 Camille M. L. S. Pagniello
 Megan A. Cimino
 Eric Terrill1
- 1Scripps Institution of Oceanography, University of California, San Diego, La Jolla, CA, United States
- 2Institute of Marine Sciences, University of California, Santa Cruz, Santa Cruz, CA, United States
Passive acoustics is a tool to monitor behavior, distributions, and biomass of marine invertebrates, fish, and mammals. Typically, fixed passive acoustic monitoring platforms are deployed, using a priori knowledge of the location of the target vocal species. Here, we demonstrate the ability to conduct coastal surveys of fish choruses, spatially mapping their distributions with an autonomous surface vehicle. For this study, we used an autonomous Liquid Robotics Wave Glider SV3 equipped with a Remora-ST underwater acoustic recorder and hydrophone. The exploratory 15-day deployment transited through three marine reserves, resulting in approx. 200 h of passive acoustic recordings, and revealed five distinct fish choruses from La Jolla to Capistrano Beach, CA (approx. 80 km separation), each with unique acoustic signatures. Choruses occurred in the evening hours, typically in the 40 to 1000 Hz band. There was a lack of both temporal and frequency partitioning amongst the choruses, but some choruses exhibited distinct spatial niches by latitude and water temperature. These results suggest that the mobility of the Wave Glider allows for persistent surveys and studies that otherwise may be too challenging or costly for stationary or ship-based sensors; a critical consideration for documenting biological activity over large spatiotemporal scales, or sampling of nearshore marine reserves.
Introduction
Sound production plays an important role in the life history of many marine animals including invertebrates, fish and mammals (Tyack, 1998). Fish, in particular, are known to vocalize while defending their territory, feeding and spawning (Winn, 1964). Fish in some spawning aggregations are known to vocalize during certain time periods over a few hours (Cato, 1978). This “chorus” results in a significant increase in ambient sound pressure levels due to the large number of fishes producing sound at the same time. As such, fish choruses can be used to determine the timing of spawning seasons, species distributions and essential habitat (Gannon, 2008; Luczkovich et al., 2008).
Passive acoustics can be used to record sound production. It enables monitoring of soniferous animal presence and behavior over large temporal (i.e., on the order of years) and spatial (i.e., on the order of 10s km) scales because of the ocean’s transparency to sound (Jensen et al., 2011). While passive acoustic monitoring can generate long temporal records at a single location, the spatial coverage is small compared to those of interest to ecosystem managers that are required to monitor vast areas and entire coastlines. Given that passive acoustic recorders are traditionally deployed on stationary platforms (Mellinger et al., 2007; Sousa-Lima et al., 2013), there is a need for more instrument platforms that are mobile and capable of expanding the region that is monitored.
Recent studies show the increased deployment of passive acoustic recorders on autonomous mobile vehicles (e.g., Baumgartner and Fratantoni, 2008; Klinck et al., 2009; Wall et al., 2012). Slocum buoyancy gliders, for example, have been used to map the sound production of various fish species including red grouper (Epinephelus morio), toadfish (Opsanus spp.) and cusk eel (Lepophidium sp./Ophidion sp.) in the Gulf of Mexico (Wall et al., 2012, 2013, 2014) as well as various species of whales in the Gulf of Maine (Baumgartner et al., 2013). Similar to other autonomous vehicles, the Wave Glider (Hine et al., 2009) is a mobile platform that can be equipped with environmental sensors for measuring temperature, salinity, fluorescence, as well as acoustic doppler current profilers (ADCP), acoustic transponders and GPS motion sensors (e.g., Kraus and Bingham, 2011; Mullison et al., 2011; Bingham et al., 2012). It is unique in that it can harness ocean wave energy for forward platform propulsion, allowing for extended mission durations without the requirement for diving to depth, as is needed for buoyancy gliders. When equipped with passive acoustic recorders, Wave Gliders have been primarily used for the monitoring of marine mammals in deep water. Although the Wave Glider generates mostly low-frequency noise, the source level of low-frequency humpback whale vocalizations is high enough to enable the use of a Wave Glider to study the whale’s acoustic behavior (Wiggins et al., 2010; Bingham et al., 2012). Soniferous fish, however, typically produce low-frequency sounds at source levels similar to or lower than marine mammals (Erisman and Rowell, 2017), making it a more challenging signal-to-noise environment for a Wave Glider to operate in.
The aim of this study was to determine if autonomous Wave Gliders can be used to record fish sounds and choruses in California nearshore environments, which are noisier and shallower than open ocean environments. A passive acoustic recorder was attached to a Wave Glider during an exploratory 15-day mission along the southern California coast. Recordings of different chorusing fish species collected during this study show that a Wave Glider equipped with passive acoustic monitoring capabilities enables scientists and managers to collect fisheries-independent data about the distribution of fish over large areas.
Materials and Methods
Wave Glider and Sensors
The Wave Glider SV3 (Liquid Robotics, a Boeing company, Sunnyvale, CA, United States) is an autonomous surface platform with a tether that connects a surface float to a subsurface glider with articulating wings (hereafter referred to as the “sub”) (Figure 1). The wings convert vertical wave motion into lift, resulting in forward propulsion. The surface float contains Iridium satellite communications and control computers as well as batteries charged by solar panels. The location and condition of the Wave Glider was recorded and telemetered every 5 min. The Wave Glider also has an Automatic Identification System (AIS) receiver, which was monitored closely in real-time for boat traffic to avoid collisions.
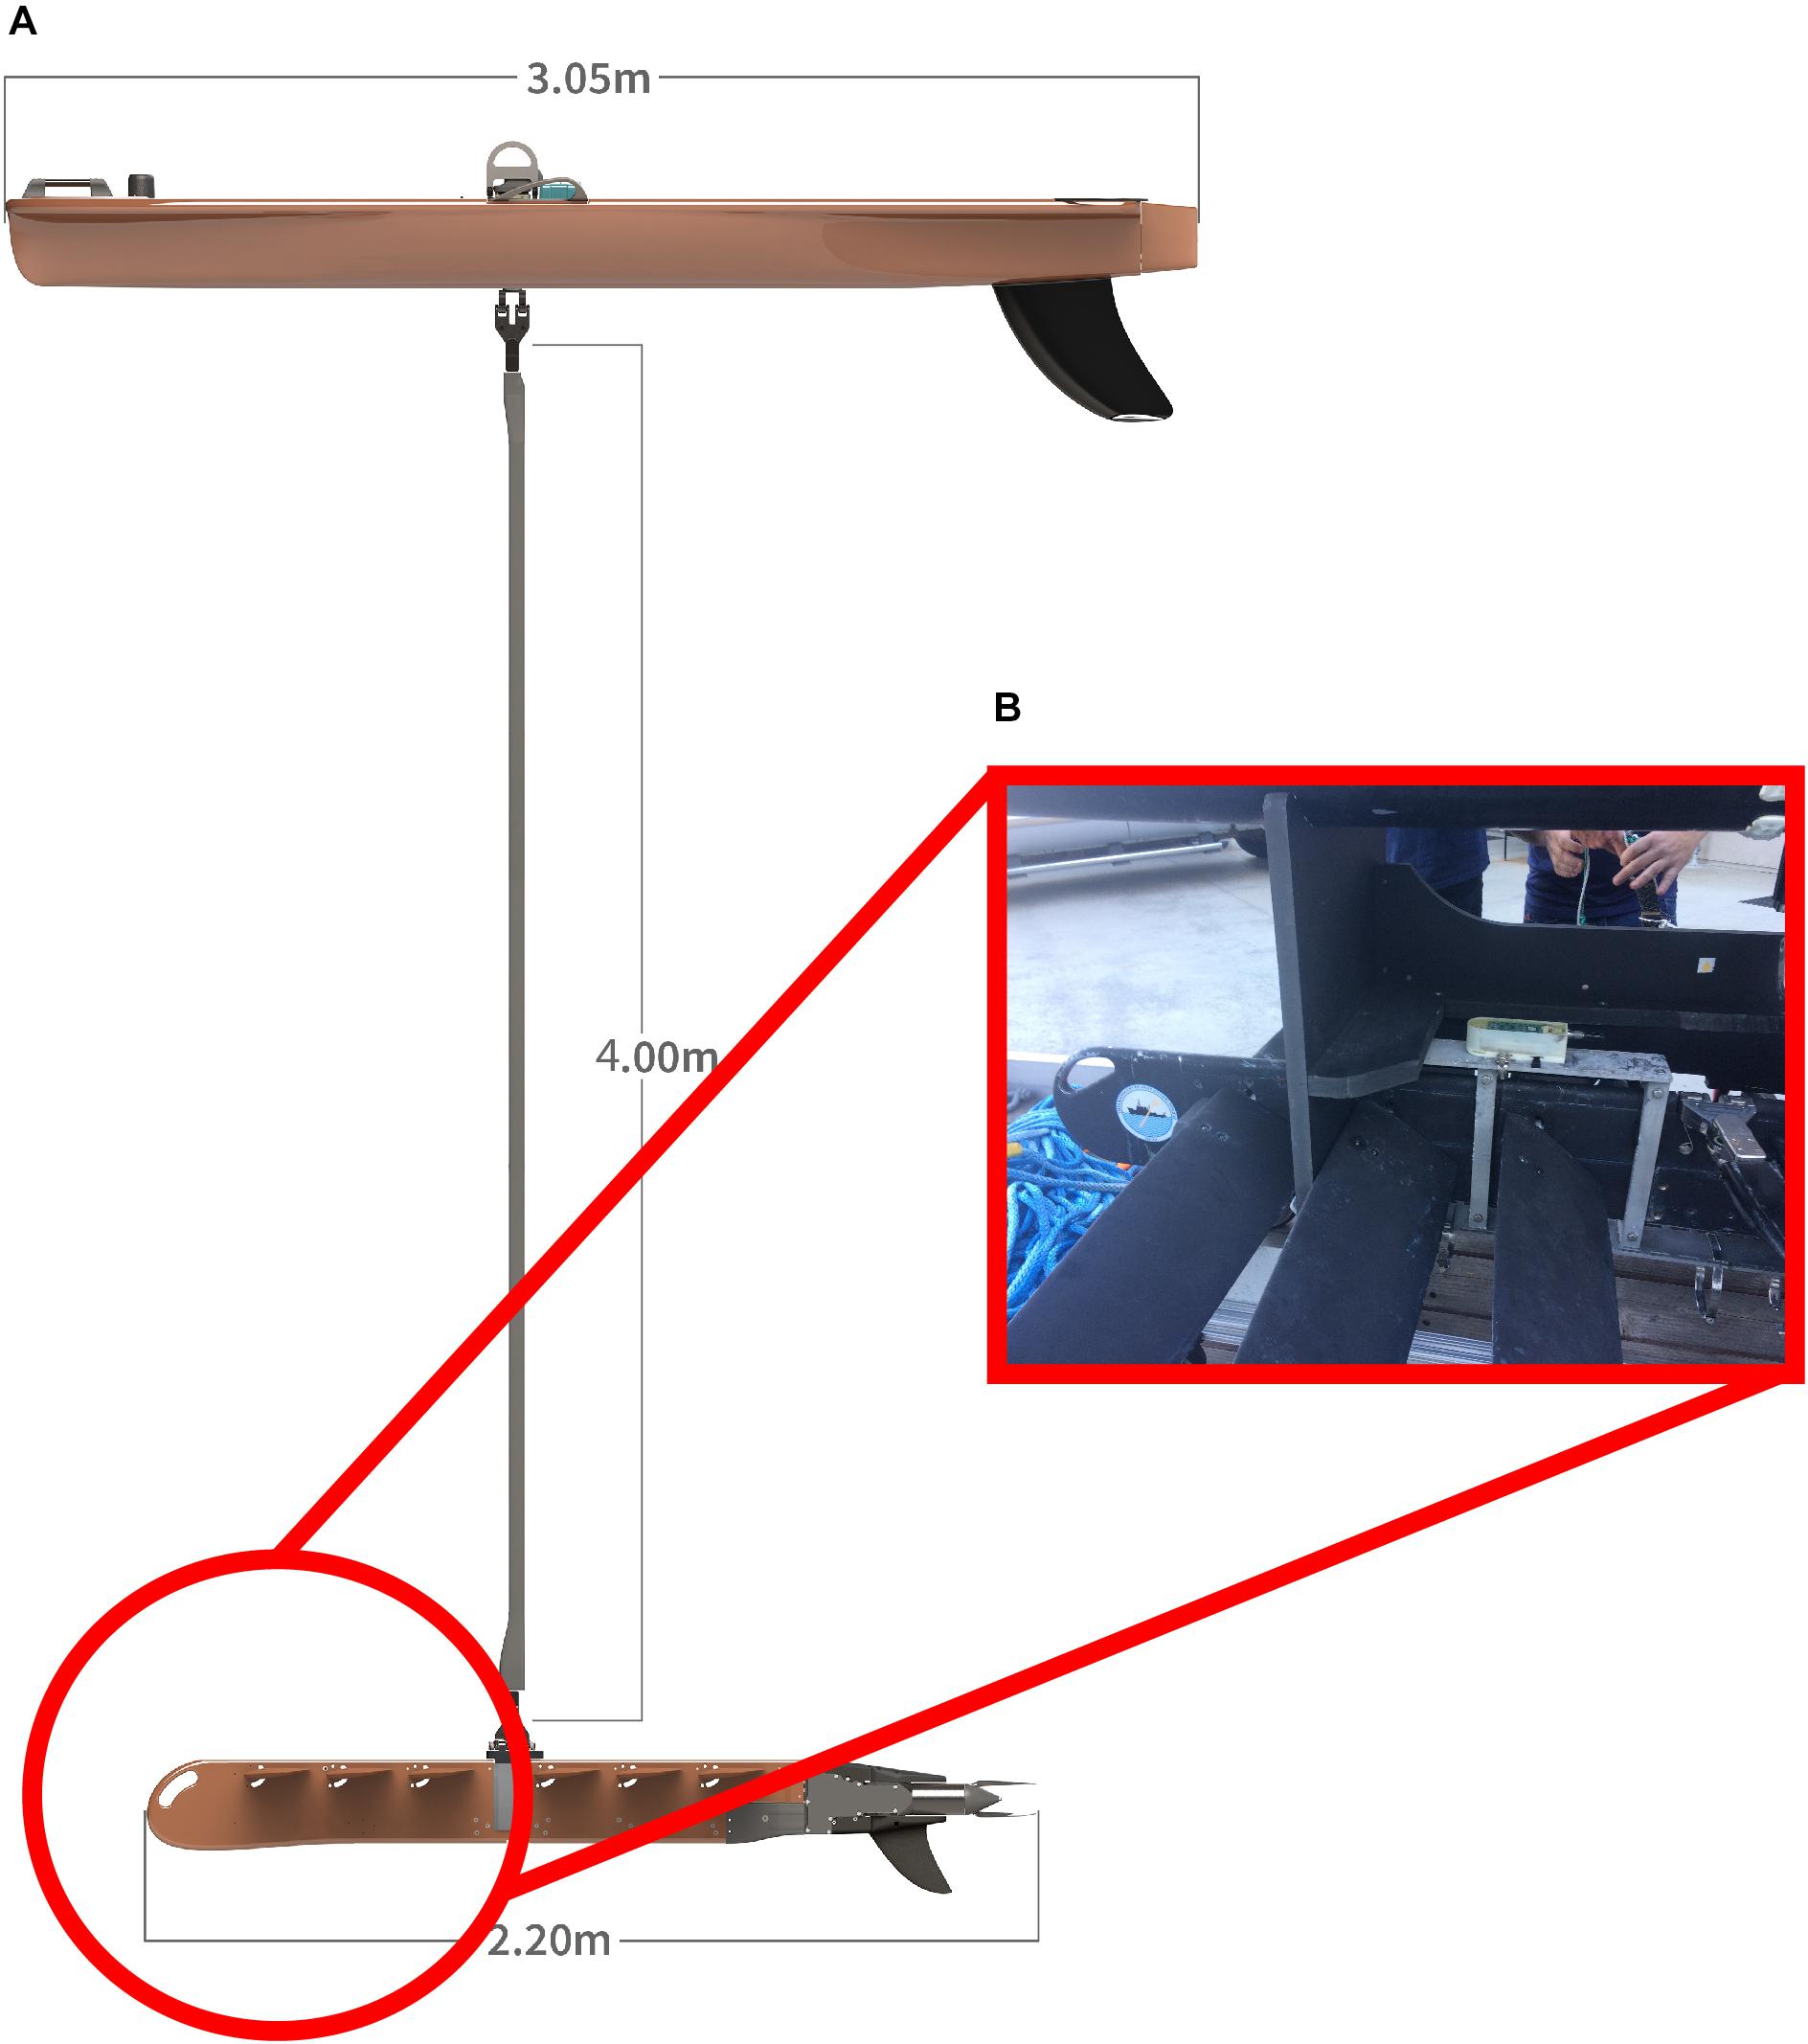
Figure 1. (A) Model of the Wave Glider. (Image courtesy of Liquid Robotics). (B) Location of the Remora-ST underwater acoustic recorder on the sub.
A Remora-ST underwater acoustic recorder (Loggerhead Instruments, Inc., Sarasota, FL, United States) was attached to custom made steel plates on the topside of the sub at 4 m depth (Figure 1). The recorder sampled at 48 kHz for 3 min every 5 min. The hydrophone had a typical sensitivity of −201 dB V/μPa and had a pre-amplifier of 33 dB gain. The acoustic recorder had a 16-bit analog-to-digital converter with a −1 to 1 V response. The passive acoustic recorder and hydrophone were factory calibrated and thus, no additional calibrations were conducted.
Study Area
The Wave Glider was deployed along the southern California coast from July 20 to August 3, 2017 (Figure 2A). The deployment started and ended in La Jolla, CA, where the vehicle ran inshore-offshore surveys near the kelp forests in the Matlahuayl State Marine Reserve (SMR), a habitat that supports a diverse assemblage of fishes. From July 26 to 30, 2017, the Wave Glider transited from La Jolla to Capistrano Beach, CA and back, passing through the San Diego-Scripps Coastal State Marine Conservation Area (SMCA) and the Swami’s SMCA. The vehicle was constrained to waters greater than 10 m depth and approx. 2 km offshore to avoid entanglement in kelp forests, collisions with nearshore rocks and running aground in shallow waters. The Wave Glider track extended further offshore as it approached Oceanside Harbor, a high boat traffic area, and a restricted area within the Camp Pendleton Military exercise area. Overall, the Wave Glider traveled 296 km in a straight path along the coast at an average speed of 0.25 m/s. Locations along the track were not equally sampled during the day and night (Figure 3).
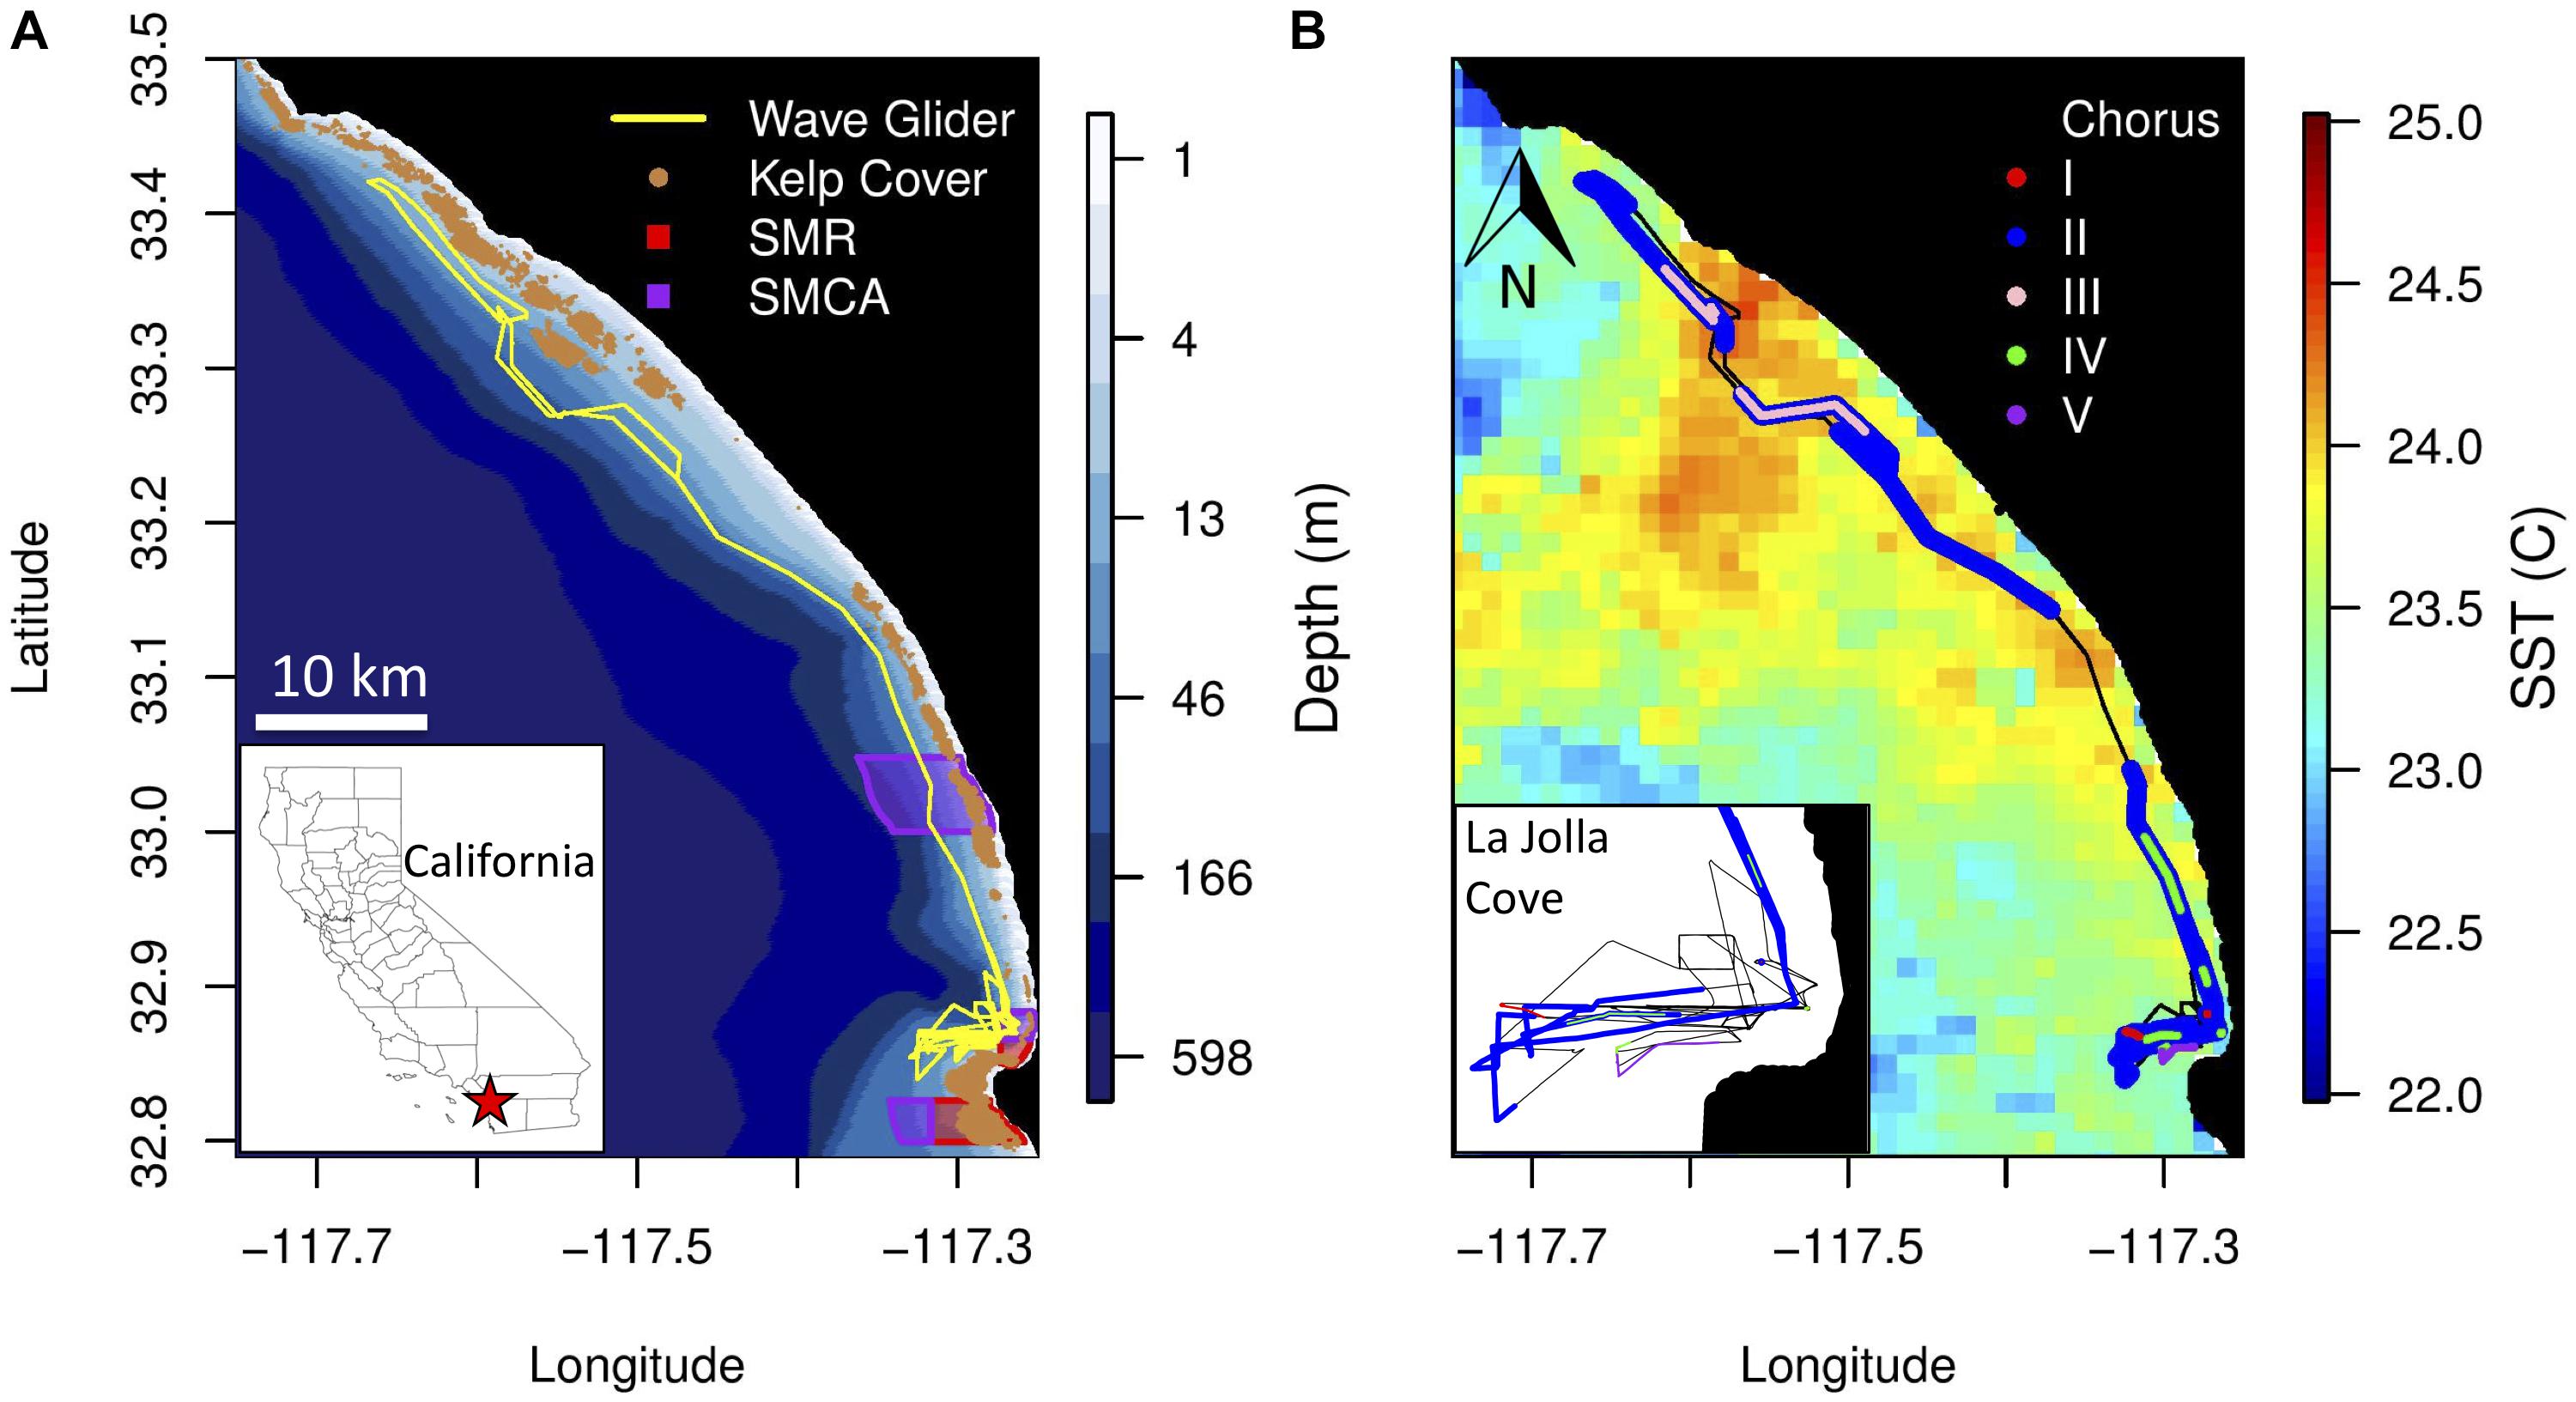
Figure 2. (A) Bathymetry along the Wave Glider track (yellow line) from La Jolla Cove, San Diego, to Capistrano Beach, CA. Historical kelp cover is shown in brown. California State Marine Reserves (SMR) and State Marine Conservation Areas (SMCA) within the study area are shown in red and purple, respectively. (B) Average sea surface temperature (°C) during the Wave Glider deployment. The locations where the five fish choruses were recorded are shown in red (Type I), blue (Type II), light pink (Type III), green (Type IV) and purple (Type V). Each chorus is mapped separately in Supplementary Figure S1. (Inset) Zoomed in view of the location of the fish choruses recorded near La Jolla Cove.
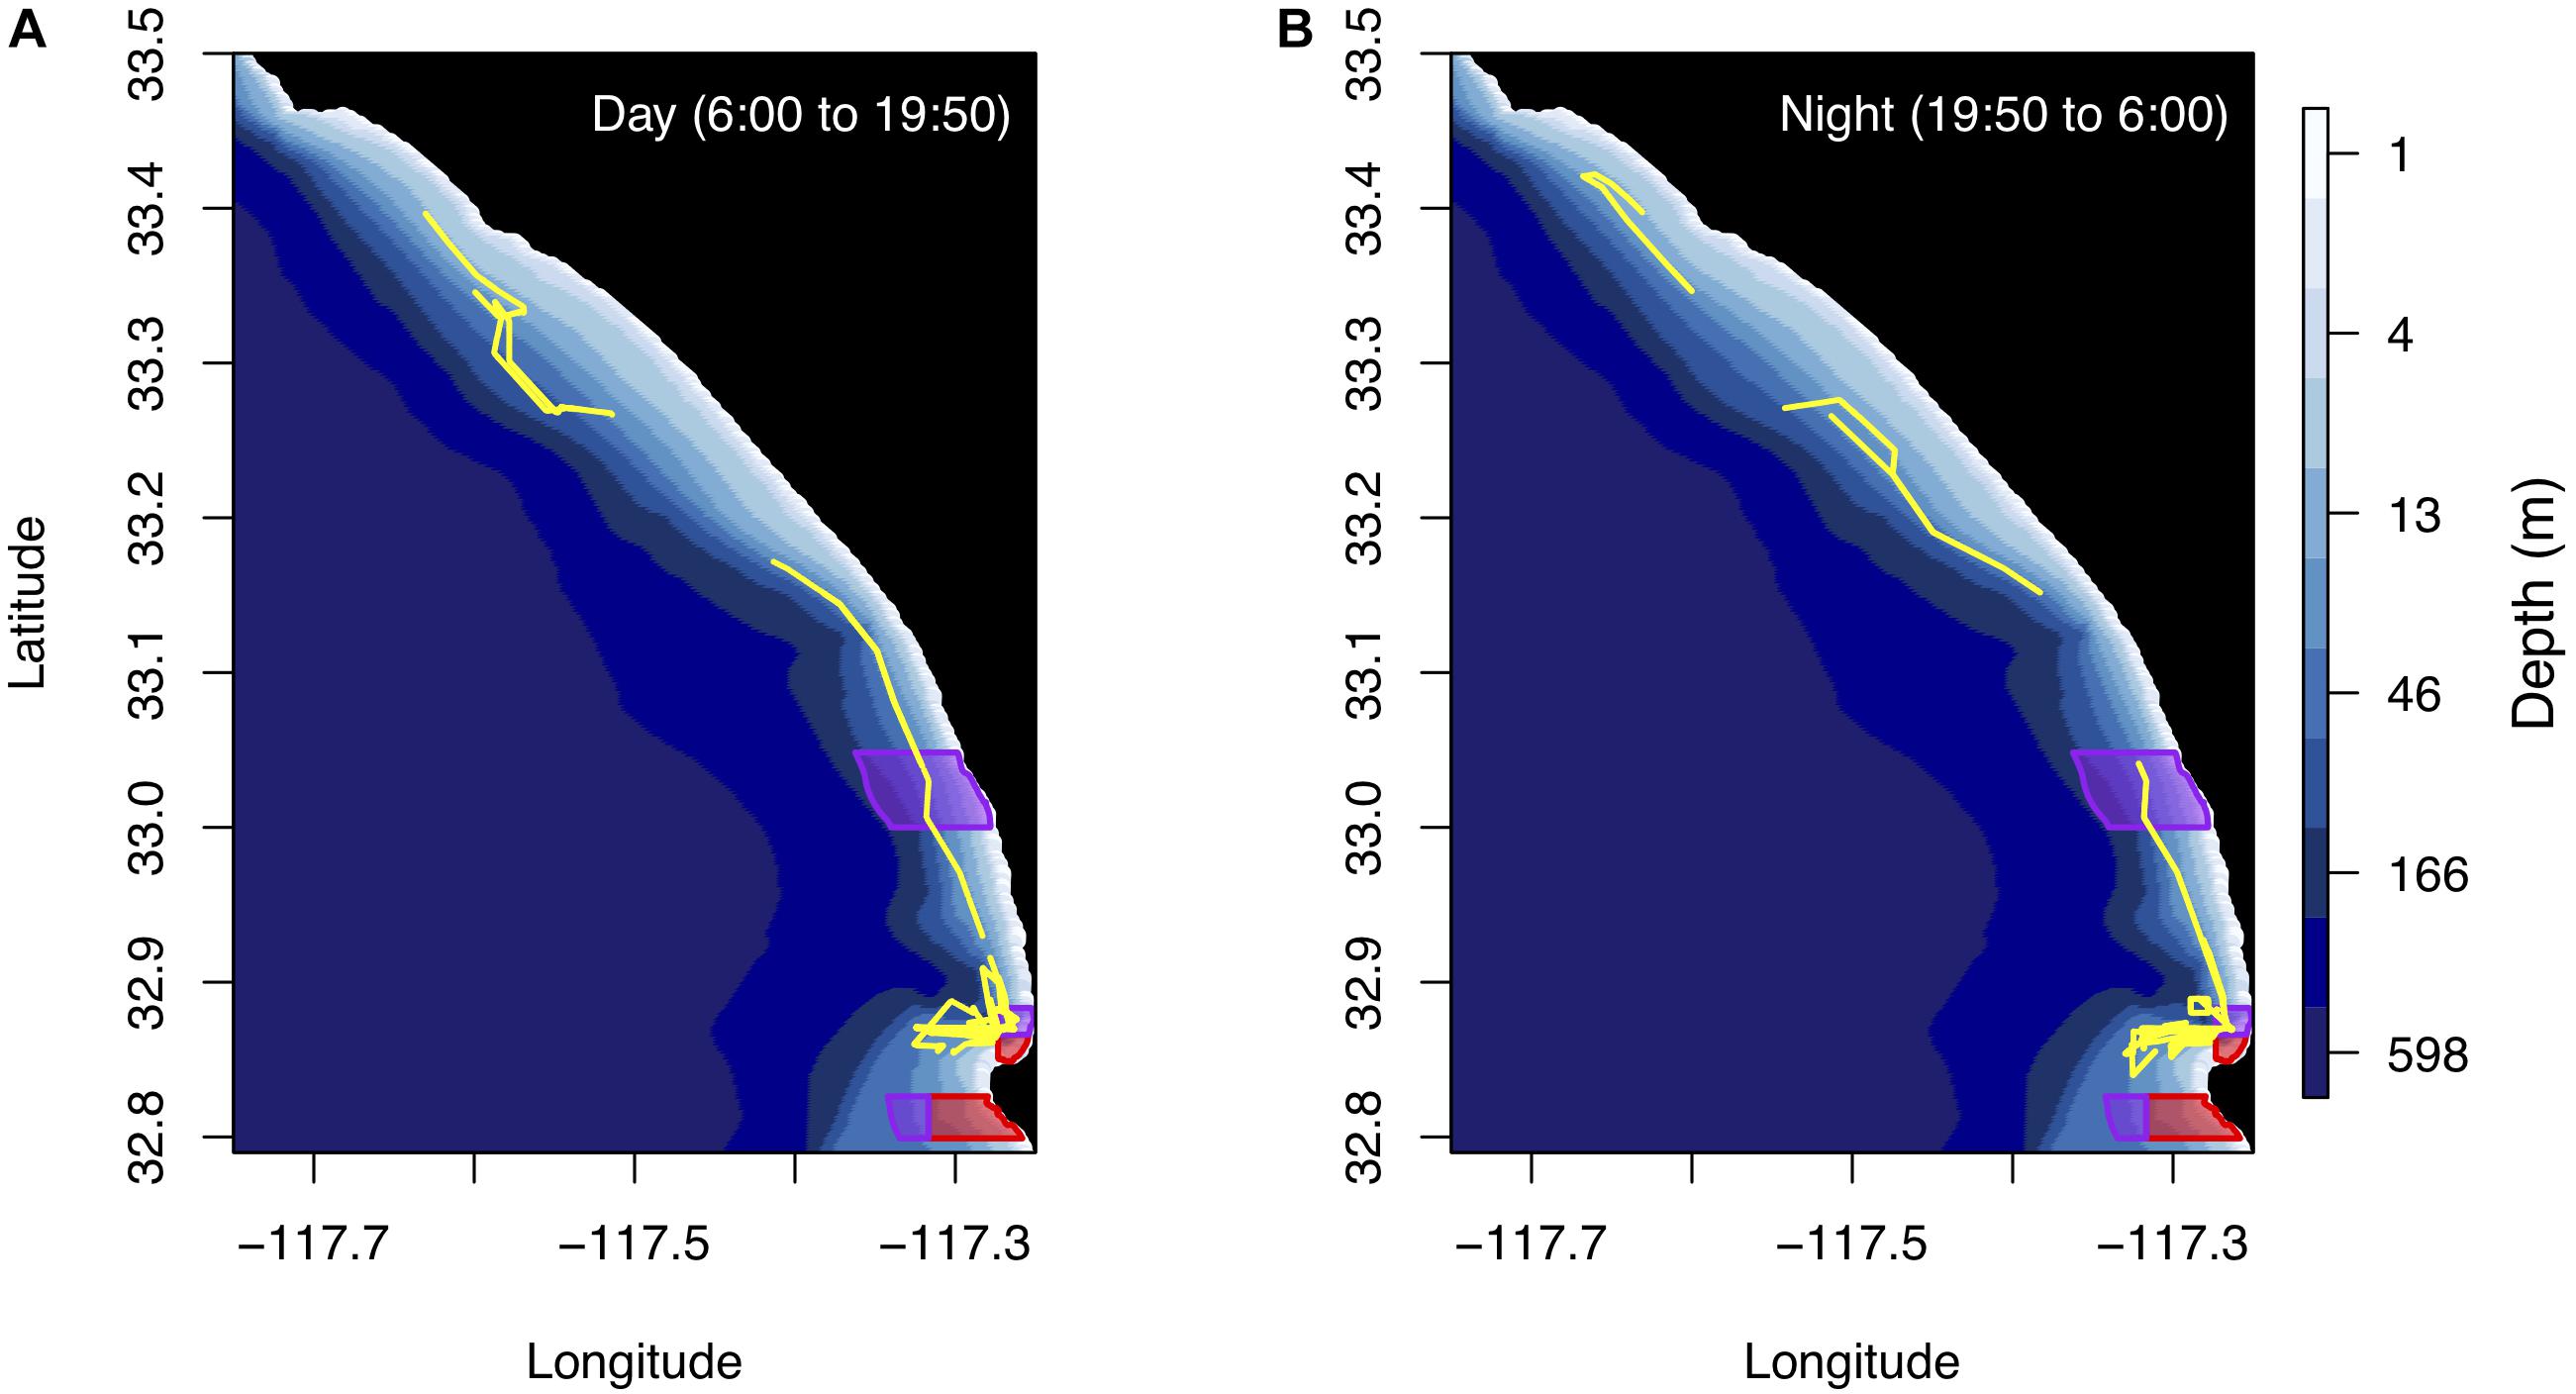
Figure 3. (A) The Wave Glider track during the day from sunrise to sunset. (B) The Wave Glider track during the night from sunset to sunrise. Note, some areas were not sampled during both the day and night. Bathymetry along the Wave Glider track (yellow line) from La Jolla Cove, San Diego, to Capistrano Beach, CA and California SMR and SMCA within the study area are shown in red and purple, respectively. Average sunset and sunrise times are also shown on the maps. Times are reported in Pacific Standard Time.
Acoustic Data Processing
Long-term spectral averages (LTSAs) of the passive acoustic recordings were computed using Triton, a Matlab-based (The Mathworks, Inc., Boston, MA, United States) acoustic data display and analysis software program (Wiggins, 2003). The program calculates fast Fourier transforms (FFTs), averages successive FFTs into a single spectral average and then, displays them as spectrograms (Wiggins and Hildebrand, 2007). FFTs were calculated using a Hanning window, 0% overlap and 1-Hz frequency bins. Successive FFTs were averaged over 5 s. LTSAs allowed for a visual scan of 199 h of recordings and to discern the start and end times of a chorus.
Choruses were divided into 10 s sub-samples. Spectrograms of each sub-sample were generated by dividing the time series into equal-length segments of 8192 samples having 90% overlap, applying a Kaiser-Bessel window of α = 2.5 to each segment, taking the FFT of each segment, and averaging the squared magnitude of the FFT of overlapped, windowed segments. The overall sensitivity (−77.7 dB re 1 μPa/counts) of the acoustic recorder was applied to the spectrograms to yield calibrated values of spectral density (dB re 1 μPa2/Hz). Frequency bandwidth (Hz) of each chorus was measured directly from spectrograms while peak frequency (Hz) was estimated from pressure spectral density curves. Received level (dB re 1 μPa peak-to-peak and rms) of each sub-sample was estimated to determine when the chorus reached its peak after sunset. When individual calls could be identified within a fish chorus, call duration (seconds) and frequency bandwidth (Hz) were measured directly from spectrograms. Peak frequency (Hz) of individual calls were estimated from pressure spectral density curves. Received level (dB re 1 μPa peak-to-peak and rms) of the individual calls was also calculated.
Choruses were classified as originating from fish based on the similarity of their acoustic characteristics to other reported fish calls and choruses (e.g., Parsons et al., 2016, 2017; McWilliam et al., 2018). A fish chorus was classified as a distinct type based on its frequency content, timing and location along the southern California coast as well as the duration and number of pulses of individual calls when possible.
Environmental Data
Environmental data was obtained to identify features that might be indicative of fish habitats. Bathymetric data for California that cover the continental shelf at 10 m contour resolution to a depth of 600 m were acquired from the California Department of Fish and Wildlife (CDFW)1. The union of kelp canopy data from 1989, 1999, 2002–2006, and 2008 collected during aerial surveys by the CDFW was used to show the persistent extent of kelp in California (i.e., a count of years of overlap per kelp bed)1. The images were processed and distributed by the CDFW Marine Region GIS Lab with a resolution of 2 m. Daily sea surface temperature (SST) measurements were made by an advanced very high-resolution radiometer aboard NOAA’s Polar Operational Environmental Satellites (POES). The measurements have a 0.0125-degree resolution2. SST measurements were patchy due to cloud cover during the Wave Glider deployment; therefore, all measurements during the deployment were averaged to obtain a snapshot of surface water temperature along the coast.
Results
Passive acoustic recordings from the 15-day deployment of the Wave Glider contained a diverse array of anthropogenic and biological sounds including surface crafts, dolphins, sea lions, snapping shrimp, and fish. Low-frequency noise originating from the Wave Glider (i.e., flow noise, the sub wings changing position, and tether strumming) was also recorded. Below 1500 Hz, the most notable sounds recorded are assumed to originate from fish based on the frequency, duration, received levels, and timing of the sound. We identified five distinct fish calls, but the species producing all but one of these choruses are unknown. The acoustic characteristics and spatiotemporal distribution of five different fish choruses (I–V) are described below. All times are reported in Pacific Standard Time.
Acoustic Characteristics and Spatiotemporal Distribution of Fish Choruses
Chorus I was the shortest chorus recorded, starting around 18:58 and ranging from 0.8 to 3.5 h (Figures 4B, 5A and Table 1). It comprised of short-duration (0.25 ± 0.05 s, mean ± SD), mid-frequency (approx. 420–880 Hz) croaks (Figures 5B,C and Table 2). Individual calls were only observed during chorusing. Received levels reached a maximum of 107 ± 2 dB re 1 μPa rms approx. 12 min after sunset. Sunset throughout the deployment was around 19:50. The chorus was only recorded offshore of the La Jolla Cove kelp beds at approx. 32.85°N (Figures 2B, 4A).
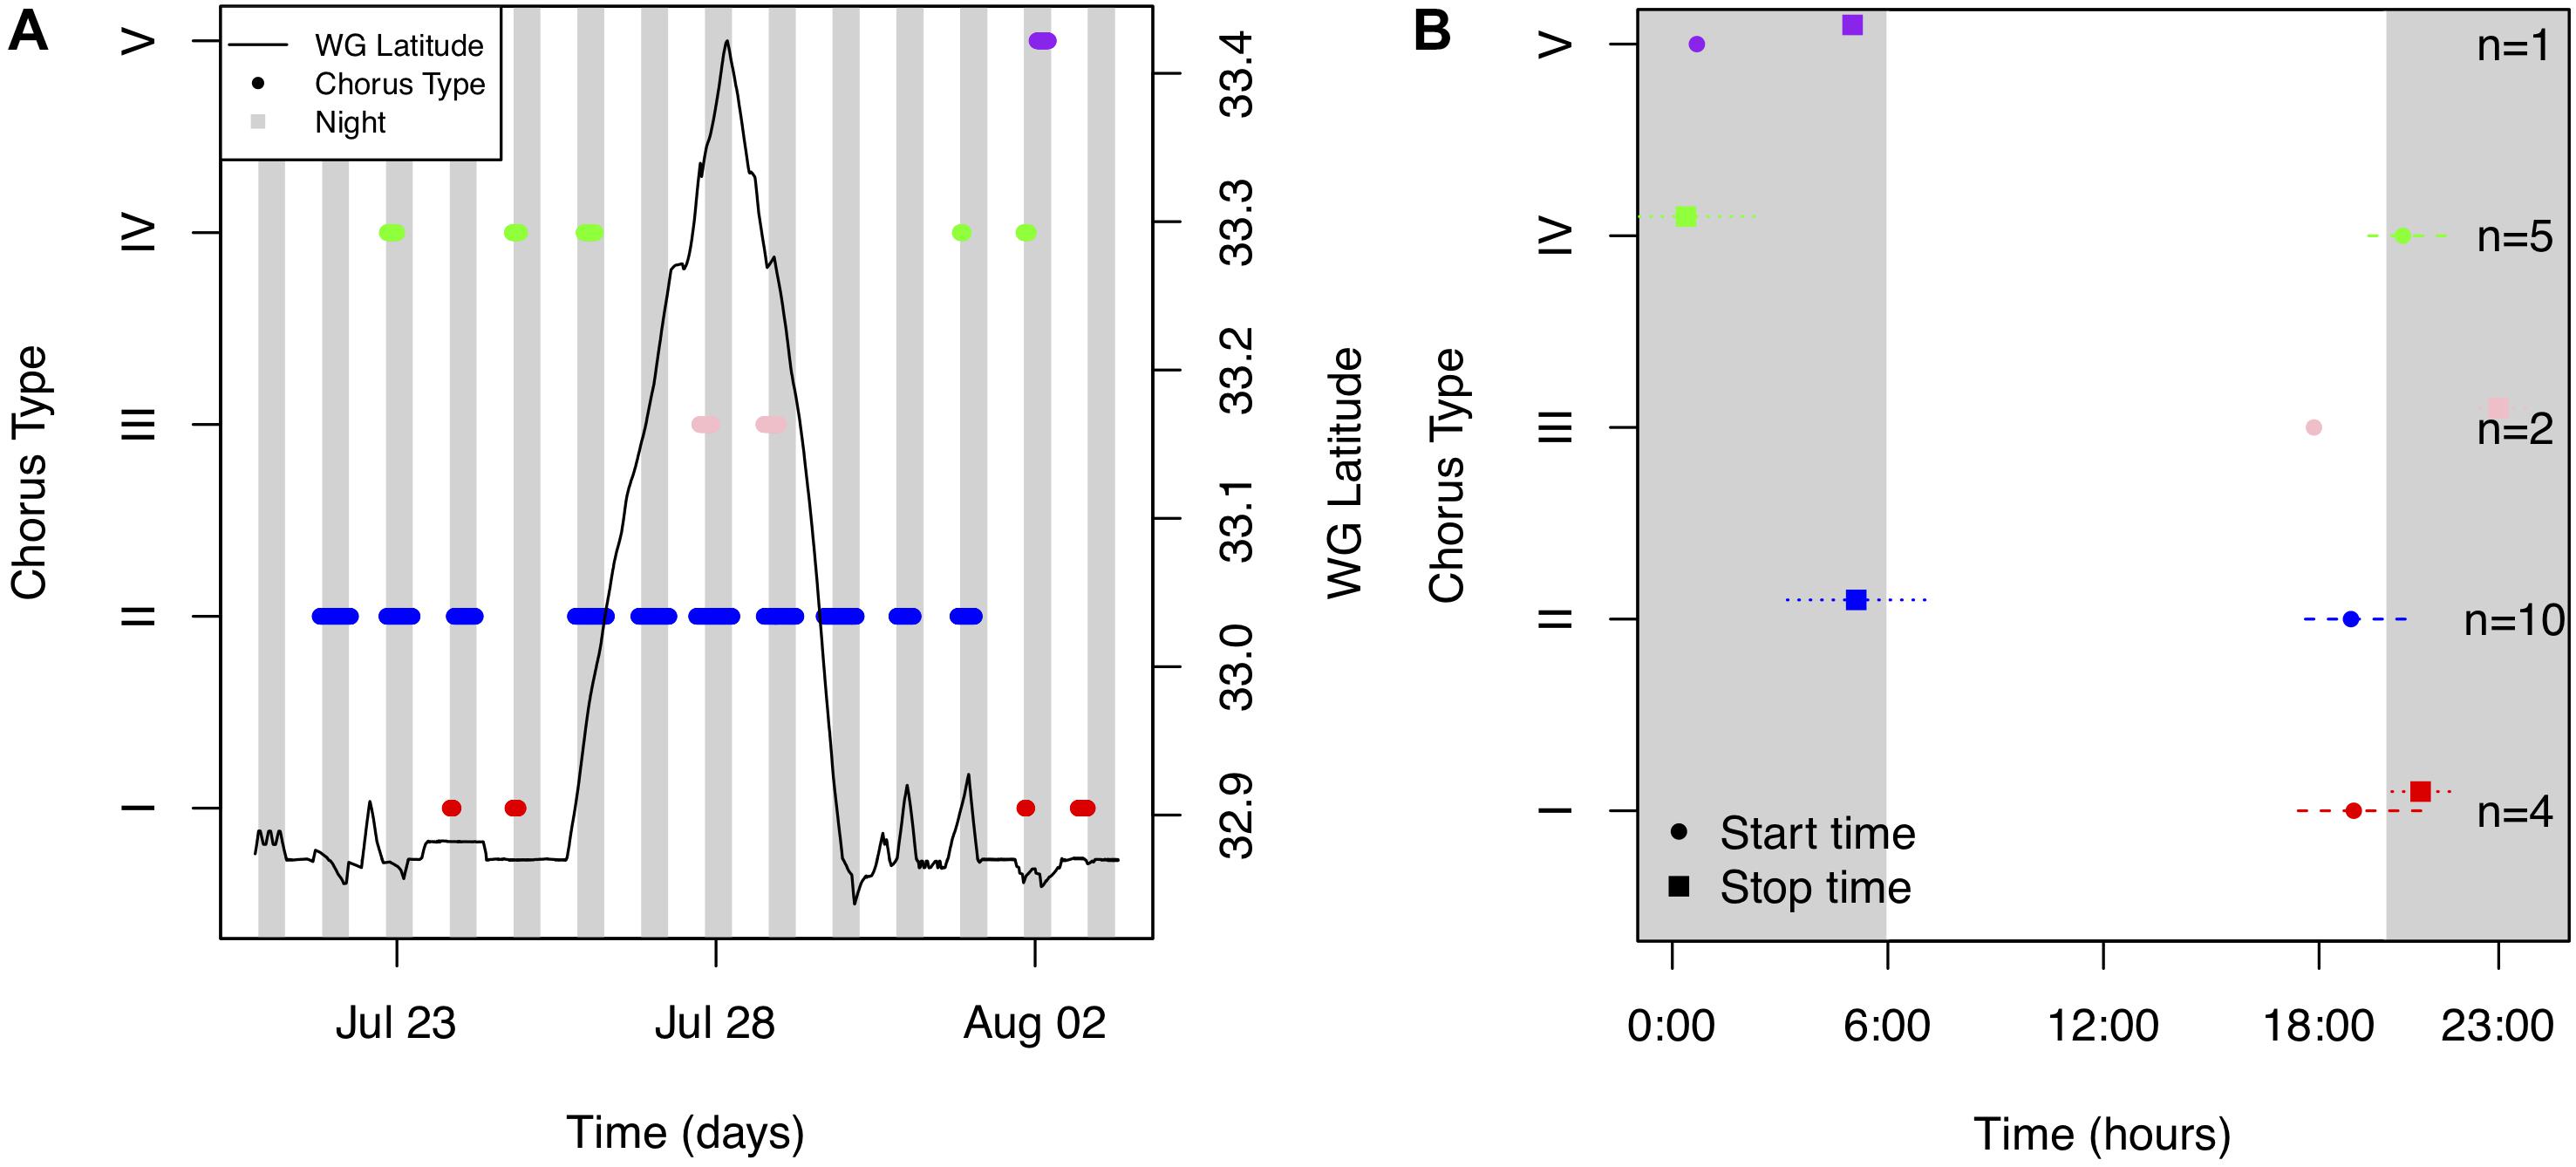
Figure 4. (A) Occurrence of five fish choruses [red (Type I), blue (Type II), light pink (Type III), green (Type IV) and purple (Type V) dots] as a function of time (days) and latitude during the entire deployment. The latitude of the Wave Glider (WG) over time is shown as a solid black line. (B) The mean and standard deviation of start (circles) and end (squares) times of each chorus. The sample size (n) is shown. The time between sunset and sunrise (i.e., night) is shaded gray. Times are reported in Pacific Standard Time.
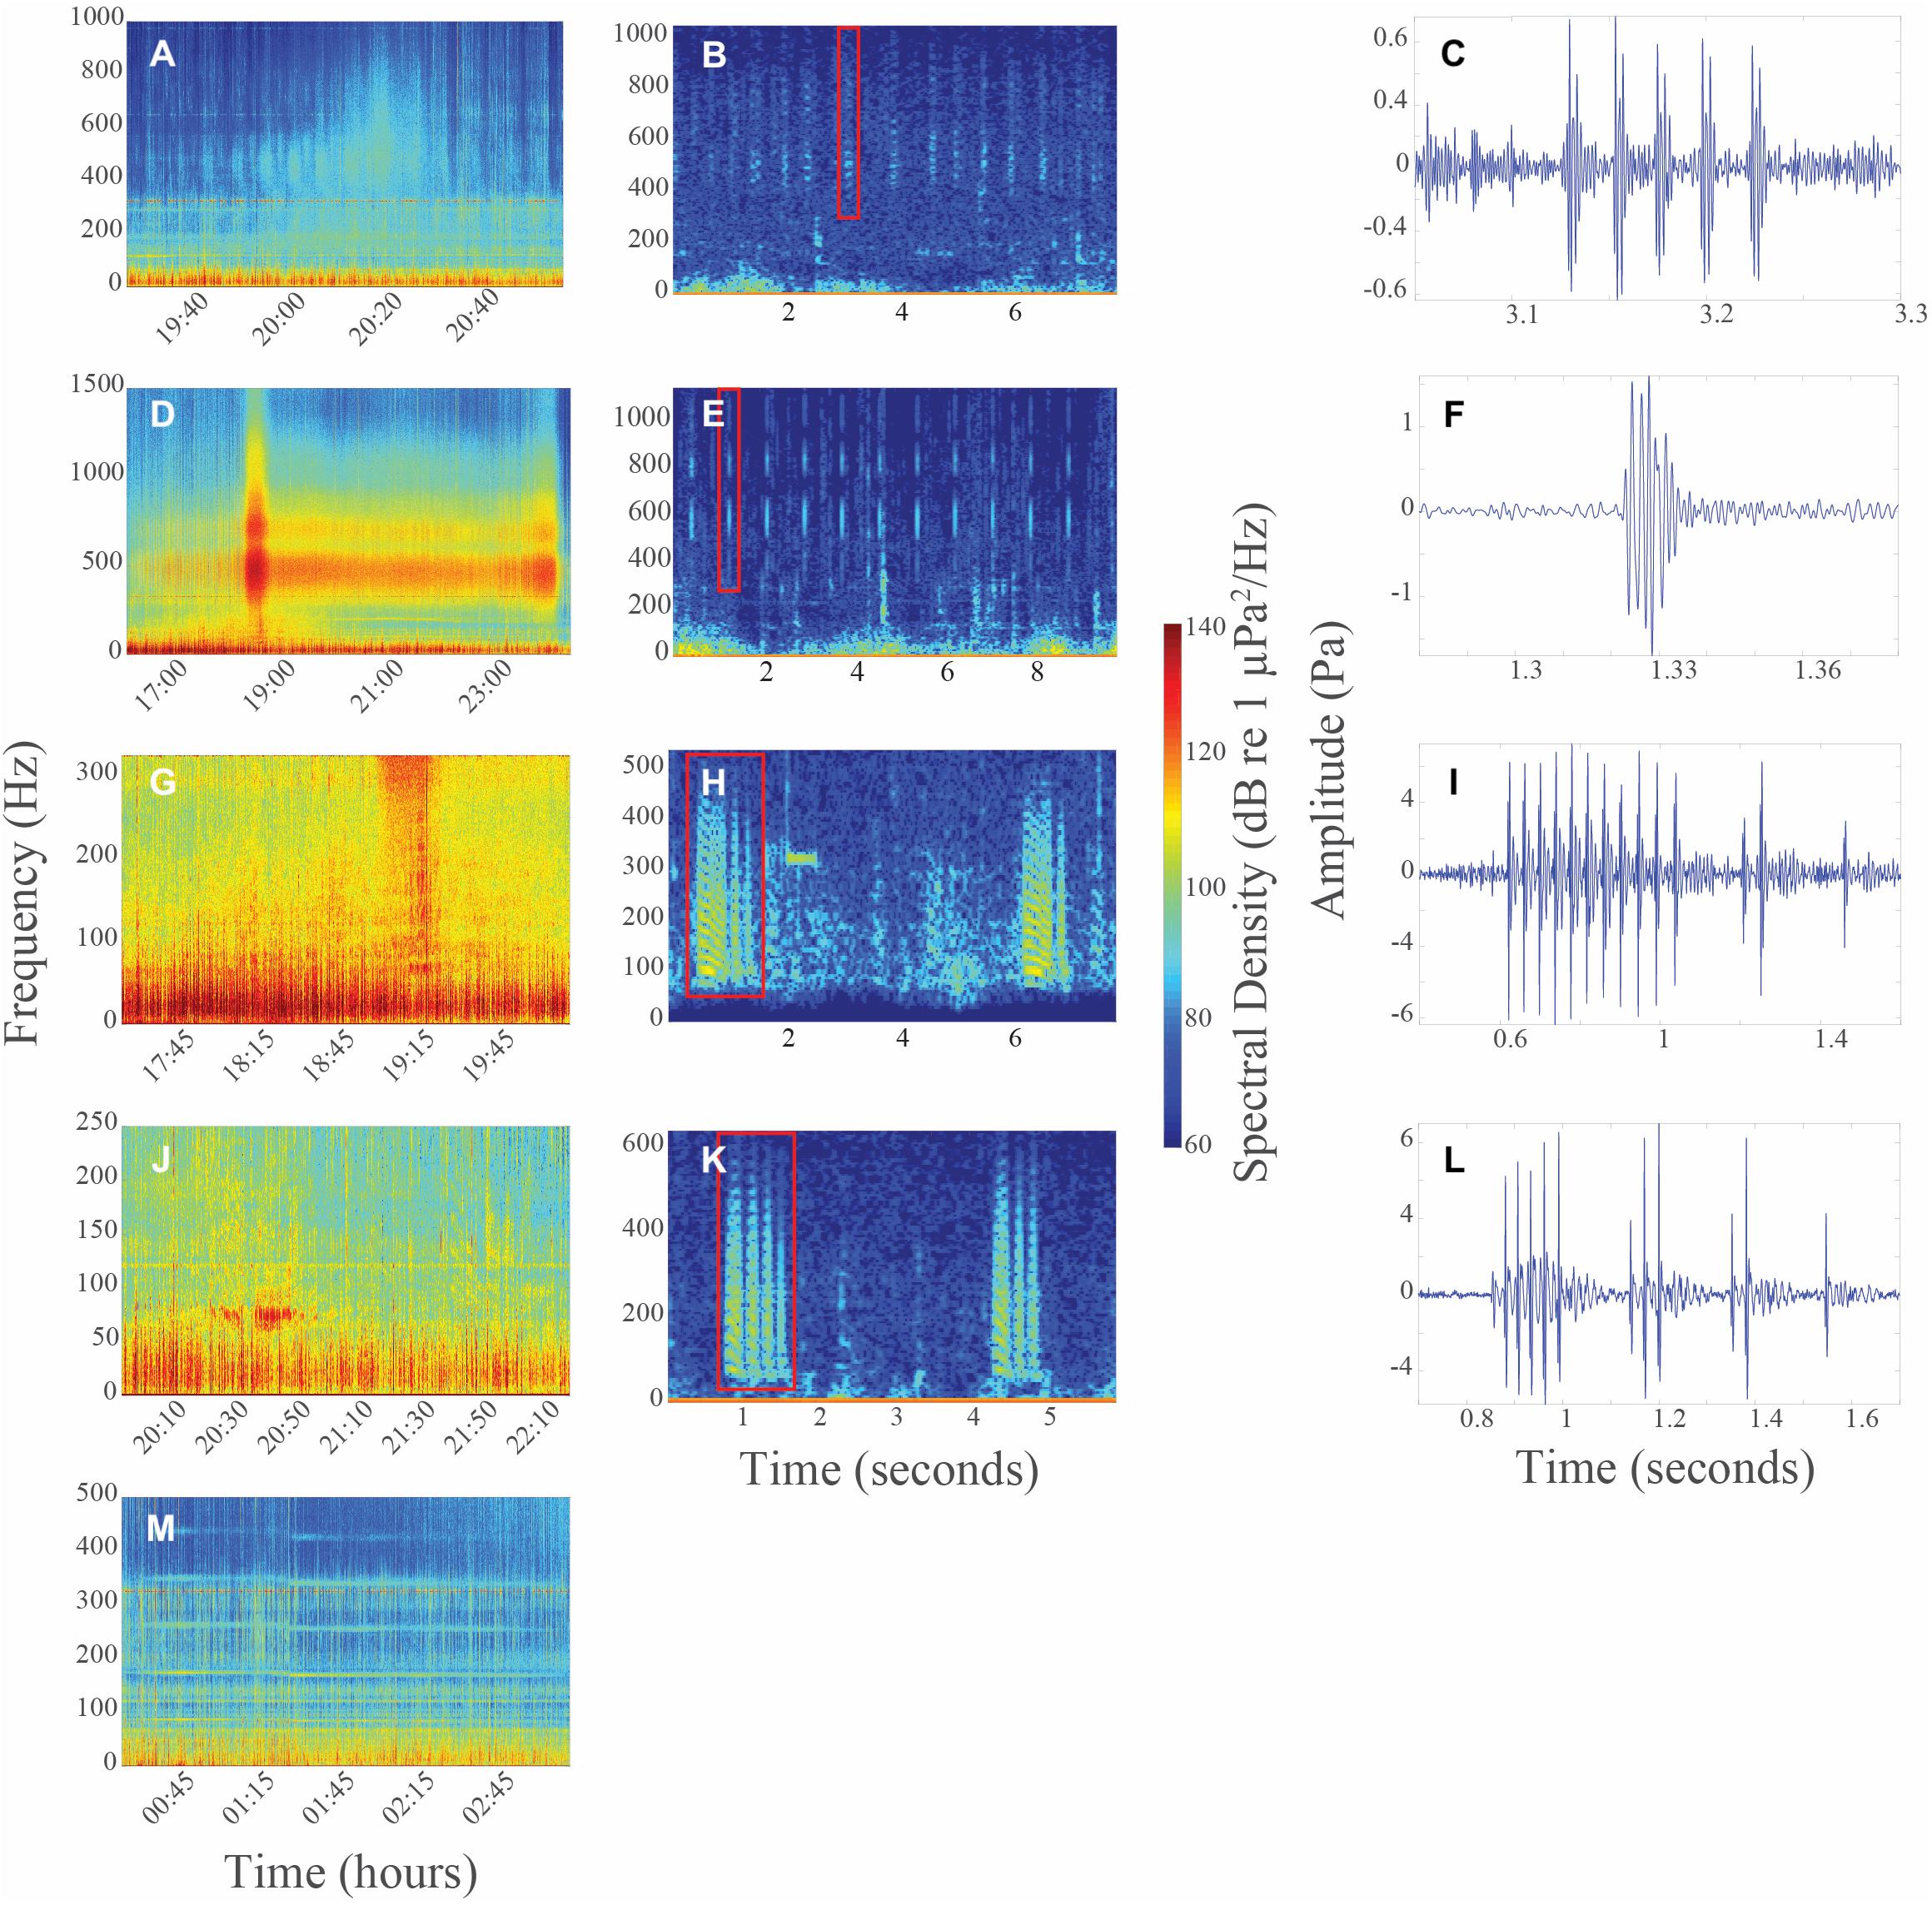
Figure 5. (A) Long-term spectral average (LTSA) of Chorus I on 07/24/2017. (B) Spectrogram and (C) time series of individual call of Chorus I on 07/24/2017 at 21:10:25 (band pass filter = 395–1015 Hz). (D) LTSA of Chorus II on 07/27/2017. (E) Spectrogram and (F) time series of individual call of Chorus II on 07/26/2017 at 17:57:32 (band pass filter = 335–1115 Hz). (G) LTSA of Chorus III on 07/27/2017. (H) Spectrogram and (I) time series of individual call of Chorus III on 07/28/2017 at 19:15:04 (band pass filter = 40–535 Hz). (J) LTSA of Chorus IV on 07/22/2017. (K) Spectrogram and (L) time series of individual call of Chorus IV on 08/01/2017 at 21:25:42 (band pass filter = 25–635 Hz). (M) LTSA of Chorus V on 08/02/2017. All spectrograms used a Hanning window, fs = 48 kHz, NFFT = 8192 and overlap = 90%. Time series are of the individual calls highlighted with a red box on each spectrogram. Color in all LTSAs and spectrograms represents spectral density (dB re 1 μPa2/Hz), with red indicating highest received levels. Times are reported in Pacific Standard Time.
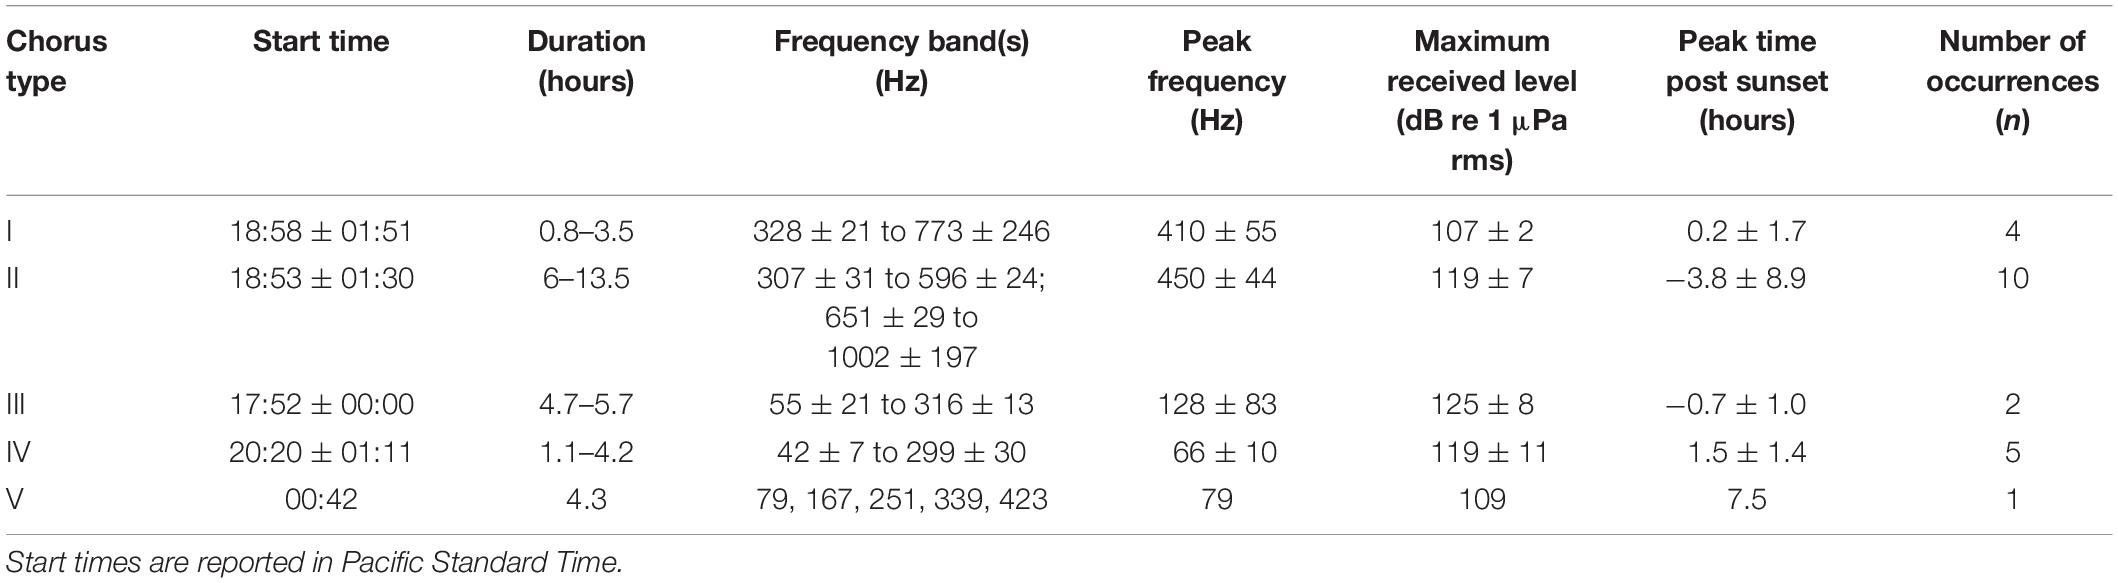
Table 1. Frequency and temporal characteristics (mean ± standard deviation) of five distinct fish choruses.
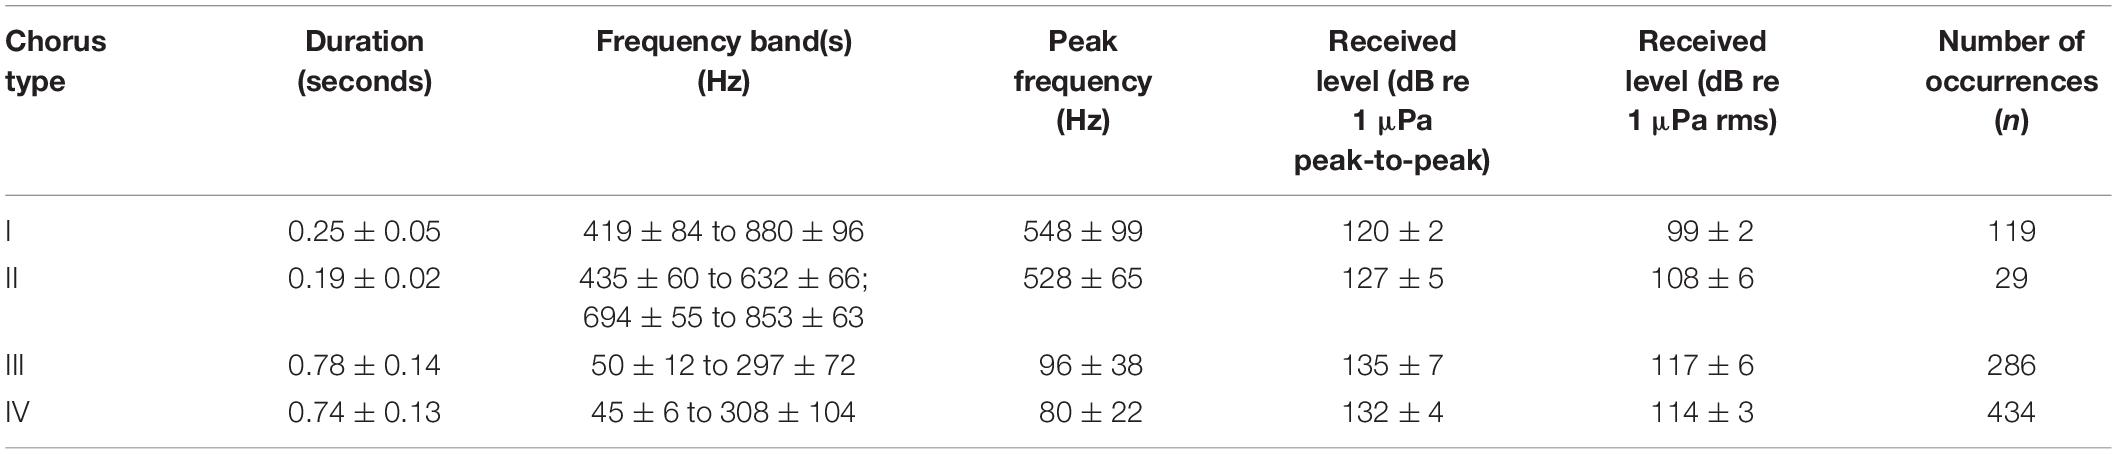
Table 2. Frequency and temporal characteristics (mean ± standard deviation) of the individual calls of four distinct fish choruses.
Chorus II was the longest chorus recorded, ranging from 6 to 13.5 h and started around 18:53 (Table 1 and Figure 4B). Received levels were a maximum of 119 ± 7 dB re 1 μPa rms in two distinct frequency bands (i.e., approx. 300–600 Hz and 650–1000 Hz) during chorusing (Figure 5D). Chorus II was recorded most often (10 of the 14 nights) and was the only chorus recorded throughout the entire deployment from La Jolla to Capistrano Beach, CA (approx. 32.85 to 33.4°N), including both SMCAs (Figures 2B, 4A). Individual calls were short-duration pulses of 0.19 ± 0.02 s (Figures 5E,F). Very few individual calls were recorded (Table 2). The presence of Chorus II does not appear to be related to the kelp distribution or SST.
Individual calls of Chorus III comprised of a pulse train, followed by zero to three short grunts (Figures 5H,I). When Chorus III occurred, its energy overlapped with energy from Chorus II in the 300 to 500 Hz frequency band. As such, calls recorded when Chorus II was not present displayed energy from approx. 60 to 540 Hz (Table 2). The chorus was only recorded twice when the Wave Glider transited near an area with elevated SST (Figures 2B, 4A). This area was offshore of the historical kelp beds located 5 km south of San Onofre, CA (approx. 33.3°N). On both July 27 and 28, 2017, the chorus started slightly before 18:00 and lasted between 5 to 6 h (Figures 4B, 5G). Received levels of the chorus peaked at 125 ± 8 dB re 1 μPa rms approx. 40 min before sunset (Table 1).
Chorus IV was recorded offshore of the La Jolla kelp beds up to Solana Beach, CA (approx. 32.85 to 32.99°N, Figures 2B, 4A). Individual calls comprised of a grunt train of two to four grunts, with each grunt decreasing in duration (Figures 5K,L). More individual calls of Chorus IV were recorded compared to any other chorus (Table 2). This chorus started at around 20:20 and its received levels peaked at 119 ± 11 dB re 1 μPa rms on average 1.5 h after sunset (Figures 4B, 5J and Table 1).
Chorus V was only recorded once on August 2, 2017 starting at ∼ 00:40 and lasted for 4 h (Figures 4B, 5M and Table 1). It occurred approx. 2 km offshore of La Jolla Cove (approx. 32.85°N). The chorus comprised of one long, continuous tonal with multiple harmonics. No individual calls were recorded.
Discussion
Knowledge of the location of fish choruses and their associated spawning aggregations is vital to the implementation of fisheries protection measures. Five distinct fish choruses were recorded by our Wave Glider equipped with a passive acoustic recorder transiting from La Jolla to Capistrano Beach, CA, confirming that the Wave Glider is a potential tool for future fisheries passive acoustic work in this region. The acoustic characteristics as well as the spatial and temporal occurrence of Chorus I are similar to the fish chorus reported by Butler et al., 2017 and Pagniello et al., 2017; however, individual calls recorded in our study did not provide clear confirmation that these are the same fish choruses. Chorus II is the same chorus first reported by Reshef et al., 2018 near Del Mar, CA. We are, however, the first to identify individual calls of this chorus. We are also the first to document Chorus III; although it is not the first fish chorus recorded near San Onofre, CA (D’Spain et al., 2013). Chorus IV is the same chorus that was recorded by Butler et al., 2017 further south offshore of Bird Rock, San Diego, CA. Given the large number of fish species that are reported to spawn during the summer months in this area (Love, 2011), it is impossible to identify the species of fish producing choruses I–IV with the currently available information. However, while the species for choruses I–IV are unknown, Chorus V is the hum of a plain midshipmen (Porichthys notatus) (Ibara et al., 1983).
While the Wave Glider survey occurred over a short timeframe and more data are needed to determine the full spatial extent and temporal boundaries of the choruses, initial observations suggested the choruses did not exhibit a distinct frequency or temporal niche, but spatial patterns by latitude and SST were observed. All choruses had high received levels primarily in 40 to 1000 Hz band and started near sunset. In the southern region of the deployment, Choruses I, IV and V were only recorded offshore of La Jolla Cove. In comparison, Chorus III was only recorded further north near an area with elevated SST off San Onofre, CA. All choruses, except for Chorus II, were only recorded near historical kelp beds, suggesting kelp could be an important habitat. Chorus II displayed no spatial habitat preferences and was recorded throughout the entire deployment. Yet, Chorus II did not have the highest maximum received levels, suggesting the Wave Glider did not pass as close to Chorus II’s location as to the location of other choruses, and thus, possibly explaining why few individual calls were recorded. In addition, we do acknowledge that in this study, all locations along the Wave Glider track were not surveyed at night (i.e., when most fish choruses tend to occur). Survey designs with equal day and night sampling at the same location would provide more insight into the temporal patterns in chorusing observed. Overall, however, our results demonstrate that the Wave Glider can be used for large-scale, exploratory missions to identify regions were soniferous fish are likely spawning.
Due to the constant motion of the Wave Glider and temporal variation in fish sound production, there are two important considerations when planning a survey. First, it is important to consider a chorus’ received levels may not be constant throughout the chorusing period due to individual variation in sound production. Additionally, because the Wave Glider is constantly moving, it is impossible to decipher whether the maximum recorded received level was associated with the closest point of approach to the chorus or the most intense time of chorusing. A distinction between these two scenarios could be made by having the Wave Glider loiter in one location for an extended period of time during a chorus. Second, the exact start and end times (i.e., on the order of minutes) of the choruses were difficult to determine because the chorus signal fades in and out near the beginning and end of chorus. This signal fading is possibly due to the sub, where the hydrophone was attached, changing position in the water column as the Wave Glider moves, and thus, shadowing signal arrivals to the hydrophone. Therefore, these potential fish spawning locations could subsequently be targeted with stationary recorders to determine the long-term temporal patterns associated with spawning activity.
Our results suggest that Wave Gliders are an effective passive acoustic asset as either a stand-alone platform or to complement stationary passive acoustic recording platforms. If used as a stand-alone platform, Wave Gliders equipped with passive acoustic monitoring capabilities allow for the acoustic exploration of an extensive area. If a location of interest is identified, a Wave Glider could also be programed to “station-keep,” and thus, acoustically monitor temporal patterns at a single location. As a precaution, Wave Gliders are not typically operated in shallow waters (<10 m) or in hazardous areas such as kelp beds, where fish choruses are most often reported to occur (e.g., Butler et al., 2017; Pagniello et al., 2017). Thus, strategic mission planning will ultimately be required to ensure that areas as close to the chorus as possible are surveyed during the expected chorusing time frame (i.e., at night). If a Wave Glider was paired with a stationary passive acoustic recording platform, long-term temporal patterns of occurrence as well as spatial extent of a fish chorus could be defined. Both Wave Gliders and passive acoustic recorders with single hydrophones can be deployed for durations of up to 1 year. Such a dual platform approach to determine the location of chorusing may even eliminate the need of a multi-hydrophone passive acoustic array, which has significantly reduced recording durations compared to single hydrophone passive acoustic recorders. Additionally, this type of combined approach would address the two considerations detailed above (space and time). As such, an approach that uses both stationary and mobile platforms equipped with passive acoustic recorders and hydrophones in concert would be ideal.
Future studies that intend to use the Wave Glider as a platform for passive acoustic monitoring should consider integrating the passive acoustic recorder into glider’s real-time system to allow for real-time feedback upon the detection of signals of interest. Furthermore, a wide range of acoustic arrays could be implemented to determine the direction of arriving signals of interest in real-time. Additionally, a depth logger and accelerometer could be attached to the sub to know the exact position of the hydrophone in the water column to determine if the fading chorus signal observed is due to the sub changing position in the water column, the propagation environment or is a natural phenomenon.
Even without these suggested platform improvements, we have shown that large-scale Wave Glider surveys in coastal environments can be used to identify the general location of fish spawning aggregations and to understand their relationships to the ocean’s bio-physical properties. If paired with net sampling, diver surveys or cameras to identify the species producing these spawning sounds, the patterns we have documented could be used to create appropriate protected areas or fishing closure regions, if necessary. The Wave Glider’s ability to be equipped with a wide variety of oceanographic sampling instruments enables the monitoring of all soniferous species as well as abiotic influences including anthropogenic activity, thus providing a full ecosystem view.
Author Contributions
MC and ET designed the study. MC led mission programing and deployment of the Wave Glider and analyzed the Wave Glider data, environmental data and created the maps. CP processed and visualized the passive acoustic data. CP wrote the initial manuscript with contributions from MC, and all authors read and helped and revise the final version.
Funding
CP was supported in part by a Natural Sciences and Engineering Research Council (NSERC) of Canada Postgraduate Scholarship – Doctoral Program and the Fleet Admiral Chester W. Nimitz Fund.
Conflict of Interest Statement
The authors declare that the research was conducted in the absence of any commercial or financial relationships that could be construed as a potential conflict of interest.
Acknowledgments
We are grateful to staff at the Coastal Observing Research and Development Center at Scripps Institution of Oceanography, especially Nixon Carruthers, Daniel Bedenko, Michael Jilka, and Robert Hess for help in Wave Glider programming, setup and deployment. We are also wish to acknowledge the U.S. Office of Naval Research DURIP program for supporting the research instrumentation used in this program and their long term commitment to development of unmanned systems, as well as the support of the Friedkin Foundation for research support.
Supplementary Material
The Supplementary Material for this article can be found online at: https://www.frontiersin.org/articles/10.3389/fmars.2019.00526/full#supplementary-material
Footnotes
- ^ https://www.wildlife.ca.gov/Conservation/Marine/GIS/Downloads
- ^ https://coastwatch.pfeg.noaa.gov/erddap/griddap/erdATssta1day.html
References
Baumgartner, M. F., and Fratantoni, D. M. (2008). Diel periodicity in both sei whale vocalization rates and the vertical migration of their copepod prey observed from ocean gliders. Limnol. Oceanogr. 53, 2197–2209. doi: 10.4319/lo.2008.53.5_part_2.2197
Baumgartner, M. F., Fratantoni, D. M., Hurst, T. P., Brown, M. W., Cole, T. V. N., Van Parijs, S. M., et al. (2013). Real-time reporting of baleen whale passive acoustic detections from ocean gliders. J. Acoust. Soc. Am. 134, 1814–1823. doi: 10.1121/1.4816406
Bingham, B., Kraus, N., Howe, B., Freitag, L., Ball, K., Koski, P., et al. (2012). Passive and active acoustics using an autonomous wave glider. J. F. Robot. 29, 911–923. doi: 10.1002/rob.21424
Butler, J., Parnell, E., and Širović, A. (2017). Who’s making all that racket? Seasonal variability in kelp forest soundscapes. J. Acoust. Soc. Am. 141:3864. doi: 10.1121/1.4988635
Cato, D. H. (1978). Marine biological choruses observed in tropical waters near Australia. J. Acoust. Soc. Am. 64, 736–743. doi: 10.1121/1.382038
D’Spain, G. L., Batchelor, H., Helble, T. A., and McCarty, P. (2013). New observations and modeling of an unusual spatiotemporal pattern of fish chorusing off the southern California coast. Proc. Meetings Acoust. 19, 1–7. doi: 10.1121/1.4800997
Erisman, B. E., and Rowell, T. J. (2017). A sound worth saving: acoustic characteristics of a massive fish spawning aggregation. Biol. Lett. 13:20170656. doi: 10.1098/rsbl.2017.0656
Gannon, D. P. (2008). Passive acoustic techniques in fisheries science: a review and prospectus. Trans. Am. Fish. Soc. 137, 638–656. doi: 10.1577/T04-142.1
Hine, R., Willcox, S., Hine, G., and Richardson, T. (2009). “The wave glider: a wave-powered autonomous marine vehicle,” in Proceedings of the MTS/IEEE OCEANS Conference, (Biloxi, MS), 1–6.
Ibara, R. M., Penny, L. T., Ebeling, A. W., van Dykhuizen, G., and Cailliet, G. (1983). “The mating call of the plainfin midshipman fish, Porichthys notatus,” in Predators and Prey in Fishes, eds D. L. G. Noakes, D. G. Lindquist, G. S. Helfman, and J. A. Ward (The Hague: Dr W. Junk Publishers), 205–212. doi: 10.1007/978-94-009-7296-4_22
Jensen, F. B., Kuperman, W. A., Porter, M. B., and Schmidt, H. (2011). Computational Ocean Acoustics, 2nd Edn. New York, NY: Springer New York.
Klinck, H., Stelzer, R., Jafarmadar, K., and Mellinger, D. K. (2009). “AAS Endurance: an autonomous acoustic sailboat for marine mammal research,” in Proceedings of International Robotic Sailing Conference, (Matosinhos), 43–48.
Kraus, N., and Bingham, B. (2011). “Estimation of wave glider dynamics for precise positioning,” in Proceedings of the MTS/IEEE OCEANS Conference, (Kona), 1–9.
Love, M. (2011). Certainly More Than You Want to Know About the Fishes of the Pacific Coast: A Postmodern Experience. Santa Barbara, CA: Really Big Press.
Luczkovich, J. J., Mann, D. A., and Rountree, R. A. (2008). Passive acoustics as a tool in fisheries science. Trans. Am. Fish. Soc. 137, 533–541. doi: 10.1577/T06-258.1
McWilliam, J. N., McCauley, R. D., Erbe, C., and Parsons, M. J. G. (2018). Soundscape diversity in the Great Barrier Reef: Lizard Island, a case study. Bioacoustics 27, 295–311. doi: 10.1080/09524622.2017.1344930
Mellinger, D., Stafford, K., Moore, S., Dziak, R., and Matsumoto, H. (2007). An overview of fixed passive acoustic observation methods for cetaceans. Oceanography 20, 36–45. doi: 10.5670/oceanog.2007.03
Mullison, J., Symonds, D., and Trenaman, N. (2011). “ADCP data collected from a liquid robotics wave glider,” in Proceedings of the 2011 IEEE/OES 10th Current, Waves and Turbulence Measurements (CWTM), (Monterey, CA), 266–272.
Pagniello, C. M., Butler, J., D’Spain, G. L., Jaffe, J., Parnell, E., and Širović, A. (2017). Soundscape fishing: spatial variability in a low-frequency fish chorus in the southern California kelp forest. J. Acoust. Soc. Am. 142:2503. doi: 10.1121/1.5014140
Parsons, M. J. G., Salgado Kent, C. P., Recalde-Salas, A., and McCauley, R. D. (2017). Fish choruses off port Hedland. Western Aust. Bioacoust. 26, 135–152. doi: 10.1080/09524622.2016.1227940
Parsons, M. J. G., Salgado-Kent, C. P., Marley, S. A., Gavrilov, A. N., and McCauley, R. D. (2016). Characterizing diversity and variation in fish choruses in Darwin Harbour. ICES J. Mar. Sci. 73, 2058–2074. doi: 10.1093/icesjms/fsw037
Reshef, E. S., Demer, D. A., Wiggins, S., and Baumann-Pickering, S. (2018). Chorusing Fish Behavioral Changes Potentially Linked to Climate Variability. in 2018 Ocean Sciences Meeting F14A-0718. Available at: https://agu.confex.com/agu/os18/meetingapp.cgi/Paper/324358 (accessed February 12, 2018).
Sousa-Lima, R. S., Norris, T. F., Oswald, J. N., and Fernandes, D. P. (2013). A review and inventory of fixed autonomous recorders for passive acoustic monitoring of marine mammals. Aquat. Mamm. 39, 23–53. doi: 10.1578/AM.39.1.2013.23
Tyack, P. L. (1998). “Acoustic communication under the sea,” in Animal Acoustic Communication: Sound Analysis and Research Methods, eds S. L. Hopp, M. J. Owren, and C. S. Evans (Berlin: Springer), 163–220. doi: 10.1007/978-3-642-76220-8_6
Wall, C. C., Lembke, C., Hu, C., and Mann, D. A. (2014). Fish sound production in the presence of harmful algal blooms in the Eastern Gulf of Mexico. PLoS One 9:e114893. doi: 10.1371/journal.pone.0114893
Wall, C. C., Lembke, C., and Mann, D. A. (2012). Shelf-scale mapping of sound production by fishes in the eastern Gulf of Mexico, using autonomous glider technology. Mar. Ecol. Prog. Ser. 449, 55–64. doi: 10.3354/meps09549
Wall, C. C., Simard, P., Lembke, C., and Mann, D. A. (2013). Large-scale passive acoustic monitoring of fish sound production on the West Florida Shelf. Mar. Ecol. Prog. Ser. 484, 173–188. doi: 10.3354/meps10268
Wiggins, S. (2003). Autonomous acoustic recording packages (ARPs) for long-term monitoring of whale sounds. Mar. Technol. Soc. J. 37, 13–22. doi: 10.4031/002533203787537375
Wiggins, S., Manley, J., Brager, E., and Woolhiser, B. (2010). “Monitoring marine mammal acoustics using Wave Glider,” in Proceedings of the MTS/IEEE OCEANS Conference, (Washington, DC), 1–4.
Wiggins, S. M., and Hildebrand, J. A. (2007). “High-frequency acoustic recording package (HARP) for broad-band, long-term marine mammal monitoring,” in Proceedings of the 2007 Symposium on Underwater Technology and Workshop on Scientific Use of Submarine Cables and Related Technologies, (Tokyo: IEEE), 551–557.
Keywords: fish chorus, passive acoustics, Wave Glider, fisheries, autonomous platform, fish sounds
Citation: Pagniello CMLS, Cimino MA and Terrill E (2019) Mapping Fish Chorus Distributions in Southern California Using an Autonomous Wave Glider. Front. Mar. Sci. 6:526. doi: 10.3389/fmars.2019.00526
Received: 15 November 2018; Accepted: 12 August 2019;
Published: 29 August 2019.
Edited by:
Leonard Pace, Schmidt Ocean Institute, United StatesReviewed by:
Robert McCauley, Curtin University, AustraliaMiles James Parsons, Australian Institute of Marine Science (AIMS), Australia
Copyright © 2019 Pagniello, Cimino and Terrill. This is an open-access article distributed under the terms of the Creative Commons Attribution License (CC BY). The use, distribution or reproduction in other forums is permitted, provided the original author(s) and the copyright owner(s) are credited and that the original publication in this journal is cited, in accordance with accepted academic practice. No use, distribution or reproduction is permitted which does not comply with these terms.
*Correspondence: Camille M. L. S. Pagniello, Y3BhZ25pZWxsb0B1Y3NkLmVkdQ==