 Szymon Surma
 Villy Christensen
 Rajeev Kumar2
 Cameron H. Ainsworth
 Tony J. Pitcher
- 1Institute for the Oceans and Fisheries, The University of British Columbia, Vancouver, BC, Canada
- 2Centre for Fisheries Ecosystems Research, Fisheries and Marine Institute of Memorial University of Newfoundland, St. John’s, NL, Canada
- 3College of Marine Science, University of South Florida, St. Petersburg, FL, United States
This paper examines the structure and dynamics of the marine ecosystem surrounding Haida Gwaii (an archipelago in the southeastern Gulf of Alaska). Based on previous research, a set of improved mass-balanced models was constructed in Ecopath with Ecosim (EwE) to represent ecosystem states existing circa 1900, 1950, and currently. These models feature increased taxonomic and ecological resolution relative to their predecessors across trophic levels and size classes from zooplankton to whales. A more detailed representation of Pacific herring (Clupea pallasii), including its age structure, predators, and prey, was introduced to permit modeling of the ecosystem role of herring as a forage fish, as well as the ecological impacts of herring fisheries. Gross ecosystem structure and herring trophodynamics were compared across ecosystem states using size spectra and ecological indicators, including mixed trophic impacts (MTIs). The 1950 model was fitted to a comprehensive set of biomass and catch time series. Dynamic ecosystem simulations evaluated the influence of fishing, predation, other natural mortality, and primary productivity trends on ecosystem behavior since 1950, as well as the relative importance of top-down versus bottom-up forcing. Size spectra and ecosystem indicators suggest that the Haida Gwaii ecosystem has not undergone a radical structural shift since 1900, despite heavy exploitation of numerous marine mammals and fish. Moreover, MTIs show that herring constitutes an important mid-trophic level node in the food web, participating in complex interactions with many predators, prey, and competitors. Dynamic ecosystem simulations demonstrate that trends in fishing mortality, trophic interactions, and primary productivity (correlated with the Pacific Decadal Oscillation) are all necessary to explain historical Haida Gwaii ecosystem behavior. These interacting drivers yield a mosaic of top-down and bottom-up trophic control for trophic interactions involving herring and throughout the food web. Simulation results also suggest that production of several herring, salmon, and groundfish stocks may have recently become partially decoupled from primary productivity, perhaps due to changes in copepod guild composition. These results also indicate that a biodiversity decline and “fishing down the food web” occurred off Haida Gwaii since 1950. Finally, the fitted 1950 model provides a robust platform for dynamic ecosystem simulations.
Introduction
This paper aimed to elucidate the structure and dynamics of the marine ecosystem surrounding Haida Gwaii, an archipelago in the southeastern Gulf of Alaska (Figure 1), with particular emphasis on the trophodynamics of Pacific herring (Clupea pallasii). The waters of the study area provide feeding grounds to four herring stocks targeted by commercial and aboriginal fisheries (DFO, 2016). A more detailed description of the oceanography, biogeography, and exploitation history of the productive and diverse Haida Gwaii marine ecosystem can be found in Section A of Supplementary File S1.
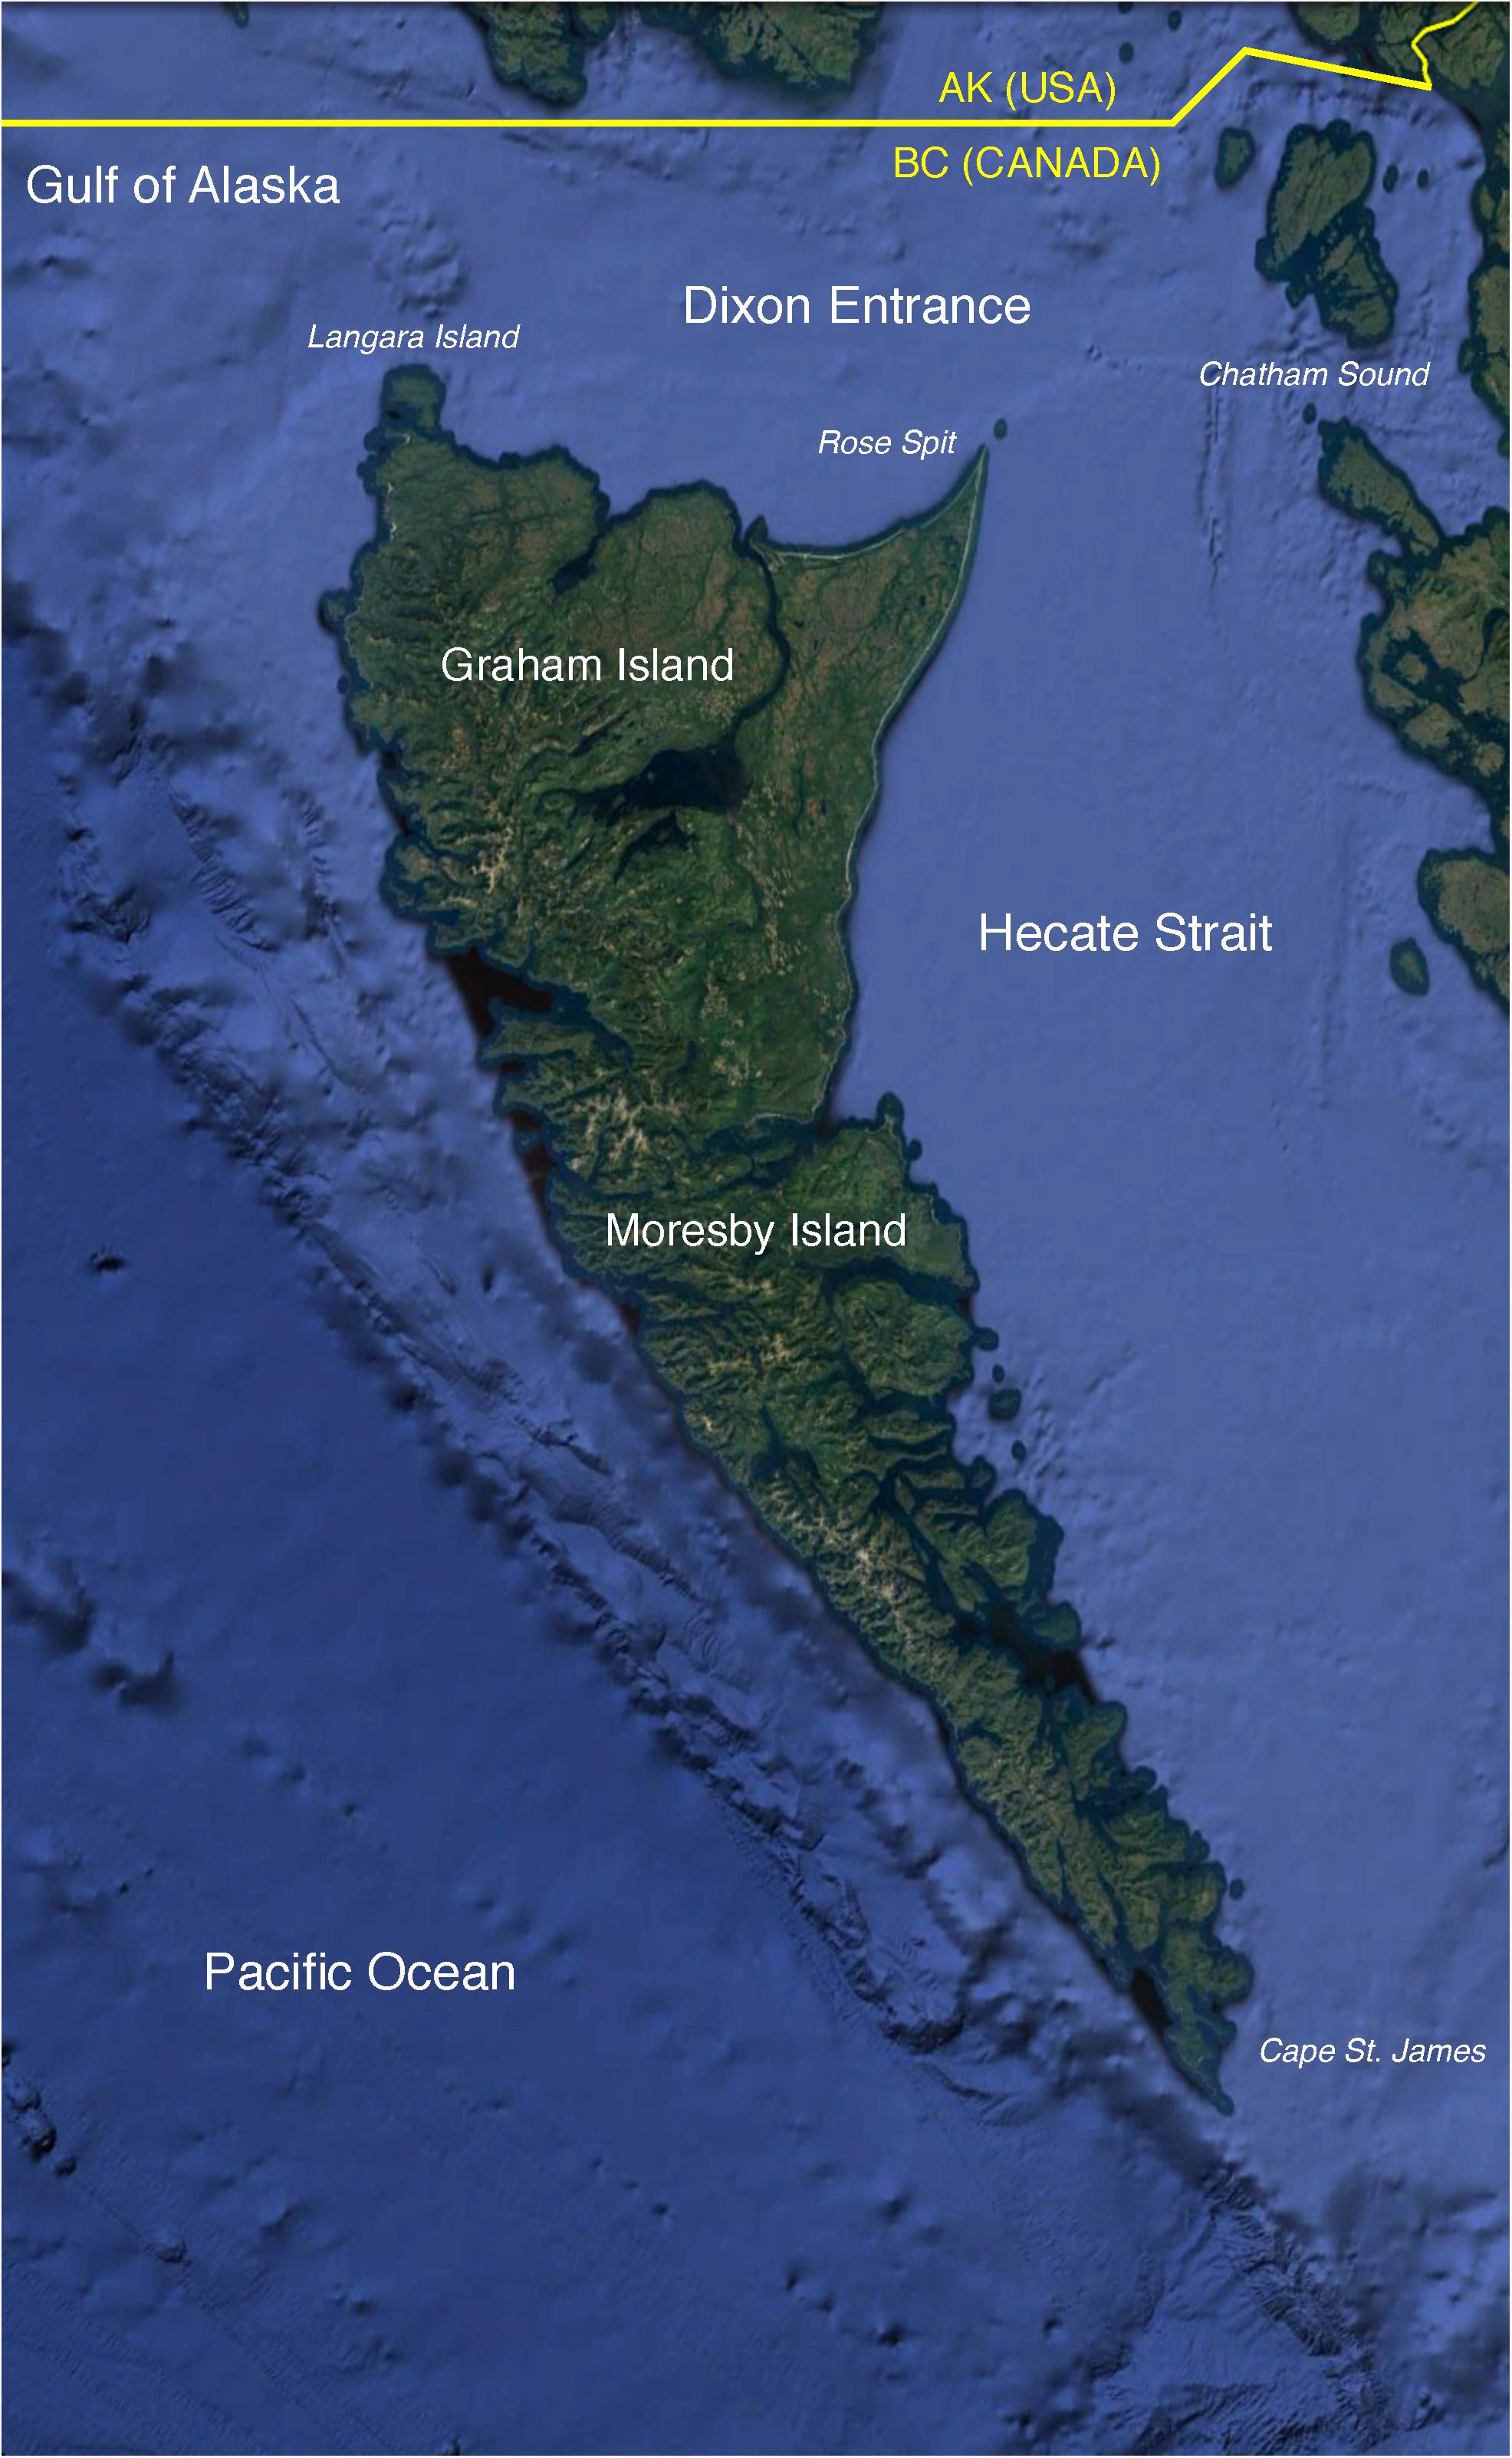
Figure 1. The study area (∼81,000 km2) located in the southeastern Gulf of Alaska and surrounding the archipelago of Haida Gwaii. Base map obtained from Google Earth Pro. Data LDEO-Columbia, NSF, NOAA. Base map ©2018 Google. Image Landsat/Copernicus. Data SIO, NOAA, U.S. Navy, NGA, GEBCO.
Pacific herring has been classified by Fox et al. (2015, 2018) as a foundation species (sensu Soulé et al., 2003), while Schweigert et al. (2010) consider it the principal forage fish of British Columbia (Canada). In the Northeast Pacific, herring is a notable prey species for numerous commercial fish (Brodeur et al., 2014; Osgood et al., 2016) and seabirds (Schrimpf et al., 2012; Bishop et al., 2015), as well as many marine mammals, including humpback whales Megaptera novaeangliae (Moran et al., 2018; Straley et al., 2018) and Steller sea lions Eumetopias jubatus (Gende and Sigler, 2006; Womble and Sigler, 2006). The trophic role of Pacific herring is especially strong and taxonomically extensive in the spring spawning season, when fish and roe alike are available to a diverse coastal predator guild (Willson and Womble, 2006).
This paper analyzed gross ecosystem structure and Pacific herring trophodynamics (including top-down versus bottom-up control) over time using size spectrum slopes and a suite of ecological indicators. In order to reveal long-term ecosystem shifts, these metrics were compared across three ecosystem states existing circa 1900 (i.e., before industrial whaling), 1950 (i.e., after the main pulse of whaling but prior to that of large-scale commercial herring fishing), and currently. Each ecosystem state was represented by a mass-balanced model built in Ecopath with Ecosim (EwE, Christensen and Walters, 2004), one of the most commonly employed ecosystem modeling frameworks (Coll et al., 2015). The basic principles of EwE are described in Section B of Supplementary File S1. The EwE models presented here, while focusing on Pacific herring, its predators, and prey, exhibit high taxonomic and ecological resolution throughout, with 80 functional groups spanning all trophic levels and size classes from phytoplankton to whales.
This paper also comparatively evaluated the roles of fishing, predation, other natural mortality, and primary productivity as drivers of Haida Gwaii ecosystem dynamics since 1950, as well as the relative importance of top-down versus bottom-up forcing, with particular emphasis on herring trophodynamics. These goals were approached by fitting the 1950 model to an extensive set of biomass and catch time series as well as fishing mortality drivers (1950–2015). The resulting simulated ecosystem dynamics were then statistically related to several oceanographic indices to connect simulation outputs to empirical observations. Furthermore, the model fitting procedure was designed to yield a robust platform for dynamic ecosystem simulations and management strategy evaluation scenarios in the future.
The models employed in this paper derive from a series of previous EwE efforts in the study area. Beattie (1999, 2001) constructed the first Ecopath models of ecosystem states existing off Haida Gwaii (in Hecate Strait) in the early 1900s and 1990s. Vasconcellos and Pitcher (2002) and Ainsworth et al. (2008) expanded the ecological resolution and spatial range of these models to include all northern British Columbia (NBC) waters and developed additional historical models for 1750 and 1950. Ainsworth et al. (2008) also fitted the 1950 NBC model to time series of catch, biomass, and fishing mortality (1950–2000), thus preparing it for use in dynamic ecosystem simulations.
However, the NBC models still featured a relatively simple, aggregated functional group structure at both high (marine mammals, seabirds, elasmobranchs) and low trophic levels (zooplankton, epifaunal invertebrates, and producers). Thus, the detailed investigation of Pacific herring trophodynamics undertaken in this paper necessitated increased group resolution for both non-teleost predators (as generally recommended by Goedegebuure et al., 2017), and zooplanktonic prey of herring. Furthermore, future investigation of the role of herring as a forage fish, and the ecosystem impacts of herring fisheries management, within the research framework outlined by Pikitch et al. (2012) would likewise require higher functional group resolution for herring predators and prey. Recent findings on the great diversity and ontogenetic trajectory of local Pacific herring diet (Pakhomov et al., 2017), representing a great improvement on the simplified herring diet composition in the NBC models, argued for a more detailed multi-stanza representation of juvenile herring age structure. Heterogeneity in biomass and catch trends among local herring stocks (DFO, 2016) suggested the need for their separation in models designed to evaluate ecosystem impacts of herring fisheries. Recent intrusions of warm water masses into the study area, and the likely rise in their frequency with global climate change (Di Lorenzo and Mantua, 2016), prompted the introduction of functional groups for two southern fish species, Pacific hake (Merluccius productus) and Pacific saury (Cololabis saira), which could exert notable pressure on herring through predation and competition, respectively.
In addition, preparation of these models to simulate the likely ecosystem impacts of recolonization of the study area by the sea otter (Enhydra lutris), a keystone species (Estes and Palmisano, 1974) extirpated from Haida Gwaii by the maritime fur trade in the 19th century (Heise et al., 2003), motivated the decision to resolve epifaunal invertebrates and benthic producers in finer ecological detail. Furthermore, the nearly two decades elapsed since 2000 offered the opportunity of adapting the NBC model to a software version (EwE 6) featuring considerable new or improved functionality, including more robust modeling of fish age structure (Christensen et al., 2008). They also allowed the model to be re-fitted to a set of time series expanded and extended with newly available biomass and catch data (e.g., DFO, 2016). Finally, these improvements to the NBC models were designed to avoid the pitfalls of model “recycling” (Essington and Plagányi, 2013). All changes in model structure since the NBC models are summarized in Table 1.
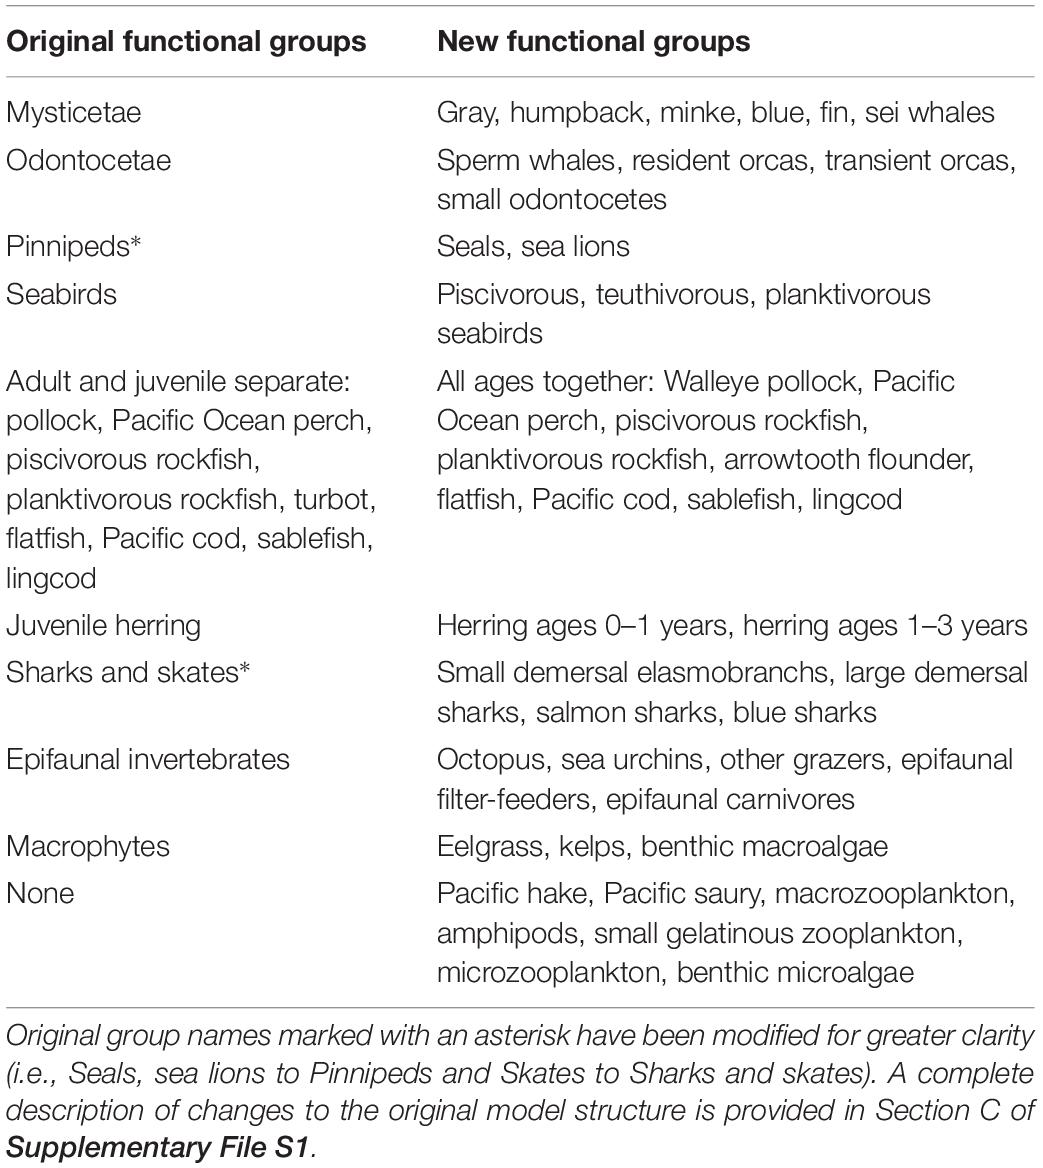
Table 1. Modifications to functional group structure introduced in the present models.
Materials and Methods
A detailed description of Ecopath model structure and parameterization appears in Section C of Supplementary File S1. Basic Ecopath parameter values for all functional groups and models are given in Section D of Supplementary File S1. Consumer diet compositions appear in Supplementary File S2, while fisheries landings and discards (t km−2) by fleet and functional group are given in Supplementary Files S3, S4, respectively. Model parameterization was tested for gross deviations from empirically determined cross-ecosystem patterns using the PREBAL (pre-balancing) technique of Link (2010).
Static Ecosystem Snapshots
Distributions of biomass or abundance versus individual mass or size (commonly known as size spectra) are frequently employed to investigate ecosystem structure and status (Blanchard et al., 2017). When such distributions are plotted using multiple points per size class rather than logarithmically binned classes, and biomasses are not normalized by size interval width, a log–log size spectrum slope of zero is almost universal across marine, freshwater, and terrestrial ecosystems, as revealed by both empirical investigations and models (Blanchard et al., 2017). However, small departures from this value occasionally occur, particularly in heavily exploited ecosystems (e.g., Jennings and Mackinson, 2003).
In order to compare ecosystem structure across all models (1900, 1950, and current), log-transformed functional group biomass densities (t km–2) were tested for Spearman rank correlation (n = 80) with estimated log-transformed mean individual mass (kg). Where this relationship proved significant (P < 0.05), an analysis of covariance (ANCOVA) was employed to test for differences among model spectrum slopes. Model group biomasses were plotted against individual masses separately, rather than in logarithmically binned size classes, to generate size spectra, and biomasses were not normalized by size interval width. Thus, ANCOVA tested model spectrum slopes for departures from the zero value expected given this approach to defining size spectra (Blanchard et al., 2017). Given the lack of evidence to the contrary (e.g., higher biomasses in 1900 than in 1950 across many size classes), it was hypothesized that size spectrum slopes across all ecosystem states (1900, 1950, and current) would not differ significantly from each other or from zero.
In addition, six ecosystem status indicators were compared across the 1900, 1950, and current models. These included mean trophic levels of the ecosystem (MTLe) and catch (MTLc), the Shannon–Wiener biodiversity index (H′) of the ecosystem, total biomass (Btot) and catch (Ytot) of non-detritus groups, and total system throughput (TST), i.e., total annual biomass flux (t km–2 year–1) through all direct trophic interactions. In the MTL and H′ calculations, functional groups replaced species as the fundamental unit. Based on the findings of Pauly et al. (2001), MTLe and MTLc were expected to decline since 1900, as were H′ and TST due to the apparent depletion of many fish and marine mammal groups.
Furthermore, two group-specific indicators were evaluated across the 1900, 1950, and current models. Firstly, proportions of the total herring consumption by predators were calculated for each predator to examine their impacts on herring across ecosystem states. Secondly, mixed trophic impacts (MTIs), measuring the net instantaneous impact (positive or negative; top-down, bottom-up, or competitive) of each functional group on all others (Christensen and Walters, 2004), were examined for all interactions involving herring in the 1950 model. Biomass-weighted average MTI values were computed across all herring stocks and age classes to evaluate overall trophic impacts on and of herring circa 1950. Based on the diverse diet of local herring (Pakhomov et al., 2017) and the importance of this forage fish to numerous predators (Willson and Womble, 2006), MTI values for trophic interactions involving herring were expected to be substantial.
Dynamic Ecosystem Trends
The 1950 Ecopath model was fitted to time series of biomass and catch data (1950–2015) in Ecosim using a non-linear search algorithm manipulating vulnerability parameter values (v), which govern the degree of top-down or bottom-up control of each trophic interaction. Vulnerability values above and below v = 2 imply top-down and bottom-up control, respectively (Christensen et al., 2008). Model fitting followed best practice as outlined by Heymans et al. (2016). The most parsimonious fit to time series among those generated by 10 scenarios was selected using the Akaike Information Criterion with a second-order correction for small sample size (AICc). The 10 fitting scenarios (Table 2) were mainly designed to evaluate the relative importance of trophic interactions and trends in fishing mortality, other natural mortality (M0), and primary productivity (i.e., bottom-up forcing) as drivers of local ecosystem dynamics through ranking of scenario AICc values. Climatic correlates of the historical primary production anomaly (PPA), a relative trend reconstructed from all time series by the non-linear search algorithm, were investigated using Spearman rank correlations (n = 792) with monthly values of three physical oceanographic indices: the Pacific Decadal Oscillation or PDO (Mantua et al., 1997), the Northern Oscillation Index or NOI (Schwing et al., 2002), and sea surface temperature (SST) at Langara Island off northwestern Haida Gwaii (Figure 1). A full description of the model fitting procedure appears in Section E of Supplementary File S1. Biomass, catch, and fishing mortality time series are provided in Supplementary File S5, while basic Ecosim parameter values appear in Supplementary File S6.
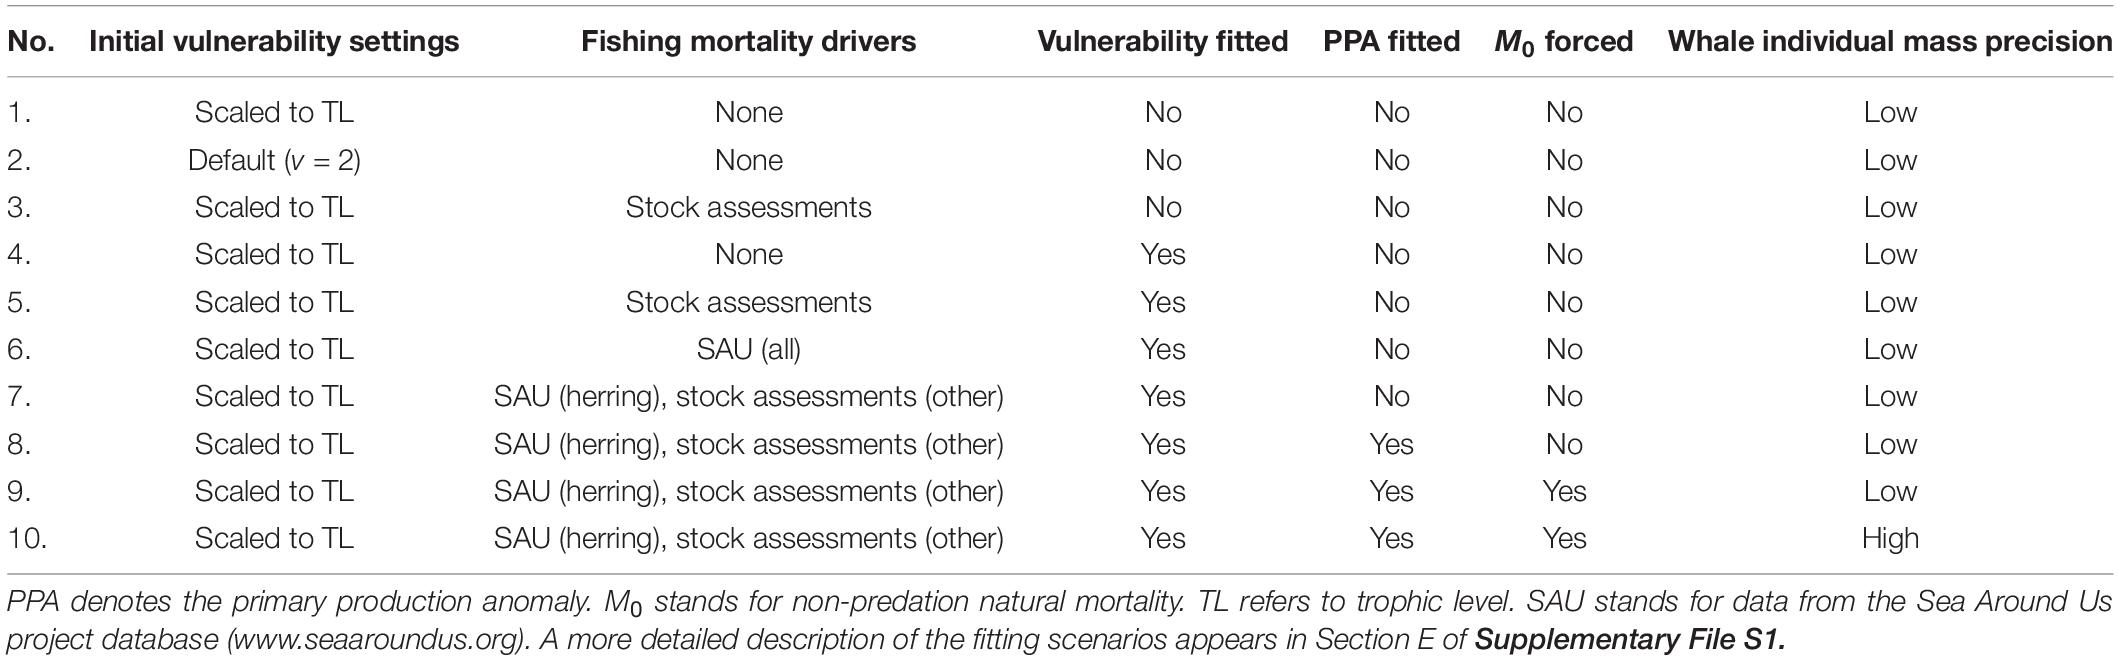
Table 2. Fitting scenarios tested for the 1950 model.
In order to quantify changing ecosystem structure and status since 1950, trends in three ecological indicators, i.e., mean ecosystem trophic level (MTLe), the Shannon–Wiener biodiversity index (H′), and the fishing in balance index (FiB), were computed from the most parsimonious fit (i.e., minimum AICc) scenario. FiB is an improved indicator of “fishing down marine food webs” (Pauly et al., 1998) lacking the methodological flaws attributed to MTLc (Pauly et al., 2000). Significance of observed trends was tested with Spearman rank correlation between time (years) and annual indicator values (n = 66). Based on the findings of Pauly et al. (2001), MTLe was expected to decline during the fitting interval, while FiB was anticipated to reveal that “fishing down” the local food web had occurred since 1950. A decrease in H′ was also expected based on declines in many functional group biomasses.
In addition, in order to investigate the fullest possible range of trophic and non-trophic factors affecting herring natural mortality M, Spearman rank correlations (n = 26) between herring M and copepod biomass anomalies were computed for 1990–2015. Natural mortalities (DFO, 2016; Figure 2A) for the local (HG, HG 2W, PRD, and CC) and West Coast of Vancouver Island (WCVI) herring stocks were matched with biomass anomalies (Galbraith and Young, 2017; Figure 2B) observed off northwest Vancouver Island for three copepod assemblages (i.e., southern shelf, boreal shelf, and subarctic oceanic). These are distinguished by index species and a descending order of energy content (Mackas et al., 2004). Elevated biomass of energy-rich (i.e., subarctic oceanic and/or boreal shelf) copepods might be expected to decrease starvation mortality in planktivorous fish such as herring, while such mortality could be expected to increase with the biomass of energy-poor (i.e., southern shelf) species (Mackas et al., 2007).
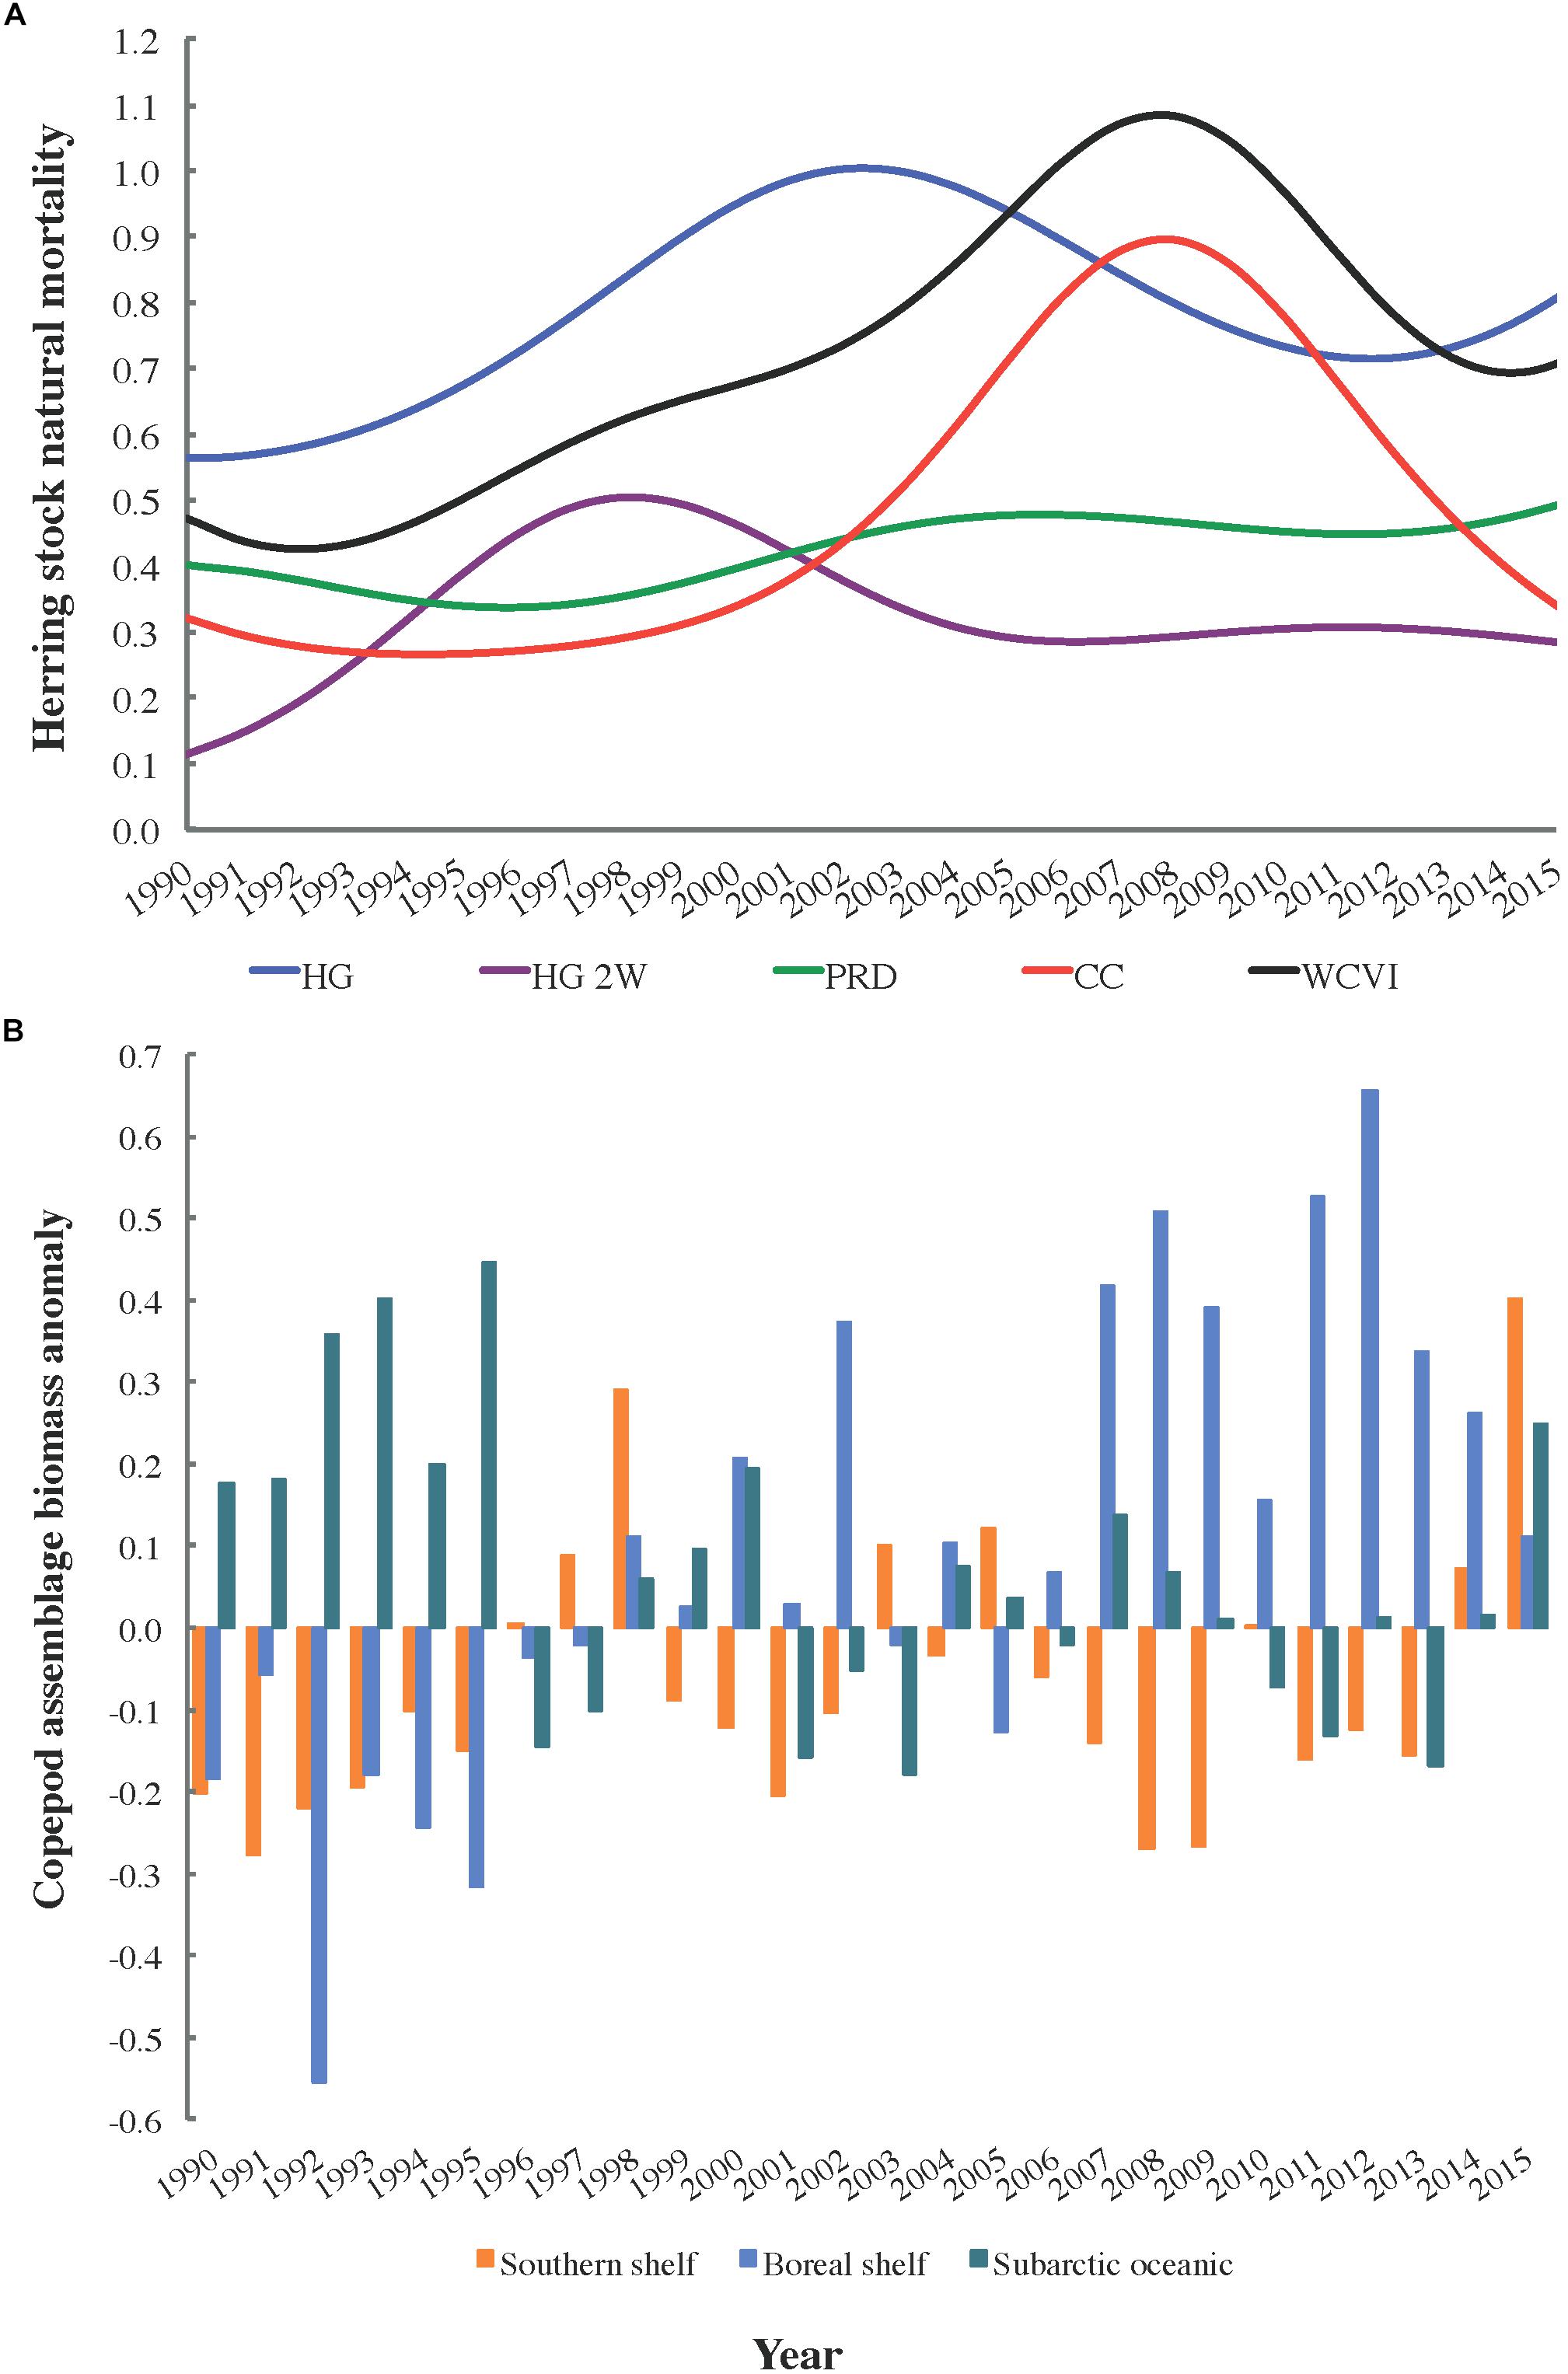
Figure 2. Trends in (A) estimated natural mortality (M) for five Pacific herring stocks (DFO, 2016) and (B) biomass anomalies for three copepod assemblages off northwest Vancouver Island, 1990–2015 (Galbraith and Young, 2017).
All statistical tests in the present study were performed using the JMP statistical software package (Altman, 2002). The Bonferroni correction was applied to significance levels for all multiple comparisons.
Results
Static Ecosystem Snapshots
Highly significant (P < 0.001) log–log correlations between functional group biomass and individual mass occurred across all models (1900: Spearman ρ = −0.47; 1950: ρ = −0.54; current: ρ = −0.52). Size spectrum slopes (Figure 3) did not differ significantly among models (ANCOVA: n = 80, df = 2, F = 0.02, P = 0.96), but all departed significantly from the expected value of zero (ANCOVA: n = 80, df = 3, F = 6.69, P < 0.001).
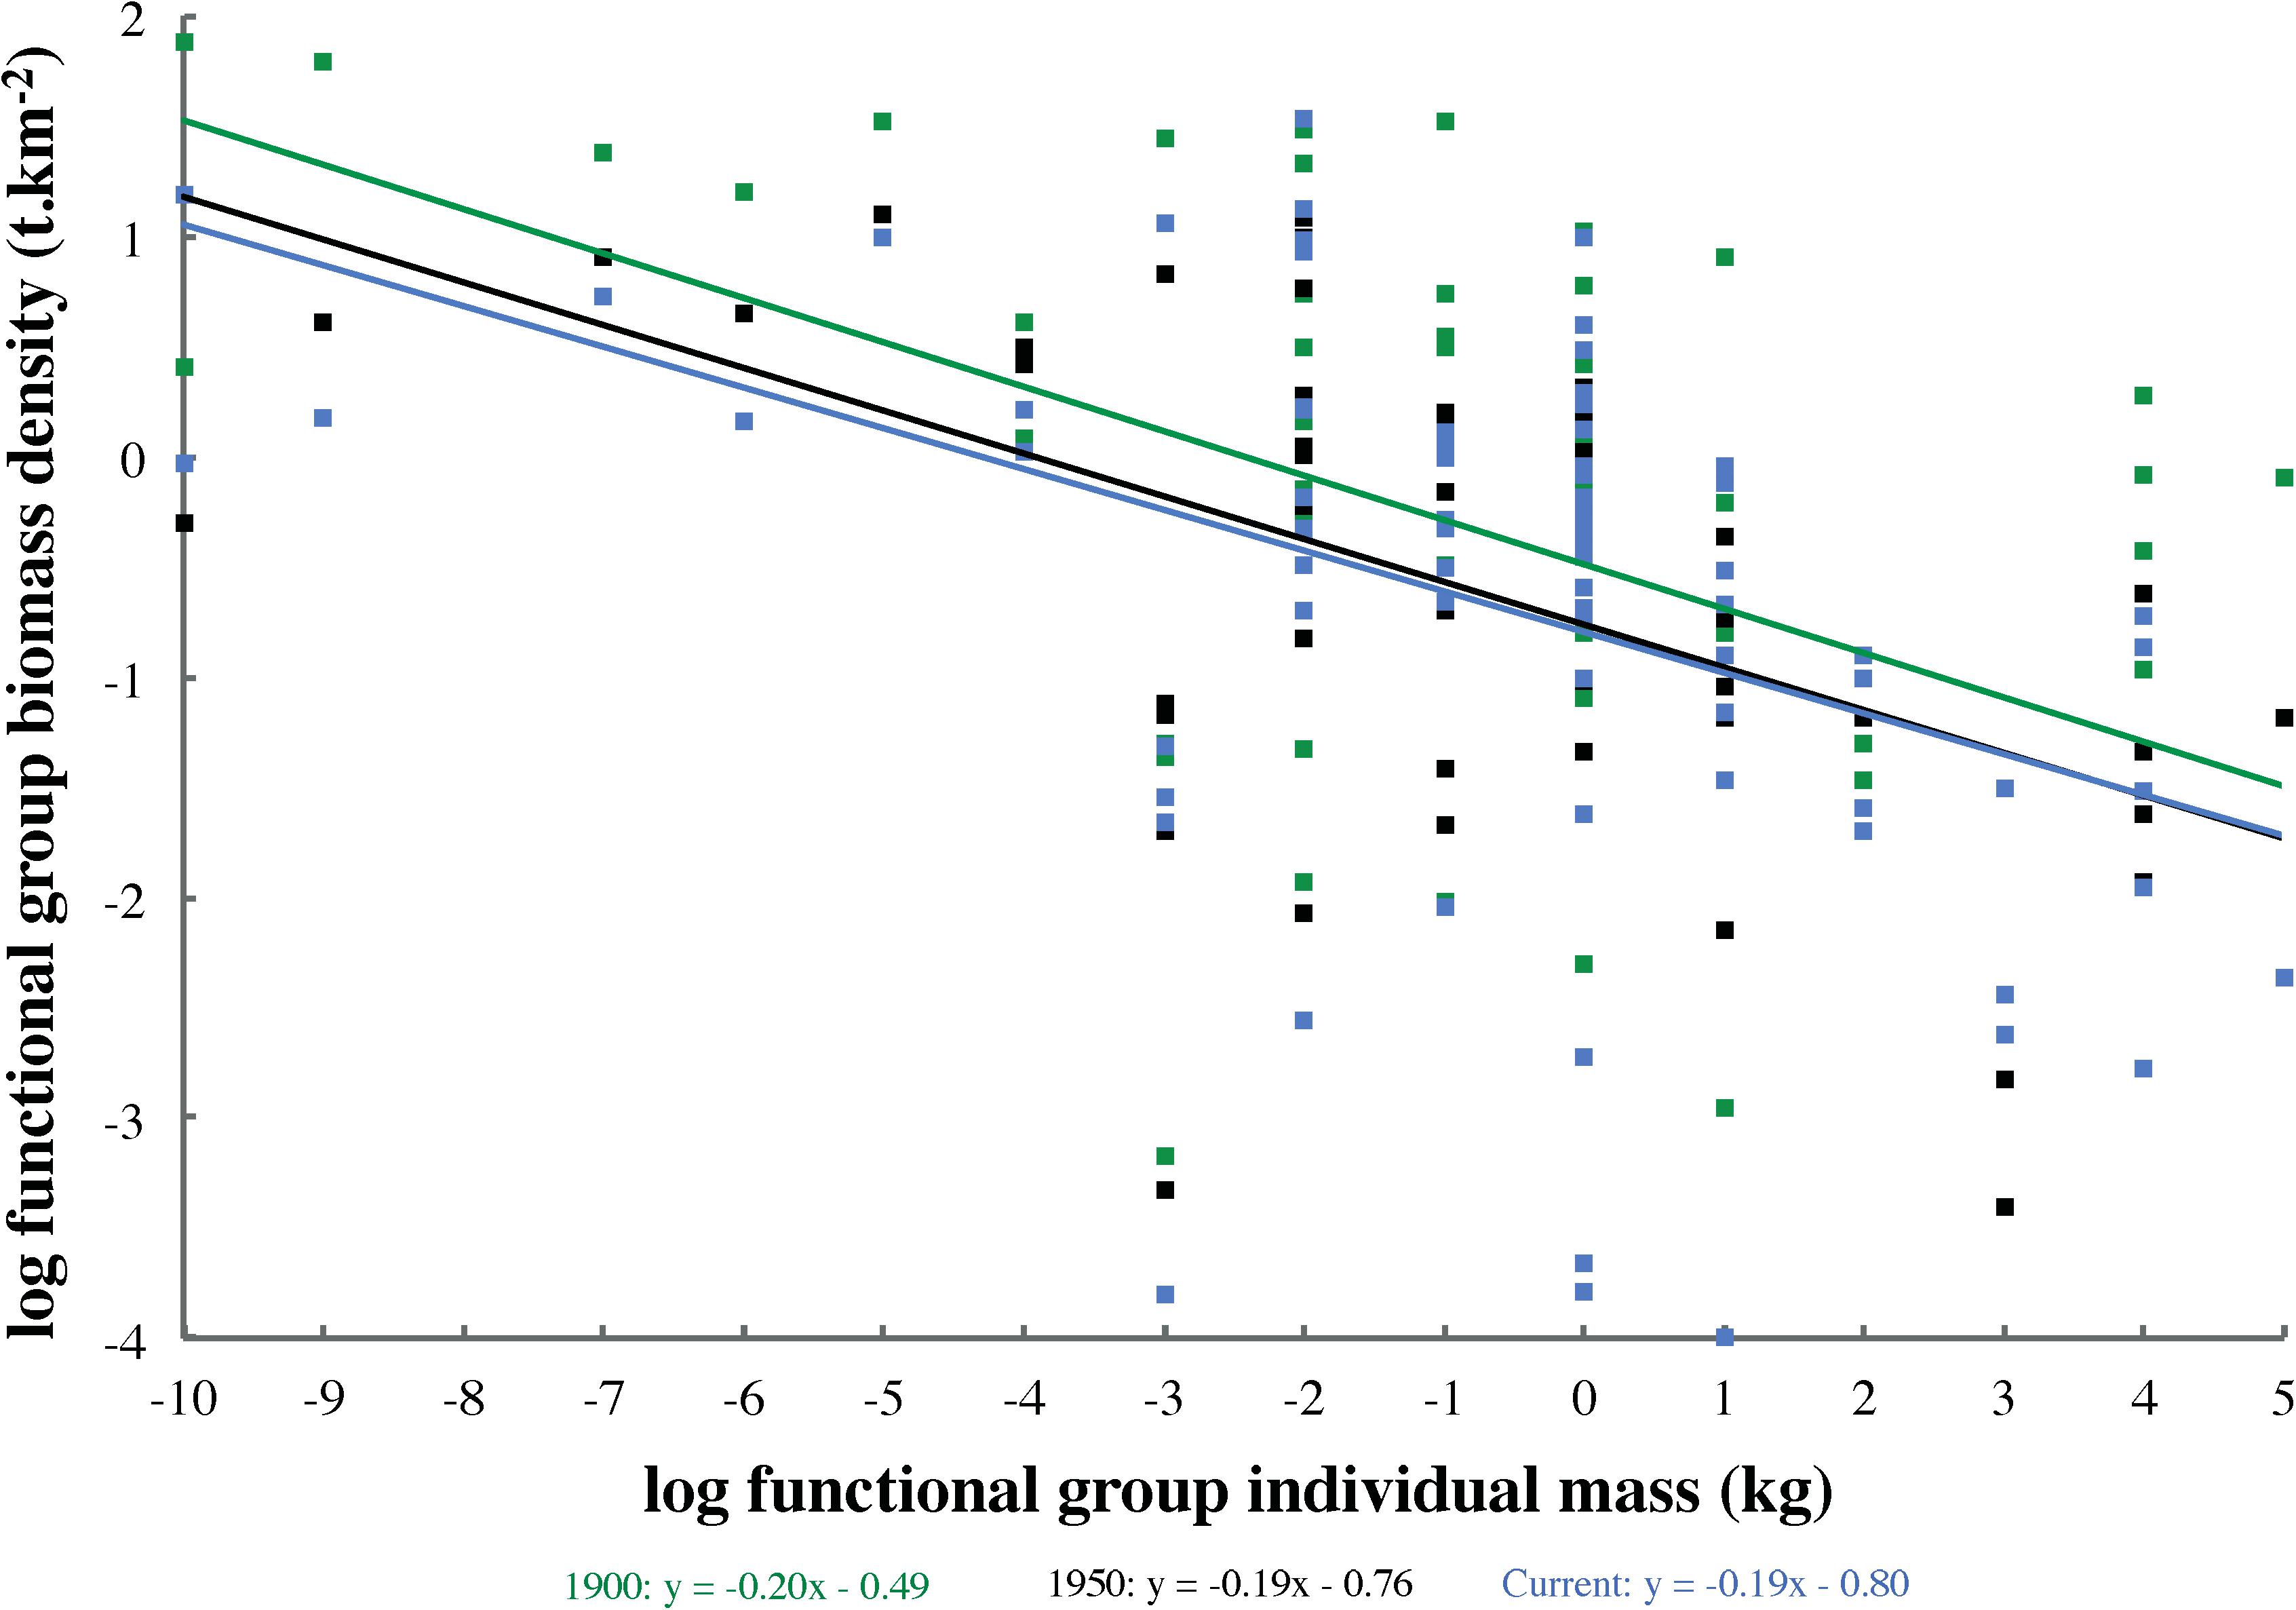
Figure 3. Biomass size spectra for Ecopath models representing three ecosystem states (1900, 1950, and current). Functional group biomasses were not normalized by size interval width or grouped into logarithmically binned size classes.
Ecosystem indicator values across all three models appear in Table 3. The mean trophic level of the ecosystem (MTLe) declined ∼11% between 1900 and 1950 and ∼4% after 1950, while that of the catch (MTLc) decreased by ∼14 and ∼3% over these intervals. Shannon–Wiener biodiversity (H′) increased ∼4% from 1900 to 1950 and declined ∼3% since 1950. Total living biomass (Btot) decreased ∼66% between 1900 and 1950 and ∼4% after 1950. Total catch (Ytot) rose almost sixfold (∼592%) from 1900 to 1950 before falling ∼23% following 1950. Total system throughput (TST) declined ∼80% before 1950 and ∼6% afterward.
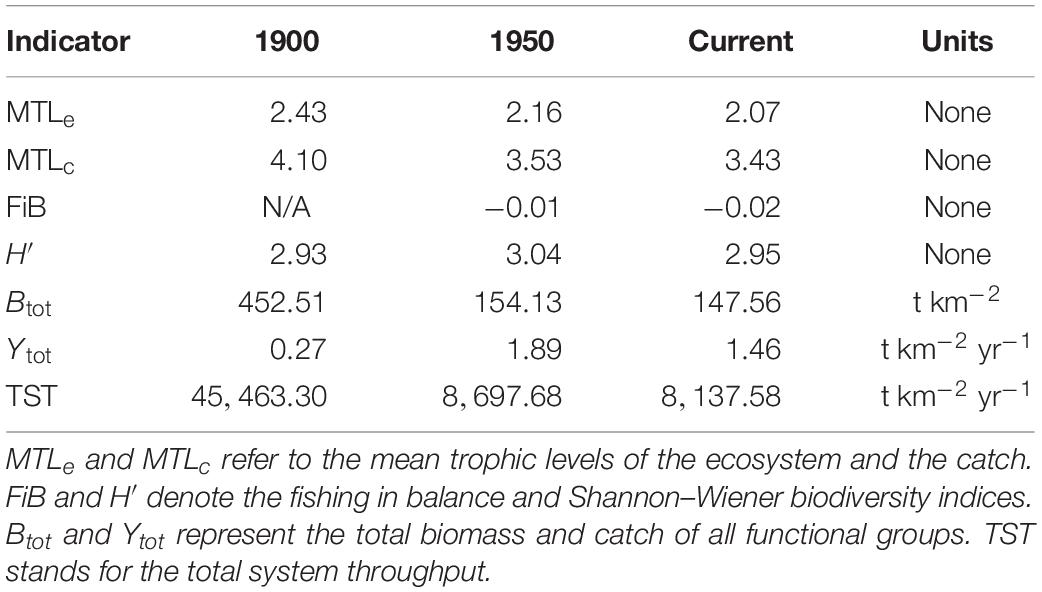
Table 3. Ecosystem indicator values for the three Ecopath models.
The distribution of total herring consumption among predator groups (Figure 4) is a function of proportions of herring in predator diet compositions (Figure 5), predator biomasses, and predator consumption per biomass (Q/B) rates. Herring was generally most prominent in predator diets from 1950, followed by current and 1900 diets (Figure 5A). In 1950, the piscivorous seabird diet included the highest proportion of herring (∼25%), with humpback whale, lingcod (Ophiodon elongatus), and inshore rockfish (Sebastes spp.) diets not far behind (Figure 5B).
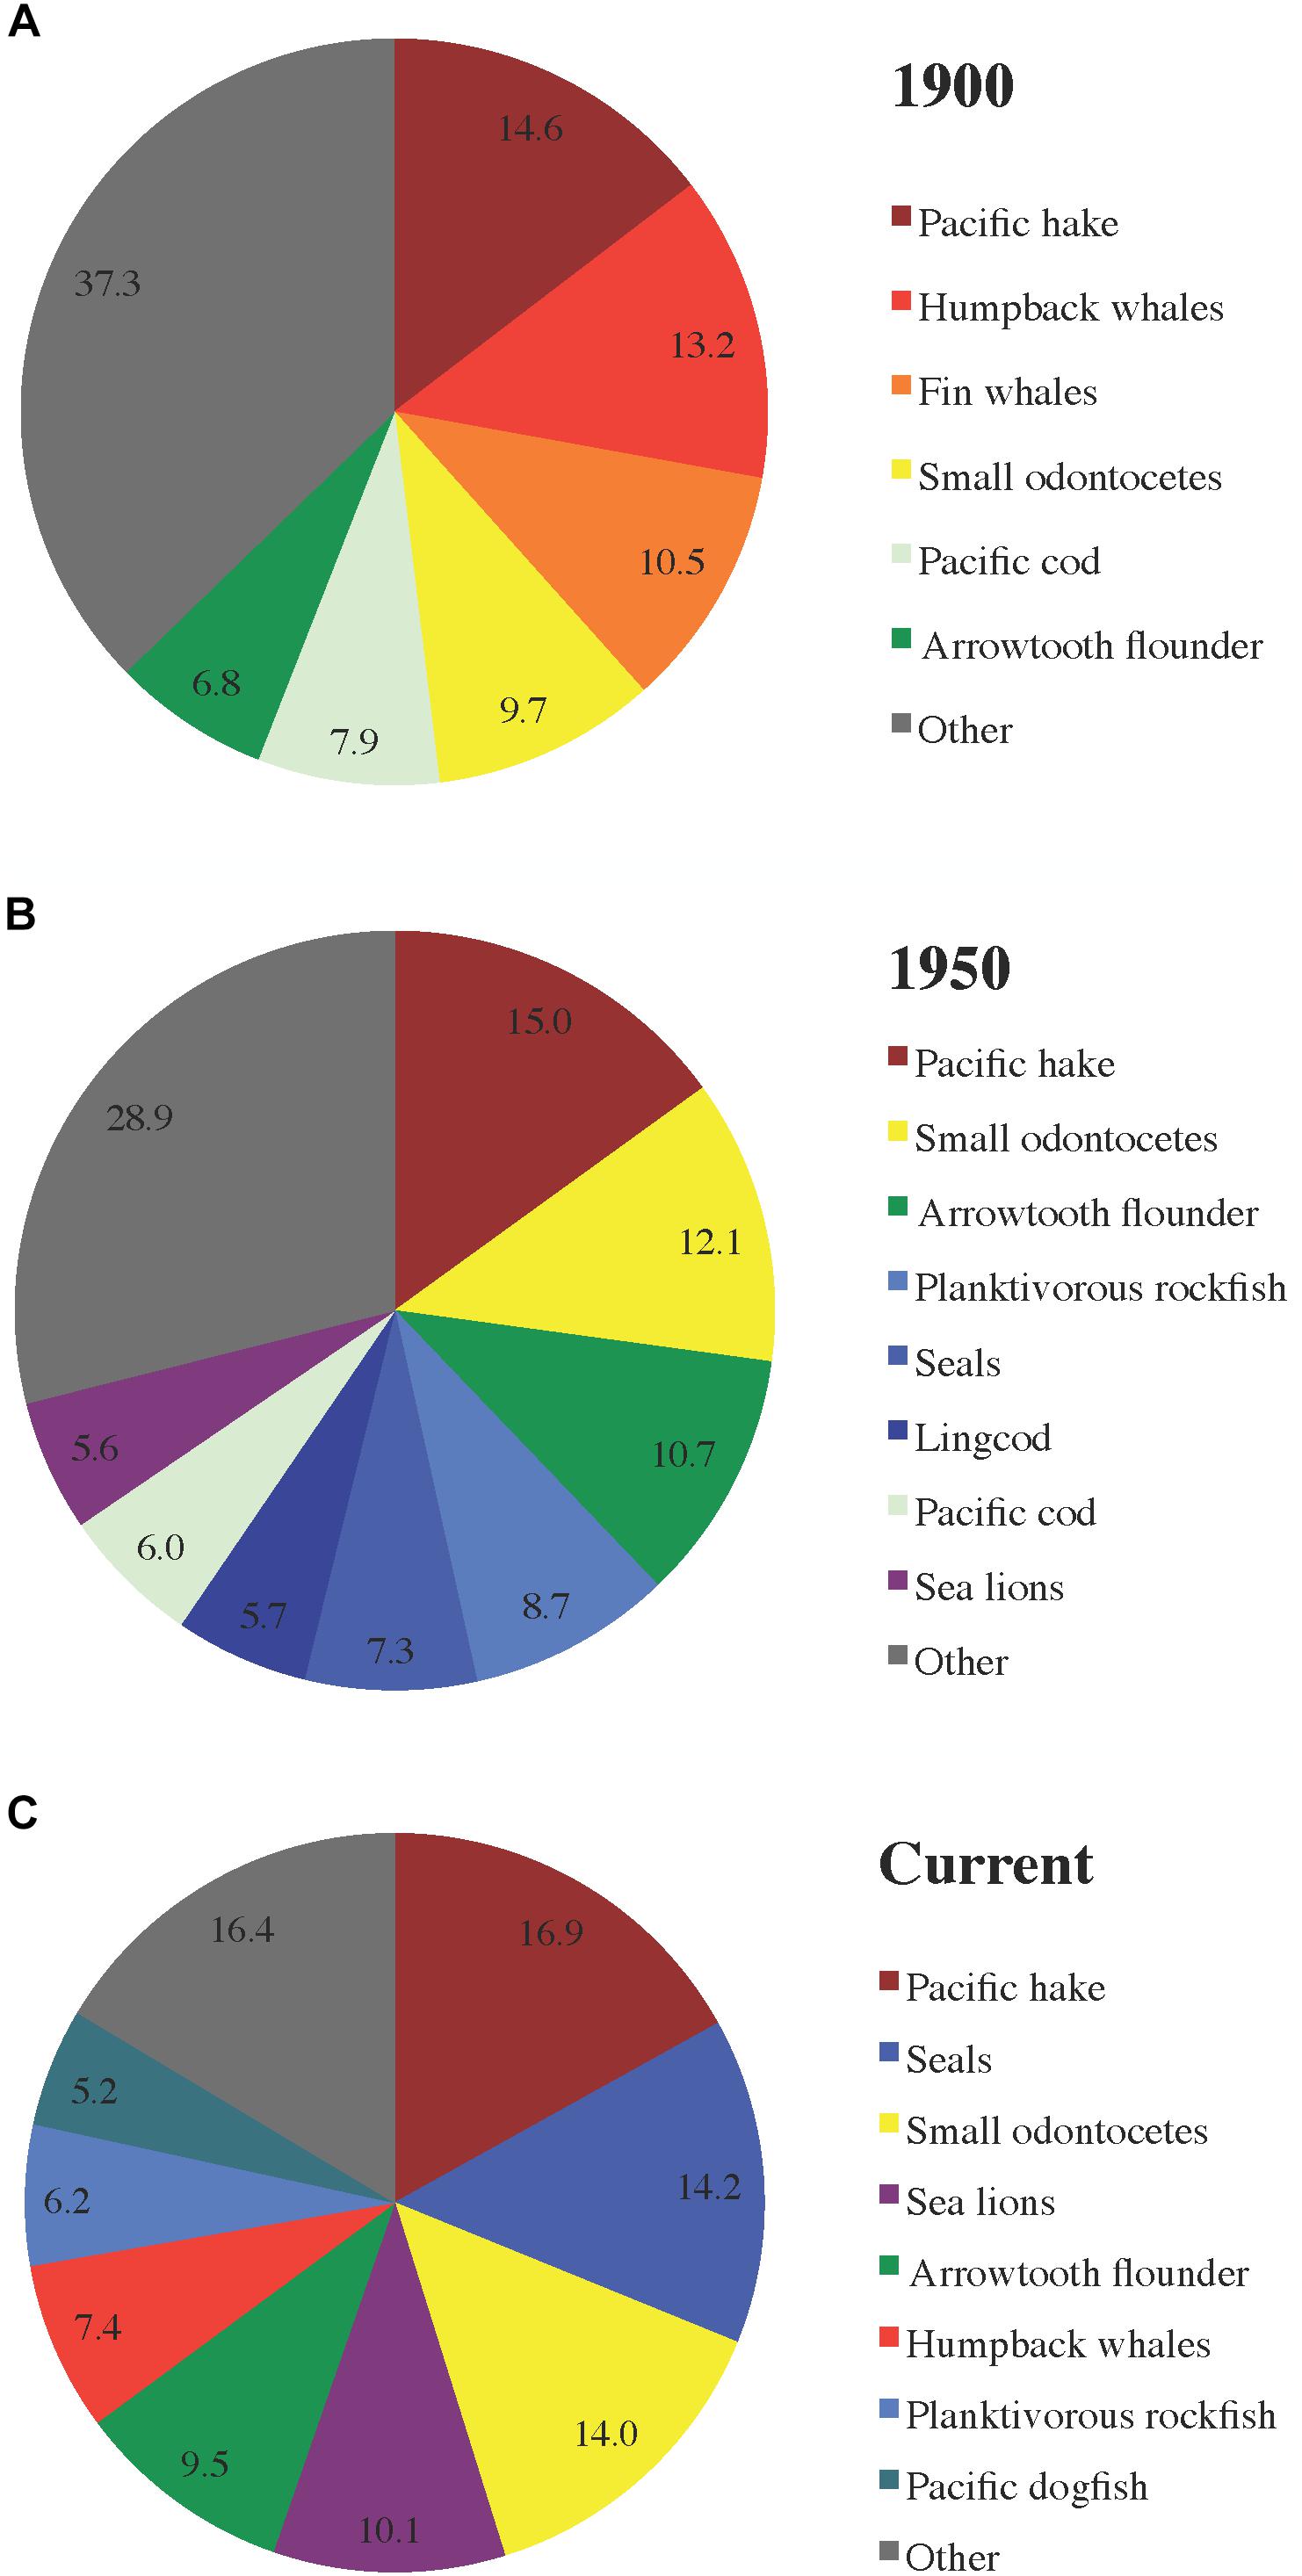
Figure 4. Proportions of total predator consumption of herring (all stocks and age/size classes combined) attributable to major predator functional groups in the (A) 1900, (B) 1950, and (C) current ecosystem models.
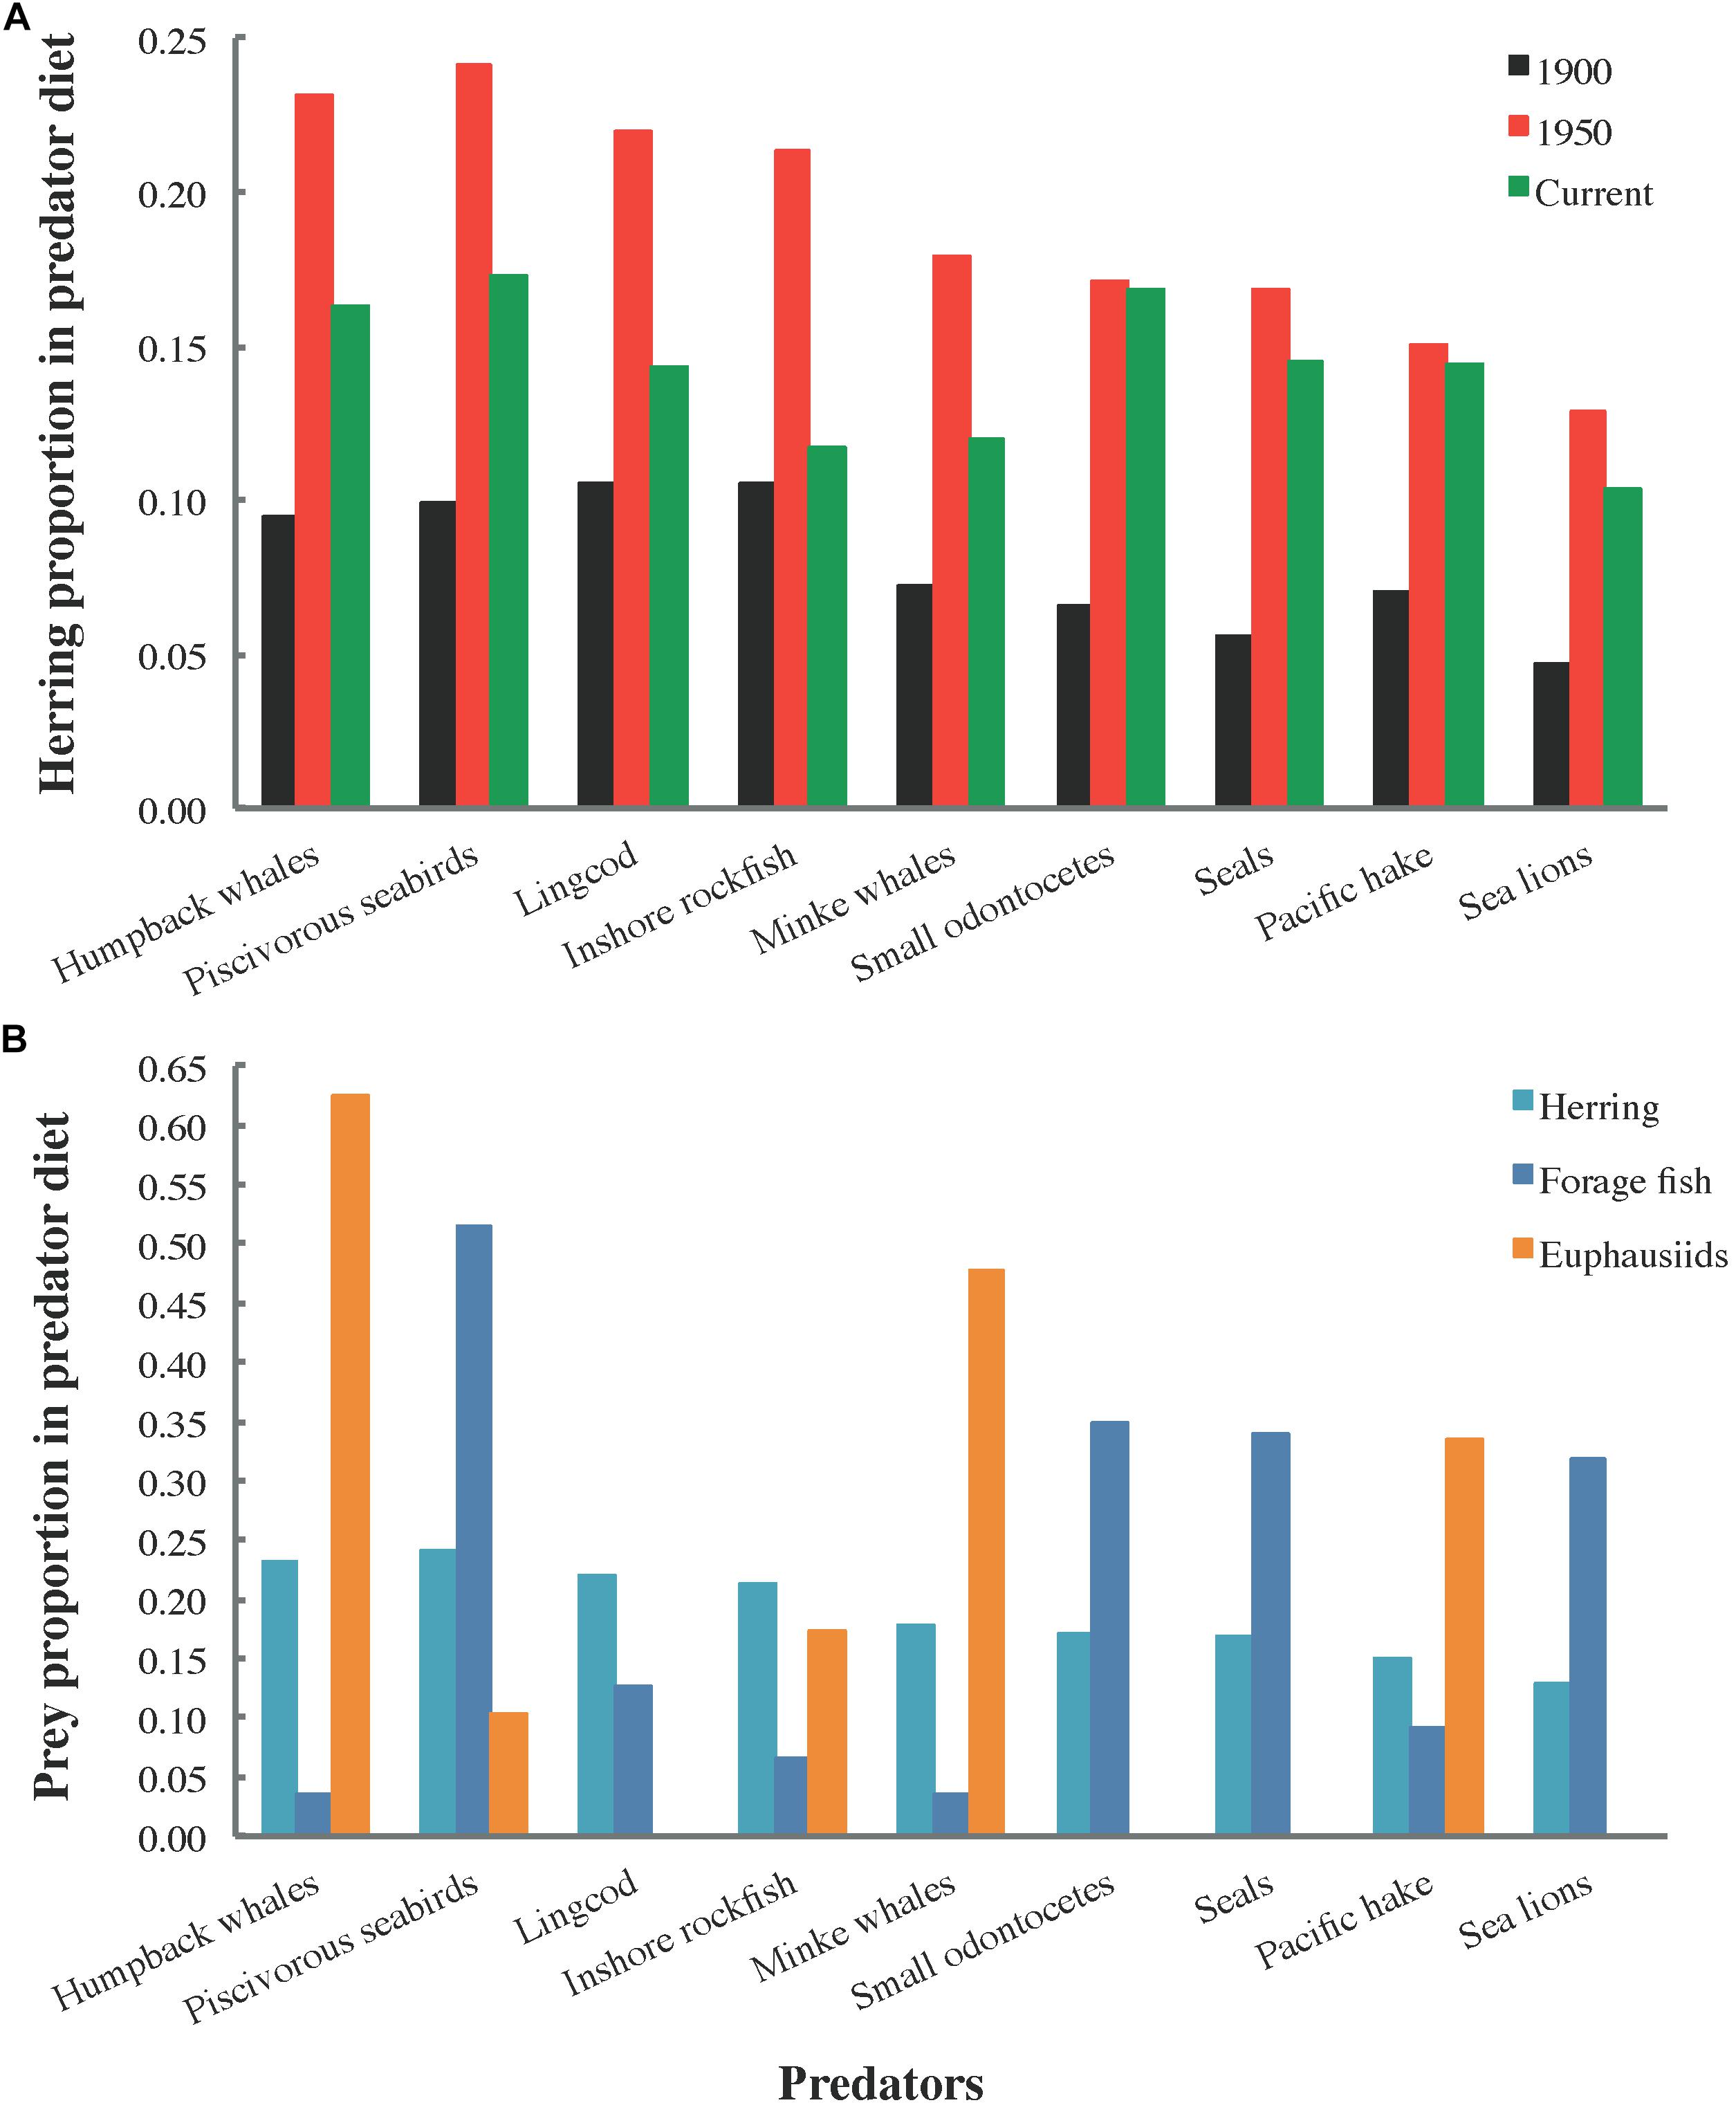
Figure 5. Proportions of (A) herring by ecosystem state (1900, 1950, and current) and (B) herring, forage fish (all small pelagic fish except herring, Pacific saury, and eulachon), and euphausiids in the diets of selected predator functional groups.
Large groundfish, primarily Pacific hake and cod (Gadus macrocephalus), arrowtooth flounder (Atheresthes stomias), planktivorous rockfish (Sebastes spp.), and lingcod, were the dominant consumers of herring across all ecosystem states (Figure 4). However, the role of marine mammals was also notable, with cetaceans preeminent among them in 1900 and currently while pinnipeds predominated in 1950. In 1900, humpback and fin whales (Balaenoptera physalus) represented nearly 25% of the total predator consumption of herring, while predatory fish (predominantly Pacific hake, cod, and arrowtooth flounder) accounted for most of the remainder (Figure 4A). In 1950, whale consumption of herring was negligible, with the pinniped (seal and sea lion) share rising to ∼13% of the total and carnivorous fish (mainly Pacific hake, arrowtooth flounder, and planktivorous rockfish) responsible for the rest (Figure 4B). In the current model, pinnipeds and humpback whales accounted for nearly 25% and ∼7% of predator consumption of herring, respectively, while large fish (primarily Pacific hake, arrowtooth flounder, and Pacific dogfish Squalus suckleyi) represented most of the remainder (Figure 4C).
Notable MTIs of herring on other functional groups (MTI > 0.01) are shown in Figure 6A. The number of impacts above this threshold (9) was quite low (∼13%) relative to the number of nodes in the food web (69 if all herring groups are considered together). MTIs of other functional groups on herring are presented in Figure 6B. The number of values exceeding the threshold (21) was higher for impacts on herring (∼30% relative to the number of food web nodes) than that for impacts of herring on other groups. While positive values predominated among the impacts of herring, the opposite was true of impacts on herring. Of the 12 herring predators with MTI > 0.01, 3 registered positive impacts of herring while 9 exerted negative impacts on herring. All three herring prey with MTI > 0.01 showed positive impacts on herring. However, two of these were also negatively impacted by herring, albeit less strongly so. Nine (36%) of the 25 functional groups demonstrating MTI > 0.01 were neither predators nor prey of herring.
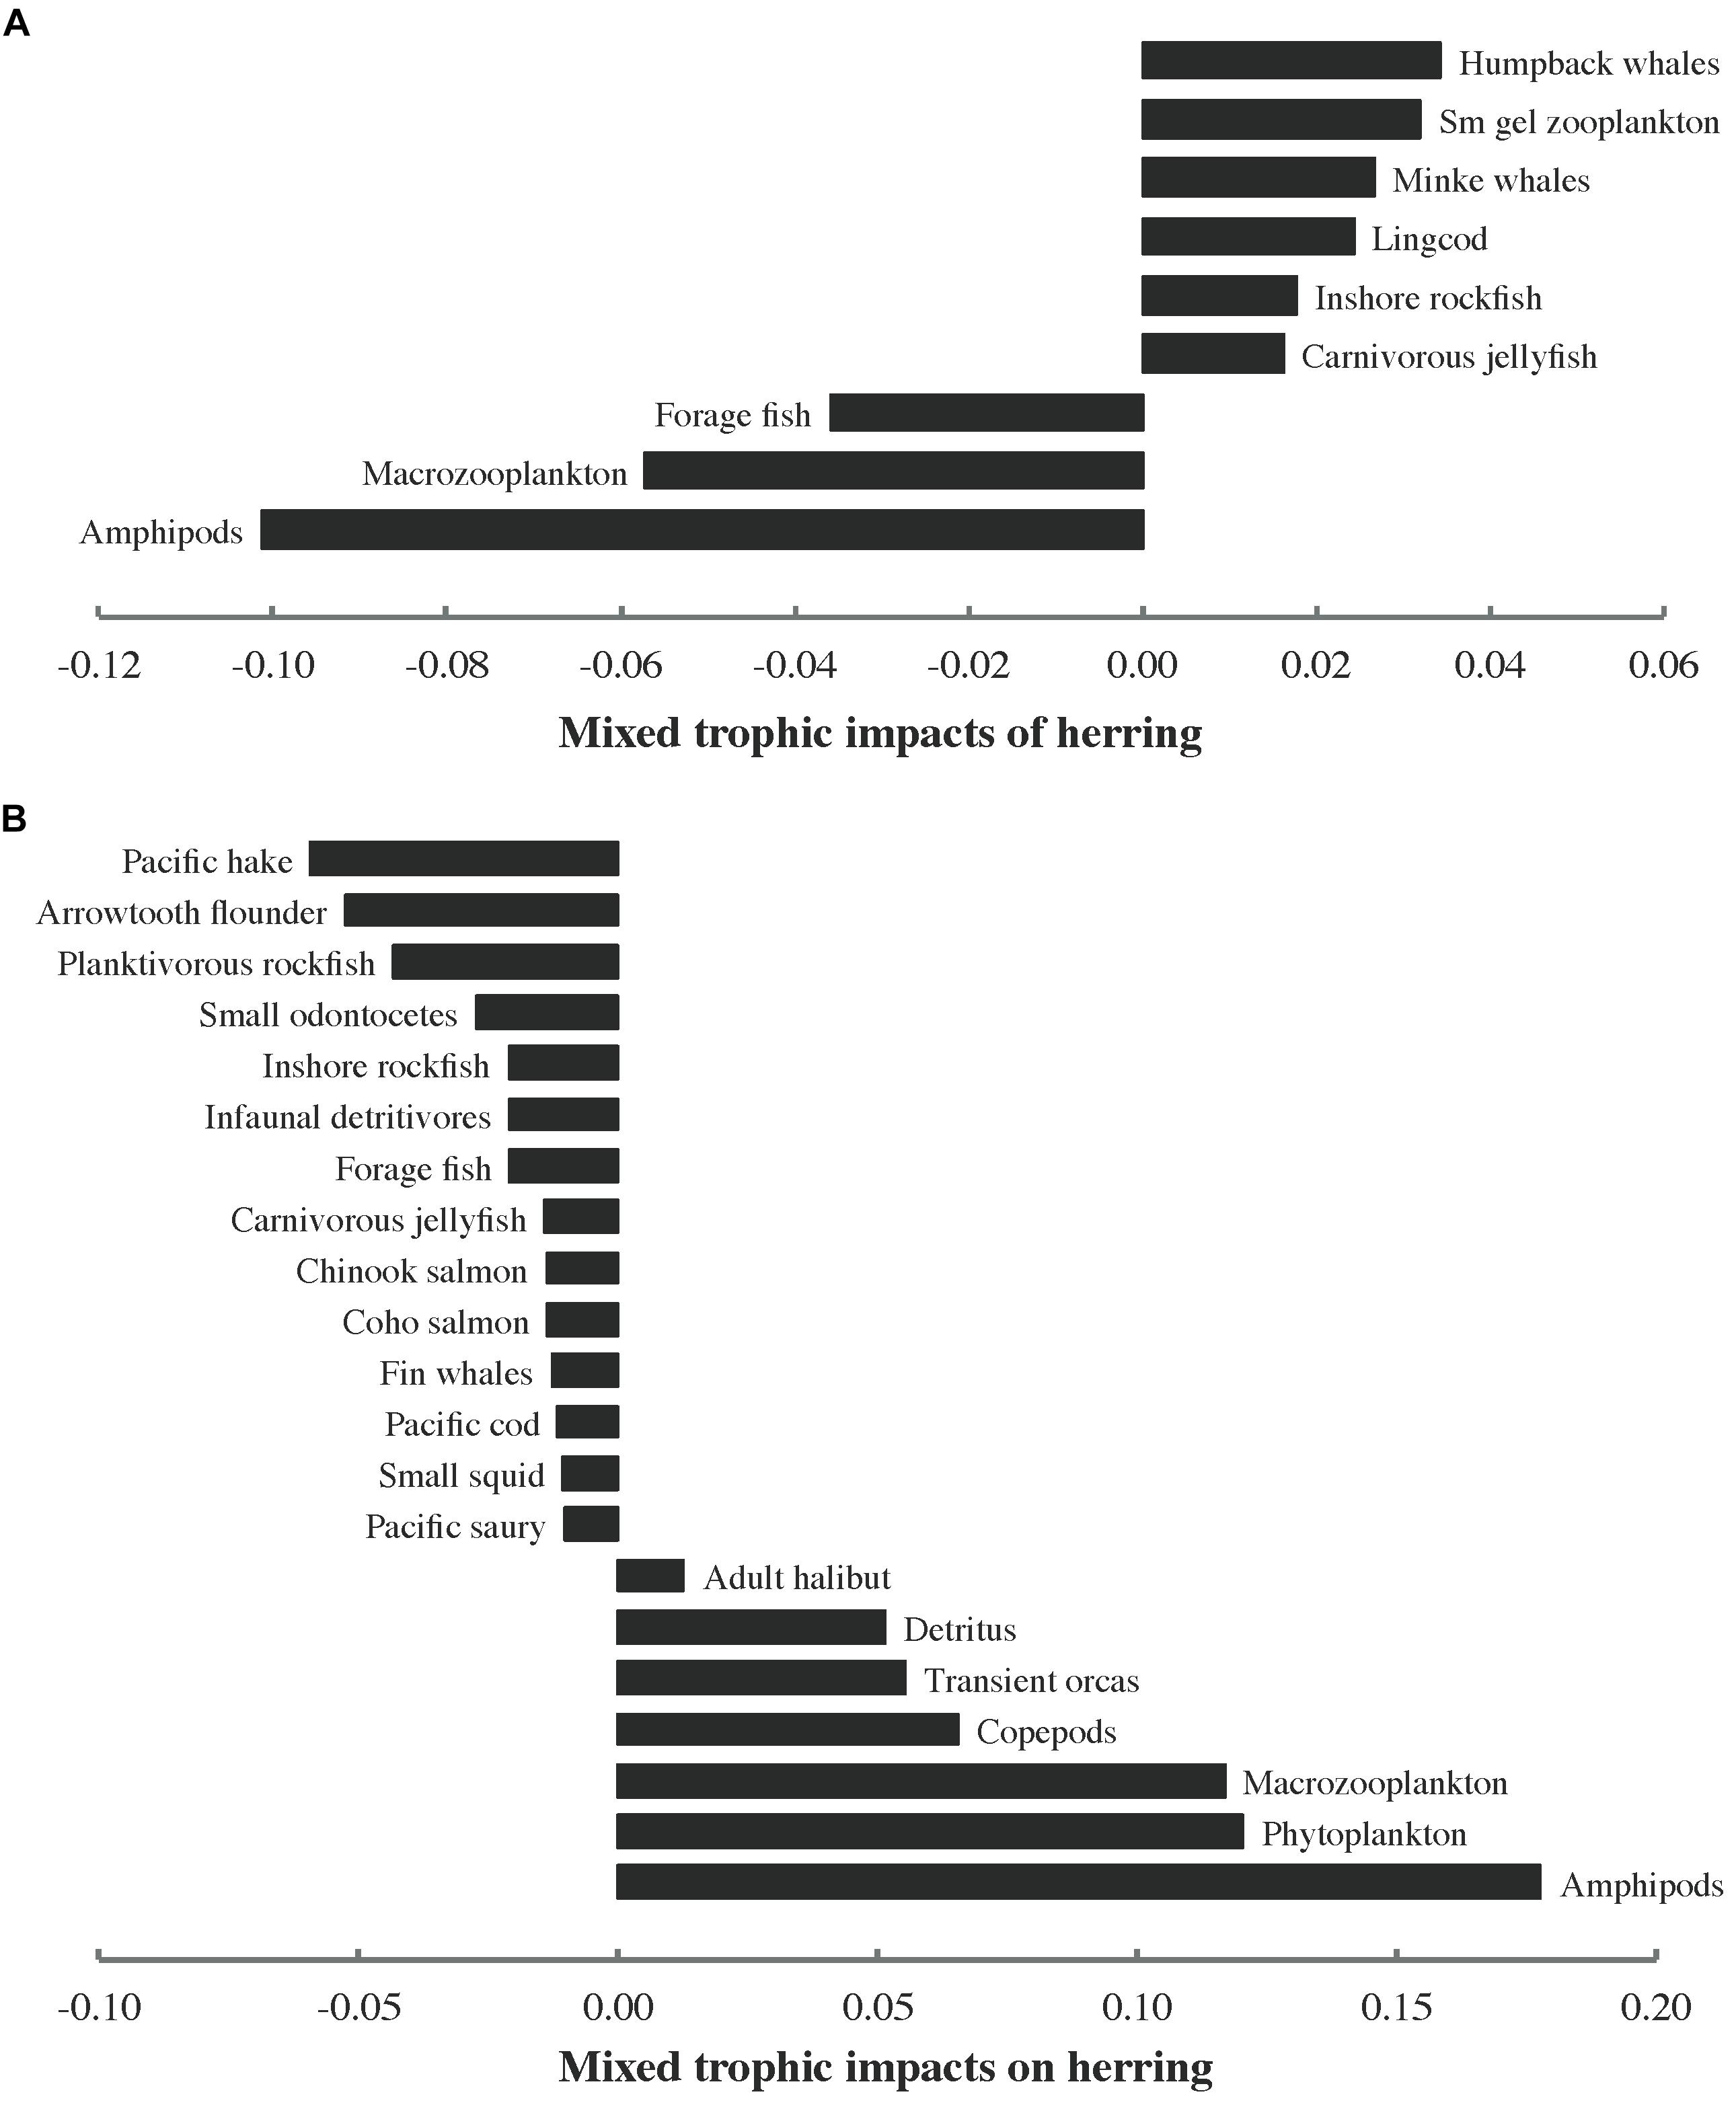
Figure 6. Notable (>0.01) mixed trophic impacts (MTI) of (A) herring (all stocks and age/size classes combined) on other functional groups and (B) other functional groups on herring in the 1950 ecosystem model. Sm gel stands for small gelatinous.
Dynamic Ecosystem Trends
Akaike information criterion (AICc) values for each 1950 model fitting scenario appear in Table 4. The vulnerability search conducted in the presence of fishing mortality drivers accounted for ∼87% of the AICc reduction in the most parsimonious fit to time series (scenario 10) relative to the baseline (ΔAICc). Fishing mortality drivers alone represented ∼69% of ΔAICc, while a vulnerability search unaided by such drivers achieved only 2–3%. The PPA and non-predation natural mortality forcing functions for selected fish stocks (listed in Section E of Supplementary File S1) accounted for 5 and 3% of ΔAICc, respectively. Running Ecosim with default vulnerability settings (v = 2) for all consumers yielded only ∼3% of ΔAICc.
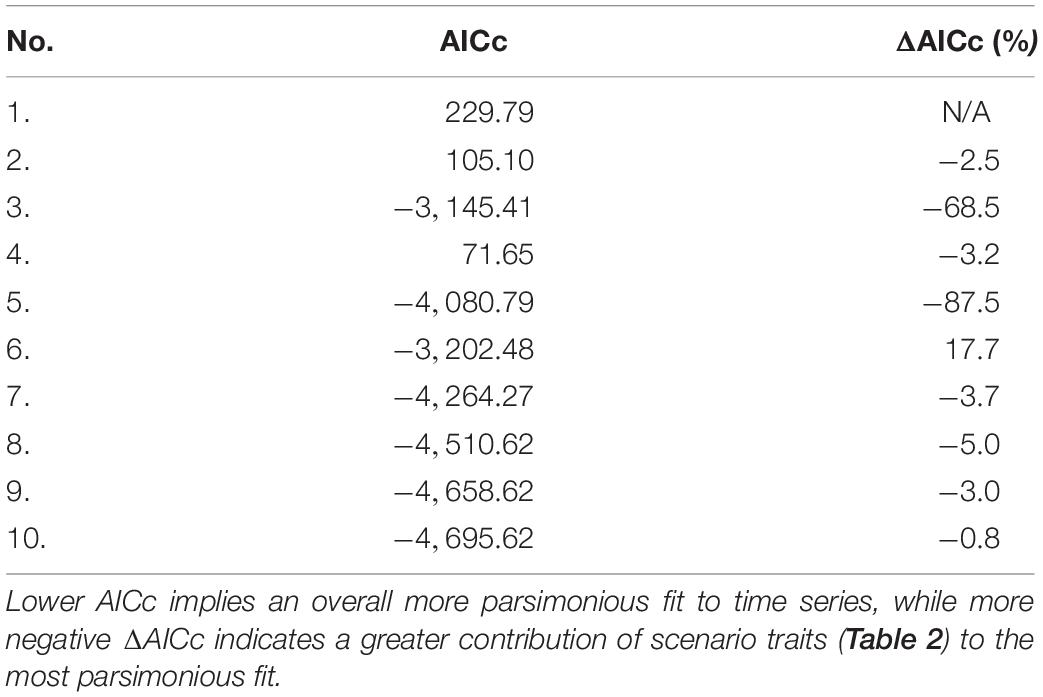
Table 4. Adjusted Akaike information criterion (AICc) values and percent improvement in AICc with respect to the scenario 1 baseline (ΔAICc) for each fitting scenario.
The fitted PPA represented a significant increasing trend (i.e., positive correlation with time in years: Spearman ρ = 0.44, P < 0.001) across the fitting interval (1950–2015). It also showed significant positive correlations with local SST (ρ = 0.08, P = 0.02) and the PDO (ρ = 0.26, P < 0.001) and a significant negative correlation with the NOI (ρ = −0.08, P = 0.02). However, correlations with SST and the NOI were no longer significant once the Bonferroni correction for multiple comparisons was applied.
Final vulnerability parameter values appear in Section F of Supplementary File S1. Unlike in the 1950 NBC model fit, no significant correlation was detected between vulnerability and predator trophic level (Spearman ρ = 0.04, P = 0.85). Sixteen consumers, including blue whales (B. musculus), fin, sei (B. borealis), humpback, and sperm whales (Physeter macrocephalus) all adult herring (Figure 7), Pacific cod, and euphausiids, showed v ≥ 2, while 12 others (gray whales Eschrichtius robustus, transient orcas Orcinus orca, seals and sea lions, all seabirds, chinook salmon Oncorhynchus tshawytscha, transient salmon Oncorhynchus spp., eulachon Thaleichthys pacificus, lingcod, and small demersal elasmobranchs) demonstrated v ≤ 2.
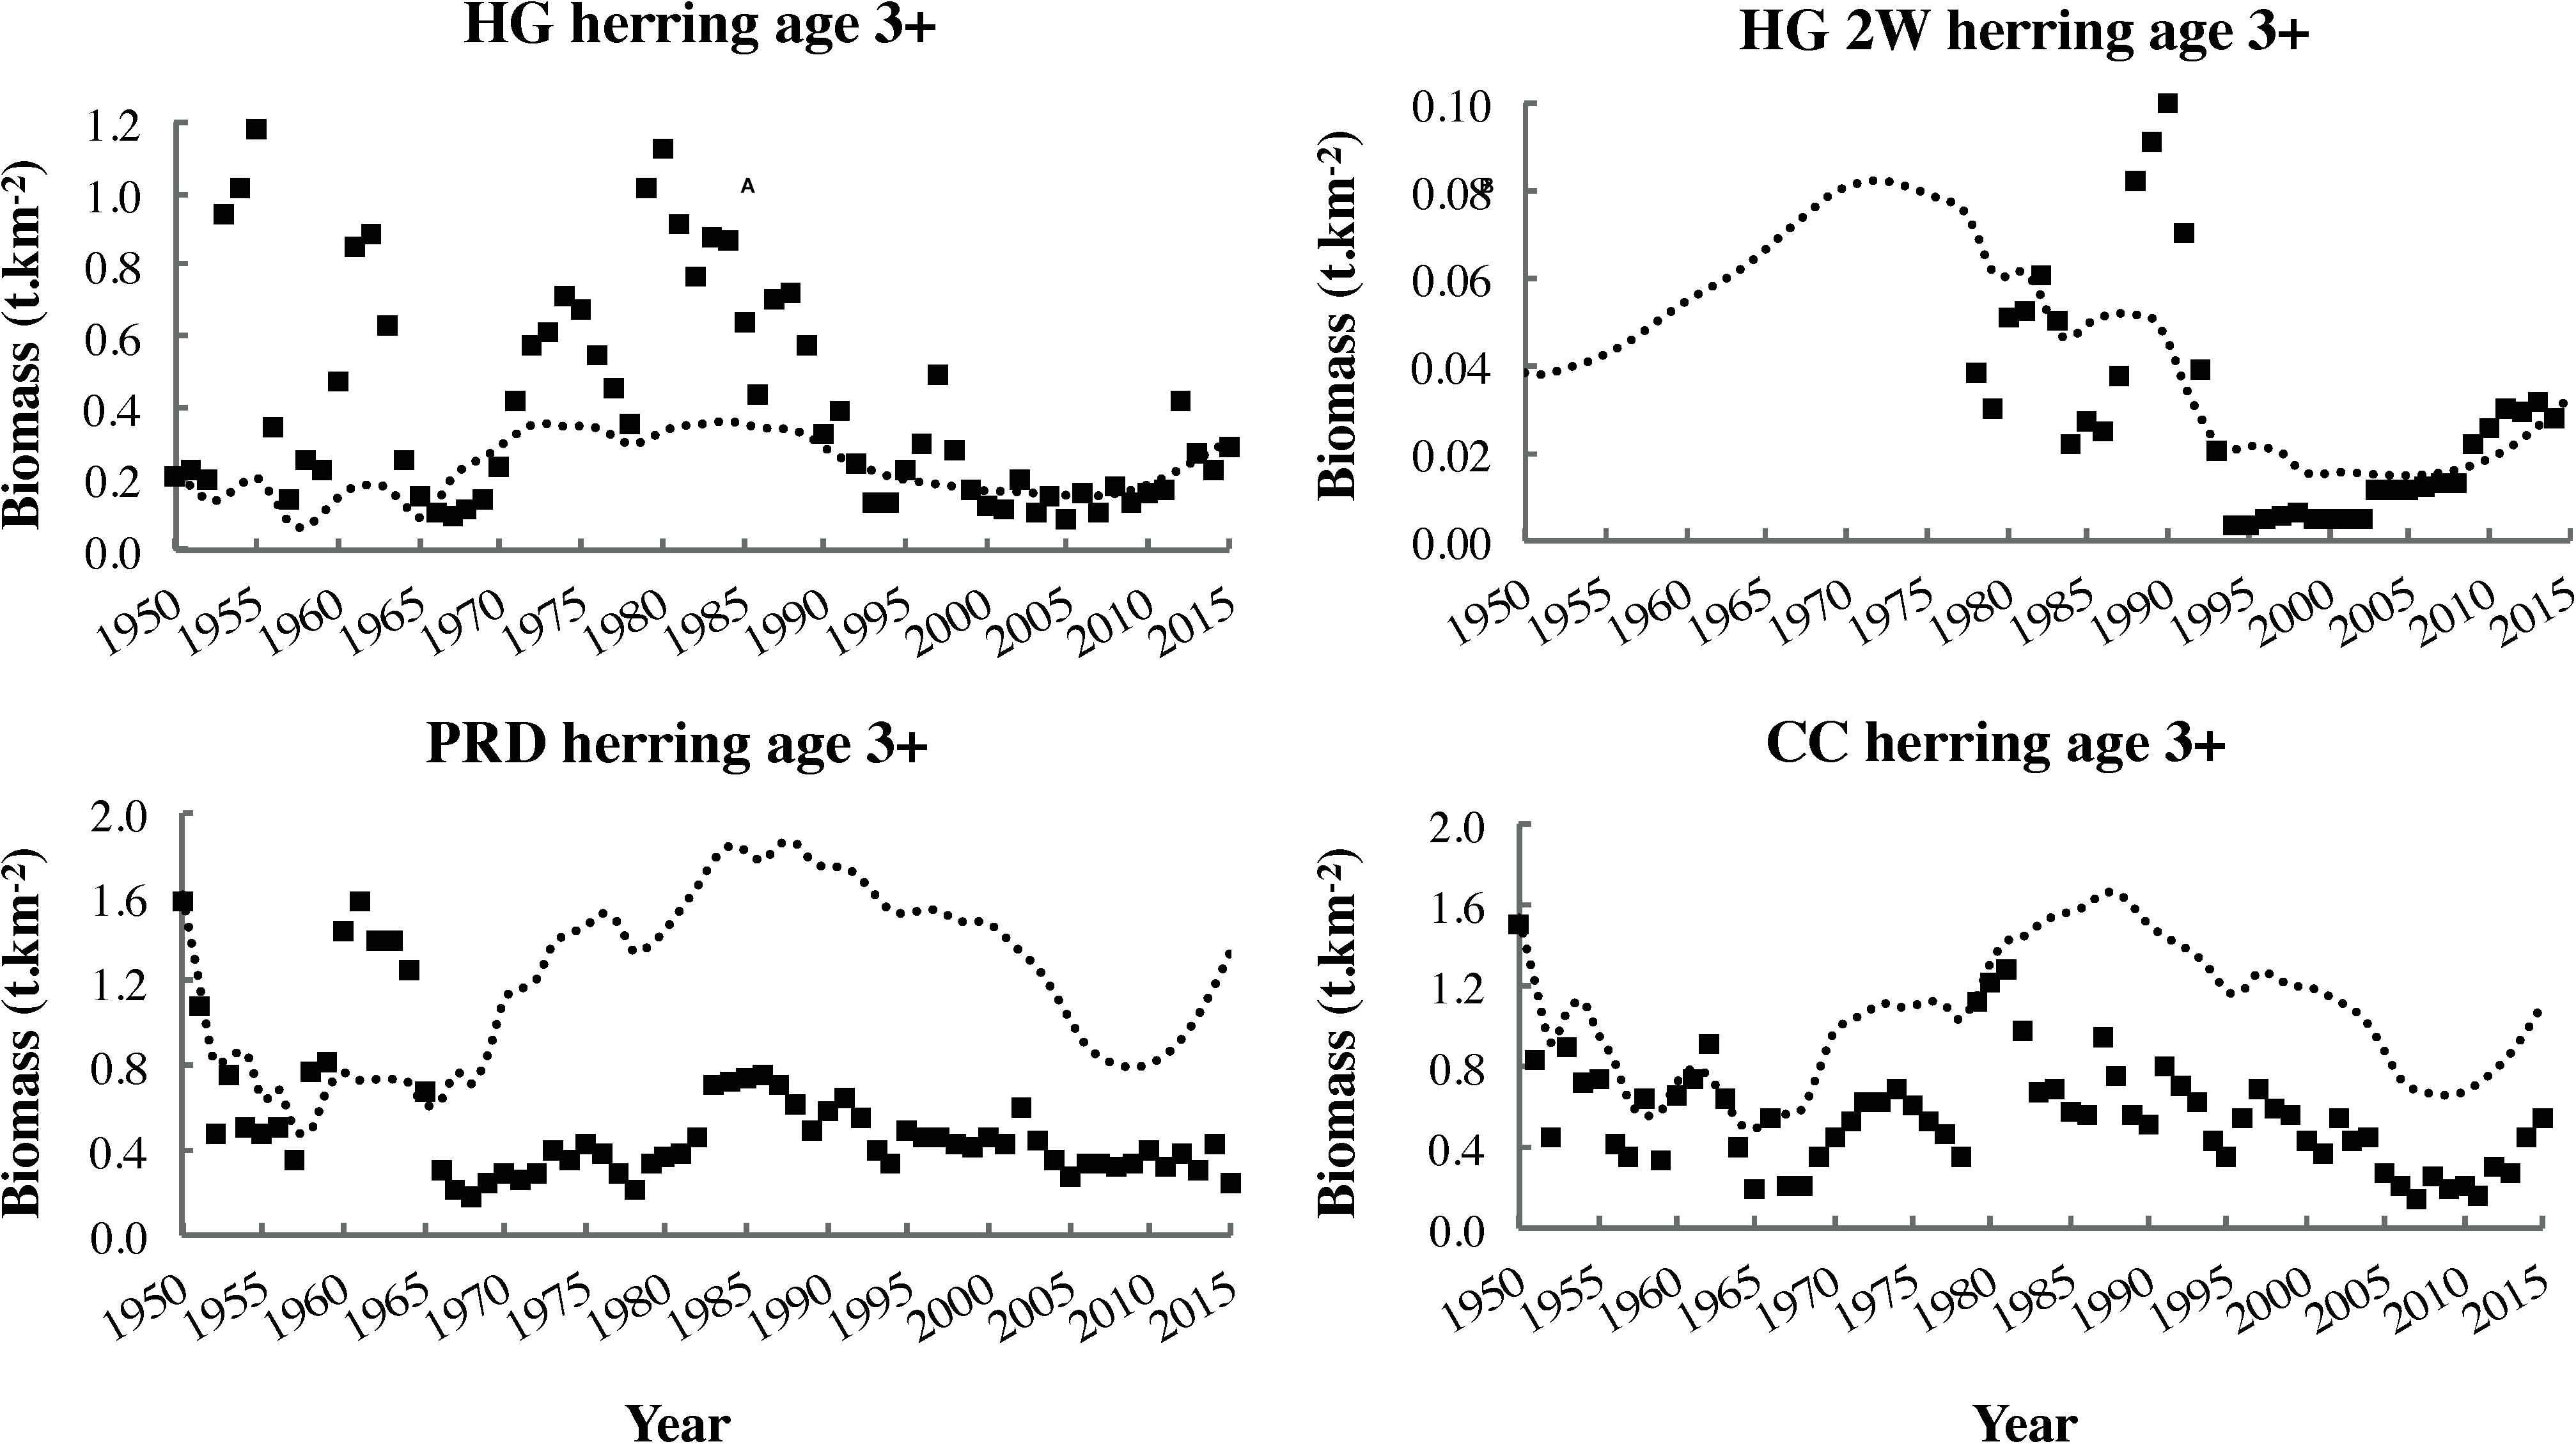
Figure 7. Biomass time series (squares) and dynamic ecosystem simulation outputs (most parsimonious fit, dotted lines) for adult (age 3+ years) classes of the four local herring stocks.
Significant decreasing trends (i.e., negative correlations with time) were detected for Shannon–Wiener H′ biodiversity (ρ = −0.63, P < 0.001; Figure 8B) and the FiB index (ρ = −0.75, P < 0.001; Figure 8C), but not the mean trophic level of the ecosystem (ρ = −0.11, P = 0.30; Figure 8A). The Shannon–Wiener H′ showed a particularly steep decline after 2005. The FiB index oscillated between positive and negative values early in the fitting period but became consistently negative by 1970.
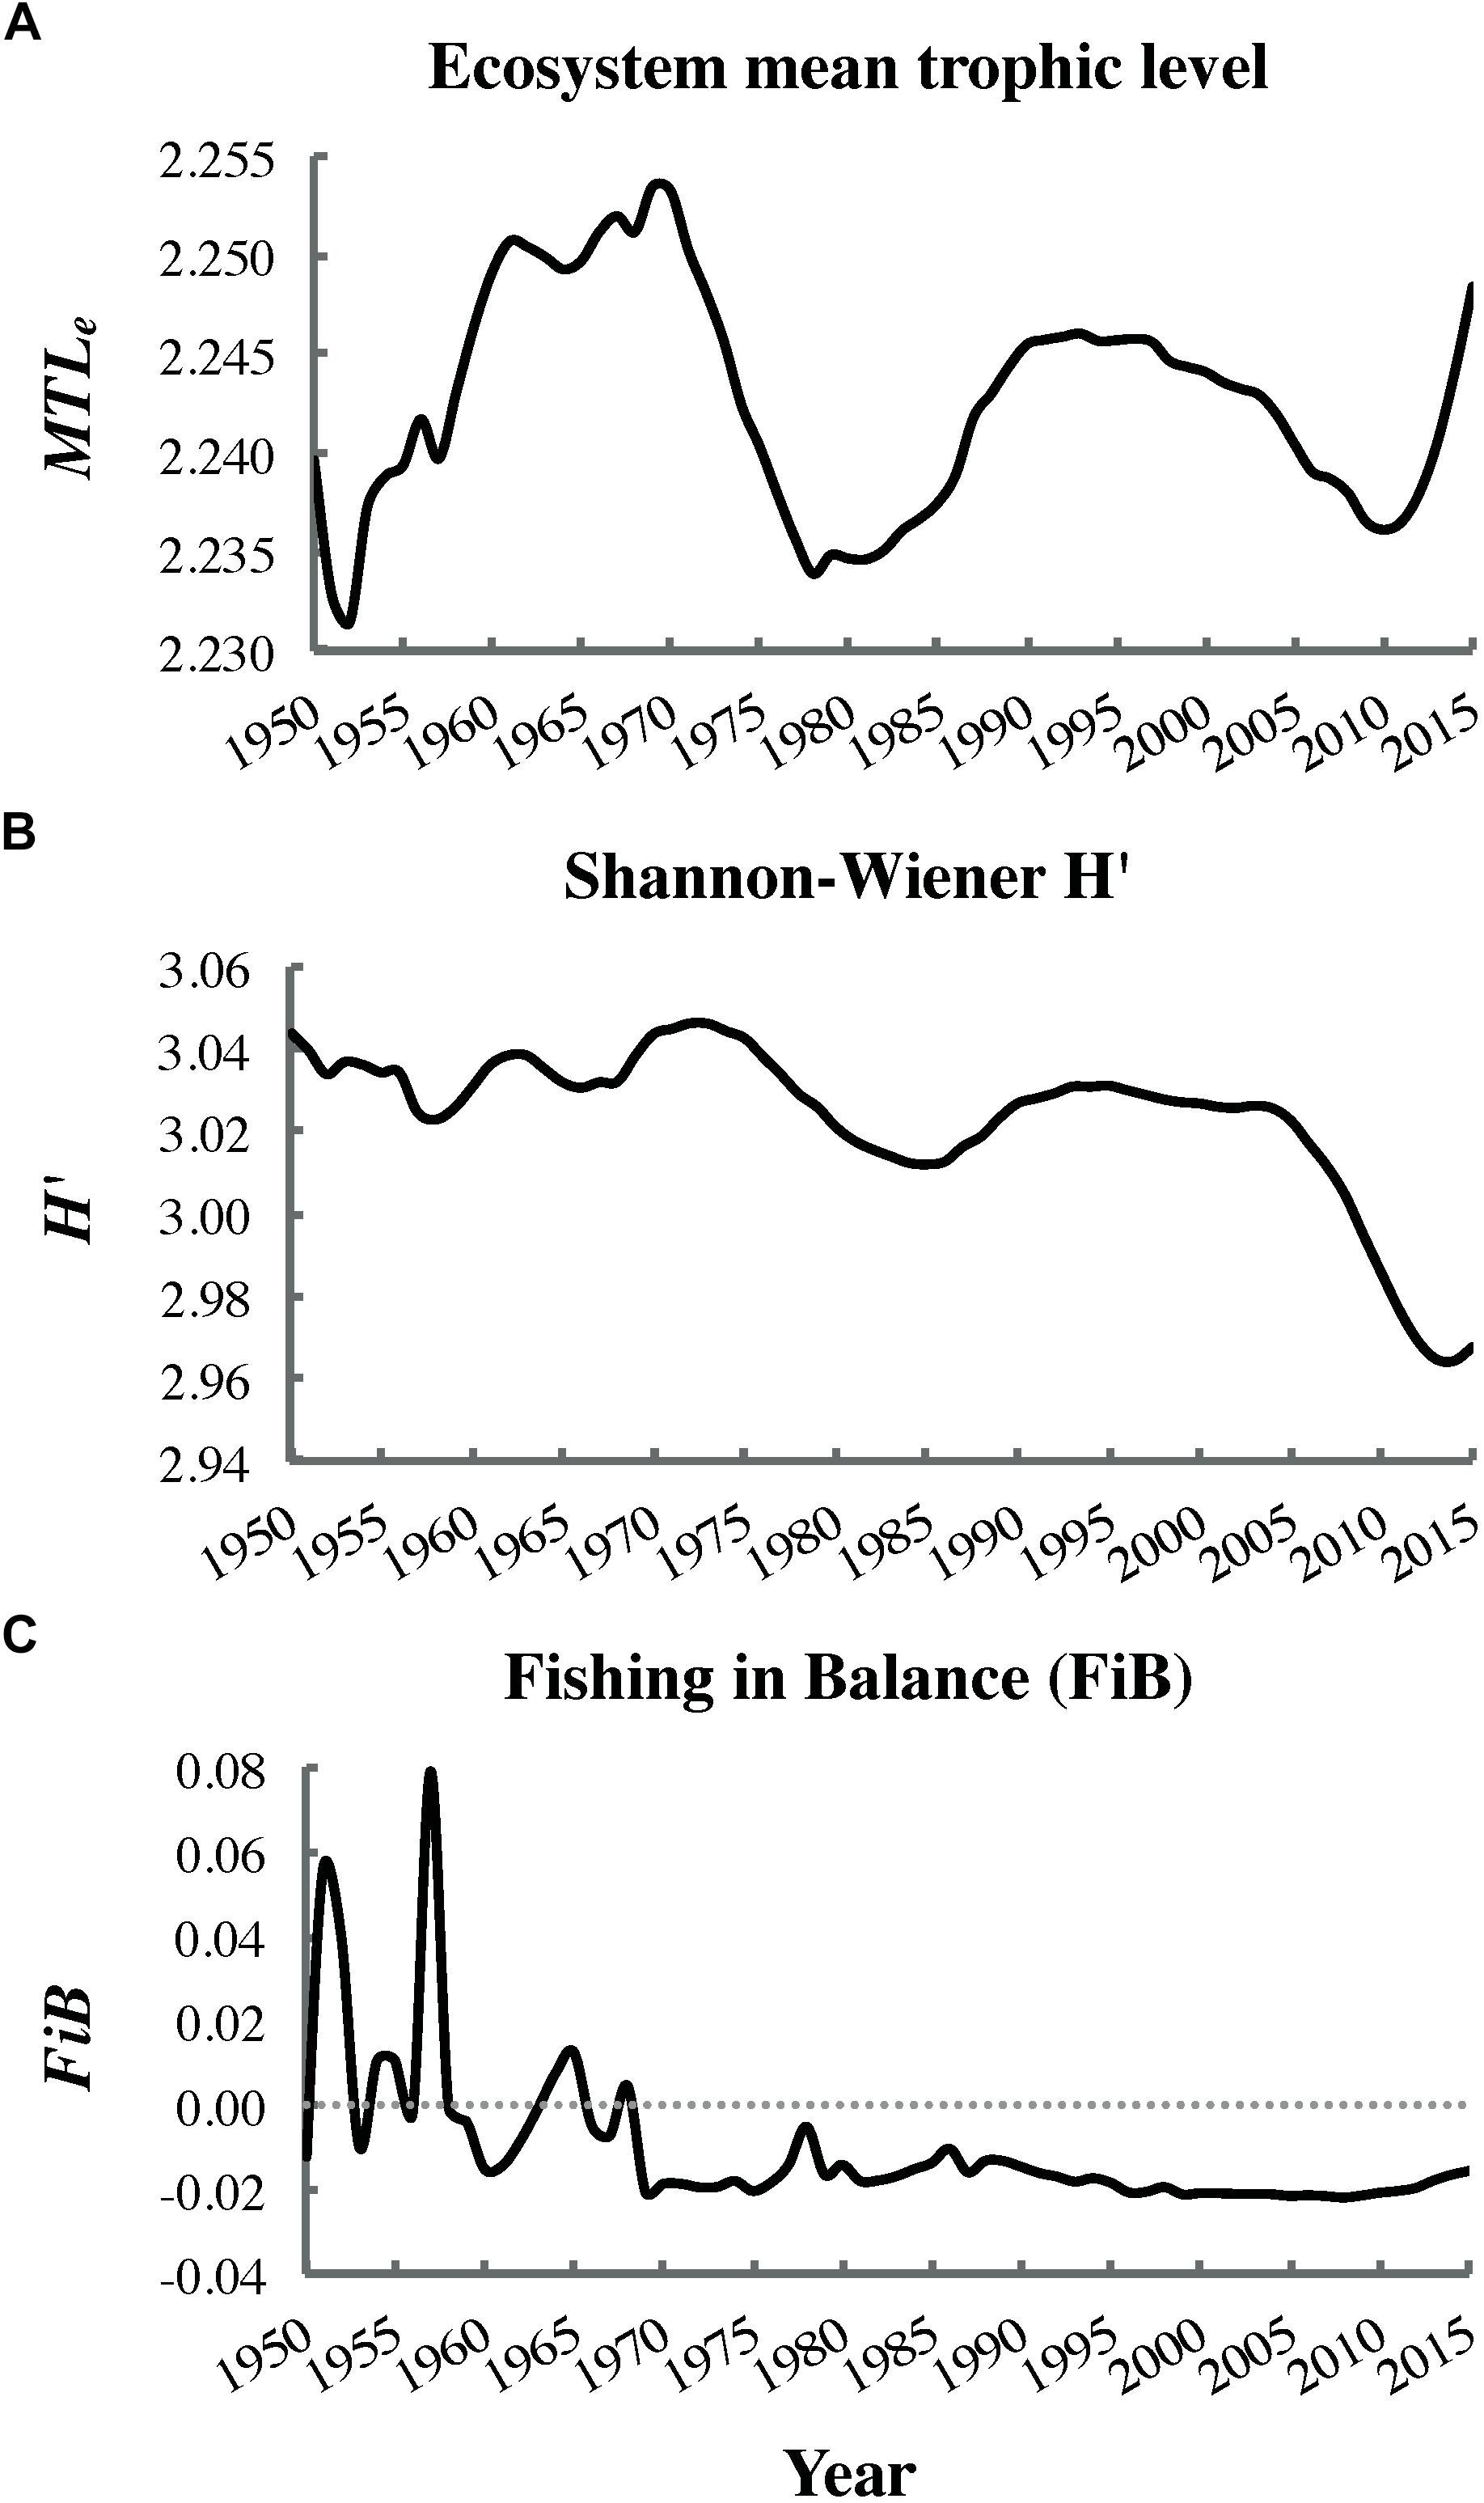
Figure 8. Trends in the (A) ecosystem mean trophic level MTLe (non-significant), (B) Shannon–Wiener biodiversity H′ (significant), and (C) fishing in balance index FiB (significant) from dynamic ecosystem simulation outputs (most parsimonious fit).
The statistical analysis (Table 5) of trends (Figure 2) in copepod assemblage biomass anomalies (Galbraith and Young, 2017) and herring natural mortalities (DFO, 2016) yielded the expected negative correlation between subarctic oceanic copepod biomass and herring M for the CC and WCVI stocks. However, while this correlation was significant at α = 0.05, it became marginally non-significant for CC with the Bonferroni correction for multiple comparisons. Similar correlations for HG and HG 2W M were already marginally non-significant at α = 0.05. Also as expected, southern shelf copepod biomass exhibited a positive correlation with HG M (α = 0.05). However, this correlation too became marginally non-significant under the Bonferroni correction. More surprisingly, boreal shelf copepod biomass showed positive correlations with M (PRD, CC, and WCVI) that remained significant under the Bonferroni correction.
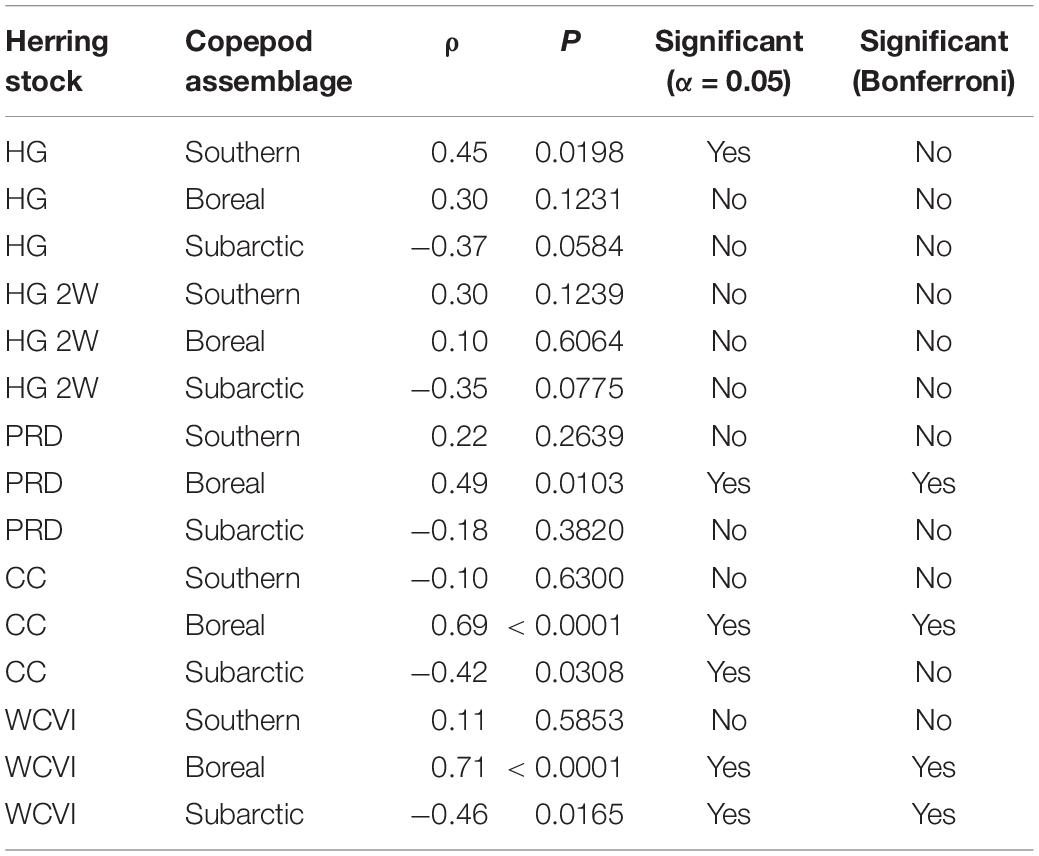
Table 5. Spearman rank correlations between natural mortalities for five British Columbia herring stocks (Haida Gwaii, Haida Gwaii 2 West, Prince Rupert District, Central Coast, and West Coast of Vancouver Island) and abundance anomalies for three copepod assemblages (southern shelf, boreal shelf, and subarctic oceanic) off northwestern Vancouver Island (1990–2015).
Discussion
Static Ecosystem Snapshots
The size spectrum slope of approximately −0.20 seen across all models (Figure 3) differed subtly but significantly from the expected value of zero predominant in almost all ecosystem categories (Blanchard et al., 2017). However, the slope observed in this study was almost identical to that detected in the North Sea by Jennings and Mackinson (2003), although the latter only sampled size classes between zooplankton and medium-sized fish. These deviations from the expected slope of zero may have derived from predator–prey mass ratios increasing with individual predator mass (e.g., baleen whales versus zooplankton) or from underestimated abundance of the highest size classes (i.e., whales and sharks). The lack of significant differences in size spectrum slope among models supported the hypothesis that biomass distributions across size classes were broadly similar in all three ecosystem states (1900, 1950, and current). It also indicated that the deviations from the expected spectrum slope of zero observed in all models are unlikely to stem from heavier exploitation of large size classes, as such exploitation only began in earnest after 1900 with industrial whaling (Webb, 1988) and pinniped hunting (Olesiuk, 2010, 2018). In the late 19th century, at least several large fish groups (e.g., halibut, salmon, and dogfish) had also yet to be heavily exploited in the study area (Chittenden, 1884). Furthermore, the biomasses of several groups in small to mid-size classes, from phytoplankton to small fish and squid, had to be increased in the 1900 model to satisfy the direct and indirect trophic demands of large, unexploited whale populations. This steepened the biomass size spectrum slope, and suggested the possibility of higher ecosystem productivity before commercial whaling than indicated by the NBC models (Ainsworth et al., 2008).
The modest reductions in MTLe and MTLc across the three ecosystem states (Table 3) also did not suggest drastic shifts in trophic structure since 1900. The reductions in these two indices likely resulted from depletion of upper-level predators (i.e., marine mammals and large groundfish) during the 20th century. The unexpected peak in H′ observed for 1950 may have reflected declines in several mid-trophic level groups (e.g., small squid, forage fish, and herring) after 1900. High biomasses and P/B or Z-values for such mid-trophic groups, as well as zooplankton and phytoplankton were necessary, as mentioned above, to satisfy direct and indirect demands of predation by unexploited whale populations in 1900. Depletion of whales (Surma and Pitcher, 2015), pinnipeds (Olesiuk, 2010, 2018), and large predatory fish, and the resulting relaxation of their trophic demands, apparently underlay the strong declines in Btot and TST between 1900 and 1950. The increase in Ytot between 1900 and 1950 presumably reflected greater fishing power due to the advent of internal combustion engines and improved (e.g., powered) gear, while the decrease in Ytot after 1950 resulted mainly from the closure of the massive herring reduction fishery in 1963 following the depletion of all local herring stocks (Hourston, 1978).
The distribution of herring consumption among predators and across ecosystem states (Figure 4) resulted from population trends in humpback and fin whales (abundant in 1900, depleted by 1950, currently recovering; Surma and Pitcher, 2015) and pinnipeds (depleted in 1900 and 1950, currently abundant; Olesiuk, 2010, 2018). Schweigert et al. (2010) observed a pattern in groundfish versus marine mammal consumption of herring off western Vancouver Island similar to that detected in the present study. However, neither the composition of total herring consumption by predators (Figure 4) nor MTIs (Figure 6B) truly supported the hypothesis of top-down impacts of Pacific cod on herring (Walters et al., 1987) or the synchronous changes in consumption of herring by all predators suggested by Oken et al. (2018) based on an older Hecate Strait EwE model.
The notable role of herring in 1950 predator diets relative to the 1900 and current models (Figure 5A) resulted from a higher ratio of herring to other prey biomass in 1950, yielded by the historical diet calculation algorithm described in Section C of Supplementary File S1 (Buszowski and Steenbeek, 2017). While herring comprised 15–25% of several marine mammal, seabird, and large fish diets in 1950, no evidence of predator specialization on herring was apparent (Figure 5B). However, this may have been an artifact of functional group aggregation, with group diet compositions, e.g., biomass-weighted averages of constituent species diets for seabirds, obscuring species-specific dietary requirements.
The MTIs of herring (Figure 6A) and on herring (Figure 6B), combined with the distribution among predators of the total consumption of herring (Figure 4) and the proportions of herring in predator diets (Figure 5), indicated that interactions between herring and its predators are frequently asymmetric (i.e., more strongly impact either predator or prey). Inshore rockfish are an exception to this rule, featuring nearly equal MTI of herring (bottom-up, Figure 6A) and on herring (top-down, Figure 6B). Similarly, two herring prey groups (macrozooplankton and amphipods) exerted large positive MTI on herring (Figure 6B) but experienced only slightly lower negative MTI (Figure 6A). The intricate combination of top-down and bottom-up interactions apparently connecting herring with its predators and prey (Figure 6) suggested that the “wasp-waist” trophic control mechanism proposed for many forage fish, in which the latter impact predators and prey through bottom-up and top-down control, respectively (Cury et al., 2000), most likely underestimates the complexity of herring trophodynamics in the modeled food web. Herring also shared mutually negative MTI with forage fish, indicating competition, while transient orcas indirectly benefited herring through cascading effects of predation on smaller marine mammals (i.e., small odontocetes and pinnipeds). Phytoplankton exerted a strong positive impact on herring, suggesting indirect bottom-up control via zooplankton. These static Ecopath results assisted in framing expectations for simulations of herring trophodynamics in Ecosim.
Dynamic Ecosystem Trends
The ecosystem simulations revealed that while fishing mortality, trophic interactions (governed by vulnerability values), and primary productivity were all necessary to emulate ecosystem dynamics since 1950 and fit the model to time series, none of these factors alone was sufficient (Table 4). These findings accorded with those derived from several previous EwE models of Northeast Pacific ecosystems, including the Gulf of Alaska (Gaichas et al., 2011), southeast Alaska, and the Aleutian Islands (Heymans et al., 2005). However, as in the 1950 NBC model (Ainsworth et al., 2008), fishing mortality trends exerted an especially strong influence on the most parsimonious fit to time series (and hence on ecosystem dynamics), while the effect of primary productivity was much weaker (Table 4). This pattern has been observed in a diverse, global array of modeled marine ecosystems in both temperate and tropical waters, although its opposite occurred in several ecosystems (Mackinson et al., 2009). Furthermore, a spectrum stretches from fully fishing-dominated to climate-dominated marine ecosystems (Gaichas et al., 2011), and model fits improved by primary productivity (though not necessarily dominated by it) are even more ubiquitous than those influenced by fishing mortality (Mackinson et al., 2009). In addition, the reduction in AICc due to the reconstructed primary productivity trend in the present 1950 model (5%) was over twice that (2%) in its NBC counterpart.
The primary production anomaly (PPA) reconstructed from all available time series was not particularly similar to the input phytoplankton biomass series, as shown in the last panel of Supplementary Figure S1.3 in Supplementary File S1. This contrast was also observed in an EwE model of the English Channel ecosystem (Araújo et al., 2006). However, the increasing trend in the PPA after 2000 agreed with satellite measurements of surface chlorophyll a density in the study area (O’Brien et al., 2017). Intriguingly, correlations between the PPA and all three physical oceanographic indices (i.e., local SST, PDO, and NOI) in the present 1950 model showed reversed signs relative to those observed in the corresponding NBC model (Ainsworth et al., 2008). The significant positive correlation between the PPA and PDO in the present model agreed with that detected in a southeast Alaska ecosystem model fitted to time series from 1963 to 2001 (Heymans et al., 2005), although Guénette (2005) obtained no such correlation for a similar interval. The correlations found in the present study and by Heymans et al. (2005) may be explained by the “optimal stability window” hypothesis (Gargett, 1997), according to which positive PDO values increase water column stability, a moderate level of which supports optimal primary productivity in the Northeast Pacific. The dome-shaped relationship between water column stability and primary productivity (Gargett, 1997) may explain the weakness of the observed correlation between PPA and PDO. However, this correlation remains consistent with the “optimal stability window” hypothesis, since large positive monthly PDO values (presumably indicating periods of strong water column stability) are quite rare (Mantua et al., 1997). If “optimal stability windows” correspond to moderately positive PDO values, the weak positive correlation between PPA and PDO observed in this study is as could be expected. Local and regional SST was positively correlated with the PPA and PDO (Mantua et al., 1997), respectively, although the correlation between the local SST and PPA lost its significance under the Bonferroni correction for multiple comparisons. Nevertheless, the observed correlations between the PPA, PDO, and SST supported the role of SST as a driver of fisheries production in the Gulf of Alaska detected by Mcowen et al. (2014).
However, while the PPA assisted the model in emulating overall ecosystem dynamics since 1950, it also yielded unobserved and apparently spurious recoveries of several fish functional groups (all herring, coho salmon O. kisutch, chinook salmon, Pacific cod, lingcod, and sablefish Anoplopoma fimbria), adversely affecting their fits to time series. These were improved, along with AICc (Table 4), by forcing functions for non-predation natural mortality (Supplementary Figure S1.6 in Supplementary File S1). This finding suggested that production of several local fish stocks might have become at least partly decoupled from local primary productivity since 2000.
Climate-associated fluctuations in the relative biomass of three copepod assemblages (Figure 2B) differing in energy content (subarctic oceanic, boreal shelf, and southern shelf) suggested a potential mechanism for such decoupling. Results of the correlation analysis described above (Table 5) indicated that while natural mortality trends in several herring stocks (Figure 2A) might be associated with shifts in the relative biomasses of copepod assemblages (and thus with average copepod energy content), these associations remain to be conclusively demonstrated. Low sample size (n = 26) due to the short time series available (1990–2015) most likely reduced the statistical power of the correlation analyses. In addition, many extraneous factors, including herring stock assessment model structure and smoothing of natural mortality time series derived from these models (DFO, 2016), could have confounded these putative correlations. Possible mesoscale variability in copepod assemblage biomass anomalies between the waters northwest of Vancouver Island (where the copepod data were obtained) and the study area (where the modeled herring stocks feed) might also have affected correlations for these stocks. This inference was supported by the expected negative correlation between herring natural mortality and the subarctic oceanic copepod biomass anomaly showing unambiguous significance only for the WCVI stock, whose feeding range overlaps the copepod sampling area.
It is, however, noteworthy that hypothesized correlations between southern shelf and subarctic oceanic copepod biomass anomalies, respectively, and herring natural mortalities were clearest for the two modeled herring stocks most strongly depressed in recent decades (i.e., HG and CC). While the significantly positive correlations between the boreal copepod biomass anomaly and many herring stock (PRD, CC, and WCVI) natural mortalities were somewhat surprising, several boreal shelf copepod species were rare in, or absent from, recent local herring diets (Pakhomov et al., 2017). These positive correlations could also derive from trophic effects not captured in the present ecosystem models (e.g., elevated boreal copepod biomass increasing the productivity of herring competitors or predators).
The incomplete dataset on copepod assemblage biomass anomalies in Hecate Strait showed similar interannual and decadal patterns as its full counterpart for northwestern Vancouver Island (Galbraith and Young, 2017), as did abundance data for large versus small copepods from the central Gulf of Alaska (Batten et al., 2018). This indicated that shared dynamics likely affect copepod community composition (and thus average energy content) in much of the Northeast Pacific. This inference was supported by significantly positive correlations linking both abundance and northward extent of southern copepods to the PDO (Batten and Walne, 2011). These, in turn, helped explain the apparent synchrony between high herring natural mortalities (Figure 2A) and positive PDO values between late 2002 and late 2007. Copepod biomass anomalies were also associated with Northeast Pacific coho salmon marine survival and growth rates, as well as sablefish recruitment (Mackas et al., 2007). Thus, these anomalies could explain the discrepancies between observed and expected Ecosim biomass trends for coho and sablefish, which were largely eliminated by forcing non-predation natural mortality (Supplementary Figure S1.6 in Supplementary File S1). For coho and chinook salmon, competition with pink salmon (O. gorbuscha) might also partially explain the observed lack of recovery (Ruggerone and Irvine, 2018).
The fact that the net contribution of the PPA to the most parsimonious fit to time series exceeded that of the trophic control (vulnerability) parameters (Table 4) indicated a substantial role for bottom-up forcing in Haida Gwaii ecosystem dynamics since 1950. This inference was echoed by the low vulnerability values obtained for 12 functional groups, suggesting bottom-up control of interactions between these groups and their prey (Christensen and Walters, 2004; Christensen et al., 2008). These findings agreed with the overall bottom-up control of Northeast Pacific fish production detected by Ware and Thomson (2005). However, the high vulnerability values obtained for 16 functional groups (including all adult herring and most large cetaceans, e.g., humpback whales) indicated top-down control. These results largely accorded with MTIs of and on herring observed in the static 1950 model (Figure 6). They also supported the hypothesized top-down control of prey populations by whales in the North Pacific (Croll et al., 2006), particularly humpback whales preying on herring in the Gulf of Alaska (Heintz et al., 2010; Surma and Pitcher, 2015; Moran et al., 2018; Straley et al., 2018).
The significant decrease in Shannon–Wiener H′ biodiversity (Figure 8B) over the fitting interval (1950–2015) likely reflected increased evenness in biomass distribution among functional groups. This, in turn, resulted from depletion of several fish stocks abundant in 1950, as well as partial recovery of initially depleted whale populations (Supplementary Figures S1.2, S1.1 in Supplementary File S1, respectively). The significant decline in the FiB to consistently negative values since 1970 (Figure 8C) indicated that “fishing down the food web” had occurred in the study area. This finding agreed with the conclusion of Pauly et al. (2001) based on MTLc trends for Canadian Pacific fisheries catches but conflicted with that of Fu et al. (2012), which relied on an older EwE model of the Hecate Strait ecosystem. However, the decrease in FiB observed in the present study was not accompanied by a significant decline in MTLe (Figure 8A), likely due to simultaneous marine mammal (i.e., whale and pinniped) recoveries and herring declines (Figure 7). The MTLe trend detected in the present analysis was relatively similar to that observed by Fu et al. (2012), albeit shifted downward by approximately one trophic level.
Fits to biomass time series obtained in this study for the major herring stocks (HG, PRD, and CC; Figure 7) and Pacific cod (Supplementary Figure S1.2 in Supplementary File S1) were similar to those generated in an OSMOSE model of the NBC food web (Fu et al., 2017). This suggested the potential for multimodel inference, perhaps within a formal framework such as that developed by Spence et al. (2018). It was also noteworthy that herring fits to time series were improved by using fishing mortality drivers and catch time series based on ratios of reconstructed to reported catch from the Sea Around Us project database (Ainsworth, 2018). This suggested that true catches for HG, HG 2W, PRD, and CC herring in the 1950s and 1960s likely exceeded values utilized in stock assessments.
Caveats and Limitations
It must be admitted here that while every attempt was made to employ the most complete and reliable data available and follow best practice in the model parameterization and fitting processes, the latter were necessarily burdened with many forms of error. Firstly, the increased functional group resolution of the present models could have raised total parameter uncertainty. However, the static and dynamic model parameter values were constrained within plausible limits by the pre-balancing tests designed by Link (2010) and by fitting to an expanded and extended set of time series, respectively, both of which strongly mitigated the potential increase in total uncertainty. The pre-balancing checks confirmed that static parameter values in the present models do not depart strongly from those expected based on empirically determined cross-ecosystem patterns. This suggested that parameter uncertainty lies within acceptable limits. In addition, the impacts of static parameter uncertainty were limited by the fact that in dynamic ecosystem simulations, these values served merely as starting points from which model runs were initialized. Furthermore, the augmented functional group resolution of the present models reduced the structural uncertainty generated by aggregating multiple ecologically diverse species (e.g., seabirds) within a single group with common parameter values. Indeed, even in the present models, the multispecies composition of numerous functional groups could have masked specialist predator responses to biomass dynamics of individual prey species (e.g., herring), ultimately affecting the performance of dynamic ecosystem simulations and projections of overall ecosystem behavior (Pinnegar et al., 2005). In addition, the present models still feature rather simplified representations of lower trophic levels, which could have masked the complex impacts of bottom-up forcing, including oceanographic regime shifts (Mantua et al., 1997; Schwing et al., 2002), on ecosystem dynamics.
Secondly, the absence of explicit age structure and stock-recruitment responses for most piscivorous fish in the present models could have obscured the effects of strong trophic ontogeny in such predators on their interactions with forage fish (Essington et al., 2015; Walters et al., 2016; Hilborn et al., 2017). Thirdly, the non-linear search algorithm fitting vulnerabilities and primary production anomalies to time series can generate satisfactory fits to data with model outputs not representative of the actual ecosystem, since multiple output configurations can yield similarly parsimonious fits (Ainsworth et al., 2008). The search algorithm may also become trapped in local minima well above the true minimum AICc. Fourthly, structural and parameter error in assessment models affect their outputs, which provide static parameter values as well as biomass and mortality time series.
Fifthly, fear-mediated, sublethal effects (Frid et al., 2008; Wirsing et al., 2008) of top predator (e.g., Pacific sleeper shark, Somniosus pacificus) presence on mesopredator (e.g., harbor seal, Phoca vitulina) foraging behavior, in which predator avoidance by mesopredators yields cascading effects on prey (e.g., Pacific herring), are absent from the present models, although their ecosystem impacts could be substantial. Sixthly, mass-balanced model outputs could noticeably underestimate the importance of energy-rich forage fish (e.g., herring and eulachon) to many predators relative to energy-balanced models (Surma et al., 2018). Finally, non-trophic factors not represented in these food web models (e.g., chemical and microplastic pollution, parasitism and infectious disease, ocean warming, acidification, and hypoxia) may also noticeably affect food web function, necessitating a cautious evaluation of the importance of fishing mortality and primary productivity as drivers of ecosystem dynamics (Mackinson et al., 2009). Nevertheless, pre-balancing tests and fitting the 1950 model to time series using the non-linear search algorithm greatly reduced the likelihood of erroneous representations of ecosystem dynamics, explanations of past trends, and projected responses to future perturbations.
Conclusion
The present models provide an improved representation of the ecosystem states existing off Haida Gwaii and in the southeastern Gulf of Alaska in 1900, 1950, and currently. While the Ecopath model structure focuses on Pacific herring, its predators, and prey, it also features increased functional group resolution relative to its predecessors across all trophic levels and size classes from zooplankton to whales. This improved resolution facilitated the investigation of interactions between herring and its predators and prey in greater detail than was possible previously, though both static ecosystem analyses (e.g., MTIs) and dynamic ecosystem simulations examining the ecological role of herring since 1950. The results of this investigation suggested that herring likely plays an important role as a mid-trophic level node (forage fish) in the Haida Gwaii food web by participating in a complex network of top-down and bottom-up interactions with numerous predators and prey as well as competing with other small planktivorous fish.
Comparative analysis of the three present models indicated that ecosystem structure (as reflected in biomass size spectrum slope) did not undergo radical change since 1900, despite heavy exploitation of many marine mammal and fish groups. The 1950 model, fitted to time series following best practices, revealed that fishing mortality, trophic interactions, and primary productivity correlated with oceanographic indices are all required to explain historical dynamics in the Haida Gwaii ecosystem, generating a combination of top-down and bottom-up trophic control. It also indicated that the production of some herring, salmon, and groundfish stocks may have recently been partially decoupled from primary productivity, perhaps due to oceanographically driven changes in copepod guild composition. Dynamic ecosystem simulations further showed that a biodiversity decline and “fishing down the food web” occurred off Haida Gwaii between 1950 and 2015. Finally, the fitted 1950 model provides a robust platform for future dynamic ecosystem simulations and management strategy evaluation scenarios, particularly those designed to investigate the ecosystem impacts of herring fisheries.
Data Availability Statement
All datasets generated for this study are included in the manuscript/Supplementary Files.
Author Contributions
SS was responsible for parameterization of most new functional groups, all historical models, biomass spectra, model fitting, statistical analyses, and writing of the manuscript. VC designed the model fitting procedure and suggested introducing the whale biomass accumulation rates. RK ported the latest NBC model to EwE 6, as well as parameterizing the hake group and herring stock and age structure in the current model (in the historical models this was done by SS). CA developed the original NBC models and prepared some of the time series used in model fitting. TP supervised the work of SS, RK, and CA, and oversaw the general direction of model development. All authors edited the manuscript.
Funding
SS received a doctoral scholarship (PGS-D) partially supporting this work from the Natural Science and Engineering Research Council of Canada (grant number 6564). TP received a Strategic Grant partially supporting this work from the Natural Science and Engineering Research Council of Canada (grant number 447247). The funders had no role in study design, data collection and analysis, decision to publish, or preparation of the manuscript.
Conflict of Interest
The authors declare that the research was conducted in the absence of any commercial or financial relationships that could be construed as a potential conflict of interest.
Acknowledgments
We thank Evgeny A. Pakhomov (Director, Institute for the Oceans and Fisheries, UBC and Professor, Department of Earth, Ocean, and Atmospheric Sciences, UBC) and Andrew Trites (Director, Marine Mammal Research Unit, Institute for the Oceans and Fisheries, UBC) for contributing novel herring diet data and expert opinion on local whale abundances, respectively; and colleagues from the Pacific Biological Station (Fisheries and Oceans Canada) for assistance in obtaining necessary data. We specifically thank Jaclyn Cleary, R. Ian Perry, and John K. B. Ford for providing herring stock assessment model outputs, zooplankton biomass anomaly values, and transient orca abundance data, respectively. We also thank Jeroen Steenbeek and Joe Buszowski (EwE Research and Development Consortium) for their repeated technical assistance, including preparation of custom EwE functionality; Dr. Divya Varkey (Fisheries and Oceans Canada) and Dr. Mimi Lam (Centre for the Study of the Sciences and the Humanities, University of Bergen) for supporting model development; Dr. Wade Smith (Institute for the Oceans and Fisheries, UBC), Jeff Scott (M.Sc., Institute for the Oceans and Fisheries, UBC), Sahir Advani (Ph.D. candidate, Institute for the Oceans and Fisheries, UBC), and Nicolás Talloni-Alvarez (Ph.D. candidate, Institute for the Oceans and Fisheries, UBC) for their general encouragement and support; the Haida people and the non-Haida inhabitants of Haida Gwaii for their interest in this research; and specifically thank Russ Jones (Nang Jingwas), hereditary chief of the Naa Saagaas XaaydaGaay clan and retired head of the Haida Oceans Technical Team. Finally, we acknowledge the prior presentation of this research in the Ph.D. dissertation of the corresponding author (Surma, 2019).
Supplementary Material
The Supplementary Material for this article can be found online at: https://www.frontiersin.org/articles/10.3389/fmars.2019.00625/full#supplementary-material
References
Ainsworth, C. (2018). British Columbia marine fisheries catch reconstruction, 1873 to 2011. BC Stud. 188, 81–89. doi: 10.14288/bcs.v0i188.186115
Ainsworth, C. H., Pitcher, T. J., Heymans, J. J., and Vasconcellos, M. (2008). Reconstructing historical marine ecosystems using food web models: Northern British Columbia from Pre-European contact to present. Ecol. Modell. 216, 354–368. doi: 10.1016/j.ecolmodel.2008.05.005
Altman, M. (2002). A review of JMP 4.03 with special attention to its numerical accuracy. Am. Stat. 56, 72–75. doi: 10.1198/000313002753631402
Araújo, J. N., Mackinson, S., Stanford, R. J., Sims, D. W., Southward, A. J., Hawkins, S. J., et al. (2006). Modelling food web interactions, variation in plankton production, and fisheries in the western English Channel ecosystem. Mar. Ecol. Prog. Ser. 309, 175–187. doi: 10.3354/meps309175
Batten, S. D., Raitsos, D. E., Danielson, S., Hopcroft, R., Coyle, K., and McQuatters-Gollop, A. (2018). Interannual variability in lower trophic levels on the Alaskan Shelf. Deep Sea Res. 2 Top. Stud. Oceanogr. 147, 58–68. doi: 10.1016/j.dsr2.2017.04.023
Batten, S. D., and Walne, A. W. (2011). Variability in northwards extension of warm water copepods in the NE Pacific. J. Plankton Res. 33, 1643–1653. doi: 10.1093/plankt/fbr065
Beattie, A. (2001). A New Model for Evaluating the Optimal Size, Placement and Configuration of Marine Protected Areas. MSc thesis, University of British Columbia, Vancouver, BC.
Bishop, M. A., Watson, J. T., Kuletz, K., and Morgan, T. (2015). Pacific herring (Clupea pallasii) consumption by marine birds during winter in Prince William sound, Alaska. Fish. Oceanogr. 24, 1–13. doi: 10.1111/fog.12073
Blanchard, J. L., Heneghan, R. F., Everett, J. D., Trebilco, R., and Richardson, A. J. (2017). From bacteria to whales: using functional size spectra to model marine ecosystems. Trends Ecol. Evol. 32, 174–186. doi: 10.1016/j.tree.2016.12.003
Brodeur, R. D., Buchanan, J. C., and Emmett, R. L. (2014). Pelagic and demersal fish predators on juvenile and adult forage fishes in the northern California current: spatial and temporal variations. California Cooperat. Ocean. Fish. Invest. Rep. 55, 96–117.
Buszowski, J., and Steenbeek, J. (2017). “Import diets” plugin for Ecopath with Ecosim 6 (custom version): EwE 5 functionality resurrected. Unpublished code.
Chittenden, N. H. (1884). Official Report of the Exploration of the Queen Charlotte Islands for the Government of British Columbia. Victoria, BC: Government of British Columbia.
Christensen, V., and Walters, C. J. (2004). Ecopath with Ecosim: methods, capabilities and limitations. Ecol. Modell. 172, 109–139. doi: 10.1016/j.ecolmodel.2003.09.003
Christensen, V., Walters, C. J., Pauly, D., and Forrest, R. (2008). Ecopath with Ecosim version 6 User Guide. Washington, DC: Lenfest Ocean Futures Project, 235.
Coll, M., Akoglu, E., Arreguín-Sánchez, F., Fulton, E. A., Gascuel, D., Heymans, J. J., et al. (2015). Modelling dynamic ecosystems: venturing beyond boundaries with the Ecopath approach. Rev. Fish Biol. Fish. 25, 413–424. doi: 10.1007/s11160-015-9386-x
Croll, D. A., Kudela, R., and Tershy, B. R. (2006). “Ecosystem impact of the decline of large whales in the North Pacific,” in Whales, Whaling, and Ocean Ecosystems, eds J. A. Estes, D. P. DeMaster, D. F. Doak, T. M. Williams, and R. L. Brownell, Jr. (Berkeley, CA: University of California Press), 202–214.
Cury, P., Bakun, A., Crawford, R. J. M., Jarre, A., Quiñones, R. A., Shannon, L. J., et al. (2000). Small pelagics in upwelling systems: patterns of interaction and structural changes in “wasp- waist” ecosystems. ICES J. Mar. Sci. 57, 603–618. doi: 10.1006/jmsc.2000.0712
DFO, (2016). Stock Assessment and Management Advice for BC Pacific Herring: 2016 Status and 2017 Forecast. Canadian Science Advisory Secretariat Science Response 2016/052. Ottawa, ON: Fisheries and Oceans Canada, 1–56.
Di Lorenzo, E., and Mantua, N. (2016). Multi-year persistence of the 2014/15 North Pacific marine heatwave. Nat. Clim. Change 6, 1042–1047. doi: 10.1038/nclimate3082
Essington, T. E., Baskett, M. L., Sanchirico, J. N., and Walters, C. (2015). A novel model of predator-prey interactions reveals the sensitivity of forage fish: piscivore fishery trade-offs to ecological conditions. ICES J. Mar. Sci. 72, 1349–1358. doi: 10.1093/icesjms/fsu242
Essington, T. E., and Plagányi, É. E. (2013). Pitfalls and guidelines for “recycling” models for ecosystem-based fisheries management: evaluating model suitability for forage fish fisheries. ICES J. Mar. Sci. 71, 118–127. doi: 10.1093/icesjms/fst047
Estes, J. A., and Palmisano, J. F. (1974). Sea Otters: their role in structuring Nearshore communities. Science 185, 1058–1060. doi: 10.1126/science.185.4156.1058
Fox, C. H., Paquet, P. C., and Reimchen, T. E. (2015). Novel species interactions: American black bears respond to Pacific herring spawn. BMC Ecol. 15:14. doi: 10.1186/s12898-015-0045-9
Fox, C. H., Paquet, P. C., and Reimchen, T. E. (2018). Pacific herring spawn events influence nearshore subtidal and intertidal species. Mar. Ecol. Prog. Ser. 595, 157–169. doi: 10.3354/meps12539
Frid, A., Baker, G. G., and Dill, L. M. (2008). Do shark declines create fear-released systems? Oikos 117, 191–201. doi: 10.1111/j.2007.0030-1299.16134.x
Fu, C., Gaichas, S., Link, J., Bundy, A., Boldt, J. L., Cook, A. M., et al. (2012). Relative importance of fisheries, trophodynamic and environmental drivers in a series of marine ecosystems. Mar. Ecol. Prog. Ser. 459, 169–184. doi: 10.3354/meps09805
Fu, C., Olsen, N., Taylor, N., Grüss, A., Batten, S., Liu, H., et al. (2017). Spatial and temporal dynamics of predator-prey species interactions off western Canada. ICES J. Mar. Sci. 74, 2107–2119. doi: 10.1093/icesjms/fsx056
Gaichas, S. K., Aydin, K. Y., and Francis, R. C. (2011). What drives dynamics in the Gulf of Alaska? Integrating hypotheses of species, fishing, and climate relationships using ecosystem modeling. Can. J. Fish. Aquat. Sci. 68, 1553–1578. doi: 10.1139/f2011-080
Galbraith, M., and Young, K. (2017). “Zooplankton along the BC continental margin 2016,” in State of the physical, biological and selected fishery resources of Pacific Canadian marine ecosystems in 2016, ed. P.C. Chandler, S.A. King, and J. Boldt. Can. Tech. Rep. Fish. Aquat. Sci. 3225, 67–75.
Gargett, A. E. (1997). The optimal stability ‘window’: a mechanism underlying decadal fluctuations in North Pacific salmon stocks? Fish. Oceanogr. 6, 109–117. doi: 10.1046/j.1365-2419.1997.00033.x
Gende, S. M., and Sigler, M. F. (2006). Persistence of forage fish ‘hot spots’ and its association with foraging Steller sea lions (Eumetopias jubatus) in southeast Alaska. Deep-Sea Res. 2 Top. Stud. Oceanogr. 53, 432–441. doi: 10.1016/j.dsr2.2006.01.005
Goedegebuure, M., Melbourne-Thomas, J., Corney, S. P., Hindell, M. A., and Constable, A. J. (2017). Beyond big fish: the case for more detailed representations of top predators in marine ecosystem models. Ecol. Modell. 359, 182–192. doi: 10.1016/j.ecolmodel.2017.04.004
Guénette, S. (2005). “Models of Southeast Alaska,” in Food web models and data for studying fisheries and environmental impacts on Eastern Pacific ecosystems, ed. S. Guénette and V. Christensen. UBC Fish. Centre Res. Rep. 13, 106–178. doi: 10.14288/1.0074785
Heintz, R., Moran, J., Vollenweider, J., Straley, J., Boswell, K., and Rice, J. (2010). Humpback whale predation and the case for top-down control of local herring populations in the Gulf of Alaska. Alaska Fish. Sci. Center Q. Rep. 2010, 1–6.
Heise, K. A., Sloan, N. A., Olesiuk, P. F., Bartier, P. M., and Ford, J. K. B. (2003). Living Marine Legacy of Gwaii Haanas. IV: Marine Mammal Baseline to 2003 and Marine Mammal-Related Management Issues Throughout the Haida Gwaii Region, Vol. 38. Gatineau, QC: Parks Canada, 1–150.
Heymans, J. J., Coll, M., Link, J. S., Mackinson, S., Steenbeek, J., Walters, C., et al. (2016). Best practice in Ecopath with Ecosim food-web models for ecosystem-based management. Ecol. Modell. 331, 173–184. doi: 10.1016/j.ecolmodel.2015.12.007
Heymans, J. J., Guénette, S., Christensen, V., and Trites, A. W. (2005). Changes in Gulf of Alaska ecosystems due to ocean climate change and fishing. ICES CM 2005, 1–31.
Hilborn, R., Amoroso, R. O., Bogazzi, E., Jensen, O. P., Parma, A. M., Szuwalski, C., et al. (2017). When does fishing forage species affect their predators? Fish. Res. 191, 211–221. doi: 10.1016/j.fishres.2017.01.008
Hourston, A. S. (1978). The decline and recovery of Canada’s Pacific herring stocks. Fish. Mar. Serv. Tech. Rep. 784, 1–17.
Jennings, S., and Mackinson, S. (2003). Abundance–body mass relationships in size- structured food webs. Ecol. Lett. 6, 971–974. doi: 10.1046/j.1461-0248.2003.00529.x
Link, J. S. (2010). Adding rigor to ecological network models by evaluating a set of pre-balance diagnostics: a plea for PREBAL. Ecol. Modell. 221, 1580–1591. doi: 10.1016/j.ecolmodel.2010.03.012
Mackas, D. L., Batten, S., and Trudel, M. (2007). Effects on zooplankton of a warmer ocean: recent evidence from the Northeast Pacific. Prog. Oceanogr 75, 223–252. doi: 10.1016/j.pocean.2007.08.010
Mackas, D. L., Peterson, W. T., and Zamon, J. E. (2004). Comparisons of interannual biomass anomalies of zooplankton communities along the continental margins of British Columbia and Oregon. Deep-Sea Res. 2 Top. Stud. Oceanogr. 51, 875–896. doi: 10.1016/j.dsr2.2004.05.011
Mackinson, S., Daskalov, G., Heymans, J. J., Neira, S., Arancibia, H., Zetina-Rejón, M., et al. (2009). Which forcing factors fit? Using ecosystem models to investigate the relative influence of fishing and changes in primary productivity on the dynamics of marine ecosystems. Ecol. Modell. 220, 2972–2987. doi: 10.1016/j.ecolmodel.2008.10.021
Mantua, N. J., Hare, S. R., Zhang, Y., Wallace, J. M., and Francis, R. C. (1997). A Pacific interdecadal climate oscillation with impacts on salmon production. Bull. Am. Met. Soc. 78, 1069–1079. doi: 10.1175/1520-04771997078<1069:APICOW>2.0.CO;2
Mcowen, C. J., Cheung, W. W. L., Rykaczewski, R. R., Watson, R. A., and Wood, L. J. (2014). Is fisheries production within Large Marine Ecosystems determined by bottom-up or top-down forcing? Fish. Fish. 16, 623–632. doi: 10.1111/faf.12082
Moran, J. R., Heintz, R. A., Straley, J. R., and Vollenweider, J. J. (2018). Regional variation in the intensity of humpback whale predation on Pacific herring in the Gulf of Alaska. Deep-Sea Res. 2 Top. Stud. Oceanogr. 147, 187–195. doi: 10.1016/j.dsr2.2017.07.010
O’Brien, T. D., Lorenzoni, L., Isensee, K., and Valdés, L. (2017). What are Marine Ecological Time Series telling us about the ocean? A status report. IOC-UNESCO, IOC Technical Series, No.129. Paris: IOC-UNESCO, 1–297.
Oken, K. L., Essington, T. E., and Fu, C. (2018). Variability and stability in predation landscapes: a cross-ecosystem comparison on the potential for predator control in temperate marine ecosystems. Fish Fish. 19, 489–501. doi: 10.1111/faf.12269
Olesiuk, P. F. (2010). An assessment of Population Trends and Abundance of Harbour Seals (Phoca Vitulina) in British Columbia. DFO Fisheries and Oceans Canada Research Document 2009/105. Ottawa, ON: Fisheries and Oceans Canada, 1–157.
Olesiuk, P. F. (2018). Recent Trends in Abundance of Steller Sea Lions (Eumetopias Jubatus) in British Columbia. DFO Fisheries and Oceans Canada Research Document 2018/006. Ottawa, ON: Fisheries and Oceans Canada, 1–67.
Osgood, G. J., Kennedy, L. A., Holden, J. J., Hertz, E., McKinnell, S., and Juanes, F. (2016). Historical diets of forage fish and Juvenile Pacific Salmon in the strait of Georgia, 1966–1968. Mar. Coast. Fish. 8, 580–594. doi: 10.1080/19425120.2016.1223231
Pakhomov, E. A., Hunt, B. P. V., Trudel, M., Pitcher, T., Sergeenko, N., Fladmark, V., et al. (2017). “Feeding dynamics of Pacific herring (Clupea pallasi) in the northeastern Pacific coast of Canada,” in Proceedings of the ICES-PICES International Symposium on Drivers of Dynamics of Small Pelagic Fish Resources: Book of Abstracts, eds J. Alheit, and Y. Oozeki, (Sidney, BC: PICES Secretariat), 109.
Pauly, D., Christensen, V., Dalsgaard, J., Froese, R., and Torres, F. Jr. (1998). Fishing down marine food webs. Science 279, 860–863. doi: 10.1126/science.279.5352.860
Pauly, D., Christensen, V., and Walters, C. (2000). Ecopath, Ecosim, and Ecospace as tools for evaluating ecosystem impact of fisheries. ICES J. Mar. Sci. 57, 697–706. doi: 10.1006/jmsc.2000.0726
Pauly, D., Palomares, M. L., Froese, R., Sa-a, P., Vakily, M., Preikshot, D., et al. (2001). Fishing down Canadian aquatic food webs. Can. J. Fish. Aquat. Sci. 58, 51–62. doi: 10.1139/f00-193
Pikitch, E., Boersma, P. D., Boyd, I. L., Conover, D. O., Cury, P., Essington, T. et al. (2012). Little Fish, Big Impact: Managing a Crucial Link in Ocean Food Webs. Washington, DC: Lenfest Ocean Program, 108.
Pinnegar, J. K., Blanchard, J. L., Mackinson, S., Scott, R. D., and Duplisea, D. E. (2005). Aggregation and removal of weak-links in food-web models: system stability and recovery from disturbance. Ecol. Modell. 184, 229–248. doi: 10.1016/j.ecolmodel.2004.09.003
Ruggerone, G. T., and Irvine, J. R. (2018). Numbers and biomass of natural- and hatchery- origin pink salmon, chum salmon, and sockeye salmon in the North Pacific ocean, 1925–2015. Mar. Coast. Fish. 10, 152–168. doi: 10.1002/mcf2.10023
Schrimpf, M. B., Parrish, J. K., and Pearson, S. F. (2012). Trade-offs in prey quality and quantity revealed through the behavioral compensation of breeding seabirds. Mar. Ecol. Prog. Ser. 460, 247–259. doi: 10.3354/meps09750
Schweigert, J. F., Boldt, J. L., Flostrand, L., and Cleary, J. S. (2010). A review of factors limiting recovery of Pacific herring stocks in Canada. ICES J. Mar. Sci. 67, 1903–1913. doi: 10.1093/icesjms/fsq134
Schwing, F. B., Murphree, T., and Green, P. M. (2002). The Northern Oscillation Index (NOI): a new climate index for the northeast Pacific. Prog. Oceanogr. 53, 115–139. doi: 10.1016/S0079-6611(02)00027-7
Soulé, M. E., Estes, J. A., Berger, J., and Del Rio, C. M. (2003). Ecological effectiveness: conservation goals for interactive species. Conserv. Biol. 17, 1238–1250. doi: 10.1046/j.1523-1739.2003.01599.x
Spence, M. A., Blanchard, J. L., Rossberg, A. G., Heath, M. R., Heymans, J. J., Mackinson, S., et al. (2018). A general framework for combining ecosystem models. Fish Fish. 19, 1–12. doi: 10.1111/faf.12310
Straley, J. M., Moran, J. R., Boswell, K. M., Vollenweider, J. J., Heintz, R. A., Quinn, T. J. II, et al. (2018). Seasonal presence and potential influence of humpback whales on wintering Pacific herring populations in the Gulf of Alaska. Deep-Sea Res. 2 Top. Stud. Oceanogr. 147, 173–186. doi: 10.1016/j.dsr2.2017.08.008
Surma, S. (2019). Pacific herring (Clupea pallasii) trophodynamics and fisheries in the northeast Pacific Ocean. Ph.D. thesis. Vancouver, BC: University of British Columbia, doi: 10.13140/RG.2.2.27744.94720/6
Surma, S., Pakhomov, E. A., and Pitcher, T. J. (2018). Energy-based ecosystem modelling illuminates the ecological role of Northeast Pacific herring. Mar. Ecol. Prog. Ser. 588, 147–161. doi: 10.3354/meps12430
Surma, S., and Pitcher, T. J. (2015). Predicting the effects of whale population recovery on Northeast Pacific food webs and fisheries: an ecosystem modelling approach. Fish. Oceanogr. 24, 291–305. doi: 10.1111/fog.12109
Vasconcellos, M., and Pitcher, T. (2002). “Historic reference points for models of past ecosystems in northern British Columbia,” in Information Supporting Past and Present Ecosystem Models of Northern British Columbia and the Newfoundland Shelf, Vol. 10, eds T. Pitcher, M. Vasconcellos, S. Heymans, C. Brignall, and N. Haggan, (Vancouver, BC: University of British Columbia), 60–67. doi: 10.14288/1.0348150
Walters, C., Christensen, V., Fulton, B., Smith, A. D. M., and Hilborn, R. (2016). Predictions from simple predator-prey theory about impacts of harvesting forage fishes. Ecol. Modell. 337, 272–280. doi: 10.1016/j.ecolmodel.2016.07.014
Walters, C. J., Stocker, M., Tyler, A. V., and Westrheim, S. J. (1987). Interaction between Pacific Cod (Gadus macrocephalus) and Herring (Clupea harengus pallasi) in the Hecate Strait, British Columbia. Can. J. Fish. Aquat. Sci. 43, 830–837. doi: 10.1139/f86-102
Ware, D. M., and Thomson, R. E. (2005). Bottom-Up ecosystem trophic dynamics determine fish production in the Northeast Pacific. Science 308, 1280–1284. doi: 10.1126/science.1109049
Webb, R. L. (1988). On the Northwest: Commercial Whaling in the Pacific Northwest, 1790-1967. Vancouver, BC: University of British Columbia Press.
Willson, M. F. and Womble, J. N. (2006). Vertebrate exploitation of pulsed marine prey: a review and the example of spawning herring. Rev. Fish. Biol. Fish. 16, 183–200. doi: 10.1007/s11160-006-9009-7
Wirsing, A. J., Heithaus, M. R., Frid, A., and Dill, L. M. (2008). Seascapes of fear: evaluating sublethal predator effects experienced and generated by marine mammals. Mar. Mamm. Sci. 24, 1–15. doi: 10.1111/j.1748-7692.2007.00167.x
Keywords: trophodynamics, ecosystem modeling, Ecopath with Ecosim, Haida Gwaii, Gulf of Alaska, Northeast Pacific, Pacific Ocean, Pacific herring
Citation: Surma S, Christensen V, Kumar R, Ainsworth CH and Pitcher TJ (2019) High-Resolution Trophic Models Reveal Structure and Function of a Northeast Pacific Ecosystem. Front. Mar. Sci. 6:625. doi: 10.3389/fmars.2019.00625
Received: 17 May 2019; Accepted: 23 September 2019;
Published: 15 October 2019.
Edited by:
Cosimo Solidoro, National Institute of Oceanography and Experimental Geophysics, ItalyReviewed by:
Ekin Akoglu, Middle East Technical University, TurkeyMauro Sinopoli, Stazione Zoologica Anton Dohrn, Italy
Copyright © 2019 Surma, Christensen, Kumar, Ainsworth and Pitcher. This is an open-access article distributed under the terms of the Creative Commons Attribution License (CC BY). The use, distribution or reproduction in other forums is permitted, provided the original author(s) and the copyright owner(s) are credited and that the original publication in this journal is cited, in accordance with accepted academic practice. No use, distribution or reproduction is permitted which does not comply with these terms.
*Correspondence: Szymon Surma, cy5zdXJtYUBvY2VhbnMudWJjLmNh