 Donna Dimarchopoulou
 Ioannis Keramidas
 Konstantinos Tsagarakis
 Athanassios C. Tsikliras
- 1Laboratory of Ichthyology, Department of Zoology, School of Biology, Aristotle University of Thessaloniki, Thessaloniki, Greece
- 2Institute of Marine Biological Resources and Inland Waters, Hellenic Centre for Marine Research, Athens, Greece
Ecosystem models can be used as fisheries management tools in the context of a holistic approach and view of assessing the status of aquatic ecosystems and proposing plans of action. The Ecopath with Ecosim modeling suite has been widely used to describe exploited marine systems and perform simulations over time. Pagasitikos Gulf is a shallow semi-enclosed gulf in the western coast of the central Aegean Sea that is characterized as semi-protected, with a bottom trawling ban in force since 1966. In this study, an Ecopath model was constructed including 31 functional groups (FGs) of organisms of lower to higher trophic levels, while Ecosim temporal simulations were run for 18 years (2008–2025), including the calibration period (2008–2017). An overall decrease in biomass and catch of the studied marine resources was observed by the end of the simulation period, due to environmental factors as well as fisheries exploitation. To examine the effect of fishing, three different scenarios were investigated, all aiming toward fishing effort reduction by 10, 30, and 50% compared to the initial business-as-usual scenario, applied to both fleets operating in the area (purse seiners and small-scale). All examined scenarios led to higher total biomass compared to the basic Ecosim simulation (the higher the reduction in fishing effort, the higher the increase in biomass), while catches were significantly lower in all cases as a result of less fishing. The most profound biomass increase with reduced fishing effort was observed in other larger pelagics, anchovy, anglerfish, sharks and rays, mackerels, hake and other gadiforms. In conclusion, reducing the exploitation levels of the ecosystem is a key factor that contributes to rebuilding of marine resources.
Introduction
Overexploitation of marine resources in the Mediterranean Sea in general and Greece in particular has long been identified and is well acknowledged, leading to the bad status of exploited fish and invertebrate populations and oftentimes resulting in collapsed stocks and economic loss (Tsikliras et al., 2015; Froese et al., 2018). Traditionally, the methods applied to assess the status and exploitation of marine stocks are single-species taking into account biological parameters and fishing mortality for each stock (Colloca et al., 2013), but failing to provide management insight in the context of the whole ecosystem, including non-target species, on their own (Pikitch et al., 2004). Putting fisheries management decisions into an ecosystem context demands shifting from traditional single-species stock assessments to more complex ecosystem models, which encompass multi-species interactions, environmental effects and human activities, and can therefore test the effect of different fisheries policies on the entire ecosystem, thus qualitatively facilitating management advice (Collie et al., 2016).
Ecopath ecosystem models (EwE: Ecopath with Ecosim1) provide a static, mass-balanced snapshot of the trophic flows and interrelationships, energy fluxes and food web structure of marine ecosystems, i.e., the species of a studied ecosystem and their trophic interactions (Christensen et al., 2005). They are used as a tool to analyze exploited aquatic systems while attempting to take into consideration all trophic levels included, from primary producers and lower invertebrates to top predatory species (Christensen and Walters, 2004). The Ecosim module of EwE is a time-dynamic simulation that models the impact of changes in fishing pressure and the environment on the ecosystem. It can be used to simulate the past (Halouani et al., 2016; Corrales et al., 2017a) or to run future simulations (Coll et al., 2013).
The EwE modeling approach is broadly used around the world, being applied to hundreds of ecosystems and counting more than 433 unique models globally, as listed and gathered in the EcoBase model repository (Colléter et al., 2015). The Mediterranean and Black Sea are among the areas with the highest proportion of studies, accounting for 9% (more than 40 models) of the total published models (Coll and Libralato, 2012; Colléter et al., 2015), which are mainly focused on the western (e.g., Coll et al., 2008, 2009a) and central (e.g., Coll et al., 2007, 2009b) Mediterranean; the eastern part of the basin being underrepresented with six models having been developed in Israel (Corrales et al., 2017b) and in Greece (Ionian Sea: Piroddi et al., 2010, 2011; Moutopoulos et al., 2013b; Piroddi et al., 2016; Aegean Sea: Tsagarakis et al., 2010).
Pagasitikos Gulf is located in the eastern Mediterranean Sea, particularly in the western coast of the central Aegean Sea, Greece (Figure 1). It is notable that Pagasitikos Gulf is characterized as a semi-protected area where fishing with towed gears, i.e., bottom trawling and boat-seining, has been banned since 1966 (Royal Decree 917/1966). The ecological and economic importance of the area is highlighted by its rich biodiversity, as well as its multi-species and multi-gear exploitation by numerous purse seiners, small-scale coastal vessels and recreational fishers, that has resulted in constantly decreasing catches since the second half of the 20th century (ELSTAT, 2017). This is in line with the overall declining trend in the eastern Mediterranean catches (Tsikliras et al., 2015) but despite the partial protection established for more than 50 years Pagasitikos Gulf.
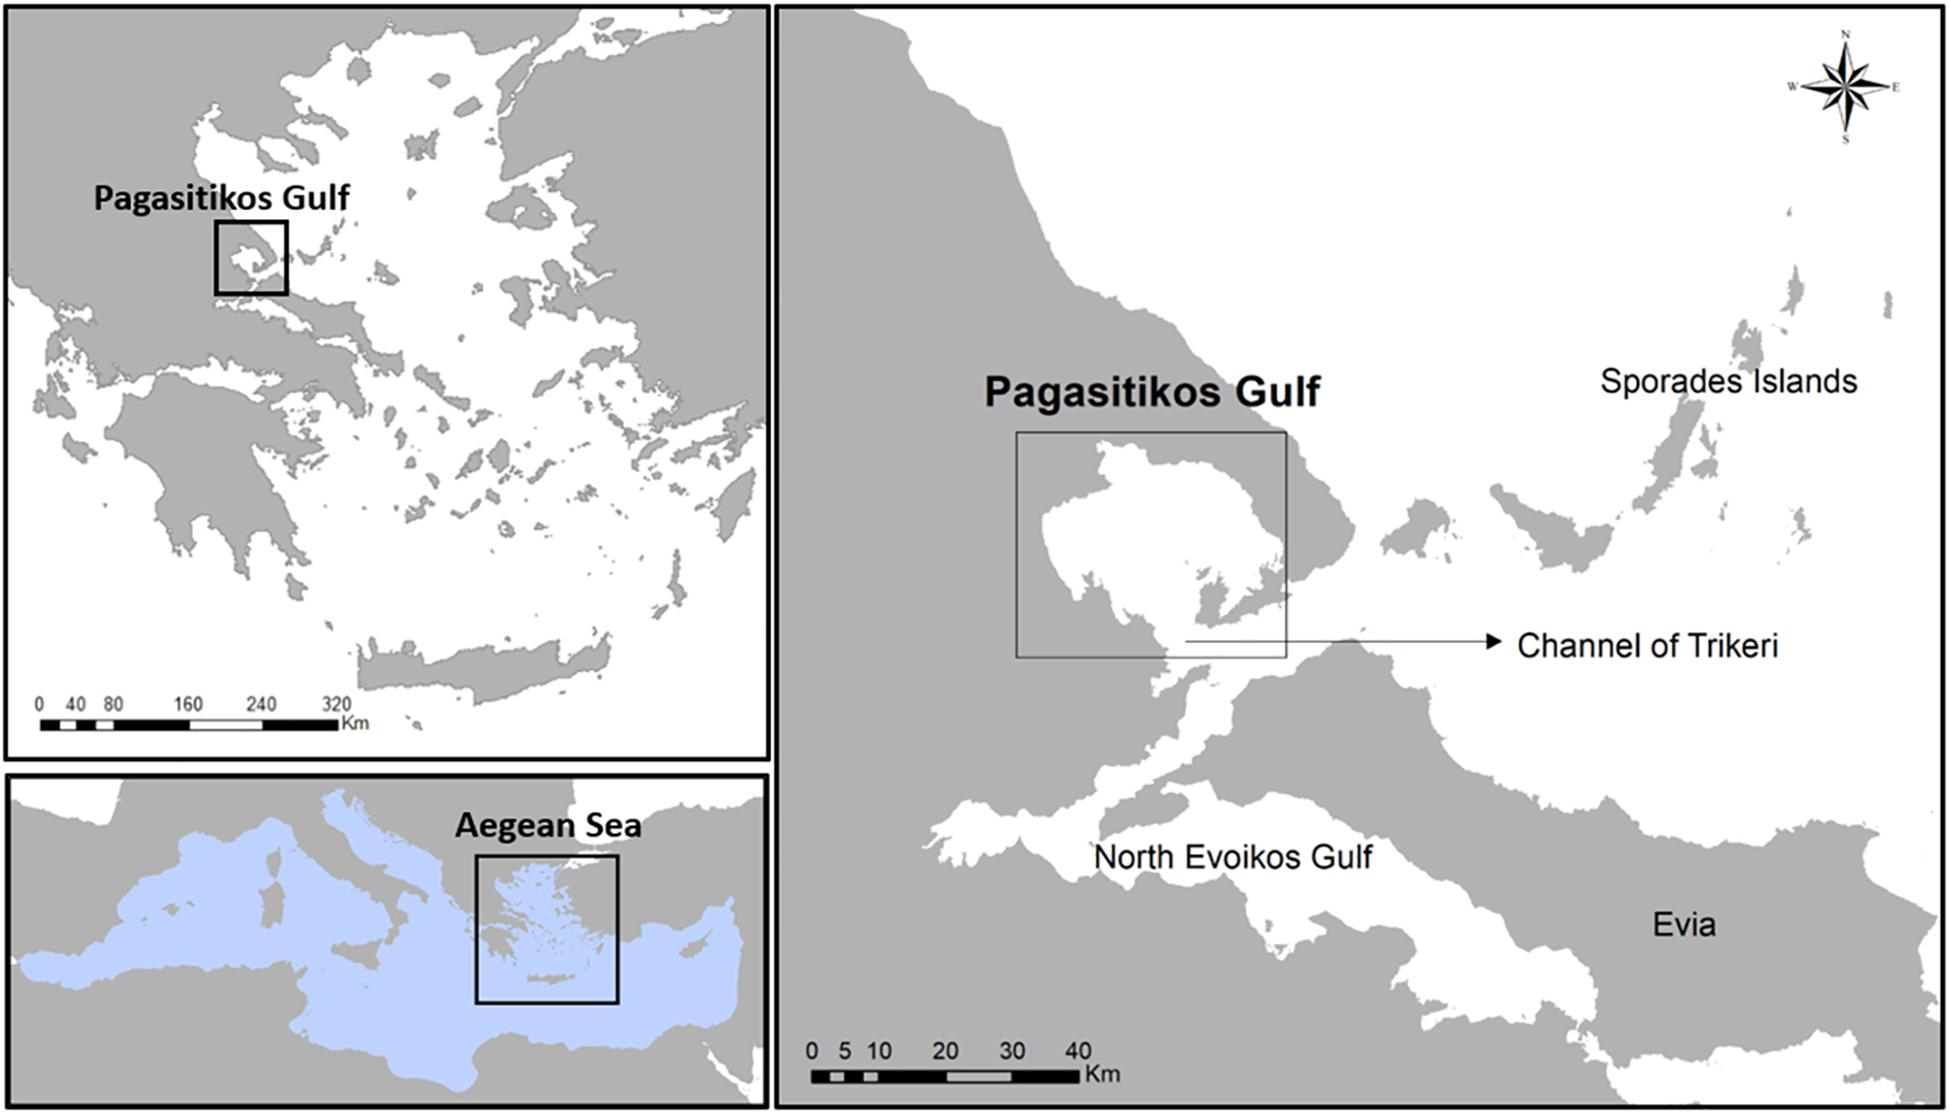
Figure 1. Map showing the location of Pagasitikos Gulf in the central Aegean Sea, Greece, eastern Mediterranean Sea.
In this work, a descriptive Ecopath mass-balance base model was developed for the first time in Pagasitikos Gulf (central Aegean Sea, Greece) aiming to describe the structure and functioning of a semi-enclosed and semi-protected ecosystem in terms of trophic flows and biomasses and to determine the ecological role of main species of interest. The temporal dimensions of this model were further extended with the time-dynamic Ecosim module of the EwE methodology, in order to set up and run temporal simulations aiming to quantify the ecosystem impacts of fishing and analyze the role of fishing activity in an area where towed gears have been absent for over 50 years. Fisheries management strategies were explored through fishing effort reduction scenarios and the potential benefits were outlined.
Materials and Methods
Study Area
Pagasitikos Gulf is a semi-enclosed shallow gulf in the western coast of central Aegean Sea with a mean depth of 69 m and a maximum depth of 102 m (Figure 1). Its eastern part is more than 80 m deep with the sea bottom covered with sediments rich in silt but poor in clay, while its western part is less than 80 m deep with the sea bottom covered with sand and biogenic detritus. Pagasitikos Gulf is in contact with the waters of north Evoikos Gulf and the Aegean Sea through the channel of Trikeri, which is 6 km wide.
About ninety fish species, many of which have high commercial value, spawn in Pagasitikos Gulf (Caragitsou et al., 2001) and the vast majority of them (with the exception of large pelagic migratory fishes) spend their entire life cycle inside the Gulf as they have been collected all year round during surveys and across sizes and life stages (Caragitsou et al., 2001; EPAL, 2008). Pagasitikos is a semi-protected area as fishing with towed gears has been prohibited all year long since 1966. Purse seiners, targeting small and medium pelagics such as European anchovy (Engraulis encrasicolus), European pilchard (Sardina pilchardus), Atlantic mackerel (Scomber scombrus), Atlantic chub mackerel (Scomber colias), and numerous small-scale coastal vessels, mainly using nets, longlines and traps to target Norway lobster (Nephrops norvegicus), surmullet (Mullus surmuletus), red mullet (Mullus barbatus), European hake (Merluccius merluccius), common pandora (Pagellus erythrinus) and anglerfish (Lophius spp.) are active in the area (Stergiou et al., 2007). Recreational fishing is rather extensive (Moutopoulos et al., 2013a) and recreational fishers mainly target sparids (Family: Sparidae) and seabass (Dicentrarchus labrax). The total fisheries production in Pagasitikos Gulf was fluctuating around an average of about 2500 metric tons before 1982, it then dropped to an average of about 1000 metric tons with an ascending trend from the mid-80s until 2010, and has rapidly been decreasing since then with an average of about 470 metric tons of landed fish and invertebrates (ELSTAT, 2017).
Ecopath Modeling
For the description of the Pagasitikos Gulf ecosystem we used Ecopath with Ecosim (EwE: Christensen and Walters, 2004) to construct an Ecopath mass-balance base model. Ecopath models, either simpler or more complex, represent a static, mass-balanced snapshot of the studied ecosystem, i.e., the species inhabiting it and their trophic relationships. Overall, the EwE software package (see footnote 1) can be used in order to (a) address ecological questions, (b) evaluate ecosystem effects of fishing, (c) explore management policy options, (d) analyze impact and placement of marine protected areas, and (e) model effect of environmental changes.
Ecopath models are designed to describe a specific ecosystem which therefore needs to be explicitly defined by the modeler who sets the spatial boundaries, as well as the time period for the model and defines the functional groups (FGs) of organisms (Christensen et al., 2005). FGs (or ecological compartments) can be single-species, or groups of (ecologically or taxonomically) related species, i.e., species that share similar population dynamics and ecological function, or even size/age groups (stanzas). As Ecopath models are a useful tool for developing a holistic ecosystem approach to fisheries management, the species to be included are not only the commercially important ones but may belong to different trophic modes (Coll and Libralato, 2012), from lower to higher trophic levels, and can be primary producers, heterotrophs or facultative consumers, i.e., organisms which consume part of their food and photosynthesize the other part. Depending on the level of aggregation and therefore complexity of the developed model, studied ecosystems have been described by a minimum of 7 up to a maximum of 67 FGs (Colléter et al., 2015). At least one detritus group must be entered, and optionally discards can be entered as a specific detritus group. Also, the fishing fleet(s) that exploit the resources of the studied ecosystem must be defined in the model (Christensen et al., 2005).
Ecopath assumes mass-balance, i.e., that the energy input and output of all living groups are balanced, usually over a yearly time period, and bases the parameterization on two master equations, one to describe the production and another for the energy balance of each component in the ecosystem (Christensen et al., 2005):
Master equation 1: Production = predation mortality + fishery catches + biomass accumulation + net migration + other mortality
Master equation 2: Consumption = production + respiration + unassimilated food
The assumption of mass-balance requires that production from any of the groups should end somewhere else in the system while taking into consideration the basic physiological and thermodynamic constraints. Predation mortality is the parameter linking the groups with each other. When balancing the model to achieve mass-balance, one production equation is used for each of the FGs. The diet composition, biomass accumulation, net migration and fishery catches of each group must always be entered (Table 1). It is optional to enter any of the rest four parameters in Table 1 (B, P/B, Q/B, EE), because the set of linear equations can be solved with one unknown value. Most of the times, based on the ease of estimation, EE is left to be estimated by the software (Christensen and Walters, 2004). Biomass accumulation is entered as rate (t/km2/year) or relative to biomass if the data show change in biomass during the modeled year. Unassimilated food is a function of consumption, production and respiration that represents physiologically non-useful urine and feces. In general, it takes a default value of 20% for carnivorous fishes, with the exception of herbivores and detritivores for which 40% is more appropriate (Winberg, 1956).
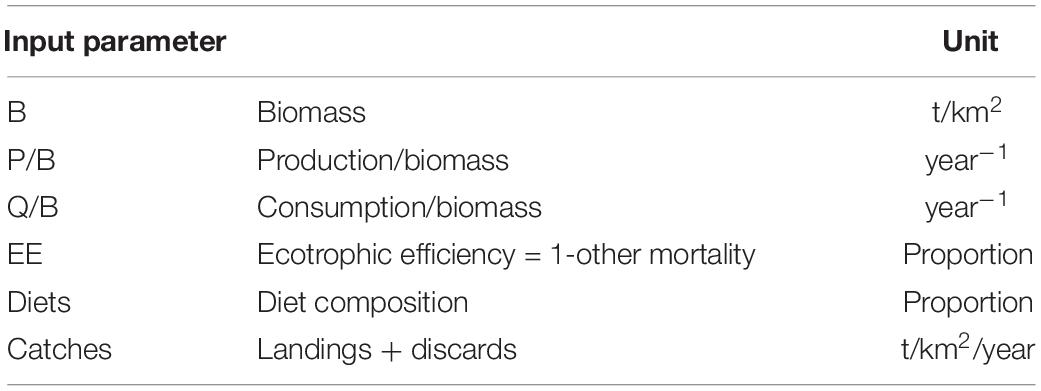
Table 1. Data requirements for Ecopath models.
The model of Pagasitikos Gulf was constructed for the year 2008, when reliable empirical biomass data were available. The food web was described by 31 FGs, that encompassed groups of lower to higher trophic levels namely 2 planktonic, 8 invertebrate, 16 fish, and 2 detritus groups, as well as sea turtles, seabirds and dolphins (Table 2). The 31 FGs consisted of more than 120 taxa as recorded in survey and landings data and the literature. At first, the listed taxa formed 28 FGs based on their importance to fisheries and management, their phylogenetic or ecological relation and available data. But 51 fish taxa of lower fishing relevance and abundance in the ecosystem remained uncategorized. For 40 of those taxa, quantitative diet information, in the form of stomach content data, were available and were used to perform a cluster analysis (using the Ward’s method and Euclidean distances in Statgraphics Centurion XVI) that resulted in forming 3 more FGs (Demersal fishes 1, 2, and 3). The remaining 11 fish taxa were assigned to one of those three FGs according to general knowledge of their feeding preferences, behavior and ecology. Pagasitikos Gulf is being exploited by two fishing fleets that were included in the model, namely purse seiners and small-scale coastal vessels.
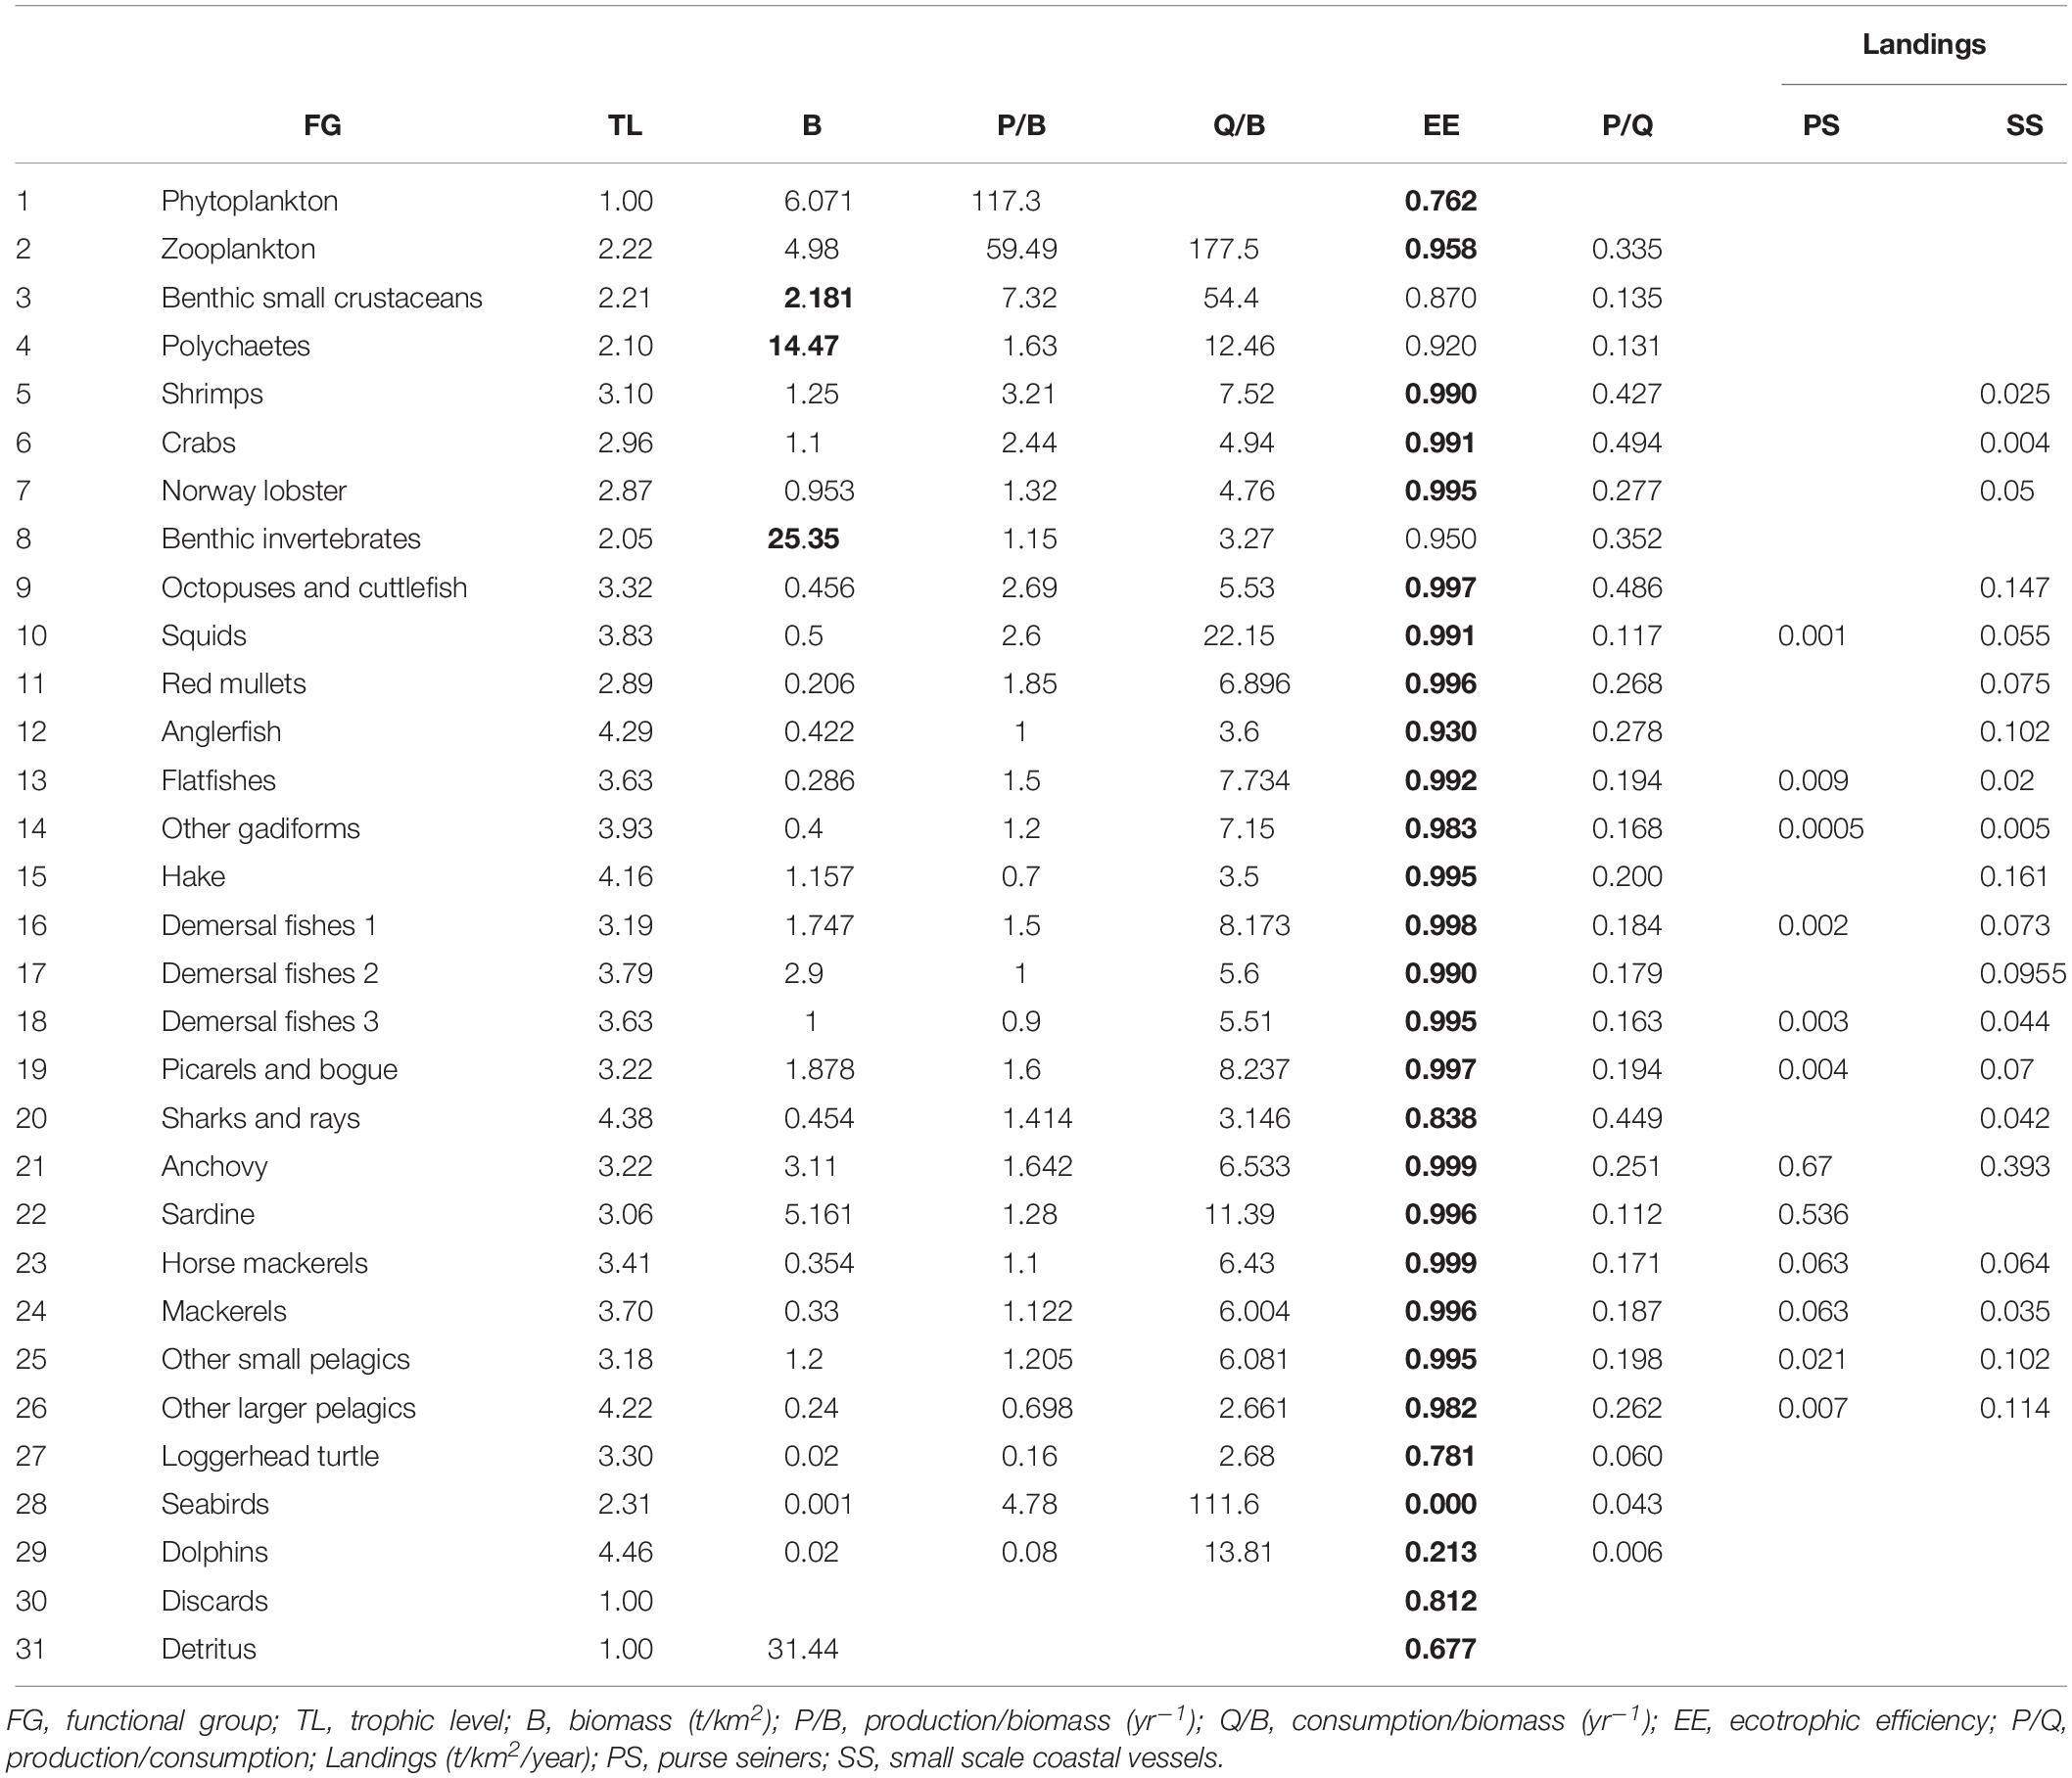
Table 2. Input and output (bold) parameters of the Pagasitikos Gulf Ecopath model.
Biomass data for fish and main invertebrate FGs (Supplementary Table A1) were obtained from local scientific trawling surveys (EPAL, 2008), while for the rest of the FGs the literature and other models were used; landings data were taken from the Hellenic Statistical Authority (ELSTAT, 2017) and were reconstructed based on the literature (Moutopoulos and Stergiou, 2012); diet compositions (Supplementary Table A3) were obtained from published reviews regarding fish in the Mediterranean (Stergiou and Karpouzi, 2002; Karachle and Stergiou, 2017); production and food consumption values were calculated using published empirical equations (Pauly, 1980) or the relevant life-history tools in FishBase (Froese and Pauly, 2019). The part of the life-history spent outside the study area was accounted for through the biomass value derived from seasonal biomass empirical data, as in the case of the other larger pelagics, or through import in the diet composition, as in the case of seabirds.
A set of statistics, that describe the studied ecosystem as a whole and can be used as measures to assess its status (Christensen et al., 2005), were included and presented along with other Mediterranean model results to allow for comparisons. The total system throughput represents the sums of all flows in the system, i.e., the total consumption, exports, respiratory flows and flows to detritus and serves as an important indicator of the size of the ecosystem in terms of flows (Ulanowicz, 1986). The system total primary production to total respiration ratio can be used to describe the state of maturity of an ecosystem (Odum, 1971) where immature systems, in their early developmental stages, have production that is expected to exceed respiration and thus the ratio is greater than 1. Fishing exploitation may lead the ecosystem to a less mature state, whereas prohibiting fishing with towed gears is likely to lead in change from disturbed to mature ecosystems in terms of bottom complexity, as well as benthos and fish species composition (Watling and Norse, 1998). The difference between primary production and respiration gives the net system production which is expected to be higher in immature systems and approximate zero in mature ones. Accordingly, the ratio of primary production to biomass declines over time in immature systems where production exceeds respiration for most FGs and biomass accumulation is observed. The system biomass to throughput ratio may take any positive value and it reaches a maximum when the system is at its most mature state. The omnivory index (Christensen and Pauly, 1992) indicates how the trophic interrelations are distributed among trophic levels and is therefore used to characterize the more or less extended web-like features of the studied system. A larger than zero value of the omnivory index suggests feeding on many trophic levels rather than specialization by feeding on just a single trophic level. The pedigree of an Ecopath input categorizes the origin of a given input (the type of data on which it is based), and specifies the likely uncertainty associated with the input, i.e., the reliability of the data (Morissette, 2007). These estimates were then utilized by the Monte Carlo routine to examine model sensitivity and assess the effect of the uncertainty in Ecopath input data on the Ecosim dynamic simulations (Christensen et al., 2005; Heymans et al., 2016).
A couple of network analyses were also performed, namely the mixed trophic impact (MTI) and keystoneness analyses. The MTI plot depicts the relative direct and indirect impact of a very small increase in the biomass of a group on the biomass of another group, thus revealing straight forward predator-prey effects but also indirect cascade effects on a prey’s prey or competitor (Christensen et al., 2005). The keystone index is used to identify groups that have considerable impact and play an important role in the studied ecosystem either despite their low biomass (keystone groups) or as a result of their high biomass (dominant groups) (Libralato et al., 2006).
Ecosim Modeling
The Ecopath base model constructed for Pagasitikos Gulf was further used for temporal simulations. Ecosim inherits key initial parameters from the base model to provide temporal dynamic simulations of biomass through a differential equation that calculates the growth rate of an FG during a specific time interval based on the net growth efficiency, the consumption rate of a prey FG by a predatory FG, the immigration and emigration rates and the other natural and fishing mortality rates (Christensen et al., 2005).
Consumption rates are calculated based on the “foraging arena” theory (Walters et al., 1997), the basic assumption of which is that aquatic organisms are divided in vulnerable and invulnerable to predation risk, as they largely limit predator-prey interactions to spatially restricted foraging arenas. The transfer rate between being vulnerable and invulnerable to predation determines if the biomass of different groups in the ecosystem is controlled by predators (top-down control, i.e., Lotka–Volterra dynamics: prey has no refuge to be protected and is always consumed when encountered by a predator), or preys (bottom-up control: prey is usually protected, by hiding in crevices for example, and becomes available to predators only when it leaves its refuge) or the control is of an intermediate type (Pauly and Christensen, 2002). The level of vulnerability represents the effect that an increase in predator biomass would have on the predation mortality of a given prey and it is an important parameter of the model that can be modified during calibration so that predictions fit better to observed historical data (Christensen et al., 2005).
Since there were no available complete time series of biomass data for the area, the Ecosim model developed for Pagasitikos Gulf was fitted to available historical landings data for the period 2008–2017 as obtained from the Hellenic Statistical Authority (ELSTAT, 2017) and reconstructed with the methodology used in Moutopoulos and Stergiou (2012) to include part of the small-scale coastal fleet and recreational fisheries catches that are excluded from official statistics (Moutopoulos et al., 2016). The recreational catches have not been properly monitored in the area and, apart from a short survey that was conducted on recreational fishing from shore based on questionnaires (Moutopoulos et al., 2013a), there is absolutely no information on their numbers and effort trends. Therefore, the fleet of small-scale coastal vessels is the one that included the scarce data on recreational catches, as the species targeted and many of the gears used are common (Moutopoulos et al., 2013a). Those were complemented with discards data that were estimated as a proportion of the landings for each fleet (Tsagarakis et al., 2014). Time series reference data over a specific historical period, along with estimates of changes in fishing effort by fishing gear type to drive the model over those years, facilitate producing a reasonable fit of the model to observed data (Christensen et al., 2005). Effort data by gear type for the two fleets (purse seiners and small-scale coastal vessels) were extracted from the European Community Fishing Fleet Register (CFR, 2018).
During the calibration of the model, the measure used to assess the goodness of fit was the reduction of the sum of squared deviations (SS) of observed values from predicted ones (Christensen et al., 2005). As in Coll et al. (2009a) and Halouani et al. (2016), the ‘’Fit to time series” module of Ecosim was used to find the 20 most sensitive to vulnerability changes prey-predator pairs and improve the fit of the model, with a vulnerability search executed to identify those values that would minimize the SS. In order to further minimize the SS, a forcing function (primary producer) was applied to represent a physical or other environmental parameter that might influence the trophic interactions among the components of the food web (Christensen et al., 2005). Primary production anomalies act upon the initial phytoplankton P/B values by adding annual modifiers every year, thus making it more realistic for the model projection (Coll et al., 2009a). The primary production anomaly identified in the model was correlated (Spearman’s rank-order correlation test for non-normally distributed data) with the following environmental and climate time series data that have been reported to affect marine populations in the Mediterranean Sea (Tsikliras et al., 2019): sea surface temperature (Aqua-MODIS, 2019), the Atlantic Multidecadal Oscillation index (AMO, NOAA and Climate Prediction Centre, 2019a), the North Atlantic Oscillation index (NAO, NOAA and Climate Prediction Centre, 2019b), and the Mediterranean Oscillation index (MOI, Climatic Research Unit University of East Anglia [CRU-UEA], 2019). The fitting procedure was performed in seven steps as described in Mackinson et al. (2009) and also followed by Piroddi et al. (2016) and the best model with the lowest Akaike’s information criterion (AIC) was chosen.
Biomass and catch projections were estimated up to 2025 and three scenarios of reduced fishing effort were examined in order to investigate the response of the studied ecosystem to alternative management schemes. Biomass Monte Carlo simulations for the year 2008 were tested against the projection year 2025 for statistically significant differences with the non-parametric Kolmogorov-Smirnov test (0.05 significance level) in Statgraphics Centurion XVI. Based on the work by Froese et al. (2018) that explores the effect of applying lower levels of fishing mortality on future biomass and catches, three scenarios of fishing effort reduction by 10% (Scenario 1), 30% (Scenario 2), and 50% (Scenario 3) were examined and compared to the baseline scenario 0 (business-as-usual). The fishing effort reduction referred to a reduction in the number of vessels operating in the area and was applied to all fleets equally (purse seiners and small-scale coastal vessels).
Results
The Pagasitikos Gulf model was defined by 31 FGs covering the main trophic components of the ecosystem and including all the professional fishing activities operating in the area, as defined by two fleets (purse seiners and small-scale coastal vessels). The cluster analysis for the unassigned demersal fishes resulted in the formation of five distinct groups of fish species (Figure 2). However, because of the low biomass of the species in the fourth and fifth branch of the dendrogram, it was decided to merge branch 4 with branch 2, and branch 5 with branch 1. All in all, branch 1 and 5 formed the FG demersal fishes 1, branch 2 and 4 formed demersal fishes 2 and branch 3 formed demersal fishes 3 (Figure 2). The input and resulting output parameters of the balanced model are shown in Table 2, while the trophic linkages among the different compartments of the studied ecosystem are depicted in a flow diagram per trophic level and habitat (Figure 3).
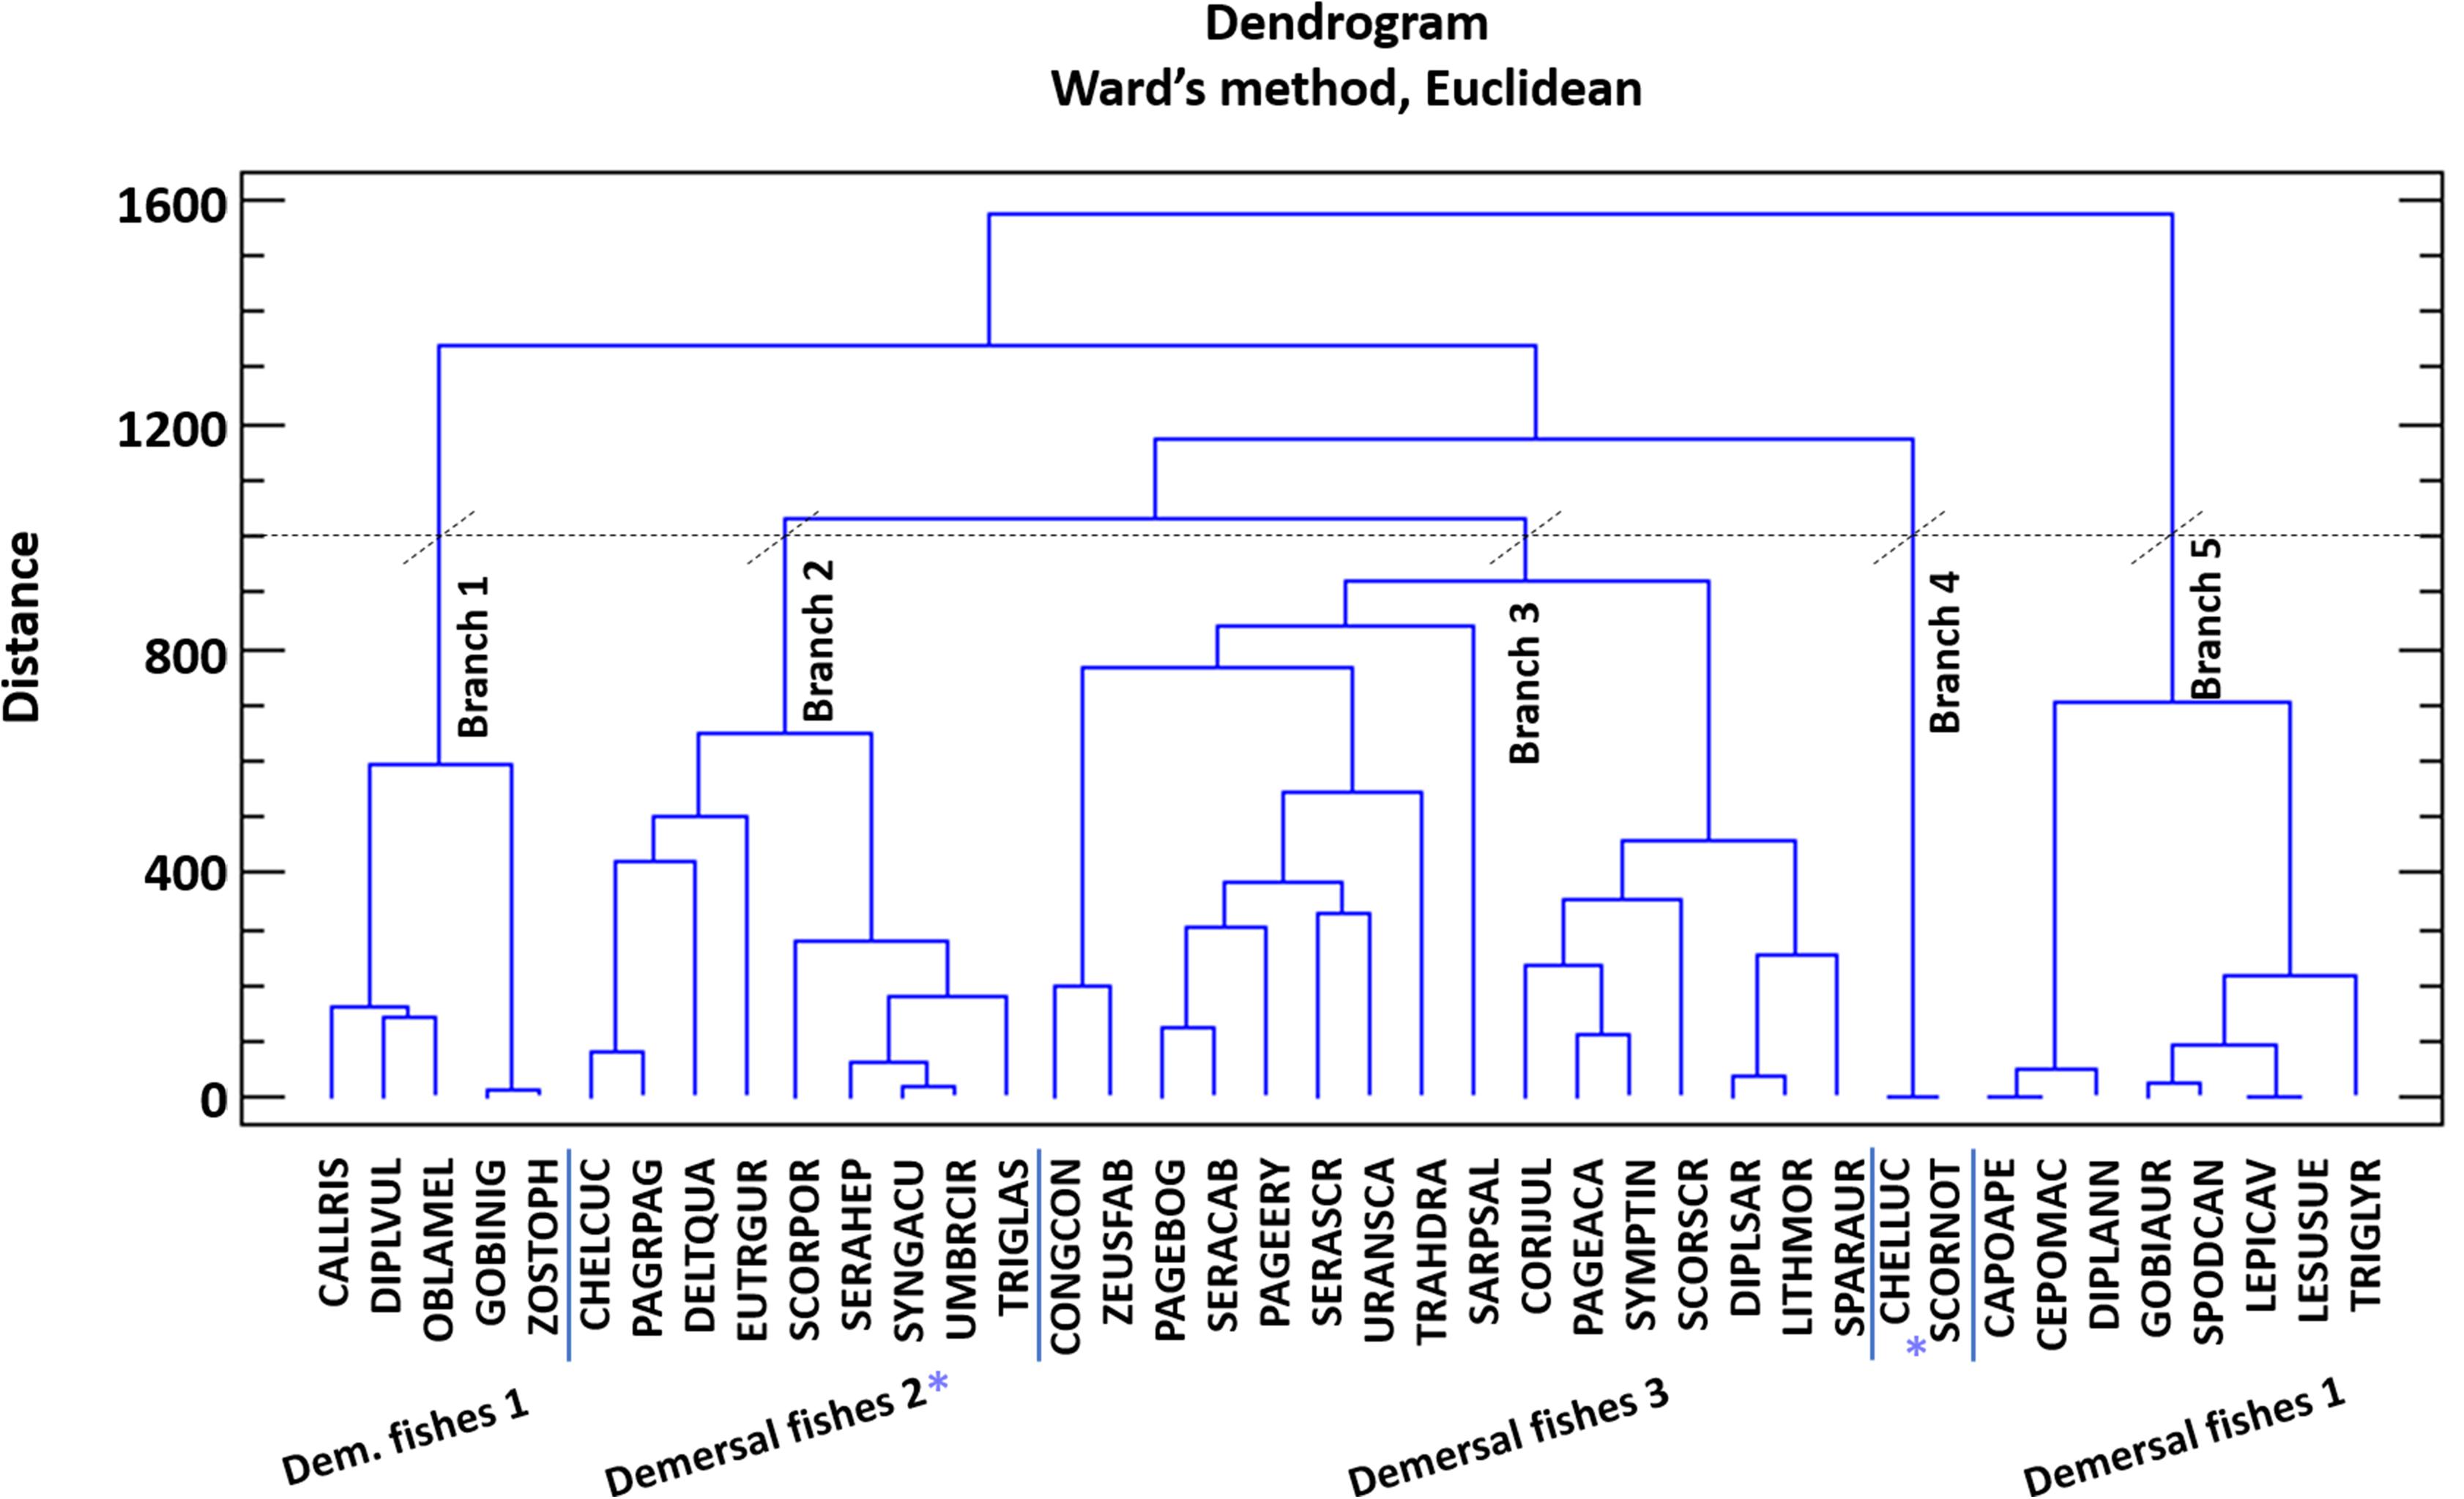
Figure 2. Cluster analysis of the diet composition of 40 fish species for their categorization in functional groups. Species codes are given in Supplementary Table A2.
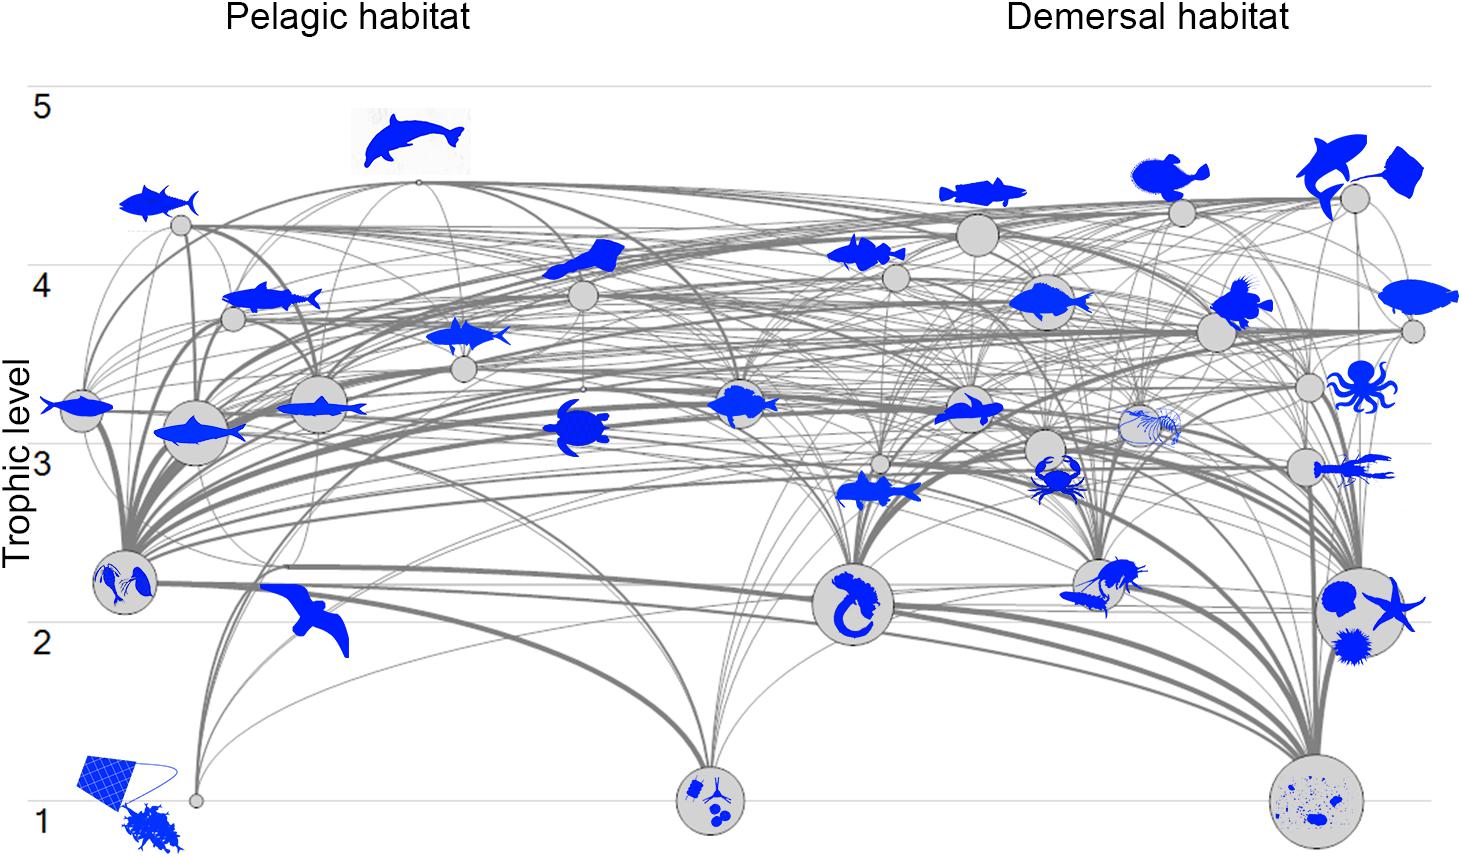
Figure 3. Flow diagram of Pagasitikos Gulf organized by 31 functional groups’ trophic levels and by pelagic or demersal habitat (organisms not in scale).
The model was not initially balanced, so we modified the input parameters of the FGs with EE values greater than 1 (12 in total). The original biomass input data for shrimps, crabs, other gadiforms, mackerels and other small pelagics were unrealistically low and were increased by lowering the catchability factor of the trawler to account for the small shrimps and crabs that aren’t caught by the gear as well as for the pelagic nature of the rest three FGs (Supplementary Table A1). For shrimps, crabs and other gadiforms, for which the changes were outside of the original range of uncertainty, we trusted more the biomasses of the predators obtained through the trawling surveys that were more focused on measuring fish, as well as the landings data. For flatfishes, hake, octopuses and cuttlefish, red mullets, demersal fishes 1 and 3, horse mackerels and discards we adjusted the diet matrix, since diet composition is the parameter with the highest plasticity (Piroddi et al., 2016). For example, the proportions of the aforementioned unbalanced FGs in their predator’s diet were distributed so that consumption was directed toward other appropriate FGs such as anglerfish, demersal fishes 2, picarels and bogue, sharks and rays. Once the model was balanced, most of the FGs showed high EE values due to predation and fishing.
Statistics for the Pagasitikos Gulf ecosystem presented along with the NC Adriatic (Coll et al., 2007) and N Aegean (Tsagarakis et al., 2010) ecosystems for comparison purposes (Table 3), indicate a medium sized system in terms of flows and production, with a total system throughput and total production of about 3000 and 1100 t/km2/year, respectively. The studied ecosystem was shown to be in a more mature stage than the NC Adriatic and N Aegean ones (Table 3), but was still characterized as immature, due to high system production, far from zero, exceeding respiration. The estimated omnivory index was higher for Pagasitikos Gulf, indicating more complex web-like trophic interactions among the ecosystem compartments. The model was typical in its uncertainty (Supplementary Table A4), with data of reasonable quality used for its construction, as implied by a pedigree index of 0.53. We chose specific models of nearby regions with similar model topology (in terms of number of FGs, aggregation across trophic levels, similar top predator specifications, lack of microbial loop) and examined the indicators that are robust to model construction (Heymans et al., 2016). We acknowledge the varying exploitation level and difference in the nature of the system, but we chose to compare with Mediterranean ecosystems of some proximity than with models of ecosystems with completely different FGs and exploitation pattern.
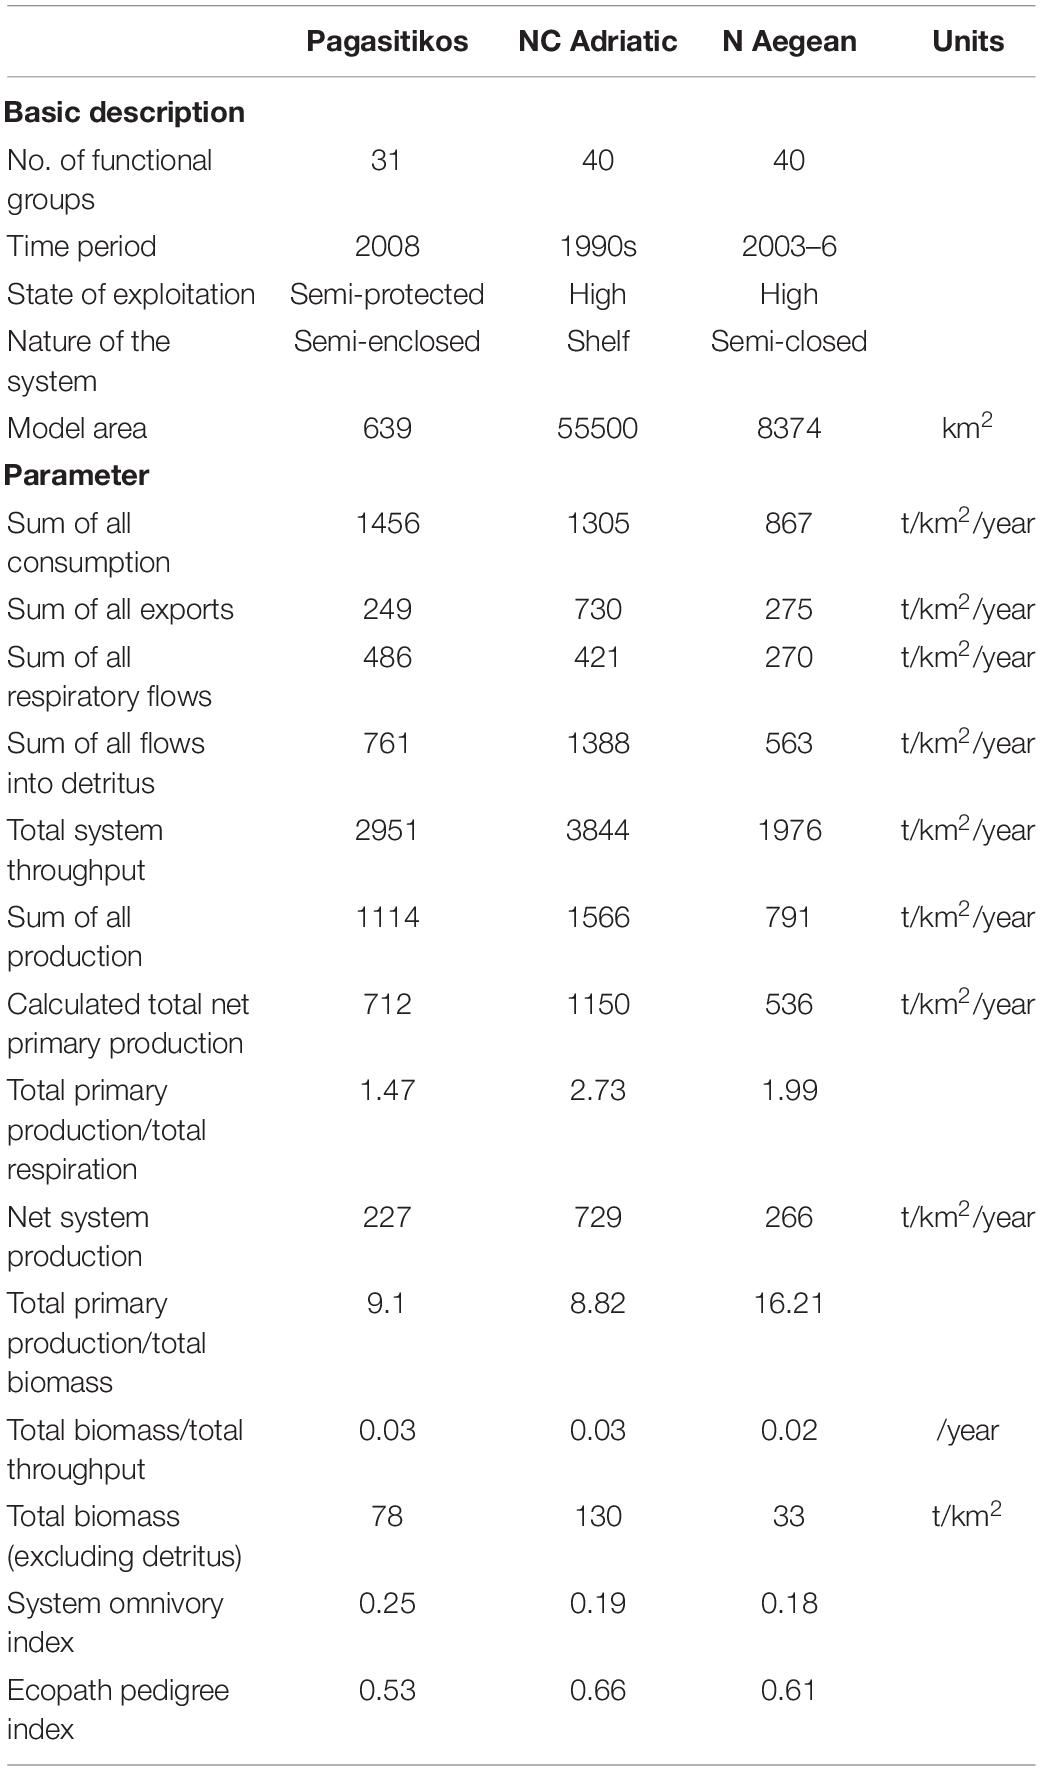
Table 3. Statistics, flows, and ecological indicators for Pagasitikos Gulf in comparison to models from other Mediterranean areas (NC Adriatic: Coll et al., 2007; N Aegean: Tsagarakis et al., 2010). Basic descriptive characteristics of the models are also provided.
According to the keystoneness graph (Figure 4), zooplankton and demersal fishes 2 were the dominant FGs as they had the highest relative total impact and keystone index in the studied ecosystem, however, they could not be characterized as keystone FGs due to their high biomass. On the other hand, squids and other gadiforms seemed to be more important to the survival of their shared ecosystem as their overall impact and keystoneness were high despite their smaller abundance in Pagasitikos Gulf. The loggerhead sea turtle and seabirds were shown to play the least important role in the studied ecosystem.
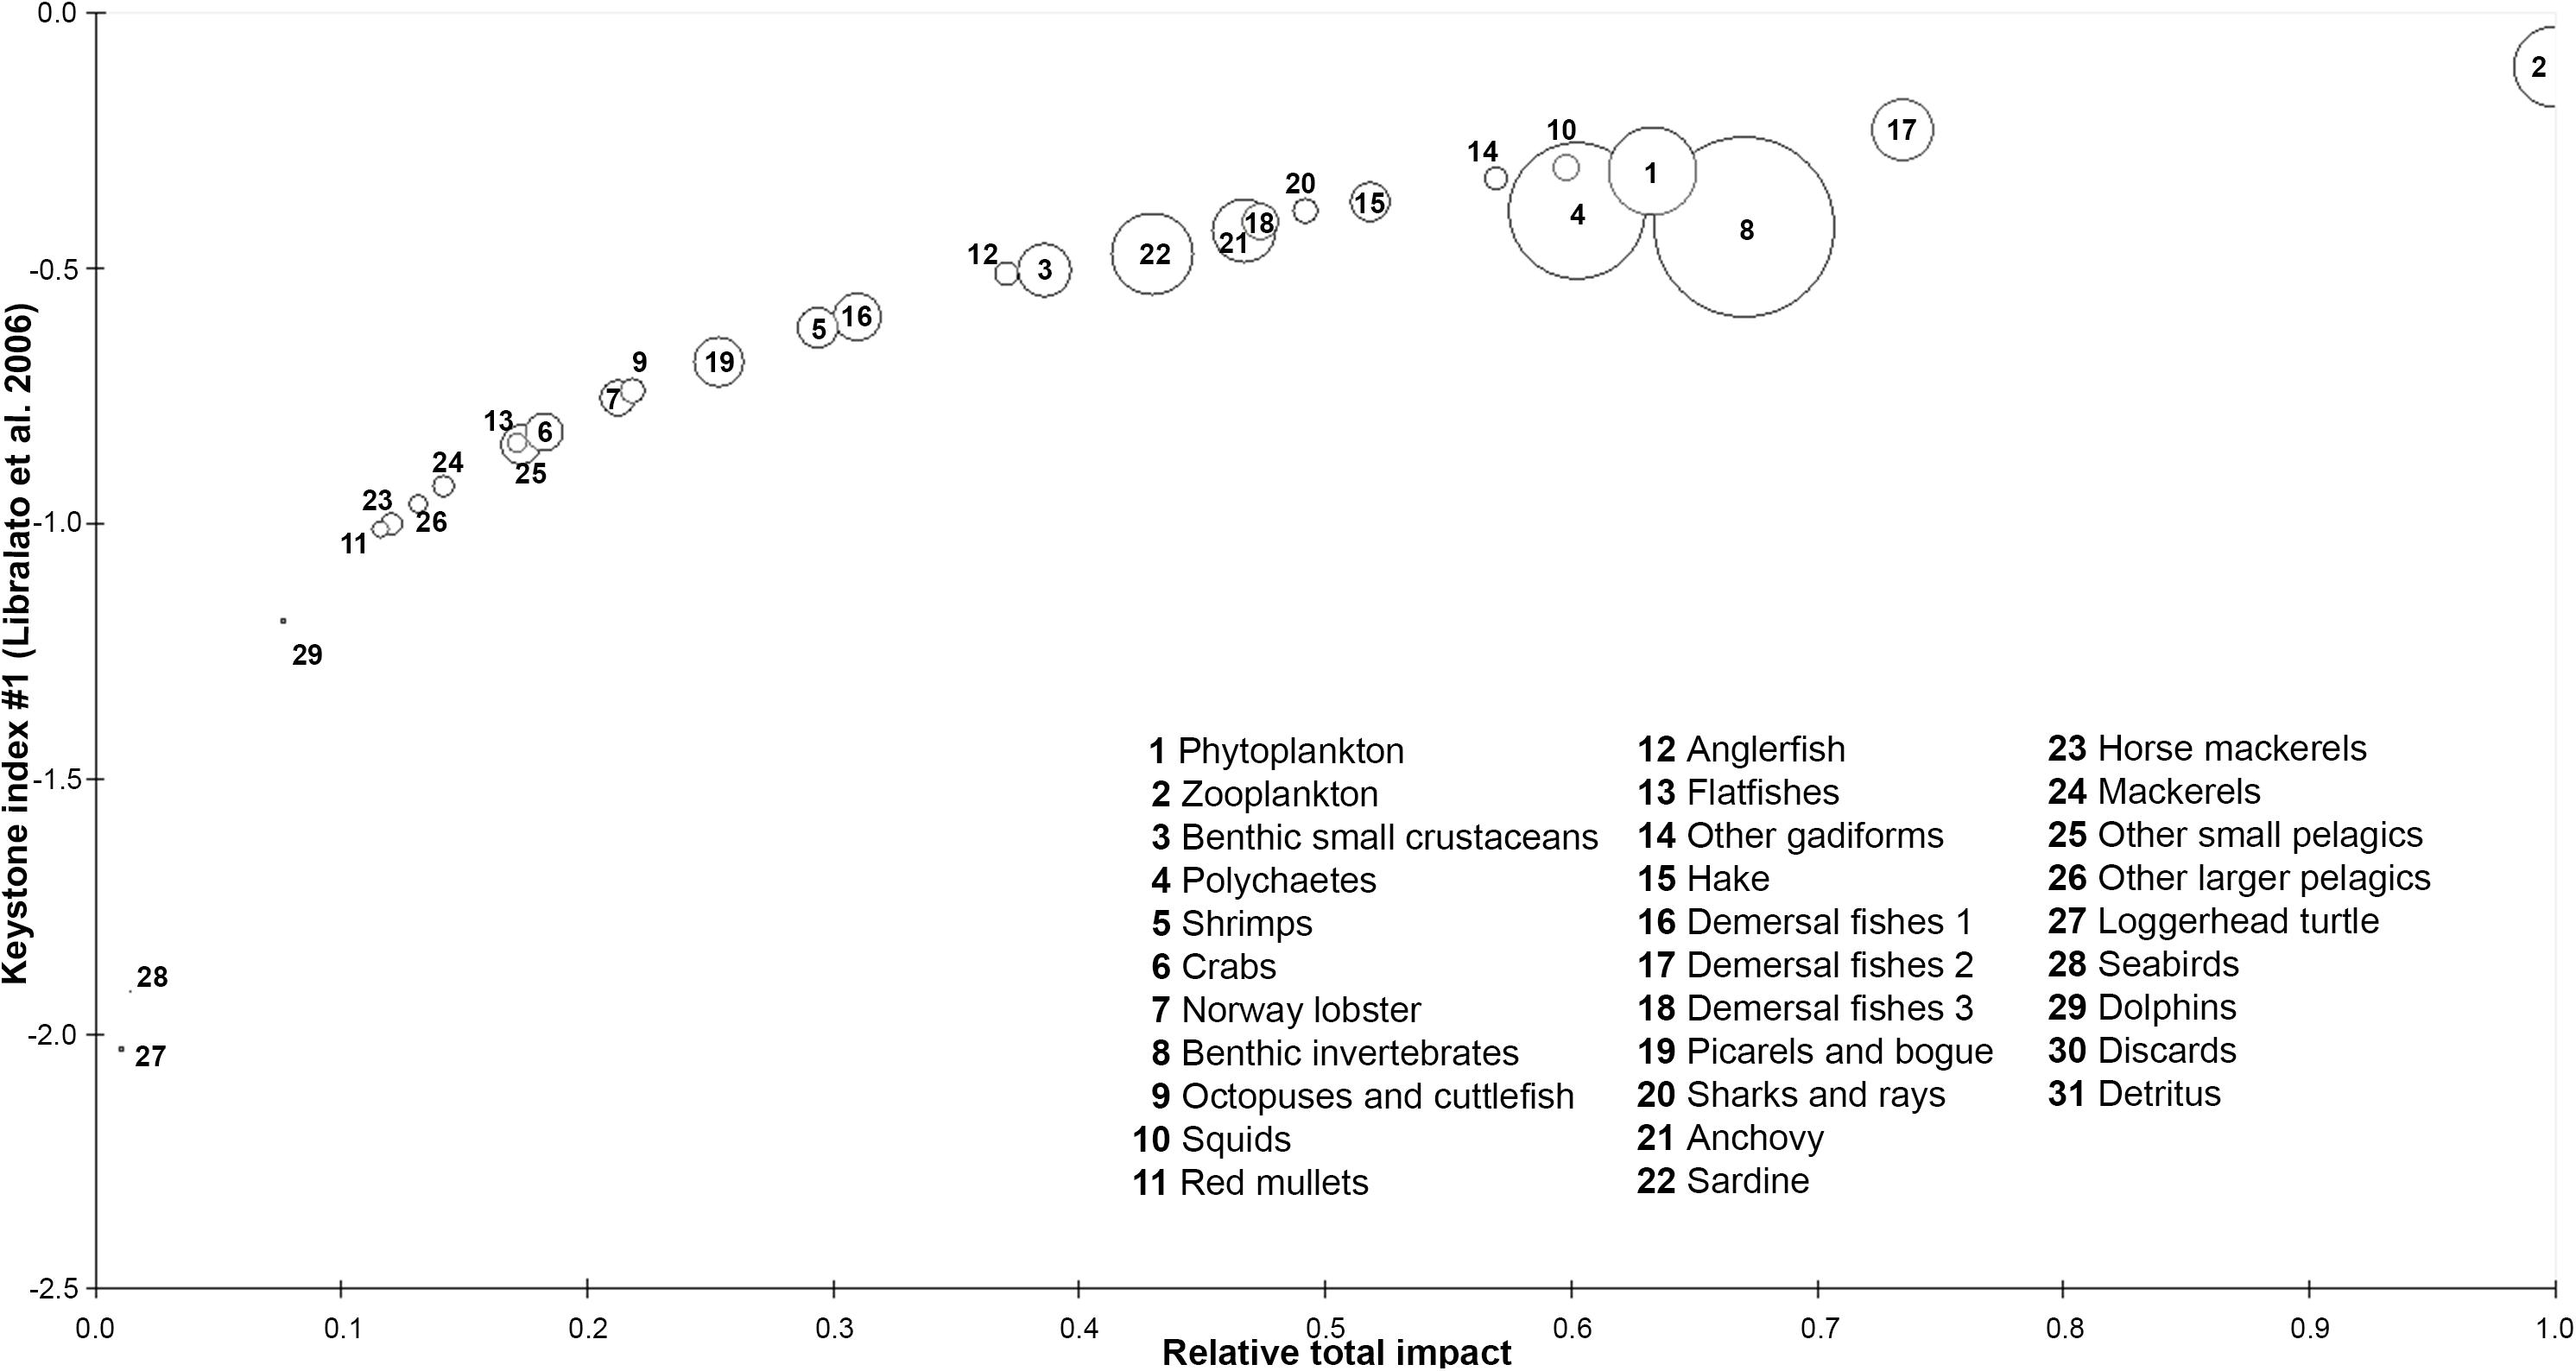
Figure 4. Keystone index and relative total impact of each functional group of the Pagasitikos Gulf model. Circle size indicates the % relative biomass of each group.
The MTI analysis (Figure 5) shows the relative direct and indirect impact that a hypothetical very small increase in the biomass of the impacting groups has on the biomass of the impacted groups, thus revealing indirect interactions between groups due to prey availability. Benthic invertebrates had the highest positive impact on octopuses and cuttlefish due to direct trophic interactions, while zooplankton had the highest negative impact on itself. Most groups had a negative impact on themselves, reflecting an increased within-group competition for resources. Predatory FGs, such as anglerfish and sharks and rays, were observed to negatively affect the groups they feed upon, like hake and anglerfish, respectively, while at the same time having a positive impact on their prey’s food (squids and demersal fishes 3, and mackerels and horse mackerels, respectively). Regarding fisheries, out of the two fleets exploiting the studied ecosystem, small-scale fisheries had the strongest negative impact on different compartments of the ecosystem with the most pronounced impact on dolphins, loggerhead turtles, other larger pelagics, anglerfish and red mullets.
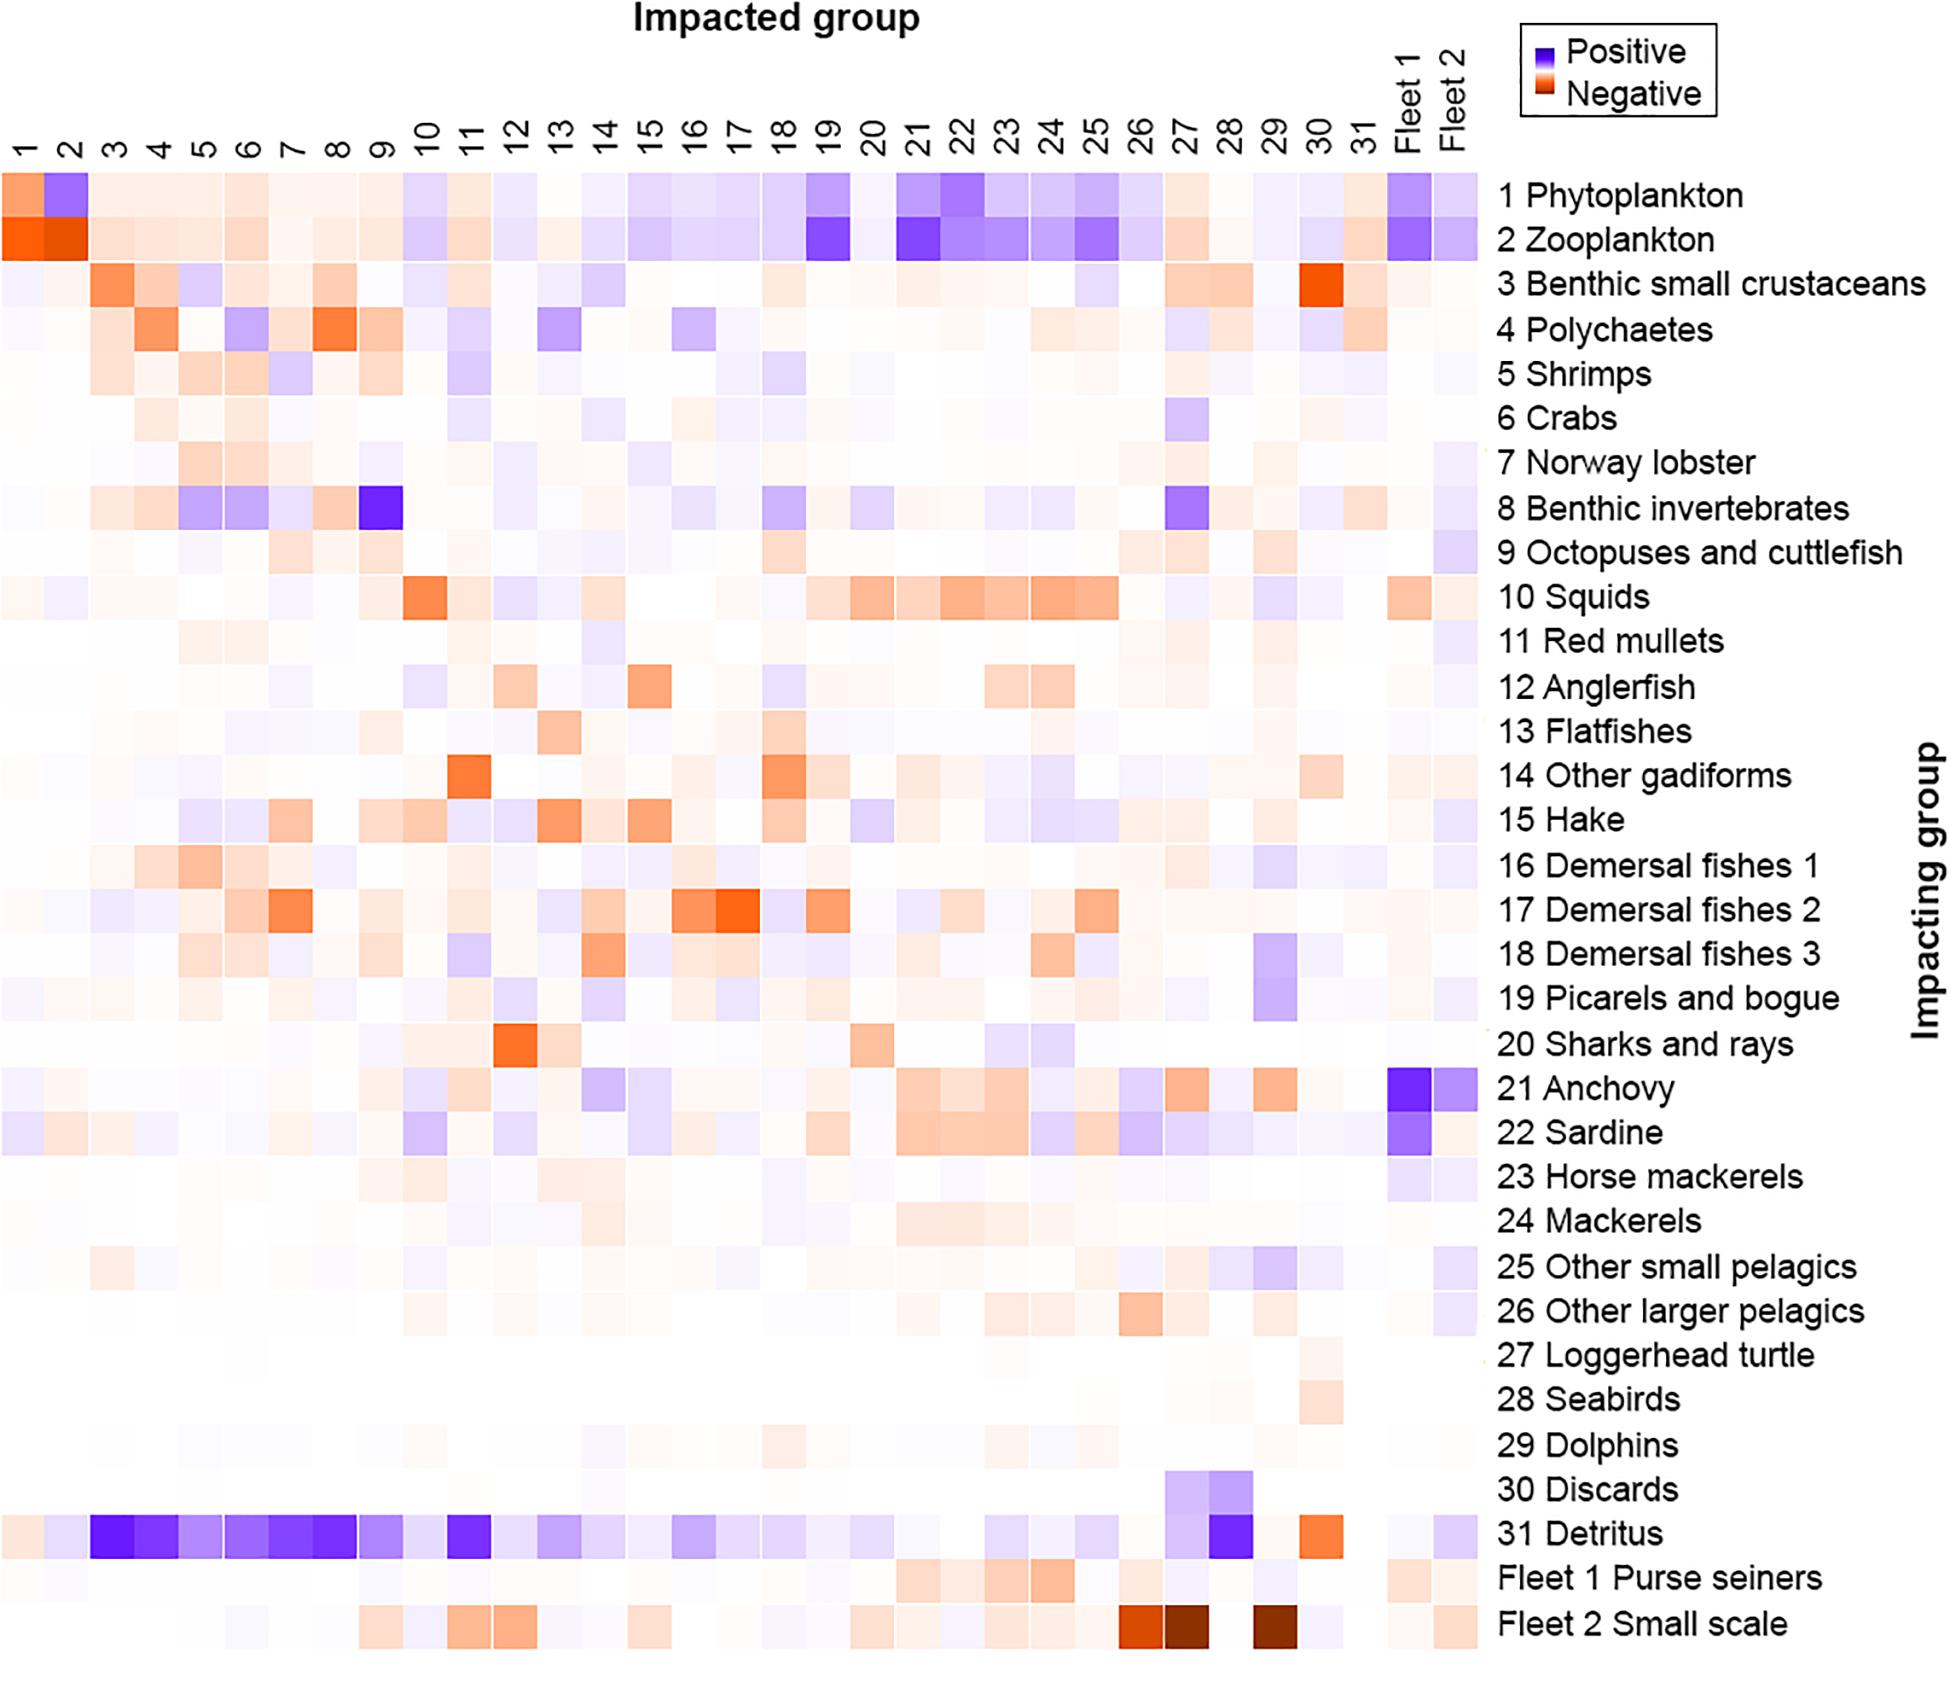
Figure 5. Mixed trophic impact analysis of the Pagasitikos Gulf Ecopath model. Impact on and by the two fishing fleets is also shown (1–2).
The model best fitting the observed landings time series data was the one yielding the lowest AICc value and explaining 86.7% of the variance of the data (Table 4). The best fit was obtained when trophic interactions, fishing and environmental parameters (in the form of primary production anomaly) were taken into account during the procedure. The combination of trophic relations and environmental drivers could explain most of the variability observed in the ecosystem (85.5%), whereas fishing alone contributed with 11.1%. Although the primary production anomaly resulted in the most profound improvement of the model fit, no significant correlation was found with available environmental and climate variability time series data (Table 5). A number of vulnerabilities were estimated by the time series fitting routine, with 20 trophic interactions, of mostly demersal organisms, giving the best improved result (Table 4). Eleven out of the twenty (55%) vulnerabilities were low (Supplementary Table A5), close to 1, indicating prey control (bottom-up) in the studied ecosystem, in which it is the physiological or behavioral factors of the prey that determine prey mortality rates rather than predator biomass (Christensen and Walters, 2004). The lowest vulnerabilities were estimated for the predator-prey interactions of zooplankton-phytoplankton (1.73), picarels and bogue-zooplankton (1.00), demersal fishes 1-polychaetes (1.09), benthic small crustaceans and polychaetes-benthic invertebrates (1.00 and 1.24, respectively), zooplankton-detritus (1.00).
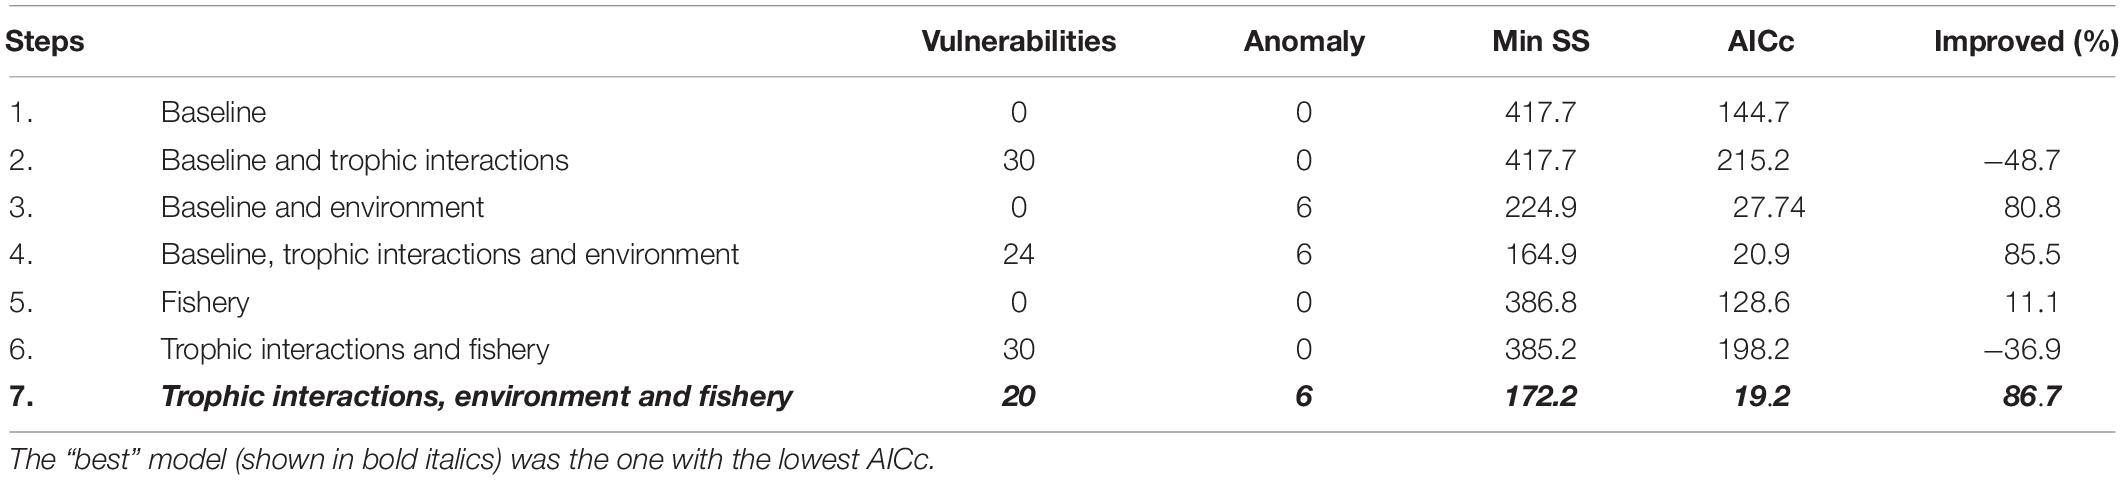
Table 4. Model fits according to the seven steps applied by Mackinson et al. (2009) including trophic interactions, fishery, and environmental drivers.
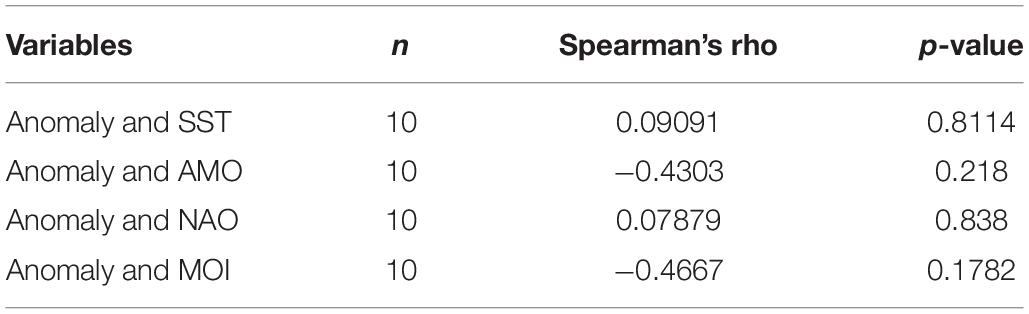
Table 5. Spearman’s rank-order correlations of the primary production anomaly with sea surface temperature (SST), the Atlantic Multidecadal Oscillation index (AMO), the North Atlantic Oscillation index (NAO), and the Mediterranean Oscillation index (MOI).
The catches estimated by Ecosim showed an overall satisfactory match when compared with independent time series data, with some exceptions such as other gadiforms for which the predicted trend did not match the original catch trend (Figure 6). The results of the basic Ecosim simulation (scenario 0: business-as-usual) for biomasses and catches for 31 FGs of the Pagasitikos Gulf ecosystem highlighted overall persistent declining trends for many important ecological and commercial groups from 2010 up to 2017, when independent data were available, with a subsequent increase and a following stabilization in the projection years (Figures 6, 7 and Table 6). The aforementioned pattern up to 2017 was mainly driven by the primary production anomaly estimated during the catch time series fitting procedure, and resulted in the ecosystem balancing in an intermediate more stable state in the projection period. Both the total biomass and total catches were predicted to considerably decrease by the end of the simulation period in 2025, by 42 and 31%, respectively, while the biomass of only four predator groups (anglerfish, hake, sharks and rays, other larger pelagics) showed a marginal increase that varied from 2% to 10%, however, it did not result in a subsequent increase of the catches (Table 6). It should be noted that the marginal biomass increase of sharks and rays was not statistically significant. Commercially important FGs like anchovy and sardine showed a decrease in biomass in the end of the simulation period, by 21 and 30%. Alongside them, FGs with intermediate consumers like other small pelagics, picarels and bogue and red mullets also had a significant decrease in biomass. Crustacean FGs with important economic and ecological value in the area, like Norway lobster and shrimps decreased in biomass by 27 and 34%, respectively, which subsequently led in a decrease in catches, by 37 and 43%, respectively (Table 6).
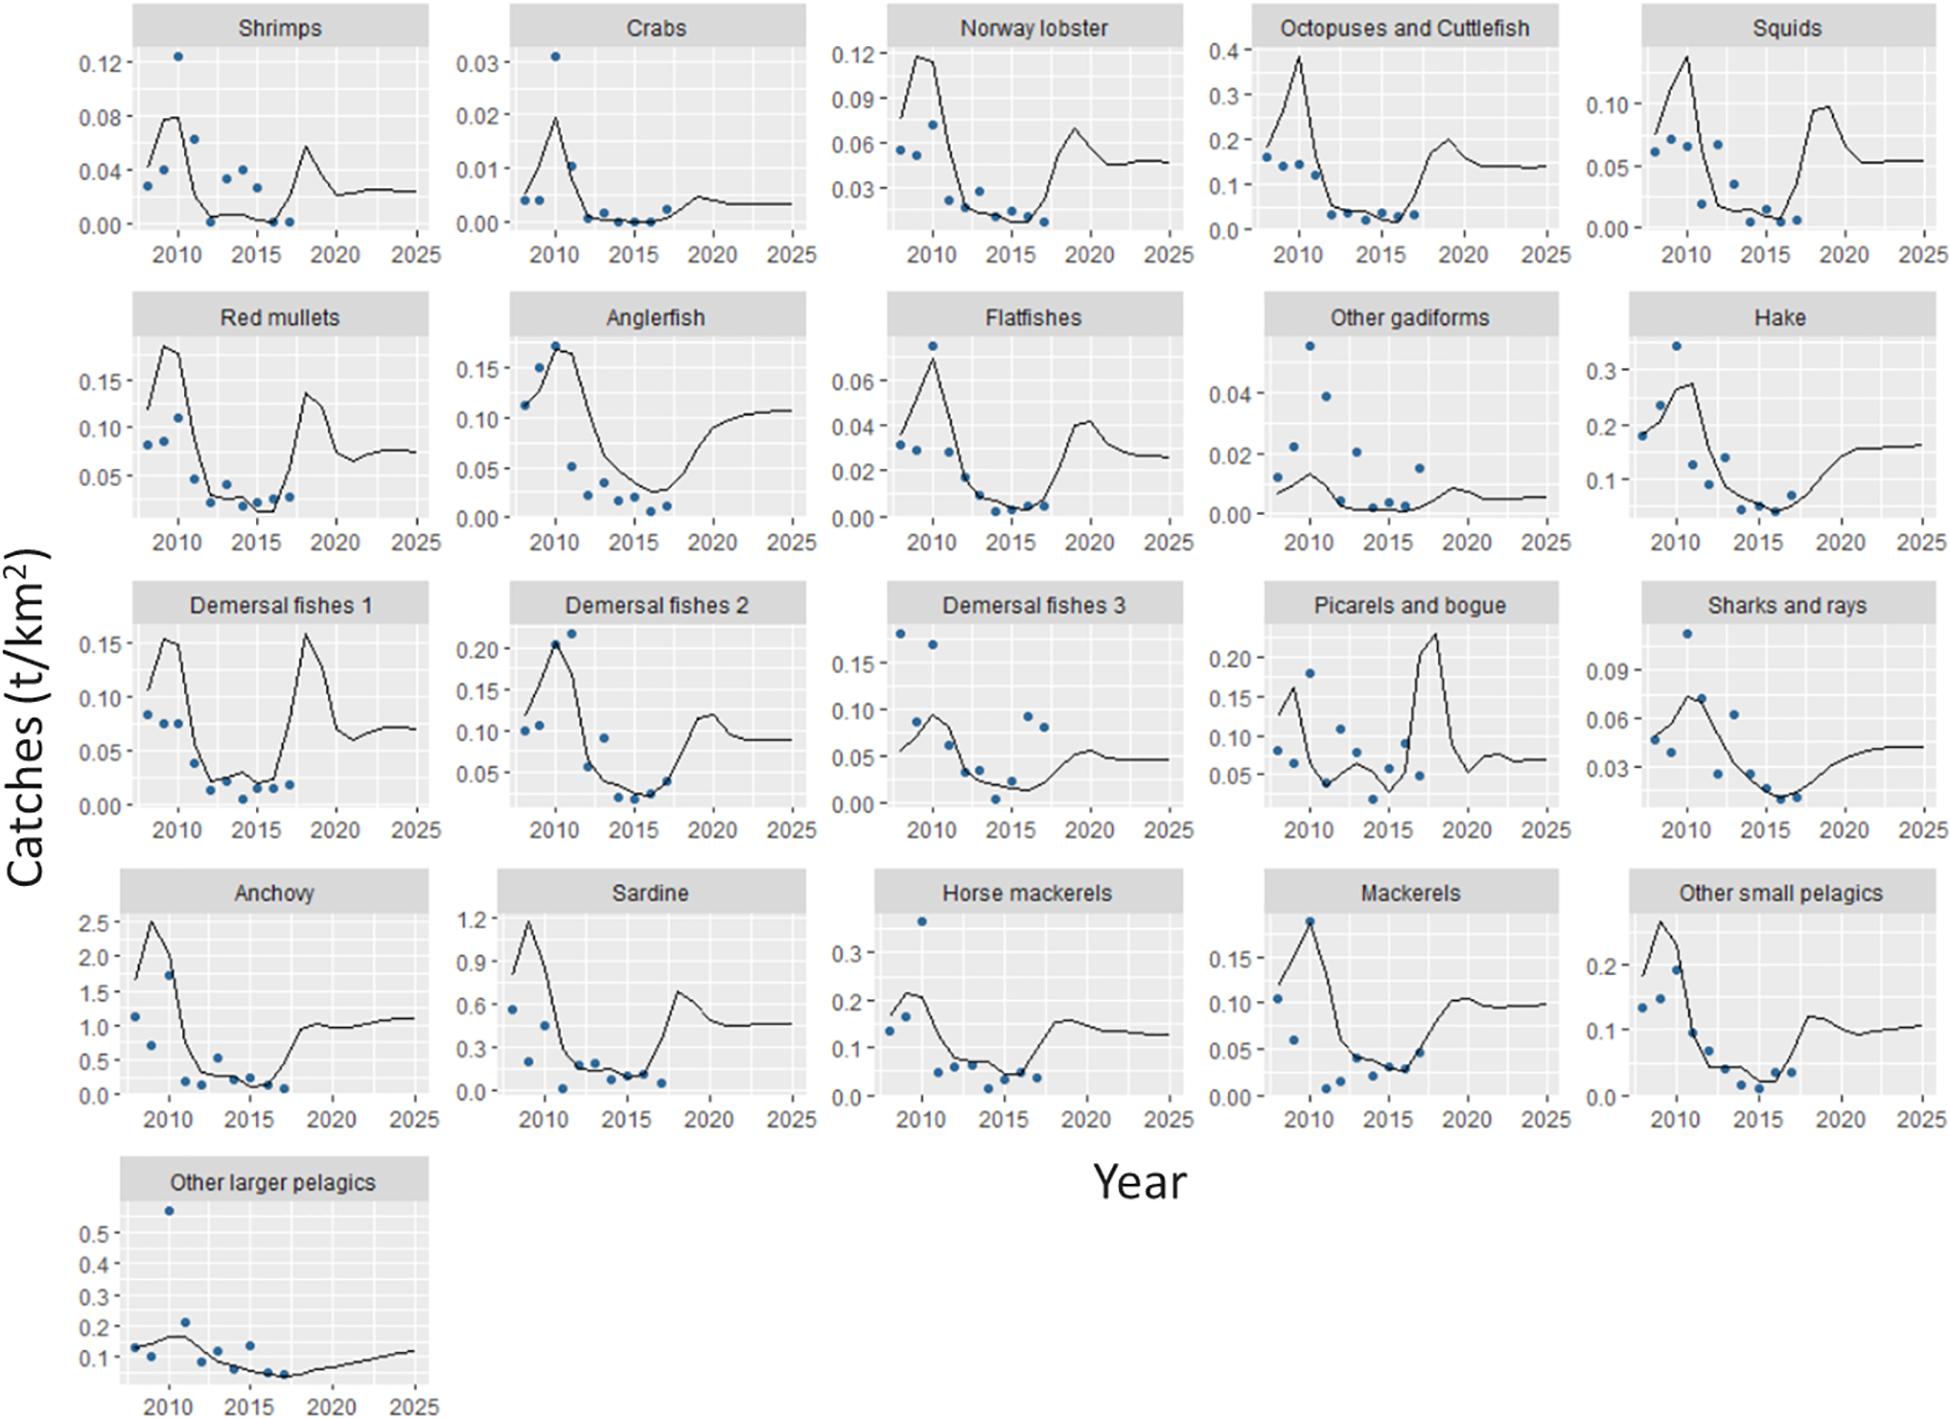
Figure 6. Catches predicted by the Ecosim model (lines) for each functional group of Pagasitikos Gulf from 2008 to 2025, in comparison to reconstructed official catches (points) (based on Moutopoulos and Stergiou, 2012).
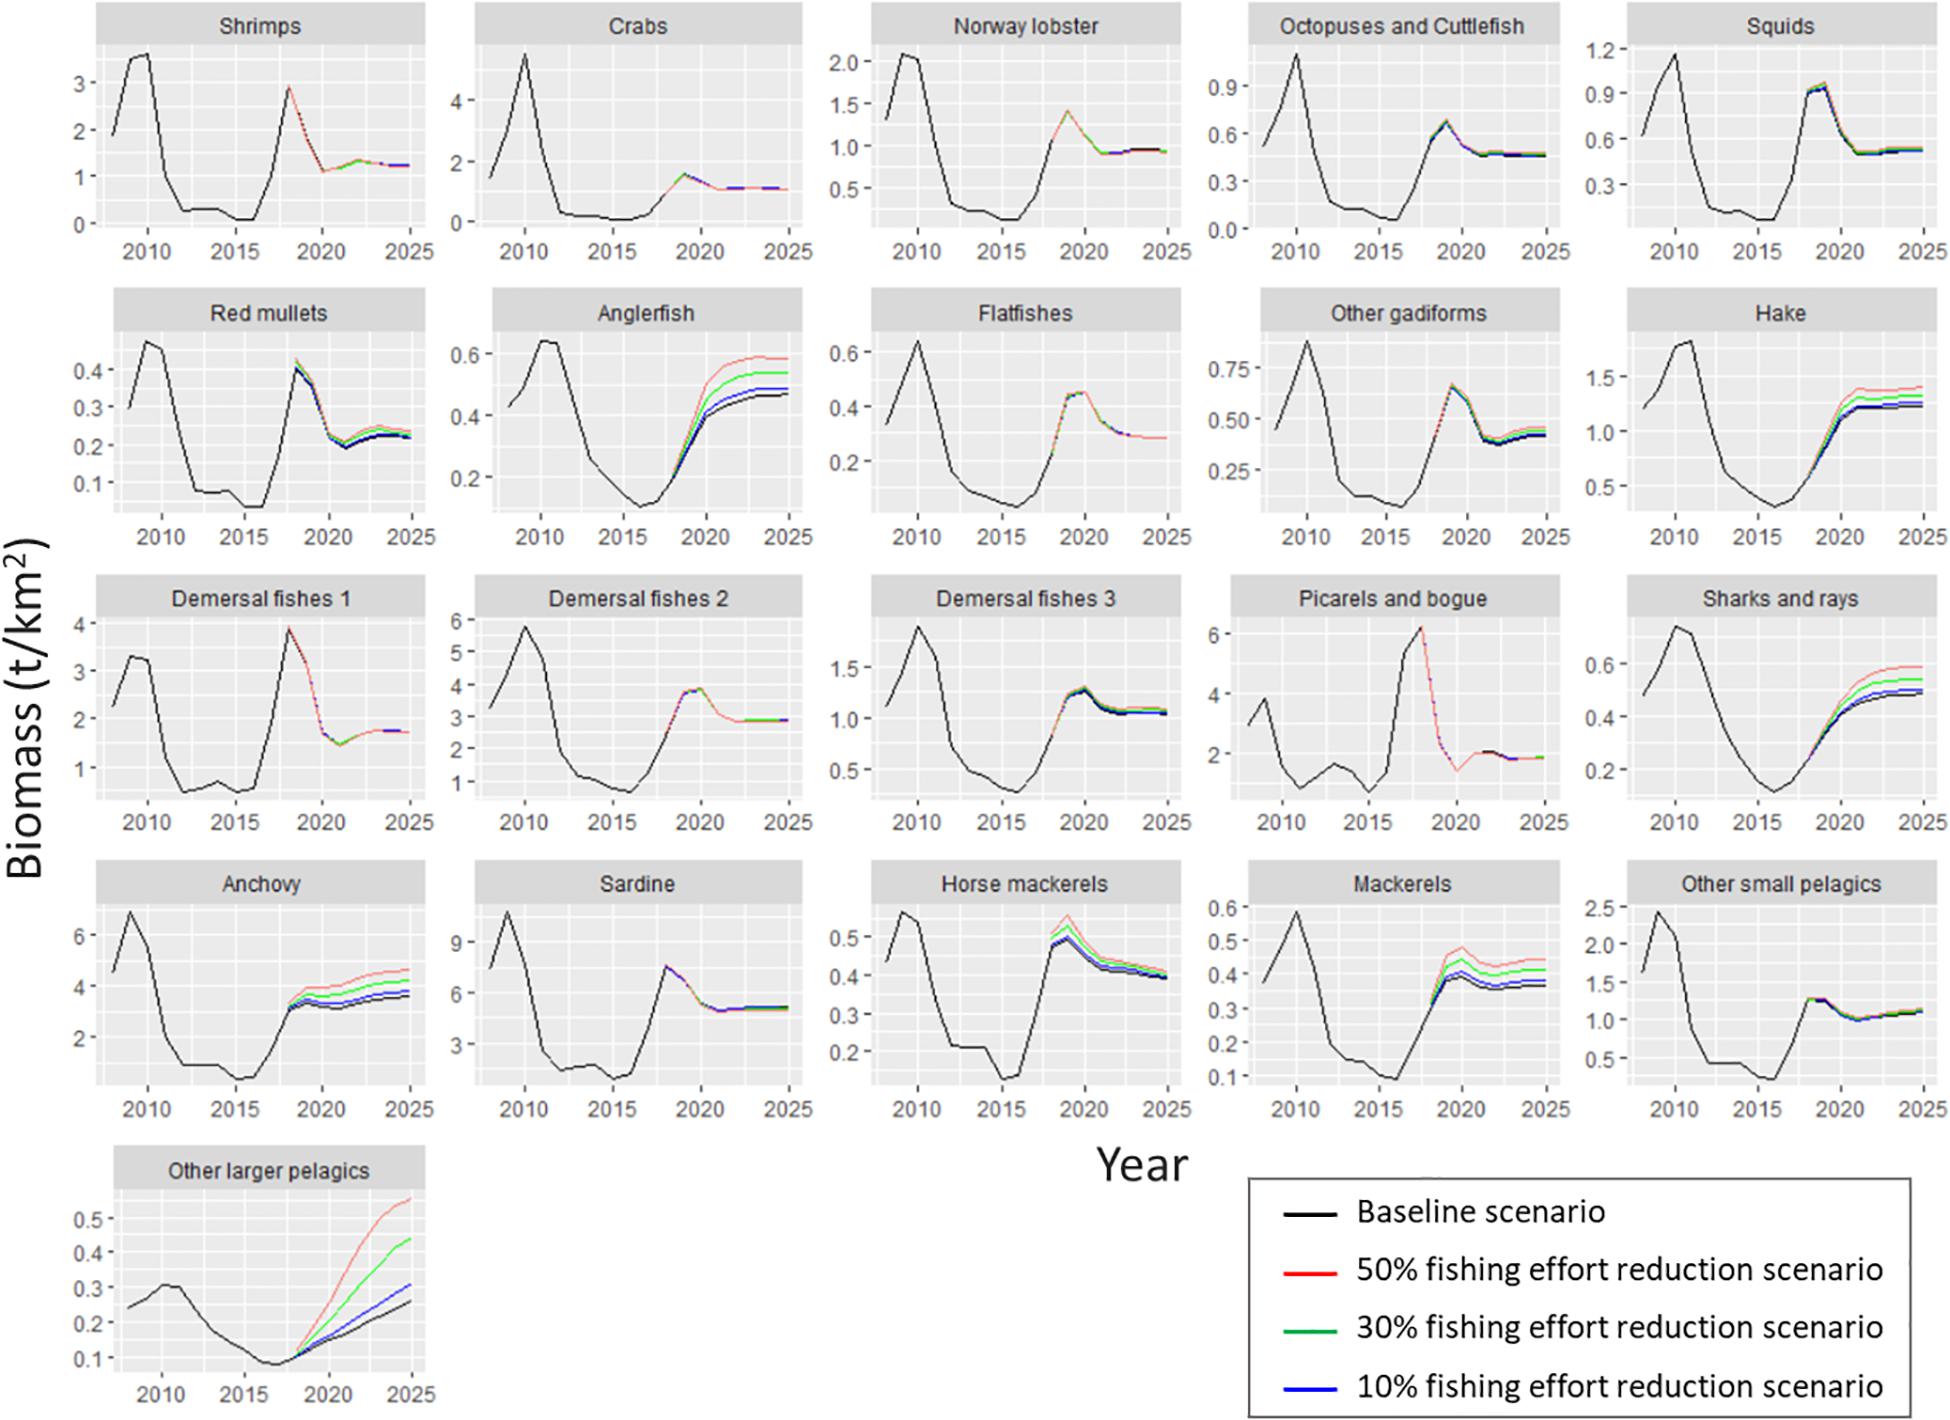
Figure 7. Biomass predicted by the Ecosim model for each functional group of Pagasitikos Gulf from 2008 to 2025, according to the business as usual scenario (black line) and three scenarios of reduced fishing effort by 10% (blue), 30% (green), and 50% (red).
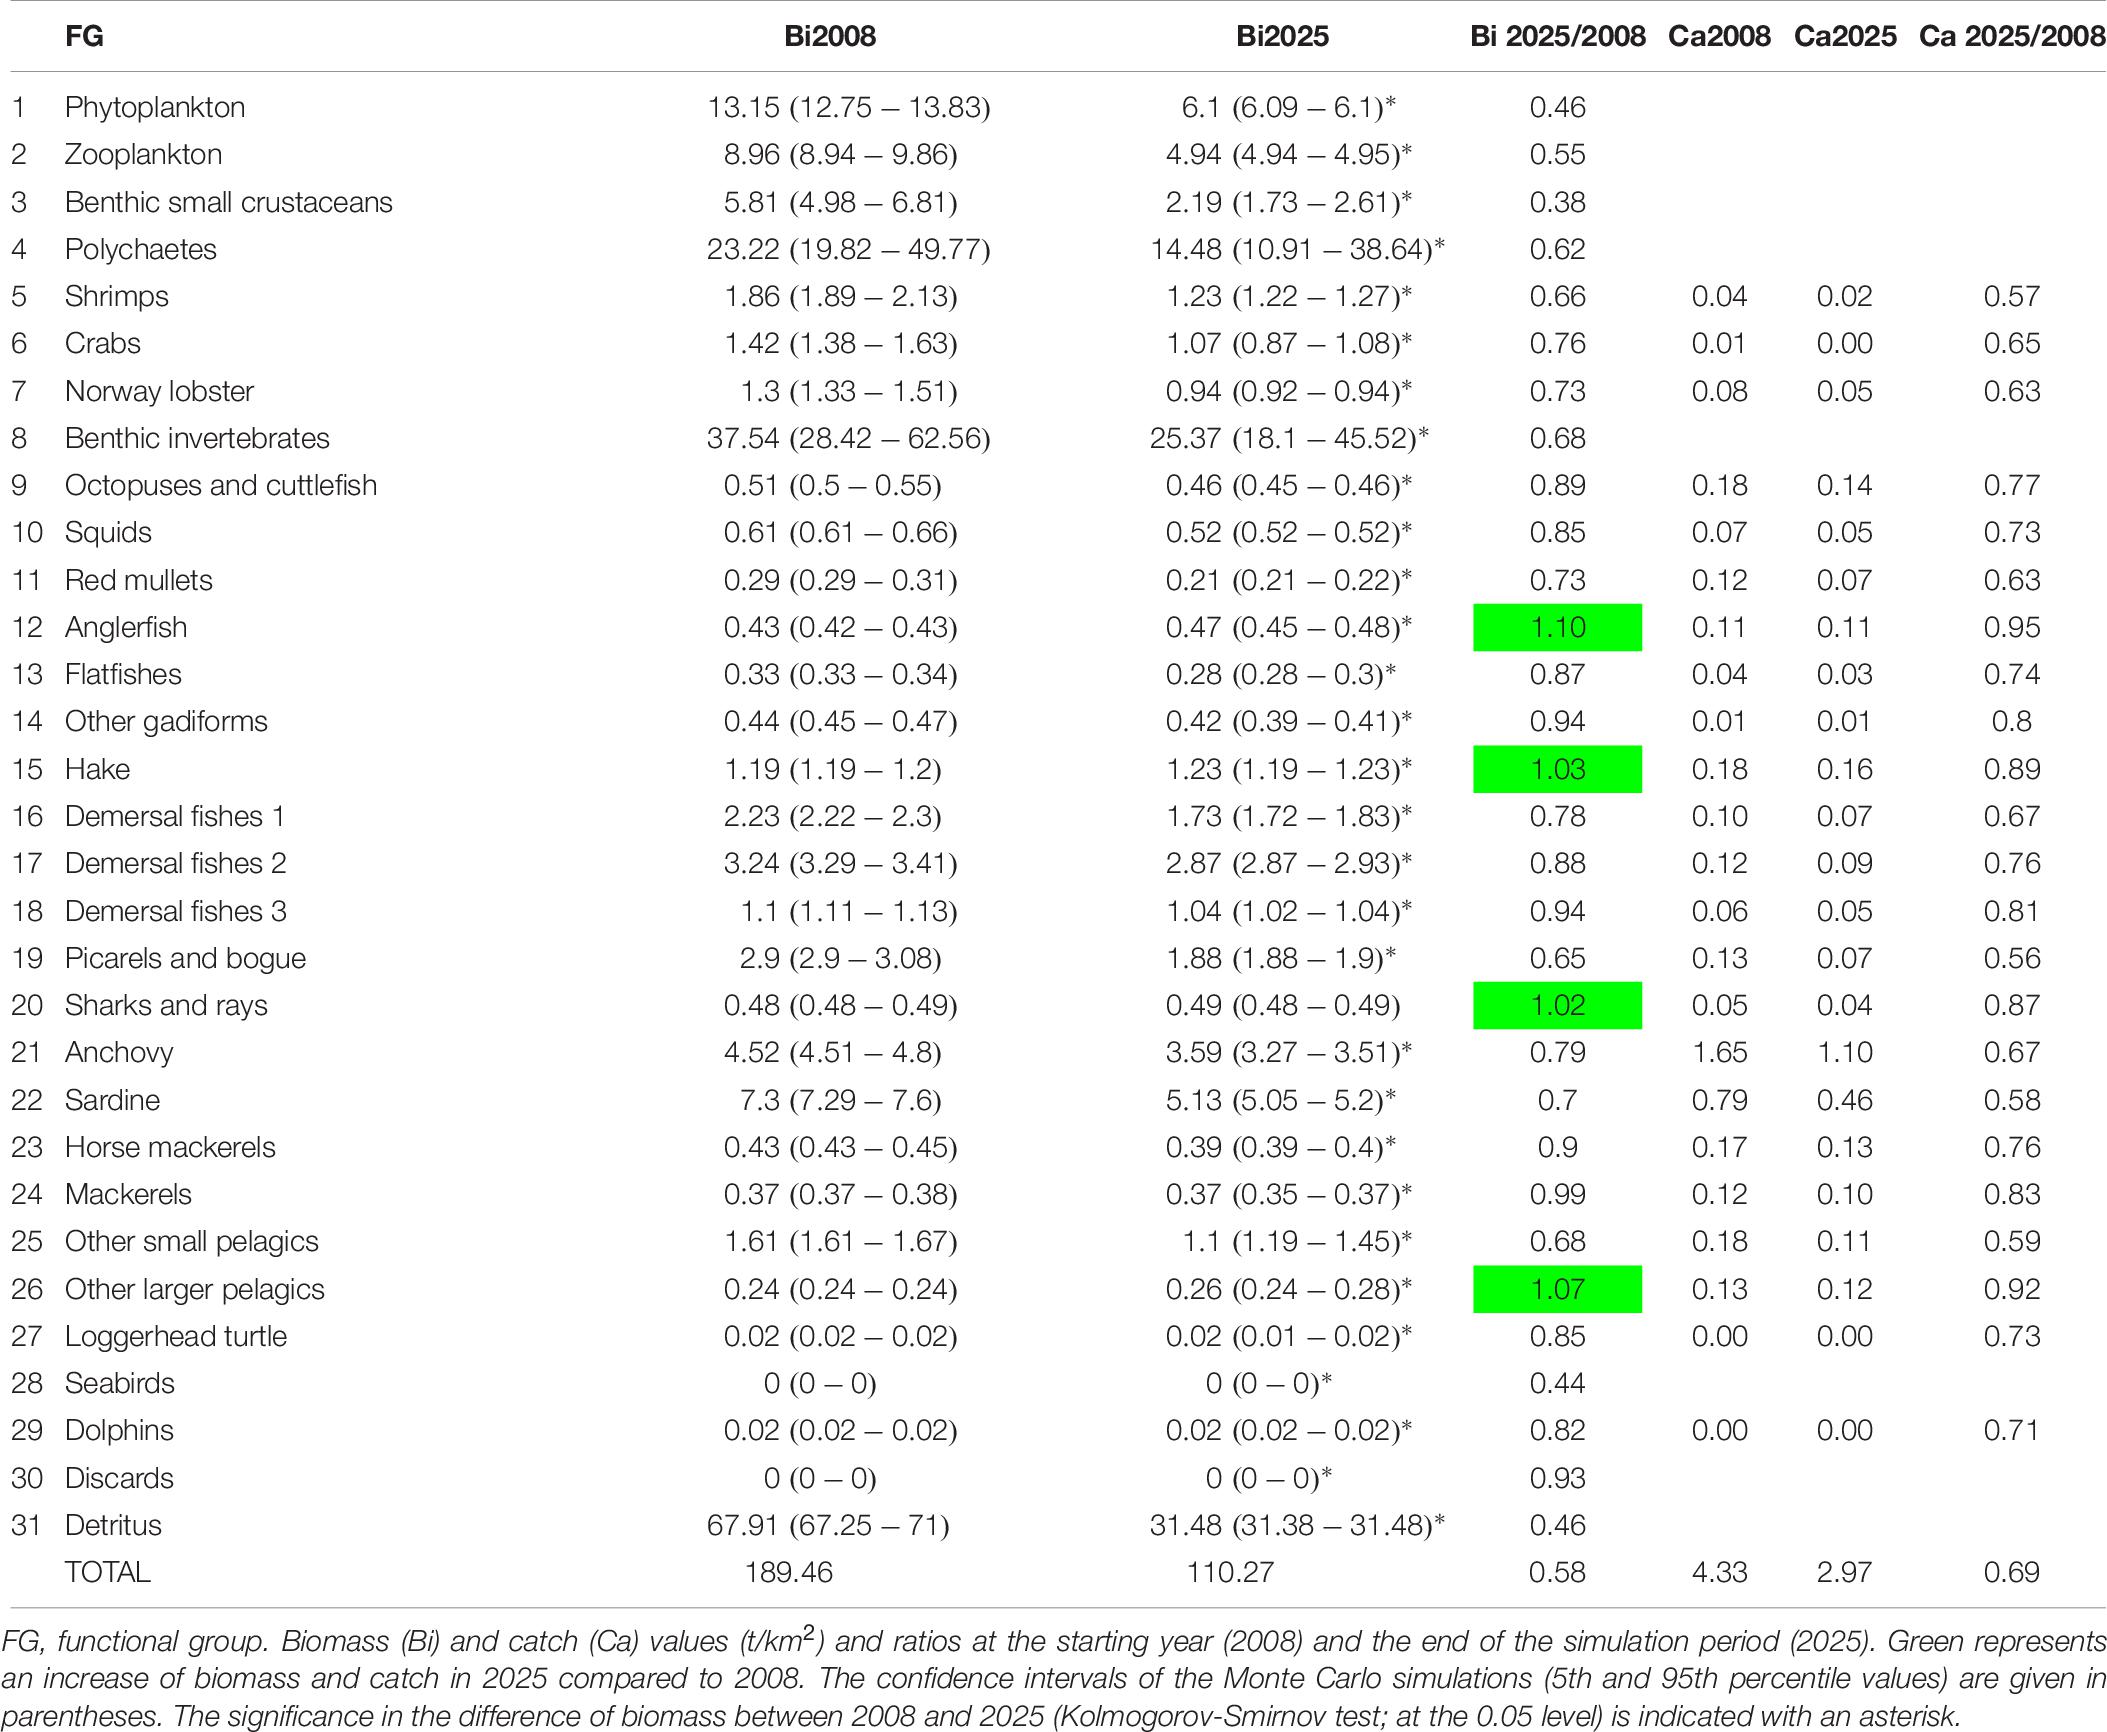
Table 6. Ecosim simulation results for Pagasitikos Gulf for the scenario 0: business-as-usual.
Sensitivity of Ecosim’s outputs to Ecopath input parameters was tested with the Monte Carlo approach. Twenty Monte Carlo trials based on a coefficient of variation (CV) around the input parameters for biomass, P/B, Q/B, EE (Supplementary Table A6) gave 20 different outcomes for each FG, with flatfishes being presented here as an example (Figure 8). As noted by Steenbeek et al. (2018) – Supplementary File 3, about half of the Monte Carlo simulation trials are accepted and result in alternate mass-balanced Ecopath models that can then be used for Ecosim to run. In line with this, the Monte Carlo simulations failed when all of the parameters were perturbed. Hence, the most certain, according to the pedigree, input values for biomass, P/B and Q/B were not changed (CV = 0), while for the less certain ones, as well as those of FGs with high relative impact and keystoneness in the ecosystem (zooplankton, demersal fishes 2, squids, and other gadiforms), the CV was obtained from the quality of the data as defined in the pedigree routine (Supplementary Table A4). The CV used for EE was 0.1. The CVs ranged from 0.05 (which translates into a 10% change around the mean initial value of the parameter) to 0.4 (which translates into an 80% change around the mean initial value of the parameter). None of the trials resulted in a model with lower sum of squares than the baseline model (SS = 172). The best statistical fit out of the 20 runs (SS = 179) was lower for flatfishes than the best estimate based on the AICc (baseline) until 2011 and higher until 2019, with flatfishes biomass being initially underestimated and subsequently overestimated by the model (Figure 8).
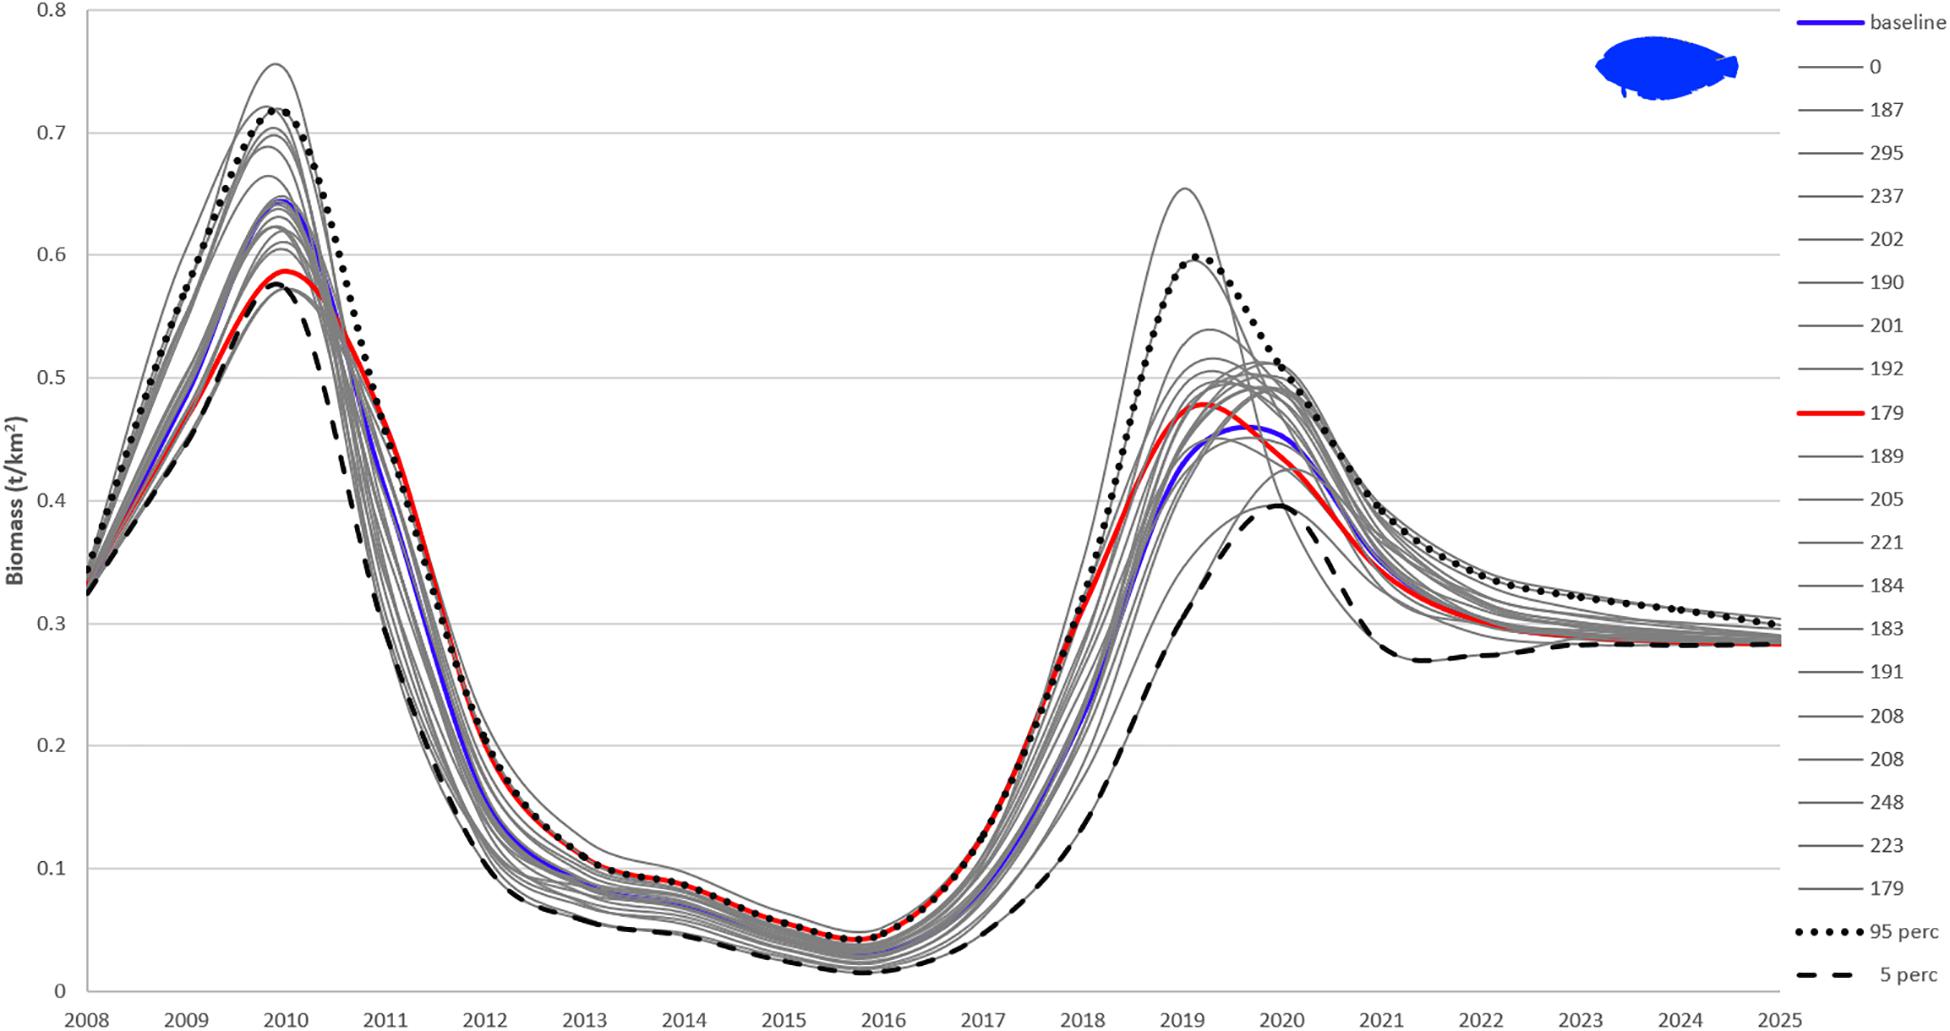
Figure 8. Twenty Monte Carlo simulations of flatfishes biomass with best fitted Pagasitikos model. The blue line (baseline) is the final best fitted model based on the AICc (sum of squares of 172), red line is the model with least sum of squares (179; still higher than the baseline), gray lines are the other 19 fits with legend values representing the final sum of squares for each trial. The 95 and 5% percentile values are also plotted.
As far as the examined scenarios of reduced fishing effort are concerned, all three of them resulted in higher total biomass compared to the basic Ecosim simulation (the higher the reduction in fishing effort, the higher the increase in biomass), while catches decreased as a result of less fishing effort (Table 7). Only the catches of other larger pelagics were predicted to increase in all three scenarios. The most profound biomass increase with reduced fishing effort was observed in the four predatory FGs (i.e., anglerfish, hake, sharks and rays and other larger pelagics), with other larger pelagics reaching a 114% biomass increase in Scenario 3 (Figure 7 and Table 7). Alongside them, the loggerhead sea turtle, anchovy and mackerels increased by 6.1, 5.6, and 4.1%, respectively, in Scenario 1; by 23.4, 17.1, and 12.2%, respectively, in Scenario 2; and 42.8, 29, and 20.9%, respectively, in Scenario 3. The biomass increase of the abovementioned predatory FGs in the predicted scenarios, led to a subsequent decrease in the biomass of prey FGs, such as shrimps, crabs, Norway lobster, demersal fishes 1, picarels and bogue and sardine thus resulting in a total biomass increase in the entire ecosystem of 0.4% in Scenario 1, 1.1% in Scenario 2 and 1.9% in Scenario 3 (Table 7).
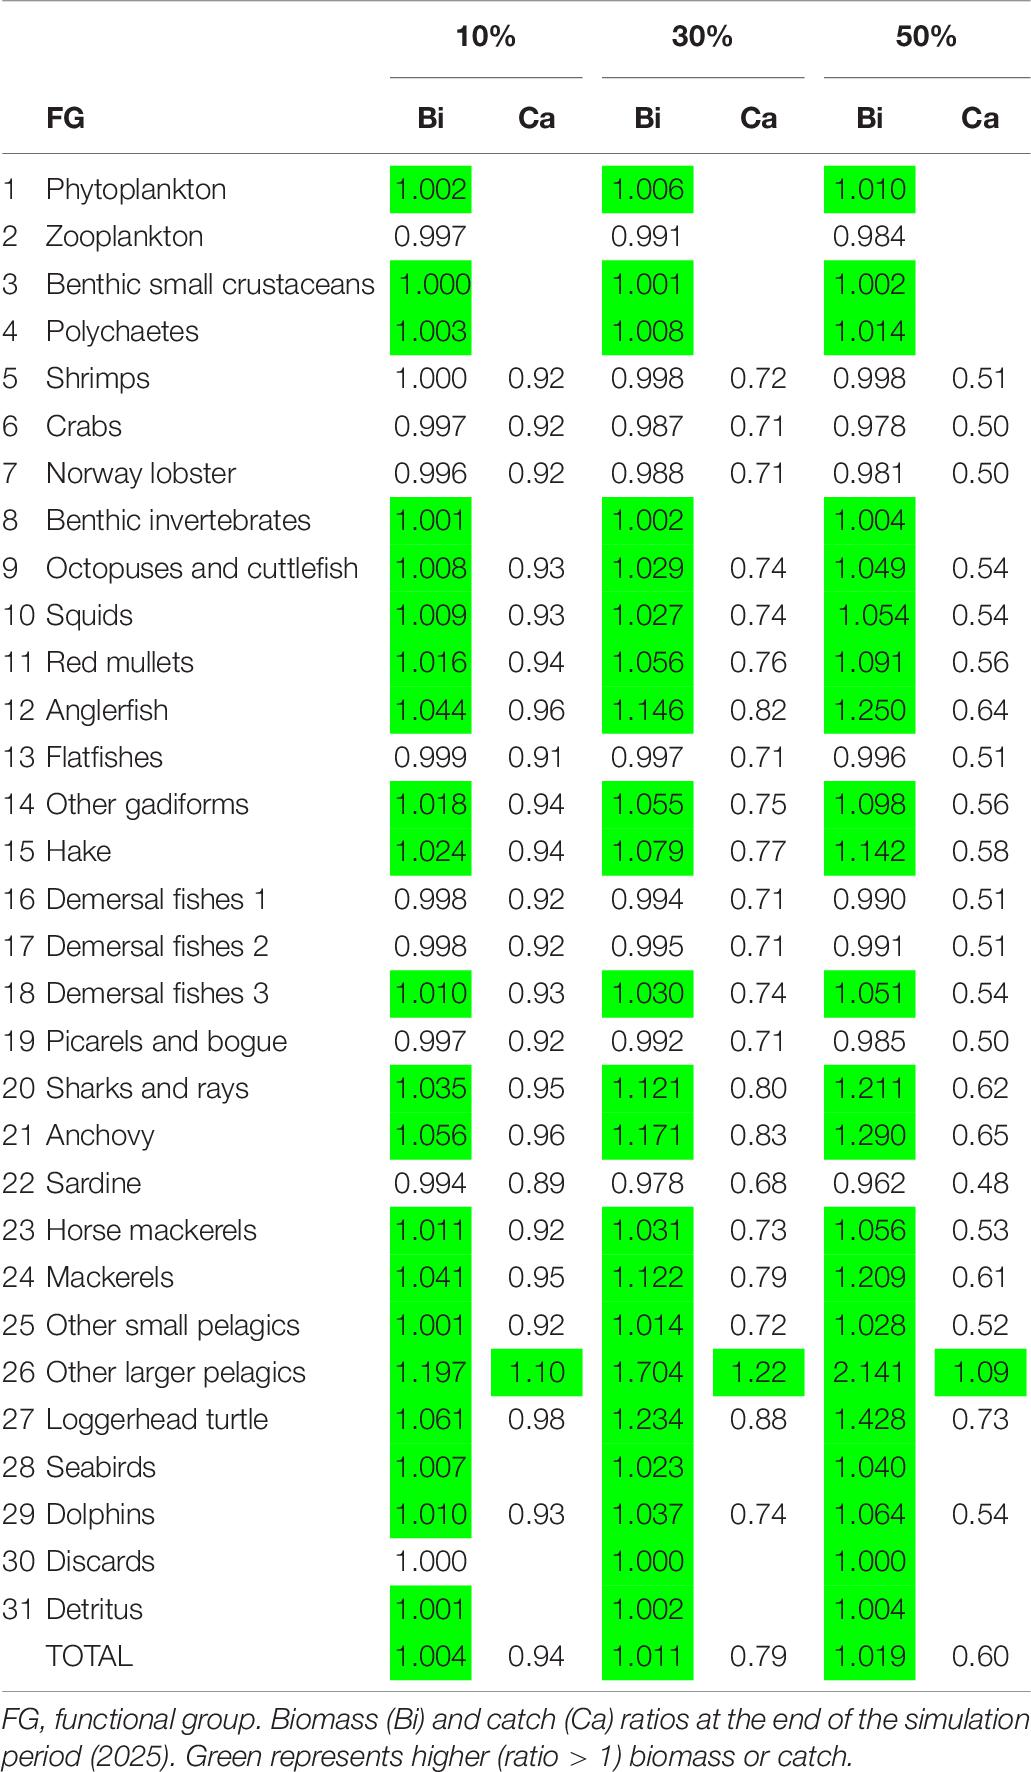
Table 7. Ecosim simulation results for Pagasitikos Gulf for three scenarios of fishing effort reduction by 10, 30, and 50% compared to the business-as-usual scenario.
Discussion
Shedding light on and understanding the particularities and variability of marine ecosystems to consequently be able to predict their future behavior plays a key role in the management of marine resources. The EwE model constructed for Pagasitikos Gulf utilizes at best the available biological and fisheries data to describe the food web structure and complex temporal dynamics of a semi-enclosed gulf in the Aegean Sea, Greece, thus adding to the modeled areas in the vicinity (Tsagarakis et al., 2010) and providing comparative ecosystem information for other coastal enclosed areas (Piroddi et al., 2016). We acknowledge that the lack of a complete biomass time series will add to the uncertainty of the model results, but we believe that ecosystem models are very helpful tools in fisheries data-poor areas where, apart from environmental forcing, fishing does remain an important driver of marine populations but only the catch composition and quantity time series are available. Semi-enclosed gulfs are special worth-studying systems, usually shallow and protected, concentrating significant urban and rural development that can disrupt ecosystem functioning due to nutrient overload (Petihakis et al., 2005) and since Pagasitikos Gulf has not been trawled for over 50 years what is evaluated here is the effect of less destructive fishing gears on marine populations and ecosystems. Pagasitikos Gulf is one of the least studied, in terms of fish and invertebrate abundance and population dynamics, marine ecosystems in Greece partly due to its exclusion from the MEDITS bottom trawl survey, which takes place every summer within the framework of the fisheries data collection program (Kallianiotis et al., 2004). Apart from the uncertainty arising from the lack of biomass time series, some uncertainty is associated with the input parameters used to balance the model, including consumption and production rates that were based on empirical equations.
The base model of Pagasitikos Gulf is of a medium-high quality (0.4–0.599) as expressed by its pedigree index of 0.53 which serves as a unique “quality footprint” (Morissette, 2007). The index allows for comparisons with other models even if those have been constructed with different number of trophic compartments (Christensen and Walters, 2004). The current model is shown to be of about the same quality as the model in Amvrakikos Gulf (Piroddi et al., 2016) and of lower quality compared to the ones in the NC Adriatic (Coll et al., 2007) and N Aegean Seas (Tsagarakis et al., 2010), mainly due to the production and consumption input values that were in many cases calculated from empirical relationships or taken from other models. Comparisons among Ecopath models require that the topology of the models is similar in terms of number of FGs, definition of primary producers and consumers, aggregation across trophic levels, top predator specification, presence or lack of microbial loop (Heymans et al., 2016), but also the level of fisheries exploitation and ecosystem characteristics are important. The Pagasitikos Gulf model was compared with two other models in the Mediterranean Sea that examined similar hypotheses acknowledging that some of the differences may be partly attributed to the inherent uncertainty in ecosystem models, differences in model topology and the different characteristics of the modeled areas.
According to the summary statistics that describe the studied ecosystem as a whole, Pagasitikos Gulf is shown to be an immature system with high system production, far from zero, exceeding respiration (Christensen et al., 2005) probably as a result of the intense fishing pressure exerted on stocks by purse seiners and coastal vessels. Although still high, Pagasitikos Gulf presents the lowest value for system production compared to the other models (NC Adriatic: Coll et al., 2007; N Aegean: Tsagarakis et al., 2010), something that could possibly be attributed to towed gears not operating in the area for over 50 years, as it has been shown that prohibiting fishing with towed gears is likely to lead in change from disturbed to mature ecosystems in terms of bottom complexity, as well as benthos and fish species composition (Watling and Norse, 1998).
The keystone species indicator revealed the high ecological importance of high trophic level organisms, such as other gadiforms and squids, which is indicative of an ecosystem less severely impacted by overfishing (Coll et al., 2009a). However, the absence or low biomass of marine mammals, reptiles, seabirds and sharks from the area shows that, even without trawling, the coastal areas of the Mediterranean are still suffering from historical overexploitation (Lotze et al., 2006), which has caused early food web changes by releasing prey from predation, and are dominated by medium demersal and pelagic fishes, medium and small sharks and rays (Coll et al., 2009a). The ecological importance of squids, which feed upon sardines and anchovies and are mainly responsible for consuming the largest proportion of exploited resources in Pagasitikos Gulf, has been previously highlighted in other models of the Mediterranean Sea (Adriatic Sea: Coll et al., 2007; N Aegean Sea: Tsagarakis et al., 2010).
The decreasing biomass of most FGs by the end of the simulation period (2025) in the baseline business-as-usual (Scenario 0) continues from the previous declining trend, is related to the ongoing fisheries exploitation pattern in the area and agrees with the general trends for those species in the Aegean Sea (Tsikliras et al., 2013; Froese et al., 2018). Anchovy and sardine that are exploited by purse seiners across Greek waters, account for the vast majority of landings in the northern Aegean Sea and Pagasitikos Gulf (Stergiou et al., 2007), with their abundance also related to climate forcing (Alheit et al., 2014; Tsikliras et al., 2019). Norway lobster is a prime catch of the coastal fleet (netters and potters) and because of its high commercial value it is exploited throughout the year in Pagasitikos Gulf. Netters and potters are heavily competing in the race for Norway lobsters and their intense rivalry has caused the decline in biomass (hence catches) and somatic length of the stock in the area (EPAL, 2008). The biomass decline of most targeted demersal stocks was the main trend of similar models in the South Catalan Sea (Coll et al., 2008) and the Adriatic Sea (Coll et al., 2009b) and was attributed mainly to fishing but also to climate/environmental forcing that degraded these ecosystems.
In the northeastern Ionian Sea (Piroddi et al., 2010) the decline of fish resources was mainly caused by the intensive fishing pressure that occurred in the area until the end of the 1990s and also by changes in primary production that impacted the trajectories of the main FGs. Although environmental drivers played an important role in the fitting of the Pagasitikos Gulf model to historical catch time series, as similarly observed and presented in the study of Alexander et al. (2015), the simulated primary production trajectory could not be correlated with available known climatic environmental drivers in the present study. It can be hypothesized that the primary production anomaly estimated by the model may encompass interactions of various types of primary producers or the microbial loop, compartments not explicitly included in the present model (Alexander et al., 2015). Also, as primary production dynamics are not shaped by a single environmental factor but rather by a combination of factors, it is possible that the identified anomaly does not represent well these dynamics in the studied system. Salinity, river discharges or nutrients could also be playing a more important role locally and affect enclosed ecosystems, such as Pagasitikos Gulf, more compared to large-scale climatic oscillations such as AMO and NAO, but no time series data were available for those parameters in the study area. Indeed, as analyzed in Christensen et al. (2005), the process of estimating values of a primary production forcing function for the environmental anomalies in the studied ecosystem entails an inherent risk of obtaining a spurious temporal pattern that might not represent any real forcing. However, what one can say is “assuming that primary production was in fact variable and that this did cause changes in relative abundance throughout the food web, then our best estimate of the historical pattern of variation is the one obtained by the fitting procedure” (Christensen et al., 2005).
Measures to reduce overfishing and illegal fishing activities are needed together with the establishment of marine protected areas that will ensure prey survival required to sustain marine predators (Piroddi et al., 2010). In the N Aegean Sea (Tsagarakis et al., 2010), the five artisanal and industrial fishing fleets operating in the area had high impact on vulnerable species and numerous targeted groups while several exploitation indices highlighted that the ecosystem was highly exploited and unlikely to be sustainably fished. In Pagasitikos Gulf it appears that the small-scale coastal fisheries have a stronger negative impact on different FGs of the ecosystem (the impacted groups included target species such as anglerfish and red mullets, but also marine mammals and reptiles) compared to purse seiners that target only small and medium pelagic fishes. Indeed, despite the higher overall contribution of the purse-seining fleet to the national landings compared to all other gears (Stergiou et al., 2007), in Pagasitikos Gulf the catches of the small-scale fleet (1.676 t/km2/year) exceed those of purse seiners (1.380 t/km2/year) highlighting the impact of the small-scale fisheries on the ecosystem.
A marginal increase in biomass was observed in four top predator FGs (anglerfish, hake, sharks and rays, and other larger pelagics); however, the difference for sharks and rays was not statistically significant. Anglerfish and hake are targeted by coastal vessels using nets, while sharks (many large sharks are protected and absent from Pagasitikos Gulf) and rays are usually part of the by-catch, as in many areas of the world (Molina and Cooke, 2012) and discarded. However, the predation upon those high trophic level FGs in the area is minimum and the incorporation of trophic interrelations in the model besides fishing pressure (Heymans et al., 2016) may explain their biomass increase in Scenario 0.
All models are simplifications of reality that have an inherent level of uncertainty related to the quality of the input data and should therefore be treated and analyzed accordingly (Steenbeek et al., 2018). As EwE model predictions are generally more sensitive to biomass and production rate input data (Essington, 2007), the lack of a time series of biomass data and the reliance only on catch data in this work increases uncertainty and may limit confidence to model results. However, despite their uncertainty, ecosystem models together with some data-limited approaches that require only catch data (e.g., CMSY: Froese et al., 2018) can be used to evaluate stock status and the effect of fishing on marine populations in data-poor areas, such as Pagasitikos Gulf, where the lack of biomass and CPUE time series will not allow for the assessment through age based or surplus production models. The Monte Carlo routine in EwE assessed the sensitivity of the Ecosim outputs to the underlying Ecopath input parameters and provided a useful image of the range of possible outputs based on the uncertainty around the input data (Heymans et al., 2016) as shown by the 5th and 95th percentile values plotted (Figure 8), thus giving a better understanding of the reliability of the model predictions. Despite the several alternative outputs that may overestimate or underestimate FG abundance, the chosen model was shown to be the best statistical fit with the lowest sum of squares.
The results of Ecosim simulations with decreasing fishing effort comply with the general and common sense rule that less biomass removal by fishing will eventually lead to biomass increase in the sea and stock rebuilding (Froese et al., 2018). It is not argued that the future projections provide absolute quantitative information, but rather an idea of the ecosystem status relative to the past conditions. In the absence of the primary production anomaly in future projections (Heymans et al., 2016), the fishing scenarios indicate the direction of change that is related to fishing and a relative magnitude of this change. Nevertheless, given the contribution of the primary production anomaly in fitting the model to the data during the calibration period, the results regarding the importance of fishing may be modified by environmental factors.
Indeed, the biomass of most FGs that are targeted by both fleets operating in Pagasitikos Gulf increased in all scenarios and the increase was higher for top predators that are not preyed upon in the area and lower for medium to low trophic FGs that are preys for both natural predators and anthropogenic activities. The peculiarity of the lack of bottom trawling in the area complicates the comparison with other ecosystems where trawling is the main biomass removing method and has the highest impact on marine populations and ecosystems (Coll et al., 2007; Hattab et al., 2013). In any case, the main output of no-fishing or decreased fishing effort scenarios in all models always leads to higher biomass of targeted species and decrease in catches. In the South Catalan Sea (Coll et al., 2009a), the no-fishing scenario resulted in biomass increase of higher trophic levels whereas the trophic level of the same groups was substantially lower in exploited food webs. In the northern Gulf of Mexico (Geers et al., 2016), any increase in fishing effort would result in biomass declines and increase of catches leading the ecosystem to immaturity, whereas the decrease in effort resulted in slight increases in overall biomass and substantial decreases in catches. In the coast of Israel (Corrales et al., 2018), fishing effort reductions resulted in significant increasing trends for most ecological indicators including total biomass, invertebrate biomass, predatory biomass and total catch but the trends for individual FGs were mixed because of their interactions and climate effects. There are cases, however, of enclosed areas that are heavily affected by environmental forcing and the impact of fishing is moderate to minor. For example, in Amvrakikos Gulf, which is another semi-enclosed embayment in the Mediterranean Sea sharing morphological similarities with Pagasitikos Gulf, the exact same pattern of how much fishing or the environment improve the fit during the fitting procedure was observed: it was the combination of environmental drivers (mainly riverine input) and trophic interactions that explained the majority of ecosystem variability, with fishing marginally contributing, leading to a degradation of the demersal parts of the food web and a relative stability of the pelagic ones (Piroddi et al., 2016). Similar results have been published in other models (e.g., Coll et al., 2009b, Adriatic Sea) but the effect of each combination to the fitting of the model differs owing to differences in ecosystems, environmental drivers and fishing pressure (Alexander et al., 2015).
The number of vessels has been gradually declining in Greece during the last decade as a result of a retirement of vessels and fishers due to ageing and to a lesser extent as a side effect of the economic crisis that has led to stricter taxation of the fishers (Machias et al., 2016). Despite the retirement of the fleet, the actual fishing effort has remained unchanged if not increased, following the global trend (Anticamara et al., 2011), but also due to technological creep (Marchal et al., 2006). Therefore, although these scenarios may reflect the future of the fishing fleet in terms of numbers, they cannot encompass the true dynamics of the fleet and fisheries in Pagasitikos Gulf and Greek Seas in general. For that reason, in some cases, fishing effort restrictions, the main fisheries management enforcement tool in the Greek Seas (Stergiou et al., 2016), should be complemented with spatial effort closures in essential fish habitats. Spatial effort constraints through the establishment of marine protected areas or spatial fisheries restrictions (Dimarchopoulou et al., 2018) may also have beneficial results in terms of biomass increase and ecosystem function (Fouzai et al., 2012; Abdou et al., 2016).
With the present study, we confirm that stock biomass is shown to increase when fishing effort is reduced, as in all fishing pressure reduction scenarios, the biomass of the FGs increased proportionally to the magnitude of reduction and the catches decreased accordingly. Consequently, in the absence of quotas in the Mediterranean Sea, effort control is the main management tool (Stergiou et al., 2016). Indeed, all recent stock assessments in the Mediterranean Sea suggest that the bad status of most stocks and their declining catches are the results of excessive fishing and clearly suggest that a decrease in fishing mortality to MSY levels is required for the stocks to rebuild (Colloca et al., 2013; Froese et al., 2018). Addressing the negative effects of overfishing through taking measures on reducing exploitation levels has been shown to not only rebuild stocks but also lead to higher catches over time, with considerably higher profits for the fishers in the medium term (Froese et al., 2018). Nevertheless, the urgency of modifying the current behavior of overfishing is pointed out by the fact that the reflection of rebuilding on catches, and thus income for the fishers, takes longer than rebuilding itself. Also, the trophic interactions among and within FGs will not allow biomass to be maximized at the same time for all ecosystem components, while environmental drivers should also be carefully considered, especially in enclosed ecosystems. In any case, effort reduction is the very first step toward sustainability once biomass declines as a result of excessive effort have been noticed.
Data Availability Statement
Publicly available datasets were analyzed in this study. This data can be found here: https://www.statistics.gr/en/statistics/-/publication/SPA03/-.
Author Contributions
DD collected the data, created the ECOPATH model, performed ECOSIM simulations, and wrote the manuscript. IK prepared the ECOSIM model. KT created the ECOPATH model, performed ECOSIM simulations, and drafted the manuscript. AT wrote the manuscript.
Funding
This work was partially supported by the European DG-MARE funded project “PROTOMEDEA” (Contract No. SI2.721917) and by the H2020 project “ODYSSEA” (Contract No. 727277).
Conflict of Interest
The authors declare that the research was conducted in the absence of any commercial or financial relationships that could be construed as a potential conflict of interest.
Acknowledgments
The authors would like to thank the editor VR for handling this manuscript and the two reviewers for their helpful comments which improved this work.
Supplementary Material
The Supplementary Material for this article can be found online at: https://www.frontiersin.org/articles/10.3389/fmars.2019.00648/full#supplementary-material
Footnotes
References
Abdou, K., Halouani, G., Hattab, T., Romdhane, M. S., Lasram, F. B. R., and Le Loc’h, F. (2016). Exploring the potential effects of marine protected areas on the ecosystem structure of the gulf of gabes using the ecospace model. Aquat. Living Resour. 29:202. doi: 10.1051/alr/2016014
Alexander, K. A., Heymans, J. J., Magill, S., Tomczak, M., Holmes, S. J., and Wilding, T. A. (2015). Investigating the recent decline in gadoid stocks in the west of Scotland shelf ecosystem using a foodweb model. ICES J. Mar. Sci. 72, 436–449. doi: 10.1093/icesjms/fsu149
Alheit, J., Licandro, P., Coombs, S., Garcia, A., Giraldez, A., Santamaria, M. T. G., et al. (2014). Atlantic multi-decadal oscillation (AMO) modulates dynamics of small pelagic fishes and ecosystem regime shifts in the eastern North and Central Atlantic. J. Mar. Syst. 131, 21–35. doi: 10.1016/j.jmarsys.2013.11.002
Anticamara, J. A., Watson, R., Gelchu, A., and Pauly, D. (2011). Global fishing effort (1950–2010): trends, gaps, and implications. Fish. Res. 107, 131–136. doi: 10.1016/j.fishres.2010.10.016
Aqua-MODIS (2019). Moderate-Resolution Imaging Spectroradiometer (MODIS) Aqua Sea Surface Temperature Dataset. Available at: https://oceancolor.gsfc.nasa.gov/cgi/l3 (accessed August, 2019).
Caragitsou, E., Siapatis, A., and Anastasopoulou, A. (2001). Seasonal structure of fish larvae assemblages in the Pagasitikos Gulf (Greece). Rapport de la Commission Internationale pour l’Exploration Scientifique de la Mer Mediterranee 36:250.
Christensen, V., and Pauly, D. (1992). ECOPATH II—a software for balancing steady-state ecosystem models and calculating network characteristics. Ecol. Modell. 61, 169–185. doi: 10.1016/0304-3800(92)90016-8
Christensen, V., and Walters, C. J. (2004). Ecopath with ecosim: methods, capabilities and limitations. Ecol. Modell. 172, 109–139. doi: 10.1016/j.ecolmodel.2003.09.003
Christensen, V., Walters, C. J., and Pauly, D. (2005). Ecopath with Ecosim: a User’s Guide, 2005 Edn. Vancouver, BC: Fisheries Centre, 154.
Climatic Research Unit University of East Anglia [CRU-UEA], (2019). Mediterranean Oscillation Indices Dataset. Available at: https://crudata.uea.ac.uk/cru/data/moi/moi2.output.dat
Coll, M., and Libralato, S. (2012). Contributions of food web modelling to the ecosystem approach to marine resource management in the Mediterranean Sea. Fish Fish. 13, 60–88. doi: 10.1111/j.1467-2979.2011.00420.x
Coll, M., Navarro, J., and Palomera, I. (2013). Ecological role, fishing impact, and management options for the recovery of a Mediterranean endemic skate by means of food web models. Biol. Conserv. 157, 108–120. doi: 10.1016/j.biocon.2012.06.029
Coll, M., Palomera, I., and Tudela, S. (2009a). Decadal changes in a NW Mediterranean Sea food web in relation to fishing exploitation. Ecol. Modell. 220, 2088–2102. doi: 10.1016/j.ecolmodel.2009.04.049
Coll, M., Santojanni, A., Palomera, I., and Arneri, E. (2009b). Food-web changes in the Adriatic Sea over the last three decades. Mar. Ecol. Progr. Ser. 381, 17–37. doi: 10.3354/meps07944
Coll, M., Palomera, I., Tudela, S., and Dowd, M. (2008). Food-web dynamics in the South Catalan Sea ecosystem (NW Mediterranean) for 1978–2003. Ecol. Modell. 217, 95–116. doi: 10.1016/j.ecolmodel.2008.06.013
Coll, M., Santojanni, A., Palomera, I., Tudela, S., and Arneri, E. (2007). An ecological model of the Northern and Central Adriatic Sea: analysis of ecosystem structure and fishing impacts. J. Mar. Syst. 67, 119–154. doi: 10.1016/j.jmarsys.2006.10.002
Colléter, M., Valls, A., Guitton, J., Gascuel, D., Pauly, D., and Christensen, V. (2015). Global overview of the applications of the Ecopath with Ecosim modeling approach using the EcoBase models repository. Ecol. Modell. 302, 42–53. doi: 10.1016/j.ecolmodel.2015.01.025
Collie, J. S., Botsford, L. W., Hastings, A., Kaplan, I. C., Largier, J. L., Livingston, P. A., et al. (2016). Ecosystem models for fisheries management: finding the sweet spot. Fish Fish. 17, 101–125. doi: 10.1111/faf.12093
Colloca, F., Cardinale, M., Maynou, F., Giannoulaki, M., Scarcella, G., Jenko, K., et al. (2013). Rebuilding Mediterranean fisheries: a new paradigm for ecological sustainability. Fish. Fish. 14, 89–109. doi: 10.1111/j.1467-2979.2011.00453.x
Corrales, X., Coll, M., Ofir, E., Heymans, J. J., Steenbeek, J., Goren, M., et al. (2018). Future scenarios of marine resources and ecosystem conditions in the Eastern Mediterranean under the impacts of fishing, alien species and sea warming. Sci. Rep. 8:14284. doi: 10.1038/s41598-018-32666-x
Corrales, X., Coll, M., Ofir, E., Piroddi, C., Goren, M., Edelist, D., et al. (2017a). Hindcasting the dynamics of an Eastern Mediterranean marine ecosystem under the impacts of multiple stressors. Mar. Ecol. Progr. Ser. 580, 17–36. doi: 10.3354/meps12271
Corrales, X., Ofir, E., Coll, M., Goren, M., Edelist, D., Heymans, J. J., et al. (2017b). Modeling the role and impact of alien species and fisheries on the Israeli marine continental shelf ecosystem. J. Mar. Syst. 170, 88–102. doi: 10.1016/j.jmarsys.2017.02.004
Dimarchopoulou, D., Dogrammatzi, A., Karachle, P. K., and Tsikliras, A. C. (2018). Spatial fishing restrictions benefit demersal stocks in the northeastern Mediterranean Sea. Sci. Rep. 8:5967. doi: 10.1038/s41598-018-24468-y
ELSTAT (2017). Hellenic Statistical Authority. Statistics on Sea Fisheries Per Year and Per Area. Available at: http://www.statistics.gr/en/statistics/-/publication/SPA03/ (accessed February, 2018).
EPAL (2008). Sustainable fishing support of Pagasitikos Gulf. Scientific monitoring. Final Report. Volos: University of Thessaly, 197.
Essington, T. E. (2007). Evaluating the sensitivity of a trophic mass-balance model (Ecopath) to imprecise data inputs. Can. J. Fish. Aquat. Sci. 64, 628–637. doi: 10.1139/f07-042
Fouzai, N., Coll, M., Palomera, I., Santojanni, A., Arneri, E., and Christensen, V. (2012). Fishing management scenarios to rebuild exploited resources and ecosystems of the Northern-Central Adriatic (Mediterranean Sea). J. Mar. Syst. 102–104, 39–51. doi: 10.1016/j.jmarsys.2012.05.003
Froese, R., and Pauly, D. (eds). (2019). FishBase. World Wide Web electronic publication. Available at: www.fishbase.org (accessed February, 2019).
Froese, R., Winker, H., Coro, G., Demirel, N., Tsikliras, A. C., Dimarchopoulou, D., et al. (2018). Status and rebuilding of European fisheries. Mar. Policy 93, 159–170. doi: 10.1016/j.marpol.2018.04.018
Geers, T. M., Pikitch, E. K., and Frisk, M. G. (2016). An original model of the northern Gulf of Mexico using Ecopath with Ecosim and its implications for the effects of fishing on ecosystem structure and maturity. Deep Sea Res. Part 2 Top. Stud. Oceanogr. 129, 319–331. doi: 10.1016/j.dsr2.2014.01.009
Halouani, G., Abdou, K., Hattab, T., Romdhane, M. S., Lasram, F. B. R., and Le Loc’h, F. (2016). A spatio-temporal ecosystem model to simulate fishing management plans: a case of study in the Gulf of Gabes (Tunisia). Mar. Policy 69, 62–72. doi: 10.1016/j.marpol.2016.04.002
Hattab, T., Lasram, F. B. R., Albouy, C., Romdhane, M. S., Jarboui, O., Halouani, G., et al. (2013). An ecosystem model of an exploited southern Mediterranean shelf region (Gulf of Gabes, Tunisia) and a comparison with other Mediterranean ecosystem model properties. J. Mar. Syst. 128, 159–174. doi: 10.1016/j.jmarsys.2013.04.017
Heymans, J. J., Coll, M., Link, J. S., Mackinson, S., Steenbeek, J., Walters, C., et al. (2016). Best practice in Ecopath with Ecosim food-web models for ecosystem-based management. Ecol. Modell. 331, 173–184. doi: 10.1016/j.ecolmodel.2015.12.007
Kallianiotis, A., Vidoris, P., and Sylaios, G. (2004). Fish species assemblages and geographical sub-areas in the North Aegean Sea, Greece. Fish. Res. 68, 171–187. doi: 10.1016/j.fishres.2003.12.007
Karachle, P. K., and Stergiou, K. I. (2017). An update on the feeding habits of fish in the Mediterranean Sea (2002-2015). Mediterranean Mar. Sci. 18, 43–52.
Libralato, S., Christensen, V., and Pauly, D. (2006). A method for identifying keystone species in food web models. Ecol. Modell. 195, 153–171. doi: 10.1016/j.ecolmodel.2005.11.029
Lotze, H. K., Lenihan, H. S., Bourque, B. J., Bradbury, R. H., Cooke, R. G., Kay, M. C., et al. (2006). Depletion, degradation and recovery potential of estuaries and Coastal Seas. Science 312, 1806–1809. doi: 10.1126/science.1128035
Machias, A., Tsagarakis, K., and Matsaganis, M. (2016). Greek fisheries and the economic crisis: structural analogies. Ethics Sci. Environ. Politics 16, 19–23. doi: 10.3354/esep00170
Mackinson, S., Daskalov, G., Heymans, J. J., Neira, S., Arancibia, H., Zetina-Rejón, M., et al. (2009). Which forcing factors fit? Using ecosystem models to investigate the relative influence of fishing and changes in primary productivity on the dynamics of marine ecosystems. Ecol. Modell. 220, 2972–2987. doi: 10.1016/j.ecolmodel.2008.10.021
Marchal, P., Andersen, B., Caillart, B., Eigaard, O., Guyader, O., Hovgaard, H., et al. (2006). Impact of technological creep on fishing effort and fishing mortality, for a selection of European fleets. ICES J. Mar. Sci. 64, 192–209. doi: 10.1093/icesjms/fsl014
Molina, J. M., and Cooke, S. J. (2012). Trends in shark bycatch research: current status and research needs. Rev. Fish Biol. Fish. 22, 719–737. doi: 10.1007/s11160-012-9269-3
Morissette, L. (2007). Complexity, Cost and Quality of Ecosystem Models and Their Impact on Resilience: A Comparative Analysis, with Emphasis on Marine Mammals and the Gulf of St. Lawrence. Ph.D. thesis, University of British Columbia, Vancouver, 260.
Moutopoulos, D., and Stergiou, K. (2012). Spatial disentangling of Greek commercial fisheries landings by gear between 1928-2007. J. Biol. Res. Thessaloniki 18, 265–279.
Moutopoulos, D. K., Katselis, G., Kios, K., Tsotskou, A., Tsikliras, A. C., and Stergiou, K. I. (2013a). Estimation and reconstruction of shore-based recreational angling fisheries catches in the Greek Seas (1950-2010). J. Biol. Res. 20, 376–381.
Moutopoulos, D. K., Libralato, S., Solidoro, C., and Stergiou, K. I. (2013b). Toward an ecosystem approach to fisheries in the Mediterranean Sea: multi-gear/multi-species implications from an ecosystem model of the Greek Ionian Sea. J. Mar. Syst. 11, 13–28. doi: 10.1016/j.jmarsys.2012.12.002
Moutopoulos, D. K., Tsikliras, A. C., and Stergiou, K. I. (2016). “Greece (excluding Crete),” in Global Atlas of Marine Fisheries: A Critical Appraisal of Catches and Ecosystem Impacts, eds D. Pauly, and D. Zeller, (Washington, DC: Island University Press), 278.
NOAA, and Climate Prediction Centre (2019a). Atlantic Multidecadal Oscillation Dataset. Available at: https://www.esrl.noaa.gov/psd/data/correlation/amon.us.data (accessed August, 2019).
NOAA, and Climate Prediction Centre (2019b). North Atlantic Oscillation Dataset. Available at: https://www.cpc.ncep.noaa.gov/products/precip/CWlink/pna/norm.nao.monthly.b5001.current.ascii.table (accessed August, 2019).
Pauly, D. (1980). On the interrelationships between natural mortality, growth parameters, and mean environmental temperature in 175 fish stocks. ICES J. Mar. Sci. 39, 175–192. doi: 10.1093/icesjms/39.2.175
Pauly, D., and Christensen, V. (2002). “Ecosystem models,” in Handbook of Fish Biology and Fisheries: Fisheries, Vol. 2, eds P. J. B. Hart, and J. D. Reynolds, (Hoboken, NJ: Blackwell publishing), 211–227.
Petihakis, G., Triantafyllou, G., Pollani, A., Koliou, A., and Theodorou, A. (2005). Field data analysis and application of a complex water column biogeochemical model in different areas of a semi-enclosed basin: towards the development of an ecosystem management tool. Mar. Environ. Res. 59, 493–518. doi: 10.1016/j.marenvres.2004.07.004
Pikitch, E. K., Santora, C., Babcock, E. A., Bakun, A., Bonfil, R., Conover, D. O., et al. (2004). Ecosystem-based fishery management. Science 305, 346–347. doi: 10.1126/science.1098222
Piroddi, C., Bearzi, G., and Christensen, V. (2010). Effects of local fisheries and ocean productivity on the northeastern Ionian Sea ecosystem. Ecol. Modell. 221, 1526–1544. doi: 10.1016/j.ecolmodel.2010.03.002
Piroddi, C., Bearzi, G., Gonzalvo, J., and Christensen, V. (2011). From common to rare: the case of the Mediterranean common dolphin. Biol. Conserv. 144, 2490–2498. doi: 10.1016/j.biocon.2011.07.003
Piroddi, C., Moutopoulos, D. K., Gonzalvo, J., and Libralato, S. (2016). Ecosystem health of a Mediterranean semi-enclosed embayment (Amvrakikos Gulf, Greece): assessing changes using a modeling approach. Cont. Shelf Res. 121, 61–73. doi: 10.1016/j.csr.2015.10.007
Steenbeek, J., Corrales, X., Platts, M., and Coll, M. (2018). Ecosampler: a new approach to assessing parameter uncertainty in Ecopath with Ecosim. SoftwareX 7, 198–204. doi: 10.1016/j.softx.2018.06.004
Stergiou, K. I., and Karpouzi, V. S. (2002). Feeding habits and trophic levels of Mediterranean fish. Rev. Fish Biol. Fish. 11, 217–254.
Stergiou, K. I., Moutopoulos, D. K., and Tsikliras, A. C. (2007). “Spatial and temporal variability in Hellenic marine fisheries landings,” in State of Hellenic Fisheries, eds C. Papaconstantinou, A. Zenetos, V. Vassilopoulou, and G. Tserpes, (Athens: Hellenic Centre for Marine Research), 141–150.
Stergiou, K. I., Somarakis, S., Triantafyllou, G., Tsiaras, K. P., Giannoulaki, M., Petihakis, G., et al. (2016). Trends in productivity and biomass yields in the Mediterranean Sea large marine ecosystem during climate change. Environ. Dev. 17(Suppl. 1), 57–74. doi: 10.1016/j.envdev.2015.09.001
Tsagarakis, K., Coll, M., Giannoulaki, M., Somarakis, S., Papaconstantinou, C., and Machias, A. (2010). Food-web traits of the North Aegean Sea ecosystem (Eastern Mediterranean) and comparison with other Mediterranean ecosystems. Estuar. Coast. Shelf Sci. 88, 233–248. doi: 10.1016/j.ecss.2010.04.007
Tsagarakis, K., Palialexis, A., and Vassilopoulou, V. (2014). Mediterranean fishery discards: review of the existing knowledge. ICES J. Mar. Sci. 71, 1219–1234. doi: 10.1093/icesjms/fst074
Tsikliras, A. C., Dinouli, A., Tsiros, V. Z., and Tsalkou, E. (2015). The Mediterranean and Black Sea fisheries at risk from overexploitation. PLoS One 10:e0121188. doi: 10.1371/journal.pone.0121188
Tsikliras, A. C., Licandro, P., Pardalou, A., McQuinn, I. H., Gröger, J. P., and Alheit, J. (2019). Synchronization of Mediterranean pelagic fish populations with the North Atlantic climate variability. Deep Sea Res. 2 159, 143–151. doi: 10.1016/j.dsr2.2018.07.005
Tsikliras, A. C., Tsiros, V.-Z., and Stergiou, K. I. (2013). Assessing the state of Greek marine fisheries resources. Fish. Manag. Ecol. 20, 34–41. doi: 10.1111/j.1365-2400.2012.00863.x
Ulanowicz, R. E. (1986). Growth and Development: Ecosystem Phenomenology. New York, NY: Springer, 203.
Walters, C., Christensen, V., and Pauly, D. (1997). Structuring dynamic models of exploited ecosystems from trophic mass-balance assessments. Rev. Fish Biol. Fish. 7, 139–172.
Watling, L., and Norse, E. A. (1998). Disturbance of the seabed by mobile fishing gear: a comparison to forest clearcutting. Conserv. Biol. 12, 1180–1197. doi: 10.1046/j.1523-1739.1998.0120061180.x
Keywords: ecosystem modeling approach, mediterranean fisheries, ecopath with ecosim, Pagasitikos gulf, fisheries management, fisheries regulations
Citation: Dimarchopoulou D, Keramidas I, Tsagarakis K and Tsikliras AC (2019) Ecosystem Models and Effort Simulations of an Untrawled Gulf in the Central Aegean Sea. Front. Mar. Sci. 6:648. doi: 10.3389/fmars.2019.00648
Received: 28 June 2019; Accepted: 03 October 2019;
Published: 22 October 2019.
Edited by:
Violin Stoyanov Raykov, Bulgarian Academy of Sciences, BulgariaReviewed by:
Tommaso Russo, University of Rome Tor Vergata, ItalyAlida Bundy, Bedford Institute of Oceanography (BIO), Canada
Copyright © 2019 Dimarchopoulou, Keramidas, Tsagarakis and Tsikliras. This is an open-access article distributed under the terms of the Creative Commons Attribution License (CC BY). The use, distribution or reproduction in other forums is permitted, provided the original author(s) and the copyright owner(s) are credited and that the original publication in this journal is cited, in accordance with accepted academic practice. No use, distribution or reproduction is permitted which does not comply with these terms.
*Correspondence: Donna Dimarchopoulou, ZGRpbWFyY2hAYmlvLmF1dGguZ3I=