 Elitza S. Germanov1,2,3*
 Andrea D. Marshall2
 I. Gede Hendrawan4
 Ryan Admiraal5,6
 Christoph A. Rohner2
 Janis Argeswara4Raka Wulandari4Mahardika R. Himawan7
 Neil R. Loneragan1,3,8
- 1Environmental and Conservation Sciences, Murdoch University, Perth, WA, Australia
- 2Marine Megafauna Foundation, Truckee, CA, United States
- 3Aquatic Megafauna Research Unit, Centre for Sustainable Aquatic Ecosystems, Harry Butler Institute, Murdoch University, Perth, WA, Australia
- 4Department of Marine Science, Faculty of Marine Sciences and Fisheries, Udayana University, Denpasar, Indonesia
- 5School of Mathematics and Statistics, Victoria University of Wellington, Wellington, New Zealand
- 6Department of Mathematics and Statistics, Murdoch University, Perth, WA, Australia
- 7Fisheries and Marine Science Department, Faculty of Agriculture, Mataram University, Mataram, Indonesia
- 8Faculty of Fisheries and Marine Science, Bogor Agricultural University, Bogor, Indonesia
The implications of plastic pollution, including microplastics, on marine ecosystems and species are increasingly seen as an environmental disaster. Yet few reports focus on filter-feeding megafauna in regions heavily impacted by plastic pollution, such as Indonesia in the Coral Triangle, a global marine biodiversity hotspot. Here, we evaluate plastic abundance and characterize debris from feeding grounds for manta rays Mobula alfredi and whale sharks Rhincodon typus in three coastal locations in Indonesia: Nusa Penida Marine Protected Area, Komodo National Park, and Pantai Bentar, East Java. A 200 μm plankton net was used to sample the top 0.5 m of the water column (‘trawl survey’) and floating plastics were assessed along ∼440 m long transects (‘visual survey’) during the Indonesian north-west (wet) and south-east (dry) monsoon seasons during 2016–2018. Microplastics were identified visually, measured and categorized from trawl samples, and larger floating plastics were counted and categorized visually from boats. Plastic abundance ranged widely from 0.04 to 0.90 pieces m–3 (trawl survey) and 210 to 40,844 pieces km–2 (visual survey). Results from linear models showed significant seasonal and location differences in estimated plastic abundance for trawl and visual surveys in Nusa Penida and Komodo. Plastic abundance was up to ∼ 44 times higher in the wet than the dry season, with the largest seasonal effect observed in Nusa Penida. Overall, small pieces < 5 mm (≥ 78%), films and fragments (> 50% combined) were the most prevalent plastics. Theoretical plastic ingestion rates were calculated using estimated filtration volumes of manta rays and whale sharks and the mean plastic abundance in their feeding grounds. Upper plastic ingestion estimates for manta rays were ∼63 and 25 pieces h–1 for Nusa Penida and Komodo locations, respectively, and ∼137 pieces h–1 for whale sharks in Java. Analysis of manta ray egested material confirmed plastic ingestion, the consequences of which might include exposure to toxic plastic additives and adhered persistent organic pollutants. Communicating this information to communities who stand to benefit from healthy megafauna populations might help local governments as they work toward reducing plastics in the marine environment.
Introduction
The rising level of plastic debris in our oceans is a large-scale environmental problem with wide ranging impacts (van Sebille et al., 2015; Worm et al., 2017; Germanov et al., 2018). Perhaps most significantly, this form of pollution wreaks havoc on marine life (Gall and Thompson, 2015; Wilcox et al., 2015, 2018; Worm et al., 2017). While large debris also impacts marine organisms (e.g., turtles, birds, sharks, and mammals), once broken down to microscopic sizes through environmental exposure, microplastics are of growing concern as they easily enter food webs (Andrady, 2011; Worm et al., 2017). Microplastics, generally referred to as plastics < 5 mm in diameter (Andrady, 2011), are comparable in size to, or smaller than zooplankton, an integral component in marine ecosystems and the primary food for planktivores. These small plastic particles are ingested by a range of organisms, including zooplankton themselves (Cole et al., 2013; Setälä et al., 2014), small planktivorous fishes (Boerger et al., 2010) and filter-feeding megafauna (Besseling et al., 2015).
In addition to the more obvious issues associated with the ingestion of foreign, potentially indigestible objects – such as digestive tract obstruction and perforation, dietary dilution and starvation – plastics, are significant carriers of toxic additives such as bisphenol A, phthalates, and flame retardants (Andrady, 2011; Worm et al., 2017; Germanov et al., 2018). Microplastic ingestion is proposed to impact gut biomes of host organisms, potentially leading to gut dysbiosis (reviewed by Fackelmann and Sommer, 2019). Further, the hydrophobic nature of some plastics and the increased surface area of microplastics, through pitting processes, create an ideal sink for persistent organic pollutants (POPs), such as dichloro-diphenyl-trichloroethanes (DDTs), polychlorinated biphenyls (PCBs), polycyclic aromatic hydrocarbons (PAHs) (Rios et al., 2007, 2010; Ogata et al., 2009; Cole et al., 2011) and heavy metals (Ashton et al., 2010). Pollutants are concentrated up to a million-fold in microplastics compared to surrounding seawater (Mato et al., 2001). Upon plastic ingestion, these toxic chemicals can leach into organisms (Teuten et al., 2009) and may negatively affect the physiology (Browne et al., 2013; Rochman et al., 2013), development (Anselmo et al., 2011) and endocrine functions (Rochman et al., 2014) of marine organisms (reviewed in Browne et al., 2015; Worm et al., 2017), even if the plastic pieces eventually pass through the digestive system. Long-lived species may bioaccumulate these pollutants over decades to concentrations that lead to altered reproductive fitness (Reddy et al., 2001), which may further impact their young through maternal offloading (e.g., Lyons et al., 2013a, b, 2014; Genov et al., 2019) leading to population level impacts (Worm et al., 2017).
Owing to their feeding strategies, filter-feeding megafauna are particularly susceptible to microplastic ingestion (Germanov et al., 2018), while their longevity (Stevens, 2016; Stewart et al., 2018) increases the risks of pollutant bioaccumulation. In a number of studies on filter-feeding megafauna, Fossi et al. (2014, 2016, 2017) documented trace levels of phthalates and POPs in the muscle of basking sharks Cetorhinus maximus, the blubber of fin whales Balaenoptera physalus and the skin of whale sharks Rhincodon typus. For phthalates, a plastic additive and chemical tracer, and probably with POPs, these chemicals are likely to have been acquired through plastic ingestion.
Filter-feeding reef and giant manta rays (Mobula alfredi, and M. birostris, respectively) and whale sharks are likely to feed in a variety of habitats, including deep and pelagic environments (Couturier et al., 2013), and they are commonly observed feeding near the surface in shallow coastal waters (Jaine et al., 2012; Rohner et al., 2015; Armstrong et al., 2016; Germanov et al., 2019). Several types of plastic polymers are buoyant in seawater and accumulate in the surface layer of the water column (Andrady, 2011). Additionally, microplastics might be acquired indirectly through ingestion of plankton that have ingested microplastics (Cole et al., 2013; Setälä et al., 2014). Habitat ranges for many filter feeding megafauna also overlap with areas of heavy plastic pollution such as the Coral Triangle (Maximenko et al., 2012; Eriksen et al., 2014; van Sebille et al., 2015; reviewed by Germanov et al., 2018).
Indonesia is situated within the Coral Triangle, a significant region for global marine biodiversity (Gray, 1997; Worm and Branch, 2012; Worm et al., 2017). It is home to many endemic and threatened marine species and boasts globally significant populations of manta rays (Germanov and Marshall, 2014; Germanov et al., 2019) and whale sharks (Norman et al., 2017). Currently, Indonesia is also ranked as the world’s second largest plastic marine debris emitter (Jambeck et al., 2015). In a sample of fishes sold for human consumption from the Makassar fish market, Indonesia, over a quarter of the fishes, including over half of the species sampled, contained plastic debris in their digestive tracts (Rochman et al., 2015). The impacts of plastic pollution on megafauna in Indonesia and neighboring countries are also now being documented. Three recent examples of deceased marine mammals that have ingested substantial amounts of plastic have been documented and have prompted concern for other species that live and feed in these polluted waters: a sperm whale Physeter microcephalus in Indonesia (Victor, 2018); a pilot whale Globicephala macrorhynchus in southern Thailand (Zachos, 2018); and a juvenile Cuvier’s beaked whale Ziphius cavirostris in the Philippines (British Broadcasting Corporation [BBC], 2019). In Australia, sea turtles, well-established to be at risk of plastic ingestion, were recently evaluated to have a 50% risk of mortality upon ingesting as little as 14 pieces of plastic (Wilcox et al., 2018).
In Indonesia, among the megafauna most likely impacted by plastic pollution are manta rays and whale sharks (Germanov et al., 2019). They are globally threatened (Pierce and Norman, 2016; Marshall et al., 2018a, b) with the main threats coming from direct and indirect fisheries. Protecting these species can be an economic benefit, as they are important drawcards for marine tourism in Indonesia (Gallagher and Hammerschlag, 2011; O’Malley et al., 2013). In Indonesia, despite directed fisheries being formally outlawed throughout the entire Exclusive Economic Zone in 2014 (Ministry of Marine Affairs and Fisheries, 2014), these species are still exposed to other anthropogenic threats including boat strikes, and habitat destruction and disturbance, and the rising levels of plastic pollution in coastal waters, particularly at feeding habitats. In these plastic pollution hotspots, filter feeders would be at an elevated risk of ingesting microplastics and tainted zooplankton, and would be exposed to plastic associated pollutants (Germanov et al., 2018).
To gain insight into the level of threat plastic debris poses to Indonesia’s manta rays and whale sharks, it is important to quantify the abundance of plastic debris in feeding grounds. While microplastic levels have been modeled globally (Maximenko et al., 2012; Eriksen et al., 2014; van Sebille et al., 2015), abundance estimates for microplastic pollution within the Coral Triangle and Indonesia vary considerably between models (van Sebille et al., 2015). Further, with a few exceptions (Manalu et al., 2017; Syakti et al., 2017), empirical data on microplastics are lacking for coastal areas in Indonesia. Plastic abundance and theoretical ingestion rates have been calculated for whale sharks feeding in La Paz, Mexico (Fossi et al., 2017). However, to our knowledge, no plastic abundance estimates for manta ray and whale shark feeding grounds currently exist for Indonesia or the greater Coral Triangle. Furthermore, while there is empirical evidence that whale sharks ingest plastic (Haetrakul et al., 2009; Sampaio et al., 2018; Abreo et al., 2019; Donati et al., 2019), confirmation that manta rays ingest plastics is yet unavailable. Plastic ingestion by manta rays might be confirmed from opportunistic stomach contents analysis of stranded individuals (e.g., Haetrakul et al., 2009; Besseling et al., 2015; Sampaio et al., 2018; Abreo et al., 2019) and could potentially also be assessed through non-invasive analysis of egested material (Donati et al., 2019).
Our primary aim of the study was to quantify the surface plastic abundance in coastal feeding grounds for manta rays and whale sharks in Indonesia, within the Coral Triangle region, and establish if reef manta rays, hereafter ‘manta rays’ ingest plastics. The study region has a high but spatially variable human population density, is oceanographically complex, and has strong seasonal weather patterns that influence regional river pollution emissions (Lebreton et al., 2017). To that end, we examined whether geographic and seasonal variations in plastic debris abundance were evident. Based on these plastic abundance estimates, we have provided theoretical plastic ingestion rates for manta rays and whale sharks in the region. Egested material from manta rays was also analyzed for plastic content. By highlighting the implications of plastic pollution to manta rays and whale sharks, we are effectively employing a flagship approach to conservation (Bowen-Jones and Entwistle, 2002; Barua, 2011; Verissimo et al., 2011) in the hopes of creating flow-on effects from these iconic species to positively enhance the stewardship of Indonesia’s marine ecosystems.
Materials and Methods
Study Locations and Oceanographic Conditions
Three separate locations within Java and the Lesser Sunda Island chain of Indonesia that are frequented by feeding manta rays and whale sharks (see below) were chosen as study sites (Figures 1, 2, created using QGIS Development Team, 2016; Table 1). Manta Bay (MB), within the Nusa Penida Marine Protected Area (MPA) located to the south east of Bali Island (Figure 2A); and Karang Makassar (KM), in the central region of the Komodo National Park (NP), Flores (Figure 2B) are year-round manta ray feeding grounds (Dewar et al., 2008; Germanov and Marshall, 2014; Germanov et al., 2019). Pantai Bentar (PB), southeast of Probolinggo, East Java (Figure 2C) is a seasonal (December–March) whale shark feeding ground (Kamal et al., 2016). The sites consist of: a shallow (5–20 m deep), steep cliff-lined bay with mixed sand, rock and reef substrate in the north-west section of Nusa Penida Island, referred to here as North and South MB (N-MB and S-MB); a shallow rubble and reef slope (6–20 m deep) east of Komodo Island (KM); and a large, shallow (0–20 m) mangrove fringed bay affected by river runoff and heavy sedimentation (E. Germanov, personal observation) near PB beach. Nusa Penida MPA and Komodo NP, located along an island chain, are situated on a shallow (< 200 m) continental shelf with deep water basins (> 1,000 m) > 20 km offshore. The Madura Strait, East Java, including PB, is entirely < 100 m in depth (Figure 1).
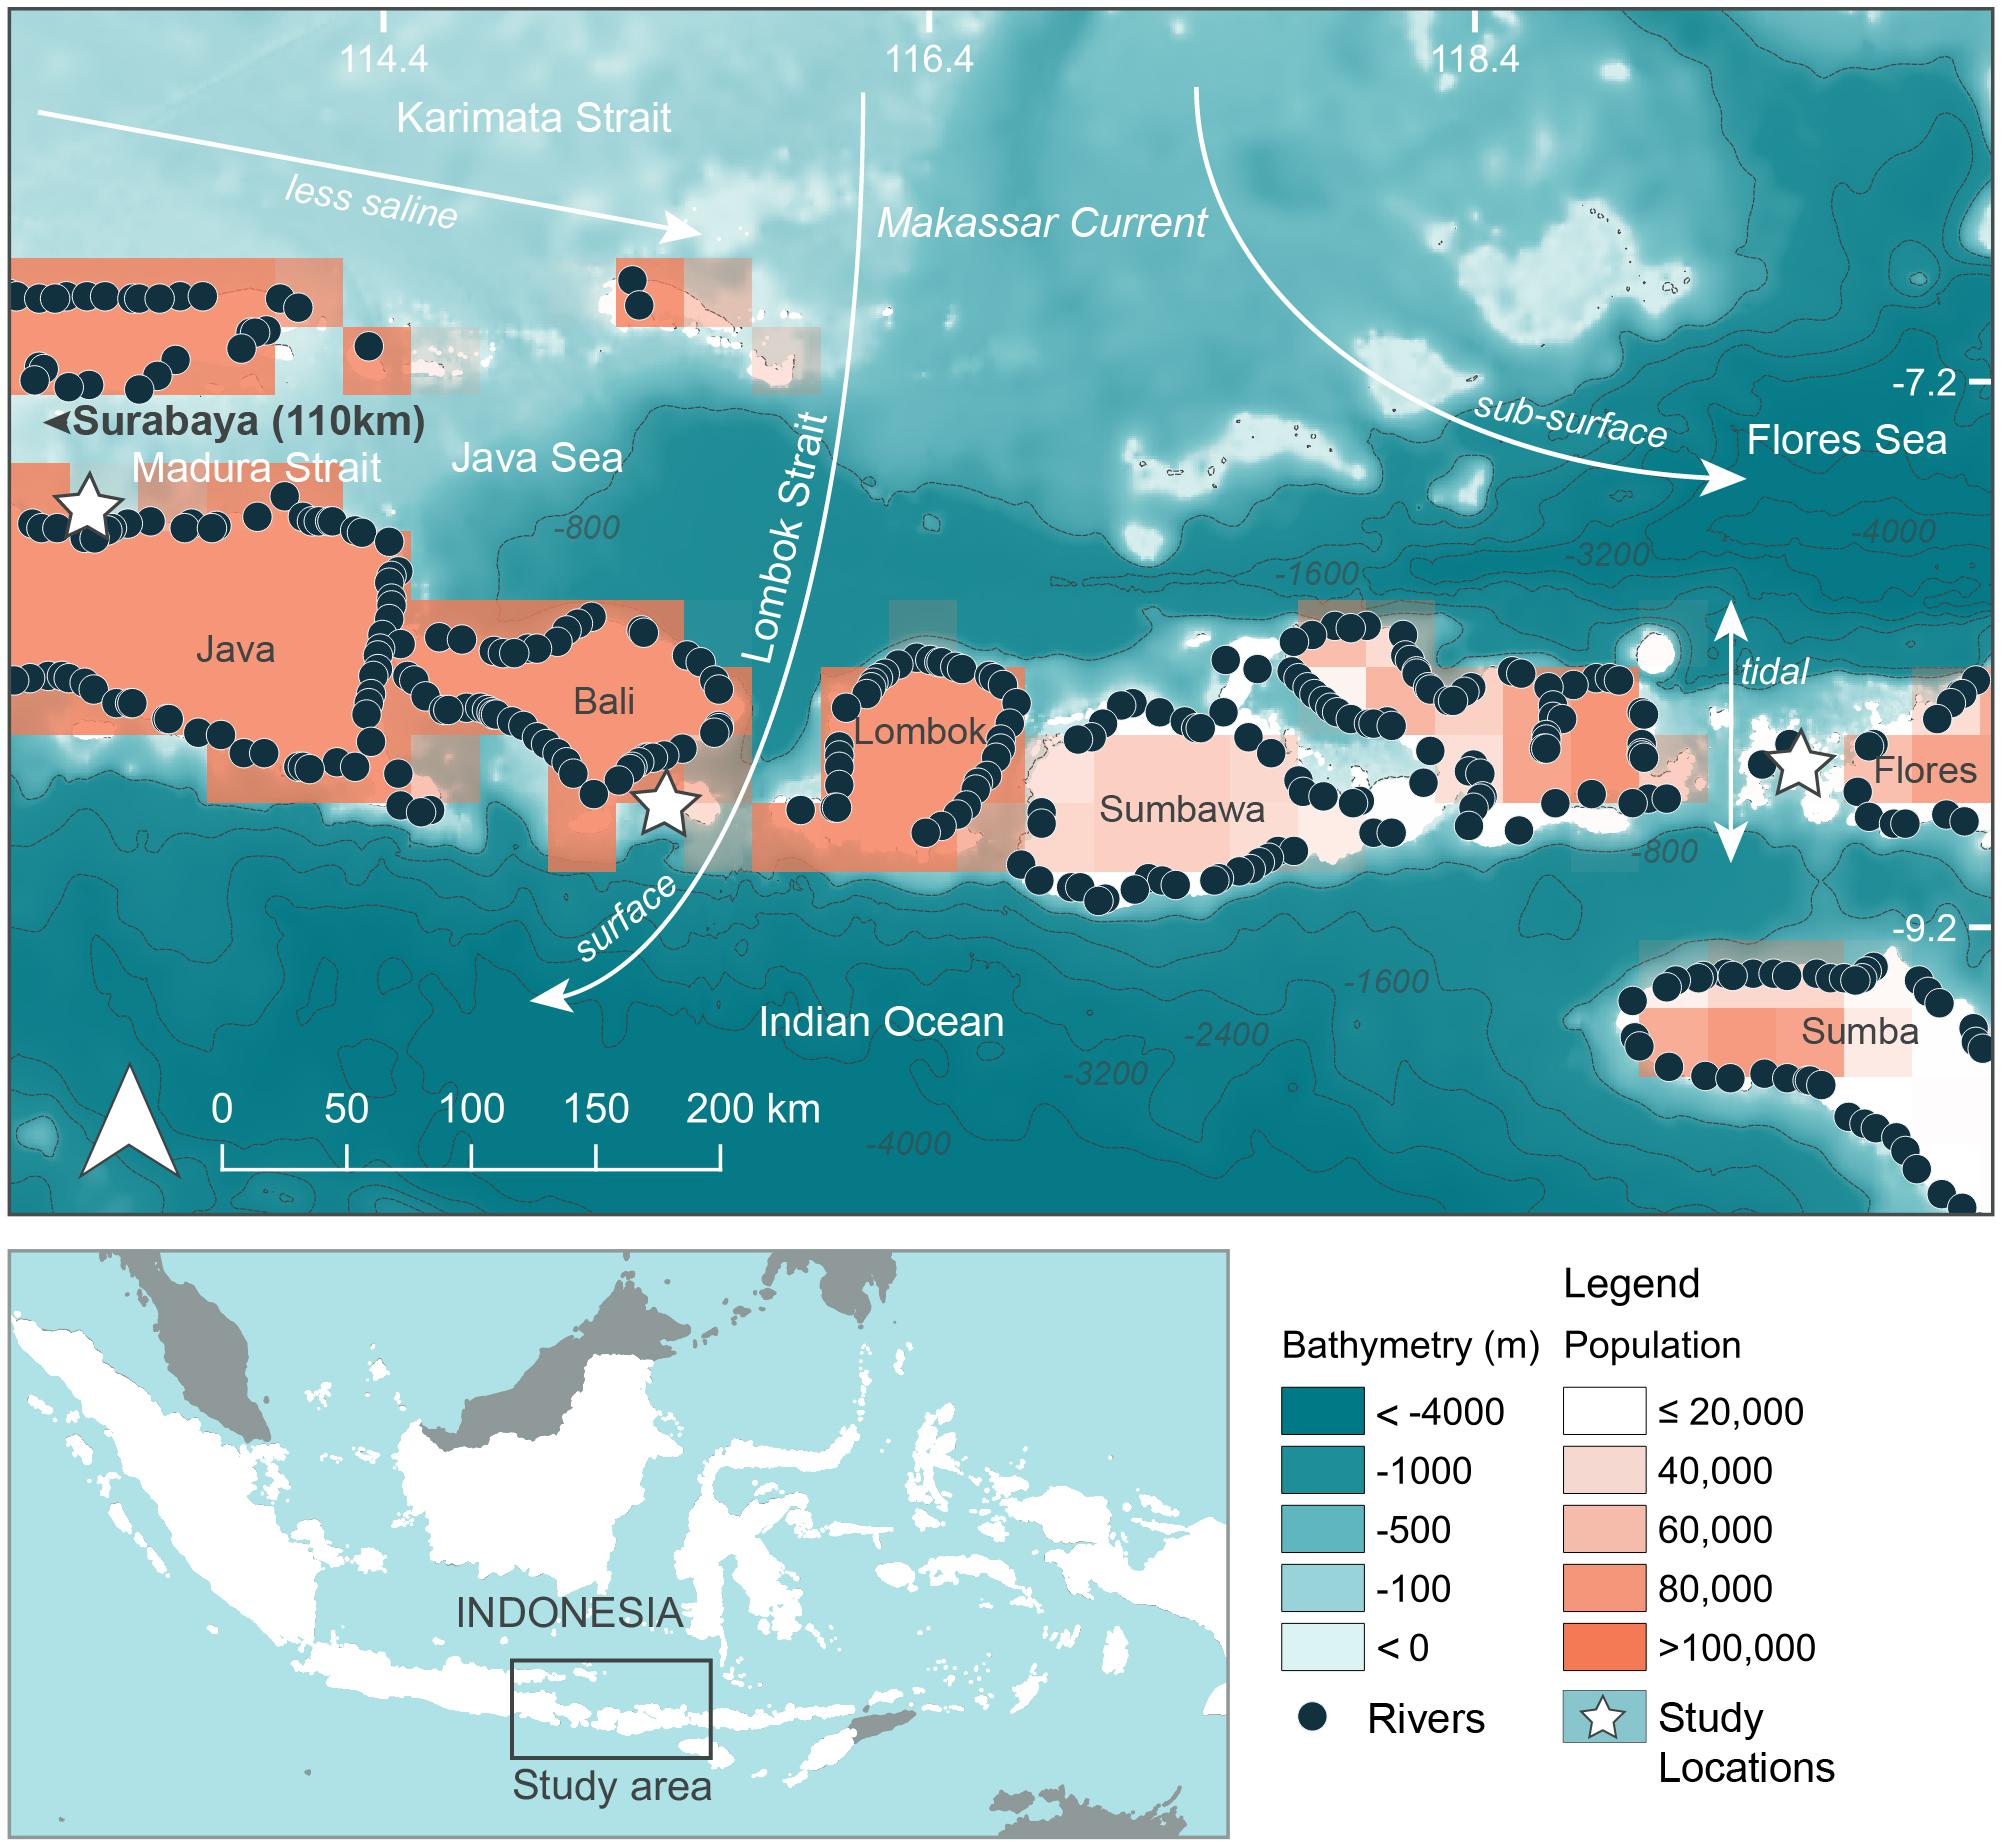
Figure 1. Regional oceanographic details, river emission points and population density adjacent to study areas. Bathymetry information was available from GEBCO_2014 Grid, version 20150318; www.gebco.net. River emission points available from Lebreton and Reisser (2018). Population information in 15 min × 15 min grids (∼760 km2) using 2025 population projections available from Yetman et al. (2004).
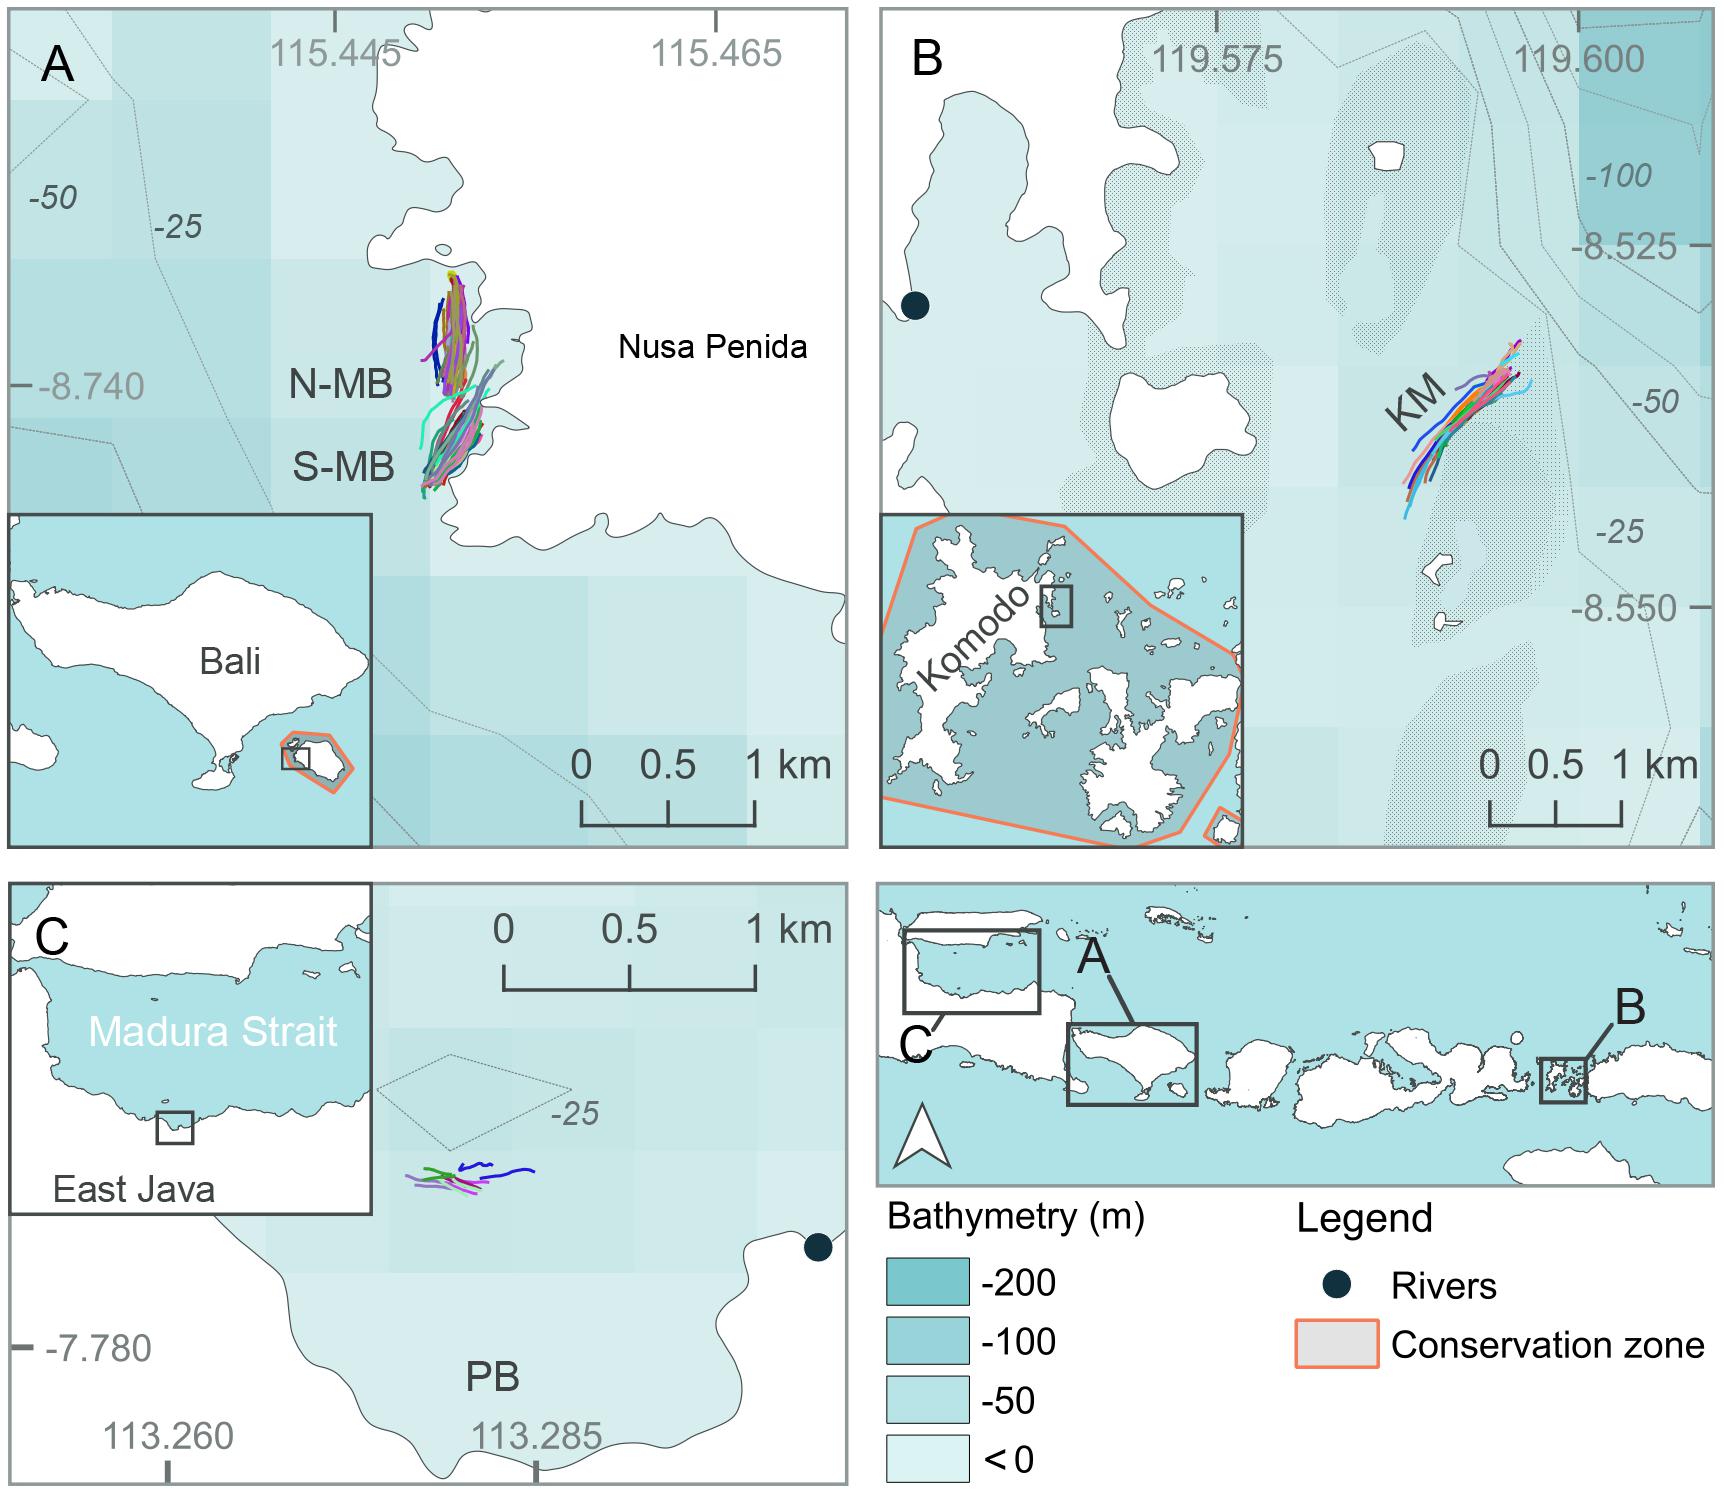
Figure 2. Map of study locations at (A) North and South Manta Bay (N-MB and S-MB, respectively), Nusa Penida Marine Protected Area; (B) Karang Makassar (KM), Komodo National Park; and (C) Pantai Bentar (PB), East Java in Indonesia. Different color lines in (A–C) represent individual survey GPS tracks.
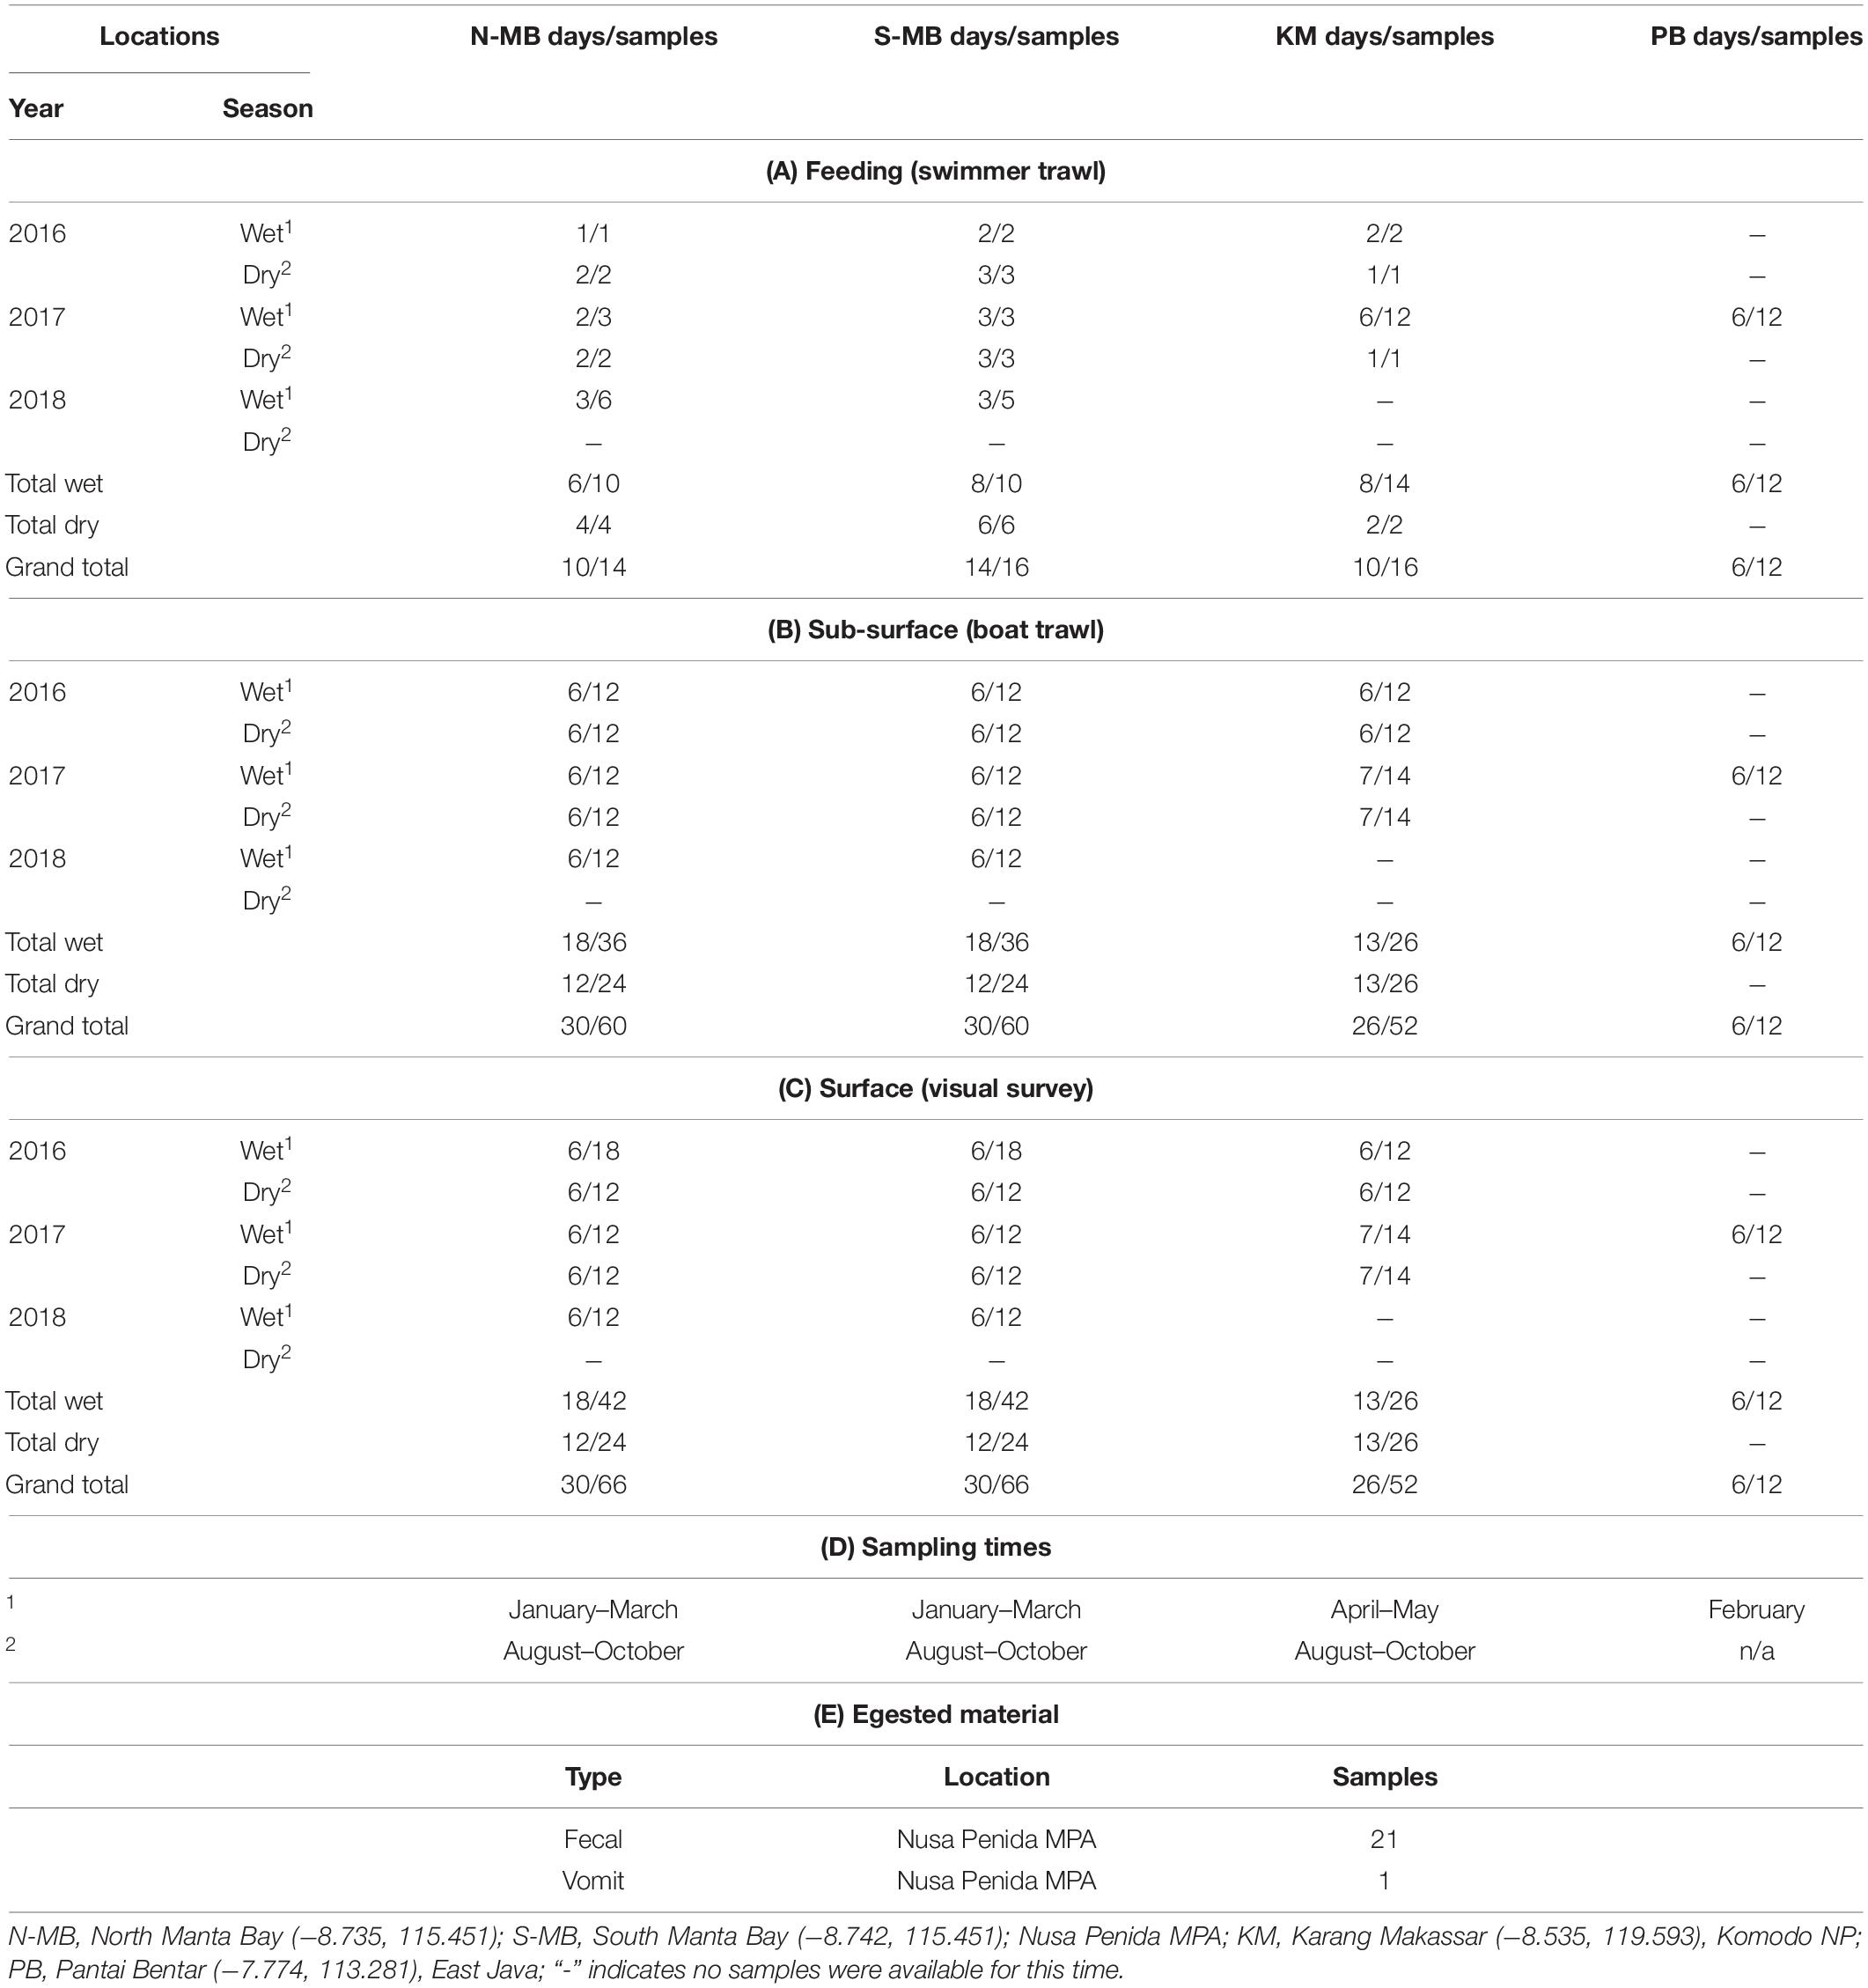
Table 1. Research locations, sampling seasons and times, and the numbers of (A) feeding, (B) sub-surface, and (C) surface samples, (D) the sampling times in Indonesia from January, 2016 to February, 2018, and (E) egested material samples collected from 2016 to 2018.
Oceanography in the Region
The region has complex oceanography and the strong seasonal conditions that influence oceanographic conditions and rainfall that varies between the study locations (Figure 3). Thus, we anticipated that there would be regional and seasonal differences in plastic abundance between the study sites and tested for these variations. Generally, the region experiences substantial influence from the Indonesian Throughflow (ITF) (Tillinger, 2011) via the Makassar Current, estimated to transport up to 50% of the ITF volume (Mayer and Damm, 2012). The majority of the Makassar Current flows southward through the Makassar Strait and passes through the Lombok Strait between the Islands of Lombok and Bali and the eastern side of Nusa Penida as a surface current (Mayer and Damm, 2012). A portion of the Makassar current also enters the Flores Sea, north of Komodo NP, as a subsurface current (Mayer and Damm, 2012). East of Bali, the ITF pathway known as the Karimata Strait, located between the islands of Kalimantan and Sumatra and Java, connects the South China Sea to the Java Sea. This pathway serves to bring less saline water eastward toward the Flores Sea and into the Makassar Strait during the north-west monsoon season (Mayer and Damm, 2012). The prevailing winds of the north-west and south-east monsoons generally act to decelerate the Makassar Current flow (Mayer and Damm, 2012), leading to seasonal differences in intensity, with it being greatest during the south-east monsoon (Sprintall et al., 2009). Further oceanographic influences on the region come from the Indian Ocean (Ningsih et al., 2013; Hendrawan and Asai, 2011) and tidal currents that move north to south and vice versa through the straits surrounding the Komodo NP (Mehta-Erdmann, 2004).
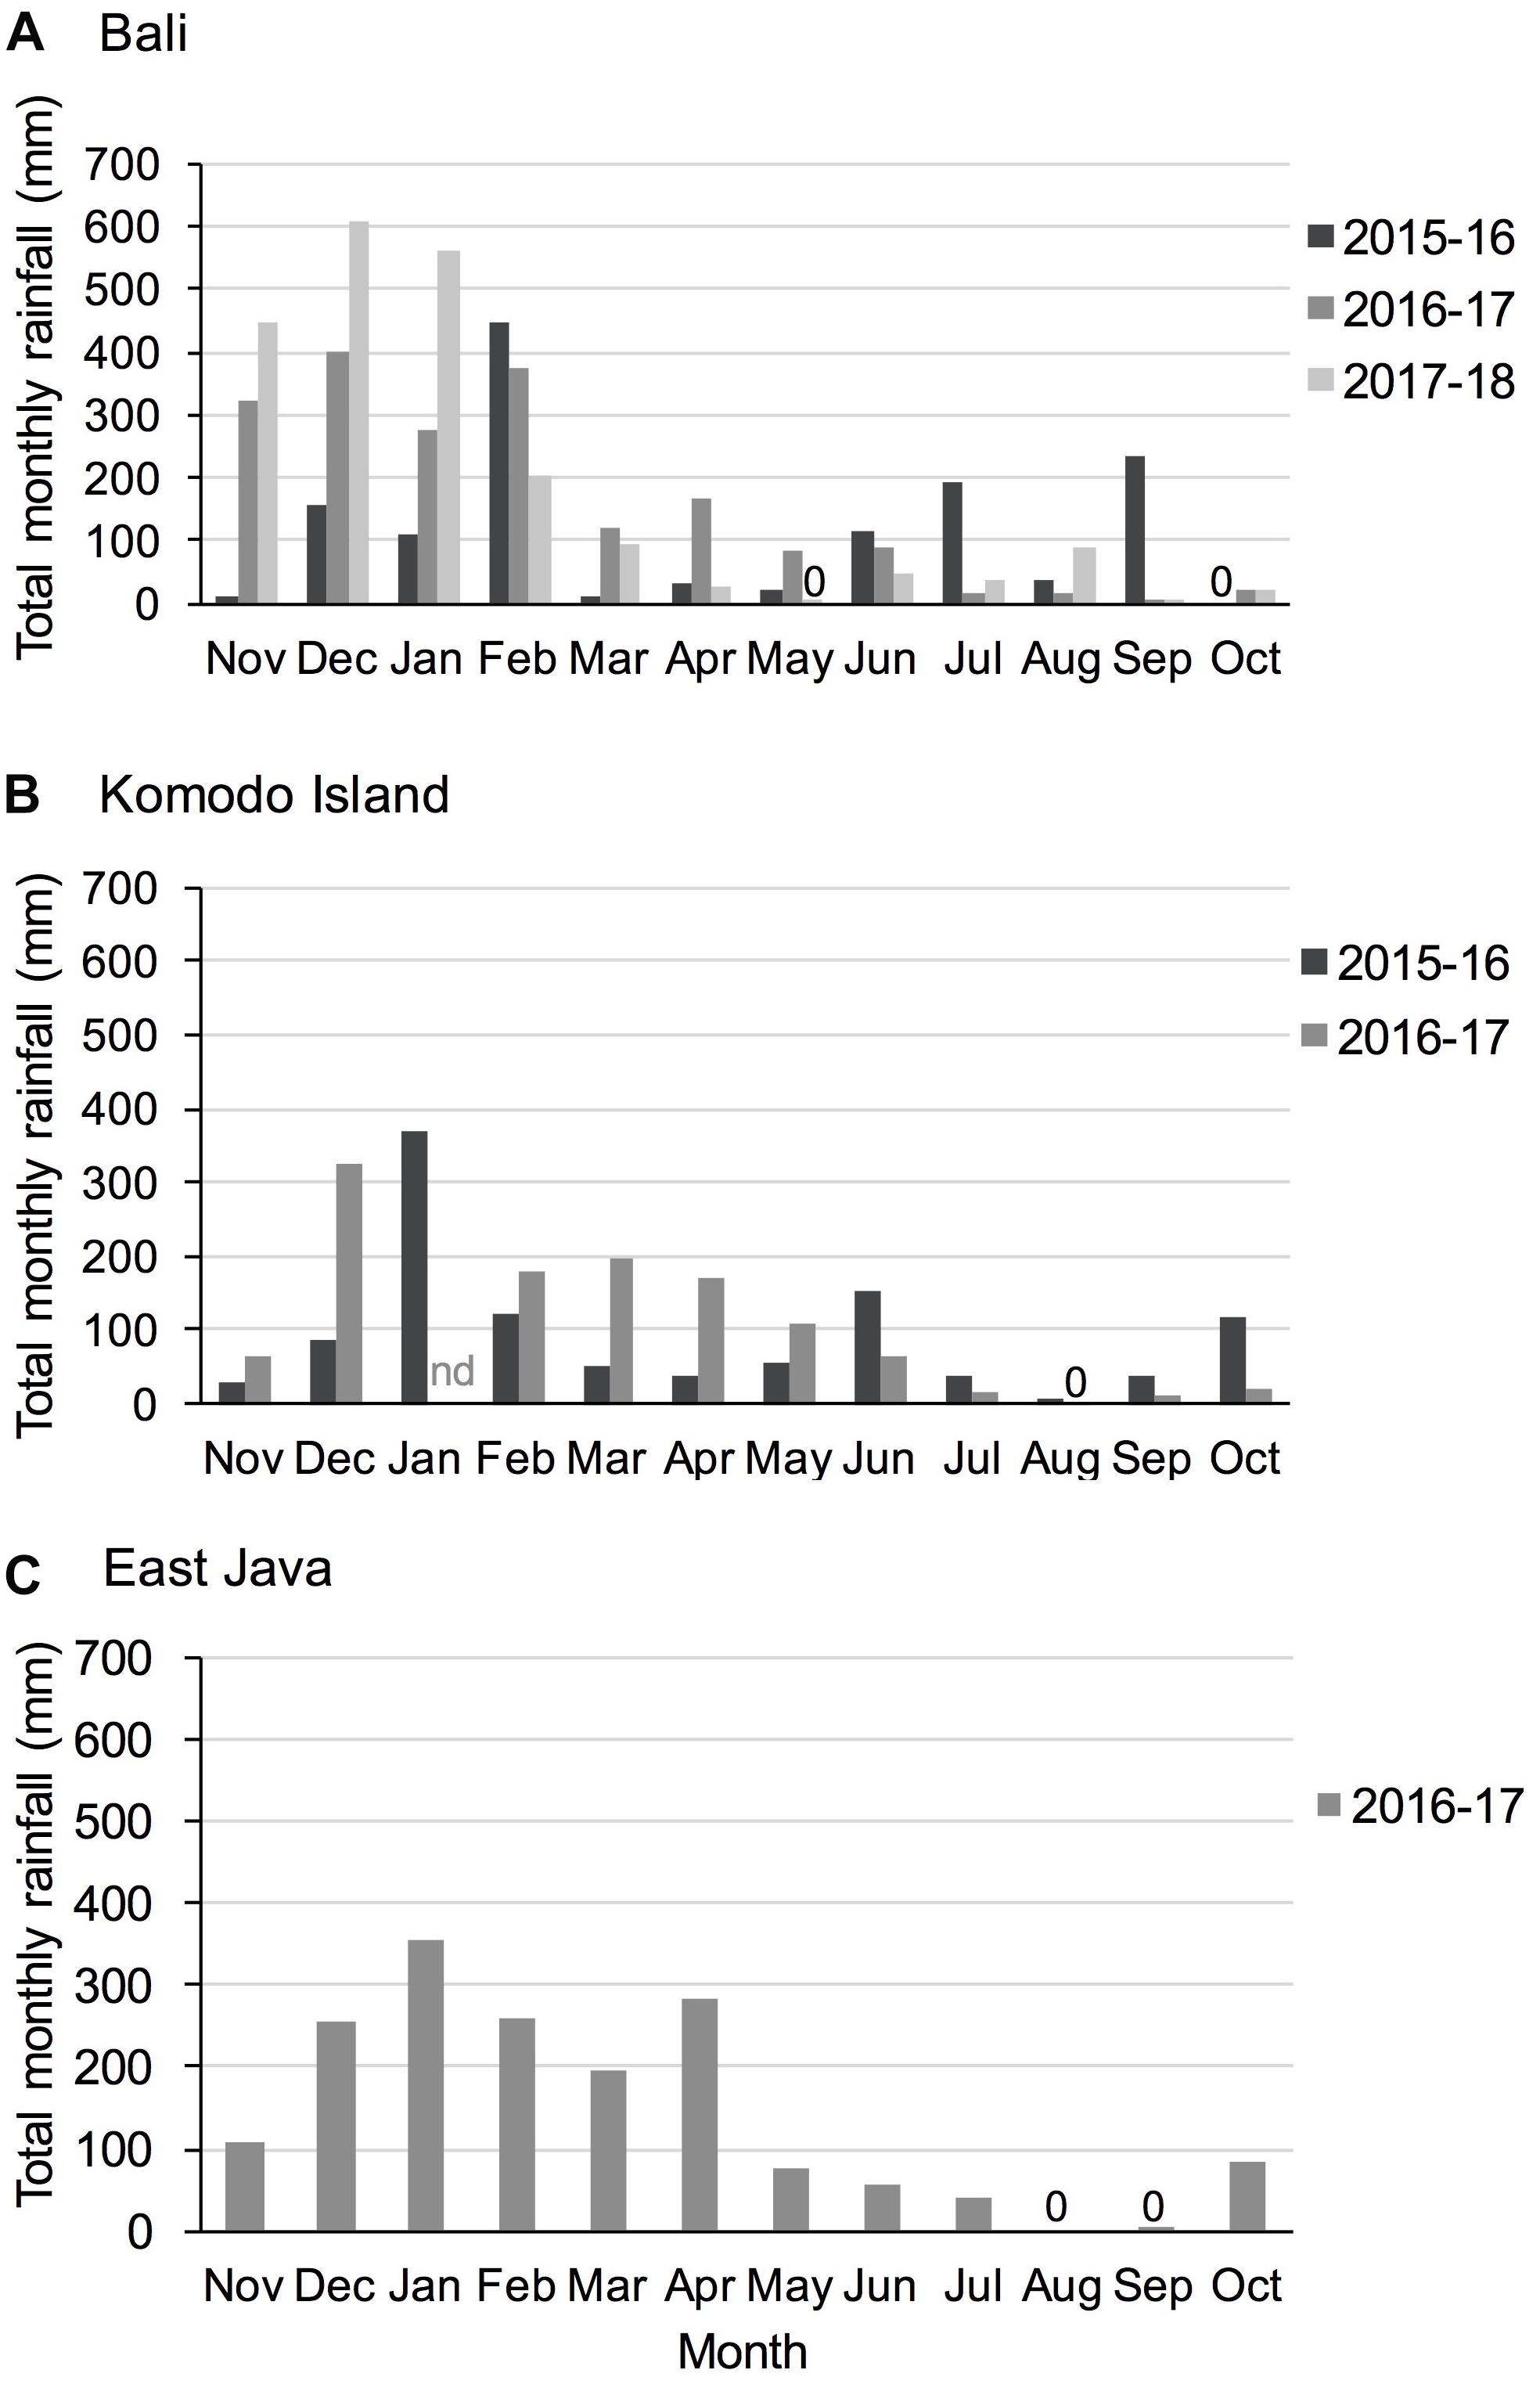
Figure 3. Total monthly rainfall for study regions (A) Bali, (B) Komodo Island, and (C) East Java during study years. 0 = no precipitation recorded; nd = no data available. Precipitation data were available from the Indonesian Meteorology, Climatology and Geophysics Agency Data online, Pusat Database BMKG; http://dataonline.bmkg.go.id/.
The regional oceanic productivity, that sustains the feeding grounds for megafauna (e.g., Dewar et al., 2008; Mayer and Damm, 2012; Thys et al., 2016), is owed to the warmer (Tillinger, 2011) and nutrient rich Pacific waters (Ayers et al., 2014) carried by the ITF mixing with Indian Ocean waters. The area is further enriched by deep water upwelling to the south of the island chain, especially during the south-east monsoon (Ningsih et al., 2013). The two alternating monsoon seasons also vary the amount of precipitation that falls on the region, which is higher during the north-west monsoon (November–April), hereafter ‘wet’ season, compared to the south-east monsoon (May – October), hereafter ‘dry’ season (Chang et al., 2005).
Surveys and Sample Analysis
Feeding Behavior Observations
Feeding behavior was assessed by observing manta rays and whale sharks both from a boat and directly from underwater. Manta rays display different feeding behaviors (Stevens, 2016) and we observed surface feeding in our study (for a description of manta ray behaviors see Germanov et al., 2019). This behavior is characterized by manta rays swimming near the surface (∼0.5 m), either in a straight line and periodically completing tilting ‘U-turns,’ or infrequently, ‘barrel-rolling’ by completing full vertical rotations (Jaine et al., 2012; Stevens, 2016; Germanov et al., 2019). Feeding manta rays had open mouths and their cephalic fins unrolled in a funnel shape. Whale sharks have several different feeding modes (Nelson and Eckert, 2007), and those at PB were actively surface feeding. This feeding mode is characterized by whale sharks swimming fast at the surface, often with the upper jaw, first dorsal and upper caudal lobe out of the water, and actively gulping in water.
Trawl Surveys
Plastic sampling took place between January 2016 and February 2018. Samples were collected during three wet seasons (2016, 17, 18) and two dry seasons (2016, 17) from N-MB and S-MB; and during two of each season from KM (2016, 2017) (Table 1). Swimmer towed sampling occurred only when manta rays or whale sharks were feeding. Samples were collected by towing a small round net (0.2 m diameter mouth × 0.60 m length, 200 μm mesh size) adjacent to feeding animals (min. distance of 3 m) by a swimmer (Supplementary Figure 2) for 5 to 10 min (depending on conditions and animal behavior). The results were normalized to the tow times (i.e., results are presented in pieces min–1).
Boat towed trawl sampling occurred in two consecutive net tows (replicates) per day taken on six or seven individual sampling days per season for each year at MB and KM (Table 1). Sampling at PB took place during six sampling days in 2017 only during the wet season as, generally, whale sharks are absent during the dry season (Kamal et al., 2016) (Table 1). Samples were collected by towing a round net (0.5 m diameter mouth × 1.5 m length, 200 μm mesh size), with a mechanical flow meter (Sea Gear) affixed in the center of the net mouth. The results were normalized to the filtered volume (i.e., results were presented in pieces m–3). The net was rigged to sample from the sub-surface layers of the water column (up to 0.5 m depth), representative of where local manta rays and whale sharks surface feed (E. Germanov and M. Himawan, personal observation). The net was towed for up to 10 min (mean ± 1 SE = 8.1 ± 0.2) between two standard start and stop positions at a mean speed of 3.28 ± 0.1 km h–1, covering a mean distance of 438.6 ± 15.8 m. Overall the mean sampled volume was 35.8 ± 1.4 m–3. Care was taken to ensure sampling took place outside the wake of the boat to limit surface vertical mixing. Furthermore, to minimize any potential disturbance to animals, the boat was kept ≥ 15 m from any animal present. To limit potential tidal influences caused by tidally forced internal waves affecting the transport of surface slicks and maximize sampling opportunities while animals were feeding (personal observation), we aimed to complete sampling and surveys at MB and PB within ∼2 h of high tide, and within 1 h prior to low tide at KM. To limit wind-mixing variability (Collignon et al., 2012; Reisser et al., 2013), surveys were completed under Beaufort wind scale conditions of ≤ 4.
Our trawl methodology is appropriate for manta ray and whale shark feeding ecology studies (Couturier et al., 2013; Rohner et al., 2015), but differs from the standard microplastic methodology using neuston or ‘manta’ nets (Reisser et al., 2013; Eriksen et al., 2014 and reviewed by Hidalgo-Ruz et al., 2012). Neuston or ‘manta’ nets, rigged to sample from the surface-water interface will sample proportionally sample more from the surface than a similarly rigged net with a round opening, as the rectangular mouth opening of the net would sample equally from the surface-water interface as below the surface (see Supplementary Figure 1A). Our plastic abundance estimates are based on samples collected mostly from sub-surface waters, and as a result, might not be directly comparable to those obtained with standard microplastic methodology. However, we converted our results to be presented in comparable units (km–2) to those of modeled estimates (as per van Sebille et al., 2015) by multiplying by the submerged height of the net (0.5 m) to obtain the data in m–2 and then converted to km–2 (see Supplementary Figure 1B). Results are expressed two ways (Figure 4 and Table 2): (1) the number of plastic pieces m–3 and (2) the number of pieces converted to plastic km–2.
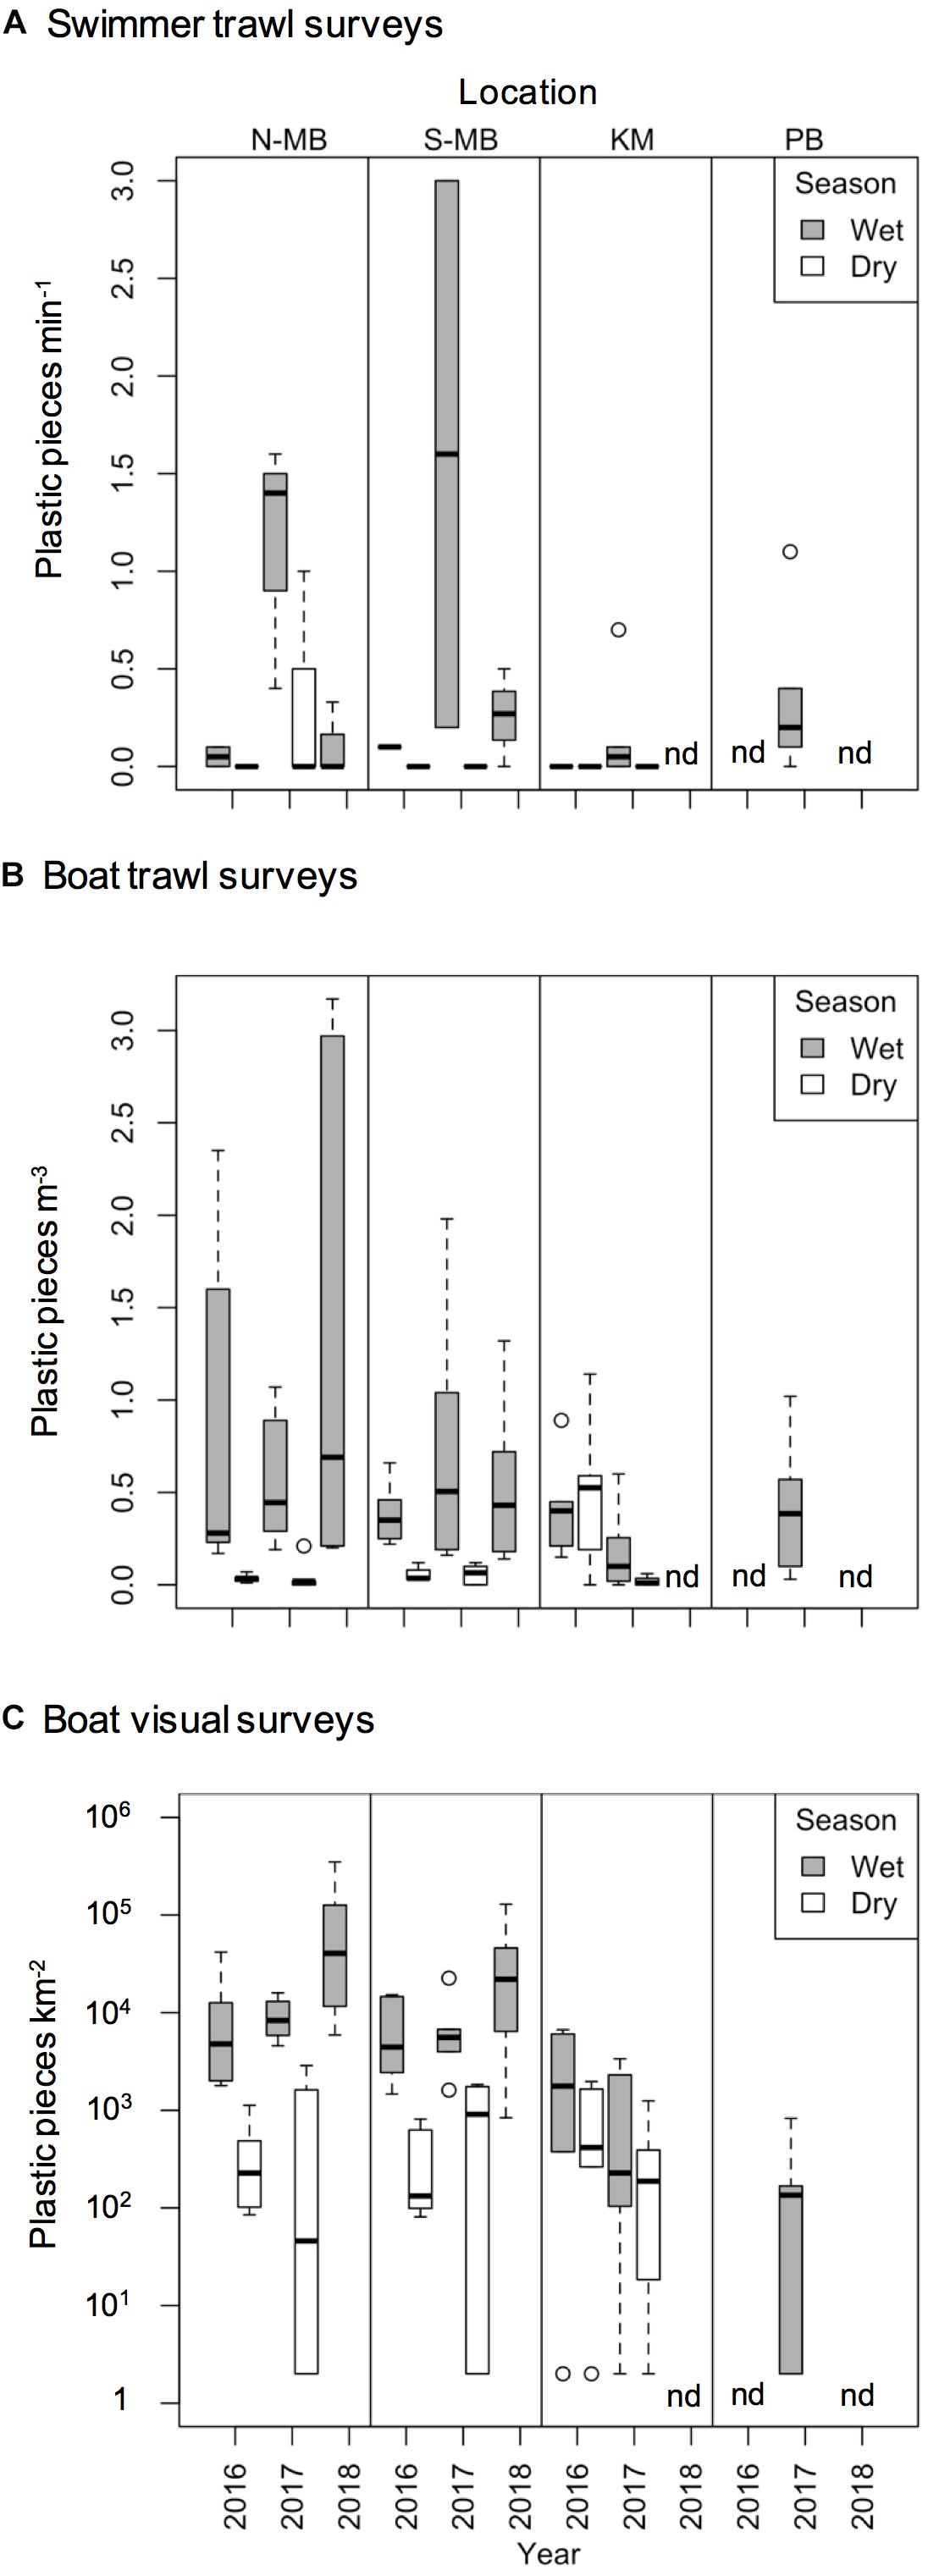
Figure 4. Boxplot depicting plastic abundance estimated through (A) swimmer towed trawl surveys (plastic min– 1), (B) boat trawl surveys (plastic m– 3), and (C) visually counted anthropogenic debris (plastic km– 2) from north (N-MB) and south (S-MB) Manta Bay, Nusa Penida; Karang Makassar (KM), Komodo National Park; and Pantai Bentar (PB), East Java.
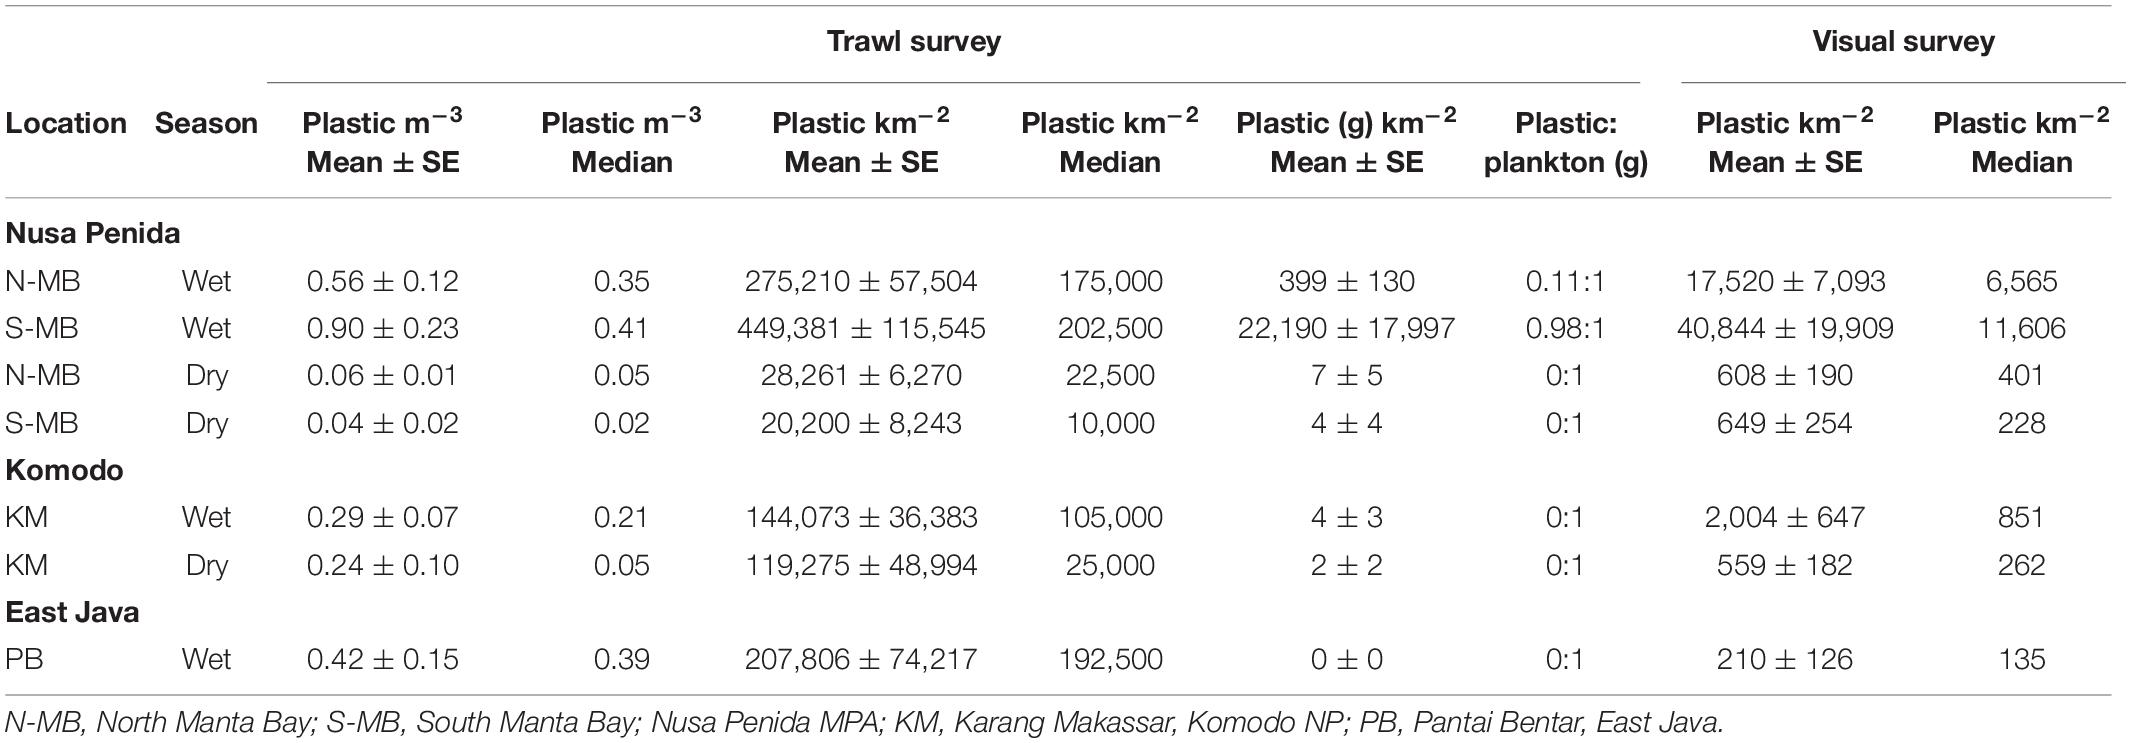
Table 2. Floating plastic debris abundance estimates for each sampling location and season and pooled across years.
Sample Analysis
After each tow, the net was washed with filtered sea water to collect all organic and inorganic material stuck on the side of the mesh. Any large debris was removed manually and placed in a separate container. Large natural debris, such as leaves and sticks, were carefully rinsed before being discarded. The resulting sample was decanted from the collecting jar, reduced to a final volume of 50 or 100 ml (depending on the density of plankton) and preserved in a 5% formaldehyde-seawater buffered solution. Samples were stored in the 5% formaldehyde solution or were transferred to 70% ethanol for storage prior to analysis.
The plastics were separated from the organic material gravimetrically (Collignon et al., 2012) in filtered sea water for 10–16 h (overnight) in 1 L graduated cylinders (organic matter settled on the bottom of the cylinders while plastics floated). Visible pieces of plastic were separated from the solution using forceps and the top water layer containing microplastics was siphoned, transferred to filter paper (Whatman No.1) and dried at room temperature. The organic layer was thoroughly checked for any remaining plastics, which were added to the filter paper. Once dry, the filter paper was examined for plastic using a dissecting microscope. Plastics were counted, measured (length = longest side), and sorted by size class (< 1, 1.01–5, 5.01–200, and > 200 mm; Eriksen et al., 2014), and type (‘film,’ ‘foam,’ ‘fragment,’ ‘line,’ and ‘other’; Rochman et al., 2015). Plastic pieces as small as 0.1 mm were considered with no upper size limit. For this study, we considered all plastics that were collected in our trawls and going forward we use the term ‘microplastics’ to distinguish plastic pieces < 5 mm as is the commonly accepted definition (e.g., Andrady, 2011). A plastic particle was considered to be ‘film’ if it was thin and bent easily; ‘foam’ if it was thicker and compressed under light pressure; ‘fragment’ if it was hard, often brittle under light pressure; ‘line” if it had an elongated, cylindrical shape, bent easily, but was hard under light pressure; and ‘other’ included paint fragments, which were opaque, thin pieces that fragmented easily under light pressure, and tar, which was black in color and viscous. Fibers, apart from fishing line and monofilament rope, were excluded from the results, as we could not guarantee that samples were free from airborne fiber contamination during sample analysis (Rochman et al., 2015). When it was unsure if a particle was composed of plastic it was touched with a hot needle point, and particles that melted were confirmed as plastic (Vandermeersch et al., 2015; Roch and Brinker, 2017; Shim et al., 2017). Plastic and biological material were dried (24 h at 60°C) and weighed separately to calculate the weight ratio of plastic to plankton for each sample.
Visual Surveys
Visual survey transects of floating plastic debris were carried out simultaneously with the net tows. Additionally, during the 2016 wet season in MB a third daily replicate of the visual surveys was recorded (Table 1). Dedicated observers stood on the bow of the small motorized boats and noted debris items within 5 m of either side of the boats during timed observation periods, with GPS points taken for the start and end positions of each transect. These positions were used to denote the length of the transect and calculate the area surveyed (Eriksen et al., 2014). The results are expressed in number of plastic pieces km–2. Debris observations were broken down into five categories: plastic ‘films’ (i.e., bags and wrappers), plastic ‘fragments’ (i.e., hard plastic), ‘foam’ (i.e., foamed polystyrene), ‘bottle’ (i.e., beverage bottles and single use plastic cups) and ‘other’ items such as plastic drinking straws, cigarette butts, sandals and ropes, representing commonly found items and plastic polymer types found in the marine environment (Andrady, 2011).
Manta Ray Egested Material Collection and Analysis
Manta ray fecal matter or vomit (i.e., egested material) was collected opportunistically during recreational dives by dive professionals in the local dive community. Once egested material was released into the open water column by the manta ray, any densely packed matter was immediately collected into 50 ml conical polypropylene containers with a screw cap, keeping the material as intact as possible. Overall, a total of 22 samples of egested material (21 fecal and one vomit sample) were collected from within the Nusa Penida MPA.
Samples were stored at −20°C until analysis. Prior to analysis, the samples were thawed at 4°C before examining the contents carefully at 40X magnification in a glass Petri dish using a stereomicroscope. Plastic pieces were removed using forceps and placed on filter paper. The remaining organic material was separated gravimetrically and floating plastic was separated as outlined above. Subsequently, the remaining biological material and debris transferred to filter paper were carefully examined and all plastics were counted and classified according to the criteria outlined above. Fibers (apart from fishing line and monofilament rope) were excluded from the final plastic tally for the reasons outlined above. Finally, both organic and plastic material were dried and weighed and the ratio of plastic to organic material was calculated as outlined above.
Calculating Theoretical Plastic Ingestion Rates
Based on the estimated abundance of microplastics and the estimated water filtration rates for manta rays and whale sharks of approximately 86.4 m3 and 326 m3 h–1, respectively (Motta et al., 2010; Paig-Tran et al., 2013), we calculated theoretical plastic ingestion rates for manta rays and whale sharks. Rates were calculated based on the estimated mean number of pieces of plastics per unit volume at the different study locations (i.e., ingestion rate = filtration rate × number of pieces of plastic per unit volume).
Statistical Analyses
Daily site replicate samples for swimmer, boat trawl, and visual survey data were pooled, and the resulting daily site means were used in analyses, which were all carried out using R statistical software (R Core Team, 2018). The correlation between the levels of plastic documented by visual and trawl surveys was estimated using Kendall’s tau.
Annual, seasonal and location effects were evaluated. Initial analysis highlighted the importance of incorporating a location × season interaction, as well as the need to log-transform the dependent variable (number of floating plastic pieces assessed by visual and trawl surveys). No plastics were detected in 11% (n = 172) of trawl and 12% (n = 184) of visual samples (Table 1). For these cases, we adjusted the 0 values with a constant equal to approximately 1/2 of the lowest non-zero value (30 for visually assessed floating plastic data and 0.005 for trawl survey floating plastic data). The value of the constant was chosen to minimize its influence on the results, while ensuring the greatest compliance of residuals for a homogenous distribution. Back transformations of coefficients from linear models ignored these constants, as a sensitivity analysis found that their impact was negligible. Data from PB were excluded from these analyses as we only collected data in the 2017 wet season, so annual and season effects could not be estimated. Data from PB, and, because of the small sample sizes, all data resulting from swimmer towed trawl surveys were analyzed using descriptive statistics.
Results
Local Rainfall
Remote sensing rain data available from the Indonesian Meteorology, Climatology and Geophysics Agency (BMKG) illustrates seasonality in rainfall and annual and regional variations (Figure 3).
Manta Ray and Whale Shark Observations
Manta rays were present on 80% of the surveys (n = 60) at north and south Manta Bay (N-MB, S-MB) combined and were feeding 73% of the time with no seasonal variation in presence. Manta rays were present and feeding on 58% of surveys (n = 26) at KM; however, most (80%) of the feeding events at Karang Makassar (KM) were during the wet season. Whale sharks were present during every survey (n = 6) at Pantai Bentar (PB) and feeding on 83.3% of surveys.
Trawl Surveys
Swimmer towed trawl samples collected whilst manta rays were feeding confirmed that microplastics were present in their immediate feeding areas (Figure 4A; created using R, 2018). A total of 43% of all samples including daily replicates (25 out of 58) contained plastics corresponding to 45% of sample days (17 out of 38 days). The total mean number (± 1 SE) of plastic pieces min–1 of sampling by swimming in Nusa Penida during the wet season was 0.68 ± 0.23 pieces min–1 for N-MB and 0.48 ± 0.47 pieces min–1 for S-MB. Little (0.17 ± 0.17 pieces min–1) to no plastic was found in the dry season samples from S-MB and N-MB, and respectively. The total mean plastics by swimming in KM was 0.11 ± 0.09 pieces min–1 for the wet season, while no plastic was found in the dry season. Swimmer towed samples collected amidst feeding whale sharks at PB also confirmed microplastics in their immediate feeding area. The total mean number of plastic pieces min–1 swimming there was 0.33 ± 0.16.
To assess annual (2016–2018), seasonal (wet vs. dry), and location (N-MB, S-MB, or KM) effects on sampled plastic abundance, we fitted a linear model of log-transformed plastic abundance on year, season, location and a season-location interaction with N-MB wet season data as the intercept. The results from these models (Table 3) based on the quantitative trawl surveys of floating plastic (Figure 4B), indicate that there is a seasonal effect on plastic abundance that is dependent on location (p = 2.4 × 10⁻⁶), but did not detect a year effect after adjusting for location, season, and the season-location interaction (p = 0.073) (Table 3). Plastic at N-MB was 12.62 times more abundant (p = 2.4 × 10⁻⁶) during the wet season than the dry season for a given year (Table 3). Plastic abundance at S-MB in the wet season is estimated to be 28.2 times more abundant at S-MB than plastic abundance in the dry season for a given year; however, this seasonal effect was not significantly different from the seasonal effect for N-MB (p = 0.246). The seasonal effect was also significant at KM (p = 0.037), but the size of the effect was smaller than at MB – plastic was 2.8 times more abundant during the wet season than the dry season for a given year (Table 3). Plastic abundance was similar for nearby N-MB and S-MB during the wet season (p = 0.498), but 3.5 times greater (p = 0.012) at N-MB than at KM during the wet season (Table 3), indicating geographic differences in plastic abundance between these two locations over 450 km apart. Testing for location effects excluded PB due to the availability of a single season of data (the 2017 wet season only). However, the mean and median abundance of plastic during the 2017 wet season at PB (207,806 ± 74,217) was similar in magnitude to those for MB and KM during the wet season (range of means: 144,073–449,381; see Figure 4B and Table 2).
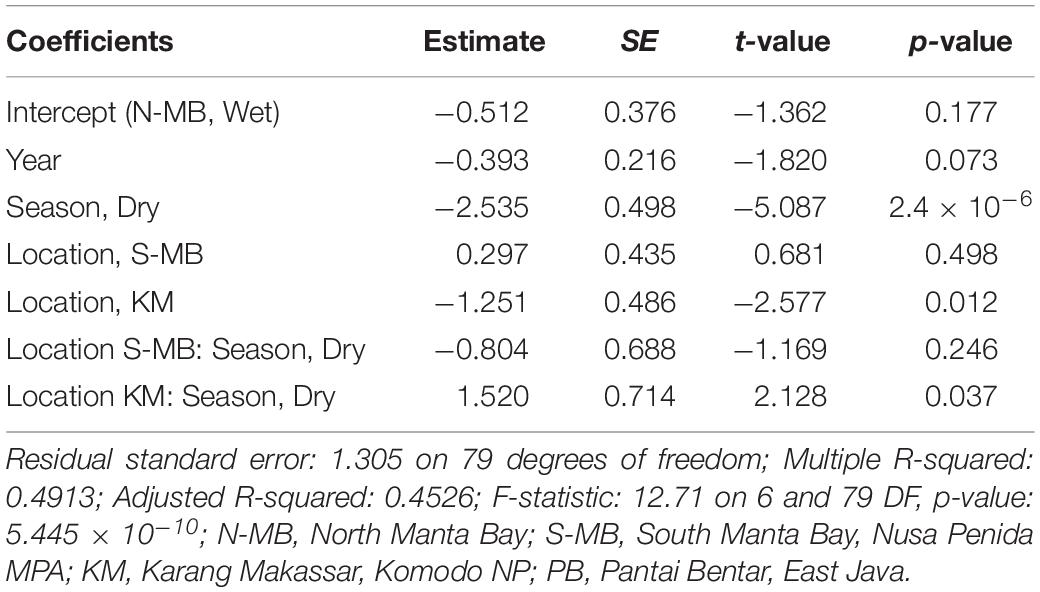
Table 3. Estimated coefficients, t-values and significance levels (p), for linear model of log-transformed trawl sampled anthropogenic debris (plastic m–3) on year, season, location and a season-location interaction.
Visual Surveys
Similar to trawl surveys, the linear model (Table 4) for visual surveys of floating plastics (Figure 4C) identified a strong seasonal effect of plastic abundance that is dependent on location but failed to find an annual temporal effect (p = 0.131). Plastic was an estimated 23 times more abundant (p = 7.83 × 10⁻⁷) during the wet season than the dry season at N-MB for a given year. Plastic abundance at S-MB in the wet season is estimated to be 44.5 times greater than plastic abundance during the dry season. Although this seasonal effect for S-MB was significant, it was not significantly different than the seasonal effect for N-MB (p = 0.417), in line with what was observed with the trawl survey. In comparison to N-MB, a lesser (p = 0.008) seasonal effect was observed for KM with plastic abundance in the wet season an estimated 2.4 times greater than in the dry season for a given year (Table 4). Like trawl sampled plastic abundance, visually assessed plastic abundance during the wet season differed between N-MB and KM (p = 9.83 × 10⁻⁵) but not between S-MB and N-MB (p = 0.313) (Table 4), further indicating a geographic effect on plastic abundance. Moreover, the amounts of visually assessed and trawl sampled plastic were dependent and concordant (Kendall’s tau coefficient = 0.42, z = 5.83, p = 5.60 × 10⁻⁹, n = 184) for all locations (including PB), indicating that visually monitoring plastic abundance might be sufficient to capture the broader seasonal and geographic trends. However, the mean abundance of visually observed floating plastic at PB during the wet season (210 ± 126 plastic km–2) appears lower than that of N-MB, S-MB, and KM during the same season (range of means: 2,004–40,844, see Figure 4C and Table 2).
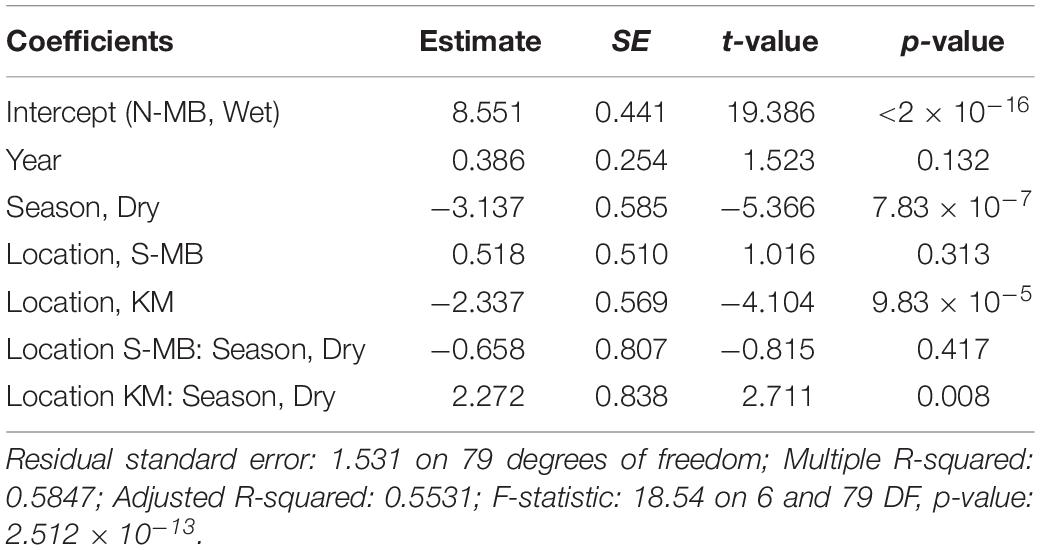
Table 4. Estimated coefficients, t-values and significance levels (p), for linear model of log-transformed visually counted anthropogenic debris (plastic km–2) on year, location, season, and a location-season interaction.
Characterization of Debris
Most (range: 78–98%) trawl sampled plastic pieces were < 5 mm long in all study locations (Figure 5A). The majority of plastic pieces at N-MB, S-MB, and KM were in the second smallest category (1–5 mm; 53–66%), while the smallest category (<1 mm) dominated at PB (53%). Larger plastic debris > 5 mm long was present at all locations, but its contribution to the total plastics was generally small and varied among locations (2–22%).
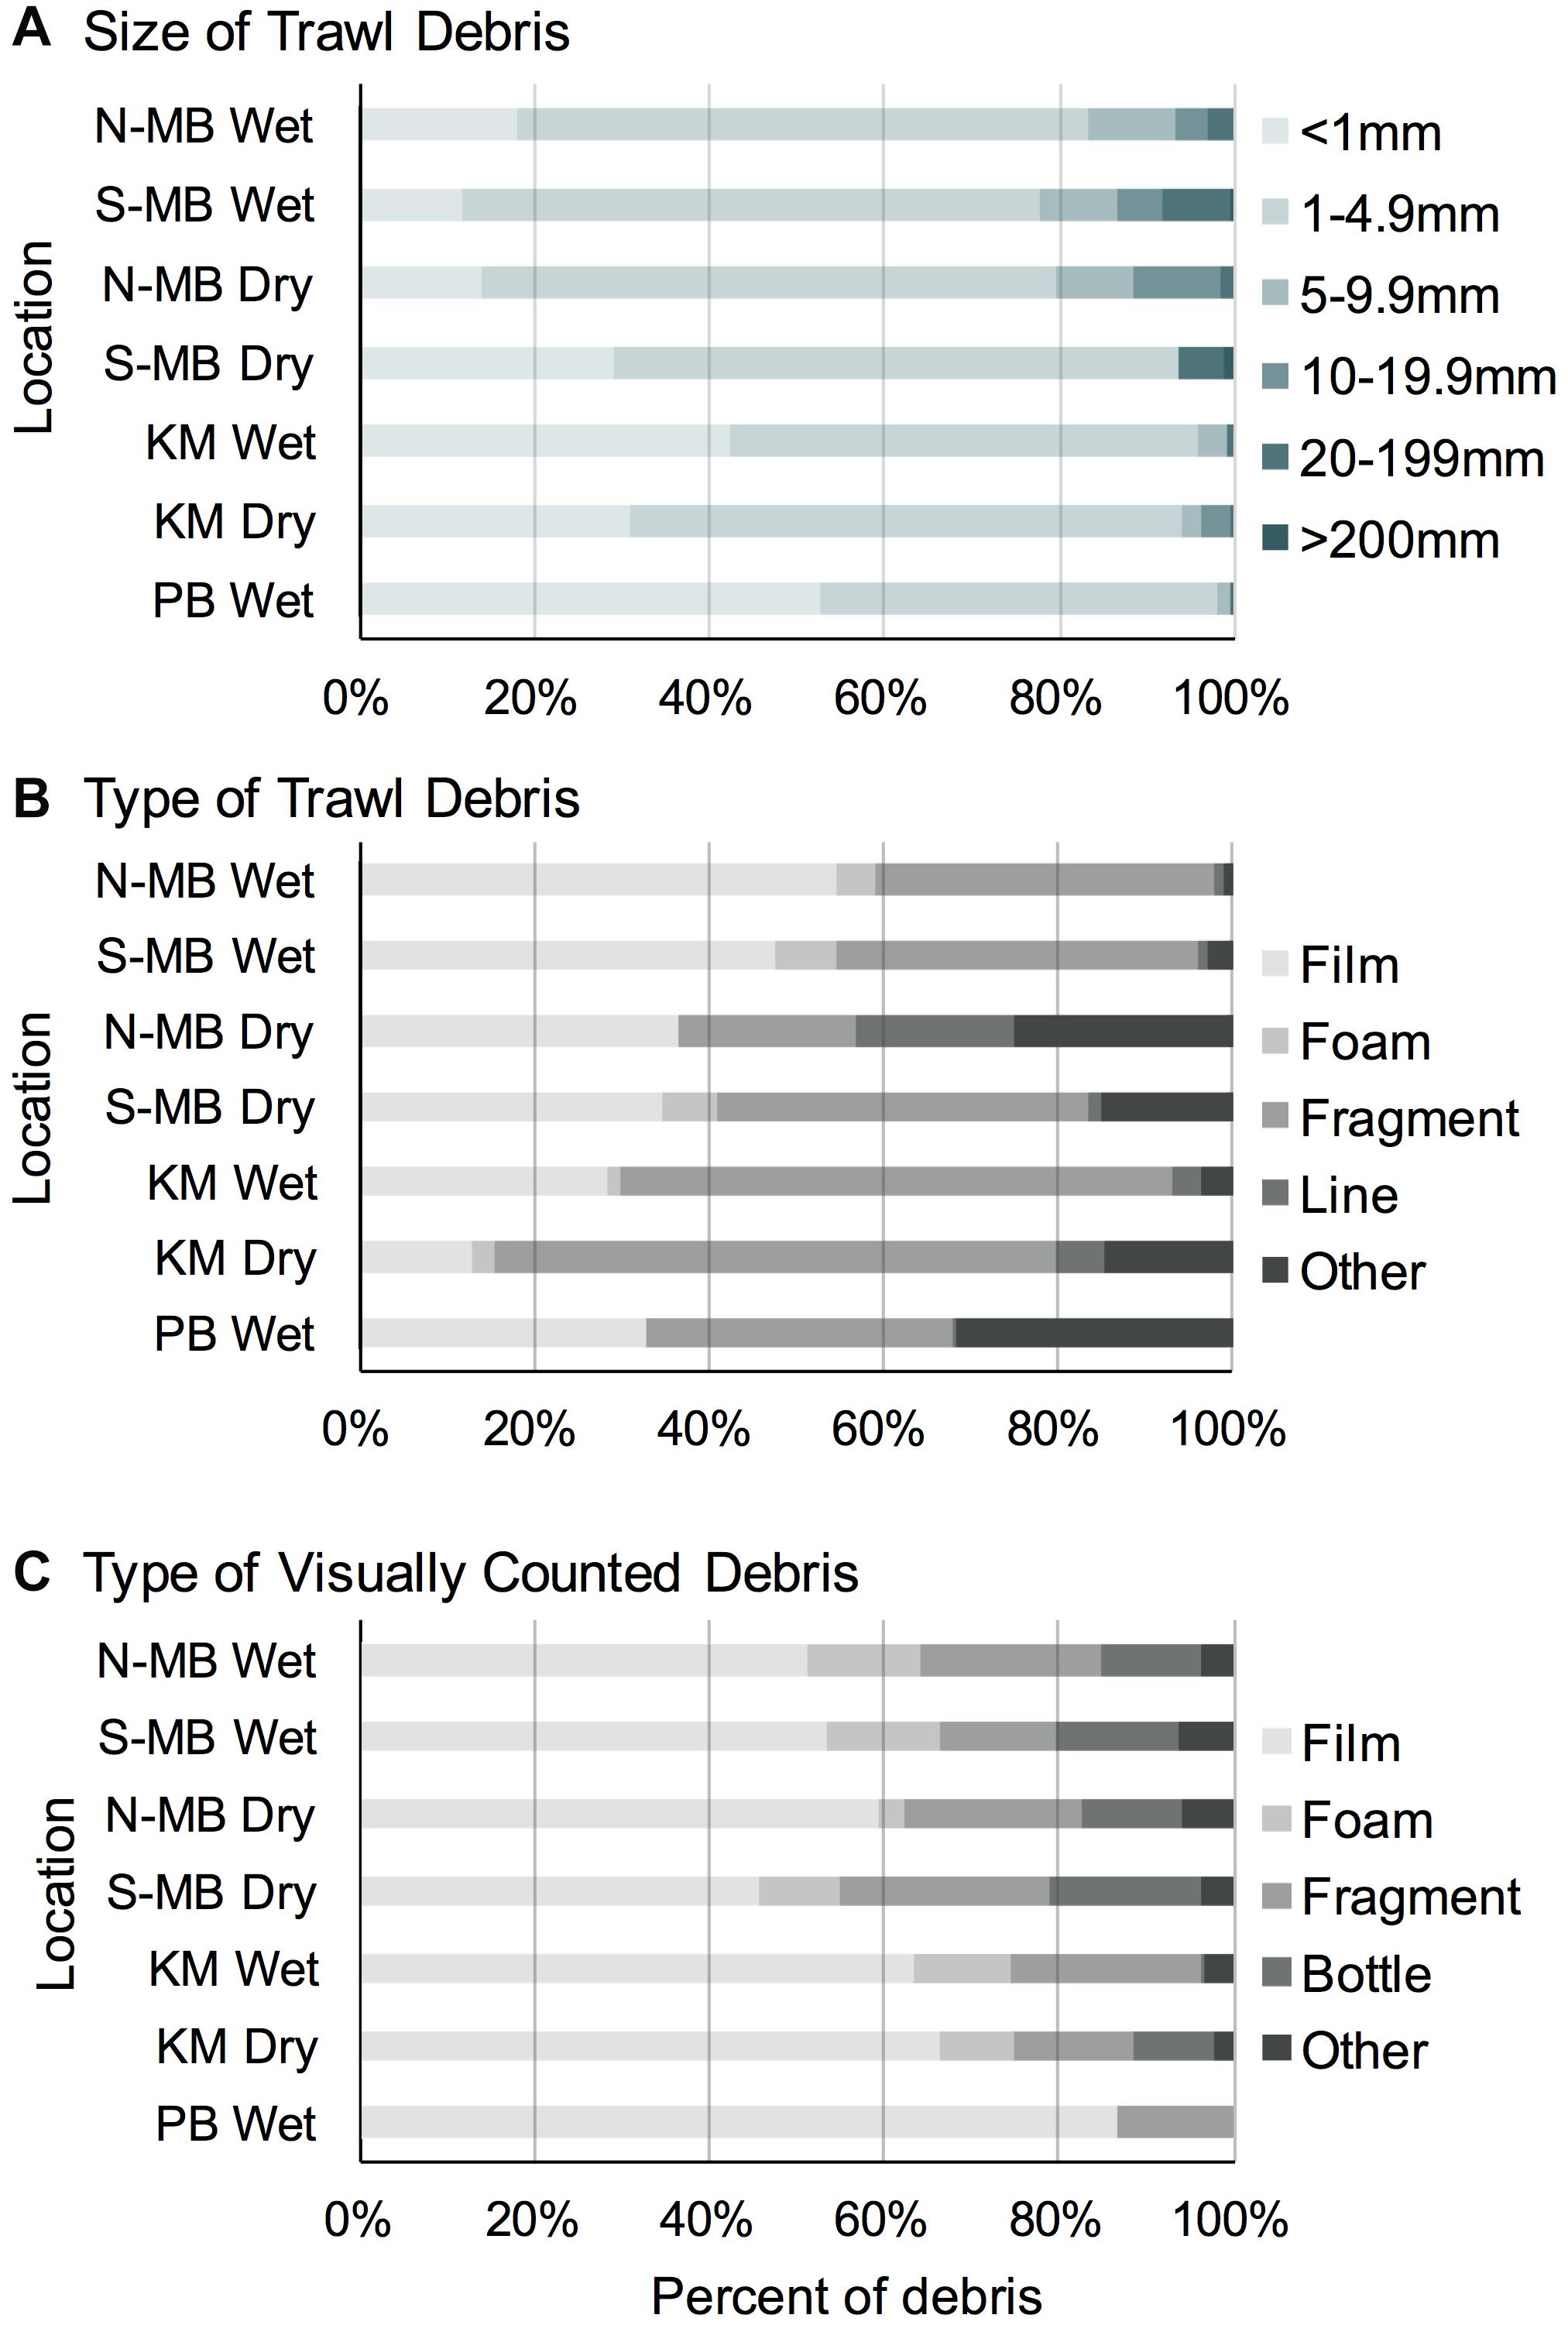
Figure 5. The size (A) and type (B) of anthropogenic debris recorded through trawl and visual (C) surveys from South (MB-S) and North (MB-N) Manta Bay, Nusa Penida, Karang Makassar (KM), Komodo National Park and Pantai Bentar (PB), East Java pooled across years and presented as a fraction of the total amount.
Overall, the trawl sampled debris was mostly composed of plastic ‘films’ (range: 28–55%), with the exception of the dry season in KM (13%), and plastic ‘fragments’ (range: 20–65%) (Figure 5B). At N-MB and S-MB, 35–55% of debris were plastic ‘films’ and 20–43% were plastic ‘fragments.’ At KM, plastic ‘fragments’ were most common (63–65%) during both seasons; whereas, during the wet season, 28% of debris were plastic ‘films’ compared to 13% in the dry season (Figure 5B). Plastic debris at PB during the wet season was approximately equally composed of ‘films’ (33%), ‘fragments’ (35%) and ‘other’ debris (32%), which was mostly paint fragments. Debris classified as ‘other’ (range: 1–25%) included paint fragments and tar for N-MB, S-MB, and KM. A total of 458 fibers were found in all samples and were excluded from debris counts. The types of debris found in the swimmer towed samples amidst feeding manta rays from MB and the number of pieces (in parentheses) included films (9), fragments (5), foam (1), lines (2) and other items, including paint fragments and tar (3). The types of debris collected by swimmer towed samples from KM included fragments (3) and tar (1). The types of debris found in swimmer towed samples from PB were films (2), fragments (3) and other items (6), including paint fragments and tar. Fibers were found in 43% (25) of all samples but were excluded from plastic calculations.
The visually counted plastic debris was mostly plastic ‘films’ (range: 45–87%) and plastic ‘fragments’ (range: 13–24%; Figure 5C) corresponding to the most common types of trawl sampled debris (Figure 5B). Foamed polystyrene was commonly observed at N-MB, S-MB, and KM making up 3–13% of debris. Whole bottles and single use cups (counted as ‘bottle’) were also commonly observed at the sites in Nusa Penida, regardless of season, and in Komodo during the dry season, making up 9–18% of floating debris. Items classified as ‘other’ in visual surveys included plastic straws, cigarette butts, ropes, sandals, shoe soles, and other rubber items.
Plastic Ingestion
In MB, based on mean plastic abundance estimates for the north and south sections of the bay combined, the estimated plastic ingestion by manta rays was 62.7 pieces h–1 during the wet season and 4.4 pieces h–1 during the dry season (Table 5). These values compare with estimated ingestion rates for KM of 25.1 pieces h–1 during the wet season and 20.7 pieces h–1 during the dry season. In PB, the estimated wet season plastic ingestion by whale sharks was ∼136.9 pieces h–1. Based on the ratio of plastic to plankton by weight (Table 3), in the wet season, manta rays in MB might be ingesting between 110 and 980 g of plastic for every kg of plankton. However, unlike plastic, plankton abundance by weight did not appear to vary seasonally for MB and KM (Supplementary Figure 3).
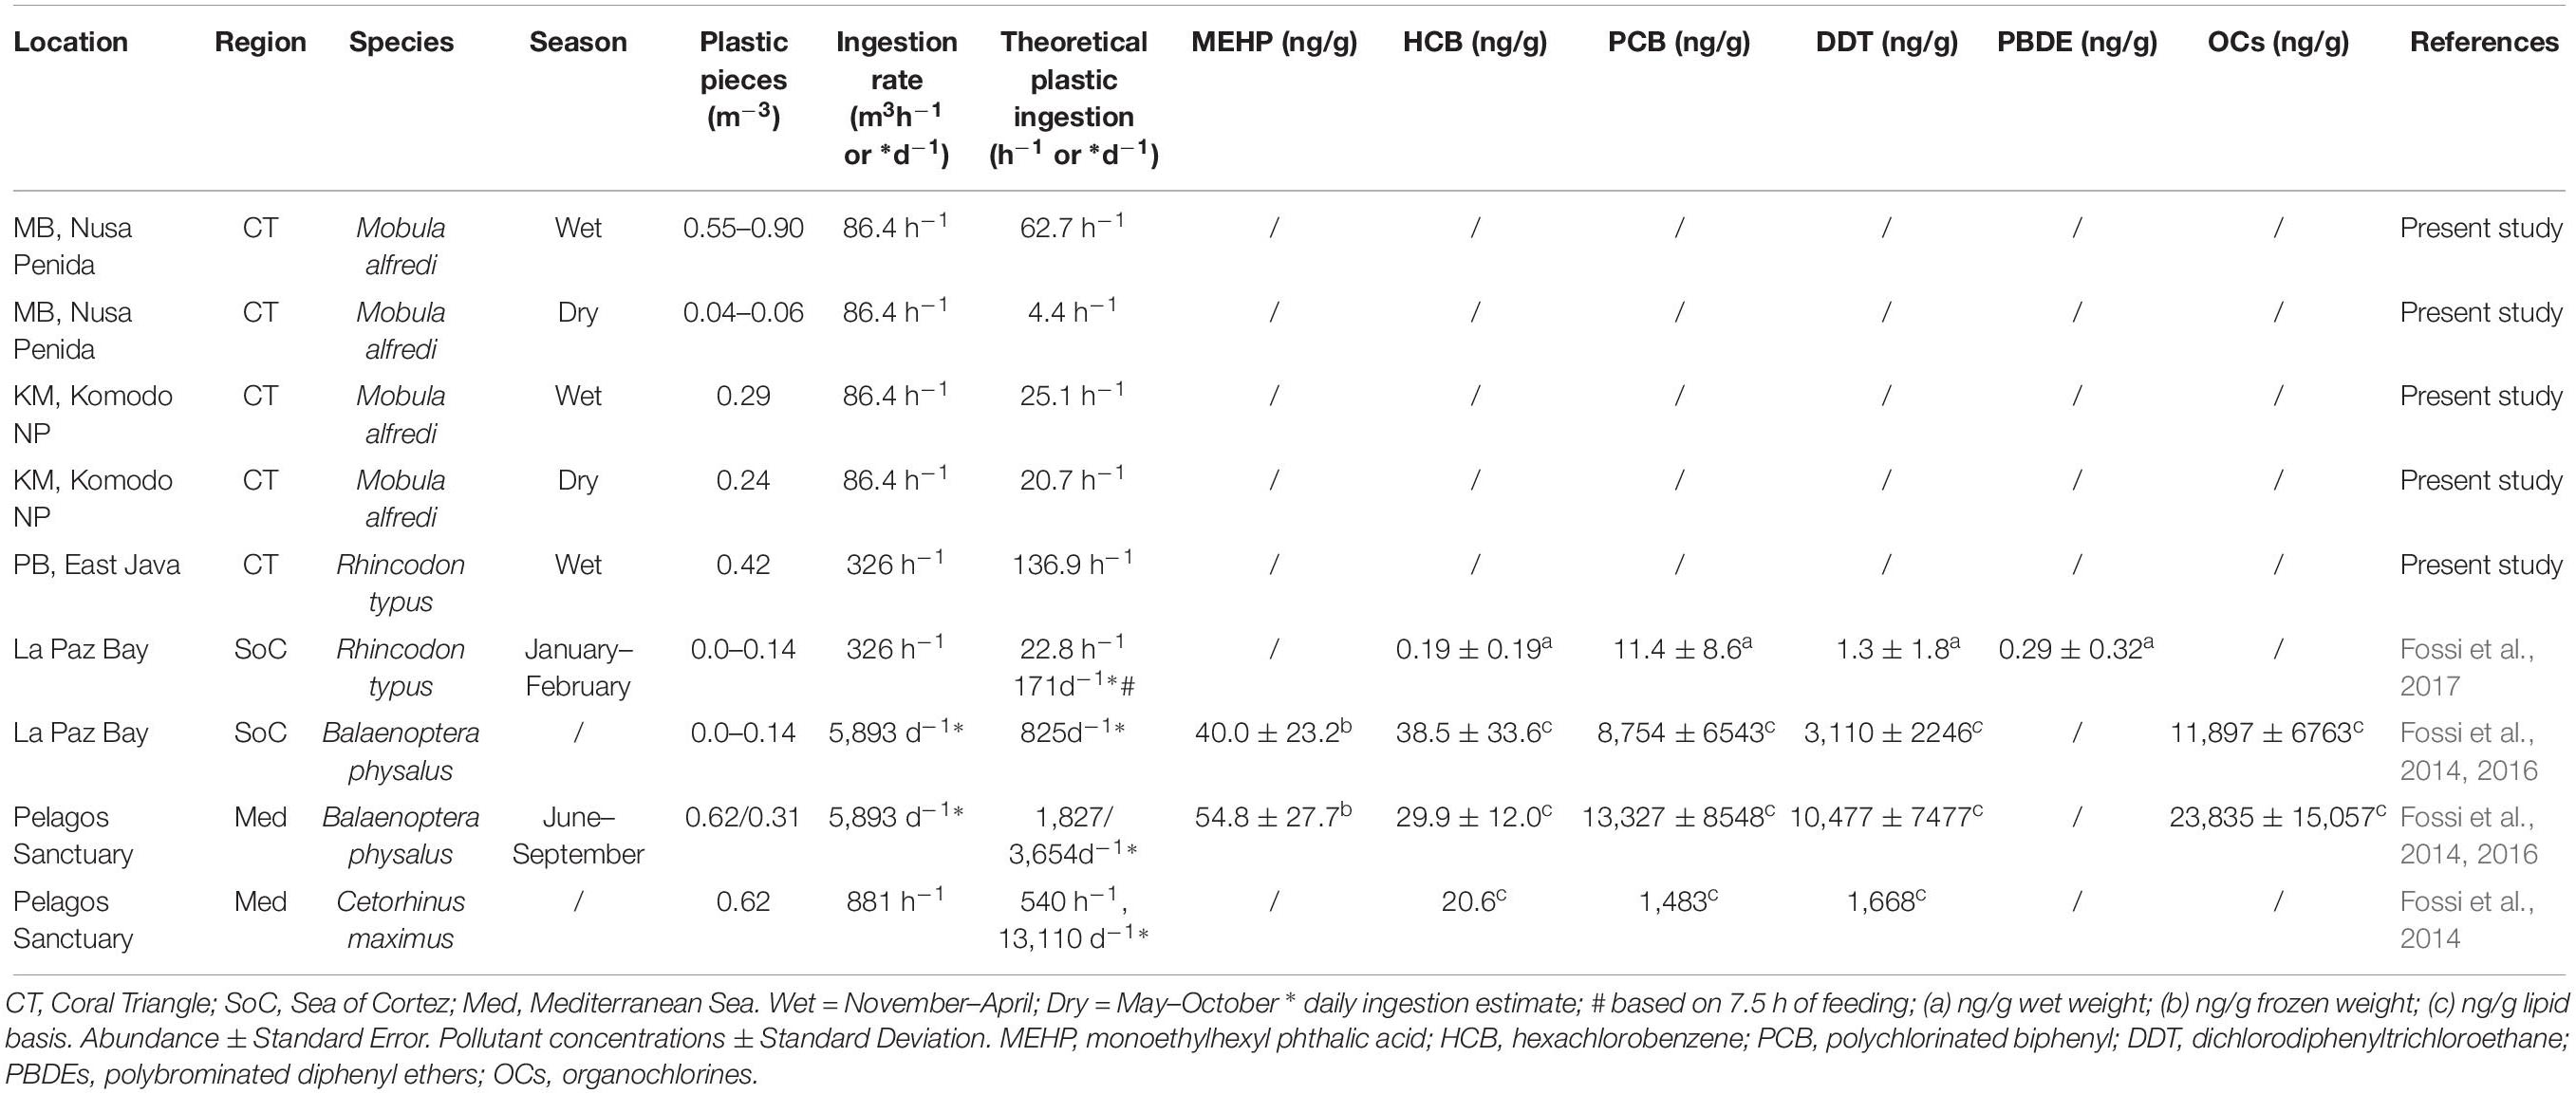
Table 5. A comparison of plastic abundance estimates in filter feeding megafauna foraging grounds, theoretical ingestion estimates and plastic associated pollutant levels (when available).
The amount of manta ray egested fecal material opportunistically collected from free swimming manta rays varied considerably, ranging from ∼0 to 3.17 g dry weight (n = 21), with three samples weighing > 0.5 g dry weight. One of these fecal samples (0.58 g), collected at Manta Point, Nusa Penida, ∼12 km south of S-MB, contained 26 pieces of plastic (Figure 6). The overall mean length of the plastics was 7.8 mm, with 54% of plastics being < 5 mm, and the rest being > 5 up to 30 mm. Two fiber pieces, 3 and 5.5 mm, were excluded. The ratio of plastic dry weight (0.05 g) to that of organic material (0.58 g) for this sample was 0.09:1. Further, a single sample of manta ray vomit, also collected at Manta Point, contained 66 pieces of plastic (Figure 7). The overall mean length of the plastics was 7.7 mm, with 77% of plastics being < 5 mm, and the rest being > 5 up to 94 mm. No fibers were found in this sample. The ratio of plastic dry weight (0.25 g) to that of organic material (4.12 g) for this sample was 0.06:1. Although only two of the samples of egested material were confirmed to contain plastics (other than fibers), these findings provide proof of plastic ingestion by manta rays.
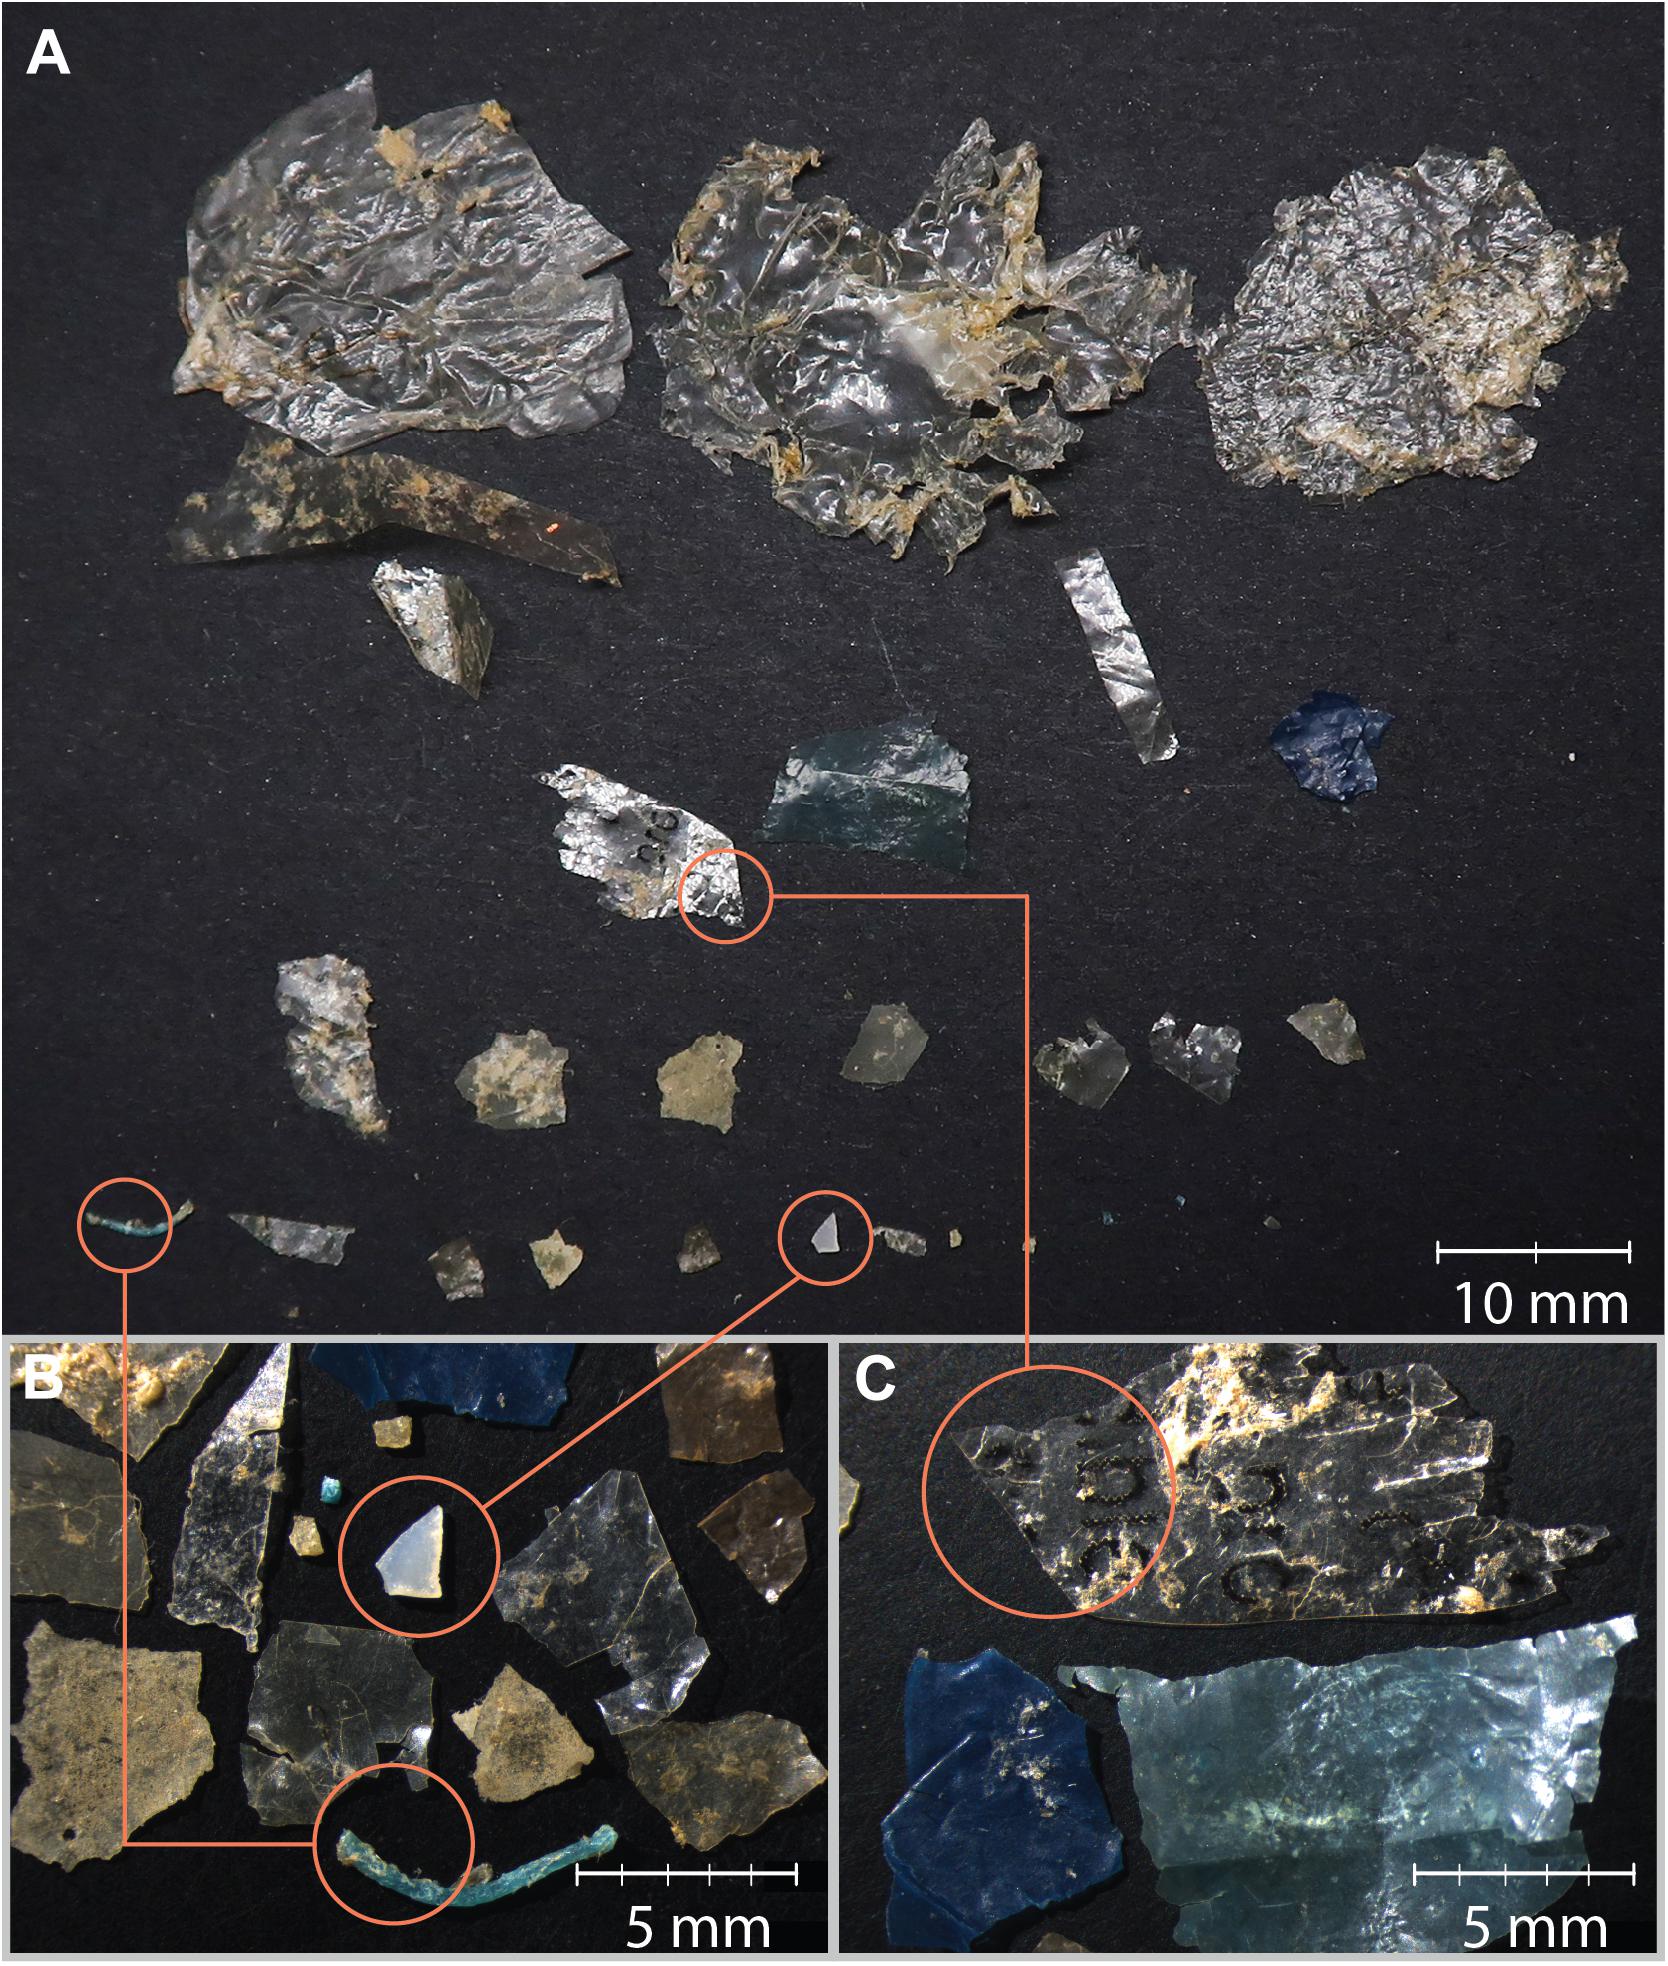
Figure 6. Low (A) and high magnification photographs of smaller (B) and larger (C) plastic debris found in manta ray fecal material (n = 1) from Nusa Penida, Indonesia.
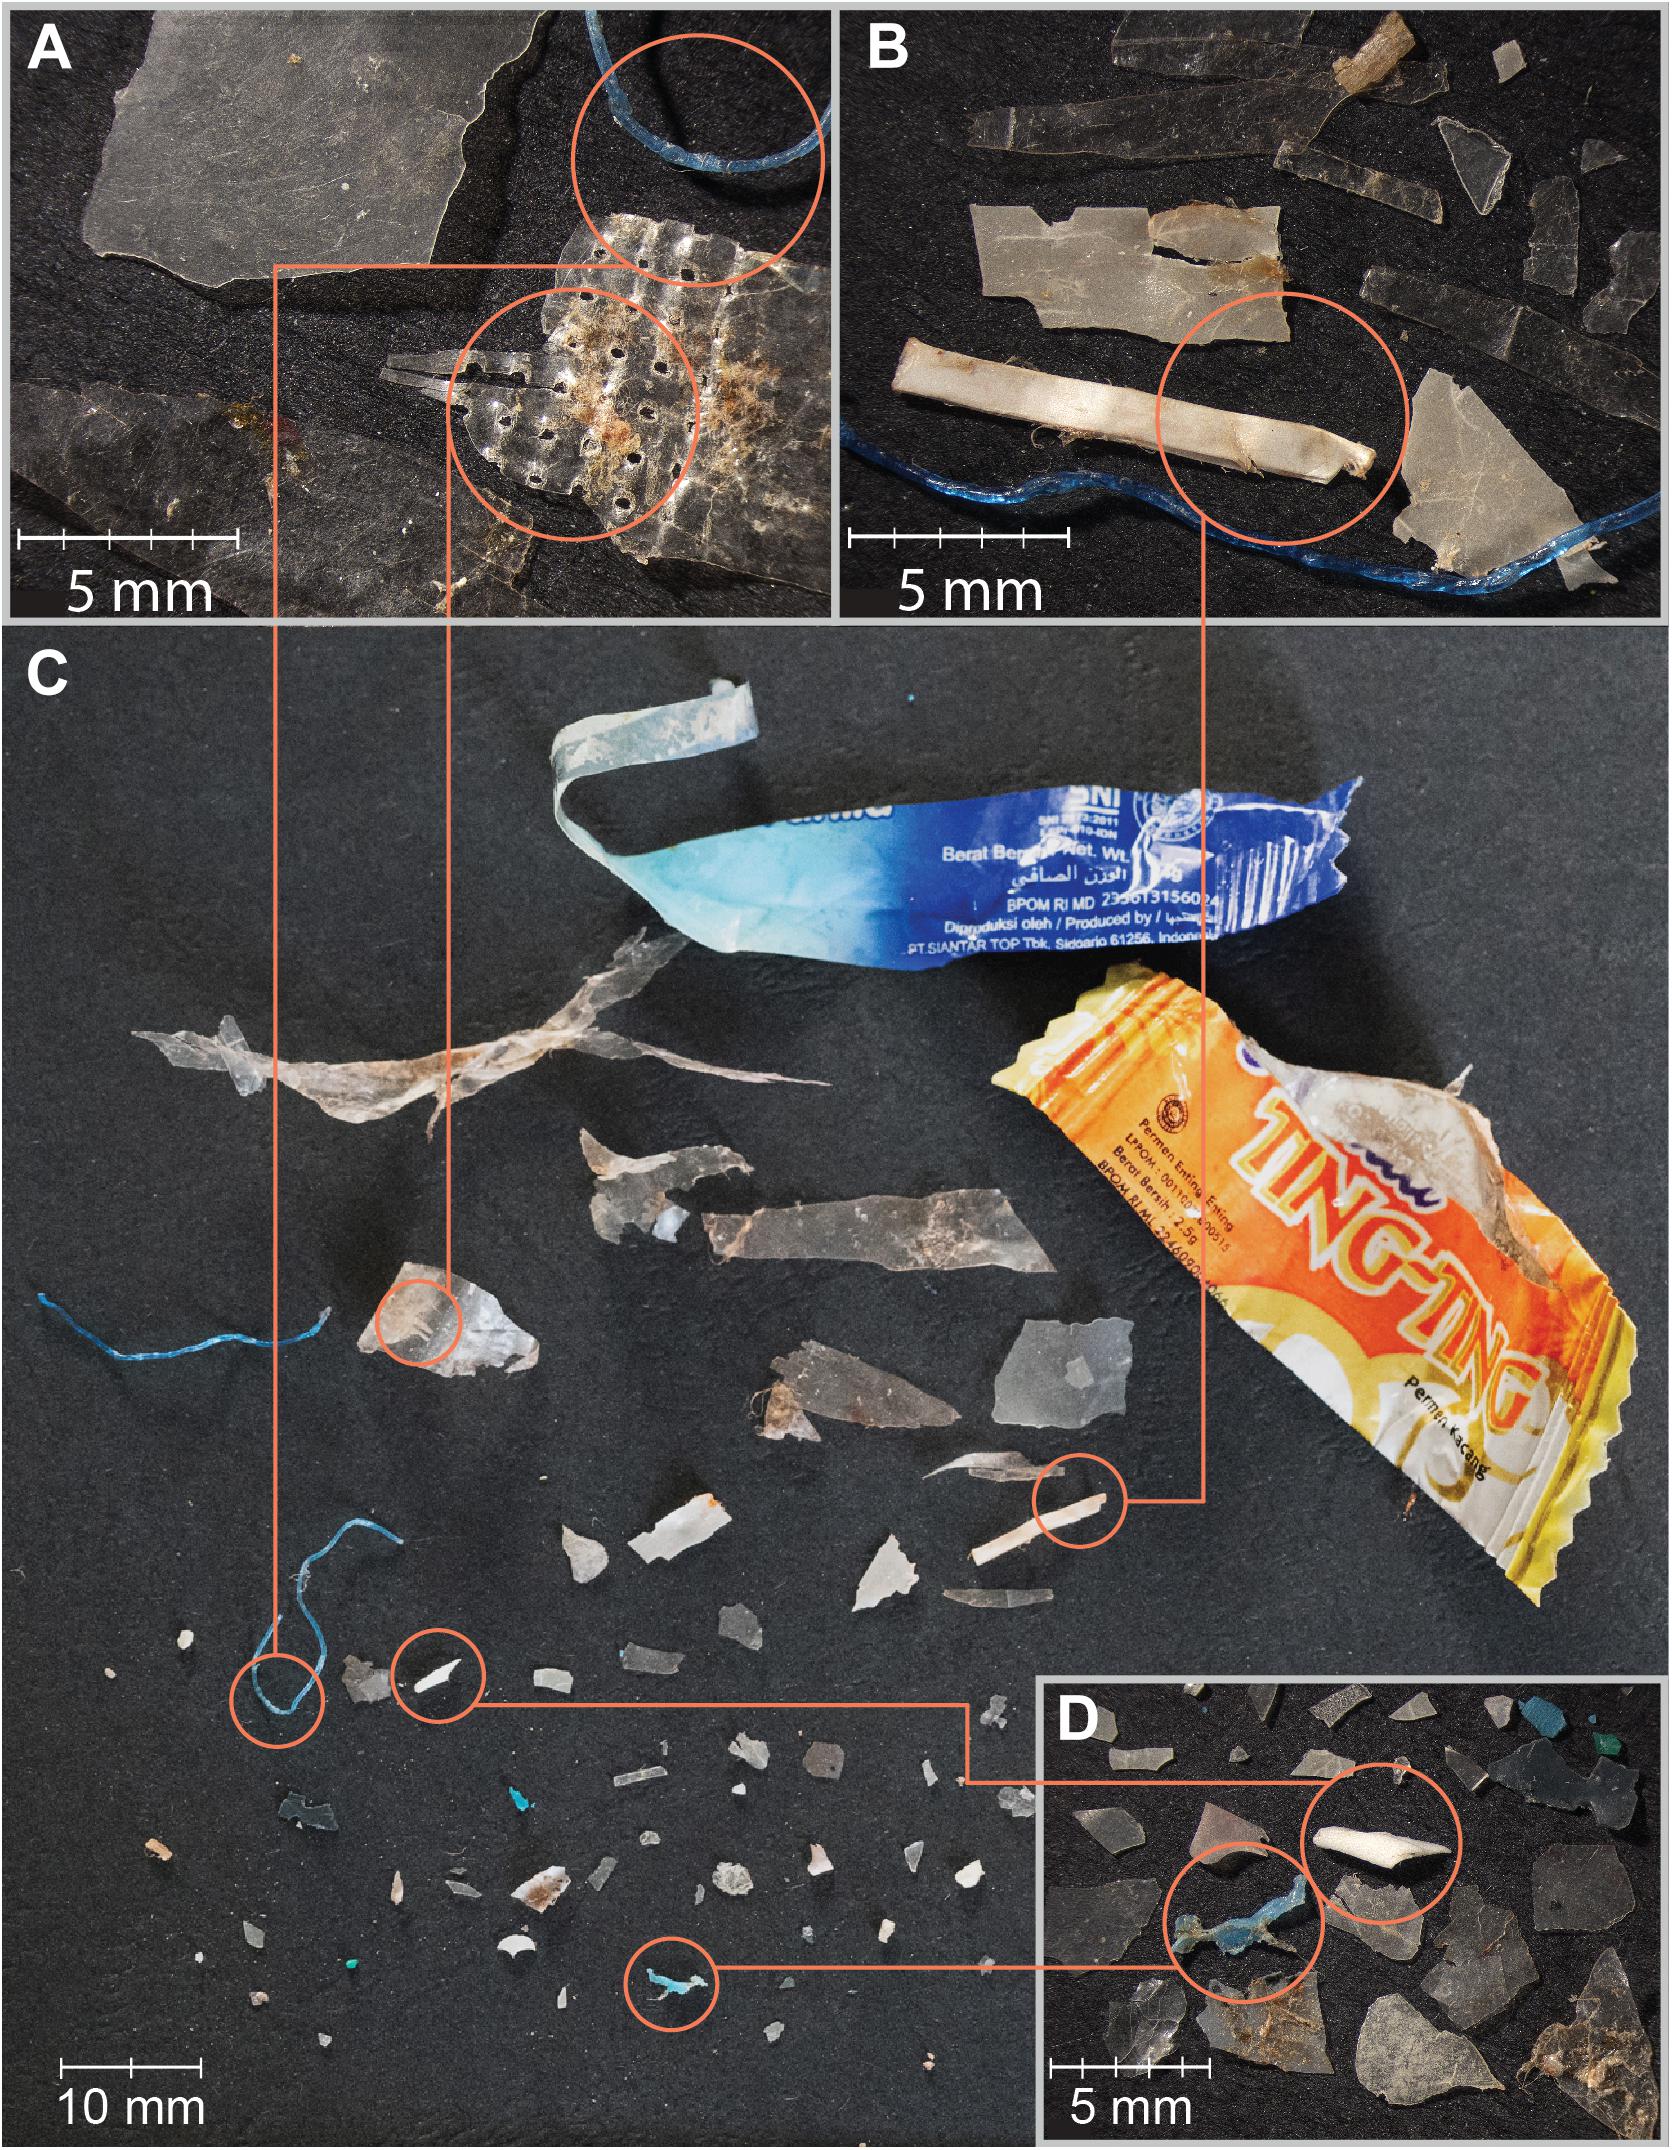
Figure 7. Various sizes and types of plastic debris found in manta ray vomit material (n = 1) from Nusa Penida, Indonesia. Larger debris are photographed under high (A,B) and low (C) magnification, and smaller debris (D) under high magnification.
Discussion
This study has confirmed that manta rays are able to ingest plastic marine debris. Furthermore, plastic debris and microplastics were found in all of the examined feeding grounds for manta rays and whale sharks in Indonesia, within the Coral Triangle. Our observations confirm that manta rays and whale sharks are feeding amongst plastic debris in these locations and that plastic materials are likely being ingested from surface waters. These preliminary findings suggest that manta rays and likely whale sharks are unable to select out plastic debris during the feeding process, that it is feasible that they are regularly ingesting plastic material in areas with high densities of surface plastics, but that they may also be able to expel at least some of what is ingested through regurgitation or passing it in fecal matter. Further, quantitative trawl sampling enabled us to estimate the theoretical plastic ingestion rates for manta rays and whale sharks at these study locations. Plastic debris abundance estimates fit within the current modeled estimates (Maximenko et al., 2012; Eriksen et al., 2014; van Sebille et al., 2015), but differed between locations and were higher during the wet than the dry season. Across locations, the most common types of plastics were ‘films’ and ‘fragments,’ which were mostly < 5 mm.
Plastic Abundance Estimates
Overall, our plastic abundance estimates (Table 2) from trawls (range: 20,000–449,000 pieces km–2) and visual surveys (range: 100–10,000 pieces km–2) were in the upper end of the modeled estimates for the Coral Triangle region (Eriksen et al., 2014; van Sebille et al., 2015). Plastic by weight estimates also fit within the models with Manta Bay (MB) wet season estimates resembling those by Eriksen et al. (2014) and van Sebille et al. (2015) and the rest the Maximenko et al. (2012) model.
However, the three most recent modeled predictions for microplastics (Maximenko et al., 2012; Eriksen et al., 2014; van Sebille et al., 2015) vary considerably (up to a factor > 100) for Indonesia and the Coral Triangle. Variations between models are likely in part due to differences in methodology (i.e., net mesh sizes, sample processing, and model approach; van Sebille et al., 2015). Complex regional oceanographic and weather conditions are also likely to contribute to these variations. Further, fine scale oceanographic features are likely not detected in these large scale oceanographic models; however, such small-scale variations are critical when considering the feeding ecology of large filter-feeders. For instance, previous small scale investigations of fin whale feeding grounds, in two sections (Ligurian and Sardinian Seas) of the Pelagos Sanctuary, Mediterranean Sea, where the coastal geography is complex, show variability in plastic abundance on the scale of 101 km (Fossi et al., 2016). Plankton within manta ray and whale shark feeding areas vary often on an even finer scale, with patches of high prey density ranging 101–102 m (Rohner et al., 2015; Armstrong et al., 2016). So while the global models are useful, in the case of megafauna feeding implications fine scale investigations are crucial.
Seasonal Trends in Plastic Debris Abundance
In N-MB and S-MB, and to a lesser extent, Karang Makassar (KM), plastic abundance was greater in the wet than dry seasons. The magnitude of this seasonal difference was much greater at S-MB and N-MB than at KM, where these estimates were highly variable and the seasonal patterns of change were less clear. Nevertheless, an increase in plastic abundance during the wet season is consistent with recent evaluations of marine debris sources that point toward rivers contributing the majority (88–94%) of marine debris (Lebreton et al., 2017; Schmidt et al., 2017). Asia hosts the majority of the world’s most polluted rivers (103 out of 122), including the top 20, which account for 67% of the annual river debris input globally (Lebreton et al., 2017). Indonesia itself was identified as a major contributor with rivers from Java and Sumatra contributing ∼14% of the total global annual marine plastic emissions (Lebreton et al., 2017). Seasonally, Indonesian waste inputs from rivers are highest during the wet season – an estimated 35,000 t in February compared with 1,800 t in August (Lebreton et al., 2017). Thus our findings of increased plastic abundance during the wet season are supported by the seasonal increase in regional river pollution emissions. Similar findings from the other side of the world indicate that the increase in rainfall during the hurricane season in Banderas Bay, Mexico also likely leads to an increase in the contribution of plastic debris from land-based sources via river emissions (Pelamatti et al., 2019).
Further, our findings suggest that most of the debris observed at the study sites is generated regionally, as plastic volumes emitted from heavily polluted Chinese rivers are highest during the Indonesian dry season (June–September; Lebreton et al., 2017). However, it is conceivable that long-range drifting debris (Maximenko et al., 2012; van Sebille, 2014), potentially brought via the southward currents (Mayer and Damm, 2012) of the Indonesia Throughflow (ITF), also makes a contribution to the plastic pollution in the region.
Nevertheless, in many parts of Indonesia, and other nearby developing countries, common practice is to dispose of waste in open dumping grounds close to river beds (Hoornweg and Bhada-Tata, 2012). With the onset of the wet season, river beds swell to accommodate the increased water volume and in the process deliver debris to the marine environment. Thus waste management efforts should be focused on preventing waste from entering the marine environment prior to the start of wet season. Such intervention could be in the form of river bed cleanups, prohibition and enforcing a moratorium on waste disposal nearby water sources. In addition, the introduction of contained waste disposal facilities, located away from rivers and coastlines is needed throughout Indonesia and other developing countries, especially in more remote and rural areas that currently lack access to any waste disposal facilities.
Geographic Differences in Abundance and Characteristics of Plastics
Both trawl sampled and visually assessed plastic abundance estimates were greater at MB than at KM, which is likely a factor of the distance of these locations from densely populated areas (Pedrotti et al., 2016) and rivers with substantial plastic emissions (Lebreton et al., 2017). Nusa Penida and the MB sites, for instance, are in close proximity to some of Indonesia’s most populous islands, including Java, Bali and Lombok, while Komodo NP is surrounded by the relatively sparsely populated islands of Sumbawa, Flores, and Sumba (Gaffin et al., 2004; Yetman et al., 2004). The study locations adjacent to densely populated areas are likely to have a higher abundance of plastic debris (Pedrotti et al., 2016); however, local oceanographic conditions are likely to strongly influence the trajectories of drifting plastic and thus the local abundance. Fine-scale oceanographic conditions in this region, such as extreme tidal currents (Field and Gordon, 1996), complex shorelines (Sugimoto, 1975) and bathymetry could generate local gyres and traps/sinks for plastics.
The higher percentage of smaller sized microplastics sampled in KM compared to those sampled from MB, suggest that the plastic pieces are either traveling from further locations and undergoing additional degradation through ultra-violet radiation and other environmental influences, or entering the marine environment at more advanced stages of fragmentation. The remoteness of Komodo from major urban centers and large, plastic-emitting rivers suggests that plastic size is more likely to be related to the distance and extended time for degradation than size at entrance to the marine environment.
Plastic and anthropogenic debris abundance estimated from trawl surveys at Pantai Bentar (PB) during the 2017 wet season was comparable to those estimated for MB and KM during the wet season, as well as for the a Cilacap coast of Java (0.27–0.54 pieces m–3), Indonesia, adjacent to the emission points of the Donan and Serayu rivers (Syakti et al., 2017). Interestingly, the amount of visually observed floating plastics at PB was markedly lower and more similar to levels detected in MB and KM during the dry season. Further, microplastics sampled from PB had the highest percentage of particles < 1 mm compared to the other study locations. Given the proximity of PB to densely populated areas (e.g., Surabaya city with ∼3,457,00 people as of 2015; Indonesia Population, 2019) and river emission points, it is surprising that the larger debris size classes did not comprise a greater portion of the total plastic debris. Generally, there are more river outflows on the east Java and Bali coastlines than further east, like those adjacent to the Komodo NP. Thus we would expect to find higher or comparable levels of plastic at PB and MB, to those at KM during the wet season. However, while the overall rainfall patterns are generally similar for the three study sites during our study period (see Figure 3), regional variations and inter-annual differences (Hendrawan et al., 2019) likely influence the strength of river flows and thus potentially plastic inputs.
A striking difference between the study locations was the water clarity (E. Germanov, personal observation), with PB having high levels of algae and sediment in the water, which could contribute to faster sinking of marine debris (i.e., vertical migration) and thus reduced detection at the surface. A faster vertical decent of debris might occur due to biofouling of larger buoyant items, such as plastic bags (i.e., film plastic) (reviewed in Cole et al., 2011; Lobelle and Cunliffe, 2011; Bond et al., 2018), as well as the attachment of foreign particles such as clay minerals (Kowalski et al., 2016), which both would decrease the buoyancy of plastics. Further, the inflow of less saline water via the Karimata Strait (Mayer and Damm, 2012) and nearby rivers emissions might decrease the buoyancy of larger plastics and accelerate their migration into the sediments (Cole et al., 2011). Follow-up investigation of plastic abundance in the bottom sediments at PB is warranted.
The most abundant types of debris by both trawl sampling and visual observation, as well as those present in the manta ray egestion material, were plastic films. This category of plastics corresponds to items commonly composed of Polyethylene (PE) polymers that have a lower density than sea water and are thus buoyant (Andrady, 2011). This observation coincides with PE being the most abundant plastic polymer in the marine environment (reviewed in Hidalgo-Ruz et al., 2012; Bond et al., 2018). Further, this is likely a reflection of the high level of packaging on consumer goods and single-use items, including ‘sachets’ that are commonly used in Indonesia (Merkl et al., 2015). Film plastics are considered low value plastics for sales into recycling and are rarely salvaged from waste streams (Merkl et al., 2015). Although more valuable and readily recycled (Merkl et al., 2015), other single use plastics commonly encountered in our surveys were plastic bottles. Plastic bottles, composed of polyethylene terephthalate (PET), will eventually break up to plastic fragments, but are much more durable than PE (Muthukumar et al., 2011; Bond et al., 2018) and thus persist longer and disperse further into the marine environment. The durability of plastic items, and the distance and time taken to ‘arrive’ at the sampling locations, as well as the rates of vertical migrations through biofouling, might explain the differences in the plastic ‘signatures’ of the different locations that we investigated (e.g., more hard plastic fragments in KM than MB). Follow-up studies characterizing the polymers types present in the microplastics can help link the plastic debris to consumer goods and help to identify their origin (Rios et al., 2010; Reisser et al., 2013; Pedrotti et al., 2016; Pelamatti et al., 2019). Further, as different polymers have different affinity properties (Bond et al., 2018), and contain different additives with variable toxicity (Endo et al., 2005; Teuten et al., 2009), understanding the chemical composition of microplastics in this region will allow us to better evaluate the potential implications of plastic ingestion on manta rays, whale sharks and other filter-feeding megafauna (Germanov et al., 2018).
Theoretical Plastic Ingestion Rates
The plastic to plankton weight ratios estimated for manta ray and whale shark feeding grounds in the current study, apart from S-MB, were lower than the 0.5:1 ratio estimated for the Mediterranean Sea (Collignon et al., 2012). As well as an indicator of the high pollution levels in the Mediterranean Sea, perhaps the lower ratios we observed are also a function of the regional productivity and the high plankton abundance in megafauna feeding hotspots (Putra et al., 2016). Manta rays and whale sharks feed in high density prey patches to attain a positive energy balance, as feeding behavior is energetically costly (e.g., Motta et al., 2010; Rohner et al., 2015; Armstrong et al., 2016). The necessity for high density plankton in areas where manta rays and whale sharks feed renders the plankton to plastic ratio less informative than in other less productive regions. The amount of plastic in Indonesian feeding grounds during the wet season was comparable to the levels found in fin whale feeding grounds within the Pelagos Sanctuary, Mediterranean Sea (≤0.62 items m–3; Fossi et al., 2014, 2016) and higher than those in whale shark feeding habitats within La Paz Bay, Sea of Cortez (≤0.14 items m–3; Fossi et al., 2017).
The estimated plastic ingestion rates for manta rays (∼63 items h–1 in the wet season, ∼4 items h–1 in the dry season at MB; ≤ 25 items h–1 at KM) and the ratio of plastic to plankton indicate that in some locations during times of the highest plastic abundance (wet season), manta rays might be ingesting up to 980 g of plastic per kg of plankton. The ratios of plastics to plankton noted from the egested material samples are 10–16-fold lower, but nevertheless considerable. Further, we estimated that the whale sharks (∼137 items h–1) feeding at PB are ingesting up to sixfold higher amounts of plastic than the those feeding in La Paz Bay (see Table 5; Fossi et al., 2017). Even with these higher estimates, we are likely to be underestimating the amount of plastic intake, as our abundance estimates are limited to free-floating plastics and do not include any plastics ingested by plankton (Cole et al., 2013; Setälä et al., 2014). Plastic levels have not been characterized in many other manta ray (Pelamatti et al., 2019) and whale shark feeding grounds, but despite this general lack of comparisons, we think that large filter-feeders in Indonesia are likely to be feeding in more heavily polluted waters than most other locations throughout their range (Germanov et al., 2018).
Information on the total daily time that individual whale sharks and manta rays spend feeding at PB and MB/KM, respectively, is not currently available. However, manta rays display a high degree of residency to MB, especially immature manta rays, and are most commonly observed feeding year-round (Germanov et al., 2019). Further, high levels of habitat use are documented for KM, with median individual visitations lasting 2 h (Dewar et al., 2008). Returning to the same polluted area to feed for several hours each day would put these manta rays at high risk of ingesting substantial quantities of plastic. Interestingly, a sample of vomit containing plastics was collected from a manta ray that had not been sighted at MB since 2015, which might indicate that feeding in other polluted areas is occurring. Manta rays are likely feeding in other sites within the greater region other than MB and KM (E. Germanov, personal observation), and at depth (Couturier et al., 2013). Particularly for KM, seasonality appears to have an effect on feeding behavior with less feeding behavior observed at KM during the dry season, suggesting that manta rays are preferring to feed elsewhere at this time. However, based on the weight of plankton collected at both MB and KM, which was similar for both wet and dry seasons, we were unable to relate plankton availability with plastic abundance.
To fully grasp the level of threat from plastic ingestion it is necessary to gain a greater understanding of feeding ecology for manta rays and the variety of locations used in the region. Plastic abundance is yet to be evaluated in other known feeding grounds within the region (e.g., Raja Ampat, Setyawan et al., 2018; Perryman et al., 2019), and at different water depths where feeding might also occur. Tagging studies using transmitters with depth and acceleration sensors (e.g., daily diary tags, Wilson et al., 2008; Gleiss et al., 2013) would enable studies of fine scale manta ray habitat use, visitation lengths, and behavior (e.g., feeding at the surface, at depth vs. cleaning), thus improving estimates of plastic exposure.
Implications of Plastic Ingestion
Plastic pieces in two samples of manta ray egested material collected within the Nusa Penida MPA confirm that plastic ingestion by manta rays, including plastic > 5 mm, is feasible. Observing plastic in a fecal sample from a manta ray indicates that this manta ray has ingested plastic and that at least some of this plastic has passed through the entirety of its digestive tract and was excreted. Observing plastic in a vomit sample from a manta ray indicates that while plastic was ingested, it is also possible for manta rays to regurgitate plastic before it passes through the digestive system. It is not surprising that manta rays cannot selectively exclude microplastics from zooplankton in their filter-feeding process, but empirical evidence until now has been lacking. Whale sharks are also confirmed to ingest plastics ranging from 15 to 200 mm in length, as shown from necropsies performed in Brazil (Sampaio et al., 2018), Thailand (Haetrakul et al., 2009), Philippines (Abreo et al., 2019), and Malaysia (Lee, 2019), by direct observations by Fossi et al. (2017) in La Paz Bay, Sea of Cortez, and analyzed from fecal samples (Donati et al., 2019). Ingestion of large plastic pieces is a concern, as the accumulation of plastic in the digestive system is more likely. Plastic accumulation in the digestive tracts of marine mammals (Jacobsen et al., 2010; de Stephanis et al., 2013) and sea turtles (Stamper et al., 2009; Santos et al., 2015) is linked to mortality and/or morbidity (either through dietary dilution, blockage or mechanical damage of intestinal tracts). While the levels of plastic debris found in the stranded and deceased whale sharks mentioned above were not as high as those reported for some stranded whales (e.g., 73.6 kg; Jacobsen et al., 2010), internal perforations from what appeared to be a single hardened plastic straw are believed to have caused the death of at least one whale shark (Haetrakul et al., 2009).
The ability of manta rays and whale sharks (Donati et al., 2019) to regurgitate ingested plastic or pass it through their digestive systems and eventually expel it is a positive finding. However, even if eventually expelled, while plastic is within the body it has the potential to disrupt regular gut functioning (Fackelmann and Sommer, 2019) and to leach and desorb associated toxic chemicals, such as POPs and heavy metals (Teuten et al., 2009; Rochman et al., 2013, 2014; Tanaka et al., 2013), allowing these chemicals to be absorbed by the organisms. Polyethylene (PE), the key component of films and fragments, is particularly adsorbent for POPs (Teuten et al., 2009; Bond et al., 2018). Smaller particles, because of increased surface area, harbor higher levels of POPs (Mato et al., 2001; Cole et al., 2011). Thus finding that the majority of plastics in feeding grounds are small (< 5 mm) indicates an increased risk of pollutant exposure for filter feeding megafauna feeding at these sites.
Plastic associated pollutants, including phthalates and brominated flame retardants [e.g., polybrominated diphenyl ethers (PBDEs)] and POPs (DDTs, PCBs, and other organochlorine compounds) were detected in biopsy sampled skin from whale sharks feeding in La Paz Bay and blubber from fin whales feeding in La Paz Bay and the Mediterranean Sea (Fossi et al., 2016, 2017). Microplastic abundance estimates in PB and the theoretical estimates of plastic ingestion by whale sharks at this location are markedly greater than those for La Paz Bay (Table 5). However, whether whale sharks, manta rays and other large filter feeders are exposed to comparable or higher levels of POPs as those reported for La Paz Bay and the Mediterranean is less certain. Based on a 2009 global assessment of POPs in coastal waters via the analysis of PE pellets collected from beaches (Ogata et al., 2009), pollution levels of PCBs and DDTs were markedly lower in Jakarta Bay, Indonesia than those in the American West Coast and the Mediterranean Sea. However, more recent pellet analyses indicate that Indonesian pollution levels have increased (International Pellet Watch, 2019). Heavy metal contamination of mobulids, including manta rays, has been confirmed (Essumang, 2010; Ooi et al., 2015); however, this contamination is yet to be linked to heavy metal exposure via plastic ingestion.
An understanding of the implications of microplastic ingestion on the population level, requires knowledge of the physiological response of individuals, and how likely it is to influence their reproduction. As filter-feeders are likely to feed from several locations, and plastic abundance is likely to vary along these planes, quantifying the exposure of filter-feeders to pollutants that serve as a proxy for plastic exposure (Fossi et al., 2014, 2017), might better capture the level of risk to individuals and populations. Thus, future investigations should focus on quantifying the plastic associated pollutant contamination levels of manta rays, whale sharks, and other filter-feeding megafauna within Indonesia and the greater Coral Triangle (see Germanov et al., 2018; Stewart et al., 2018 for recent discussions on future direction recommendations). Further, monitoring individual health might be achieved through the analysis of biomarker responses (Dove et al., 2012; Fossi et al., 2017). For example, some serum metabolites have been associated with the health of whale sharks in aquaria providing a starting point for assessing the health of wild individuals and populations (Dove et al., 2012). The first investigation using CYP1A-like protein responses in whale sharks in the wild shows a positive correlation with some common plastic additives (i.e., brominated flame retardants), suggesting that induction of this biomarker may serves as a warning indicator of pollutant exposure in this species (Fossi et al., 2017). Long-term monitoring of health indexes for high risk populations will provide insight into the implications of microplastic ingestion and exposure to associated pollutants, while broad regional studies will assist in identifying pollution hotspots, necessary for effective management of these threatened species. Focusing further research on these species is warranted, particularly as large filter-feeders are widely considered important sentinels for the implications of plastic pollution in marine environments (Germanov et al., 2018; Nelms et al., 2019).
Efforts to Stem the Plastic Tide
In 2017, in response to being ranked as the world’s second largest plastic marine debris emitter (Jambeck et al., 2015), mostly through river emissions (Lebreton et al., 2017), the Indonesian government pledged 1 billion USD per annum toward reducing plastic marine debris in their waters by 70% before 2025 (Langenheim, 2017). Recently, in December 2018, several major Indonesian cites, including those in the Bali Province (Aqil, 2018), enacted bans on frequently used single-use plastics such as bags, straws and polystyrene containers, demonstrating the commitment of government to addressing the plastic issue. To this end, our multi-year dataset can serve as a baseline for monitoring the plastic pollution in these coastal environments within Bali Province and important habitats for threatened species. Continuing to monitor these coastal environments and gaining an understanding of how local oceanography contributes to the accumulation of plastic debris along coastlines will be crucial as Indonesia’s government works to curb this threat.
Conclusion
We estimated plastic marine debris abundance and characterized the debris in three feeding grounds for manta rays and whale sharks in Indonesia, thus providing the first empirical estimates of plastics in megafauna feeding grounds for the region. Our plastic abundance estimates are consistent with overall modeled microplastic abundance estimates for the greater region. Estimated pollution emission from regional rivers support the relatively higher plastic abundance we observed during the Indonesian wet season (November–April). Regional differences in plastic abundance, prevalent plastic sizes and types indicate that factors in addition to season, such as population density and local oceanographic processes, influence local plastic debris abundance. Nevertheless, the seasonal variation in plastic abundance highlights that concentrating marine debris intervention and prevention measures from land-based sources, such as rivers, prior to the onset of the wet season would maximize efforts to reduce plastic levels at the source.
This is the first study to provide theoretical estimates of plastic marine debris ingestion for manta rays, as well as for whale sharks in the Coral Triangle. Although, the extent of the impacts on individuals and populations remain unknown, manta rays ingested plastic marine debris, and it is likely that whale sharks also ingest plastics in this region. The urgency to reduce marine plastic pollution has become a prominent environmental issue, and many countries are joining global initiatives (e.g., Clean Seas Campaign, 2019) to reduce plastic waste and marine pollution. Incorporating the information gleaned from this study into educational campaigns that bring awareness about the potential impacts of plastic marine debris to flagship species, like manta rays, whale sharks and other charismatic megafauna (Bowen-Jones and Entwistle, 2002; Germanov et al., 2018; Panti et al., 2019), might assist local governments as they attempt to socialize increasing regulations on plastic usage and disposal. These efforts could have a positive effect in regions with significant marine tourism industries, such as the Nusa Penida MPA and Komodo NP. Gaining the support of the public and coastal communities will be key in tackling plastic marine debris in the region, one of Indonesia’s, and the whole of the Coral Triangle’s, biggest challenges in protecting its marine environments.
Data Availability Statement
The raw data supporting the conclusions of this manuscript will be made available by the authors, without undue reservation, to any qualified researcher.
Ethics Statement
This study was conducted under permits issued by the Indonesian Ministry of Research and Technology (Permit #458/SIP/FRP/E5/Dit. KI/XII/2015; Permit Extension#11/TKPIPA/E5/Dit. KI/XI/2016 and #86/EXT/SIP/FRP/E5/Dit.KI/XI/2017), the Komodo National Park (#SI.1432/BTNK-1/2016) and following protocols approved by the Murdoch University Animal Ethics Committee (#R2781/15).
Author Contributions
EG and AM conceived the study. EG, JA, RW, and MH collected the data. EG, JA, and RW analyzed the data with the guidance from RA, CR, GH, and NL. EG wrote the manuscript with contribution to figures, drafting, critical review, and editorial input from AM, RA, CR, GH, and NL. All authors critically reviewed the manuscript with final proofs.
Funding
EG is supported by an Australian Postgraduate Award and Murdoch International Top Up (32608315), supported her doctoral studies; CR was supported by two private trusts, Aqua-Firma and Waterlust; Ocean Park Conservation Foundation (FH04_1516) has funded a large portion of the fieldwork, logistics, and capacity building programs; Foundation Fortuna supported field work, laboratory analysis, logistics, and capacity building programs; Idea Wild donated field sampling equipment; Mantahari Oceancare funded manta ray research capacity building programs; PADI Foundation (14668) supported field work and logistics; and private donors, supported field work and logistics. This research was generously supported by R. Horner and private donors; and through in-kind donations by Arenui Boutique Liveaboard, Current Junkies Liveaboard, Happy Days yacht, Scuba Junkie Komodo, Manta Rhei Dive Center, and Wunderpus Liveaboard.
Conflict of Interest
The authors declare that the research was conducted in the absence of any commercial or financial relationships that could be construed as a potential conflict of interest.
Acknowledgments
We are grateful for the study permit from the Indonesian Ministry of Research (Ristek Dikti). We are grateful for the assistance of students from Udayana University: R. A. Saraswati, S. Risuana, D. Damayanti, B. Gustavina, and A. Swarry; volunteers from the Marine Megafauna Foundation, especially L. Ellevog, L. Auditore, S. Mathews, G. Barford, S. Al Rashid, D. Whittle, and S. Kalucza; and to I. K. Riadiyasa, N. Lynch, and the local dive communities for their logistical help. We thank Captains Diasa and Edy for assisting at Manta Bay; the captains and crew of the Busy Girl and Happy Days yachts, and the Komodo National Park staff and rangers A. Kefi, Y. Hamzan and D. Indriasari for assisting at the Komodo National Park; and the local boat captains and representatives for assisting at Pantai Bentar. We thank C. Parfitt, R. Horner, and P. Coulson for providing microscopy tools and/or assistance. We thank the members of Faculty of Marine Sciences and Fisheries, Universitas Udayana, Bali, Indonesia and C. O. Lafuente for assisting in creating Figures 1, 2. Bathymetry information used in creating Figures 1, 2 was available from: GEBCO_2014 Grid, version 20150318; www.gebco.net. River emission points for creating Figure 1 were available from Lebreton and Reisser (2018). Population information in 15 min × 15 min grids (∼ 760 km2) using 2025 population projections available from Yetman et al. (2004). We thank B. Wirayawan for assisting in access to precipitation data used in creating Figure 3 (available from: Indonesian Meteorology, Climatology and Geophysics Agency Data online, Pusat Database BMKG; http://dataonline.bmkg.go.id/).
Supplementary Material
The Supplementary Material for this article can be found online at: https://www.frontiersin.org/articles/10.3389/fmars.2019.00679/full#supplementary-material
References
Abreo, N. A. S., Blatchley, D., and Superio, M. D. (2019). Stranded whale shark (Rhincodon typus) reveals vulnerability of filter-feeding elasmobranchs to marine litter in the Philippines. Mar. Pollut. Bull. 141, 79–83. doi: 10.1016/j.marpolbul.2019.02.030
Andrady, A. L. (2011). Microplastics in the marine environment. Mar. Pollut. Bull. 62, 1596–1605. doi: 10.1016/j.marpolbul.2019.02.030
Anselmo, H. M., Koerting, L., Devito, S., van den Berg, J. H., Johannes, H. J., and Dubbeldam, M. (2011). Early life developmental effects of marine persistent organic pollutants on the sea urchin Psammechinus miliaris. Ecotoxicol. Environ. Saf. 74, 2182–2192. doi: 10.1016/j.ecoenv.2011.07.037
Aqil, A. M. I. (2018). Ban Against Single-Use Plastic Bags, Half-Hearted Effort? Jakarta Post. Available at: https://www.thejakartapost.com/news/2018/12/28/ban-against-single-use-plastic-bags-half-hearted-effort.html (accessed March 20, 2019).
Armstrong, A. O., Armstrong, A. J., Jaine, F. R., Couturier, L. I., Fiora, K., Uribe-Palomino, J., et al. (2016). Prey density threshold and tidal influence on reef manta ray foraging at an aggregation site on the great barrier reef. PLoS One 115:e0153393. doi: 10.1371/journal.pone.0153393
Ashton, K., Holmes, L., and Turner, A. (2010). Association of metals with plastic production pellets in the marine environment. Mar. Pollut. Bull. 60, 2050–2055. doi: 10.1016/j.marpolbul.2010.07.014
Ayers, J. M., Strutton, P. G., Coles, V. J., Hood, R. R., and Matear, R. J. (2014). Indonesian throughflow nutrient fluxes and their potential impact on Indian ocean productivity. Geophys. Res. Lett. 41, 5060–5067.
Barua, M. (2011). Mobilizing metaphors: the popular use of keystone, flagship and umbrella species concepts. Biodivers. Conserv. 20:1427. doi: 10.1007/s10531-011-0035-y
Besseling, E., Foekema, E., Van Franeker, J., Leopold, M. F., Kühn, S., Rebolledo, E. B., et al. (2015). Microplastic in a macro filter feeder: humpback whale Megaptera novaeangliae. Mar. Pollut. Bull. 95, 248–252. doi: 10.1016/j.marpolbul.2015.04.007
Boerger, C. M., Lattin, G. L., Moore, S. L., and Moore, C. J. (2010). Plastic ingestion by planktivorous fishes in the North Pacific Central Gyre. Mar. Pollut. Bull. 6012, 2275–2278. doi: 10.1016/j.marpolbul.2010.08.007
Bond, T., Ferrandiz-Mas, V., Felipe-Sotelo, M., and van Sebille, E. (2018). The occurrence and degradation of aquatic plastic litter based on polymer physicochemical properties: a review. Crit. Rev. Environ. Sci. Technol. 48, 1–38. doi: 10.1080/10643389.2018.1483155
Bowen-Jones, E., and Entwistle, A. (2002). Identifying appropriate flagship species: the importance of culture and local contexts. Oryx 36, 189–195. doi: 10.1017/S0030605302000261
British Broadcasting Corporation [BBC], (2019). Dead Whale ‘Had 40kg of Plastic In Its Stomach’. London: BBC.
Browne, M. A., Niven, S. J., Galloway, T. S., Rowland, S. J., and Thompson, R. C. (2013). Microplastic moves pollutants and additives to worms, reducing functions linked to health and biodiversity. Curr. Biol. 23, 2388–2392. doi: 10.1016/j.cub.2013.10.012
Browne, M. A., Underwood, A. J., Chapman, M. G., Williams, R., Thompson, R. C., and van Franeker, J. A. (2015). Linking effects of anthropogenic debris to ecological impacts. Proc. Biol. Sci. 282:20142929. doi: 10.1098/rspb.2014.2929
Chang, C., Wang, Z., McBride, J., and Liu, C. (2005). Annual cycle of Southeast Asia-maritime continent rainfall and the asymmetric monsoon transition. J. Clim. 18, 287–301. doi: 10.1175/JCLI-3257.1
Clean Seas Campaign, (2019). Tide Turners. United Nations Environment. Available at: https://www.cleanseas.org/tide-turners#governments (accessed April 17, 2019).
Cole, M., Lindeque, P., Fileman, E., Halsband, C., Goodhead, R., Moger, J., et al. (2013). Microplastic ingestion by zooplankton. Environ. Sci. Technol. 47, 6646–6655. doi: 10.1021/es400663f
Cole, M., Lindeque, P., Halsband, C., and Galloway, T. S. (2011). Microplastics as contaminants in the marine environment: a review. Mar. Pollut. Bull. 62, 2588–2597. doi: 10.1016/j.marpolbul.2011.09.025
Collignon, A., Hecq, J., Glagani, F., Voisin, P., Collard, F., and Goffart, A. (2012). Neustonic microplastic and zooplankton in the North Western Mediterranean Sea. Mar. Pollut. Bull. 64, 861–864. doi: 10.1016/j.marpolbul.2012.01.011
Couturier, L. I., Rohner, C. A., Richardson, A. J., Marshall, A. D., Jaine, F., Bennett, M. B., et al. (2013). Stable isotope and signature fatty acid analyses suggest reef manta rays feed on demersal zooplankton. PLoS One 81:e77152. doi: 10.1371/journal.pone.0077152
de Stephanis, R., Giménez, J., Carpinelli, E., Gutierrez-Exposito, C., and Cañadas, A. (2013). As main meal for sperm whales: plastics debris. Mar. Pollut. Bull. 691, 206–214. doi: 10.1016/j.marpolbul.2013.01.033
Dewar, H., Mous, P., Domeier, M., Muljadi, A., Pet, J., and Whitty, J. V. (2008). Movements and site fidelity of the giant manta ray, manta birostris, in the Komodo Marine Park, Indonesia. Mar. Biol. 155, 121–133. doi: 10.1007/s00227-008-0988-x
Donati, G. F. A., Shameel, I., Hindle, K., Zareer, I., and Wieczorek, A. M. (2019). “Microplastics a macro-disaster: a threat to the largest fish of our 2008 seas?,” in Proceedings of the 5th International Whale Shark Conference (IWSC5), Ningaloo, WA.
Dove, A. D., Leisen, J., Zhou, M., Byrne, J. J., Lim-Hing, K., Webb, H. D., et al. (2012). Biomarkers of whale shark health: a metabolomic approach. PLoS One 7:e49379. doi: 10.1371/journal.pone.0049379
Endo, S., Takizawa, R., Okuda, K., Takada, H., Chiba, K., Kanehiro, H., et al. (2005). Concentration of polychlorinated biphenyls (PCBs) in beached resin pellets: variability among individual particles and regional differences. Mar. Pollut. Bull. 50, 1103–1114. doi: 10.1016/j.marpolbul.2005.04.030
Eriksen, M., Lebreton, L. C., Carson, H. S., Thiel, M., Moore, C. J., Borerro, J. C., et al. (2014). Plastic pollution in the world’s oceans: more than 5 trillion plastic pieces weighing over 250,000 tons afloat at sea. PloS One 9:e111913. doi: 10.1371/journal.pone.0111913
Essumang, D. K. (2010). First determination of the levels of platinum group metals in manta birostris (manta ray) caught along the ghanaian coastline. Bull. Environ. Contam. Toxicol. 84, 720–725. doi: 10.1007/s00128-010-0019-8
Fackelmann, G., and Sommer, S. (2019). Microplastics and the gut microbiome: how chronically exposed species may suffer from gut dysbiosis. Mar. Pollut. Bull. 143, 193–203. doi: 10.1016/j.marpolbul.2019.04.030
Field, A., and Gordon, A. L. (1996). Tidal mixing signatures in the Indonesian SeasJ. Phys. Oceanogr. 26, 1924–1937. doi: 10.1175/1520-0485(1996)026
Fossi, M. C., Baini, M., Panti, C., Galli, M., Jiménez, B., Muñoz-Arnanz, J., et al. (2017). Are whale sharks exposed to persistent organic pollutants and plastic pollution in the Gulf of California (Mexico)? first ecotoxicological investigation using skin biopsies. Comp. Biochem. Physiol. C Toxicol. Pharmacol. 199, 48–58. doi: 10.1016/j.cbpc.2017.03.002
Fossi, M. C., Coppola, D., Baini, M., Giannetti, M., Guerranti, C., Marsili, L., et al. (2014). Large filter feeding marine organisms as indicators of microplastic in the pelagic environment: the case studies of the mediterranean basking shark (Cetorhinus maximus) and fin whale (Balaenoptera physalus). Mar. Environ. Res. 100, 17–24. doi: 10.1016/j.marenvres.2014.02.002
Fossi, M. C., Marsili, L., Baini, M., Giannetti, M., Coppola, D., Guerranti, C., et al. (2016). Fin whales and microplastics: the mediterranean Sea and the Sea of Cortez scenarios. Environ. Poll. 209, 68–78. doi: 10.1016/j.envpol.2015.11.022
Gaffin, S., Rosenzweig, C., Xing, X., and Yetman, G. (2004). Downscaling and geo-spatial gridding of socio-economic projections from the IPCC special report on emissions scenarios (SRES). Glob. Environ. Chang. 14, 105–123.
Gall, S. C., and Thompson, R. C. (2015). The impact of debris on marine life. Mar. Pollut. Bull. 92, 170–179. doi: 10.1016/j.marpolbul.2014.12.041
Gallagher, A. J., and Hammerschlag, N. (2011). Global shark currency: the distribution, frequency, and economic value of shark ecotourism. Curr. Issues Tour. 14, 797–812. doi: 10.1080/13683500.2011.585227
Genov, T., Jepson, P. D., Barber, J. L., Hace, A., Gaspari, S., Centrih, T., et al. (2019). Linking organochlorine contaminants with demographic parameters in free-ranging common bottlenose dolphins from the northern Adriatic Sea. Sci. Total Environ. 657, 200–212. doi: 10.1016/j.scitotenv.2018.12.025
Germanov, E. S., Bejder, L., Chabanne, D. B. H., Dharmadi, D., Hendrawan, I. G., Marshall, A. D., et al. (2019). Contrasting habitat use and population dynamics of reef manta rays within the Nusa Penida marine protected area, Indonesia. Front. Mar. Sci. 6:215. doi: 10.3389/fmars.2019.00215
Germanov, E. S., and Marshall, A. D. (2014). Running the gauntlet: regional movement patterns of manta alfredi through a complex of parks and fisheries. PLoS One 9:e110071. doi: 10.1371/journal.pone.0110071
Germanov, E. S., Marshall, A. D., Bejder, L., Fossi, M. C., and Loneragan, N. R. (2018). Microplastics: no small problem for filter-feeding megafauna. Trends Ecol. Evol. 334, 227–232. doi: 10.1016/j.tree.2018.01.005
Gleiss, A. C., Wright, S., Liebsch, N., Wilson, R. P., and Norman, B. (2013). Contrasting diel patterns in vertical movement and locomotor activity of whale sharks at Ningaloo reef. Mar. Biol. 160, 2981–2992. doi: 10.1007/s00227-013-2288-3
Gray, J. S. (1997). Marine biodiversity: patterns, threats and conservation needs. Biodivers. Conserv. 6, 153–175. doi: 10.1023/A:1018335901847
Haetrakul, T., Munanansup, S., Assawawongkasem, N., and Chansue, N. (2009). A Case Report: Stomach Foreign Object in Whale Shark (Rhincodon typus) Stranded in Thailand. Kyoto University. Available at: https://repository.kulib.kyoto-u.ac.jp/dspace/bitstream/2433/71015/1/8thSEASTAR_83.pdf (accessed March 1, 2019).
Hendrawan, I. G., Asai, K., Triwahyuni, A., and Lestari, D. V. (2019). The interanual rainfall variability in Indonesia corresponding to El Niño Southern oscillation and Indian Ocean Dipole. AOS 38, 57–66. doi: 10.1007/s13131-019-1457-1
Hendrawan, I. G., and Asai, K. (2011). “Numerical Study of tidal upwelling over the sill in the Lombok Strait (Indonesia),” in Proceedings of the Twenty-first International Offshore and Polar Engineering Conference, Maui, e24.2011.
Hidalgo-Ruz, V., Gutow, L., Thompson, R. C., and Thiel, M. (2012). Microplastics in the marine environment: a review of the methods used for identification and quantification. Environ. Sci. Technol. 46, 3060–3075. doi: 10.1021/es2031505
Hoornweg, D., and Bhada-Tata, P. (2012). What a Waste: A Global Review of Solid Waste Management. Washington, DC: World Bank.
Indonesia Population (2019). Available at: http://worldpopulationreview.com/countries/indonesia (accessed May 12, 2019).
International Pellet Watch (2019). Google Pollution Map: Google Map. International Pellet Watch. Available at: www.pelletwatch.org (accessed February 13, 2019).
Jacobsen, J. K., Massey, L., and Gulland, F. (2010). Fatal ingestion of floating net debris by two sperm whales (Physeter macrocephalus). Mar. Pollut. Bull. 60, 765–767. doi: 10.1016/j.marpolbul.2010.03.008
Jaine, F. R. A., Couturier, L. I. E., Weeks, S. J., Townsend, K. A., Bennett, M. B., Fiora, K., et al. (2012). When giants turn up: sighting trends, environmental influences and habitat use of the manta ray manta alfredi at a coral reef. PLoS One 7:e4610. doi: 10.1371/journal.pone.0046170
Jambeck, J. R., Geyer, R., Wilcox, C., Siegler, T. R., Perryman, M., Andrady, A., et al. (2015). Marine pollution. Plastic waste inputs from land into the ocean. Science 347, 768–771. doi: 10.1126/science.1260352
Kamal, M. M., Wardiatno, Y., and Noviyanti, N. S. (2016). “Habitat conditions and potential food items during the appearance of whale sharks (rhincodon typus) in probolinggo waters, madura strait, indonesia,” in Proceedings of the QScience Proceedings, The 4th International Whale Shark Conference, Qatar.
Kowalski, N., Reichardt, A. M., and Waniek, J. J. (2016). Sinking rates of microplastics and potential implications of their alteration by physical, biological, and chemical factors. Mar. Pollut. Bull. 109, 310–319. doi: 10.1016/j.marpolbul.2016.05.064
Langenheim, J. (2017). Indonesia Pledges $1bn a Year to Curb Ocean Waste. The Guardian. Available at: https://www.theguardian.com/environment/the-coral-triangle/2017/mar/02/indonesia-pledges-us1-billion-a-year-to-curb-ocean-waste (accessed March 20, 2019).
Lebreton, L. C. M., and Reisser, J. (2018). Supplementary data for ‘River plastic emissions to the world’s oceans’. Figshare Fileset. 12:15. doi: 10.6084/m9.figshare.4725541.v5
Lebreton, L. C. M., van der Zwet, J., Damsteeg, J. W., Slat, B., Andrady, A., and Reisser, J. (2017). River plastic emissions to the world’s oceans. Nat. Commun. 8:15611. doi: 10.1038/ncomms15611
Lee, S. (2019). Plastic Bag Causes Death Of Whale Shark In Sabah. Star Online. Available at: https://www.thestar.com.my/news/nation/2019/02/08/plastic-bag-causes-death-of-whale-shark-in-sabah/ (accessed March 20, 2019).
Lobelle, D., and Cunliffe, M. (2011). Early microbial biofilm formation on marine plastic debris. Mar. Pollut. Bull. 62, 197–200. doi: 10.1016/j.marpolbul.2010.10.013
Lyons, K., Carlisle, A., Preti, A., Mull, C., Blasius, M., O’Sullivan, J., et al. (2013a). Effects of trophic ecology and habitat use on maternal transfer of contaminants in four species of young of the year lamniform sharks. Mar. Environ. Res. 90, 27–38. doi: 10.1016/j.marenvres.2013.05.009
Lyons, K., Lowe, C. G., and Gillanders, B. (2013b). Mechanisms of maternal transfer of organochlorine contaminants and mercury in the common thresher shark (Alopias vulpinus). Can. J. Fish. Aquat. Sci. 70, 1667–1672. doi: 10.1139/cjfas-2013-0222-2222
Lyons, K., Lavado, R., Schlenk, D., and Lowe, C. G. (2014). Bioaccumulation of organochlorine contaminants and ethoxyresorufin-o-deethylase activity in southern California round stingrays (Urobatis halleri) exposed to planar aromatic compounds. Environ. Toxicol. Chem. 33, 1380–1390. doi: 10.1002/etc.2564
Manalu, A. A., Hariyadi, S., and Wardiatno, Y. (2017). Microplastics abundance in coastal sediments of Jakarta Bay, Indonesia. Aqua. Aquar. Conserv. Legisl. 10, 1164–1173.
Marshall, A., Bennett, M. B., Kodja, G., Hinojosa-Alvarez, S., Galvan-Magana, F., Harding, M., et al. (2018a). Mobula Birostris (Amended Version of 2011 Assessment). The IUCN Red List of Threatened Species 2018: e.T198921A126669349. Available at: http://dx.doi.org/10.2305/IUCN.UK.2018-1.RLTS.T198921A126669349.en. (accessed March 2, 2019).
Marshall, A., Kashiwagi, T., Bennett, M. B., Deakos, M., Stevens, G., McGregor, F., et al. (2018b). Mobula Alfredi (Amended Version of 2011 Assessment). The IUCN Red List of Threatened Species 2018: e.T195459A126665723. Available at: http://dx.doi.org/10.2305/IUCN.UK.2011-2.RLTS.T195459A126665723.en. (accessed March 2, 2019).
Mato, Y., Isobe, T., Takada, H., Kanehiro, H., Ohtake, C., and Kaminuma, T. (2001). Plastic resin pellets as a transport medium for toxic chemicals in the marine environment. Environ. Sci. Technol. 35, 318–324. doi: 10.1021/es0010498
Maximenko, N., Hafner, J., and Niiler, P. (2012). Pathways of marine debris derived from trajectories of Lagrangian drifters. Mar. Pollut. Bull. 65, 51–62. doi: 10.1016/j.marpolbul.2011.04.016
Mayer, B., and Damm, P. (2012). The makassar strait throughflow and its jet. J. Geophys. Res. 117, C7. doi: 10.1029/2011JC007809
Merkl, A., Stuchtey, M., Russel, S., Crow, A., Simon, E., Wooster, J., et al. (2015). Stemming the Tide: Land-based Strategies for a Plastic-Free Ocean. Ocean Conservancy and McKinsey Center for Business and Environment. Available at: https://www.mckinsey.com/business-functions/sustainability/our-insights/stemming-the-tide-land-based-strategies-for-a-plastic-free-ocean (accessed December, 2015).
Ministry of Marine Affairs and Fisheries (2014). Keputusan Menteri Kelautan dan Perikanan Republik Indonesia No4/Kepmen-KP/2014 Tentang Penetapan Status Perindungan Penuh Ikan Pari Manta. Jakarta: Ministry of Marine Affairs and Fisheries.
Motta, P. J., Maslanka, M., Hueter, R. E., Davis, R. L., De la Parra, R., Mulvany, S. L., et al. (2010). Feeding anatomy, filter-feeding rate, and diet of whale sharks Rhincodon typus during surface ram filter feeding off the Yucatan Peninsula, Mexico. Zoology 113, 199–212. doi: 10.1016/j.zool.2009.12.001
Muthukumar, T., Aravinthan, A., Lakshmi, K., Venkatesan, R., Vedaprakash, L., and Doble, M. (2011). Fouling and stability of polymers and composites in marine environmentInt. Biodeterior. Biodegrad. 65, 276–284. doi: 10.1016/j.ibiod.2010.11.012
Nelms, S. E., Barnett, J., Brownlow, A., Davison, N. J., Deaville, R., Galloway, T. S., et al. (2019). Microplastics in marine mammals stranded around the British coast: ubiquitous but transitory? Nat. Sci. Rep. 9:1075. doi: 10.1038/s41598-018-37428-37423
Nelson, J. D., and Eckert, S. A. (2007). Foraging ecology of whale sharks (Rhincodon typus) within bahía de los angeles, baja California Norte, Mexico. Fish. Res. 84, 47–64. doi: 10.1016/j.fishres.2006.11.013
Ningsih, N. S., Rakhmaputeri, N., and Harto, A. B. (2013). Upwelling variability along the southern coast of bali and in Nusa Tenggara waters. Ocean Sci. J. 48, 49–57. doi: 10.1007/s12601-013-0004-3
Norman, B. M., Holmberg, J. A., Arzoumanian, Z., Reynolds, S. D., Wilson, R. P., Rob, D., et al. (2017). Undersea constellations: the global biology of an endangered marine megavertebrate further informed through citizen science. Bioscience 67, 1029–1043. doi: 10.1093/biosci/bix127
Ogata, Y., Takada, H., Mizukawa, K., Hirai, H., Iwasa, S., Endo, S., et al. (2009). International pellet watch: global monitoring of persistent organic pollutants (POPs) in coastal waters. 1. Initial phase data on PCBs, DDTs, and HCHs. Mar. Pollut. Bull. 58, 1437–1446. doi: 10.1016/j.marpolbul.2009.06.014
O’Malley, M. P., Lee-Brooks, K., and Medd, H. B. (2013). The Global economic impact of manta ray watching tourism. PLoS One 8:e65051. doi: 10.1371/journal.pone.0065051
Ooi, M. S., Townsend, K. A., Bennett, M. B., Richardson, A. J., Fernando, D., Villa, C. A., et al. (2015). Levels of arsenic, cadmium, lead and mercury in the branchial plate and muscle tissue of mobulid rays. Mar. Pollut. Bull. 94, 251–259. doi: 10.1016/j.marpolbul.2015.02.005
Paig-Tran, E., Kleinteich, T., and Summers, A. P. (2013). The filter pads and filtration mechanisms of the devil rays: variation at macro and microscopic scales. J. Morphol. 274, 1026–1043. doi: 10.1002/jmor.20160
Panti, C., Baini, M., Lusher, A., Hernandez-Milan, G., Rebolledo, E. L. B., Unger, B., et al. (2019). Marine litter: One of the major threats for marine mammals. outcomes from the European cetacean society workshop. Environ. Pollut. 247, 72–79. doi: 10.1016/j.envpol.2019.01.029
Pedrotti, M. L., Petit, S., Elineau, A., Bruzaud, S., Crebassa, J., Dumontet, B., et al. (2016). Changes in the floating plastic pollution of the Mediterranean Sea in relation to the distance to land. PLoS One 11:e0161581. doi: 10.1371/journal.pone.0161581
Pelamatti, T., Fonseca-Ponce, I. A., Rios-Mendoza, L. M., Stewart, J. D., Marín-Enríquez, E., Marmolejo-Rodriguez, A. J., et al. (2019). Seasonal variation in the abundance of marine plastic debris in Banderas Bay. Mexico. Mar. Pollut. Bull. 145, 604–610. doi: 10.1016/j.marpolbul.2019.06.062
Perryman, R. J., Venables, S. K., Tapilatu, R. F., Marshall, A. D., Brown, C., and Franks, D. W. (2019). Social preferences and network structure in a population of reef manta rays. Behav. Ecol. Sociobiol. 73:114. doi: 10.1007/s00265-019-2720-x
Pierce, S. J., and Norman, B. (2016). Rhincodon typus. The IUCN Red List of Threatened Species 2016: e.T19488A2365291. Available at: http://dx.doi.org/10.2305/IUCN.UK.2016-1.RLTS.T19488A2365291.en. (accessed March 20, 2019).
Putra, M., Lewis, S., Kurniasih, E., Prabuning, D., and Faiqoh, E. (2016). “Plankton biomass models based on GIS and remote sensing technique for predicting marine megafauna hotspots in the Solor waters,” in Proceedings of the 2nd International Conference of Indonesian Society for Remote Sensing (ICOIRS), (Jogyakarta: Earth and Environmental Science).
R Core Team, (2018). R: A Language and Environment for Statistical Computing. Vienna: R Foundation for Statistical Computing.
Reddy, M. L., Reif, J., Bachand, A., and Ridgway, S. (2001). Opportunities for using Navy marine mammals to explore associations between organochlorine contaminants and unfavorable effects on reproduction. Sci. Total Environ. 2741, 171–182. doi: 10.1016/S0048-9697(01)00741-0
Reisser, J., Shaw, J., Wilcox, C., Hardesty, B. D., Proietti, M., Thums, M., et al. (2013). Marine plastic pollution in waters around Australia: characteristics, concentrations, and pathways. PLoS One 8:e80466. doi: 10.1371/journal.pone.0080466
Rios, L. M., Jones, P. R., Moore, C., and Narayan, U. V. (2010). Quantitation of persistent organic pollutants adsorbed on plastic debris from the Northern Pacific Gyre’s “eastern garbage patch”. J. Environ. Monit. 12, 2226–2236. doi: 10.1039/c0em00239a
Rios, L. M., Moore, C., and Jones, P. R. (2007). Persistent organic pollutants carried by synthetic polymers in the ocean environment. Mar. Pollut. Bull. 54, 1230–1237. doi: 10.1016/j.marpolbul.2007.03.022
Roch, S., and Brinker, A. (2017). Rapid and efficient method for the detection of microplastic in the gastrointestinal tract of fishes. Environ. Sci. Tech. 51, 4522–4530. doi: 10.1021/acs.est.7b00364
Rochman, C. M., Hoh, E., Kurobe, T., and Teh, S. J. (2013). Ingested plastic transfers hazardous chemicals to fish and induces hepatic stress. Nat. Sci. Rep. 3:3263. doi: 10.1038/srep03263
Rochman, C. M., Kurobe, T., Flores, I., and Teh, S. J. (2014). Early warning signs of endocrine disruption in adult fish from the ingestion of polyethylene with and without sorbed chemical pollutants from the marine environment. Sci. Total Environ. 493, 656–661. doi: 10.1016/j.scitotenv.2014.06.051
Rochman, C. M., Tahir, A., Williams, S. M., Baxa, D. V., Lam, R., Miller, J. T., et al. (2015). Anthropogenic debris in seafood: plastic debris and fibres from textiles in fish and bivalves sold for human consumption. Nature Sci. Rep. 5:14340. doi: 10.1038/srep14340
Rohner, C. A., Armstrong, A. J., Pierce, S. J., Prebble, C. E., Cagua, E. F., Cochran, J. E., et al. (2015). Whale sharks target dense prey patches of sergestid shrimp off Tanzania. J. Plankton Res. 37:fbv010. doi: 10.1093/plankt/fbv010
Sampaio, C. L., Leite, L., Reis-Filho, J. A., Loiola, M., Miranda, R. J., José de Anchieta, C., et al. (2018). New insights into whale shark Rhincodon typus diet in Brazil: an observation of ram filter-feeding on crab larvae and analysis of stomach contents from the first stranding in Bahia state. Environ. Biol. Fish. 101, 1285–1293. doi: 10.1007/s10641-018-0775-6
Santos, R. G., Andrades, R., Boldrini, M. A., and Martins, A. S. (2015). Debris ingestion by juvenile marine turtles: an underestimated problem. Mar. Pollut. Bull. 931, 37–43. doi: 10.1016/j.marpolbul.2015.02.022
Schmidt, C., Krauth, T., and Wagner, S. (2017). Export of plastic debris by rivers into the sea. Environ. Sci. Technol. 51, 12246–12253. doi: 10.1021/acs.est.7b02368
Setälä, O., Fleming-Lehtinen, V., and Lehtiniemi, M. (2014). Ingestion and transfer of microplastics in the planktonic food web. Environ. Pollut. 185, 77–83. doi: 10.1016/j.envpol.2013.10.013
Setyawan, E., Sianipar, A. B., Erdmann, M. V., Fischer, A. M., Haddy, J. A., Beale, C. S., et al. (2018). Site fidelity and movement patterns of reef manta rays (Mobula alfredi): mobulidae using passive acoustic telemetry in northern Raja Ampat, Indonesia. Nat. Conserv. Res. 3, 1–15. doi: 10.24189/ncr.2018.043
Shim, W. J., Hong, S. H., and Eo, S. E. (2017). Identification methods in microplastic analysis: a review. Anal. Methods 9, 1384–1391. doi: 10.1039/C6AY02558G
Sprintall, J., Wijels, S. E., Molcard, R., and Jaya, I. (2009). Direct estimates of the Indonesian throughflow entering the Indian Ocean: 2004–2006. J. Geophys. Res. 114:C07001. doi: 10.1029/2008JC005257
Stamper, M. A., Spicer, C. W., Neiffer, D. L., Mathews, K. S., and Fleming, G. J. (2009). Morbidity in a juvenile green sea turtle (Chelonia mydas) due to ocean-borne plastic. JZWM 40, 196–198. doi: 10.1638/2007-0101.1
Stevens, G. M. W. (2016). Conservation and Population Ecology of Manta Rays in the Maldives. Heslington: University of York.
Stewart, J. D., Jaine, F. R., Armstrong, A. J., Armstrong, A. O., Bennett, M. B., Burgess, K. B., et al. (2018). Research priorities to support effective manta and devil ray conservation. Front. Mar. Sci. 5:314. doi: 10.3389/fmars.2018.00314
Sugimoto, T. (1975). Effect of boundary geometries on tidal currents and tidal mixing. J. Oceanogr. Soc. Japan 31, 1–14. doi: 10.1007/BF02108214
Syakti, A. D., Bouhroum, R., Hidayati, N. V., Koenawan, C. J., Boulkamh, A., Sulistyo, I., et al. (2017). Beach macro-litter monitoring and floating microplastic in a coastal area of Indonesia. Mar. Pollut. Bull. 122, 217–225. doi: 10.1016/j.marpolbul.2017.06.046
Tanaka, K., Takada, H., Yamashita, R., Mizukawa, K., Fukuwaka, M., and Watanuki, Y. (2013). Accumulation of plastic-derived chemicals in tissues of seabirds ingesting marine plasticsMar. Pollut. Bull. 691, 219–222. doi: 10.1016/j.marpolbul.2012.12.010
Teuten, E. L., Saquing, J. M., Knappe, D. R., Barlaz, M. A., Jonsson, S., Bjorn, A., et al. (2009). Transport and release of chemicals from plastics to the environment and to wildlife. Philos. Trans. R. Soc. Lond. B. Biol. Sci. 364, 2027–2045. doi: 10.1098/rstb.2008.0284
Thys, T., Ryan, J. P., Weng, K. C., Erdmann, M., and Tresnati, J. (2016). Tracking a marine ecotourism star: movements of the short ocean sunfish Mola ramsayi in Nusa Penida, Bali, Indonesia. J. Mar. Biol. 2016:8750193. doi: 10.1155/2016/8750193
Tillinger, D. (2011). Physical oceanography of the present day Indonesian Throughflow. J. Geol. Soc. Lond. Special Public. 355, 267–281. doi: 10.1144/SP355.13
van Sebille, E. (2014). Adrift.org.au—A free, quick and easy tool to quantitatively study planktonic surface drift in the global ocean. J.Exp. Mar. Biol. Ecol. 461, 317–322. doi: 10.1016/j.jembe.2014.09.002
van Sebille, E., Wilcox, C., Lebreton, L., Maximenko, N., Hardesty, B. D., Van Franeker, J. A., et al. (2015). A global inventory of small floating plastic debris. Environ. Res. Lett. 10:124006. doi: 10.1088/1748-9326/10/12/124006
Vandermeersch, G., Van Cauwenberghe, L., Janssen, C. R., Marques, A., Granby, K., Fait, G., et al. (2015). A critical view on microplastic quantification in aquatic organisms. Environ. Res. 143, 46–55. doi: 10.1016/j.envres.2015.07.016
Verissimo, D., MacMillan, D. C., and Smith, R. J. (2011). Toward a systematic approach for identifying conservation flagships. Conserv. Lett. 4, 1–8. doi: 10.1111/j.1755-263X.2010.00151.x
Victor, D. (2018). 1,000 Pieces of Plastic Found Inside Dead Whale in Indonesia. NY Times. Available at: https://www.nytimes.com/2018/11/21/world/asia/whale-plastics-indonesia.html (accessed March 20, 2019).
Wilcox, C., Puckridge, M., Schuyler, Q. A., Townsend, K., and Hardesty, B. D. (2018). A quantitative analysis linking sea turtle mortality and plastic debris ingestion. Nat. Sci. Rep. 81:12536. doi: 10.1038/s41598-018-30038-z
Wilcox, C., Van Sebille, E., and Hardesty, B. D. (2015). Threat of plastic pollution to seabirds is global, pervasive, and increasing. PNAS 112, 11899–11904. doi: 10.1073/pnas.1502108112
Wilson, R. P., Shepard, E. L. C., and Liebsch, N. (2008). Prying into the intimate details of animal lives: use of a daily diary on animals. Endanger. Species Res. 41, 123–137. doi: 10.3354/esr00064
Worm, B., and Branch, T. A. (2012). The future of fish. Trends Ecol. Evol. 27, 594–599. doi: 10.1016/j.tree.2012.07.005
Worm, B., Lotze, H. K., Jubinville, I., Wilcox, C., and Jambeck, J. (2017). Plastic as a persistent marine pollutant. Annu. Rev. Environ. Resour. 42, 1–26. doi: 10.1146/annurev-environ-102016-060700
Yetman, G., Gaffin, S., and Xing, X. (2004). Global 15 × 15 Minute Grids of the Downscaled Population Based on the SRES B2 Scenario, 1990 and 2025. Washington, DC: NASA Socioeconomic Data and Applications Center (SEDAC). doi: 10.7927/H4HQ3WTH
Zachos, E. (2018). How This whale Got Nearly 20 Pounds of Plastic in its Stomach. Available at: https://news.nationalgeographic.com/2018/06/whale-dead-plastic-bags-thailand-animals/ (accessed March 20, 2019).
Keywords: Mobula alfredi, Rhincodon typus, marine debris, conservation ecology, flagship species, base-line, seasonal, coastal survey
Citation: Germanov ES, Marshall AD, Hendrawan IG, Admiraal R, Rohner CA, Argeswara J, Wulandari R, Himawan MR and Loneragan NR (2019) Microplastics on the Menu: Plastics Pollute Indonesian Manta Ray and Whale Shark Feeding Grounds. Front. Mar. Sci. 6:679. doi: 10.3389/fmars.2019.00679
Received: 02 August 2019; Accepted: 18 October 2019;
Published: 19 November 2019.
Edited by:
Julia Reisser, The University of Western Australia, AustraliaReviewed by:
Monica F. Costa, Federal University of Pernambuco, BrazilRodrigo Riera, Catholic University of the Most Holy Conception, Chile
Copyright © 2019 Germanov, Marshall, Hendrawan, Admiraal, Rohner, Argeswara, Wulandari, Himawan and Loneragan. This is an open-access article distributed under the terms of the Creative Commons Attribution License (CC BY). The use, distribution or reproduction in other forums is permitted, provided the original author(s) and the copyright owner(s) are credited and that the original publication in this journal is cited, in accordance with accepted academic practice. No use, distribution or reproduction is permitted which does not comply with these terms.
*Correspondence: Elitza S. Germanov, ZWxpdHphQG1hcmluZW1lZ2FmYXVuYS5vcmc=