 Miriam Römer1*
 Chieh-Wei Hsu1Markus Loher1Ian R. MacDonald2Christian dos Santos Ferreira1
 Thomas Pape1
 Susan Mau1Gerhard Bohrmann1Heiko Sahling1†
- 1MARUM – Center for Marine Environmental Sciences and Department of Geosciences, University of Bremen, Bremen, Germany
- 2Department of Earth, Ocean and Atmospheric Science, Florida State University, Tallahassee, FL, United States
This multi-disciplinary study of the hydrocarbon seepage system at Tsanyao Yang Knoll (TYK) in the southern Gulf of Mexico illustrates the amount and fate of hydrocarbons (mainly oil and methane) emanating from the seafloor structure and rising through a 3400 m water column. TYK forms part of the Campeche Knolls and was found to be one of the most active seepage structures at such an exceptional depth. Combining ship-based and AUV-based hydroacoustic mapping with direct seafloor observations and investigations, which used a TV-sled and a remotely operated vehicle with gas and water sampling devices provided an integrated view for the various transport pathways of hydrocarbons from the seafloor to the sea surface. In total, 32 acoustic ‘flares,’ indicative of gas bubble emission sites, were detected emanating from depressions on top of the knoll. Most of the emission sites were concentrated in two depressions that comprised a main seep field. An estimated volume of 550–4650 L of hydrocarbons per hour (or 8300–70,600 mol CH4 per hour) are released in the form of gas bubbles, which dissolve almost entirely during their rise in the water column. However, echograms showed gas anomalies to about 500 m below sea surface and some bubbles were seen to burst at the sea surface. Concentrations of dissolved methane were highly elevated (∼30,000 nmol/L) directly above the seafloor emission site, but decreased to background concentrations (3–5 nmol/L) within the lowermost 100 m. Smaller volume flow rates of oil also escaped from the seafloor, rose to the sea surface and generated natural oil slicks visible from the ship and in satellite images. This study shows that hydrocarbon seepage at ∼3400 m water depth can be followed to the sea surface. However, most of the methane dissolves in deeper waters, whereas oil reaches the sea surface.
Introduction
Release of light hydrocarbons and oil from the seafloor into the water column are common processes in various geological settings along the world’s ocean margins. The distribution of seep sites from the continental shelves to abyssal depths is predominantly controlled by the structure and composition of the deeper subsurface. Seep sites are known, for example, from tectonically active continental margins (e.g., Cascadia margin; Heeschen et al., 2005), from regions affected by salt tectonics [e.g., Nile Deep Sea Fan (Mascle et al., 2014); from the northern and southern Gulf of Mexico (GOM, Leifer and MacDonald, 2003; MacDonald et al., 2003, 2004; Sahling et al., 2016)], from thick fan deposits [e.g., Black Sea (Naudts et al., 2006; Artemov et al., 2007), Gulf of Guinea (Sultan et al., 2014); SW Barents Sea (Sauter et al., 2006), or are linked to naturally leaking oil reservoirs (Hornafius et al., 1999; MacDonald et al., 2004)]. Although numerous seep sites have been discovered and investigated, so far the variations in seepage activities, individual fluxes of light hydrocarbons and oil as well as their specific fate is still poorly explored. This holds particularly true for deep-water seep sites. Results from ship-based echosounders have shown that gas bubbles that are discharged at deep-water sites typically dissolve in the water column (Heeschen et al., 2003; Greinert et al., 2006; McGinnis et al., 2006; Sauter et al., 2006). Major factors controlling the fate of bubbles in the water column are water depth of the emission site, initial bubble size, presence of surfactants, as well as temperature, salinity and dissolved methane concentrations of the ambient water (Leifer and Patro, 2002) and gas composition (McGinnis et al., 2011). In addition, bubble-induced upwelling may lead to elevated methane transport through the water column (Leifer et al., 2006; Sauter et al., 2006). Moreover, bubble dissolution is hindered during ascent through the gas hydrate stability zone (GHSZ), due to the formation of a hydrate skin, which causes increased bubble lifetimes (Rehder et al., 2002). Similarly, the presence or absence of oil can significantly increase the bubble lifetime, because oil coating limits gas exchange (Leifer and MacDonald, 2003; Solomon et al., 2009).
The GOM is known for the presence of numerous prolific oil seep areas (e.g., Kvenvolden and Cooper, 2003; Garcia-Pineda et al., 2010). For several regions in the GOM, remote sensing has proven that oil emitted at water depths – even those exceeding several 100 m – is able to migrate to the sea surface. By analyzing synthetic aperture radar (SAR) data across the entire GOM that show persistent layers of oil slicks at the sea surface, MacDonald et al. (2015) identified 914 natural oil seep zones and calculated a total oil discharge rate of 2.5–9.5 × 10⁷ L/yr. About 69% of the estimated oil release were situated in the northwestern part of the GOM, while about 27% of the total was located in the southwestern part (MacDonald et al., 2015).
The salt province in the southern GOM, comprising the Sigsbee Knolls and the Campeche Knolls, is separated from the Mississippi-Texas-Louisiana salt province in the northern GOM by the Sigsbee Abyssal Plain (Figure 1; Bryant et al., 1991). The knoll areas comprise a series of diapiric domes and elongated ridges resulting from the movement of evaporites deposited during rifting in the Late Jurassic (Salvador, 1991). In the southern GOM, about 5–7 km of sediment was deposited above the salt, with increasing thickness in the onshore and nearshore regions (Ding et al., 2008). Seismic studies revealed that most of the investigated knolls and ridges are underlain by shallow hydrocarbon reservoirs (Ding et al., 2010). Oil and gas are driven upwards through faults generated by active and extensive salt tectonics, are released at the seafloor, and subsequently dissolve in the water column (light hydrocarbons) or form oil slicks on the sea surface (MacDonald et al., 2002). Seafloor observations at one of the knolls, called Chapopote Knoll, revealed extensive deposits of solidified asphalts (MacDonald et al., 2004). Brüning et al. (2010) suggested that heavy oil (with low solubility and density > water) forms lava-like asphalt flows when exposed to seawater, spreads meters to several 10s of meters at the seafloor, and finally solidifies.
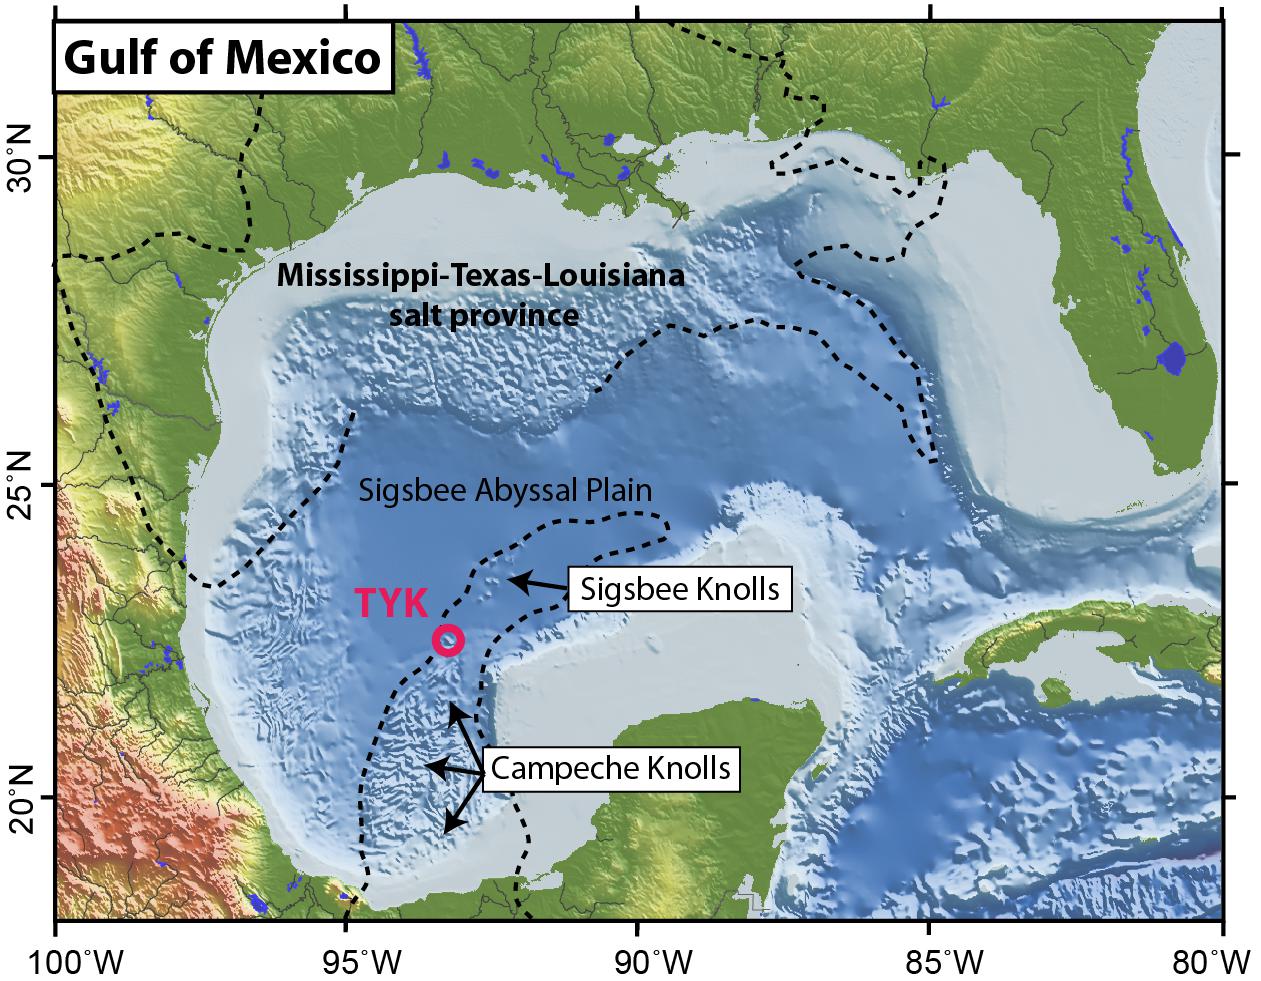
Figure 1. Geomorphological map of the Gulf of Mexico based on shaded GEBCO (General Bathymetric Chart of the Oceans) data showing the position of the Tsanyao Yang Knoll (TYK, red circle) in the southern GOM. Limits of subsurface salt provinces (dashed line) in the northern and southern Gulf of Mexico were adopted from the U.S. Geological Survey (https://catalog.data. gov/dataset/limit-of-salt-in-the-gulf-coast-saltlimitg).
During R/V METEOR cruise M114 in 2015, new measurements and sampling added substantial information to previous observations of the hydrocarbon seep system in other sites among the Campeche Knolls. A multidisciplinary approach with hydro-acoustic mapping and visual seafloor inspections showed that seafloor asphalt deposits, which were previously known only from the Chapopote Knoll, also occur at numerous other knolls and ridges (Sahling et al., 2016). The natural hydrocarbon seeps of the Campeche Knolls, due to the influence of gas and oil at the seafloor, further comprise chemosynthetic ecosystems located in deep waters. Chemoautotrophic communities, authigenic carbonates, gas bubble emissions, or gas hydrates were observed at 12 sites, indicating that hydrocarbon seepage is widespread in the region of the Campeche Knolls (Sahling et al., 2016).
This study targets gas and oil emissions from an individual knoll called ‘Tsanyao Yang Knoll’ (TYK) that was intensively investigated during R/V METEOR cruise M114 (Figure 1). It is based on results obtained through mapping seafloor seeps and determining volume emission rates of discharged gas bubbles and oil. They included hydro-acoustic characterizations of bubble transport and methane concentrations in the water column, and allowed for a comprehensive view of the entire seep system regarding the volumes of hydrocarbons entering the water column. Furthermore, their fate while traveling toward the sea surface was recorded for the first time by combining a bottom–up and surface down approach. A better understanding of natural seepage fluxes in the remote, deep ocean will help to evaluate the impact of deep-sea (>3000 m) hydrocarbon injections to the global ocean. These effects can further be compared to those caused by anthropogenic-induced disasters like the Deepwater Horizon blowout (McNutt et al., 2012).
Materials and Methods
The data presented in this study were acquired during R/V METEOR cruise M114 conducted in February/March 2015 to the southern GOM. The main objective of the cruise was to investigate natural hydrocarbon seepage related to the Campeche and Sigsbee Knolls.
Hydro-Acoustic Mapping
R/V METEOR was equipped with a KONGSBERG multibeam echosounder system EM122, which has been used to map TYK on the basis of seafloor morphology, seafloor backscatter intensity, and hydro-acoustic water column anomalies (‘flares’) that are diagnostic for gas bubble ascent in the water column. This hull-mounted echosounder comprised 288 beams, was operated at a frequency of 12 kHz, and had a resolution of 1° along track and 2° across track. Resulting raw data were processed with the open-source software MB-Systems (Caress and Chayes, 1996) to generate grids of bathymetry and backscatter with a cell size of 25 m. Seafloor bathymetry maps were finally created using ArcGIS10.3. Water column data were recorded in a separate file format (∗.wcd) and displayed and edited with the QPS software Fledermaus 7.3 and the FMMidwater toolbox.
Part of the TYK was additionally mapped in high resolution with the autonomous underwater vehicle (AUV) ‘MARUM SEAL.’ The AUV was deployed at approximately 80–100 m above seafloor. The echosounder installed on this AUV was a multibeam echosounder Kongsberg EM2040 capable of producing seafloor maps with grid cell sizes of less than 1 m. Raw data of seafloor bathymetry and backscatter as well as water column anomalies were processed as described above.
Seafloor Documentation and Visual Gas Bubble Analysis
Two dives with the deep-water remotely operated vehicle (ROV) ‘MARUM-QUEST 4000 m’ were conducted at TYK in order to inspect and sample the seafloor. GPS-based positioning was performed using the shipboard IXSEA Posidonia ultra-short base-line positioning system. The ROV was equipped with two color-zoom cameras for overview and near-bottom surveillance, and a broadcast standard 3CCD HDTV zoom video camera set for close-up video recording. Spatial resolution of this camera was 2.2 mega-pixel at 59.94 Hz interlaced. The video footage provided a general overview of seafloor structures and was used for detailed gas bubble visualization at emission sites. Visual inspections and quantifications of gas emissions were conducted at sites discovered by scanning the water column for backscatter signals caused by gas bubbles with a Kongsberg 675 kHz Type 1071 horizontal-scanning sonar (‘forward-looking sonar’). Size and rising speed of individual bubbles were determined with the ImageJ program. The funnel and the ROV manipulator, placed into the bubble streams, were used as a reference scale for size and distance measurements. Bubble volumes were calculated considering major and minor axes of imaged bubbles and assuming that bubbles form a rotational ellipsoid with an equivalent spherical radius (re, Leifer and Patro, 2002). Discharge rates of bubble-forming gas (in mL/min) were calculated considering the measured bubble size distribution and rates of bubble emission from the seafloor. Gas volume flows were converted into methane flows (in mol CH4/min) by applying measured gas compositions (see section “Gas Sampling and Chemical Analysis”) and methane compressibility1 with a compressibility factor (Z) of 0.92 at 3400 meter below sea level (mbsl) and 4.4°C.
In addition, visual seafloor inspections were performed using a towed TV-sled equipped with a video-data telemetry (Oktopus GmbH, Kiel, Germany), which transmits a black and white video signal to the onboard unit. Additionally, a video time-lapsed camera was attached to the frame of the TV-sled recording digital videos to a SD memory card, which were exported and analyzed after recovery. The sled was towed at a maximum speed of 0.5 knots at about 180 cm above the seafloor.
Gas Sampling and Chemical Analysis
Gas bubbles escaping the seafloor were sampled during ROV dives using a pressure-tight gas bubble sampler (GBS; Pape et al., 2010). Gas samples were collected during controlled degassing of the GBS at different pressure levels shortly upon recovery and transferred into glass vials pre-filled with saturated NaCl-solution. Aliquots of the gas were analyzed for molecular composition on-board using a two-channel 6890N (Agilent Technologies) gas chromatograph (Pape et al., 2010). Methane (C1) and further light hydrocarbons (C2–C6) were separated and quantified with a capillary column connected to a Flame Ionization Detector. Methane, nitrogen, as well as oxygen and argon, were separated with a stainless steel column packed with mole sieve and detected with a Thermal Conductivity Detector. Calibrations and performance checks of the analytical system were conducted regularly using commercial pure gas standards and gas mixtures, which yielded a precision better than 1.5%.
Oceanographic data and water samples were collected during a single hydrocast using a Sea-Bird CTD (SBE 9 plus) mounted on a 24 × 10 L Niskin rosette frame. Additional water samples were collected using seven 2.5 L Niskin bottles mounted on the side of the ROV. These Niskin bottles were closed individually at selected positions. Water samples from the sea-air interface at the location of active oil and bubble discharge were collected from a zodiac using a single Niskin bottle.
Methane concentrations of discrete water samples were analyzed using the batch mode of the Greenhouse Gas Analyzer (GGA, Los Gatos Research) following the procedure described by Geprägs (2016). Water was sampled from the Niskin bottles by filling two 140 mL syringes outfitted with gas tight valves via silicone hoses. The syringes were flushed and filled with 100 mL of seawater in order to avoid introduction of air bubbles and reformation of seawater-derived gas bubbles. In the laboratory on board, 40 mL of synthetic air without any methane were added to the syringes. The syringes were shaken vigorously for over 1.5 min to allow for equilibration between water and headspace. To minimize the risk of water injection into the GGA, the 40 mL headspace gas of each of the two syringes filled from the same Niskin bottle were transferred to a dry 140 mL syringe via a Luer Lock adapter and injected into the GGA. Immediately afterward, up to 60 mL of Zero Air were injected as needed, to reach the required volume of 140 mL of the analysis chamber of the GGA. The reproducibility of the method was < 2.5%.
Results
Hydro-Acoustic Seafloor and Water Column Mapping
TYK is located in the northernmost part of the Campeche Knoll area and emerges from a relatively flat seabed at 3650 to 3700 m below sea level (mbsl) (Figure 2A). In the entire Campeche Knolls area, most of the seafloor elevations are situated along ridges that typically trend from SW to NE (Figure 2A). In its northernmost part, these ridges are less pronounced, but appear as gradual morphologic elevations, presumably related to deeper sub-surface structures. A smoothly curved morphological high southwest of TYK, in alignment with the slightly elongated geometry of the knoll, is visible in the bathymetry map (Figure 2A). A further knoll with a similar shape and geometry, but about double the extent of TYK, is present in the northwestern prolongation of TYK.
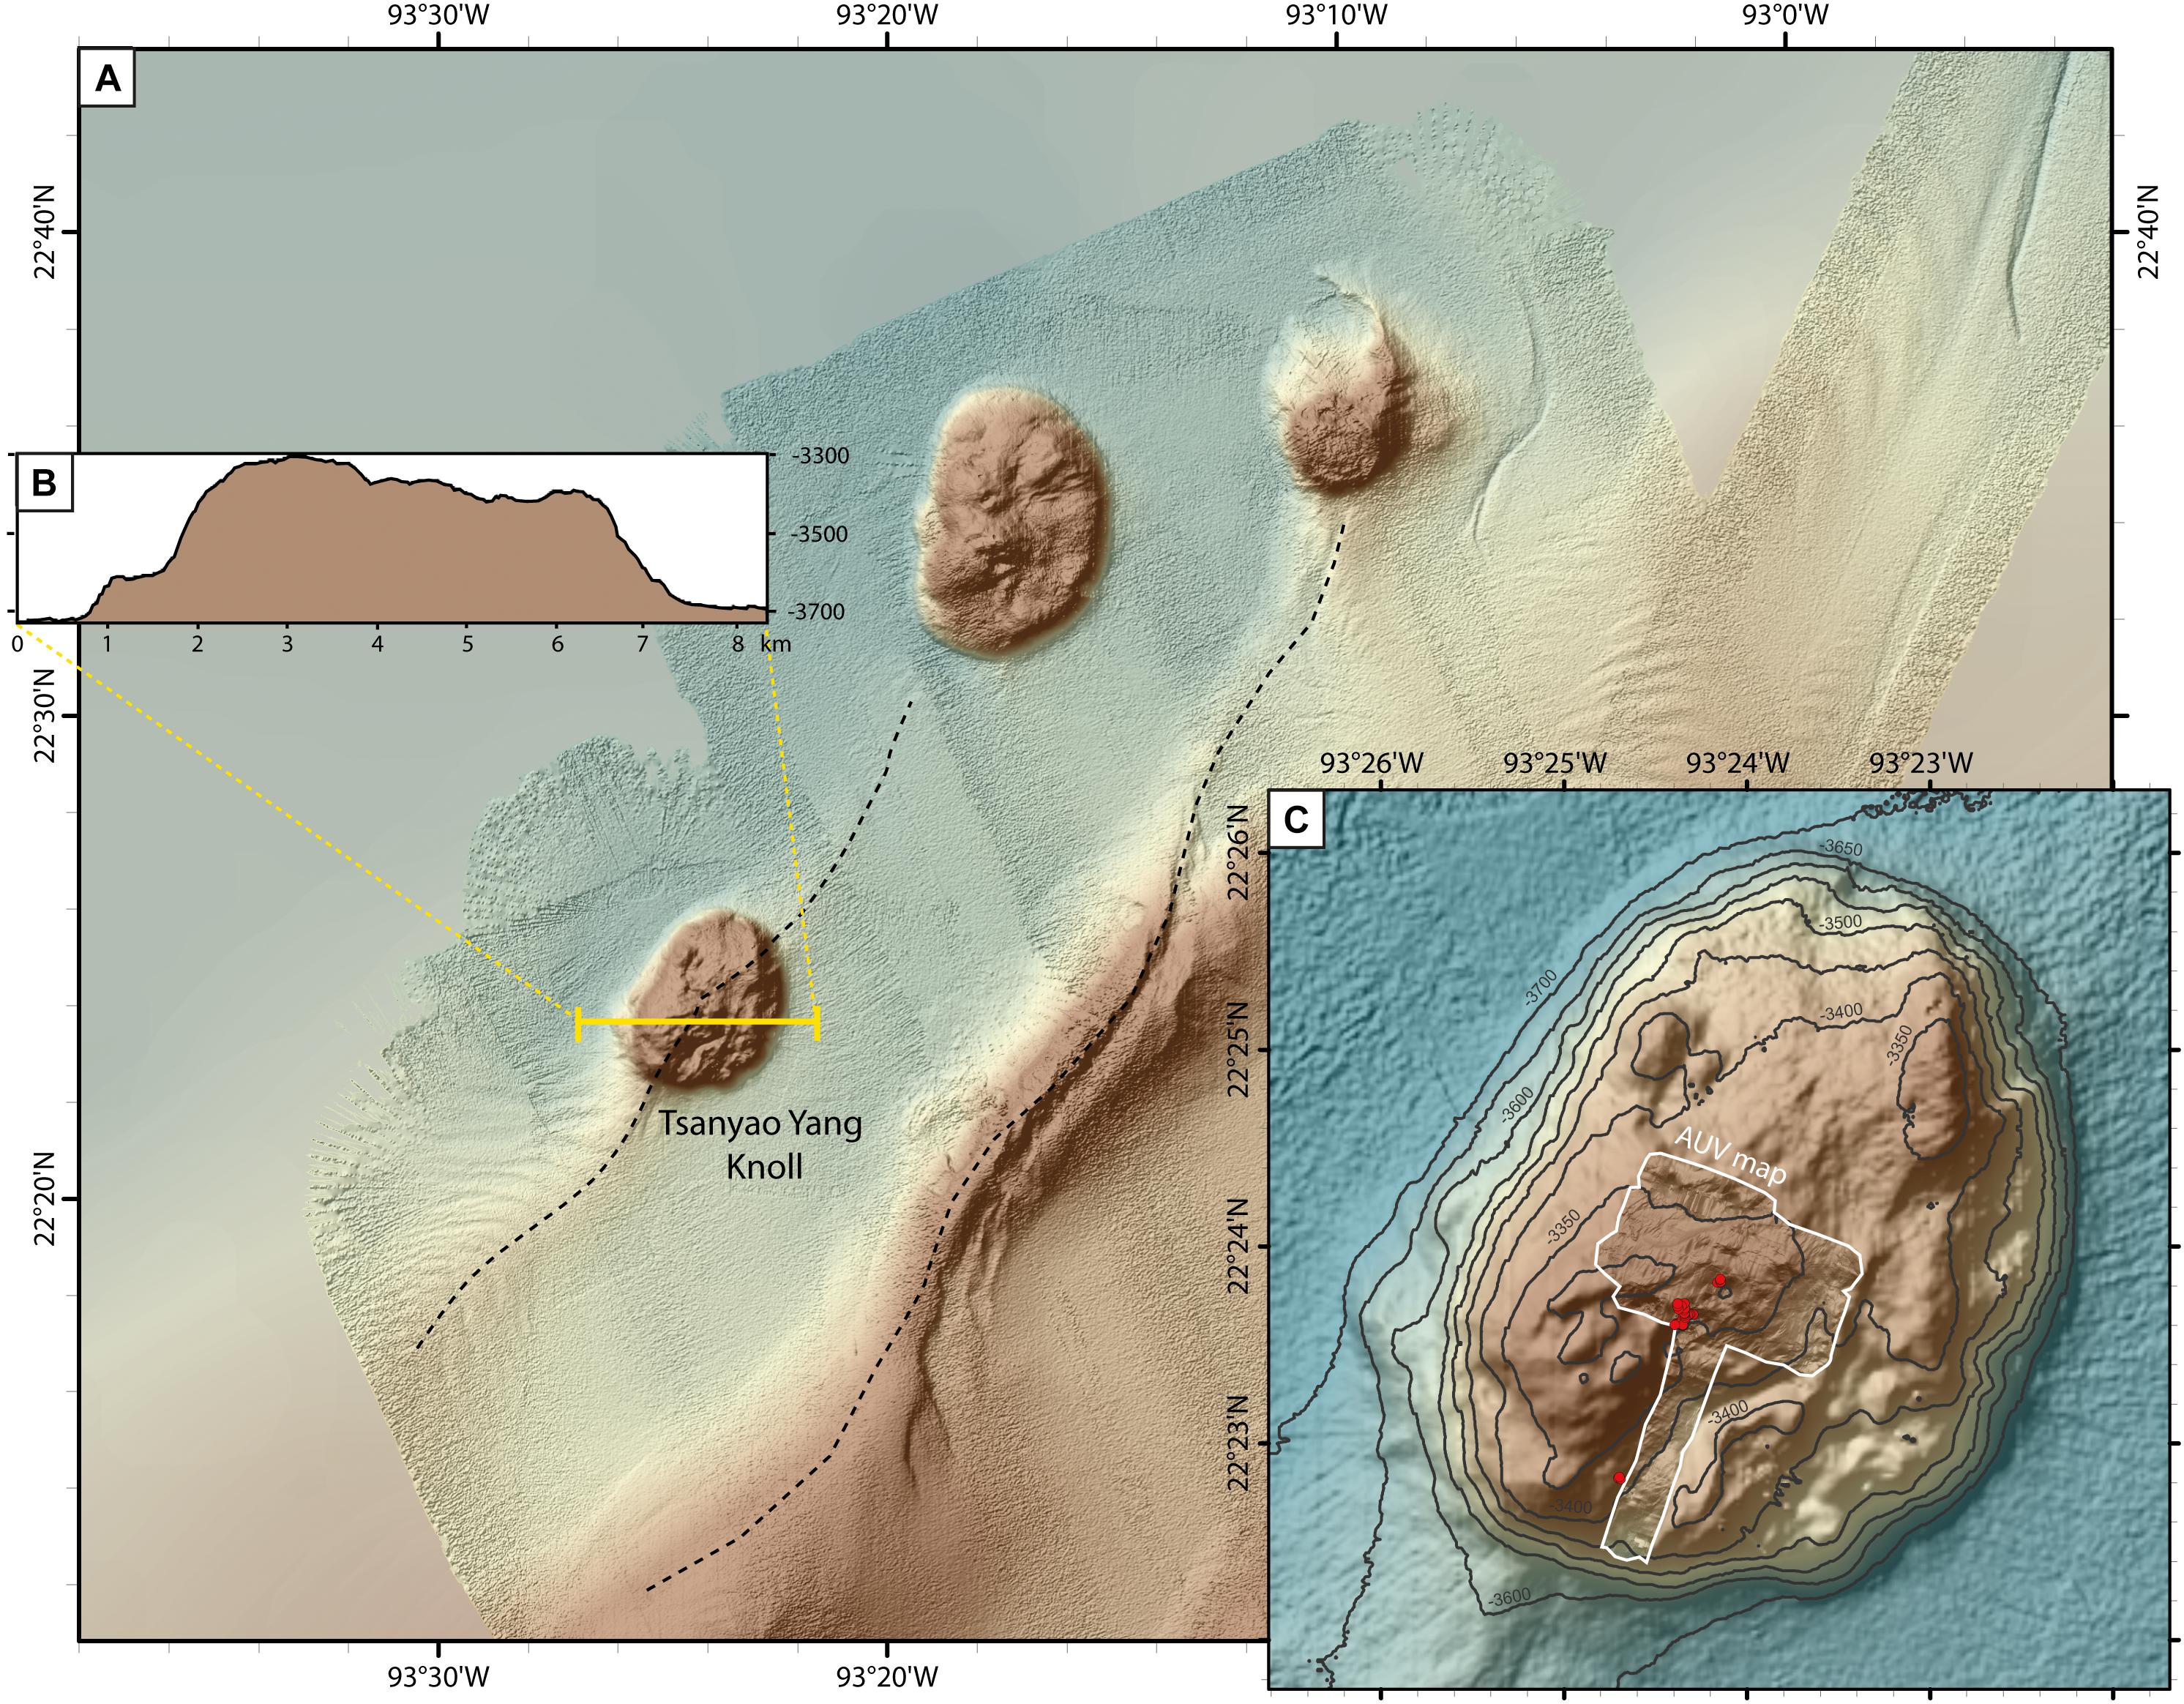
Figure 2. (A) Bathymetric map (from multibeam data acquired during R/V METEOR cruise M114 over GEBCO data) of the northernmost area of the Campeche Knolls including Tsanyao Yang Knoll (TYK) and two unnamed knolls northeast of TYK. Knolls and ridges appear to be SW-NE directed in this area, as highlighted by dashed-lines. (B) Morphological profile crossing TYK in W-E direction illustrating steep flanks and a truncated top. (C) Close-up of the bathymetry at the top of TYK combining ship- and AUV-based (white outline) multibeam data. Red dots indicate vertical seafloor projections of flare locations detected in hydro-acoustic echograms.
TYK has a sub-circular shape and is slightly elongated in SW-NE direction with a dimension of approximately 5.5 km × 7.5 km. It has steep flanks, which extend 250–300 m in height, and a generally flat top that reaches minimum water depths of ∼3300 mbsl in its southwestern part (Figures 2B,C). High-resolution bathymetric and seafloor backscatter data obtained during the course of an AUV dive, which covered part of TYK, revealed the presence of small-scale (10 to 100s of meter in dimensions) depressions and elevations on the generally flat top (Figure 2C). The most striking observation relevant to the localization of hydrocarbon seepage sites was the presence of at least 10 circular or elliptical depressions (Figure 3A). They were ∼100–300 m in diameter and ∼25 to 40 m deep. Most depressions were funnel-shaped and some showed positive structures inside their central deeper parts, creating an irregular morphology (Figure 3B). One of the largest depressions was composed of a central flat area exhibiting numerous decimeter-sized depressions and surrounding steep flanks (Figure 3D). Several more irregular and elliptic depressions represent composite features of two or more depressions (Figure 3B). Most depressions were characterized by relatively high seafloor backscatter intensities in their central parts (Figure 3C), which contrasted with the relatively homogeneous and low seafloor backscatter intensities on the top of the knoll.
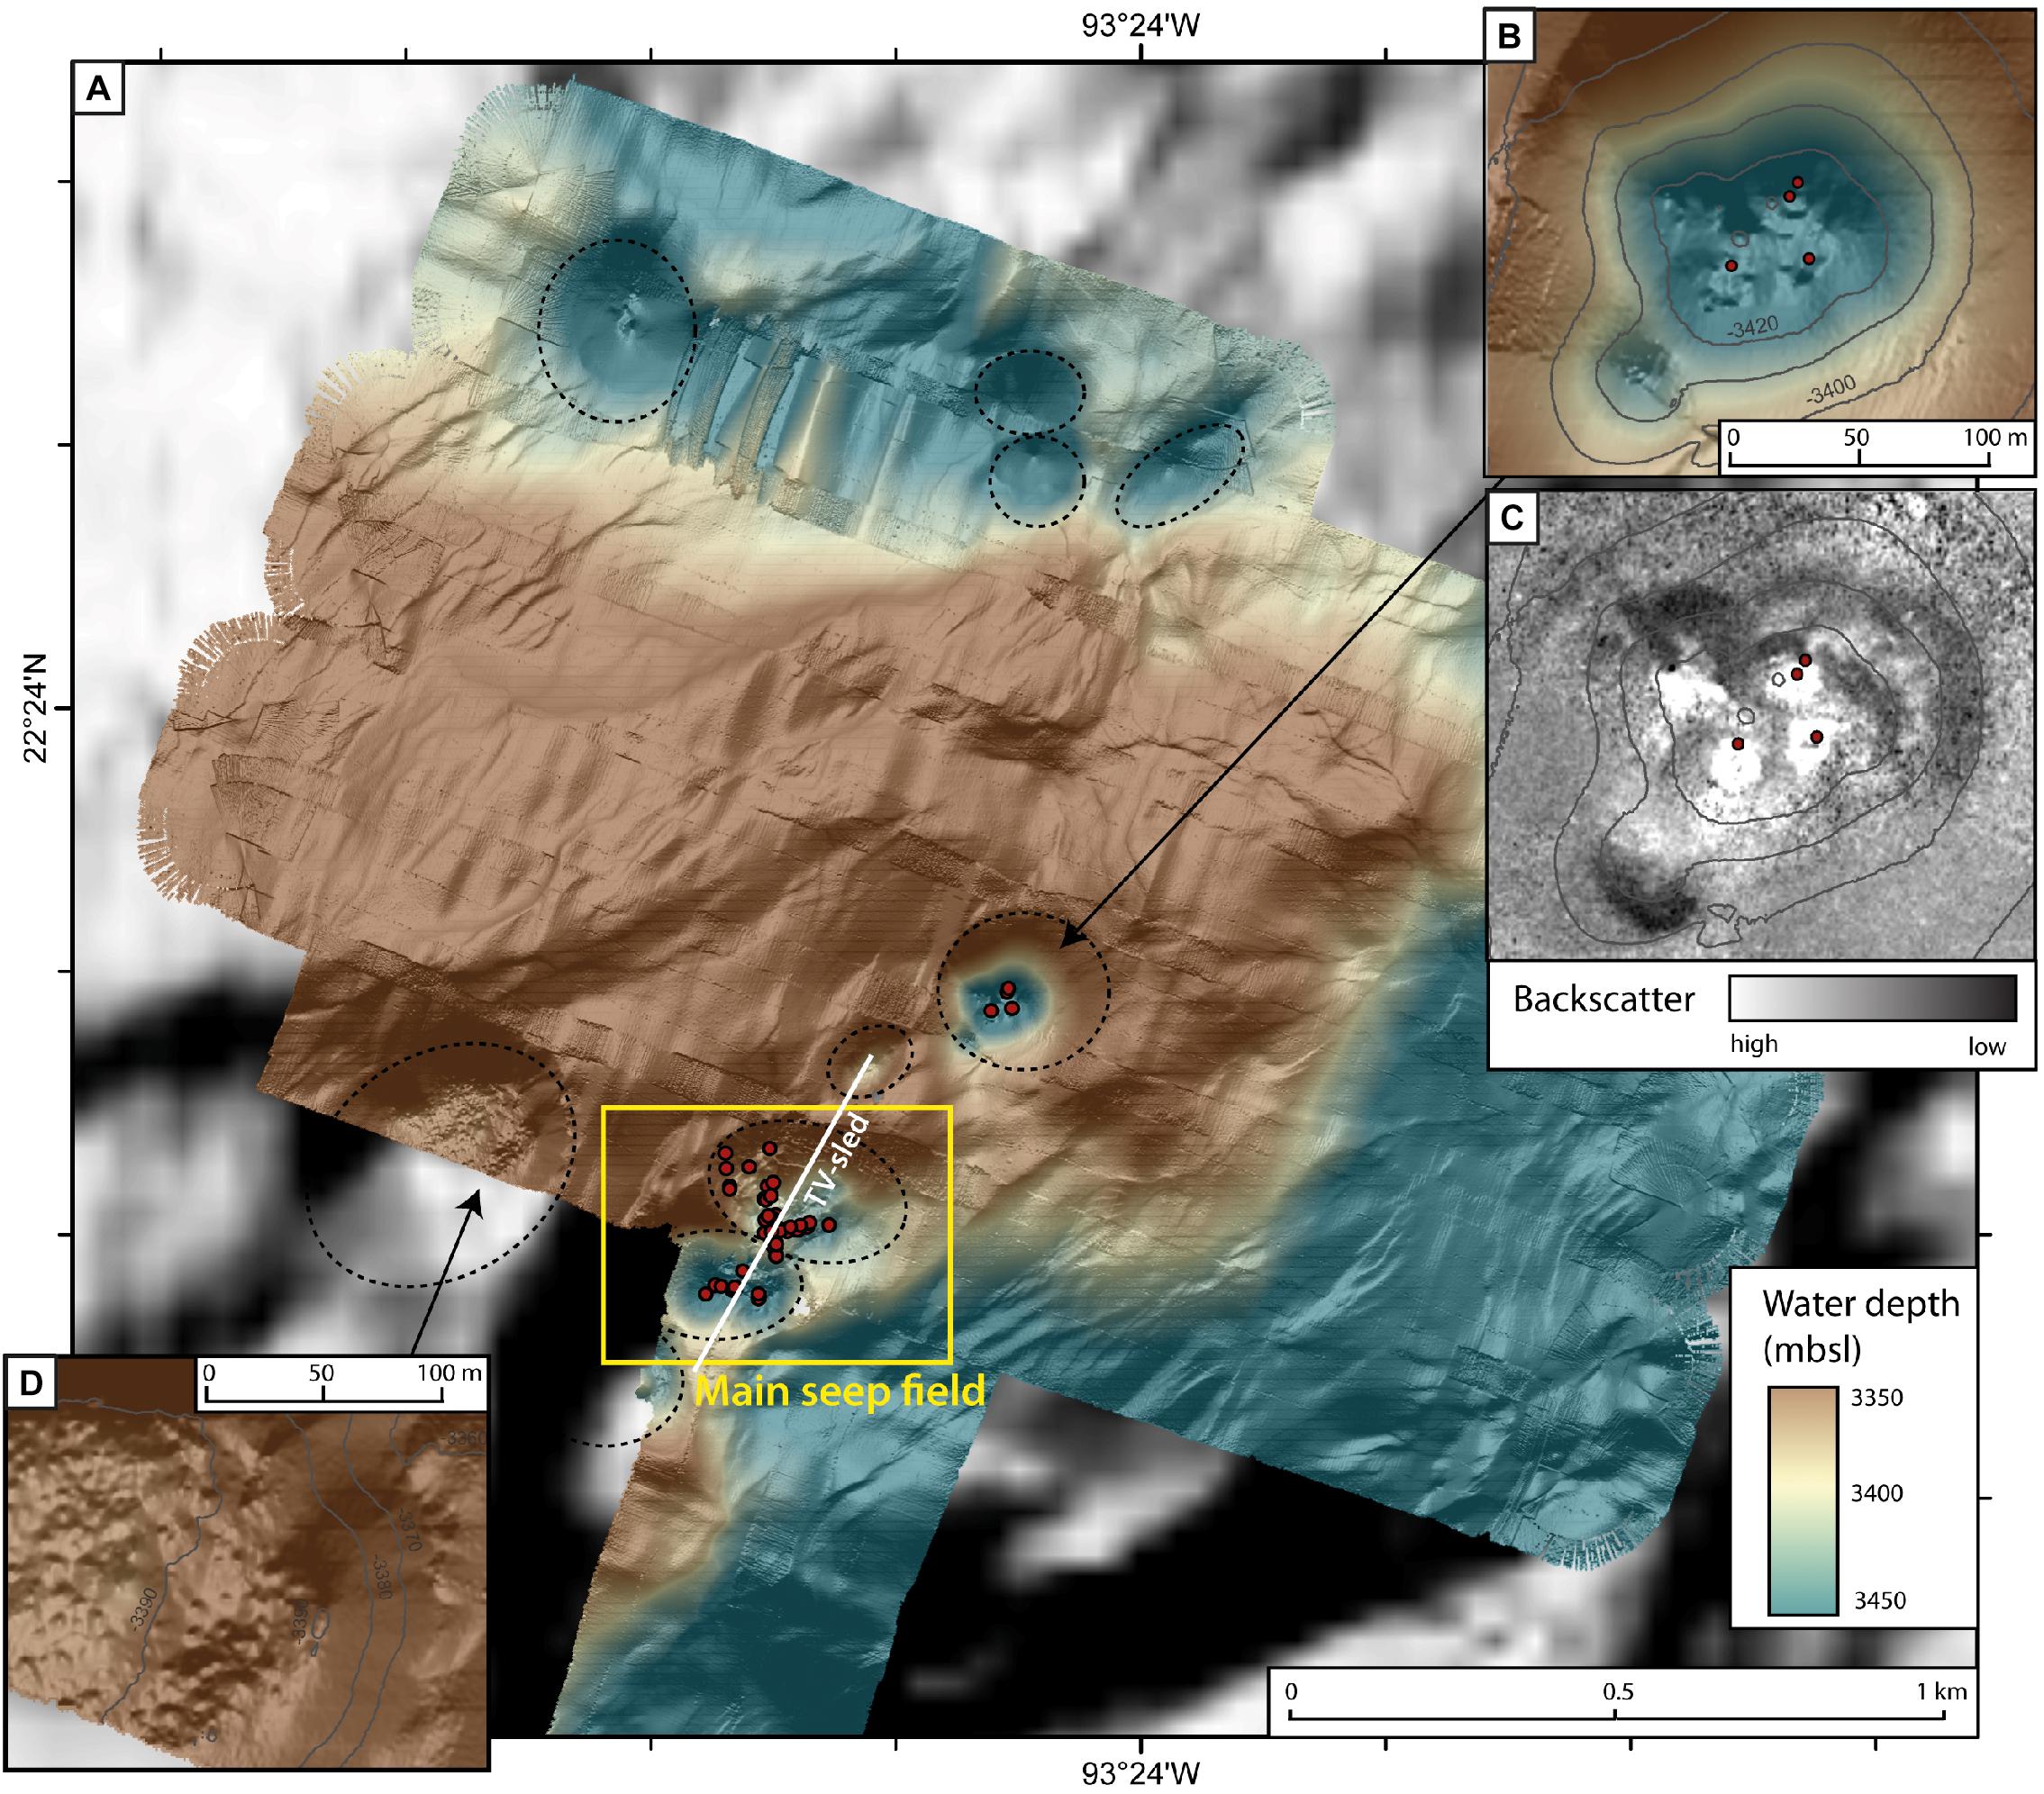
Figure 3. (A) High-resolution bathymetric grid acquired during the AUV dive above part of Tsanyao Yang Knoll showing a rough seafloor morphology with several depressions (outlined by dashed lines). Flares were exclusively detected above depressions. Most of them occurred in the two depressions defined as ‘Main seep field’ (yellow box). (B,C) Close-up of the depressions that showed gas bubble emission activity from the central part of the depression at sites characterized by high seafloor backscatter patches. (D) Close-up of the morphology in the depression that did not show gas bubble emission, but a rough morphology in its central part.
AUV-based multibeam mapping also revealed numerous acoustic anomalies in the water column that indicated the presence of gas bubbles. Respective seafloor emission sites were exclusively situated within the morphological depressions. Most of the emission sites were found in the main seep field (Figure 3A), which presents an irregular-shaped complex of two adjacent depressions. During the AUV dive, seafloor gas bubble escape was also documented at two other depressions located southwest and northeast of the main seep field (Figure 2C). Three flares were located above the southwestern depression and four above the northeastern depression. However, seepage activity from these features was minor compared with that from the main seep field, where a total of 32 flares was detected. As exemplified in the northern depression (Figure 3C), flares were generally sourced from areas showing elevated seafloor backscatter.
Flare appearance in the AUV-based echograms indicated variable emission intensities. Some were thin, linear reflections of individual points, whereas others created wider columns of high backscatter, in which several flares appeared to converge (Figures 4B,C). Three flare clusters fueled from several seafloor emission sites could be distinguished along the AUV track that crossed the main seep field (in the stacked view of the water column backscatter data, Figure 4C). These were situated above either the northeastern depression (flare cluster a), an area between the two adjacent depressions (b), or the southwestern depression (c). Figure 4B illustrates the complex distribution of several bubble streams above flare cluster (a) area and the varying intensities of individual flares. A major emission site was found at Site 2 (see section “Seafloor Observations and Documentation” for description), whereas a flare close to the track center seemed to be relatively minor in intensity.
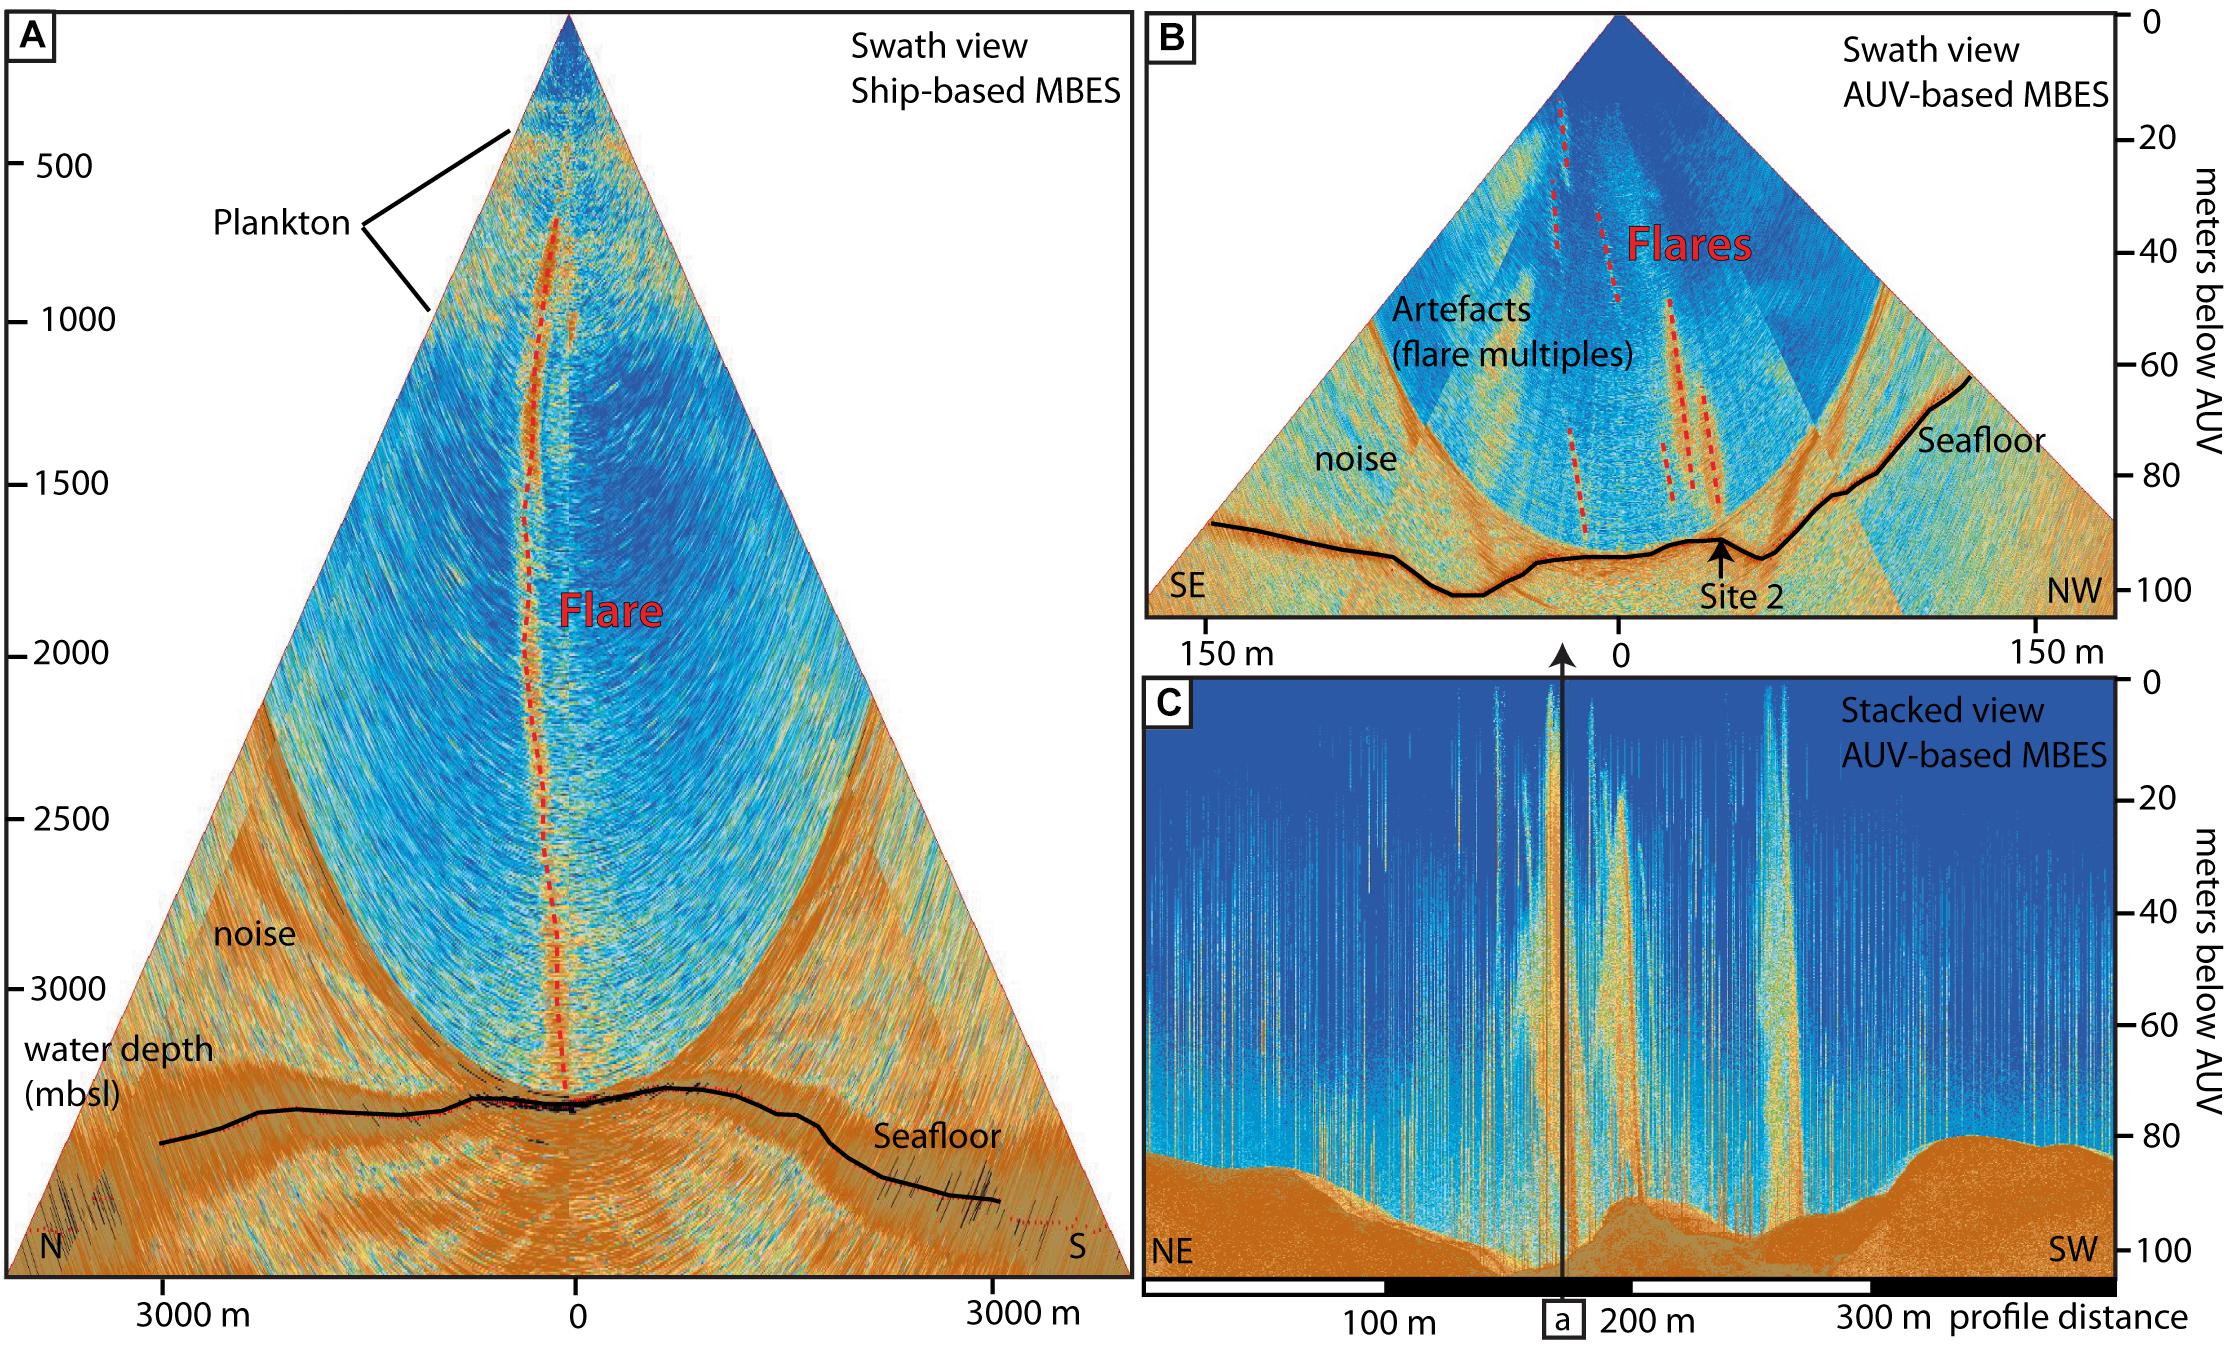
Figure 4. Multibeam records illustrating water column observations at TYK. (A) Screenshot of ship-based data (presented in a ‘swath view’) showing the main flare at TYK that was detected to rise from the seafloor at 3400 mbsl to water depths of ca. 500 mbsl. (B) Screenshot of AUV-based multibeam data (‘swath view’) showing several flares (highlighted by dashed red lines) that were located above the northeastern depression of the main seep field. (C) AUV-based multibeam data (presented in ‘stacked view’) showing three major flare clusters (brownish colors) along a 400-m long survey line crossing the main seep field. Position of the swath view example shown in (B) is marked as black line.
During cruise M114, water column anomalies interpreted as flares were also detected with the ship-based multibeam echosounder system Kongsberg EM122 (Figure 4A). In contrast to the high-resolution mapping achieved with the sonar that is mounted on the AUV, the ship-mounted sonar is used to image the entire water column, but does not allow for precise localization of seafloor gas emission sites (Figures 4B,C). Water column mapping by use of the ship-based multibeam system generally confirmed positions of flares determined by AUV flare mapping (in the central and southern part of TYK), and flares were apparently absent in other parts of TYK. Flares were observed in the water column below ∼500 mbsl (Figure 4A). Above this water depth, flare occurrences remained ambiguous, because a dense layer of hydro-acoustic noise obscured potential signals from gas bubbles. Water currents additionally led to horizontal deflections of bubbles passing the upper water column. Variable orientations of such deflections during the different surveys indicated changing current direction.
Seafloor Observations and Documentation
A single TV-sled survey, conducted along a NE-SW transect of about 500 m length across the main seep field (Figure 3A), and two ROV dives in the same area (Figure 5), revealed the presence of morphologic structures related to an active hydrocarbon seepage system as well as thriving chemosynthetic assemblages. The TV-sled transect was started at the depression northwest of the main seep field, which was characterized by elevated seafloor backscatter signals. Gas flares remained undetected above this site, but the presence of microbial mats in patchy distributions in the central part of the depression indicated the presence of hydrocarbons in concentrations sufficient to nourish chemosynthetic organisms. Further upslope, indications of seepage gave way to a seafloor covered with hemipelagic sediment. Observations of the main seep field showed a similar, but more complex, pattern with a seep-influenced area concentrated in the center of the depression. The northern slope was characterized by soft sediments with cm-sized dark rocks and bivalve shell fragments that increased in density from the rim downslope into the depression. The rocks are speculated to be remains of authigenic carbonate deposits. However, the sediment cover, the virtual absence of living bivalves, and the numerous shell fragments suggest that the seep system at this site has been inactive for a long time. In contrast, seafloor bubble release was observed in the central part of the depression. Assemblages of tubeworms, shell accumulations, white patches of microbial mats, dark gray reduced seafloor sediments and rock outcrops were identified. In contrast, the southern slope of the depression did not show evidence of seep activity.
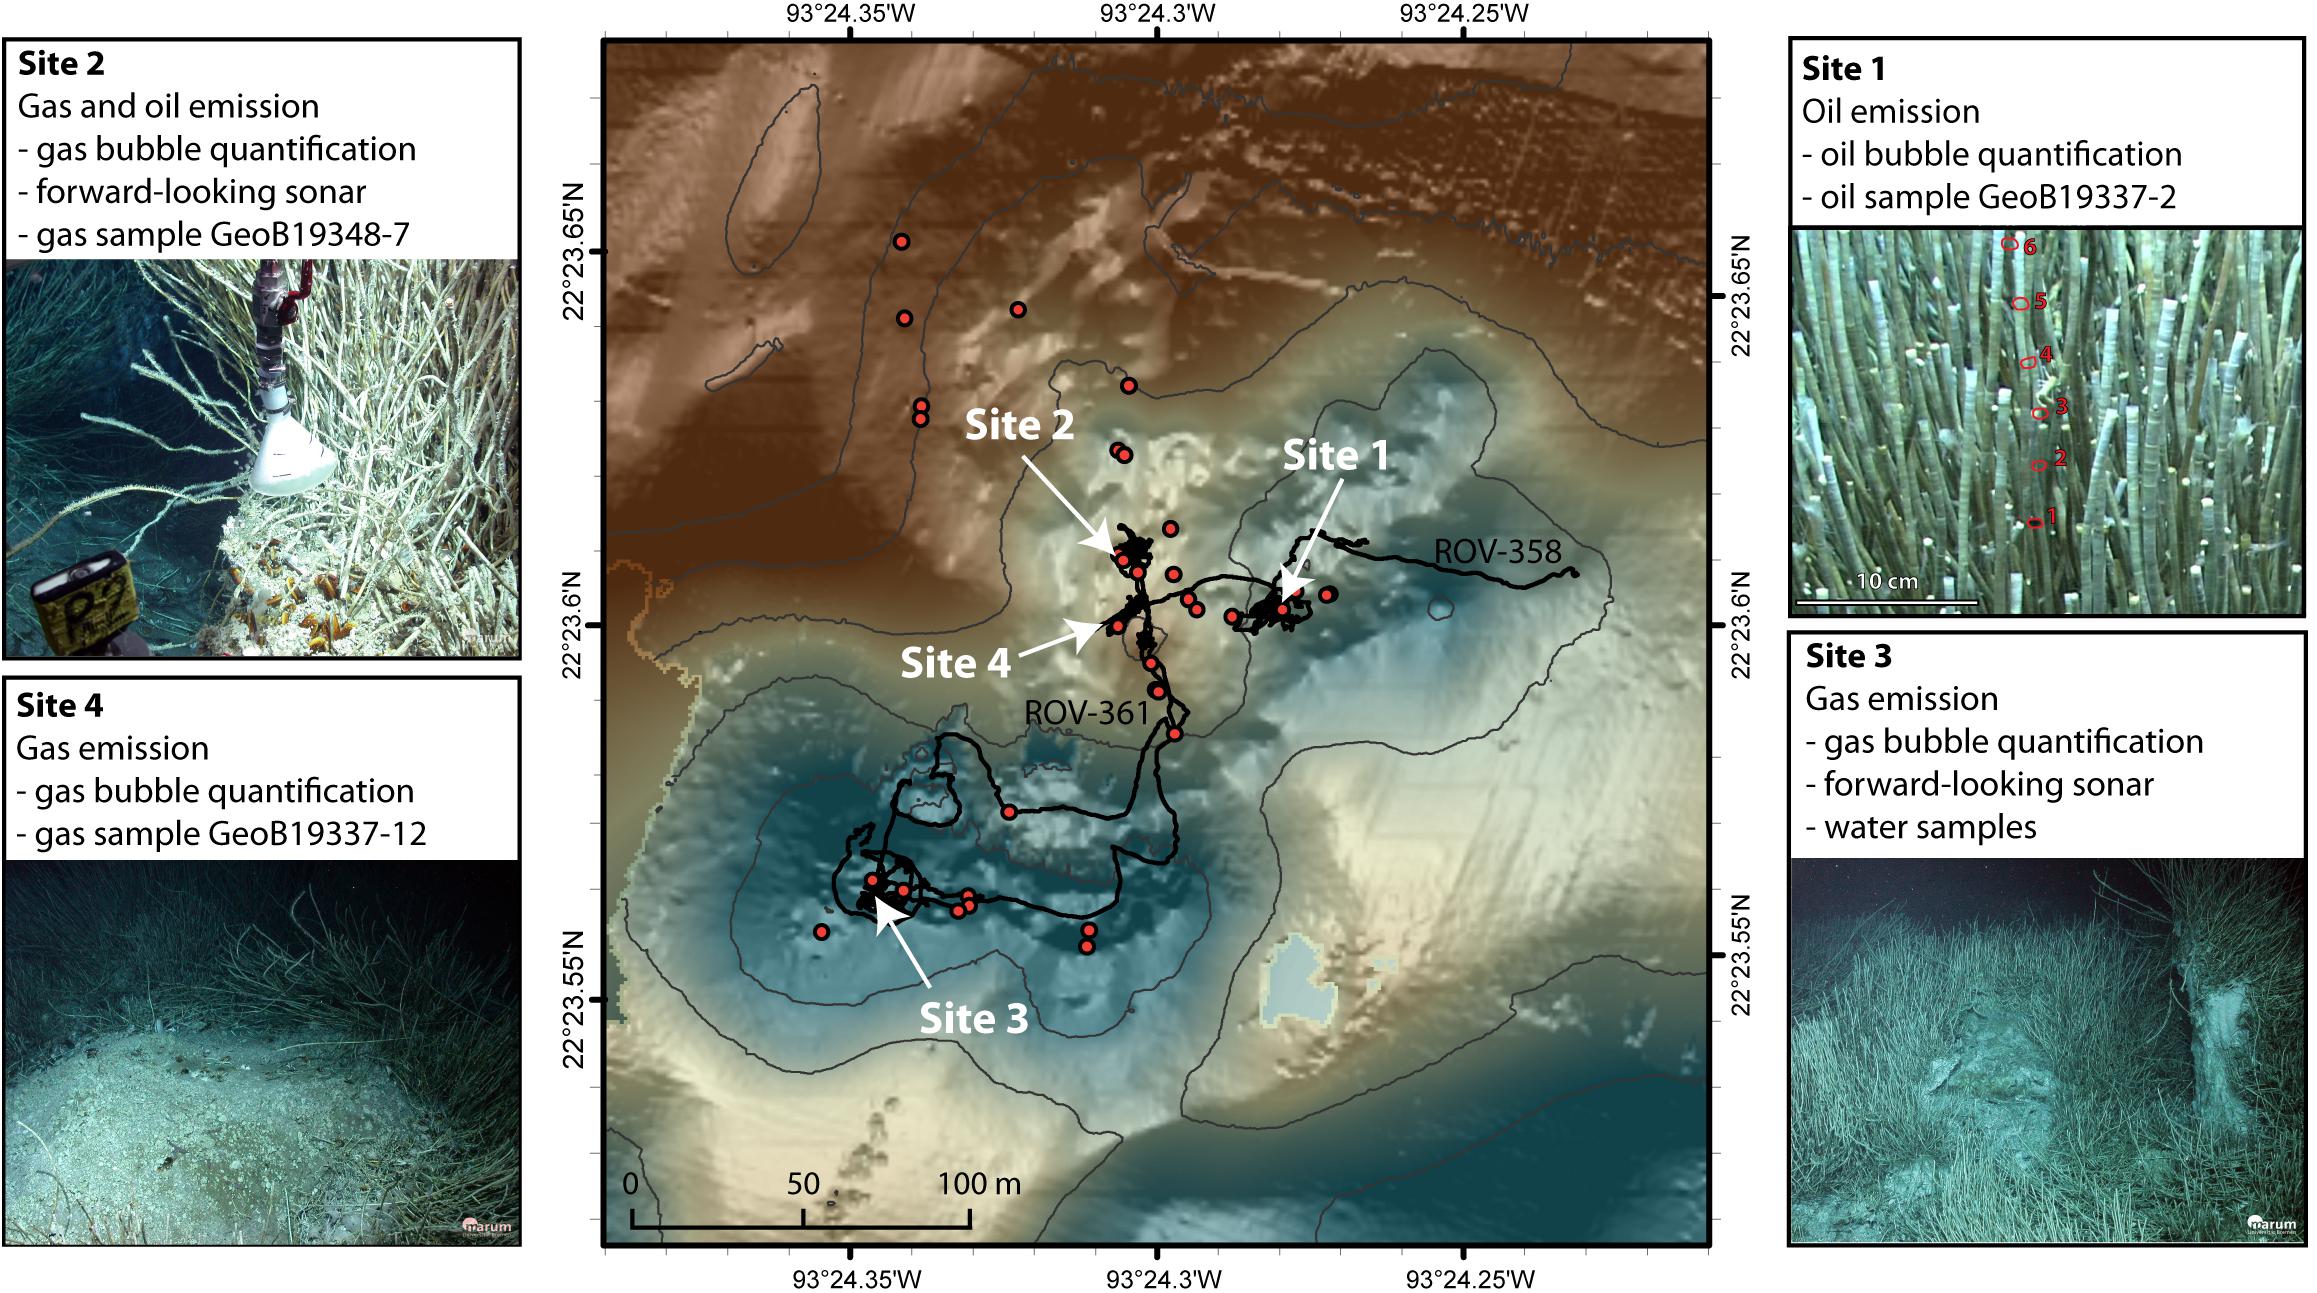
Figure 5. AUV-based high-resolution bathymetric data of the main seep field at TYK and seafloor projections of the positions of 32 flares (red dots) that were detected during M114. Flares clustered in the central areas of the two depressions and at the northern flank. Track lines of the two ROV dives (black lines) crossed several flare locations. Locations of Sites 1 to 4, at which detailed investigations and gas sampling have been performed, are marked by white arrows.
High-resolution video documentation of the seafloor within the depressions was achieved during the two ROV dives. Several seep-influenced areas were found, documented, and sampled. The ROV-based investigations generally confirmed the observation from the TV-sled survey. Extensive fields of vestimentiferan tubeworms, ranging from cm-sized juvenile stages to over 1-m long adults, indicated recent seepage activity. Clusters of living clams and mussels and respective shell fragments occurred next to whitish microbial mats and dark gray reduced sediment patches in several areas. Rock outcrops and concretions on the sediment are presumably authigenic carbonates. In contrast to some other knolls of the Campeche Knolls area, asphalt deposits were not observed on TYK. Semi-exposed gas hydrate outcrops were found at several sites within the main seep field, representing one of the deepest exposed gas hydrate deposits (∼3450 mbsl) known so far. The outcrops extended 3–10 m in diameter, with reliefs of 1–2 m. They were generally densely colonized by vestimentiferan tubeworms. The exposed gas hydrate displayed a fine-scale fabric of cm-sized pellets, pointing at rapid gas hydrate formation from gas bubbles. Where bubble streams emanated from the edges of the gas hydrate outcrops, some of the gas would freeze in place and accreted as additional mass that increased the size of the mounds.
ROV-based investigations at four seep sites in the main seep field (termed Sites 1–4; Figure 5) included detailed video recording, quantification and sampling of discharged gas. Site 1 is located at the center of the northeastern depression at about 3410 mbsl and showed exclusively oil bubble emissions at a partly collapsed mound structure colonized by vestimentiferan tubeworms. The southern side provided a view into the internal mound structure, whereas the northern side of the mound was intact and showed a smoothly sloped mound of about 2 m in height. Site 2 is situated on the western rim of the northeastern depression at about 3405 mbsl. An outcrop of gas hydrate formed a U-shaped seafloor morphology at least 2 m high and ∼10 m wide, that was colonized by scores of vestimentiferan tubeworms, including numerous juvenile individuals that indicate ongoing recruitment to the colony. In addition, several sites of intense gas bubble emission and a single site of oil bubble emission were detected at Site 2. Site 3 is located in the southwestern depression near its deepest part at about 3430 mbsl. Methanotrophic mussels (cf. Bathymodiolus heckeri) were observed in close proximity to gas vents. An extensive continuous tubeworm field covered the crest of a mound, which contains and possibly mainly consists of gas hydrate. Several gas bubble streams were fueled through holes within the gas hydrate outcrop.
Another mounded seafloor structure was detected at Site 4, which was situated between the two depressions at about 3400 mbsl. This mound was also densely populated by vestimentiferan tubeworms, but at its summit, the seafloor was composed of unconsolidated carbonate rubble, carbonate cements, and shell debris. Gas bubbles emanated from the edge of the central area where gas hydrate was exposed at the seafloor between tubeworm stems.
Water Column Methane Distributions
Ex situ concentrations of dissolved methane were analyzed in water samples collected within or close to a gas bubble stream observed at Site 3 during ROV dive 361. We sampled a depth profile by closing the Niskin bottles attached to the ROV at 0.5, 2.5, 5.0, 10.0, 15.0, and 25.0 m above the gas emission site at the seafloor. As expected, methane concentrations decreased from > 30,000 nmol/L near the seafloor to less than 500 nmol/L at 25.0 m above seafloor (Figure 6).
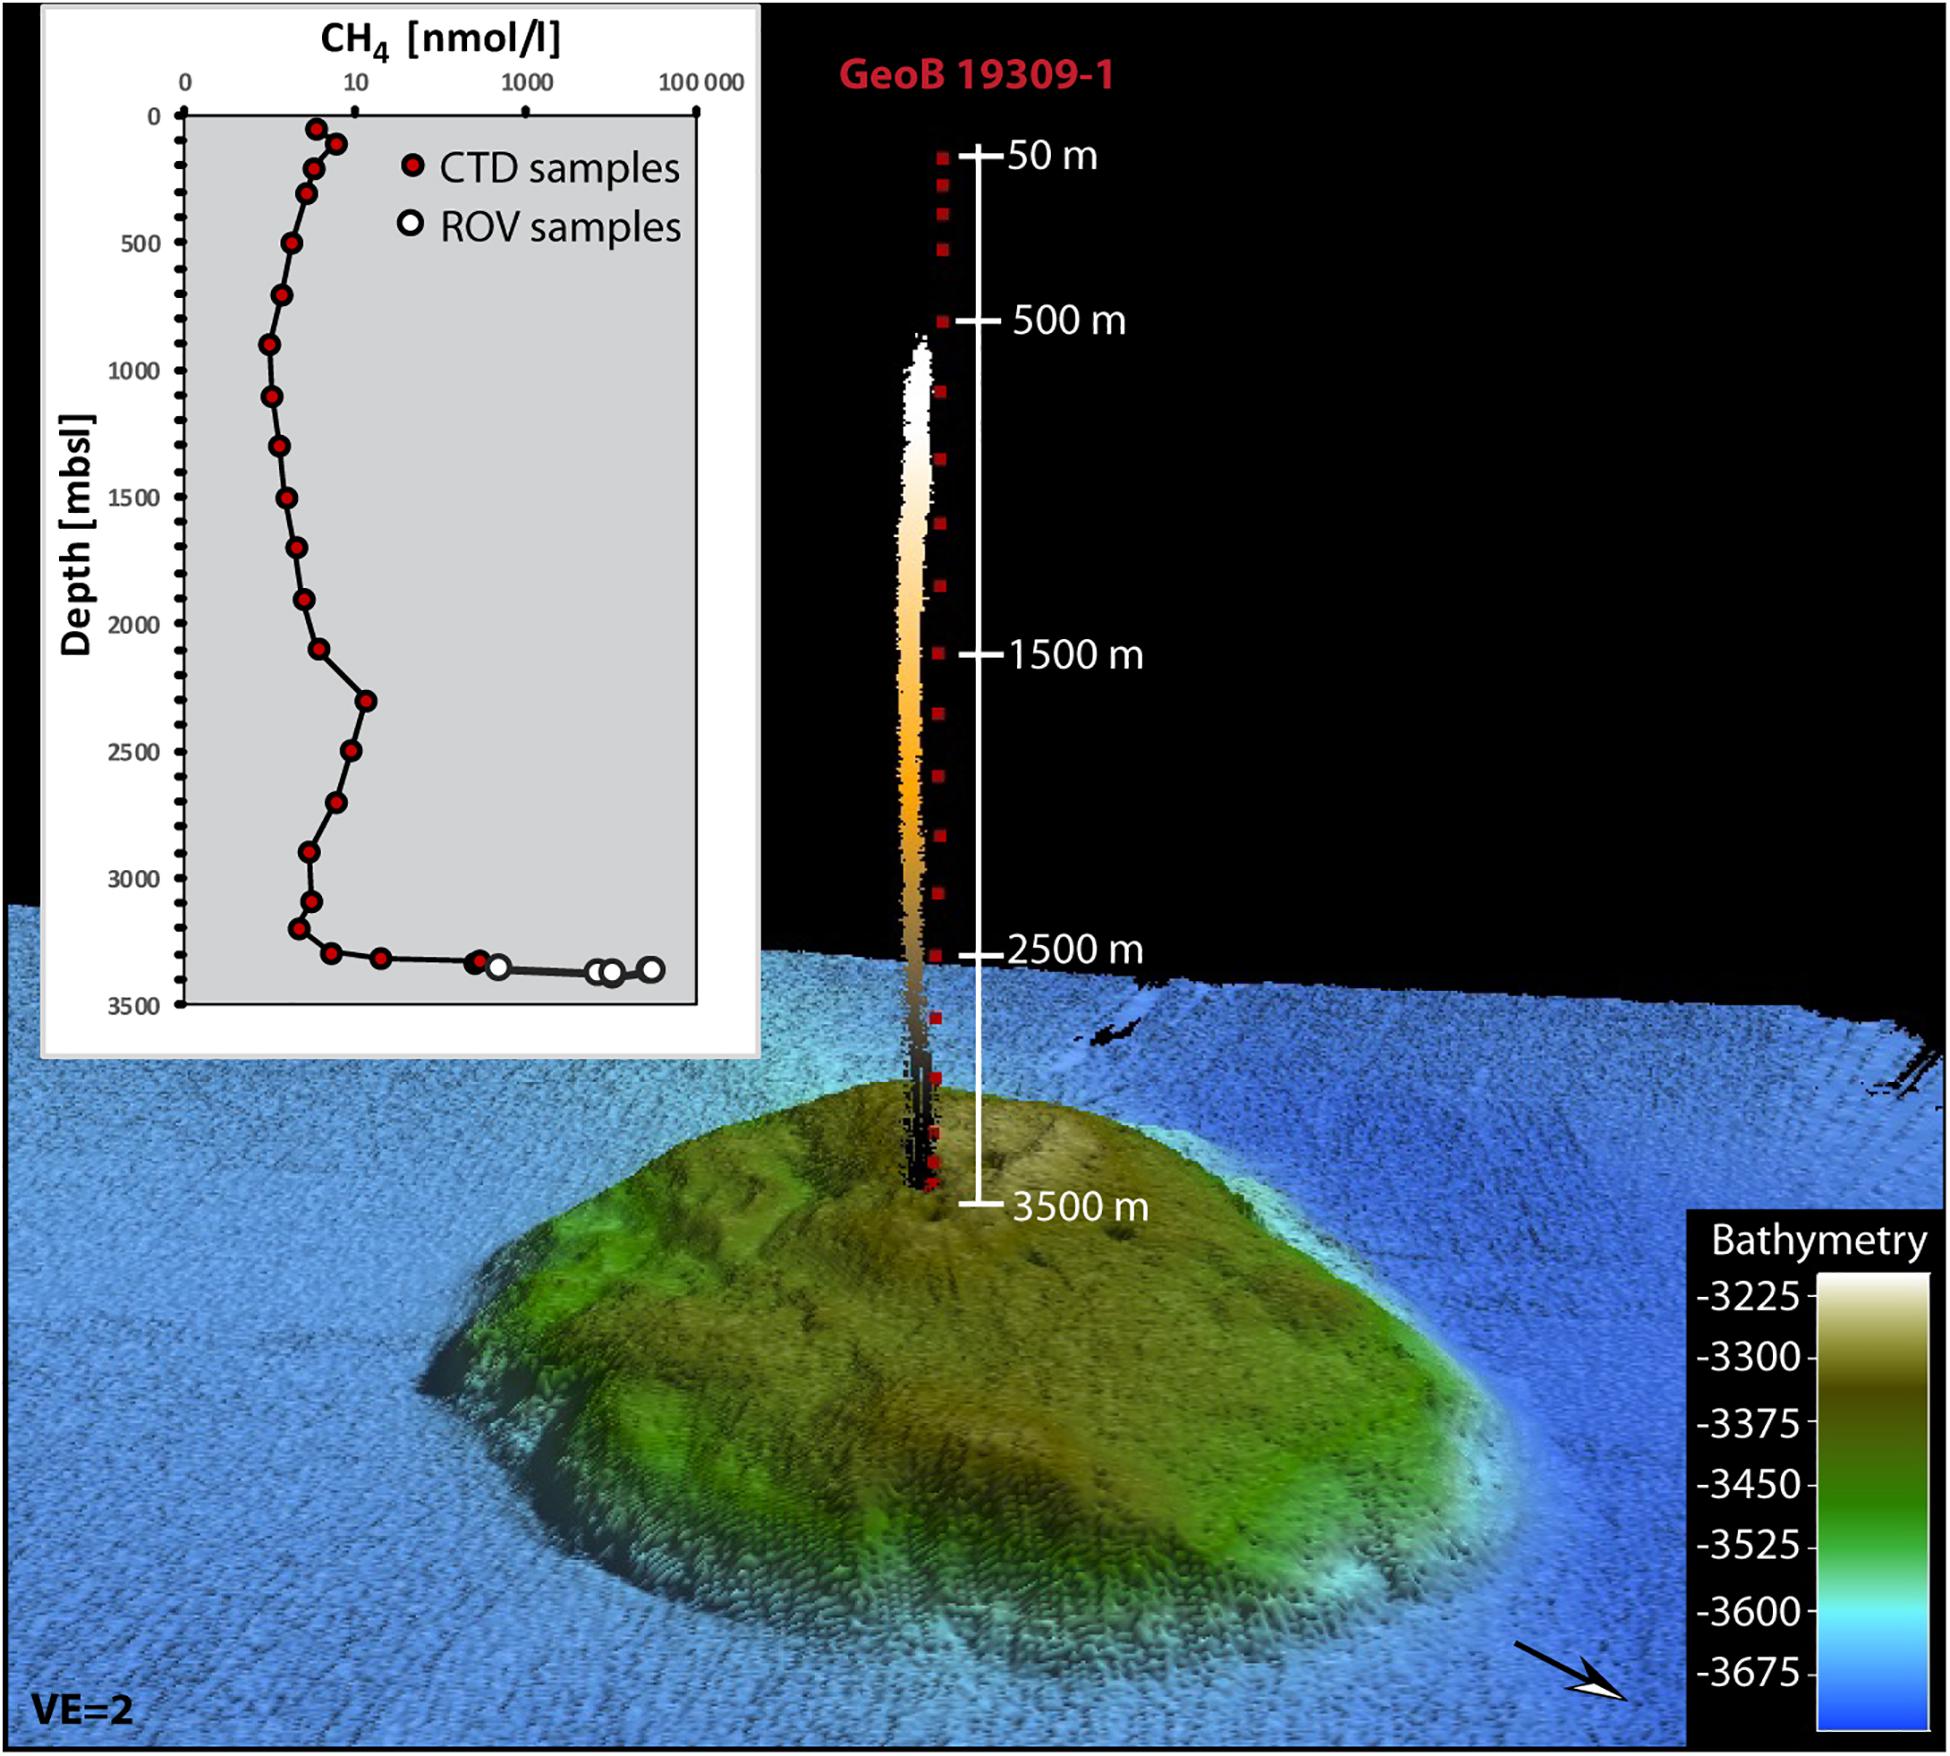
Figure 6. 3D-illustration of the seafloor at TYK that combines ship-based multibeam bathymetric data and positions of flares sourced from the main seep field. Depths of water samples taken during a hydrocast station close to the gas bubble streams for the analysis of ex situ concentrations of dissolved methane are shown as red dots. The resulting concentration profile (inset) illustrates the steep decrease in dissolved methane concentrations in the water column toward background concentrations within less than 100 m. Logarithmic scale used for illustrations of methane concentrations.
In addition, a series of water samples covering the entire water column within or close to the respective flare was sampled during a CTD rosette station (Figure 6). The lowermost samples (both ∼36 m above seafloor) had methane concentrations of 243 and 270 nmol/L. At 52 m above seafloor, methane concentrations were lower (19 nmol/L) and further decreased to 4.8 nmol/L at 72 m above seafloor, which is slightly elevated in contrast to methane concentrations in atmospheric equilibrium at the given temperature, salinity, and pressure (2.8 nmol/L). Farther up in the water column, methane concentrations ranged between 1 and 13 nmol/L. Water samples taken at the sea surface within the area of the oil slick origin, wherein gas bubbles were observed to burst, contained methane concentrations of 3–5 nmol/L, which slightly exceeds the atmospheric equilibrium methane concentration of 2.2 nmol/L.
Gas Emission Investigations
During the two ROV dives, several gas emissions that had appeared as flares in AUV-based multibeam mapping were detected and confirmed to be the seafloor locations of the gas emissions producing the water column anomalies. Although comprehensive mapping of the AUV flare sites with the ROV-based sonar could not be performed, the presence and positions of seven flares discovered during AUV dives were visually confirmed as gas bubble emission sites. Gas samples taken from single gas bubble streams each at Site 2 (GeoB19348-7) and Site 4 (GeoB19337-12) revealed similar molecular gas compositions (Table 1). Methane was the most abundant gas (93.4 and 94.5 mol-% of C1–C6), and amended by ethane (4.3/3.2), propane (1.3/1.1), as well as i- (0.4/0.4) and n-butane (0.4/0.6). The resulting hydrocarbon ratios [C1/(C2-C6)] were 14 at Sites 2 and 17 at Site 4, indicating a thermogenic origin of the light hydrocarbons. Light hydrocarbons extracted at atmospheric pressure from the oil sample recovered with the GBS (GeoB19337-2) from Site 1 yielded a C1/(C2–C6) ratio of 6. It could not be resolved, if the oil release was in pure liquid phase or included a gas phase. Nevertheless, in this study we refer to the term “oil bubble” to account for this type of fluid release in contrast to pure gas bubble emissions.
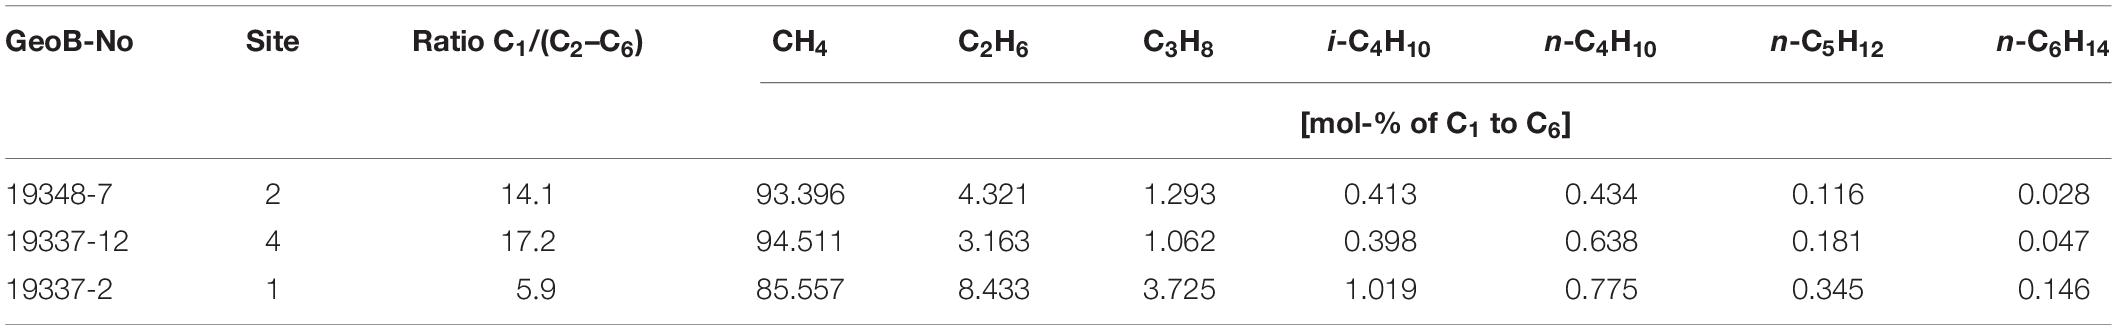
Table 1. Gas molecular composition of gas and oil bubbles sampled at Tsanyao Yang Knoll with a gas bubble sampler during two ROV dives (GeoB19348-1 and GeoB19337-1) conducted during METEOR cruise M114 in 2015.
Gas flows were quantified visually for individual gas bubble streams at Sites 2, 3, and 4 (Table 2). At Site 2, numerous gas bubble streams emerged from a several meter large canyon-like structure composed of gas hydrate. Gas bubble sizes and rising speeds were recorded for one of several gas bubble streams. Because of the limitations in differentiating between gas bubble streams visually, the spatial distribution of gas emission sites was documented with the ROV-based forward-looking sonar. Respective sonar records allowed for an extrapolation of gas flows from an entire area based on the quantification of gas flow for a single bubble stream. At Site 2, about eight clusters of gas bubble streams were observed in an area of about 7 m in diameter during scanning at an altitude of ∼15 m (Figure 7). While approaching these clusters and descending with the ROV toward the seafloor, the scanning range was reduced to 5 m, resulting in a more precise recording that showed the presence of at least 17 gas bubble streams. One of these gas bubble streams (‘2-1’), was finally documented and quantified visually (Table 2). The measured bubble radius re ranged between 1.2 and 4.8 mm with an average of 2.6 mm (n = 190). The bubble emission frequency was 89 bubbles per second (b/s). The resulting gas volume outflow from Site 2 was 454 mL/min (± 100). At Site 3, three acoustic anomalies (3A, B, and C) became visible in sonar records using a scanning range of 20 m at an altitude of 15 m (Figure 7). The three anomalies were located 2 and 4 m, respectively, distant to each other, but had appeared as a single anomaly in the AUV-based multibeam echosounder record. Anomaly 3C represented about one-third of the flare and was subsequently videoed and visually quantified. At anomaly 3C, two gas bubble streams (3-1, 3-2), which originated from separate sites about 30 cm apart on top of a massive gas hydrate structure, were quantified. Sizes of bubbles discharged at the two emission sites differed significantly. Bubbles contained in stream 3-1 showed an average re of 2.1 mm (SD = 0.6, n = 80), whereas at stream 3-2 bubbles diameters were much smaller with re of 0.47 mm (SD = 0.04, n = 85). Bubble emission frequencies varied in inverse proportion to bubble size, with 38 b/s at anomaly 3-1 and 2318 b/s at anomaly 3-2, respectively. The calculated gas volume outputs were 110 mL/min (± 23) at bubble stream 3-1 and 62 mL/min (± 6.5) at bubble stream 3-2. At Site 4, a single bubble stream (4-1) was quantified. Bubble radius re ranged from 1.2 to 6.0 mm, with an average of 3.3 mm (n = 66). A relatively low bubble emission frequency of 2.5 b/s was measured, resulting in a volume outflow of about 32 mL/min (± 8). Conversion of the gas volume to a molar flow, presuming the bubbles to be composed of 94% of methane, shows that in total about 10 moles of methane per minute were released from the sites hosting the four gas bubble streams 2-1, 3-1, 3-2, and 4-1.
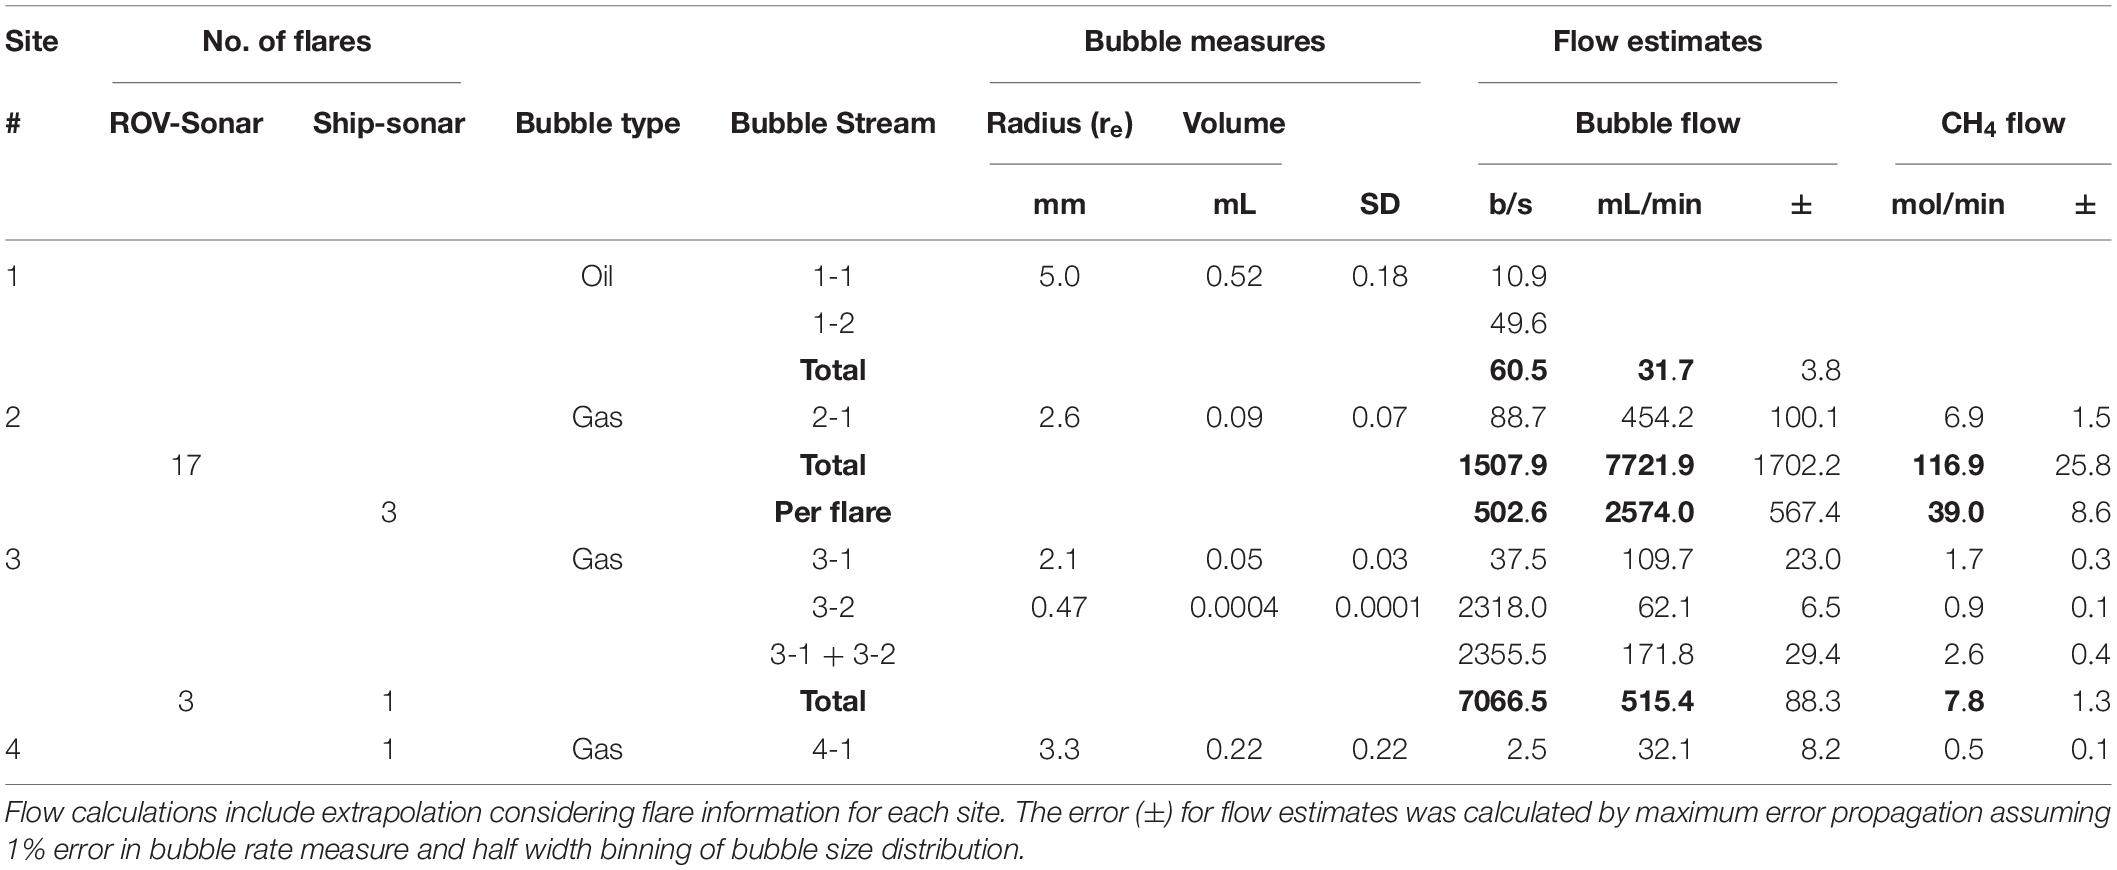
Table 2. Bubble estimates and calculated flows at the four emission sites (Sites 1–4) in the main seep field at Tsanyao Yang Knoll.
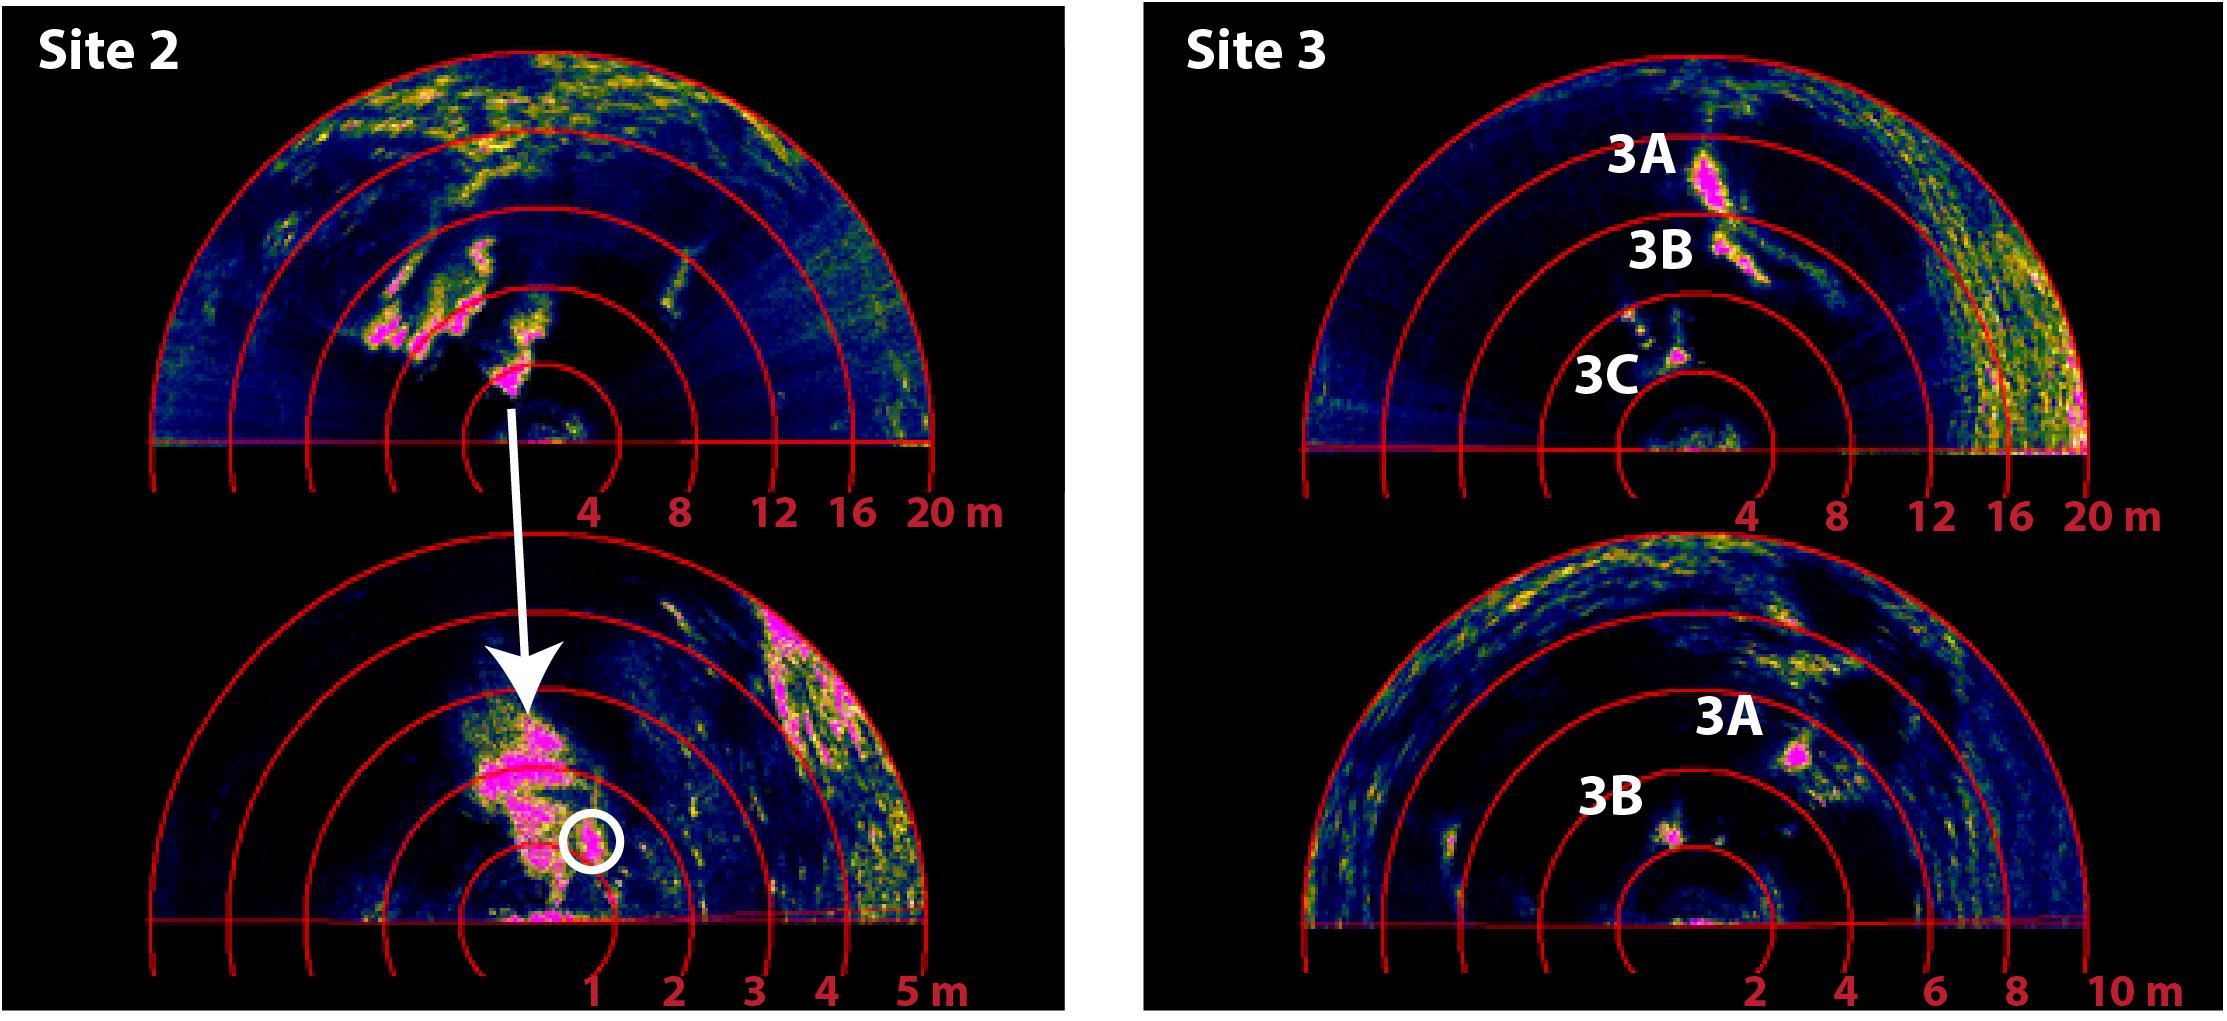
Figure 7. Screenshots of the echograms from the ROV-based forward-looking sonar showing anomalies from bubble streams at Site 2 and Site 3. The signal at Site 2 is composed of several (in total ∼17) hydro-acoustic anomalies representing bubble streams, of which one bubble stream was quantified (white circle). At Site 3, three major hydro-acoustic anomalies were recorded. Two bubble streams generating anomaly 3C were quantified, corresponding to about one-third of the total bubble flow in this area.
Oil Emission Investigations
Oil bubble emissions from the seafloor were expected owing to the presence of an oil slick at the sea surface during the time of the two ROV dives. Because the impedance contrast between oil and water is insufficient, hydro-acoustic techniques are not useful for detecting oil emissions. However, visual observations during ROV dives confirmed the presence of oil bubble emissions from two seafloor sites (Sites 1 and 2, Figure 5). Site 2 is located in the surrounding of a whitish-colored gas hydrate outcrop dominated by an abundance of gas bubble emissions (see section “Gas Emission Investigations”). In addition, we observed a single stream of solitary oil bubbles in the Site 2 area. Some up-rising oil bubbles stacked on the almost vertical wall composed of gas hydrate, creating a brownish-stained vertical fabric of gas hydrates. As this site was difficult to reach with the ROV, more detailed oil emission observations and sampling were performed at Site 1, which appeared to emit oil bubbles with similar frequencies. However, in contrast to Site 2, at Site 1 (located at a partly collapsed mound structure) oil emissions exclusively occurred, while gas bubble emissions were virtually absent. Dark brown colored and oblate disk-like shaped oil bubbles rose from the surface of the collapsed part and from a site close to the summit of the intact side. Their shape resulted in a zigzag-trajectory during their rise in the water column, and in combination with the low buoyancy of oil (compared to that of gas) this resulted in relatively lower average rising speed of 11.7 cm/s (SD = 1.7, n = 56). Oil bubbles rising through the tangled tubeworm stems into the water column (Figure 5 and Table 2) showed an average radius re of 5.0 mm (n = 56) corresponding to an average volume of 0.52 mL (SD = 0.18) per oil bubble. During 23 min of observation time for oil bubble counting, the oil bubble emission frequency was 1 b/s, which resulted in an oil volume flow of 31.7 mL/min (± 3.8).
Sea Surface Oil Slicks
An oil slick covered the sea surface above TYK during the hydro-acoustic surveys, the AUV dive, and both ROV deployments conducted during M114. The slick became visible by eye as elongated, bright patches of sun-glint on the sea surface (Figure 8A). Numerous oil bubbles were seen bursting in a localized area of the slick (Figure 8B). Therefore, this area was defined as the oil slick origin. The oil slick origin was estimated to measure about 75 m in diameter, at a location about 500 m southeast of the main seep field on the seafloor. Oil bubbles spread radially at the surface and caused rainbow-like refraction patterns (Figure 8C). Bubbles, that were assumed to mainly contain gas from their disintegration behavior, did not produce oil films at the surface, indicating effective separation of the gas and oil phases either in the subsurface or during passage through the water column. However, gas bubbles were observed to burst through the oil films (Figure 8D).
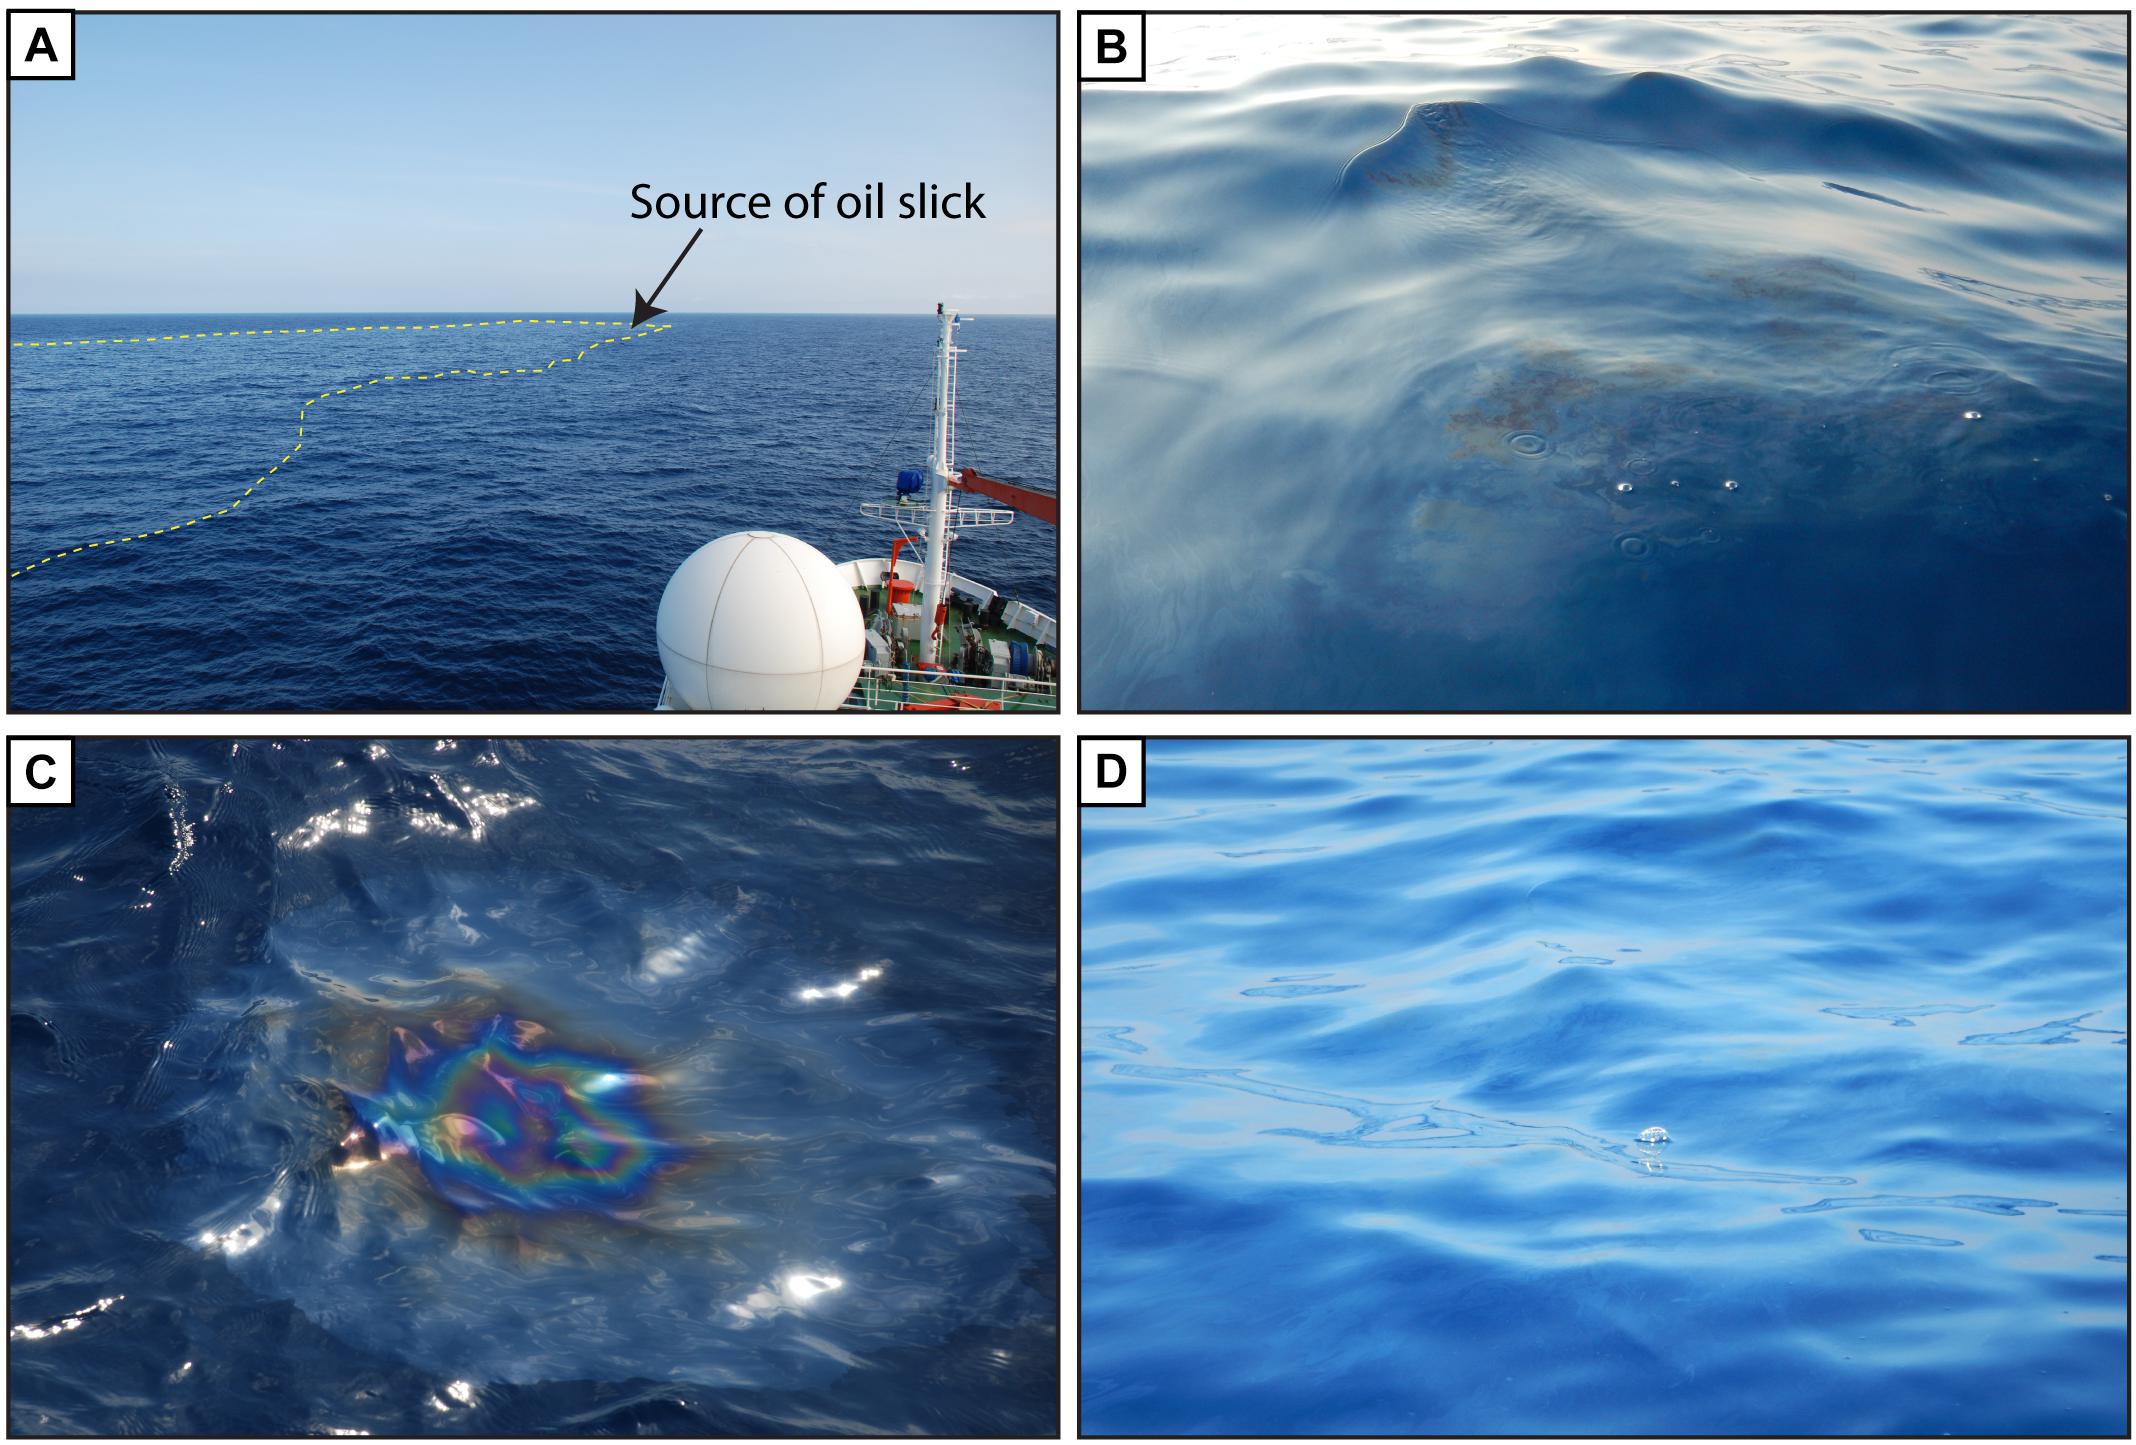
Figure 8. Sea surface pictures taken from the vessel during METEOR cruise M114 in March 2015. (A) An oil slick was visible due to the smoothing of the sea surface. (B) Oil and gas bubbles were observed at that location and interpreted to define the area where hydrocarbons reach the sea-air interface. (C) Photograph taken shortly after an oil bubble reached the sea surface and oil spreads in a circular pattern. (D) A gas bubble reaching the sea surface shortly before bursting and releasing its gas content into the atmosphere.
Discussion
Amounts of Hydrocarbons Released at TYK
This study presents the first quantification of individual gas and oil seeps in the southern GOM. Comprehensive investigations at four seafloor gas emission sites revealed that between 32 and 462 mL/min gas were emitted at individual sites and that the total gas volume emission rate determined for all four sites was about 658 mL/min (or 10 mol CH4/min). Oil emissions were detected at Sites 1 and 2 (Figure 5). Volume rates calculated for oil bubbles released at Site 1 and assuming the bubbles to consist of pure oil were 32 mL/min, which corresponds to 1.7 × 10⁴ L/yr, assuming a constant oil emission. Oil emissions at Site 2 were not quantified and we cannot rule out that additional oil bubble streams occur at TYK. Seafloor asphalt deposits, which were found at other knoll structures in the southern GOM (Sahling et al., 2016), remained undiscovered at TYK. Sahling et al. (2016) speculated that TYK, which is classified as a flat-topped knoll and represents a passive-type salt diapir structure (Ding et al., 2010), may not host such a shallow hydrocarbon reservoir that is typical for the knolls and ridges that feature asphalt deposits, but might be located deeper in the subsurface. Alternatively, the apparent absence of asphalts might also result from incomplete survey coverage.
Notably at TYK, the surfaces of hydrate mounds formed by methane emissions were massively colonized by vestimentiferan tubeworms. This has not, to our knowledge, been previously reported from shallower sites in the Gulf of Mexico, where hydrate mounds have been shown to wax and wane over timescales of about 1 year (MacDonald et al., 1994). The dense blanket of adult and juvenile worms, as well as associated fauna and detrital material serves to insulate the hydrate surface from exposure to seawater and reducing dissolution rates (Lapham et al., 2014). This may promote the growth of hydrate mounds and would also influence the release of bubbles from such features.
In order to estimate total gas bubble volume outputs from the entire TYK, we jointly considered results from our ROV-based gas quantifications at individual emission sites and those obtained by ship-based hydro-acoustic flare and ROV-based sonar analysis (Table 2). At Site 2, ship-based multibeam echosounder data suggested the presence of three flares. Surveying with the ROV-based forward-looking sonar in the same area documented the presence of 17 hydro-acoustic anomalies that represented individual gas bubble streams, one of which was quantified (2-1, Table 2). Assuming that gas emission rates at all 17 bubble emission sites were equal, a total volume output of 7.7 L/min is calculated for Site 2. At Site 3, two gas bubble streams, 3-1 and 3-2, were quantified. As these bubble streams were located close to each other, they could not be resolved in the ROV-based echograms (3C in Figure 7). In addition, two other anomalies were documented with the forward-looking sonar (3A and 3B in Figure 7). In the AUV-based multibeam echosounder data, all the three gas bubble streams appeared as single flare. The summed volume emission rate determined for the two bubble streams was accordingly multiplied by three, resulting in an estimated minimum gas emission rate of ∼0.5 L/min for the gas bubble streams that formed the flare. A single gas bubble stream was found to cause the flare detected at Site 4, and its volume emission rate was estimated at 32 mL/min. In order to estimate the total amount of gas released at the 32 flares detected at TYK, we calculated the results for the 5 individual flares quantified at Sites 2, 3, and 4 and applied minimum and maximum estimates for the additional 27 flares for which bubble release rates could not be determined (Table 2). By assuming the minimum volume of gas released to form a gas bubble stream and represented by a single flare as calculated at Site 4 (32 mL/min) is representative for all 27 additional flares and added the actually known release of the 5 flares at Sites 2, 3, and 4, the total gas volume emission rate estimated for TYK is in the order of 9 L/min. Considering the maximum flow calculated at one flare (2.6 L/min for one flare at Site 2) for these calculations, the resulting gas volume emission rate is 78 L/min. Assuming a constant gas volume release over time, a total of 4.9 × 10⁶ to 4.2 × 10⁷ L/yr of gas would be emitted from TYK into the hydrosphere. Converted to molar output these gas volume emission rates would account for a methane release ranging between 138 and 1178 mol CH4/min or 7.3 × 10⁷ and 6.2 × 10⁸ mol CH4/yr.
In the northern GOM, gas seeping from the seafloor quantified by use of video time-lapse cameras (Johansen et al., 2017) and stereoscopic high-speed cameras (Wang et al., 2016) revealed gas bubble volume rates similar to those determined for the TYK in this study. Estimated gas bubble volume flows at four emission sites in the northern GOM ranged between 13 and 300 mL/min (Wang et al., 2016). Johansen et al. (2017) analyzed five emission sites (partly reassessing the sites described by Wang et al., 2016) and estimated flows ranging between 5 and 358 mL/min.
The gas volume emission rates calculated above indicate that TYK is an important source of methane to the hydrosphere, as its mass output is on the upper limit of other natural seep environments quantified worldwide. For example, Hydrate Ridge was found to emit 2.2 × 10⁷ mol CH4/yr (Torres et al., 2002), the Haakon Mosby mud volcano ∼1.9 × 10⁷ mol CH4/yr (Sauter et al., 2006) or the Dutch Dogger Bank seep area 1.7–3.7 × 10⁷ mol CH4/yr (Römer et al., 2017). Anthropogenic disasters such as the Deepwater Horizon blowout released oil as well as up to 1 × 10¹⁰ moles of methane within 83 days (Kessler et al., 2011) and the UK22/4b blowout in the North Sea still releases 5400 L/min (or 2 × 10⁹ mol/yr), even though the accident happened already 20 years before this estimation in 1990 (Leifer and Judd, 2015). Both examples illustrate that anthropogenic methane releases can cause a much more extensive methane–carbon injection to the hydrosphere than most natural systems. To our knowledge, only one seep area, the Coal Oil Seep field offshore California, is assumed to emit methane amounts in similar quantities. Hornafius et al. (1999) estimated volume emission rates of about 1.2 × 10⁵ L/min (or 1.8 × 10⁹ mol/yr) for discharged methane and 11 L/min for the associated oil emission. However, all aforementioned sites are located in shallower waters compared to TYK. Due to the hydrostatic pressure that gas needs to overcome to migrate upwards in the sediment column, we assume that pore pressure affecting fluids in the subsurface of TYK should be comparably high. Moreover, it is likely that most human-induced hydrocarbon releases persist for up to several decades at maximum, while natural seepage sites are more persistent through time.
Although in this study we presented estimates of amounts of gas released on an annual basis, data are insufficient to document continuous seepage. Analyses were made during short time periods in the frame of a research cruise and, therefore, represent snapshots of seep activity. However, gas bubble emissions are known to vary over time periods from minutes and months up to decades (Tryon et al., 1999; Boles et al., 2001; Kannberg et al., 2013; Römer et al., 2016), increasing the error of estimates from non-recurring observations. Methane fluxes can be influenced by microbial methane production rates in subsurface sediments or changes in bottom pressure (Fechner-Levy and Hemond, 1996; Leifer and Boles, 2005; Scandella et al., 2011). Tidal variations in bottom pressure were proven to be an important factor triggering gas emission activities offshore Vancouver Island (Römer et al., 2016), but bottom water currents, storm events, and swell might also influence variations in seepage activity. Furthermore, a correlation of fluid emissions with earthquakes has been postulated in several studies (Kessler et al., 2005; Mau et al., 2007; Lapham et al., 2008; Fischer et al., 2013). However, information on variabilities in gas bubble release at TYK is lacking, as flare surveys remained unrepeated, and ROV-based observations at individual emission sites were limited in time.
Fate of Hydrocarbons in the Water Column
Methane Bubbles
In this study we used ship-based hydro-acoustic methods, similar to those used in previous approaches (e.g., Schneider von Deimling et al., 2007) to follow gas bubbles during their rise through the water column. Flares recorded above TYK in this study (Figure 4) were fueled from a site in 3400 mbsl and are, to the best of our knowledge, the deepest-sourced flares reported so far. Nevertheless, flares fueled by gas emissions from the deep sea seafloor (>2000 mbsl) have previously been reported from the Makran Accretionary Wedge at ∼2900 mbsl with flare heights exceeding 2000 m (Römer et al., 2012) and from the Vodyanitskii mud volcano at ∼2000 mbsl in the Black Sea with a 1300 m high flare (Greinert et al., 2006). Similar to these studies, the flares at TYK could be traced up to about 500 mbsl, but remained undiscernible in the echogram of shallow waters either due to enhanced hydro-acoustic noise (likely caused by plankton; Figure 4), bubble dissolution, and/or deflection out of the echosounder view. In contrast, we observed bubbles popping up at the sea surface in the area of the oil slick occurrence, documenting that at least a fraction of the bubbles released at the seafloor were transported through the 3400 m high water column, although it was not possible to quantify the amount of methane remaining in bursting bubbles. Close to the seafloor, we additionally observed gas hydrate-formation around bubbles when released into the water column. Because of its whitish color, we assume that hydrates were relatively pure, whereas oil impregnations were negligible. Generally, gas bubbles shrink in the course of ascent through the water column due to gas exchange, since methane and other light hydrocarbons dissolve in undersaturated waters (Leifer and Judd, 2002). Bubble coatings (e.g., by oil or gas hydrate) are believed to hinder gas exchange and, hence, to result in extended bubble lifetimes (Rehder et al., 2002; Leifer and MacDonald, 2003). In order to verify if such extended lifetime would be possible in theory for bubbles discharged from TYK, we applied the single bubble dissolution module of the Texas A&M Oil spill Calculator (TAMOC; Dissanayake et al., 2018). This model considers gas hydrate formation, includes detailed equations of state for hydrocarbons (Gros et al., 2016), and has been applied to hindcast the fate of oil and gas released from the Deepwater Horizon accident (Gros et al., 2017). Information on the model functionality, input parameters and modeling results are given in the Supplementary Material. Sizes and molecular compositions of single bubbles during their rise from an emission site at 3400 mbsl were modeled using the measured initial composition of gas forming bubbles when released from the seafloor at TYK. The potential gas bubble rising heights retrieved from the model generally confirm observations made during M114. Bubbles with average sizes determined at bubble streams 2-1, 3-1, and 4-1 (re = 2.6 mm, 2.1 mm, and 3.3 mm, respectively) would travel through the entire water column and reach the sea-air interface, supporting the observations of bubbles popping up at the sea surface (Figures 8B,D). In contrast, bubbles with the smallest size measured at bubble stream 3-2 would be entirely dissolved after a rise through the water column of 200 m only (i.e., at 3200 mbsl). The model also confirms that most of the methane in the bubbles dissolved into the water column in the first 100 m of their ascent. Those bubbles that reach the sea surface do contain a maximum of 0.12% of their initial methane content. Interestingly, C2 to C6 components remain much longer in the bubbles and although in much smaller amounts initially released, bubbles reaching the sea surface contain larger amounts of C2 to C6 components than methane.
Oil Bubbles
In addition to the gas bubble emissions, seafloor discharge of oil bubbles and oil slicks at the sea surface were observed at the TYK. Hydro-acoustic methods, however, are inappropriate to distinguish between oil-coated gas bubbles from pure gas bubbles and pure oil drops were not recognized due to the low impedance contrast between pure oil drops and water. Therefore, the pathways of oil drops and oil-coated bubbles during their rise through the water column remained unresolved.
From ROV-based visual observations it appeared that oil bubbles differed in their color from light to dark brown, which we interpret to be related to the fraction of gas contained in the bubbles. At Site 1 the rising speed of oil bubbles with a radius re of ∼5 mm was relatively slow with about 11.7 cm/s. The lower buoyancy of oil related to that of gas resulted in comparably lower rising speeds. The rising speed measured suggest that these bubbles probably do only contain little or no gas phase (Clift et al., 1978). Oil bubbles containing a gas fraction are probably more favorable to rise higher up into the water column and potentially reach the sea surface, whereas pure oil drops (i.e., lacking a gas phase) might remain within the water column as they may not be sufficiently buoyant without gas as a carrier. During M114, oil slicks were observed at the sea surface above TYK (Figure 8), indicating that oil drops or oil-coated bubbles traveled through the 3400 m-high water column. SAR images taken between 2003 and 2011 demonstrated that extent sea surface oil slicks are fueled by oil emissions from the seafloor at TYK. In order to calculate the minimum volume of slick-forming oil, it is assumed that slicks have uniform thicknesses of 0.1 μm, which corresponds to the minimum thickness of an oil layer detectable with SAR sensors (Garcia-Pineda et al., 2009). At TYK the surface areas and oil volumes of the oil slicks ranged from 15 to 132 km2 (n = 20) and from 1500 to 13,200 L, respectively (Suresh, 2015).
Oil volume emission rates required to establish the detected oil slicks were calculated by considering the drift velocities of oil (3% of the prevailing wind speeds; Espedal, 1999) and minimum wind speeds required for detection of oil slicks by SAR imaging (about 3 m/s; Brekke and Solberg, 2005). Hence, the resulting minimum drift velocity was 0.09 m/s. The time required for the slick to reach its detected extent was estimated by Suresh (2015) and yielded a minimum volume output of 73 L/h oil fueling the oil slicks at TYK. These oil volume output estimates for the TYK are significantly higher than minimum oil seepage rates estimated for two mound structures in the eastern Black Sea (Pechori Mound: 13 L/h; Colkheti Seep: 28 L/h; Körber et al., 2014). The estimated volume outputs at the TYK would account for 1.5–2.6% of oil flows estimated for the entire GOM (2.53 × 10⁷ to 9.48 × 10⁷ L/yr; MacDonald et al., 2015).
Quantification of oil bubble volume output near the seafloor during the ROV dive in this study, resulted in about 1.9 (± 0.2) L/h at Site 1. Even this minimum estimate would require an almost 40 times higher oil volume output to form the oil slick at the sea surface (73 L/h). In addition, oil containing light hydrocarbons released at the seafloor undergoes a volume reduction during the rise to the sea surface. This effect has been described and quantified to be in the order of several 10s of percents by Gros et al. (2016) for the release after the Deepwater Horizon accident. Analyses of SAR images indicated that oil slick presence and extent and, thus, oil seepage is variable over time (MacDonald et al., 2015). Therefore, additional seafloor mapping is needed to verify whether further oil emission sites are present at TYK that have been either inactive at the time of our investigations or remained undiscovered due to methodological limitations. Nevertheless, this study shows that the combination of two approaches, i.e., (a) quantifying individual oil bubbles and extrapolating (bottom–up) and (b) estimating the oil slick extent (top–down) to calculate the oil flow into the hydrosphere, provide an efficient approach to quantitatively assess hydrocarbon seepage.
Dissolved Methane
Dissolved methane was enriched in the lowermost 100 m of the water column due to gas emissions (Figure 6). However, methane in significant concentrations might also prevail in oil-coated bubbles up to the sea surface. The steep decrease of CH4 concentrations from 30,000 nmol/L at 0.5 m above seafloor to 5 nmol/L at 72 m above seafloor illustrates the rapid dissolution of CH4 from bubbles and its dispersion in the ocean, as similarity reported for a seep field in the South China Sea (Di et al., 2019). Detection of an additional methane concentration peak with much lower concentrations (13 nmol/L) at 2300 mbsl (∼1100 m above the seep sites) might result from sampling of water closer to the gas bubble stream ascending through the water column than for the samples above and below. An increase of methane concentration in this water depth is not substantiated by our simulations using the TAMOC model (see electronic supplement). Sea surface waters within the area where gas and oil bubbles reached the sea-air interface contained 3–5 nmol/L CH4. These concentrations are slightly higher than concentration of dissolved methane in atmospheric equilibrium (2.2 nM). Oil-coated bubbles could have carried this methane through the entire water column as was suggested by Hu et al. (2012) for hydrocarbon seeps in < 900 m water depth in the northern GOM, but remains unproven for the > 3000 m water column above TYK seep sites.
Comprehensive Picture of the Hydrocarbon Seepage System
The scheme shown in Figure 9 summarizes our results of seafloor hydrocarbon emissions at TYK and its residual hydrocarbons after having risen 3400 m through the water column. Figure 9A combines the bathymetric grid of TYK, flares extracted from the ship-based multibeam echosounder records, and the extents of two oil slicks detected in SAR images in 2004 and 2011 (Suresh, 2015). Figure 9B illustrates pathways and amounts of carbon transported through oil and methane-rich gas bubbles. Both, gas and oil are discharged in large amounts from the top of the knoll structure. Whereas only two sites of oil emissions were observed at the seafloor, numerous gas emission sites were found, which were spatially concentrated in three depressions. The calculated carbon flow through emissions of methane-rich gas bubbles into the water column ranged between 100 and 900 kg/h. In contrast to oil bubbles that can travel through the entire water column to the sea surface, methane from the gas bubbles dissolves nearly entirely in the seawater. Nevertheless, the emission site at TYK is extraordinary in two aspects: the relatively great water depth at which the bubble emission sites are located and the fact that these bubbles appeared in the echogram up to ∼500 mbsl, where the echogram becomes too noisy to distinguish gas from plankton. This means that gas bubbles emitted at TYK travel at least 2900 m through the water column, representing one of the highest flares observed so far. Oil traversing the same water depth reached the sea surface and formed slicks visible in SAR images. Taking the volume of individual oil slicks in SAR images into account (Suresh, 2015), the amount of carbon transported to the sea-air interface via oil bubbles accounted for 1300–11,600 kg. Evaluation of satellite images revealed that the minimum carbon output through oil emissions to the sea surface was about 53 kg/h (Suresh, 2015). Because this mass is far higher than that calculated for the oil bubbles escaping the seafloor, it is likely that further oil emission sites exist at TYK that remained undetected during this study. Although very high concentrations of dissolved methane (>30,000 nmol/L) were measured in waters closely above the seafloor emission site, hardly any anomaly was detected in surface waters sampled at the termination point of the oil slick.
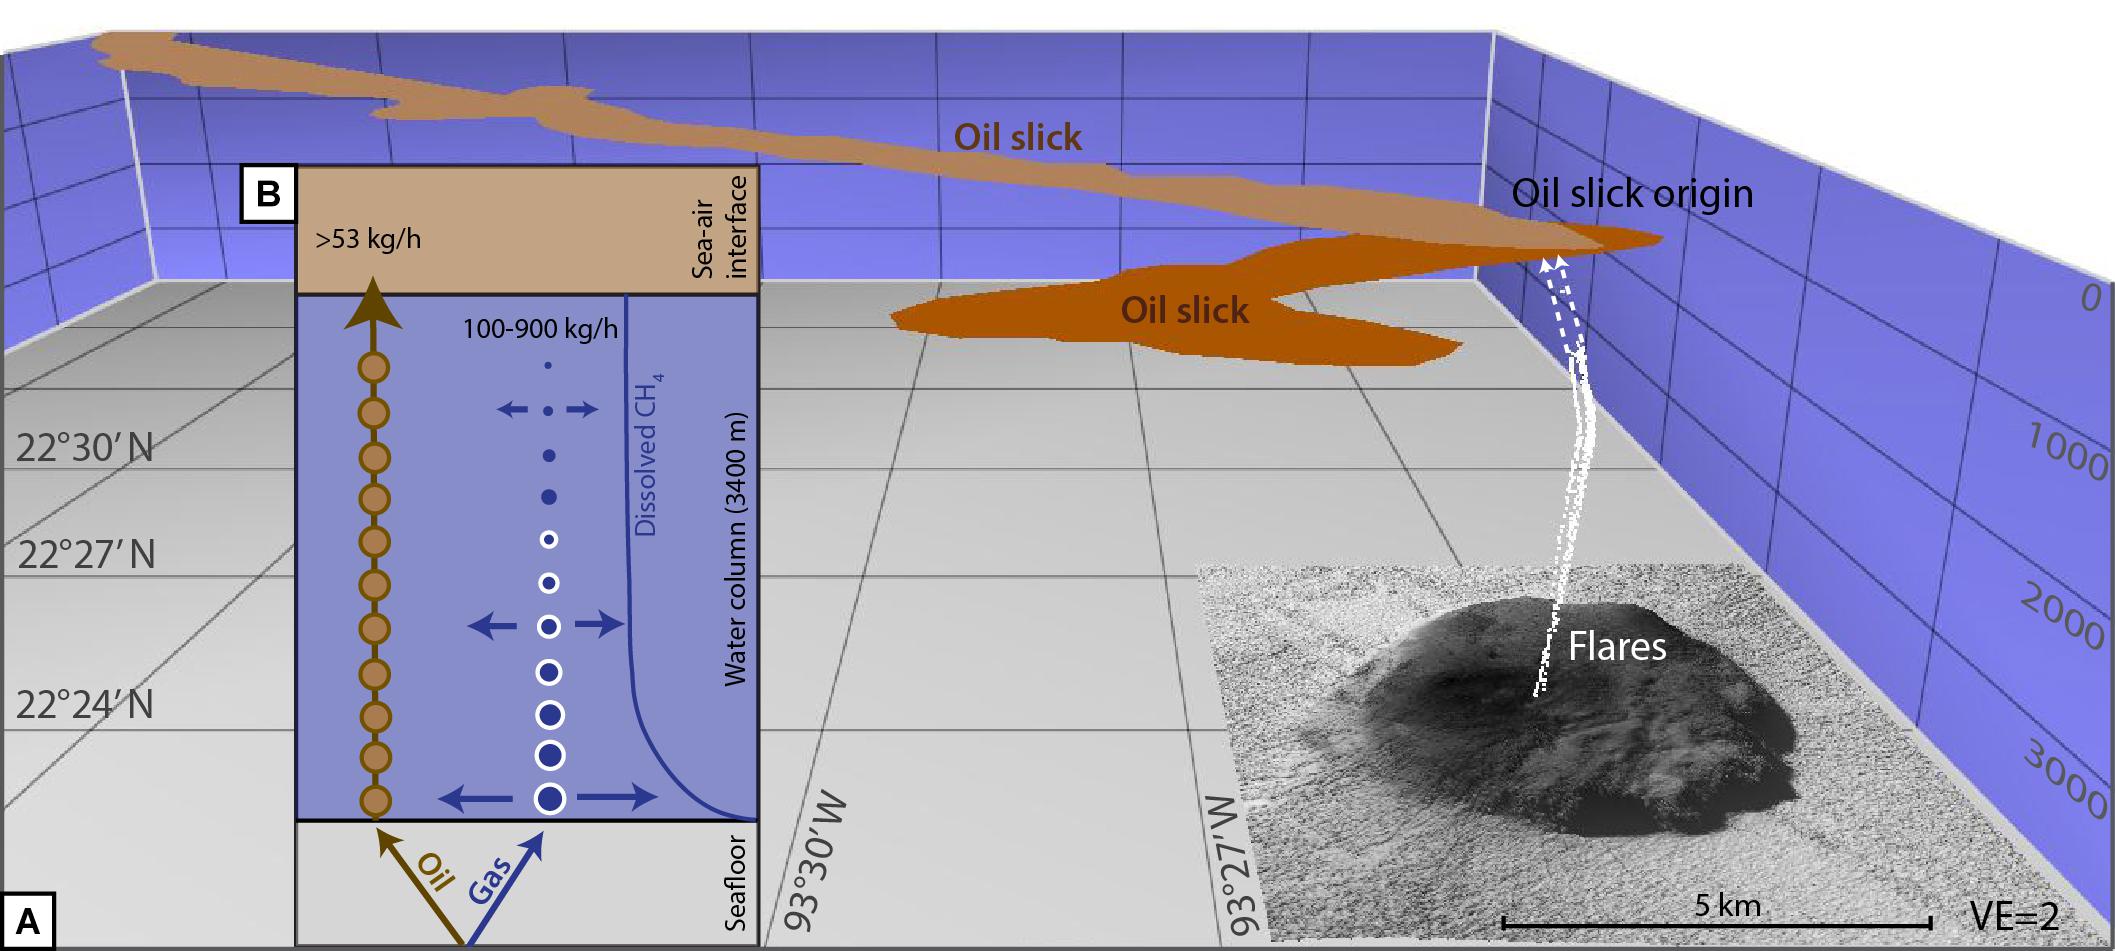
Figure 9. Composite illustration of the hydrocarbon seep system investigated at Tsanyao Yang Knoll. (A) During M114, flares about 3000 m in height originated from the main seep field on top of the knoll up to the sea surface (white dots are extracted water column anomalies, white dotted line is projected path of bubbles in the upper 500 m), where oil and gas bubbles were observed. In 2011 oil emissions fueled extent oil slicks at the sea surface (Suresh, 2015). (B) Quantification revealed that only a minor fraction of the oil volume required to generate an oil slick of such an extent did originate from the oil bubble emission site that was discovered at the seafloor during an ROV dive in 2015. In contrast, gas bubbles released from the seafloor contain mainly methane that is rapidly dissolved during bubble rise through the water column. Therefore, most of the carbon released through methane bubbles remained in the lowermost water column and did not reach the sea-air interface.
Conclusion
In this study, gas and oil emissions from the seafloor at the TYK in the southern Gulf of Mexico were comprehensively analyzed. Gas hydrate mounds hosted massive chemosynthetic communities, which may have promoted growth and stability of the mounds. Annual volume output calculated for discharged gas bubbles ranged between 4.8 × 10⁶ and 4.1 × 10⁷ L/yr (corresponding to 7.3 × 10⁷ and 6.2 × 10⁸ mol CH4/yr). In comparison, volume flows calculated for oil bubble emissions were significantly lower (1.7 × 10⁴ L/yr). Ex situ concentrations of dissolved methane were highly elevated with > 30,000 nmol/L very close to the seafloor at the emission sites. However, water column methane concentration decreased rapidly to background concentrations within the lowermost 100 m. At the sea surface concentrations of dissolved methane are only slightly higher to those at atmospheric equilibrium although positioned in an area where gas and oil bubbles surfaced. Estimated volumes of sea surface oil slicks fueled by seafloor emissions illustrate that much more oil than quantified during our ROV-based observations is likely emitted from the seafloor at TYK. Future investigations are needed to locate additional seafloor oil emission site that are likely present and to verify the amount of oil emitted at the seafloor.
This study presents flow estimates for hydrocarbons released at an individual knoll in the southern GOM. However, numerous knoll and ridge structures in addition to the TYK are known from the Campeche and Sigsbee Knolls area in the central and southern GOM, and several of them have been shown to emit gas and oil. TYK was found to represent an example with comparably high abundance of gas and oil emissions and is a rather extensively emitting structure. Therefore, TYK should not be regarded as an average representative illustrating the seepage intensity of all knolls in that area, and flow calculations presented in this study should be considered carefully when extrapolating to other seep sites situated at these knolls. Nevertheless, it allows gaining insight into a natural seep system in the GOM and reveals valuable data to compare with other hydrocarbon seeps in the GOM, worldwide and anthropogenic caused releases. Our study provides insight on processes and fate of gas leaking from a natural system and provides a baseline for the evaluation of disastrous events such as the Deepwater Horizon accident or long-time leakage of abandoned wells. Furthermore, it adds to the list of flow calculations allowing to determine the ranges of natural seep systems including both, methane and oil emissions from the deep seafloor into the water column.
Data Availability Statement
The datasets analyzed for this study can be found in the Open Access library PANGAEA (https://www. pangaea.de/). Data associated with this article: https://doi.pangaea.de/10.1594/PANGAEA.864677, https://doi. pangaea.de/10.1594/PANGAEA.864652, https://doi.pangaea.de/10.1594/PANGAEA.864271, https://doi.pangaea.de/10.1594/PANGAEA.860371.
Author Contributions
HS and GB provided the funding acquisition as well as cruise preparation and management for R/V Meteor cruise M114 and post-cruise processing. MR, C-WH, CS, ML, SM, and IM carried out the on board data collection. CS took care about the hydroacoustic data curation and archiving. TP conducted the post-cruise gas analysis. SM, C-WH, ML, IM, and TP contributed to the interpretation of the results. MR took the lead in writing the manuscript. All authors helped to shape the research, analysis, and manuscript.
Funding
Cruise M114 was funded by the German Research Foundation (DFG - Deutsche Forschungsgemeinschaft) through the cruise proposal “Hydrocarbons in the southern Gulf of Mexico.” IM acknowledges support from the Gulf of Mexico Research Initiative ECOGIG 2 consortium for participation in the M114 cruise.
Conflict of Interest
The authors declare that the research was conducted in the absence of any commercial or financial relationships that could be construed as a potential conflict of interest.
Acknowledgments
We greatly appreciate the shipboard support from the master and crew of the research vessel METEOR during cruise M114 as well as the professional assistance of the scientific and technical operating teams of the ROV ‘MARUM Quest 4000m’ and AUV ‘MARUM Seal.’ Further, we thank the Mexican authorities for granting permission to conduct research in Mexican national waters (permission of DGOPA: 02540/14 from 5 November 2014). Additional thanks go to Gopika Suresh (MARUM) for providing oil slick information of the study area. We are especially thankful for the possibility to use the TAMOC model and the professional support provided by Scott A. Socolofsky, Jonas Gros, and Anusha Dissanayake. Furthermore, we thank Monika Wiebe and Sven Klüber for acquiring and processing sediment temperature data during the cruise as well as Patrizia Geprägs and Stefanie Buchheister (all MARUM) for water sampling and on-board methane concentration measurements. Finally, we want to thank the editor for handling the submissions and the two reviewers, JG and DC, providing very constructive comments that strongly improved our manuscript.
Supplementary Material
The Supplementary Material for this article can be found online at: https://www.frontiersin.org/articles/10.3389/fmars.2019.00700/full#supplementary-material
Input parameter and results from the single bubble dissolution module of the Texas A&M Oil spill Calculator (TAMOC).
TABLE S1 | Ambient profile acquired during a CTD hydrocast at TYK (GeoB19309-1).
TABLE S2 | Input parameter and model results for bubble size distribution measured at bubble stream 2–1 at Site 2.
TABLE S3 | Input parameter and model results for bubble size distribution measured at bubble stream 3–1 at Site 3.
TABLE S4 | Input parameter and model results for bubble size distribution measured at bubble stream 3–2 at Site 3.
TABLE S5 | Input parameter and model results for bubble size distribution measured at bubble stream 4–1 at Site 4.
Footnotes
References
Artemov, Y. G., Egorov, V. N., Polikarpov, G. G., and Gulin, S. B. (2007). Methane emission to the hydro-and atmosphere by gas bubble streams in the dnieper paleo-delta, the black Sea Marine. Ecol. J. 6, 5–26.
Boles, J. R., Clark, J. F., Leifer, I., and Washburn, L. (2001). Temporal variation in natural methane seep rate due to tides, coal oil point area, California. J. Geophys. Res. 106, 27077–27086. doi: 10.1029/2000jc000774
Brekke, C., and Solberg, A. H. S. (2005). Oil spill detection by satellite remote sensing. Remote Sens. Environ. 95, 1–13. doi: 10.1016/j.rse.2004.11.015
Brüning, M., Sahling, H., MacDonald, I. R., Ding, F., and Bohrmann, G. (2010). Origin, distribution, and alteration of asphalts at chapopote knoll, Southern Gulf of Mexico. Mar. Pet. Geol. 27, 1093–1106. doi: 10.1016/j.marpetgeo.2009.09.005
Bryant, R. B., Lugo, J., Cordova, C., and Salvador, A. (1991). “Physiography and bathymetry,” in The Geology of North America, the Gulf of Mexico Basin, ed. A. Salvador, (Boulder, Co: Geological Society of America), 13–30. doi: 10.1130/dnag-gna-j.13
Caress, D. W., and Chayes, D. N. (1996). Improved processing of hydrosweep DS multibeam data on the R/V Maurice Ewing. Mar. Geophys. Res. 18, 631–650. doi: 10.1007/bf00313878
Clift, R., Grace, J. R., and Weber, M. E. (1978). Bubbles, Drops, and Particles. New York, NY: Academic Press.
Di, P., Feng, D., and Chen, D. (2019). The distribution of dissolved methane and its air-sea flux in the plume of a seep field, Lingtou promotory, South China Sea. Geofluids 2019:3240697. doi: 10.11552019/3240697
Ding, F., Spiess, V., Brüning, M., Fekete, N., Keil, H., and Bohrmann, G. (2008). A conceptual model for hydrocarbon accumulation and seepage processors around chapopote asphalt site, southern Gulf of Mexico: from high resolution seismic point of view. J. Geophys. Res. 113:B08404.
Ding, F., Spiess, V., MacDonald, I. R., Brüning, M., Fekete, N., and Bohrmann, G. (2010). Shallow sediment deformation styles in north-west campeche knolls, gulf of Mexico and their controls on the occurrence of hydrocarbon seepage. Mar. Pet. Geol. 27, 959–972. doi: 10.1016/j.marpetgeo.2010.01.014
Dissanayake, A. L., Gros, J., and Socolofsky, S. A. (2018). Integral models for bubble, droplet, and multiphase plume dynamics in stratification and crossflow. Environ. Fluid Mech. 18, 1167–1202. doi: 10.1007/s10652-018-9591-y
Espedal, H. A. (1999). Satellite SAR oil spill detection using wind history information. Int. J. of Remote Sens. 20, 49–65. doi: 10.1080/014311699213596
Fechner-Levy, E. J., and Hemond, H. F. (1996). Trapped methane volume and potential effects on methane ebullition in a northern peatland. Limnol. Oceanogr. 41, 1375–1383. doi: 10.4319/lo.1996.41.7.1375
Fischer, D., Mogollon, J. M., Strasser, M., Pape, T., Bohrmann, G., Fekete, N., et al. (2013). Subduction zone earthquake as potential trigger of submarine hydrocarbon seepage. Nat. Geosci. 6, 647–651. doi: 10.1038/ngeo1886
Garcia-Pineda, O., MacDonald, I., Zimmer, B., Shedd, B., and Roberts, H. (2010). Remote-sensing evaluation of geophysical anomaly sites in the outer continental slope, northern Gulf of Mexico. Deep Sea Res. Part Ii-Topical Stud. Oceanogr. 57, 1859–1869. doi: 10.1016/j.dsr2.2010.05.005
Garcia-Pineda, O., Zimmer, B., Howard, M., Pichel, W., Li, X. F., and MacDonald, I. R. (2009). Using SAR images to delineate ocean oil slicks with a texture-classifying neural network algorithm (TCNNA). Can. J. Remote Sens. 35, 411–421. doi: 10.1016/j.marpolbul.2010.10.005
Geprägs, P. (2016). Methane Environment Around Cold Seeps – Examples From Antarctica and the Mediterranean. Ph.D.Thesis, Staats- und Universitätsbibliothek Bremen, Germany.
Greinert, J., Artemov, Y., Egorov, V., De Batist, M., and McGinnis, D. (2006). 1300-m-high rising bubbles from mud volcanoes at 2080m in the Black Sea: hydroacoustic characteristics and temporal variability. Earth Planet. Sci. Lett. 244, 1–15. doi: 10.1016/j.epsl.2006.02.011
Gros, J., Reddy, C. M., Nelson, R. K., Socolofsky, S. A., and Arey, J. S. (2016). Simulating gas-liquid-water partitioning and fluid properties of petroleum under pressure: implications for deep-sea blowouts. Environ. Sci. Technol. 50, 7397–7408. doi: 10.1021/acs.est.5b04617
Gros, J., Socolofsky, S. A., Dissanayake, A. L., Jun, I., Zhao, L., Boufadel, M. C., et al. (2017). Petroleum dynamics in the sea and influence of subsea dispersant injection during Deepwater Horizon. Proc. Natl. Acad. Sci. U.S.A. 114, 10065–10070. doi: 10.1073/pnas.1612518114
Heeschen, K., Tréhu, A., Collier, R. W., Suess, E., and Rehder, G. (2003). Distribution and height of methane bubble plumes on the Cascadia Margin characterized by acoustic imaging. Geophys. Res. Lett. 30:1643.
Heeschen, K. U., Collier, R. W., de Angelis, M. A., Suess, E., Rehder, G., Linke, P., et al. (2005). Methane sources, distributions, and fluxes from cold vent sites at Hydrate Ridge, Cascadia Margin. Global. Biogeochem. Cycles 19:GB2016.
Hornafius, J. S., Quigley, D., and Luyendyk, B. P. (1999). The world’s most spectacular marine hydrocarbon seeps (Coal Oil Point, Santa Barbara Channel, California)- quantification of emissions. J. Geophys. Res. 104, 20703–20711. doi: 10.1029/1999jc900148
Hu, L., Yvon-Lewis, S. A., Kessler, J. D., and MacDonald, I. R. (2012). Methane fluxes to the atmosphere from deepwater hydrocarbon seeps in the northern Gulf of Mexico. J. Geophys. Res. 117:C01009.
Johansen, C., Todd, A. C., and MacDonald, I. R. (2017). Time series video analysis of bubble release processes at natural hydrocarbon seeps in the Northern Gulf of Mexico. Mar. Pet. Geol. 82, 21–34. doi: 10.1016/j.marpetgeo.2017.01.014
Kannberg, P. K., Tréhu, A. M., Pierce, S. D., Paull, C. K., and Caress, D. W. (2013). Temporal variation of methane flares in the ocean above Hydrate Ridge. Oregon. Earth Planet. Sci. Lett. 368, 33–42. doi: 10.1016/j.epsl.2013.02.030
Kessler, J. D., Reeburgh, W. S., Southon, J., and Varela, R. (2005). Fossil methane source dominates Cariaco Basin water column methane geochemistry. Geophys. Res. Lett. 32:L12609.
Kessler, J. D., Valentine, D. L., Redmond, M. C., Du, M., Chan, E. W., Mendes, S. D., et al. (2011). A persistent oxygen anomaly reveals the fate of spilled methane in the deep Gulf of Mexico. Science 331, 312–315. doi: 10.1126/science.1199697
Körber, J.-H., Sahling, H., Pape, T., dos Santos Ferreira, C., MacDonald, I., and Bohrmann, G. (2014). Natural oil seepage at Kobuleti Ridge, eastern Black Sea. Mar. Pet. Geol. 50, 68–82. doi: 10.1016/j.marpetgeo.2013.11.007
Kvenvolden, K. A., and Cooper, K. M. (2003). Natural seepage of crude oil into the marine environment. Geo Mar. Lett. 23, 140–146. doi: 10.1007/s00367-003-0135-0
Lapham, L. L., Chanton, J. P., Martens, C. S., Higley, P. D., Jannasch, H. W., and Woolsey, J. R. (2008). Measuring temporal variability in pore-fluid chemistry to assess gas hydrate stability: development of a continuous pore-fluid array. Environ. Sci. Technol. 42, 7368–7373. doi: 10.1021/es801195m
Lapham, L. L., Wilson, R. M., MacDonald, I. R., and Chanton, J. P. (2014). Gas hydrate dissolution rates quantified with laboratory and seafloor experiments. Geochim. Cosmochim. Acta 125, 492–503. doi: 10.1016/j.gca.2013.10.030
Leifer, I., and Boles, J. (2005). Turbine tent measurements of marine hydrocarbon seeps on subhourly timescales. J. Geophys. Res. 110:C01006.
Leifer, I., and Judd, A. (2015). The UK22/4b blowout 20 years on: investigations of continuing methane emissions from sub-seabed to the atmosphere in a North Sea context. Mar. Pet. Geol. 68, 706–717. doi: 10.1016/j.marpetgeo.2015.11.012
Leifer, I., and Judd, A. G. (2002). Oceanic methane layers: the hydrocarbon seep bubble deposition hypothesis. Terra Nova 14, 417–424. doi: 10.1046/j.1365-3121.2002.00442.x
Leifer, I., Luyendyk, B. P., Boles, J., and Clark, J. F. (2006). Natural marine seepage blowout: contribution to atmospheric methane. Global. Biogeochem. Cycles 20:GB3008.
Leifer, I., and MacDonald, I. R. (2003). Dynamics of the gas flux from shallow gas hydrate deposits: interaction between oily hydrate bubbles and the oceanic environment. Earth Planet. Sci. Lett. 210, 411–424. doi: 10.1016/s0012-821x(03)00173-0
Leifer, I., and Patro, R. K. (2002). The bubble mechanism for methane transport from the shallow sea bed to the surface: a review and sensitivity study. Cont. Shelf Res. 22, 2409–2428. doi: 10.1016/s0278-4343(02)00065-1
MacDonald, I. R., Bohrmann, G., Escobar, E., Abegg, F., Blanchon, P., Blinova, V., et al. (2004). Asphalt volcanism and chemosynthetic life in the Campeche Knolls. Gulf Mex. Sci. 304, 999–1002. doi: 10.1126/science.1097154
MacDonald, I. R., Garcia-Pineda, O., Beet, A., Asl, S. D., Feng, L., Graettinger, G., et al. (2015). Natural and unnatural oil slicks in the Gulf of Mexico. J. Geophys. Res. Oceans 120, 8364–8380.
MacDonald, I. R., Guinasso, N. L., Sassen, R., Brooks, J. M., Lee, L., and Scott, K. T. (1994). Gas hydrate that breaches the sea-floor on the continental-slope of the gulf-of-mexico. Geology 22, 699–702.
MacDonald, I. R., Leifer, I., Sassen, R., Stine, P., Mitchell, R., and Guinasso, N. Jr. (2002). Transfer of hydrocarbons from natural seeps to the water column and atmosphere. Geofluids 2, 95–107. doi: 10.1046/j.1468-8123.2002.00023.x
MacDonald, I. R., Sager, W. W., and Peccini, M. B. (2003). Gas hydrate and chemosynthetic biota in mounded bathymetry at mid-slope hydrocarbon seeps: northern Gulf of Mexico. Mar. Geol. 198, 133–158. doi: 10.1016/s0025-3227(03)00098-7
Mascle, J., Mary, F., Praeg, D., Brosolo, L., Camera, L., Ceramicola, S., et al. (2014). Distribution and geological control of mud volcanoes and other fluid/free gas seepage features in the Mediterranean Sea and nearby Gulf of Cadiz. Geo Mar. Lett. 34, 89–110. doi: 10.1007/s00367-014-0356-4
Mau, S., Rehder, G., Arroyo, I. G., Gossler, J., and Suess, E. (2007). Indications of a link between seismotectonics and CH4 release from seeps off Costa Rica. Geochem. Geophys. Geosyst. 8:Q04003.
McGinnis, D. F., Greinert, J., Artemov, Y., Beaubien, S. E., and Wüest, A. (2006). Fate of rising methane bubbles in stratified waters: how much methane reaches the atmosphere. J. Geophys. Res. 111:C09007.
McGinnis, D. F., Schmidt, M., DelSontro, T., Themann, S., Rovelli, L., Reitz, A., et al. (2011). Discovery of a natural CO2 seep in the German North Sea: implications for shallow dissolved gas and seep detection. J. Geophys. Res. 116:C03013. doi: 10.1029/2010JC006557
McNutt, M. K., Camilli, R., Crone, T. J., Guthrie, G. D., Hsieh, P. A., Ryerson, T. B., et al. (2012). Review of flow rate estimates of the deepwater horizon oil spill. PNAS 109, 20260–20267. doi: 10.1073/pnas.1112139108
Naudts, L., Greinert, J., Artemov, Y., Staelens, P., Poort, J., Van Rensbergen, P., et al. (2006). Geological and morphological setting of 2778 methane seeps in the Dnepr paleo-delta, northwestern Black Sea. Mar. Geol. 227, 177–199. doi: 10.1016/j.margeo.2005.10.005
Pape, T., Bahr, A., Rethemeyer, J., Kessler, J. D., Sahling, H., Hinrichs, K.-U., et al. (2010). Molecular and isotopic partitioning of low-molecular-weight hydrocarbons during migration and gas hydrate precipitation in deposits of a high-flux seepage site. Chem. Geol. 269, 350–363. doi: 10.1016/j.chemgeo.2009.10.009
Rehder, G., Brewer, P. W., Peltzer, E. T., and Friederich, G. (2002). Enhanced lifetime of methane bubble streams within the deep ocean. Geophys. Res. Lett. 29, 1731–1734.
Römer, M., Riedel, M., Scherwath, M., Heesemann, M., and Spence, G. D. (2016). Tidally controlled gas bubble emissions: a comprehensive study using long-term monitoring data from the NEPTUNE cabled observatory offshore vancouver Island. Geochem. Geophys. Geosyst. 17, 3797–3814. doi: 10.1002/2016gc006528
Römer, M., Sahling, H., Pape, T., Spiess, V., and Bohrmann, G. (2012). Gas bubble emission from submarine hydrocarbon seeps at the Makran continental margin (offshore Pakistan). J. Geophys. Res. 117:C10015.
Römer, M., Wenau, S., Mau, S., Veloso, M., Greinert, J., Schlüter, M., et al. (2017). Assessing marine gas emission activity and contribution to the atmospheric methane inventory: a multidisciplinary approach from the Dutch Dogger Bank seep area (North Sea). Geochem. Geophys. Geosyst. 18, 2617–2633. doi: 10.1002/2017gc006995
Sahling, H., Borowski, C., Escobar-Briones, E., Gaytan-Caballero, A., Hsu, C. W., Loher, M., et al. (2016). Massive asphalt deposits, oil seepage, and gas venting support abundant chemosynthetic communities at the Campeche Knolls, southern Gulf of Mexico. Biogeosciences 13, 4491–4512.
Salvador, A. (1991). “Origin and development of the Gulf of Mexico basin,” in The Gulf of Mexico Basin, ed. A. Salvador, (Boulder, CO: Geological Society of America), 389–444. doi: 10.1130/dnag-gna-j.389
Sauter, E. J., Muyakshin, S. I., Charlou, J.-L., Schlüter, M., Boetius, A., Jerosch, K., et al. (2006). Methane discharge from a deep-sea submarine mud volcano into the upper water column by gas hydrate-coated methane bubbles. Earth Planet. Sci. Lett. 243, 354–365. doi: 10.1016/j.epsl.2006.01.041
Scandella, B. P., Varadharajan, C., Hemond, H. F., Ruppel, C., and Juanes, R. (2011). A conduit dilation model of methane venting from lake sediments. Geophys. Res. Lett. 38:L06408.
Schneider von Deimling, J., Brockhoff, J., and Greinert, J. (2007). Flare imaging with multibeam systems: data processing for bubble detection at seeps. Geochem. Geophys. Geosyst. 8:Q06004.
Solomon, E. A., Kastner, M., MacDonald, I. R., and Leifer, I. (2009). Considerable methane fluxes to the atmosphere from hydrocarbon seeps in the Gulf of Mexico. Nat. Geosci. 2, 561–565. doi: 10.1038/ngeo574
Sultan, N., Bohrmann, G., Ruffine, L., Pape, T., Riboulot, V., Colliat, J.-L., et al. (2014). Pockmark formation and evolution in deepwater Nigeria: rapid hydrate growth versus slow hydrate dissolution. J. Geophys. Res. Sol. Earth 119, 2679–2694. doi: 10.1002/2013JB010546
Suresh, G. (2015). Offshore oil Seepage Visible From Space: A Synthetic Aperture Radar (SAR) Based Automatic Detection, Mapping and Quantification System. Ph. D., Thesis, Staats- und Universitätsbibliothek Bremen, Germany.
Torres, M. E., McManus, J., Hammond, D., de Angelis, M. A., Heeschen, K. U., Colbert, S. L., et al. (2002). Fluid and chemical fluxes in and out of sediments hosting methane hydrate deposits on Hydrate Ridge, OR, I: hydrological provinces. Earth Planet. Sci. Lett. 201, 525–540. doi: 10.1016/s0012-821x(02)00733-1
Tryon, M. D., Brown, K. M., Torres, M. E., Trehu, A. M., McManus, J., and Collier, R. W. (1999). Measurements of transience and downward fluid flow near episodic methane gas vents. Hydrate Ridge, Cascadia. Geology 27, 1075–1078.
Keywords: methane seepage, oil release, gas bubbles, Campeche Knolls, southern Gulf of Mexico
Citation: Römer M, Hsu C-W, Loher M, MacDonald IR, dos Santos Ferreira C, Pape T, Mau S, Bohrmann G and Sahling H (2019) Amount and Fate of Gas and Oil Discharged at 3400 m Water Depth From a Natural Seep Site in the Southern Gulf of Mexico. Front. Mar. Sci. 6:700. doi: 10.3389/fmars.2019.00700
Received: 29 August 2019; Accepted: 31 October 2019;
Published: 15 November 2019.
Edited by:
Cristina Gambi, Marche Polytechnic University, ItalyReviewed by:
Jonas Gros, GEOMAR Helmholtz Center for Ocean Research Kiel, GermanyDuofu Chen, Shanghai Ocean University, China
Copyright © 2019 Römer, Hsu, Loher, MacDonald, dos Santos Ferreira, Pape, Mau, Bohrmann and Sahling. This is an open-access article distributed under the terms of the Creative Commons Attribution License (CC BY). The use, distribution or reproduction in other forums is permitted, provided the original author(s) and the copyright owner(s) are credited and that the original publication in this journal is cited, in accordance with accepted academic practice. No use, distribution or reproduction is permitted which does not comply with these terms.
*Correspondence: Miriam Römer, bXJvZW1lckBtYXJ1bS5kZQ==
†Deceased April 23, 2018