 Mark Bushnell1*
 Christoph Waldmann2
 Steffen Seitz3
 Earle Buckley4
 Mario Tamburri5
 Juliet Hermes6
 Emma Henslop7
 Ana Lara-Lopez8
- 1U.S. Integrated Ocean Observing System, Silver Spring, MD, United States
- 2MARUM - Zentrum für Marine Umweltwissenschaften der Universität Bremen, Bremen, Germany
- 3Physikalisch-Technische Bundesanstalt, Braunschweig, Germany
- 4Buckley Environmental, Mount Pleasant, SC, United States
- 5Chesapeake Biological Laboratory, University of Maryland Center for Environmental Science, Solomons, MD, United States
- 6JCOMM OCG, The South African Environmental Observation Network, Cape Town, South Africa
- 7IOC/UNESCO, Paris, France
- 8Integrated Marine Observing System, University of Tasmania, Hobart, TAS, Australia
Scientists who observe and distribute oceanographic data require a process to ensure high-quality data. This process includes quality assurance, quality control, quality assessment, standards, and best practices. In this paper, quality assurance is widely regarded as actions taken prior to instrument deployment to improve the probability of generating good data, while quality control is the effort made to examine the resultant data. Herein we focus on quality assurance and strive to guide the oceanographic community by identifying existing quality assurance best practices preferred by the five entities represented by the authors – specifically, the Alliance for Coastal Technology, the AtlantOS project, the Integrated Marine Observing System, the Joint Technical Commission for Oceanographic and Marine Meteorology, and the U.S. IOOS Quality Assurance/Quality Control of Real-Time Oceanographic Data project. The focus has been placed on QA in response to suggestions from the AtlantOS and QARTOD communities. We define the challenges associated with quality assurance, which include a clear understanding of various terms, the overlap in meaning of those terms, establishment of standards, and varying program requirements. Brief, “real-world” case-studies are presented to demonstrate the challenges. Following this is a description of best practices gathered by the authors from hundreds of scientists over the many years or decades the aforementioned entities have been in place. These practices address instrument selection, preparation, deployment, maintenance, and data acquisition. Varying resources and capabilities are considered, and corresponding levels of quality assurance efforts are discussed. We include a comprehensive description of measurement uncertainty with a detailed example of such a calculation. Rigorous estimates of measurement uncertainty are surprisingly complex, necessarily specific, and not provided as often as needed. But they are critical to data users who may have applications not envisioned by the data provider, to ensure appropriate use of the data. The guidance is necessarily generic because of the broad expanse of oceanographic observations. Further, it is platform-agnostic and applies to most deployment scenarios. We identify the recently created Ocean Best Practice System as one means of developing, sharing, documenting, and curating more specific QA processes. Ultimately, our goal here is to foster their development and harmonization.
Introduction
Scientists acquire oceanographic and meteorological data from diverse environments above and below the water surface using various means of telemetry. This paper includes data generated from the following:
• Operational observations
• Sensors in development
• Fresh and salt water environments
• Meteorological measurements
Remotely sensed observations from satellite and aircraft are not included in the QA practices discussed in this paper.
High-quality marine observations require sustained quality assurance (QA) and quality control (QC) practices to ensure credibility and value to those who produce and use data. QA practices are employed with hardware to support the generation of high-quality data, such as sufficiently accurate, precise, and reliable sensors or instruments with adequate resolution. Other QA practices include sensor calibration; calibration checks and/or in situ verification, including post-deployment calibration; proper deployment considerations, such as measures for corrosion control and biofouling prevention; reliable data communications; adequate maintenance intervals; and implementation of detailed record-keeping processes.
The creation of a robust QC process is also essential; QC and QA are interrelated, and both are important to ensure the highest possible data quality. QC involves follow-on steps that support the delivery of high-quality data and requires both automation and human intervention. QC practices include testing such things as format, checksum, timely arrival of data, threshold checks (minimum/maximum, rate of change), neighbor checks, climatology checks, model comparisons, signal/noise ratios, verification of user satisfaction, and generation of data quality flags.
In this paper, we begin with a description of the challenges and a discussion of the definitions used herein. Brief descriptions of our offices/programs and their QA efforts follow, forming a framework to meet the challenge. We then introduce practices that ensure data quality, again working to clarify the distinction between QA, QC, and related aspects. Section Fundamental Concepts, Issues, and Problems of QA Best Practices builds on the fundamental concepts, issues, and problems of QA best practices. Section Measurement Uncertainty focuses further on the under-appreciated QA subject of measurement uncertainty. We hope it spurs readers to view the important details provided in Supplementary Material.
Description of Challenges
QA, QC, and the closely related topics of best practices (BP) and standards are challenging to separate. Indeed, these terms are often (usually) used interchangeably and have different meanings to different people. Herein, we attempt to clarify these terms and provide approaches to each, with the aforementioned focus on QA, as agreed to by several leading ocean-observing organizations. It is hoped that the material provided is useful to others and paves the way for more ocean observations obtained using a common understanding. Aspirations notwithstanding, we acknowledge that overlap among QA, QC, best practices, and standards will remain (Figure 1). As an example of this overlap, consider a post-deployment calibration. Under certain circumstances, it may be used to establish sensor drift and determine a correction to be applied to the data – a QC action. The same post calibration might then also serve as a pre-deployment calibration for the next deployment – a QA action. These semantic conundrums can be clarified through documentation when operators (data providers) describe their data acquisition methods. Metadata should clarify and document the efforts undertaken.
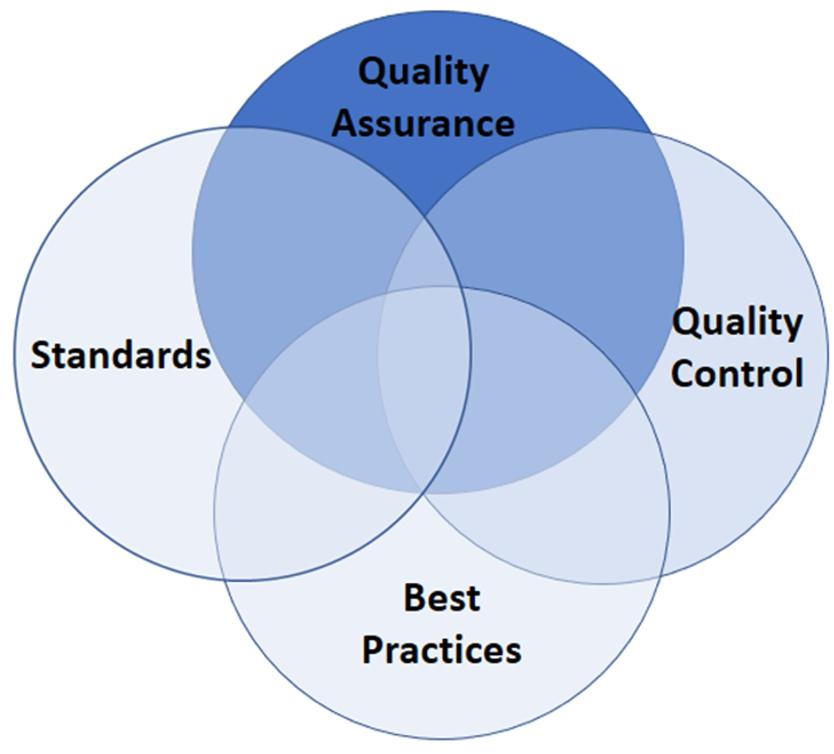
Figure 1. Overlap of QA, QC, established standards, and best practices.
It is helpful to consider International Organization for Standardization (ISO) statements regarding QA and QC. ISO 9000:2015 defines quality assurance as “part of quality management focused on providing confidence that quality requirements will be fulfilled” or “all the planned and systematic activities implemented within the quality system that can be demonstrated to provide confidence that a product or service will fulfill requirements for quality.”
ISO 9000:2015 defines quality control as “part of quality management focused on fulfilling quality requirements” or “the operational techniques and activities used to fulfill requirements for quality.”
To further clarify, ISO9000:2105 states “While quality assurance relates to how a process is performed or how a product is made, quality control is more the inspection aspect of quality management.”
Within this paper, we use the following definitions:
Quality assurance (QA) – processes that are employed to support the generation of high-quality data.
Quality control (QC) – the follow-on steps that support the delivery of high-quality data, requiring both automation and human intervention.
Data quality assessment (DQA) –the process of empirically evaluating data to determine whether they meet the necessary quality requirements (e.g., accuracy, precision, spatial, and temporal resolution, etc.).
Best practice (BP) – a methodology that has repeatedly produced superior results relative to other methodologies with the same objective and has been adopted and used by multiple organizations or communities (Simpson et al., 2017).
Standard – (a) a document, established by consensus and approved by a recognized body, that provides (for common and repeated use) rules, guidelines or characteristics for activities or their results, aimed at the achievement of the optimum degree of order in a given context (ISO), (b) more loosely, a reference material with one or more known property values and their uncertainties.
Ensuring data quality is not always straightforward. QA (and QC) procedures may be specific to a sensor technology or even to a particular manufacturer’s model, so the establishment of a standard that is applicable to every sensor is difficult. When multiple accepted best processes exist, we strive to identify the challenge and pave the way toward resolution.
Additional challenges to QA standardization are broadly varying program requirements. Differing accuracies, capabilities, and resources invariably occur. Some well-established programs with the highest standards may implement rigorous QA processes. Others, with different requirements, may employ simple techniques – all observations may have value when used prudently. An analogy is made with weather versus climate accuracy scales (Newton et al., 2014). It is the responsibility of the users to understand and appropriately utilize data of varying quality, and operators must provide support by documenting and publishing their QA processes.
A Framework to Meet the Challenges
Ensuring that data are of the highest quality (within resource constraints and needs) figures prominently into the goals of all ocean-observing entities. This paper pulls together the prevailing QA practices and strives for uniformity of those practices in a framework to examine QA, an important aspect of total data quality, with a particular focus on the entities of the authors: AtlantOS, JCOMM, ACT, QARTOD, and IMOS.
AtlantOS1 is a European Union Horizon 2020 research and innovation project composed of 62 partners from 18 countries. It strives to create “a sustainable, efficient, and fit-for-purpose Integrated Atlantic Ocean Observing System.” There are 11 objectives, or Work Packages, and this QA document partially addresses WP7 Task 7.1. The idea to create this QA document was launched during an AtlantOS workshop2.
The Joint Technical Commission for Oceanography and Marine Meteorology (JCOMM)3 falls under the WMO-UNESCO Intergovernmental Oceanographic Commission umbrella. The JCOMM Observation Coordination Group (OCG) 2015–2020 workplan includes an effort to “promote the adoption of consistent standards and practices for data management.” At the JCOMM OCG 7 in 2016, the recommendation was made that the OCG vice chair of the Standards and Best Practices subcommittee “promote development of standards and best practices across the marine met/ocean observing networks, working with the community of networks under the JCOMM Observations Coordination Group (OCG).”
The Alliance for Coastal Technologies (ACT)4 is a partnership of research institutions, resource managers, and private-sector companies dedicated to fostering the development and adoption of effective and reliable sensors and platforms for use in coastal, freshwater, and ocean environments. The test protocols that ACT develops require QA management, and the tests themselves require QA.
Quality Assurance/Quality Control of Real-Time Oceanographic Data (QARTOD)5 was formed in 2004 as a grassroots effort with a focus on real-time QC. The project was adopted by U.S. Integrated Ocean Observing System (IOOS) in 2012 and has since completed Thirteen manuals and several supporting documents (U. S. Integrated Ocean Observing System, 2014, 2015a,b,c,d,e, 2016, 2017a,b,c,d,e, 2018a,b). Each manual receives a series of reviews by subject matter experts from the U.S. (state and federal government agencies, instrument manufacturers, etc.) and the international oceanographic community. Updates provide another opportunity for review and comment. While these manuals focus on descriptions of real-time QC tests, they also include an appendix wherein QA is loosely addressed (because of the close coupling of QA and QC). In the future, as the QARTOD manuals are updated, that appendix will be removed, and this document will be referenced.
The Integrated Marine Observing System (IMOS)6 is Australia’s marine-observing system, which is a national scale, sustained observing system established in 2006. It supports the collection of physical and biogeochemical observational time series across oceanic and coastal waters. Science and implementation plans developed by the Australian marine research community underpin IMOS observations, giving the rationale for measuring particular variables at the needed time and space scales using the appropriate observing platforms and sensors. IMOS was also designed to contribute to and benefit from the Global Ocean Observing System (GOOS); many of the observing platforms operated by IMOS are embedded and contribute data to important global networks and must conform with standard QA/QC procedures. IMOS integrates QA/QC procedures recommended by programs such as Argo, the International Quality Controlled Ocean Database, GO-SHIP, and the U.S. IOOS QARTOD project.
The authors have drawn largely upon existing sources of documented, agreed-upon best practices and existing standards to ensure the QA of data collected by instruments that are deployed on various platforms (piers, moorings, bottom-mounted devices, autonomous vessels, etc.) by observers of oceanographic and meteorological processes. It is intended to benefit a variety of audiences, including operators of observatories (i.e., data providers) – either from learning about useful QA measures or seeing their employed measures validated herein. Users of the observed data will learn about the QA measures employed, and that information should be available to them to help ensure the data are properly applied. Manufacturers and vendors may gain clarity into the expectations of their consumers. Program managers may better understand the challenges, costs, and rewards associated with the appropriate levels of QA. Finally, comprehensive documentation of the QA processes employed will enable use of the data for the long term, adding value to the data for future applications. As such, they represent the 2019 vision of uniform QA and when appropriate, identify challenges to be overcome in the quest for uniform practices.
The scope of the paper is limited to generic QA, QC, best practices, and standards. The content does not attempt to describe practices for specific platforms or instruments, although some instruments are used in selected examples to illustrate applications. More comprehensive and specific guidance can be found, for example, in Takawano (2018). Yet, even this excellent ten volume tome, years in the making by dozens of authors and still in development, only begins to describe the vast collection of practices past and present.
No new standards, QA, or QC methods are introduced herein. Rather, from this large body of knowledge, standards and methods are identified as the desired ones to be used by our organizations, including FixO3, GO-SHIP, QARTOD, and the World Ocean Circulation Experiment (WOCE). These are noted throughout and are compiled as either direct citations, supporting documents, or sustainable links (e.g., Digital Object Identifier).
Practices that Ensure Data Quality
Many decisions made today are based on data gathering and analysis. Organizations from the highest levels of government worldwide to private-sector businesses are becoming increasingly data-driven. Organizations and agencies involved in ocean observing are certainly among those who generate large data quantities. Oceanographic and meteorological observations throughout the world are collected about all aspects of our environment, such as currents, waves, wind, and barometric pressure. The importance of the high quality of these data cannot be overstated; no one wants to make decisions about a weather forecast or long-term building project based upon incorrect or misleading data. Data QC is generally presumed to improve data quality, but many decisions that influence data quality must be made before data arrive. For example, adopting a flagging scheme standard is a QA activity (done before the data arrive), but actually flagging the data is considered QC. The collection of high-quality data begins with good QA, which requires scientists, engineers, and technicians apply consistent QA, as well as best practices for QC and quality assessment practices.
A formal QA gap analysis would compare a desired harmonized future status of QA practices with the existing capabilities to identify the missing components. Unfortunately, neither a clearly defined goal nor even a comprehensive present QA capacity exists. To determine either for even one variable is beyond the scope of this general QA paper. Rather, herein we identify a few important QA discrepancies among our agencies and offer potential solutions.
Quality Control
Quality control of the data generated from an observing system can occur on several time scales. It may be done in real-time so as to provide the best data for ingestion into models or used by decision-makers in real-time. It may be conducted during post-processing, for example after an instrument is recovered and the entire time series is available. And it often is done as a reanalysis, where long time series from multiple, related variables are used to provide the highest level of QC and data confidence. The following time scales are commonly employed:
• Real-Time: We define real-time as operating upon the most recent data points, depending upon the tests employed. Tests such as those described by the U.S. IOOS QARTOD project7 provide real-time QC.
• Near-real-time: These processes are conducted with the benefit of evaluating recent data points by using subsequent values in the time series. They necessarily induce latency but seek to minimize it (IMOS, 2017; Reverdin et al., 2017).
• Delayed mode or post-processed: The focus of these processes is to provide better QC rather than faster QC. They are performed to improve data archives. Examples are the Global Temperature and Salinity Profile Programme (Argo8; Wong et al., 2015).
• Reanalysis: This may be conducted at infrequent intervals. It can use multiple variables and relationships without regard to timely delivery of data, providing the best QC available (until the next reanalysis). An example is the work conducted by the U.S. National Oceanic and Atmospheric Administration (NOAA) Earth System Research Laboratory Physical Sciences Division9.
Quality Assessment
Quality assessment (not to be confused with quality assurance) is a process typically following QC procedures. The quality of measurements is assessed based on the information provided by the manufacturer of the instrument, including an independent calibration of the instruments, the influence of the calibration outcome on preparation procedures of the instrument for a measurement campaign, the measuring conditions while the instrument is in operation, and finally the expected results, e.g., by comparison to climatological data.
Typically, all the mentioned steps are assessed individually based on a scheme that is specific to the related measurement program (see section Measurement Uncertainty for an example of a component of quality assessment). This scheme does not harm the quality indicator as long as the process is documented properly, i.e., traceability is guaranteed. In the field of meteorology, a strict quality management framework that formalizes the quality assessment process has been established by assigning specific responsibilities like calibration, reference standard checks, etc., to selected groups and institutions10,11.
In ocean science, no comparable process exists because of the large number and diversity of parameters and instruments used. With the initiatives like QARTOD and ACT, the prerequisites are in place to change the situation. Two new ISO standards that support this process are in development. ISO/AWI 22013 defines a unique framework for describing and testing sensor characteristics. ISO/AWI 21851 focuses on design criteria for ocean observation systems. The way that measuring conditions have an influence on the outcomes of a measuring campaign is described in the case studies in section Two “Real-World” Case Studies With Different Requirements and Different Solutions. Finally, the method of conducting inter-comparison campaigns provides a good tool for an overall check of the preparation procedures of an instrument.
Data Flagging Schemes
Data are evaluated using QC tests, and the results of those tests are indicated using flags in the data files. Multiple flagging standards exist, and there is flexibility within them. Operators may incorporate additional flags into metadata records. For example, an observation may fail a gross range test and be flagged as having failed the test. Additional flags may be incorporated (e.g., failed high or failed low) to provide more detailed information to assist with troubleshooting.
Flags set in real-time should retain their original settings. Further post-processing of the data may yield different conclusions from those suggested in the initial real-time flags. However, by retaining the real-time flag settings, the historical documentation is preserved.
One known difference is the standard used to assign data quality flags. The Intergovernmental Oceanographic Commission/United Nations Environmental, Scientific, and Cultural Organization (IOC/UNESCO) issued a document (hereafter referred to as IOC 54:V3) (Paris. Intergovernmental Oceanographic Commission of UNESCO, 2013) with seven examples of flag schemes. Schlitzer (2013) identifies 16 widely used oceanographic flagging schemes, and even more exist.
AtlantOS has adopted the SeaDataNet flag scale12. This flagging scheme is described in the SeaDataNet Common Vocabularies at http://seadatanet.maris2.nl/v_bodc_vocab/welcome.aspx as list L201.
The U.S. IOOS QARTOD project has chosen the IOC 54:V3 flagging standard (U. S. Integrated Ocean Observing System, 2017e), which identifies just five flag states: 1-Good data, 2-Not evaluated, 3-Questionable data, 4-Bad data, and 9-Missing data. Following Schlitzer (2013), Table 1 shows the eleven SeaDataNet flag states and how they translate to the IOC 54:V3 and IMOS states. Table 2 shows the same translation from the IOC 54:V3 point of view.
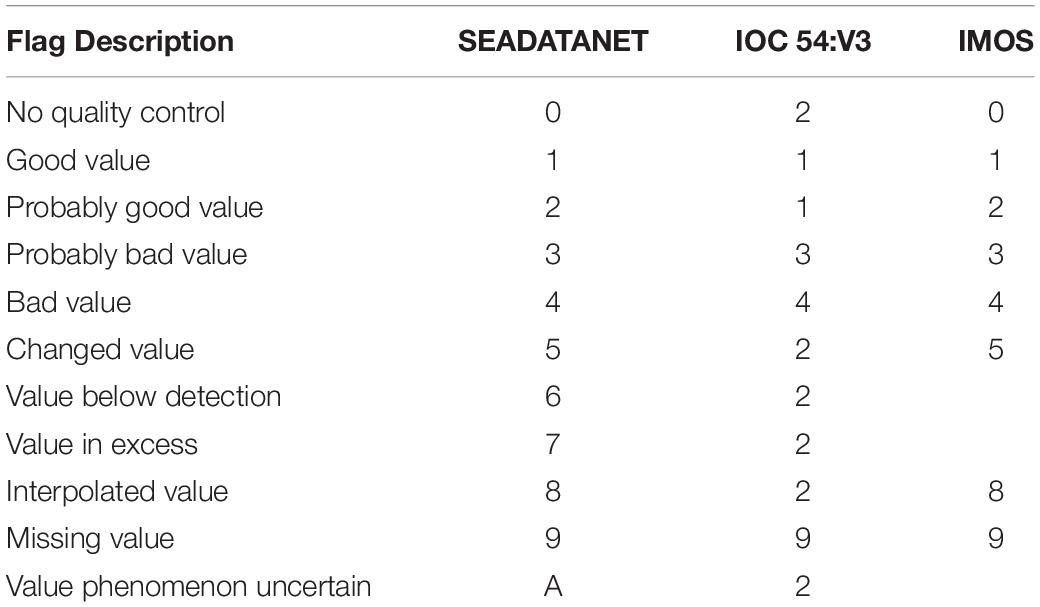
Table 1. Data quality control flag translation table, SeaDataNet to IOC 54:V3 and IMOS.
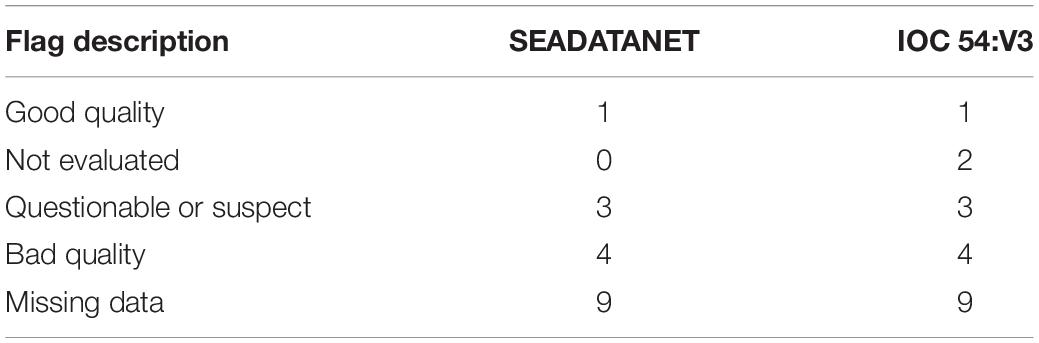
Table 2. Data quality control flag translation table, IOC 54:V3 to SeaDataNet.
IMOS uses its own flagging system, which was based on an older version of the International Oceanographic Data and Information Exchange (IODE)-IOC flagging scheme that has since changed to the current IOC 54:V3 (Table 1).
As indicated here and in the references cited, the ability to cross-reference the various flagging schemes can be managed. While one harmonized flagging scheme is highly desirable, it is likely more realistic and cost efficient to accept the present diverse standards and to implement translation between them for the foreseeable future.
Fundamental Concepts, Issues, and Problems of QA Best Practices
Ocean-observing systems rely on robust and stable instruments integrated into an equally robust infrastructure. Such infrastructures must be capable of converting raw observation data into usable information and knowledge products stored in repositories that provide management and access. The methodologies and best practices associated with large-scale observing systems engage all aspects of an elaborate, end-to-end process, which ranges from observatory design and sensor handling, to the dissemination of quality data. These methodologies and best practices must well documented and readily available.
To be fully elevated to the Simpson et al. (2017) definition of a best practice, a promising method must produce superior results relative to other methodologies with the same objective and be adopted and employed by multiple organizations. Best practices in this domain emerge from time-tested experience, usually gathered within organizations such as universities, private and public research institutions, or through collaborative projects and programs. For example, large programs such as the European FixO3 for fixed mooring observations, IOOS for coastal observations in the U.S., or JCOMM networks may document best practices and urge their propagation. These valuable documents are often maintained by international organizations such as the UNESCO IODE or GOOS, which create forums for discussing, recommending, and documenting observation and data practices. Despite the quality of these efforts, best practice documentation is still fragmented, and the impact they have is difficult to evaluate.
In this paper, our vision is to assemble accepted QA best practices to ensure high data quality, making it easier for ocean observers to find these agreed-upon best practices in one place. By assembling this collection of best practices and standards concerning QA, we hope to help ourselves and others to ensure the highest quality of data, assisting data providers and data users from the most basic to the most advanced observing system. The Supplementary Material portion of this paper includes examples of more specific QA practices, such as instrumentation acceptance, calibration, use, maintenance, and associated check lists.
Quality assurance spans the entire observational enterprise, from concept to application of archived data. Even low-resolution data collected for simple applications benefit from a well-reasoned QA plan. In section Practices that Ensure Data Quality, we gave a general overview of the important concepts for data management and best practices in general. The next section provides guidance that progresses from the perspective of an operator embarking on a new measurement task, providing a linear flow through the QA process. It begins with the identification of a proper instrument, followed by calibration, configuration, deployment and maintenance, and all other practices related to ensuring optimal results.
Instrument Selection, Purpose, Design, Deployment
Factors that affect instrument selection might include accuracy, cost, ruggedness, past experience and present capability of the operator, data communications capabilities, sensor span and stability, availability, and a host of other considerations. The selection is usually a compromise of competing factors, such as cost and accuracy, but also the initial purpose of collecting these observations. If possible, selection guidance from others engaged in similar observations and a market survey of potentially suitable instruments are wise endeavors.
An essential consideration before selecting a particular instrument or sensor is the need to have clear objectives and requirements for making the observations. Having scientific rationale underpinning the collection of data will influence the selection of an instrument that is fit for purpose.
Another important consideration is manufacturer assistance. Support (e.g., calibration, repair), stability, and responsiveness by manufacturers can be difficult to quantify, but it generally should be considered as important as the identification of the hardware itself. When questions arise just prior to deployment in a remote location, obtaining answers quickly and directly from the friendly company engineer after office hours is an invaluable service.
Purpose, Design, and Deployment
While a clear understanding of the observational requirements is desirable, it can be surprisingly difficult to obtain. Data users may have various and evolving needs.
The resources required to increase measurement accuracy usually grow dramatically; therefore, operators must ensure that both their capabilities and their expectations are realistic. For example, deep-ocean salinity observations may require a precision of 0.002 PSU (practical salinity unit), but there is little reason for such a goal when only surface salinity observations are planned. Full consideration of the spatial and temporal scales of variability should be conducted to ensure that measurements are properly representative of the area of interest, rather than an expensive study of noise.
The following paragraphs provide two examples of different requirements and different solutions.
Two “Real-World” Case Studies With Different Requirements and Different Solutions
Case Study 1: Pressure sensors are commonly found on oceanographic instruments to determine depth (CTD or conductivity, temperature, depth), create corrections for related measurements (salinity), or for observations directly utilizing the pressure measurements (tsunami sensor). One may obtain a device with a pressure span larger than necessary to accommodate a broader range of future applications. For example, an irradiance meter to be used in turbid coastal waters may not need to be lowered beyond 10 m, but the operator may decide a future project in clear ocean water could require deployment to as much as 100 m. Why not purchase the device with the larger pressure span? The operator may not understand that pressure sensor accuracy is usually stated as a percentage of full scale, and that the resolution needed for the shallow, turbid water observations would be reduced.
Case Study 2: An oceanographic laboratory performed CTD/dissolved oxygen (DO) profile transects over several years. The scientists and technicians aboard the ship made strong efforts to ensure collection of the highest quality data, with a focus on the DO observations. They made sure the Niskin bottles were not leaking. Frequently, duplicate or triplicate samples were drawn from a Niskin bottle. On occasion, multiple Niskin bottles were tripped at the same depth. They drew the DO samples first, carefully added the reagents, and stored the samples in a temperature-regulated room. They used sample bottles that employed a water seal around the stopper and covered the stopper to prevent evaporation of the water seal.
The samples were titrated using the latest automated equipment to avoid problems associated with human visual determination of the titration end point. Standards and blanks were run often. Primary standard solution from the previous cruise, as well as fresh standard solution, ensured consistency between cruises.
Comparisons between the redundant samples from one or more Niskin bottles, as well as comparisons to the DO sensor on the CTD/DO instrument, showed their efforts resulted in achieving the required accuracy standard. However, a reanalysis of their DO observations several years later showed a small bias when compared to DO observations from others. Considerable effort was expended to defend their observations. The stepwise re-creation of the sampling process was demonstrated, and the comparison statistics derived during each cruise were revisited. Side-by-side comparisons of their process with other institutions were conducted without identifying any flaws.
Ultimately, it was determined that the scale used to weigh the potassium bi-iodate when preparing the primary standard was at fault. Because the bias was small, and all other indications showed good precision, the data went unquestioned. More frequent calibration of the scale certainly was warranted. And a more concerted effort to occupy a station jointly with another institution might have revealed the issue sooner.
The Role of Metadata
Robust metadata documentation is as important as the data itself. It is required in order to ensure the understanding and proper use of the data, immediately and in perpetuity. The challenge is to identify the extent of metadata to be recorded, which becomes a balance of resources and needs.
U.S. IOOS addresses metadata standards at https://ioos.noaa.gov/data/contribute-data/metadata-standards. They state that operators should follow the guidelines in the NOAA Data Documentation Procedural Directive, which became effective on January 1, 2017 and can be found at https://nosc.noaa.gov/EDMC/PD.DD.php. IOOS data providers are expected to create metadata records that can be harvested for the IOOS Catalog13.
IMOS data collections are described by metadata records structured according to the Marine Community Profile21 (MCP v2.0), a subset and extension of the ISO 19115 standard (International Organization for Standardization, 2003), including links to specific map and download services. This subset was created because the ISO 19115 standard was considered too generic for oceanography and omitted elements that are important to this discipline (Hidas et al., 2016).
Other excellent examples of metadata management can be found within AtlantOS (Harscoat et al., 2016) and within the Argo community14.
QA Levels of Best Practices
A wide variety of techniques are used by operators to ensure that sensors are properly calibrated and operating within specifications. While all operators must conduct some form of validation, there is no need to force operators to adhere to a single method. A balance exists between available resources, level of proficiency of the operator, and accuracy. The various techniques span a range of validation levels and form a natural hierarchy that can be used to establish levels of certification for operators (Table 3). The lists in the following sections suggest ways to ensure QA by using specific procedures and techniques.
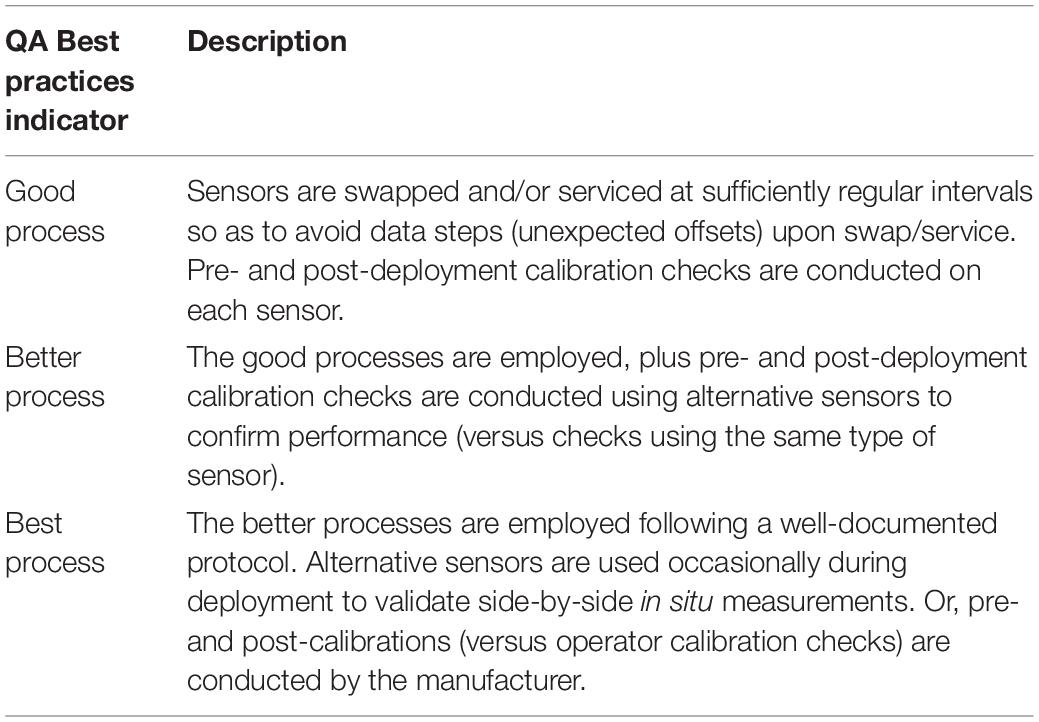
Table 3. Best practices indicator for QA.
An effective QA effort continually strives to ensure that end data products are of high value and to prove they are free of error. Operators should seek out partnering opportunities to inter-compare systems by co-locating differing sensors (e.g., joint ship measurements, co-incident Argo float/ship CTD observations), thereby demonstrating high quality by both to the extent that there is agreement and providing a robust measure of observation data uncertainty by the level of disagreement.
If possible, operators should retain an alternate sensor or technology from a second manufacturer for similar in-house checks. For resource-constrained operators, however, it may not be possible to spend the time and funds needed to procure and maintain two systems. For those who do so and get two different results, the use of alternate sensors or technologies provide several important messages: (a) a measure of corporate capabilities; (b) a reason to investigate, understand the different results, and take corrective action; and (c) increased understanding that, when variables are measured with different technologies, different answers can be correct; they must be understood in order to properly report results. For those who succeed in obtaining similar results, the additional sensors provide a highly robust demonstration of capability. Such efforts form the basis of a strong QA/QC effort. Further, sensor comparison provides the operator with an expanded supply source, permitting less reliance upon a single manufacturer and providing competition that is often required by procurement offices.
Users often take samples during deployment, recovery, or service. These times are risky for ensuring quality sensor data – often due to initial stabilization, sensor/environment disturbance, or high fouling near the end of the deployment. At least one sample should be obtained mid-deployment without disturbing the sensor.
Operators have access to other sources of QA practices and information about a variety of instruments. For example, the Alliance for Coastal Technologies (ACT) serves as an unbiased, third party testbed for evaluating sensors and platforms for use in coastal and ocean environments. ACT conducts instrument performance demonstrations and verifications so that effective existing technologies can be recognized, and promising new technologies can become available to support coastal science, resource management, and ocean observing systems (Alliance for Coastal Technologies [ACT], 2012). The NOAA Ocean Systems Test and Evaluation Program (OSTEP) also conducts independent tests and evaluations on emerging technology as well as new sensor models. Both ACT and OSTEP publish findings that can provide information about QA, calibration, and other aspects of sensor functionality. The following list provides links to additional resources on QA practices:
• Manufacturer specifications and supporting Web pages/documents
• QARTOD – https://ioos.noaa.gov/project/qartod/
• ACT – http://www.act-us.info/
• USGS – http://water.usgs.gov/owq/quality.html
• USGS – http://pubs.usgs.gov/tm/2006/tm1D3/
• USGS – http://or.water.usgs.gov/pubs/WRIR01-4273/wri014273.pdf
• WOCE – https://www.nodc.noaa.gov/woce/
• NWQMC – http://acwi.gov/monitoring/
• AtlantOS – https://www.atlantos-h2020.eu
• JCOMM – http://www.uk-ioc.org/JCOMM
Ocean Best Practices System
There exists an opportunity to improve upon the present methods used to develop, exchange, implement, and archive QA practices. The Ocean Best Practices System (OBPS) system supports an open access, permanent, digital repository of community best practices in ocean-related sciences, presently maintained by the International Oceanographic Data and Information Exchange (IODE) of the UNESCO-IOC as an IOC (IODE, GOOS) coordinated activity. An OBP Working Group is coordinating its activities with international and national agencies and projects to improve access to documented best practices (Simpson et al., 2017).
The working group is directly collaborating with AtlantOS, JCOMM, QARTOD, IMOS, and ACT and many other partners in diverse ocean disciplines to populate the OBPS repository15,16 and to address the utility of the OBPS process for their communities. In addition, many projects are contributing their experience and documentation.
A strategy formulation and an implementation plan have been developed to cover the needs related to both populating the OBPS repository and addressing the utility of the OBPS process through the largest and most diverse number of representatives of the ocean-observing community. The mission is to provide coordinated and sustained global access to best practices in ocean observing to foster innovation and excellence. The vision is to increase efficiency, reproducibility, and interoperability of the entire ocean observing value chain by providing the ocean observing community with a trusted, unified, sustained, and readily accessible knowledge base of interdisciplinary best practices.
This vision is being realized by engaging ocean observing communities in a joint and coordinated effort in producing, reviewing, and sustaining OBPS documents. This activity is centered on the UNESCO/IOC IODE best practice repository and the new peer-reviewed journal Frontiers in Marine Science research topic Best Practices in Ocean Observing17, which is integrated into a system that provides increased discoverability and access to BP documents. We believe this will promote community consensus and agreement of ocean best practices.
The project has the following four strategic objectives:
• Enhance the functionality and search capabilities of the existing IODE Ocean Best Practices repository and provide tools to promote and increase the OBPS content.
• Establish the Frontiers in Marine Science Ocean Best Practices research topic as the media to describe and disseminate robust and high-quality methodologies over the entire range of ocean observing, addressing the challenges of improving observation capabilities (including data management) and interoperability, all linked/referenced to the OBPS repository.
• Ensure visibility of the repository/system through community engagement activities.
• Establish funding of the OBPS system by the global and regional ocean observation and information organizations, as well as community practitioners.
The OBPS project has these underlying principles:
• Provide open access to a central document repository.
• Permit multiple document locations (e.g., developer website and OBPS repository).
• Enable the best practice developer to retain control of the BP content.
• Facilitate the publication of journal articles/methods papers with a corresponding entry of full documentation within the OBPS repository.
• Promote community dialog via the Frontiers journal and the OBPS repository.
• Provide for optional peer review using the Frontiers journal process.
The strategy for creating a useful and sustainable repository is to leverage existing capabilities whenever possible, both in the repository infrastructure and its content of best practices. Then expand the infrastructure with new search mechanisms based on ontologies that can service the different disciplines of ocean research from physical observations to chemistry, biology, and ecosystems. The best practices cover all facets of the information chain from sensors, calibration, platforms and platform integration to communication of observed data, data management, and user interfaces.
While existing best practice documents will be included in their native formats, it may be necessary to add metadata elements to support improved discovery and access. As a strategy, the best practice repository will identify levels of document processing to indicate the completeness of the documentation to users. At the highest level, the best practices will have comprehensive metadata and have been peer reviewed by the community or through a repository expert panel.
The Use of ISO Standards to Quantify Data Quality
The ISO is an independent, non-governmental international organization supported by experts who voluntarily contribute toward developing and maintaining standards. The published standards cover many technologies and industries but must be purchased, which is a potential hurdle for small operators. The brief descriptions in Table 4 may help individuals determine which standards may be useful for QA of oceanographic data. The ISO online browsing platform at https://www.iso.org/obp/ui is also a useful tool.
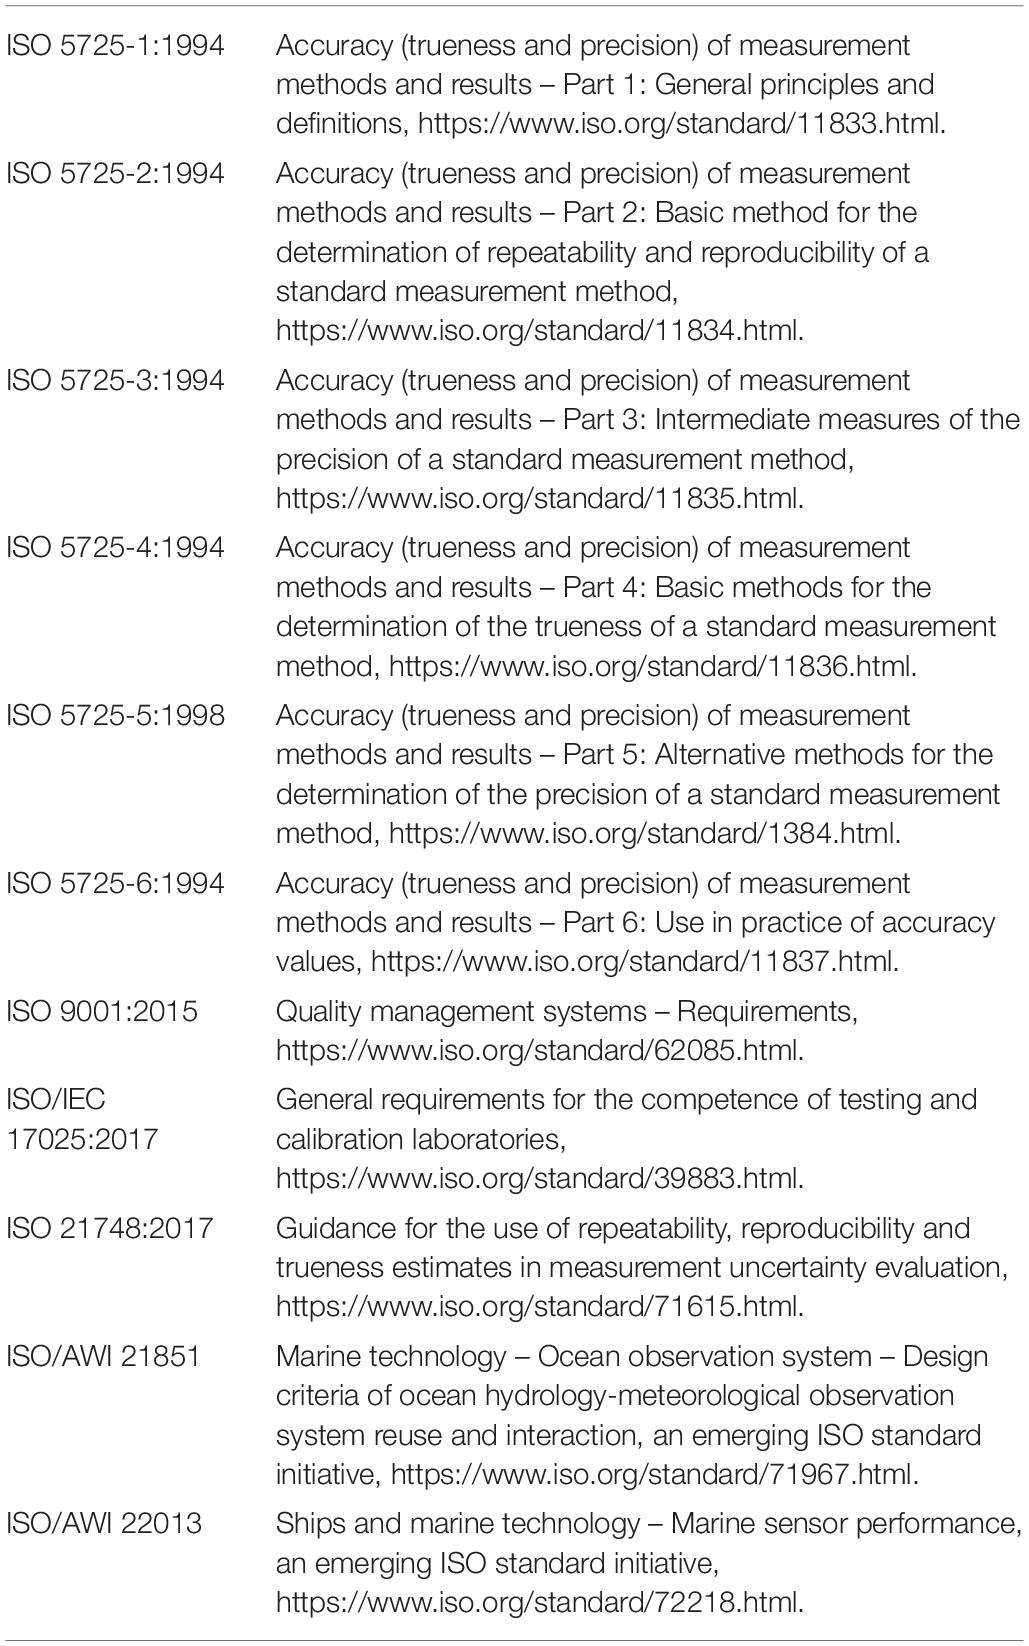
Table 4. Overview of applicable ISO standards.
Measurement Uncertainty
A properly stated measurement result usually consists of two components: the quantity value assigned to the property to be measured and the uncertainty of this value. Uncertainty of measurement is a quantitative indication of the variability of the quantity value. It arises from both our incomplete knowledge of the value of the measured quantity and the factors influencing it. The overall goal of documenting measurement uncertainty is to provide information that can be used for decision making. When the uncertainty in a measurement is evaluated and stated, the fitness for purpose of the measurement result can be properly judged.
The methods, terms, and symbols for evaluating and expressing measurement uncertainty are well described (Bell, 1999; Eurolab, 2006; BIPM, 2008; American Association for Laboratory Accreditation, 2014). Other terminology related to measurement is defined in the International Vocabulary of Metrology (BIPM, 2012). According to the GUM, the term uncertainty of measurement denotes “a parameter, associated with the result of a measurement, that characterizes the dispersion of the values that could reasonably be attributed to the measurand,” i.e., uncertainty of measurement is the quantification of the doubt that exists about the result of any measurement. As discussed below, the use of good practice – such as traceable calibration, careful calculation, good record keeping, and checking – can reduce measurement uncertainties.
Measurement uncertainty should not be confused with measurement error. The latter indicates the difference between a measured quantity value and a reference value, in practice that of a standard used in a calibration measurement. Measurement error is misleadingly often misunderstood to express the deviation of the measured quantity value from a somewhat obscure “true value” that cannot be quantified due to imperfections in the measurement. In contrast, the concept of measurement uncertainty tries to quantify a range, in which the (unknown) true value is supposed to be within a given level of confidence.
Broadly speaking, a measurement error has two components, a random component and a systematic component. Random measurement error arises from unpredictable or random temporal and spatial variations of influence quantities. The effects of these variations result in variations in repeated observations of the measurand. Although it is not possible to compensate for the random error of a measurement result, it can usually be reduced by increasing the number of observations. In contrast, systematic measurement error remains constant in replicate measurements or varies in a predictable manner.
A measurement error can be quantified and, if it is significant in size relative to the required accuracy of the measurement, a correction or correction factor can be applied to compensate for the effect. Measuring instruments and systems are adjusted or calibrated using measurement standards and reference materials to eliminate the measurement error. However, the uncertainties associated with these standards and materials, as well as the uncertainty of the calibration measurement, must still be considered.
Sources of Uncertainty
Uncertainty components/budgets are a combination of many factors that may include, but are not limited to:
• Repeatability of the calibration measurement, reflecting the variability of the calibration result in replicate measurements, quantifying stability of the equipment and stability of the environment during a specific measurement, the replicability of sampling, and the operator skills to replicate the calibration procedure
• Uncertainty of the reference value of the standard used for calibration
• Long-term stability of the measurement system since its last calibration.
• Repeatability of the actual measurement, reflecting the variability of the measurement result in replicate measurements, quantifying stability of the equipment and stability of the environment during the specific measurement, the replicability of sampling and the operator skills to replicate the measurement procedure
• Uncertainty of the model, if the measurand of interest is calculated from one or more measured input quantities and their corresponding uncertainties
• Measurement reproducibility, reflecting the variability of the measured quantity value when it is measured at different sites, times and by different, experienced operators, but under nominal identical conditions. Basically, reproducibility can only be estimated by an interlaboratory comparison measurements. Obviously, the uncertainty of any measurement cannot be smaller than the reproducibility of the method used. However, if the major uncertainty contributions are considered adequately, especially the uncertainty of the calibration standard, reproducibility should be covered by the uncertainty budget without assigning an own uncertainty value to reproducibility.
If the measurement result, i.e., its quantity value and its uncertainty, is calculated from several measured input quantities, the quantities are not necessarily independent, and their correlation can either increase or decrease the uncertainty of the final result, depending on the degree of correlation and the model used to calculate the final result.
Environmental field measurements pose unique challenges for estimating measurement uncertainty. Corresponding uncertainty contributions include but are not limited to interferences, environmental conditions, sample collection and handling, representativeness of the sample, and instrument maintenance and operation. Heterogeneity always gives rise to uncertainty.
The act of taking a sample introduces uncertainty. Heterogeneity is among the most important factors contributing to uncertainty associated with sampling. Uncertainty also arises in sample handling and preparation (e.g., transportation, preservation, splitting, drying) that may occur after sampling. Each step can introduce uncertainty from a range of mechanisms, such as loss of analyte or contamination from equipment or previous samples. Sampling methods and personnel training should aim to reduce these to a minimum.
Quantitative uncertainty factors include, but are not limited to, calibration, sample matrix, environmental conditions, sample handling and equipment maintenance, and operation. Instruments have inherent limitations, such as potential interferences, detection limits, and accuracy; it is important to ensure that the instrument is capable of collecting data that satisfy the data quality objectives of the study.
It is important to distinguish what is not a measurement uncertainty:
• Mistakes made by operators are not measurement uncertainties.
• Tolerances are not uncertainties. They are acceptance limits that are chosen for a process or a product.
• Specifications are not uncertainties.
• Accuracy is not the same as uncertainty. Accuracy is a qualitative term, because the true value cannot be known. Uncertainty is quantitative.
• Errors are not the same as uncertainties.
Section Practices that Ensure Data Quality of Supplementary Material provides additional definitions of measurement uncertainty terms, suggestions for techniques to reduce uncertainty, and a detailed example of an uncertainty calculation. It also includes an example of the propagation of uncertainty into a derived value.
Current Research Gaps
The pursuit of homogeneous QA/QC processes for ocean observations is a never-ending task. Emerging standards often are generated in parallel by research institutes, and the idea that competitive efforts can give rise to faster generation of better standards cannot be discounted. It then falls to the operational entities to identify the standards to be used, which are quite often revised to serve operational capabilities. Once operational standards are in place, there is an inherent resistance to change – while researchers continue to generate new and better processes. It is the rare instance indeed where a community of researchers and operators work together to create a standard when none exist. Typically, the challenge is that multiple standards exist, and it takes years or decades to reach consensus on a common standard.
One approach to achieving consensus is to maintain strong interagency calibration, evaluation, and data re-analysis efforts. These should be conducted at all scales, from within an office to international collaborations.
Potential Future Developments in the Field
Instruments deployed in the field continue to gain more processing power, better data communications, improved power sources, and enhanced resistance to biofouling. These smarter devices will increasingly undertake roles in the QA and QC of the data they generate. Continued and expanded international efforts to develop standards of all types, including stable, broadly used QC standards, will spur manufacturers to begin implementing real-time QC and data flagging processes embedded within sensors and field components as described in Bushnell (2017). As the Internet of Things emerges, we can anticipate fully networked systems that are remotely and autonomously configurable.
Recommendations Summary
To summarize, the following over-arching recommendations are provided. The Supplementary Material portion of this paper contains more specific examples of QA record-keeping, check lists, maintenance recommendations, and further details about measurement uncertainty.
• Begin documentation of QA early. Often documents required for other purposes can be mined for content. Proposals, procurement justifications, and cruise plans may contain relevant QA information.
• Search for existing best practices at https://www.oceanbestpractices.org/ or elsewhere and reference them. If none exist, consider creating and submitting one that can be referenced for your future use.
• Identify and document reference standards and calibration processes.
• Describe maintenance efforts used to ensure instrument stability.
• Describe methods used to validate measurements (e.g., coincident samples).
• Create a measurement uncertainty statement to be included with other metadata.
Author Contributions
The concept and original design for this article came from CW. SS provided the extensive measurement uncertainty example EB provided much of the content regarding ISO standards. MB contributed to the portions derived from QARTOD. MT provided considerations from the perspective of ACT. JH and EH offered the content relevant to JCOMM. AL-L contributed thoughts from the IMOS point of view.
Funding
All authors were supported by their respective affiliations – specifically U.S. IOOS (ACT and QARTOD), University of Bremen, the PTB/Braunschweig and Berlin, SAEON, IOC/UNESCO, and the University of Tasmania.
Conflict of Interest
EB was employed by Buckley Environmental.
The remaining authors declare that the research was conducted in the absence of any commercial or financial relationships that could be construed as a potential conflict of interest.
Acknowledgments
We thank Dr. Brian Pellerin and Dan Sullivan of the United States Geological Service for their interest and suggestions early in this effort. We greatly appreciate the time and thoughtful suggestions provided by the Frontiers editors and reviewers.
Supplementary Material
The Supplementary Material for this article can be found online at: https://www.frontiersin.org/articles/10.3389/fmars.2019.00706/full#supplementary-material
Abbreviations
ACT, U.S. Integrated Ocean Observing System Alliance for Coastal Technology; CTD, Conductivity, temperature and depth; DO, Dissolved oxygen; EMSO, European Multidisciplinary Seafloor and water column Observatory; FIXO3, Fixed point Open Ocean Observatory; GUM, Guide to the Expression of Uncertainty in Measurement; IMOS, Integrated Marine Observing System; IOC, Intergovernmental Oceanographic Commission; IODE, International Oceanographic Data and Information Exchange; IOOS, Integrated Ocean Observing System; ISO, International Organization for Standardization; JCOMM, Joint Technical Commission for Oceanographic and Marine Meteorology; JERICO, Joint European Research Infrastructure Network for Coastal Observatories; GOOS, Global Ocean Observing System; GROOM, Gliders for Research Ocean Observation and Management; NIST, National Institute of Standards and Technology; OBPS, Ocean Best Practices System; OCG, Observation Coordination Group; ONC, Ocean Networks Canada; PSU, Practical Salinity Unit; QA, Quality Assurance; QARTOD, Quality Assurance/Quality Control of Real-Time Oceanographic Data; QC, Quality Control; SAEON, South African Environmental Observation Network; UNESCO, United Nations Educational, Scientific and Cultural Organization; WMO, World Meteorological Organization; WOCE, World Ocean Circulation Experiment.
Footnotes
- ^ https://www.atlantos-h2020.eu
- ^ https://cloud.ifremer.fr/index.php/s/ApswjzeVAZgQy1z?path=%2F2017_June_Transaltantic_workshop#pdfviewer
- ^ http://www.jcomm.info
- ^ http://www.act-us.info
- ^ https://ioos.noaa.gov/project/qartod
- ^ http://imos.org.au/
- ^ https://ioos.noaa.gov/project/qartod
- ^ https://www.nodc.noaa.gov/GTSPP/
- ^ https://www.esrl.noaa.gov/psd/data/gridded/reanalysis
- ^ http://www.wmo.int/pages/prog/arep/gaw/gaw_home_en.html
- ^ https://www.wmo.int/pages/prog/arep/cas/documents/1128-CAS-16_en.pdf
- ^ https://www.atlantos-h2020.eu/download/deliverables/7.1%20Data%20Harmonization%20Report.pdf
- ^ https://ioos.github.io/catalog/pages/architecture
- ^ http://www.argodatamgt.org/Documentation
- ^ https://www.oceanbestpractices.net
- ^ https://www.oceanbestpractices.org
- ^ https://www.frontiersin.org/research-topics/7173/best-practices-in-ocean-observing
References
Alliance for Coastal Technologies [ACT] (2012). Available at http://www.act-us.info/evaluations.php (accessed September 10, 2018).
American Association for Laboratory Accreditation, (2014). G104 - Guide for Estimation of Measurement Uncertainty in Testing. Frederick, MD: American Association for Laboratory Accreditation.
Bell, S. (1999). A Beginner’s Guide to Uncertainty of Measurement. Teddington: National Physical Laboratory.
BIPM (2008). JCGM 100:2008. Evaluation of measurement data - Guide to the Expression of Uncertainty in Measurement (GUM). Geneva: International Organization for Standardization.
BIPM (2012). JCGM 200:2012. International vocabulary of metrology - Basic and general concepts and associated (VIM) 3rd edition (2008 version with minor corrections). Geneva: International Organization for Standardization.
Bushnell, M. (2017). “Integration of QARTOD tests within a sensor: considerations for sensor manufacturers,” in Proceeding of the Oceans’17 Anchorage Conference MTS/IEEE, (Anchorage, AK: IEEE), 5.
Eurolab (2006). “Guide to the Evaluation of Measurement Uncertainty for Quantitative Test Results,” in Eurolab Technical Report No. 1, (Paris: Eurolab).
Harscoat, V., Pouliquen, S., and Atlantos Wp7 Partners representatives Of Networks and Integrators, (2016). Data Management Handbook Atlantos. D7.4. Kiel: Atlantos. doi: 10.13155/48139
Hidas, M. G., Proctor, R., Atkins, N., Atkinson, J., Besnard, L., Blain, P., et al. (2016). Information infrastructure for Australia’s Integrated Marine Observing System. Earth Sci Inform 9:525. doi: 10.1007/s12145-016-0266-2
IMOS (2017). Australian National Mooring Network, QA, QC and Product Summit SARDI, West Beach, Adelaide, South Australia. June 5-9. Available at: http://imos.org.au/fileadmin/user_upload/shared/ANMN/QC_Summit_2017/QC_Summit_Report_2017_FINAL_v2.pdf (accessed November 27, 2018).
Intergovernmental Oceanographic Commission of UNESCO (2013). Ocean Data Standards, Vol.3: Recommendation for a Quality Flag Scheme for the Exchange of Oceanographic and Marine Meteorological Data. Paris: Intergovernmental Oceanographic Commission of UNESCO.
International Organization for Standardization (2003). Geographic information – Metadata. Geneva: ISO/IEC.
Newton, J. A., Feely, R. A., Jewett, E. B., Williamson, P., and Mathis, J. (2014). Global Ocean Acidification Observing Network: Requirements and Governance Plan, 1st Edn. Available at http://www.pmel.noaa.gov/co2/GOA-ON/GOA-ON_Plan_v1.0_April2014.doc (accessed March 28, 2019).
Reverdin, G., Thierry, V., Utiz, J., D’Ortenzio, F., Bradshaw, E., and Pfeil, B. (2017). QC Report. AtlantOS Project. Keil: AtlantOS.
Schlitzer, R. (2013). Ocean Quality Flag Schemes and Mapping between Them, Version 1.4. Bremerhaven: Alfred Wegener Institute for Polar and Marine Research.
Simpson, P., Pearlman, F., and Pearlman, J. (eds) (2017). “Evolving and sustaining ocean best practices workshop, 15 – 17 November 2017, intergovernmental oceanographic commission,” in Proceedings of the AtlantOS/ODIP/OORCN Ocean Best Practices Working Group, Paris, 74. doi: 10.25607/OBP-3
Takawano, T. (ed.) (2018). Guideline of Ocean Observations, 3rd Edn. Tokyo: The Oceanographic Society of Japan, 1–10.
U. S. Integrated Ocean Observing System (2014). Manual for Real-Time Quality Control of Water Level Data Version 2.0: A Guide to Quality Control and Quality Assurance of Water Level Observations. Silver Spring, MD: U. S. Integrated Ocean Observing System, 43. doi: 10.7289/V5QC01Q7
U. S. Integrated Ocean Observing System (2015a). Manual for Real-Time Quality Control of Dissolved Oxygen Observations Version 2.0: A Guide to Quality Control and Quality Assurance for Dissolved Oxygen Observations in Coastal Oceans. Silver Spring, MD: U. S. Integrated Ocean Observing System, 48. doi: 10.7289/V5ZW1J4J
U. S. Integrated Ocean Observing System (2015b). Manual for Real-Time Quality Control of In-Situ Current Observations Version 2.0: A Guide to Quality Control and Quality Assurance of Acoustic Doppler Current Profiler Observations. Silver Spring, MD: U. S. Integrated Ocean Observing System, 51. doi: 10.7289/V5WM1BMZ
U. S. Integrated Ocean Observing System (2015c). Manual for Real-Time Quality Control of In-Situ Temperature and Salinity Data Version 2.0: A Guide to Quality Control and Quality Assurance of In-Situ Temperature and Salinity Observations. Silver Spring, MD: U. S. Integrated Ocean Observing System, 56. doi: 10.7289/V5V40SD4
U. S. Integrated Ocean Observing System (2015d). Manual for Real-Time Quality Control of In-Situ Surface Wave Data Version 2.1: A Guide to Quality Control and Quality Assurance of In-Situ Surface Wave Observations. Silver Spring, MD: U. S. Integrated Ocean Observing System, 64. doi: 10.7289/V5KK991T
U. S. Integrated Ocean Observing System (2015e). U.S IOOS QARTOD Project Plan - Accomplishments for 2012–2016 and Update for 2017–2021. Silver Spring, MD: U. S. Integrated Ocean Observing System, 47. doi: 10.7289/V5JQ0Z71
U. S. Integrated Ocean Observing System (2016). Manual for Real-Time Quality Control of High Frequency Radar Surface Currents Data Version 1.0: A Guide to Quality Control and Quality Assurance of High Frequency Radar Surface Currents Data Observations. Silver Spring, MD: U. S. Integrated Ocean Observing System, 58. doi: 10.7289/V5T43R96
U. S. Integrated Ocean Observing System (2017a). Manual for the Use of Real-Time Oceanographic Data Quality Control Flags, Version 1.1. Silver Spring, MD: U. S. Integrated Ocean Observing System, 43. doi: 10.7289/V5B56GZJ
U. S. Integrated Ocean Observing System (2017b). Manual for Real-Time Quality Control of Ocean Optics Data Version 1.1: A Guide to Quality Control and Quality Assurance of Coastal and Oceanic Optics Observations. Silver Spring, MD: U. S. Integrated Ocean Observing System, 49. doi: 10.7289/V5XW4H05
U. S. Integrated Ocean Observing System (2017c). Manual for Real-Time Quality Control of Passive Acoustics Data Version 1.0: A Guide to Quality Control and Quality Assurance of Passive Acoustics Observations. Silver Spring, MD: U. S. Integrated Ocean Observing System, 45. doi: 10.7289/V5PC30M9
U. S. Integrated Ocean Observing System (2017d). Manual for Real-Time Quality Control of Phytoplankton Data Version 1.0: A Guide to Quality Control and Quality Assurance of Phytoplankton Data Observations. Silver Spring, MD: U. S. Integrated Ocean Observing System, 67. doi: 10.7289/V56D5R6S
U. S. Integrated Ocean Observing System (2017e). Manual for Real-Time Quality Control of Wind Data Version 1.1: A Guide to Quality Control and Quality Assurance of Coastal and Oceanic Wind Observations. Silver Spring, MD: U. S. Integrated Ocean Observing System, 47. doi: 10.7289/V5FX77NH
U. S. Integrated Ocean Observing System (2018a). Manual for Real-Time Quality Control of Dissolved Nutrients Data Version 1.1: A Guide to Quality Control and Quality Assurance of Coastal and Dissolved Nutrients Observations. Silver Spring, MD: U. S. Integrated Ocean Observing System, 56. doi: 10.7289/V5TT4P7R
U. S. Integrated Ocean Observing System (2018b). Manual for Real-Time Quality Control of Stream Flow Data Version 1.0: A Guide to Quality Control and Quality Assurance of Stream Flow Observations in Rivers and Streams. Silver Spring, MD: U. S. Integrated Ocean Observing System, 45. doi: 10.25923/gszc-ha43
Keywords: quality assurance, quality control, measurement uncertainty, ocean best practices, best practices
Citation: Bushnell M, Waldmann C, Seitz S, Buckley E, Tamburri M, Hermes J, Henslop E and Lara-Lopez A (2019) Quality Assurance of Oceanographic Observations: Standards and Guidance Adopted by an International Partnership. Front. Mar. Sci. 6:706. doi: 10.3389/fmars.2019.00706
Received: 13 July 2019; Accepted: 04 November 2019;
Published: 19 November 2019.
Edited by:
Marlon R. Lewis, Dalhousie University, CanadaReviewed by:
Oscar Schofield, Rutgers, The State University of New Jersey, United StatesFabien Roquet, University of Gothenburg, Sweden
Copyright © 2019 Bushnell, Waldmann, Seitz, Buckley, Tamburri, Hermes, Henslop and Lara-Lopez. This is an open-access article distributed under the terms of the Creative Commons Attribution License (CC BY). The use, distribution or reproduction in other forums is permitted, provided the original author(s) and the copyright owner(s) are credited and that the original publication in this journal is cited, in accordance with accepted academic practice. No use, distribution or reproduction is permitted which does not comply with these terms.
*Correspondence: Mark Bushnell, bWFyay5idXNobmVsbEBub2FhLmdvdg==