 Brittany T. Trew1
 Hedley S. Grantham2*
 Christian Barrientos3
 Tim Collins4
 Philip D. Doherty1Angela Formia5
 Brendan J. Godley1
 Sara M. Maxwell6Richard J. Parnell7Stephen K. Pikesley1Dominic Tilley1
 Matthew J. Witt8
 Kristian Metcalfe1*
- 1Centre for Ecology and Conservation, College of Life and Environmental Sciences, University of Exeter, Penryn Campus, Penryn, United Kingdom
- 2Wildlife Conservation Society, Global Conservation Program, Bronx, NY, United States
- 3Wildlife Conservation Society, Equatorial Guinea Program, Bata, Equatorial Guinea
- 4Wildlife Conservation Society, Marine Program, Bronx, NY, United States
- 5Wildlife Conservation Society, Gulf of Guinea Sea Turtle Program, Libreville, Gabon
- 6School of Interdisciplinary Arts and Sciences, University of Washington Bothell, Bothell, WA, United States
- 7Wildlife Conservation Society, Gabon Program, Libreville, Gabon
- 8Environmental Biology Group, College of Life and Environmental Sciences, Hatherly Laboratories, University of Exeter, Exeter, United Kingdom
Marine biodiversity is under extreme pressure from anthropogenic activity globally, leading to calls to protect at least 10% of the world’s oceans within marine protected areas (MPAs) and other effective area-based conservation measures. Fulfilling such commitments, however, requires a detailed understanding of the distribution of potentially detrimental human activities, and their predicted impacts. One such approach that is being increasingly used to strengthen our understanding of human impacts is cumulative impact mapping; as it can help identify economic sectors with the greatest potential impact on species and ecosystems in order to prioritize conservation management strategies, providing clear direction for intervention. In this paper, we present the first local cumulative utilization impact mapping exercise for the Bioko-Corisco-Continental area of Equatorial Guinea’s Exclusive Economic Zone – situated in the Gulf of Guinea, one of the most important and least studied marine regions in the Eastern Central Atlantic. This study examines the potential impact of ten direct anthropogenic activities on a suite of key marine megafauna species and reveals that the most suitable habitats for these species, located on the continental shelf, are subject to the highest threat scores. However, in some coastal areas, the persistence of highly suitable habitat subject to lower threat scores suggests that there are still several strategic areas that are less impacted by human activity that may be suitable sites for protected area expansion. Highlighting both the areas with potentially the highest impact, and those with lower impact levels, as well as particularly damaging activities can inform the direction of future conservation initiatives in the region.
Introduction
Globally, marine ecosystems play a critical role in supporting human well-being, providing numerous services such as food, livelihood and recreational opportunities (Halpern et al., 2012; Spalding et al., 2014; Barbier, 2017). However, these ecosystems face a multitude of pressures from human activities (Halpern et al., 2008), which have altered marine communities, impacted ecosystem health and eroded their capacity to provide benefits for local communities (Halpern et al., 2012). In response, ecosystem-based management (EBM), and marine spatial planning (MSP) are increasingly advocated to manage human activities in the marine environment. Marine protected areas (MPA) are one such spatial management tool within these frameworks promoted to conserve marine biodiversity (Klein et al., 2008), maintain large-scale ecological processes (Olds et al., 2012), and support the sustainable use of marine resources (Lester et al., 2009).
International commitments to protect 10% of coastal and marine areas within MPAs by 2020 (CBD, 2010) along with greater awareness of the potential benefits of MPAs for local livelihoods, and marine biodiversity, has led to a 10-fold increase in MPA coverage since 2000 (Watson et al., 2014). However, effective MPAs need to be well designed and managed, which requires an understanding of the location and overall human impact on marine habitats, ecosystems and species. Consequently, there is increasing emphasis on spatially representing the distribution, intensity, frequency and seasonality of potentially damaging processes through threat maps (Tulloch et al., 2015). These maps are regularly used as part of decision-making processes, as well as to inform decisions regarding where to prioritize and target conservation efforts and funding (Myers et al., 2000; Salafsky and Margoluis, 2003).
Whilst numerous approaches to threat mapping exist (Tulloch et al., 2015), there is a growing consensus that management of marine ecosystems must focus on multiple or cumulative human stressors, rather than single stressors (Halpern and Fujita, 2013; Brown et al., 2014). The most commonly used approach to map cumulative impacts requires: (1) mapping the spatial distribution and intensity of each anthropogenic activity (e.g., pollution or fishing); (2) mapping the location of each conservation feature, such as habitat, ecosystem or species; (3) applying a vulnerability weight that translates the intensity of an activity into its predicted impact on each feature, creating a single threat impact score; and (4) summing across activities to produce a cumulative impact score (Lombana et al., 2007; Halpern et al., 2008; Teck et al., 2010; Halpern and Fujita, 2013). This approach has been used to quantify and map cumulative human impacts on marine ecosystems and species at global (Halpern et al., 2008, 2010, 2012) and regional scales (Ban and Alder, 2008; Halpern et al., 2009; Selkoe et al., 2009; Ban et al., 2010; Foden et al., 2011; Korpinen et al., 2012; Maxwell et al., 2013; Micheli et al., 2013).
Most regional cumulative impact assessments though are not focused on the most imperiled ecosystems, regions, species or populations (Halpern et al., 2008, 2012), and have largely been restricted to well-studied, data rich developed countries in Europe and North America. In many biodiversity rich developing countries, where there are lower levels of marine protection and capacity (Marinesque et al., 2012; Watson et al., 2014) there is a limited understanding of the scale of impact (particularly derived from local stressors). Consequently, there is limited knowledge on where to efficiently allocate limited resources to ensure effective conservation outcomes where biodiversity threat data is most needed (Joppa et al., 2016).
One such example where there is insufficient biodiversity threat data is Equatorial Guinea, located in the Gulf of Guinea (Lombana et al., 2007). This is a globally important region that hosts some of the highest concentrations of relatively rare or range-restricted and threatened marine species such as sea turtles, elasmobranchs and marine mammals (Lucifora et al., 2011; Selig et al., 2014; Polidoro et al., 2017). For instance, some of the most important sea turtle rookeries globally are located in the Gulf of Guinea (Witt et al., 2009; Metcalfe et al., 2015) with the southern beaches of Bioko Island in Equatorial Guinea recording significant densities of leatherback, hawksbill, green and olive ridley sea turtles during the nesting season (Butynski, 1996; Fretey et al., 2007; Tomás et al., 2010; Honarvar et al., 2016). The coastal waters of the Gulf of Guinea also support key life history stages for numerous cetacean species (Weir, 2010; Weir et al., 2011). For example, this region provides important wintering, breeding and calving habitat for humpback whales (Rosenbaum and Collins, 2006; Rosenbaum et al., 2014), as well as vital foraging habitat for the Atlantic humpback dolphin (Weir et al., 2011; Collins, 2015; Weir and Collins, 2015).
Equatorial Guinea is also situated within the Guinea Current Large Marine Ecosystem (GCLME), a highly productive ecosystem that hosts some of the most productive coastal and offshore waters for fisheries in the world (Aryeetey, 2002; Ukwe et al., 2003). This region, in particular, also has substantial oil and gas reserves, which are vital to national economies (Frynas, 2004). Marine species across this region are therefore subject to a range of pressures such as incidental capture (bycatch) in fisheries, direct take (e.g., of eggs, meat or other products), as well as coastal development, habitat loss and pollution linked to the expansion of the offshore oil and gas sector, and population growth (Formia et al., 2003; Weir and Pierce, 2013; Metcalfe et al., 2017; Metcalfe et al., in press).
Mapping the potential cumulative impacts of multiple stressors on important marine megafauna in Equatorial Guinea is considered a national priority, and essential to fulfilling commitments to the Convention on Biological Diversity’s Strategic Plan for Biodiversity (CBD, 2010) and the United Nations Sustainable Development goals (Griggs et al., 2013; United Nations, 2015). However, given that only 0.24% of Equatorial Guinea’s waters are protected as of 2019 (UNEP-WCMC, 2019) it is highly unlikely that the government will meet the 10% goal by 2020. This study therefore aims to support evidenced-based decisions and science-informed policy to help bring actionable insights as to where conservation actions are needed – a key objective beyond 2020 set by the UN Decade of Ocean Science for Sustainable Development 2021–2030 (UN, 2018). As this region is relatively understudied and data poor, our specific goals were to: (1) predict the relative suitability of habitats for a suite of marine species across the Gulf of Guinea using presence data from neighboring countries (see: Redfern et al., 2013); (2) spatially map local stressors (i.e., individual human activities) with presumed impact weightings for focal marine megafauna; (3) map cumulative impacts on marine megafauna species using a cumulative impact mapping approach developed by Maxwell et al. (2013) to identify at-risk, high biodiversity areas for targeted conservation and mitigation efforts, as well as low-risk, high biodiversity areas that may be suitable candidates for MPAs; and (4) identify which human activities are having the greatest influence on cumulative utilization impact scores and are therefore posing the greatest threat to marine megafauna species.
Materials and Methods
Habitat Suitability Modeling
Equatorial Guinea’s exclusive economic zone (EEZ) is divided into two regions, with the Bioko-Corisco-Continental area covering approximately 58,000 km2 (18%) and Annobón Island (Pagalu) covering approximately 50,700 km2 (82%) of its waters. This study focuses on the Bioko-Corisco-Continental area (Figure 1). Whilst Equatorial Guinea is known to host globally important populations of sea turtles, whales and dolphins, fine-scale species distribution maps and comprehensive sighting data are largely non-existent. To address this gap we used an Ensemble Ecological Niche Modeling (EENM) approach to predict the relative suitability of habitats for five species of marine megafauna from two species guilds (marine mammals and marine turtles) using location data available from neighboring countries within the Gulf of Guinea as surrogates (Redfern et al., 2017). These species have a variety of ecological roles, life histories and global conservation statuses, and include: the bottlenose dolphin (Tursiops truncates) and humpback whale (Megaptera novaeangliae), listed by IUCN as Least Concern, the leatherback (Dermochelys coriacea) and olive ridley (Lepidochelys olivacea) sea turtle listed as Vulnerable, and the Atlantic humpback dolphin (Sousa teuzii) listed as Critically Endangered (IUCN, 2018).
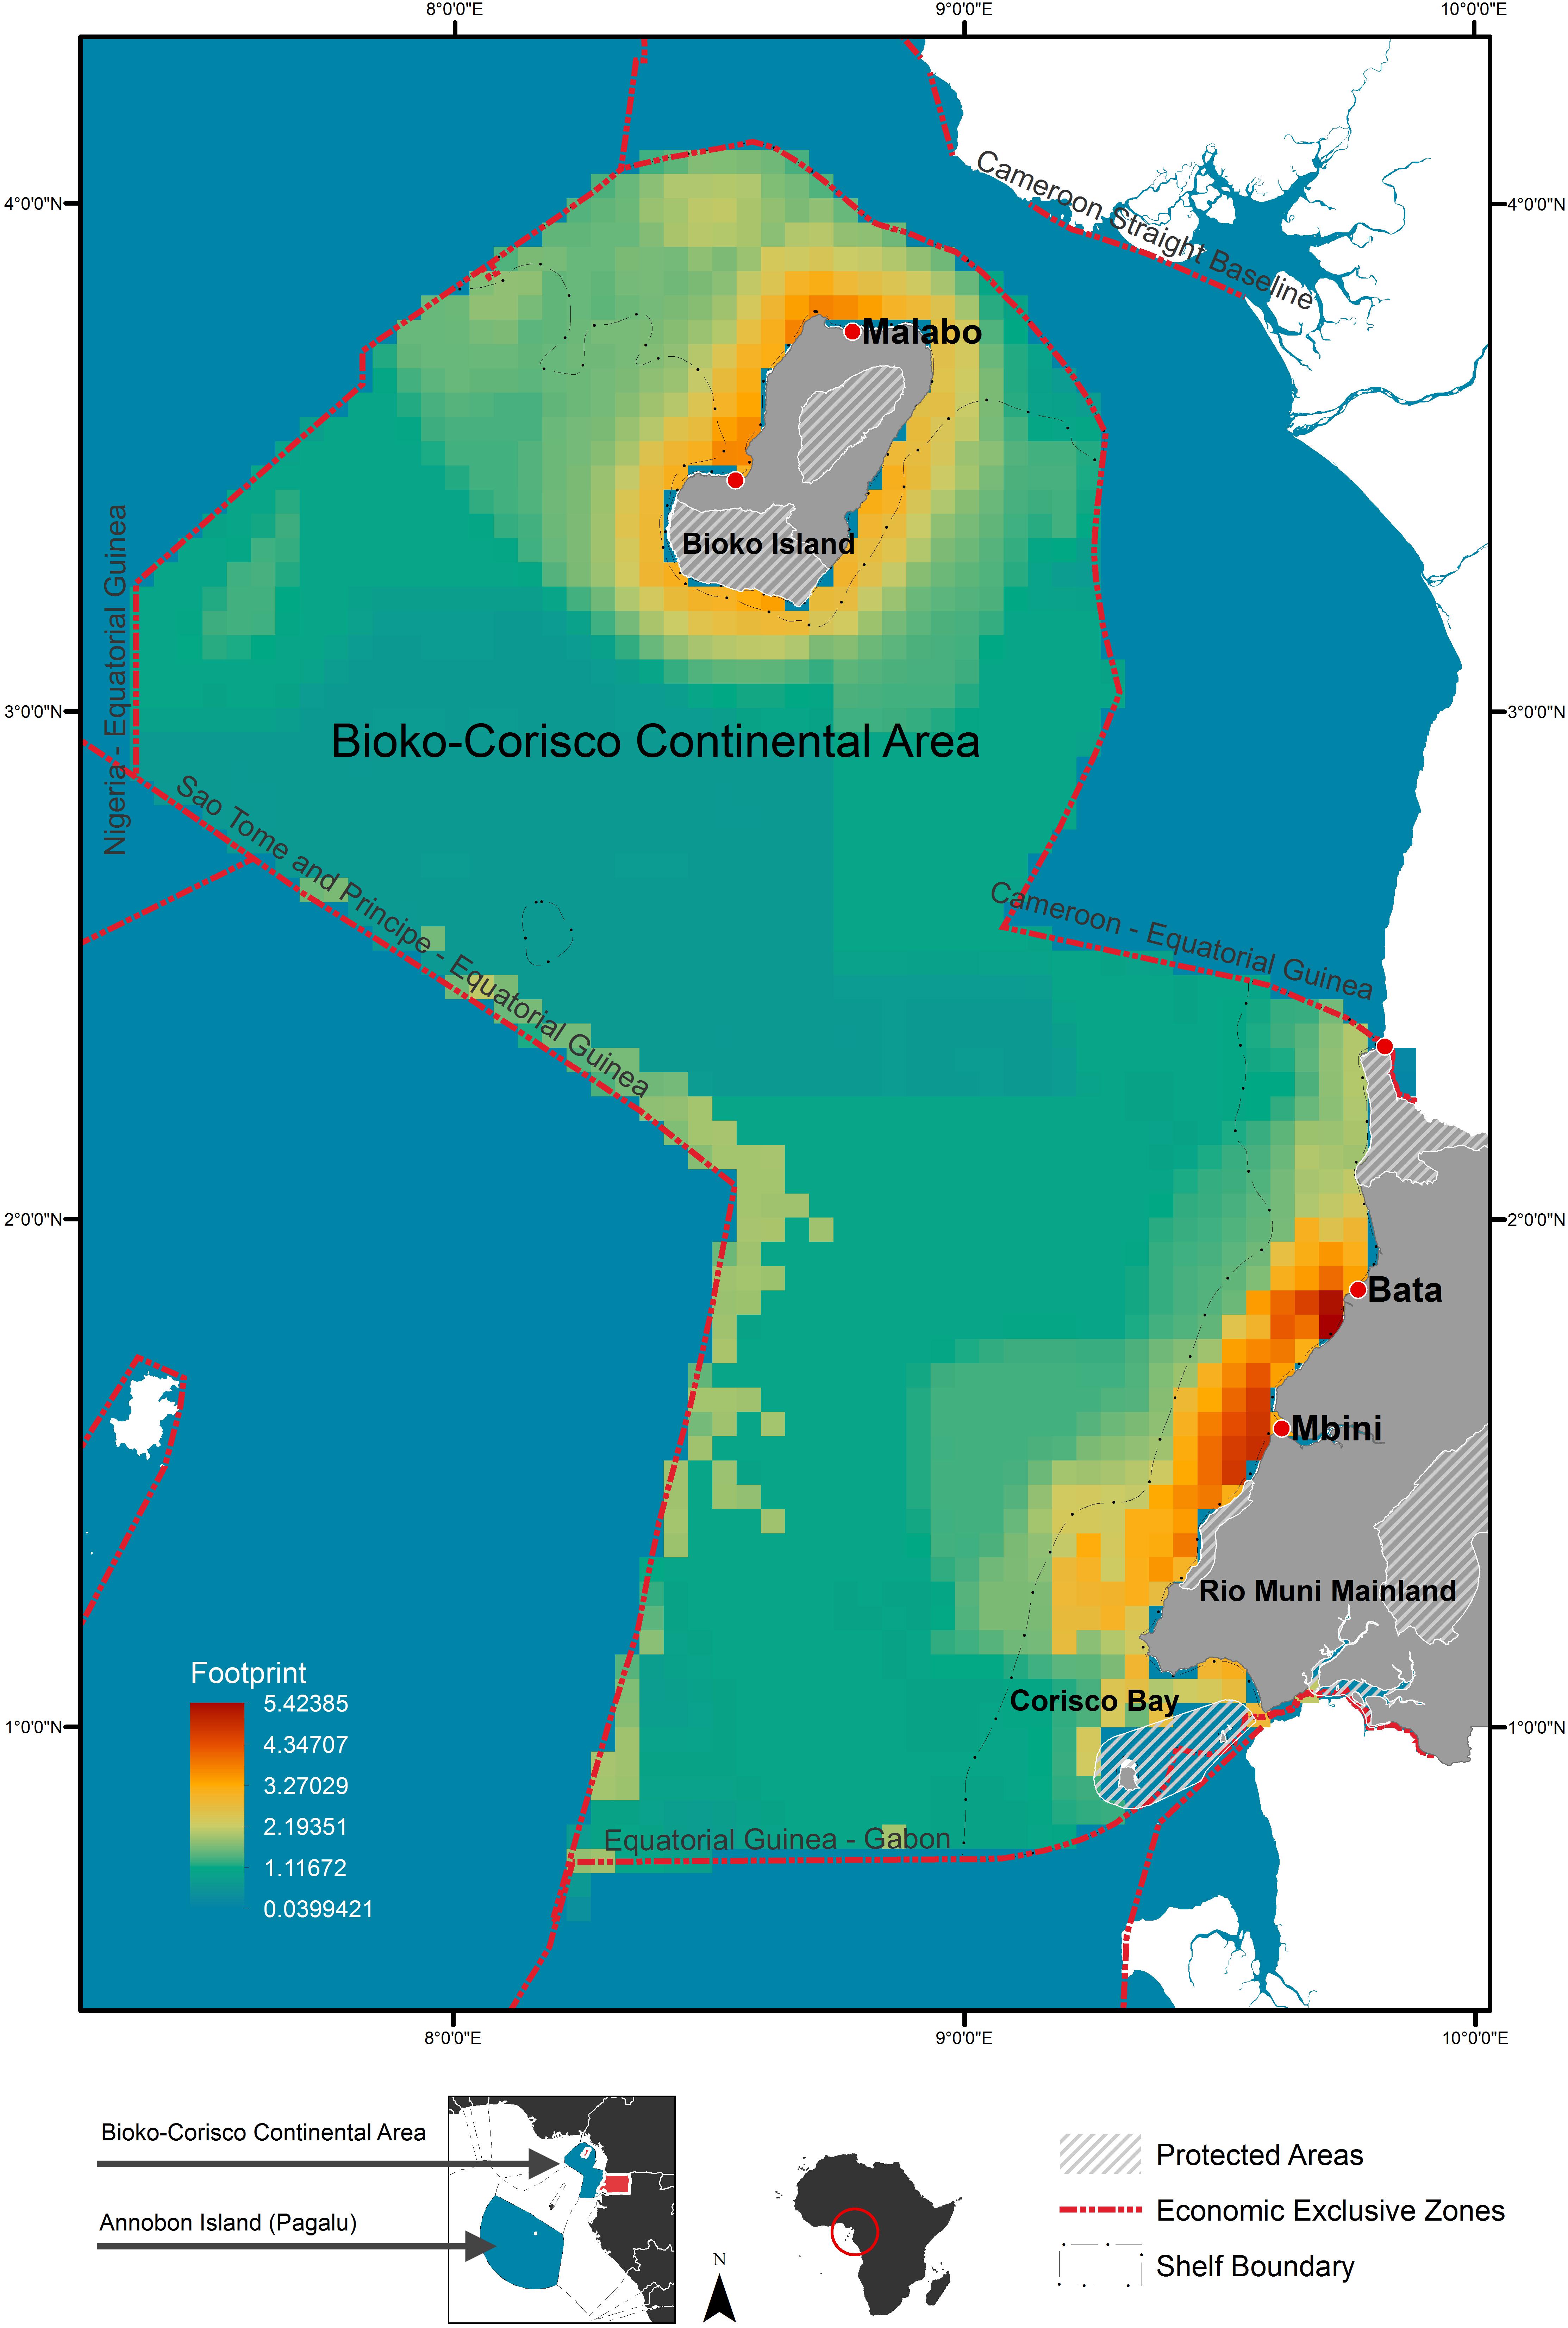
Figure 1. Context map for the economic exclusive zone (EEZ) of Equatorial Guinea with anthropogenic footprint scores. Shows major towns/cities and current protected areas; including terrestrial and marine reserves.
For leatherback and olive ridley sea turtles, location data were derived from platform transmitter terminals (PTT) attached to nesting females in Gabon (olive ridley: n = 60 individuals; leatherback: n = 37 individuals); attachment and tag details provided in previously published studies (Witt et al., 2008, 2011; Maxwell et al., 2011; Pikesley et al., 2013; Dawson et al., 2017). Satellite telemetry data were collected using the Argos satellite system (CLS, 2016) and downloaded with the Satellite Tracking and Analysis Tool [STAT; Coyne and Godley (2005)]. For each PTT all positions with a location class (LC) Z and 0 were removed (i.e., invalid locations, or locations with an estimated error >1,500 m, respectively) (CLS, 2016), and inter-nesting locations extracted by manually determining the final nesting event for each female (this being the night-time location with the highest accuracy class and located on, or nearest to land during the nesting season). Only inter-nesting locations were considered, as the migratory and foraging data available did not alter the overall habitat suitability. A user-defined speed threshold (>5 km/h) and azimuth filter (<20 degrees) was then applied to remove implausible Argos locations (Witt et al., 2010; Freitas, 2012) using the argosfilter package in R (R Core Team, 2016). For each PTT, location data were then resolved to single daily best (highest) quality locations, as per Witt et al. (2010). If more than one location was determined with equal quality within the 24-h period, the first location was retained. This data reduction technique implemented in many animal movement studies was adopted to minimize spatial and temporal autocorrelation that inherently exists within such data sets (De Solla et al., 1999). The final inter-nesting dataset was thus comprised of location data from 49 olive ridley (n = 989 daily locations), and 32 leatherback sea turtles (n = 1,433 daily locations).
For cetaceans, location data were restricted to records obtained from beach, boat and aerial surveys conducted in Gabon and the Republic of Congo between 2000 and 2013 as detailed in Collins et al. (2010) and Strindberg et al. (2011), as well as new, unpublished data (source T. Collins). Due to temporal limitations in availability of remotely sensed data prior to 2003 we only used data collected between 2003 and 2013. The resulting dataset was comprised of 2,142 records of humpback whales, 227 records of bottlenose dolphins and 254 records of the Atlantic humpback dolphin.
Spatially and temporally coincident environmental data were extracted using the raster package in R (Hijmans et al., 2016; R Core Team, 2016). These datasets were: (1) General Bathymetric Chart of the Oceans (GEBCO) gridded bathymetric depth (m) data (resolution 0.008 degrees) obtained from: www.gebco.net, (2) seabed slope (as a percentage), derived from depth data (resolution 0.008 degrees), (3) monthly averaged chlorophyll-A (chlA; resolution 0.041 degrees) obtained from: https://podaac.jpl.nasa.gov/), (4) monthly averaged MODIS L3 night-time Sea Surface Temperature (SST in°C; resolution 0.041 degrees) obtained from: https://podaac.jpl.nasa.gov/, and (5) SST derived frontal activity. Frontal activity for the study area was modeled using Marine Geospatial Ecological Tools (Roberts et al., 2010). A minimum frontal edge detection threshold of 0.5°C (SST) was applied to daily MODIS L3 night time SST (°C) data using the Cayula and Cornillon Single Image Edge Detection (SIED) algorithm (Cayula and Cornillon, 1992). Daily SST frontal activity rasters were then aggregated into monthly rasters with cumulative totals for daily frontal activity (resolution 0.041 degrees). All environmental data layers were resampled using bilinear interpolation to match the coarsest resolution of the environmental data (0.041 degrees; equivalent to 4 km latitude × 4 km longitude), and the mean of the monthly data for chlA, SST and SST frontal activity was taken as the long-term yearly (cetacean) or seasonal (turtles) products (Supplementary Table S1). To test for correlation within these data a random sample of 100 locations for each set of species-specific location data, was generated and coincident environmental data extracted for each location. A Spearman’s rank correlation test was then calculated for all unique combinations of environmental variables.
The modeling approach followed that detailed in Pikesley et al. (2015). Three modeling algorithms were applied [Generalized Linear Model (GLM), Generalized Additive Model (GAM) and Boosted Regression Tree (BRT)] within the biomod2 package in R Thuiller et al. (2014) and R Core Team, 2016 to produce species specific Ensemble Ecological Niche Models (EENMs). We prescribed the modeling area to be within latitudes N 21°, S 35°, and longitudes W 30°, E 20° (WGS84). The response variables were binary, either “presence” described by our location data, or “pseudo-absences” randomly generated within the modeling extent. For each model an equal number of pseudo-absences to location data were generated with no prescribed minimum or maximum distance to presence locations. All models were run using 10-fold cross validation with a 75/25% random spilt of the location data for calibration, and model testing, respectively. Model performance was evaluated using five metrics. To evaluate model uncertainties, within and between models, all evaluation metrics were scaled to the range 0 to 1. Species-specific model evaluation metrics were concordant across models (Supplementary Table S2); therefore, we combined our ENMs to form species-specific ensemble projections using an un-weighted average. These EENMs described the relative suitability (RS) of habitats, scaled between 0 and 1, where 0.5 represents areas of typical habitat suitability, 0 represents lowest suitability and 1 indicates greatest suitability. To investigate spatial autocorrelation within model residuals we calculated Moran’s I coefficients for each of our EENMs (Dormann et al., 2007), which indicated no spatial autocorrelation; humpback dolphin z = 0.46, p = 0.64, bottlenose dolphin z = 0.99, p = 0.32, humpback whale z = 0.14, p = 0.88, leatherback z = 0.03, p = 0.97 and olive ridley z = 0.01, p = 0.99.
Cumulative Impact Distribution
To determine the impact of human activities in Equatorial Guinea’s EEZ, we used a combination of publicly available data, and data derived from a range of unpublished studies conducted in country (source: Wildlife Conservation Society), resulting in spatial information for eight different local anthropogenic activities (Table 1). A number of different stressor layers were assigned to each of the eight local anthropogenic activities which included: (1) coastal accessibility; (2) coastal waste; (3) nutrient run-off; (4) ocean-based pollution; (5) hydrocarbon exploitation and production; (6) shipping; (7) artisanal fishing; and (8) industrial fishing, as per Halpern et al. (2008). These activities were also grouped into three different categories: fishing, pollution, and industrial activity (Table 1). An intensity score was calculated by summing corresponding stressor layers for each activity, which were then rescaled between 0 and 1, and resampled to match the resolution of the habitat suitability models (4 km × 4 km).
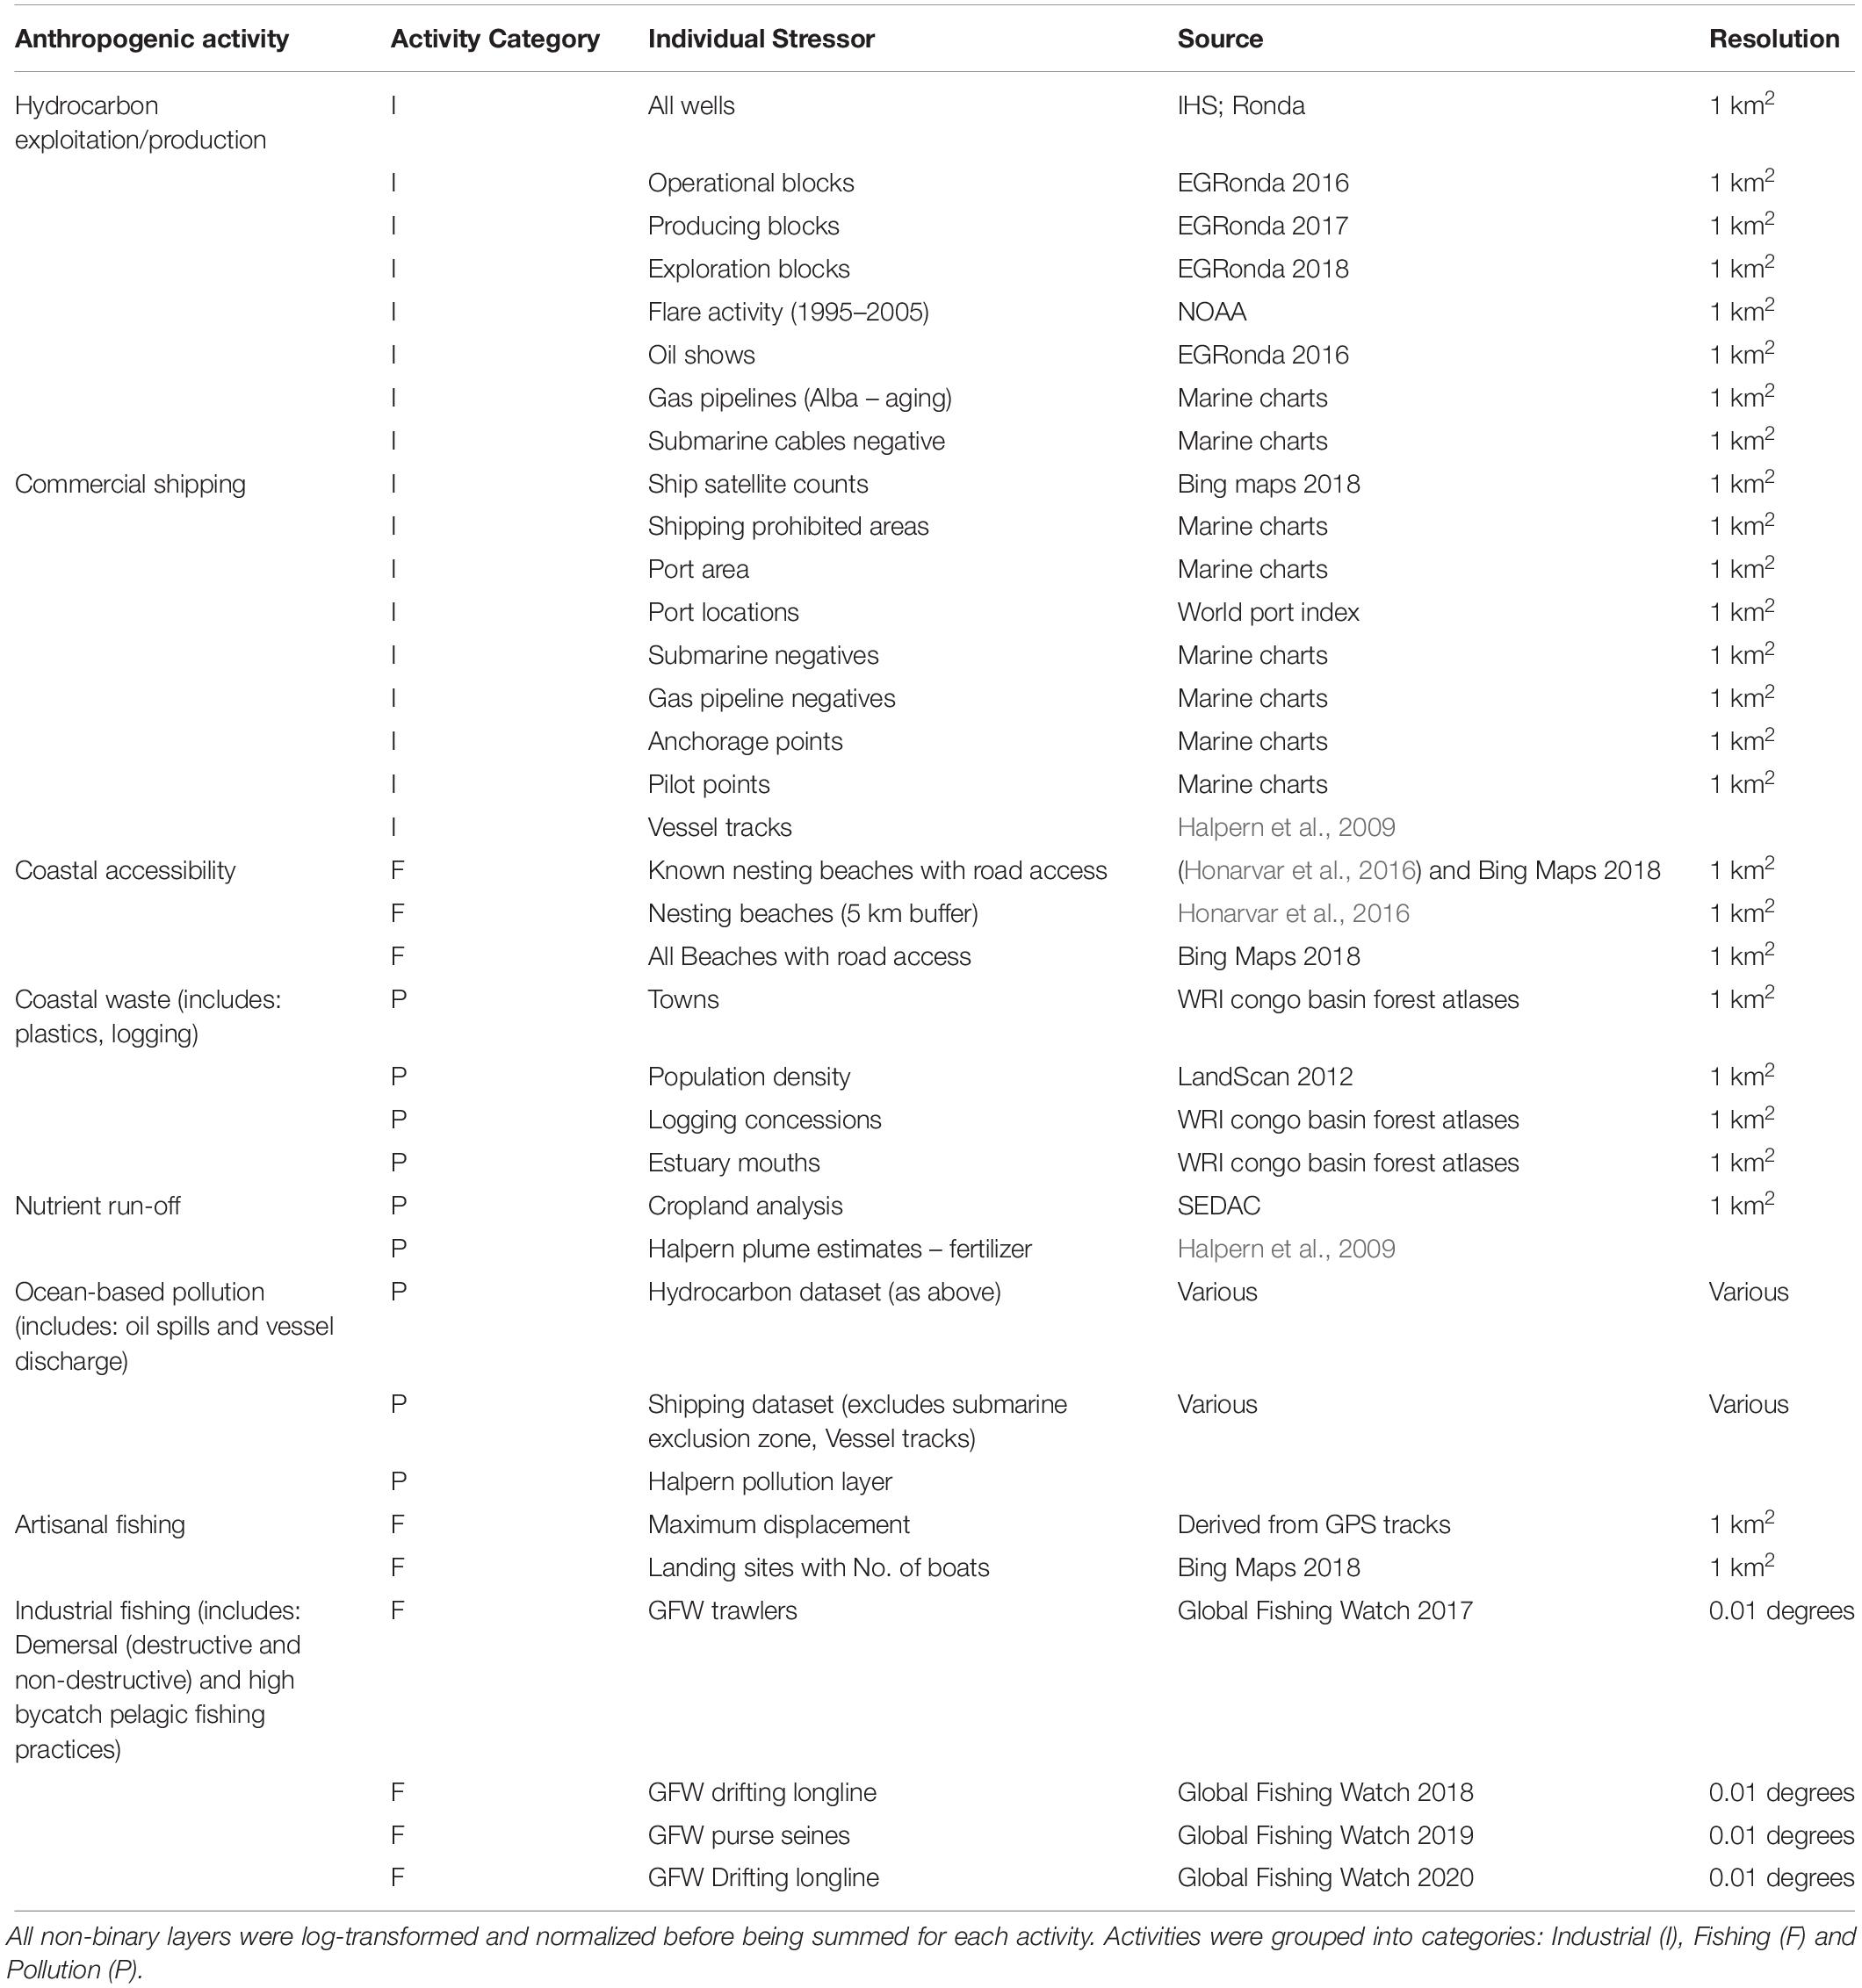
Table 1. Details of data for anthropogenic drivers used in the analyses, including source.
To predict areas where species are potentially at greatest risk to impacts associated with human activities, we calculated cumulative impact scores for each anthropogenic activity, whereby each activity was weighted by the vulnerability of the species to said activity. These vulnerability weightings were based on measures derived by Maxwell et al. (2013), and included: (1) stressor frequency; (2) whether the impact was direct or indirect; (3) the likelihood of mortality to the individual upon impact; (4) the recovery time of the individual after impact; (5) reproductive consequences of impact; and (6) relative impact on the species’ wider population (Supplementary Table S3). A review of the current literature was undertaken to assess the scores for species included in this study and shared with regional experts. There was no evidence to change humpback whale measure rankings from those of Maxwell et al. (2013). Sea turtle rankings were revised for the context of this study in Equatorial Guinea. For example, the risk of bycatch in countries with little regulation or enforcement is likely higher than in nations with longer histories of more effective marine management (e.g., Casale et al., 2017). Additionally, coastal accessibility is considered a higher threat to sea turtles in Equatorial Guinea with many coastal communities depending on turtle meat and eggs to supplement fishing catches (Tomás et al., 2010; Honarvar et al., 2016). Artisanal fishing was also included as this activity is linked to high levels of marine mammal and sea turtle bycatch in Africa (Moore et al., 2009). In utilizing vulnerability weightings, we are assuming that regional experts surveyed were able to provide accurate and representative conclusions on the vulnerability of the study species to particular stressors (see Halpern and Fujita, 2013).
The vulnerability measures for each anthropogenic activity (Supplementary Table S3), were then summed and rescaled between 0 and 1 to obtain a vulnerability weighting for each anthropogenic activity for each species (Supplementary Table S4). Vulnerability weightings for each anthropogenic activity were then multiplied by the value of intensity of the corresponding anthropogenic activity within each cell to determine its predicted impact (Eq. 1), per Maxwell et al. (2013).
Where, Si is the intensity of an anthropogenic activity i, and Vi,j is the vulnerability weighting for anthropogenic activity i on species j.
Cumulative Utilization and Impact (CUI) Distribution
To determine the potential impact of anthropogenic activity (CUI scores) in Equatorial Guinea’s EEZ, the cumulative impact (CI) scores (intensity of an anthropogenic activity weighted by its corresponding vulnerability) were summed and multiplied by the relative habitat suitability scores (Eq. 2) for individual species (n = 5), and species groups (n = 3; all marine megafauna; marine mammals and sea turtles), per Maxwell et al. (2013).
Whereby Si is the intensity of anthropogenic activity i, Vi,j is the vulnerability weighting for anthropogenic activity i on species j, and Uj is the relative habitat suitability for species j for a given cell.
To determine which anthropogenic activity had the greatest effect, and to identify the anthropogenic activity that requires the greatest mitigation, we calculated the influence of individual activity CUI scores (for example, artisanal fishing) on the overall CUI scores for each species group (n = 3) and individual species (n = 5). To do this we used pairwise linear regression to determine how well each anthropogenic activity’s CUI scores were able to predict the pattern of the overall CUI. Combined species CUI distributions were also calculated for groups of similar stressor types (fishing, pollution and industrial categories; Supplementary Figure S1). These CUI distributions can highlight specific activities that require targeted intervention. To help inform efforts to identify potential locations for MPA expansion we extracted cells from overall CUI scores which had both low impact (CUI scores ≤ 50%) and high relative habitat suitability (RS ≥ 75%).
Finally, we made comparisons between the (<200 m depth) and off-shelf (>200 m depth) means of the relative habitat suitability, cumulative impact (CI) and cumulative utilization and impact (CUI) scores for each species group and individual species using Welch’s t-tests and assuming unequal variances. These comparisons were chosen as marine biodiversity has been shown to concentrate in tropical coastal and shelf waters, with higher productivity and species richness than offshore waters (Selig et al., 2014). This method was repeated to compare means within and outside of the existing MPA within Equatorial Guinea’s EEZ, to determine the relative threat to the current MPA and potential opportunities for MPA expansion. The distribution of CUI scores was also investigated across individual species through density plots of per-pixel CUI scores. Density plots were necessary to understand the spread of CUI scores visually, as opposed to binned histogram analysis, due to the continuous nature of the CUI scores. Both the MPA analysis and the density plots were limited to the continental shelf as the focus of the study has been guided by on-shelf/off-shelf comparisons and statistical tests which confirmed that distributions are highly concentrated on the continental shelf.
Results
Habitat Suitability Models
The EENMs revealed that suitable habitat (defined as RS > 0.5) for all species (Atlantic humpback dolphin, bottlenose dolphin, humpback whale, leatherback and olive ridley sea turtle) were concentrated in the waters surrounding the Rio Muni mainland, Corisco Bay, and Bioko Island (Figure 2). The mean relative suitability of habitats was greatest in the shallow (<200 m) waters of the continental shelf for all species (Table 2). The exception, however, was the leatherback sea turtle, where high levels of habitat suitability were predicted across both territorial and offshore waters (Figure 2). Depth was the most important contributory variable across species with mean relative importance of the contribution to the model coefficients (RICC) that ranged between 0.52 for olive ridley sea turtles to 0.90 for the bottlenose dolphin (Supplementary Table S5). For species groups (that is, all marine megafauna, marine mammals and sea turtles) similar trends were evident with the highest levels of suitable habitat located in continental shelf waters along the mainland, and in the waters surrounding Corisco Bay and Bioko Island (Figure 3).
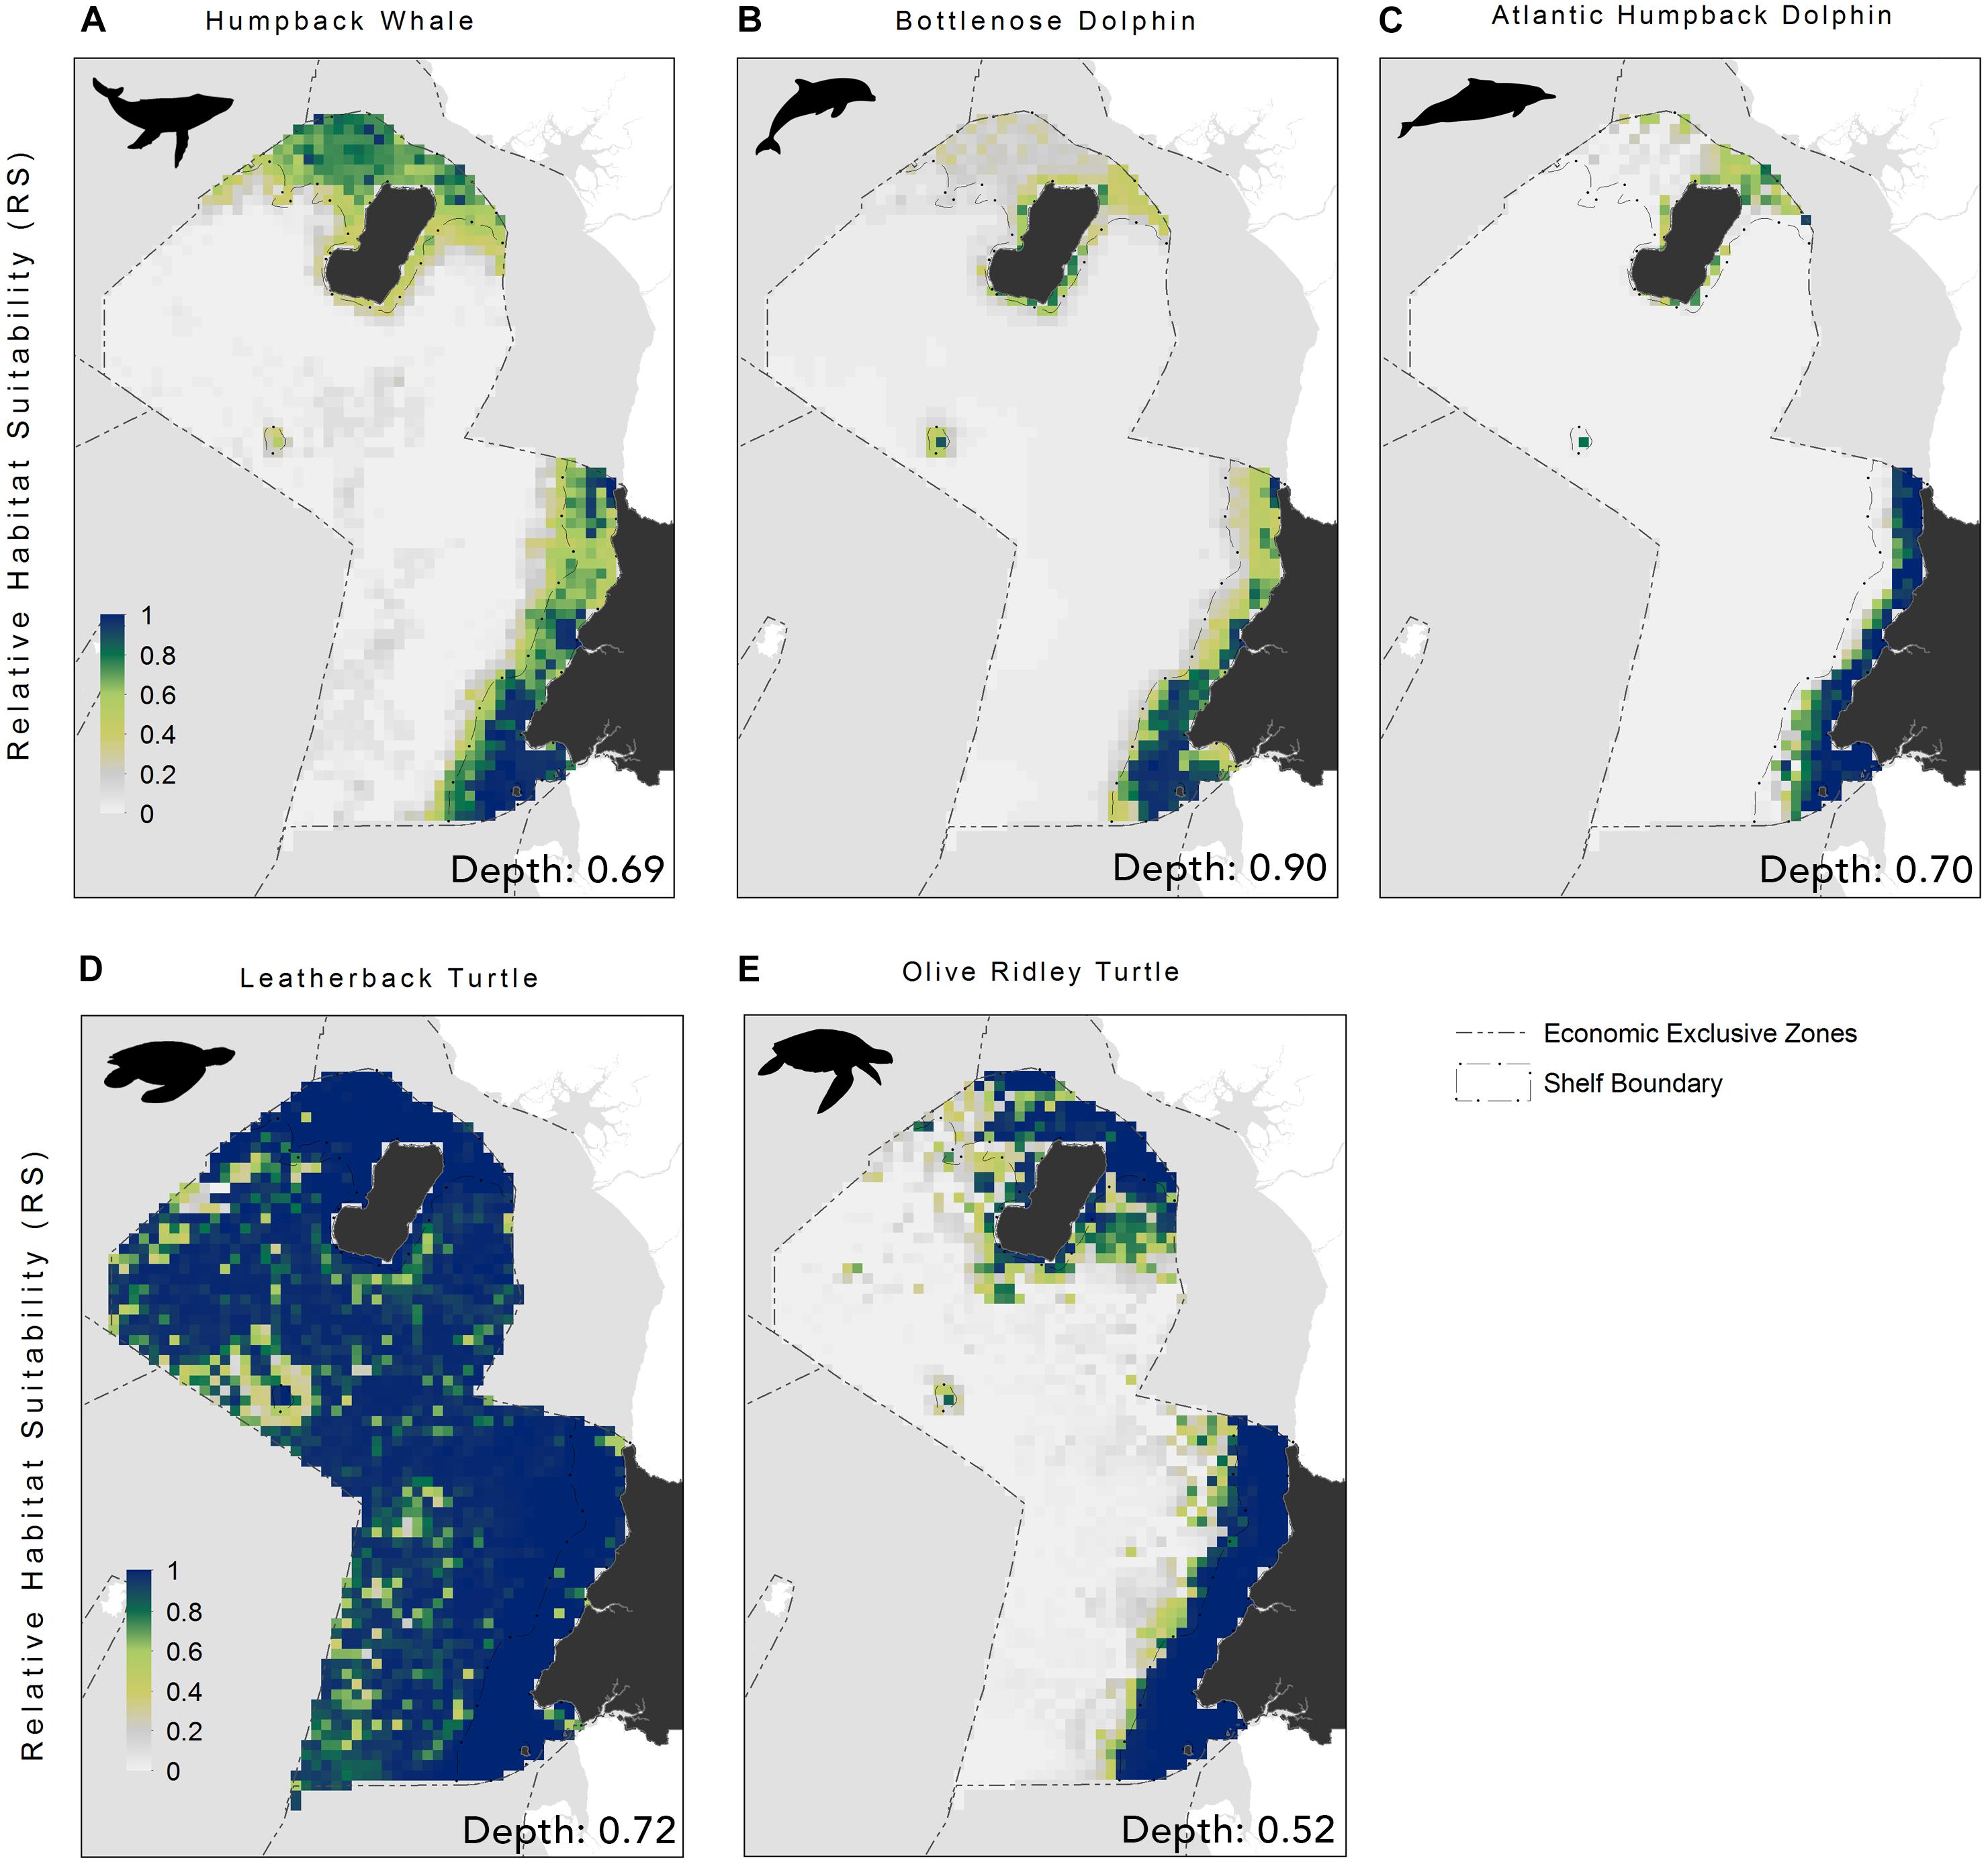
Figure 2. Relative habitat suitability models for: (A) humpback whale; (B) bottlenose dolphin; (C) Atlantic humpback dolphin; (D) leatherback turtle, and (E) olive ridley turtle within the Bioko-Corisco-Continental area of Equatorial Guinea’s exclusive economic zone. Relative suitability (RS) of habitats, is scaled between 0 and 1, where 0.5 represents areas of typical habitat suitability, 0 represents lowest suitability and 1 indicates greatest suitability. Environmental variable value for depth (the most important variable for all species) is listed on the bottom-right of each map; see Supplementary Table S5 for additional variables and their importance values. See Figure 1 for additional geographical information for the Bioko-Corisco-Continental area of Equatorial Guinea’s exclusive economic zone.
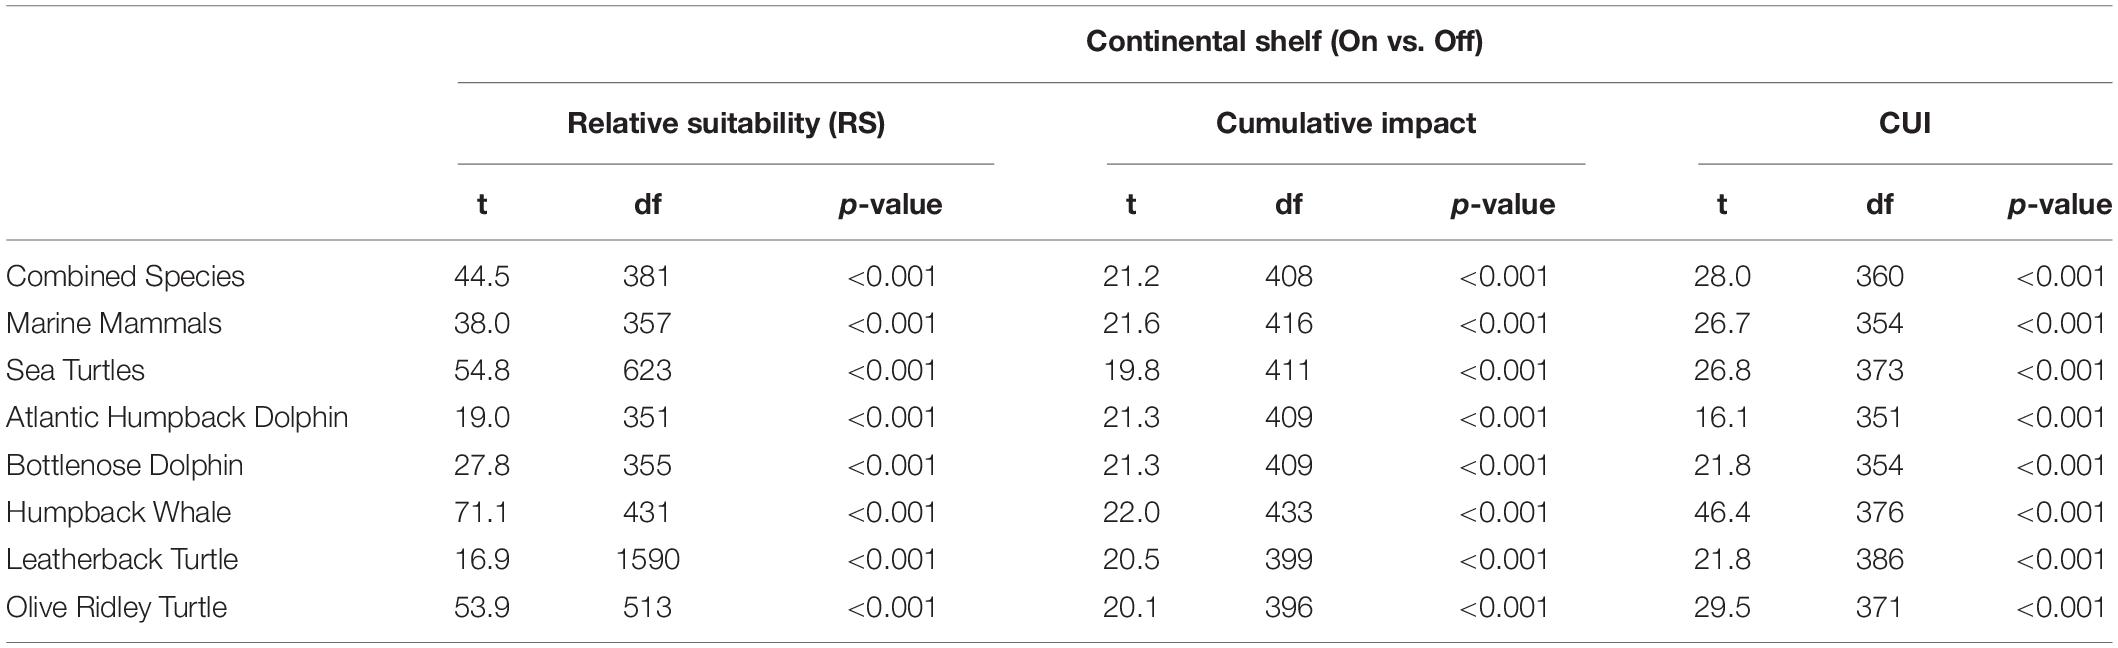
Table 2. Welch’s t-test results for comparisons between means of relative suitability (RS), cumulative impact and cumulative utilization impact distributions on the continental shelf and off the continental shelf (open water) for all species groups and individual species studied.
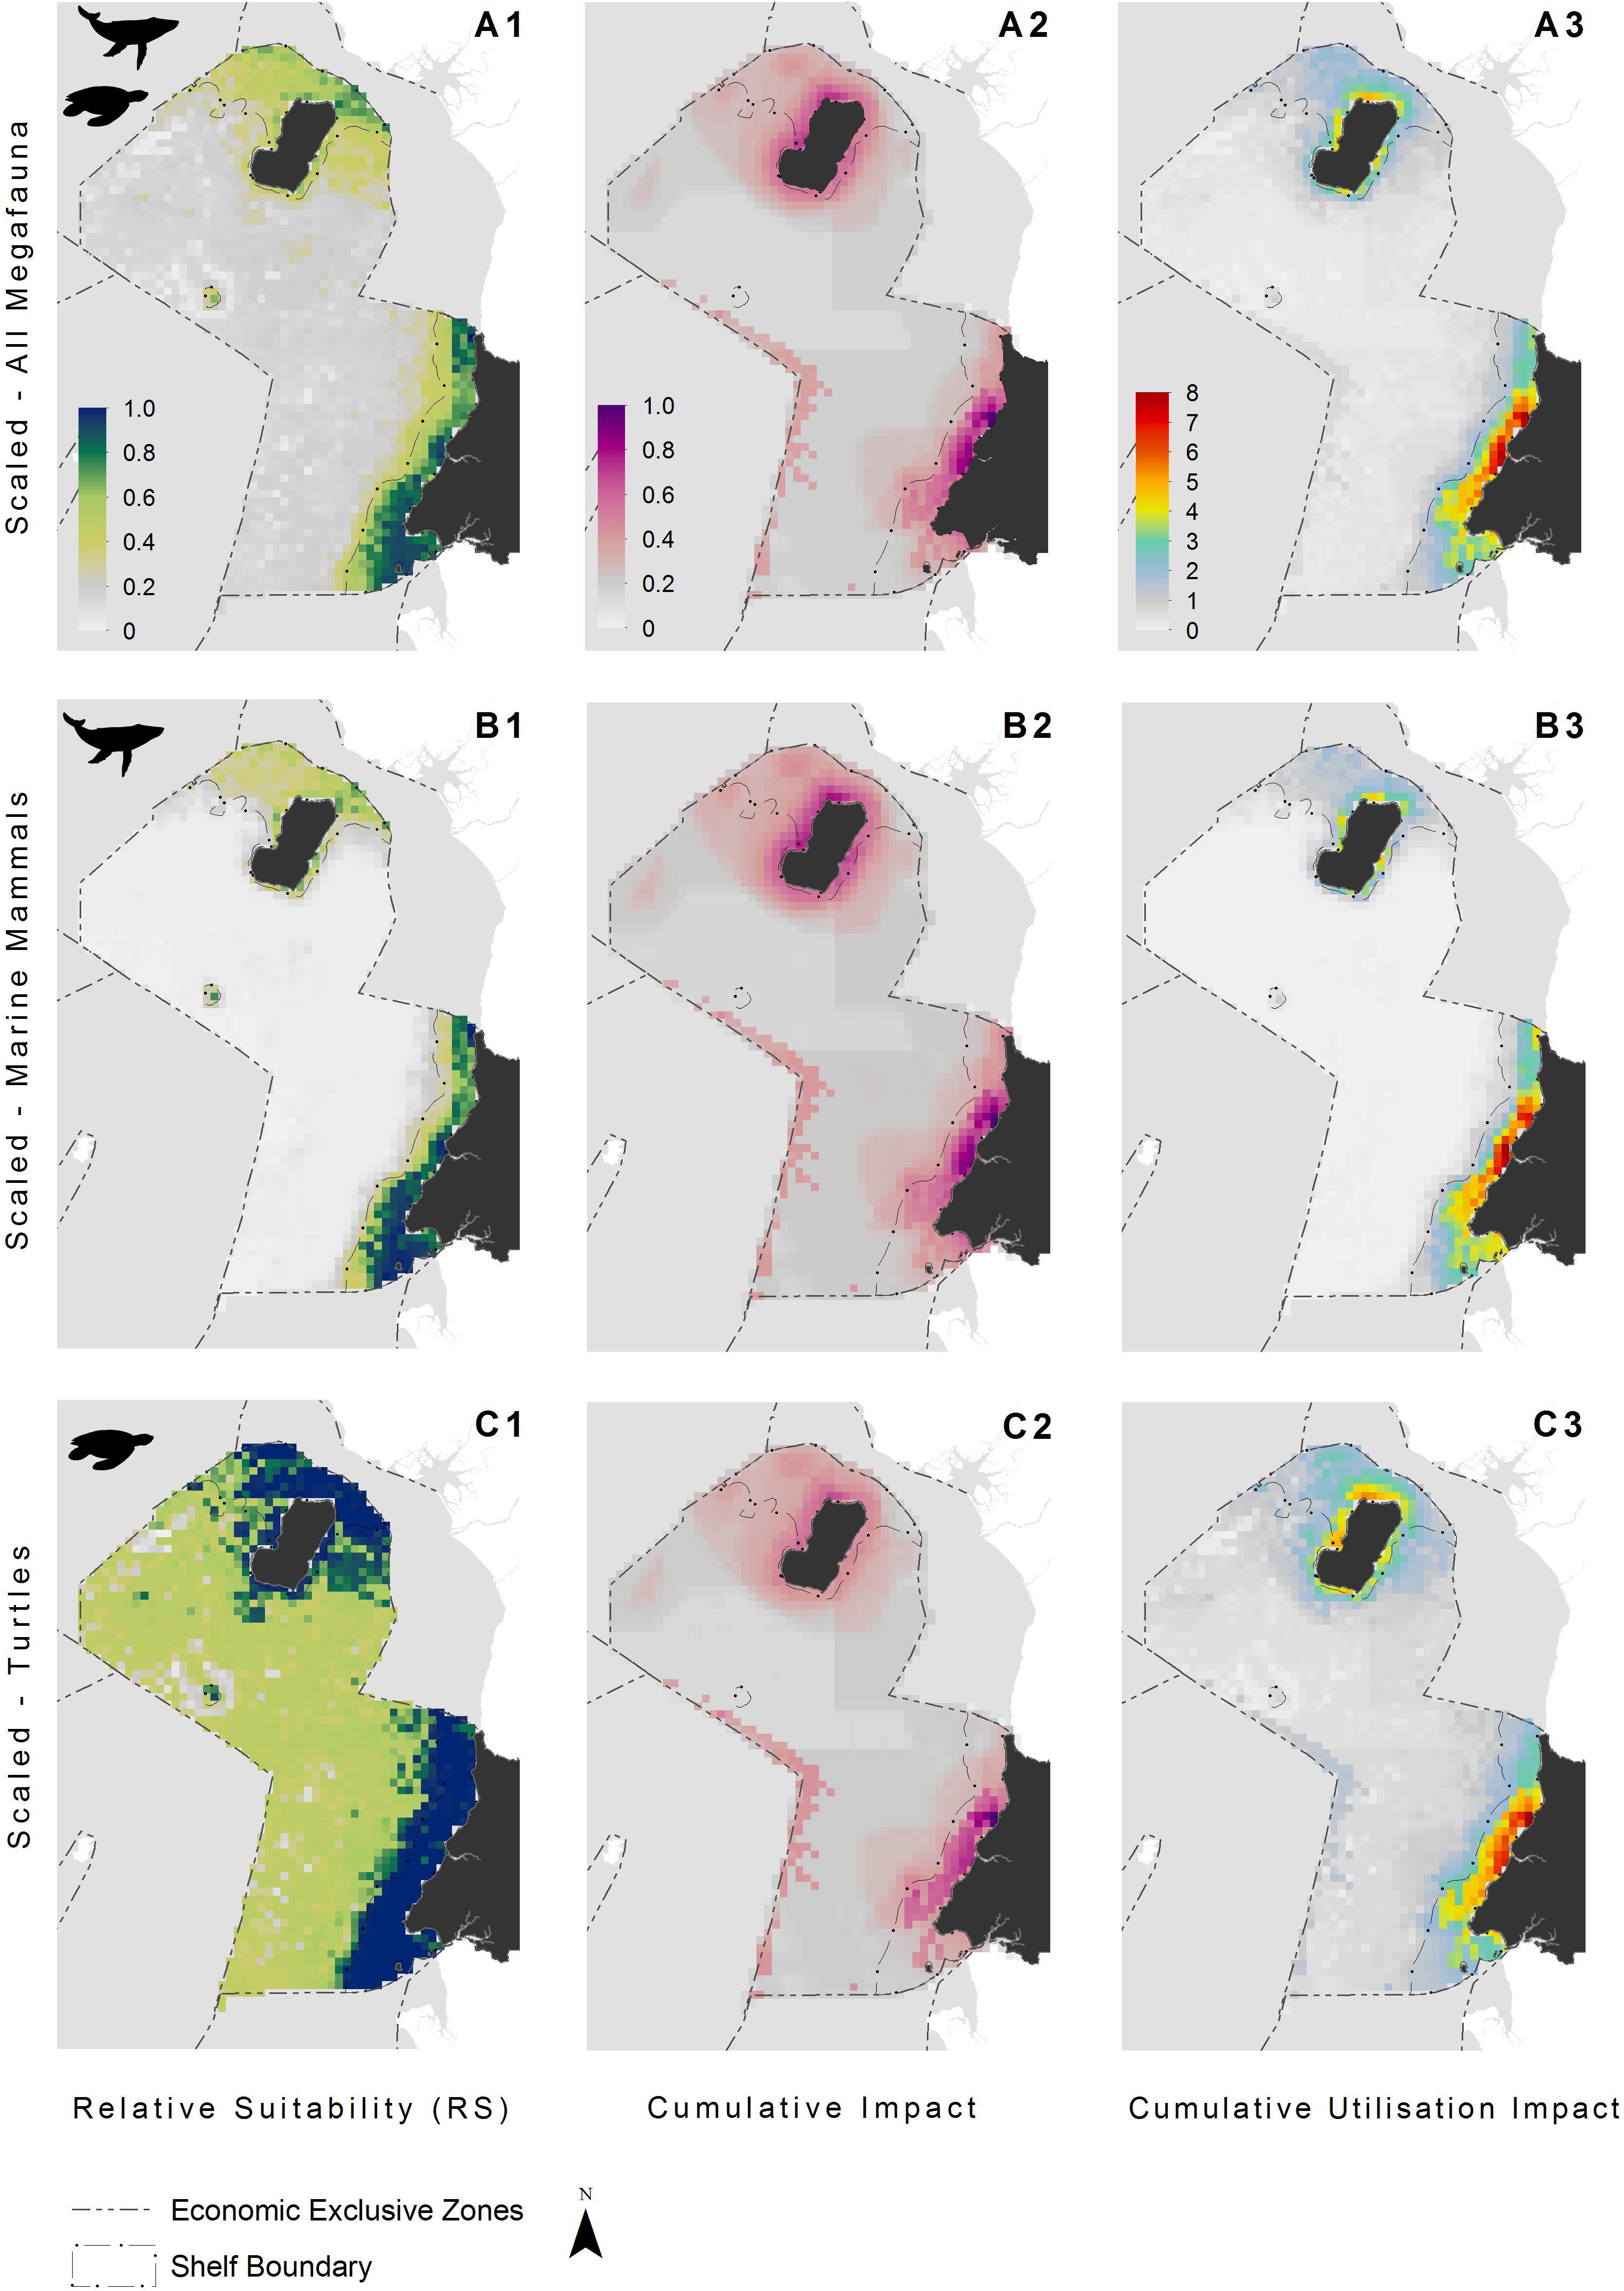
Figure 3. Species distribution models indicating the relative suitability of habitats for: (A1) all megafauna species (n = 5: humpback whale, bottlenose and Atlantic humpback dolphin, leatherback and olive ridley sea turtles); (B1) marine mammals (n = 3: humpback whale, bottlenose and Atlantic humpback dolphin); and (C1) sea turtles (n = 2: leatherback and olive ridley sea turtles). Cumulative impact distributions (activity intensity weighted by the vulnerability of a species to said activity) showing pressure hotspots for: (A2) all megafauna species (n = 5: humpback whale, bottlenose and Atlantic humpback dolphin, leatherback and olive ridley sea turtles); (B2) marine mammals (n = 3: humpback whale, bottlenose and Atlantic humpback dolphin); and (C2) sea turtles (n = 2: leatherback and olive ridley sea turtles). Cumulative utilization impact distributions for: (A3) all megafauna species (n = 5: humpback whale, bottlenose and Atlantic humpback dolphin, leatherback and olive ridley sea turtles); (B3) marine mammals (n = 3: humpback whale, bottlenose and Atlantic humpback dolphin); and (C3) sea turtles (n = 2: leatherback and olive ridley sea turtles). See Figure 1 for additional geographical information for the Bioko-Corisco-Continental area of Equatorial Guinea’s exclusive economic zone.
Cumulative Impact Distribution
The continental shelf had a higher overall mean anthropogenic footprint score than offshore waters (Welch’s t-test, t407 = 21.5, p < 0.001), with the highest scores adjacent to major urban areas and river mouths, along the mainland, and surrounding Bioko Island (Figure 1). The mean footprint score was also significantly higher within the MPA in Corisco Bay than on the rest of the continental shelf (Welch’s t-test, t64 = 2.79, P < 0.001). Cumulative impacts of anthropogenic activities (that is, underlying stressors weighted by species vulnerability) were largely consistent across all species groups (Figure 3). The highest values were recorded on the continental shelf, adjacent to major urban areas and river mouths, along the mainland, and surrounding Bioko Island – preferred habitats for many species, such as the humpback dolphin. Moderate to high values were also found along the maritime border with Sao Tome and Principe across all species groups (Figure 3); driven largely by the presence of industrial fishing activity (Kroodsma et al., 2018).
Cumulative Utilization and Impact Distribution
The highest CUI scores (which integrate the relative suitability of habitats for species and cumulative impacts) were found along the coast of the mainland extending into Corisco Bay, and in the waters surrounding Bioko Island across all species groups (Figure 3). Mean CUI scores were highest on the continental shelf for all species groups compared to offshore waters (Table 2). The mean CUI score within the MPA was also higher than the mean CUI score for the rest of the continental shelf (Welch’s t-tests: all megafauna species, t18 = 23.2, P < 0.001; marine mammals, t49 = 10.8, P < 0.001; sea turtles, t26 = 2.6, P < 0.05). Species groups showed similar patterns regarding the spatial distribution of CUI hotspots, however, CUI scores varied in intensity for individual species across these areas (Figure 4). For instance, the humpback whale (Figure 4A) and bottlenose dolphin (Figure 4B) have a greater geographical spread of moderate to high CUI scores across Equatorial Guinea’s continental shelf, whereas the highest CUI scores for the Atlantic humpback dolphin (Figure 4C) are concentrated along the coast of the mainland. For leatherback (Figure 4D) and olive ridley sea turtles (Figure 4E) potential impacts are widespread with CUI scores highest along the mainland coastline. However, high CUI scores for both species are also found in the continental shelf waters that surround Bioko Island, particularly adjacent to key nesting beaches on the south of the island. In terms of informing decision-making processes, there are several areas with low CUI scores that overlap areas with high habitat suitability scores (Figure 5); that could be used in spatial prioritization analyses to help inform the location MPAs that are designed to protect marine megafauna. The areas with low impact levels and high habitat suitability for combined megafauna species total well over 1,000 km2 – equivalent to 1.7% of the Bioko-Corisco-Continental area. Additionally, these areas are not fragmented across the EEZ, but instead form two coherent on-shelf areas near border with Cameroon and Gabon in the north and south, respectively (Figure 5).
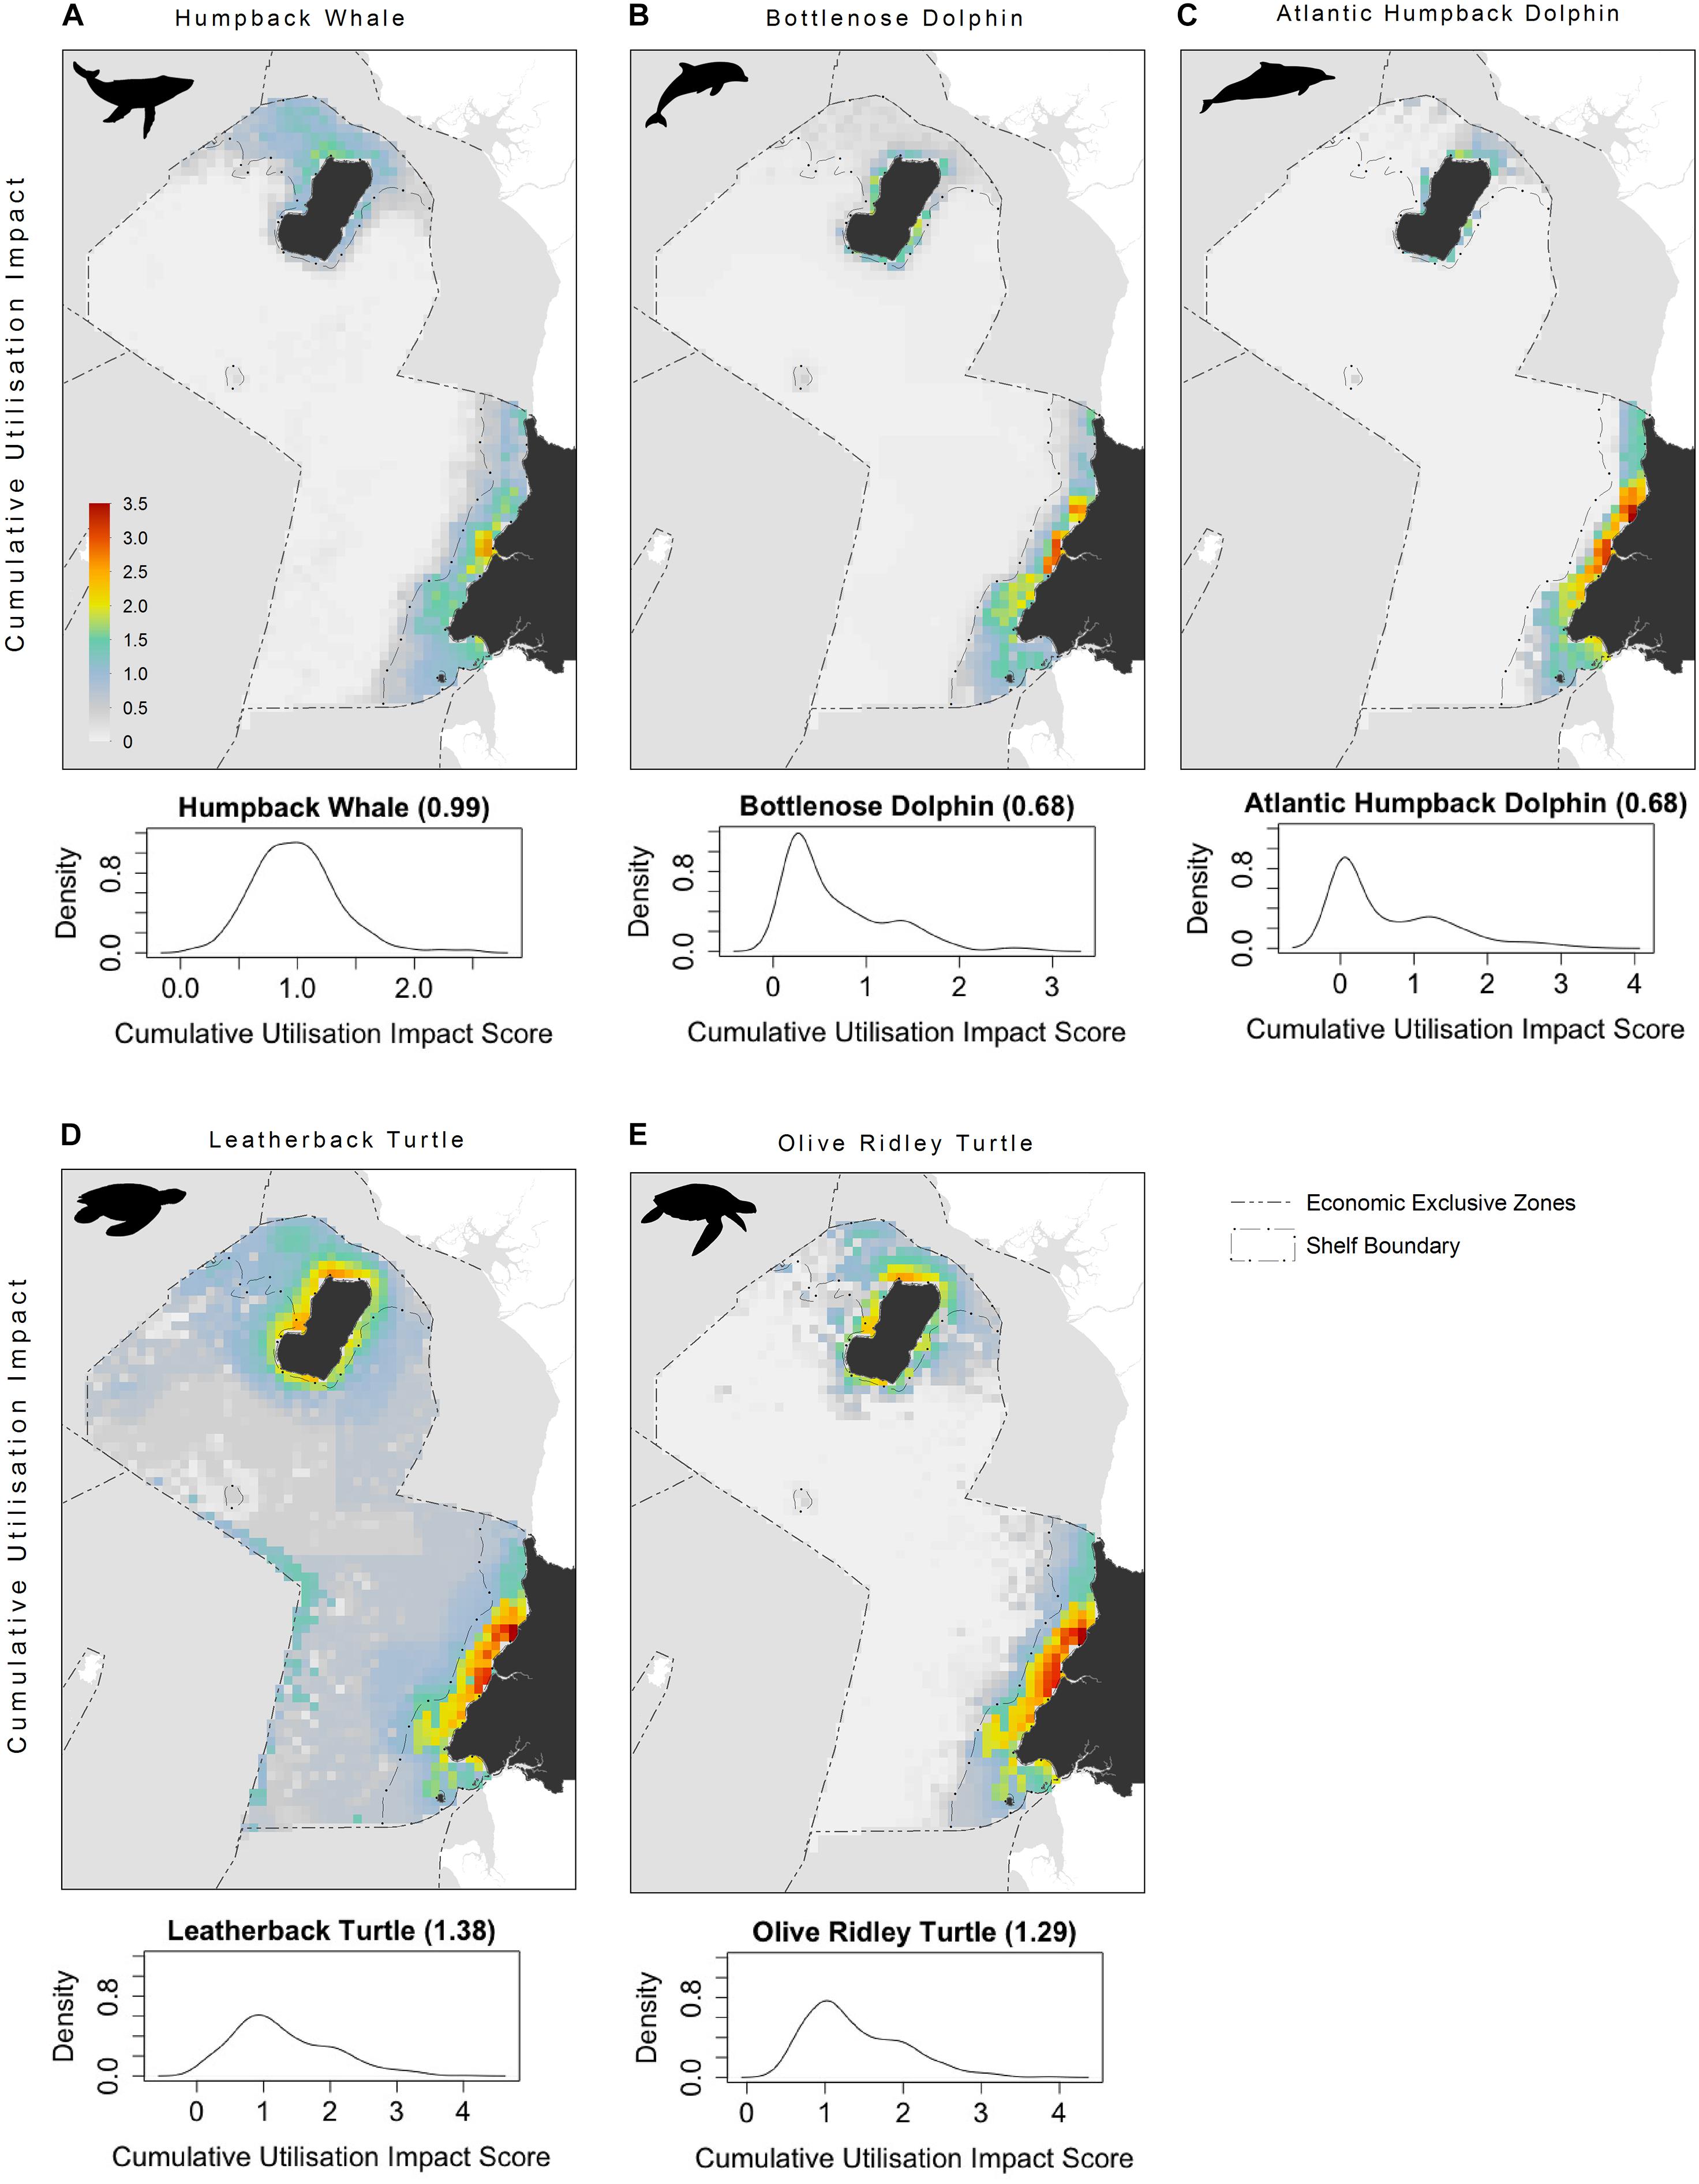
Figure 4. Cumulative utilization impact distributions for: (A) Humpback whale; (B) Bottlenose dolphin; (C) Atlantic humpback dolphin; (D) leatherback turtle; and (E) olive ridley turtle. Density plots of per-pixel cumulative utilization score calculated for each species representing CUI scores (continental shelf scores only). See Figure 1 for additional geographical information for the Bioko-Corisco-Continental area of Equatorial Guinea’s exclusive economic zone.
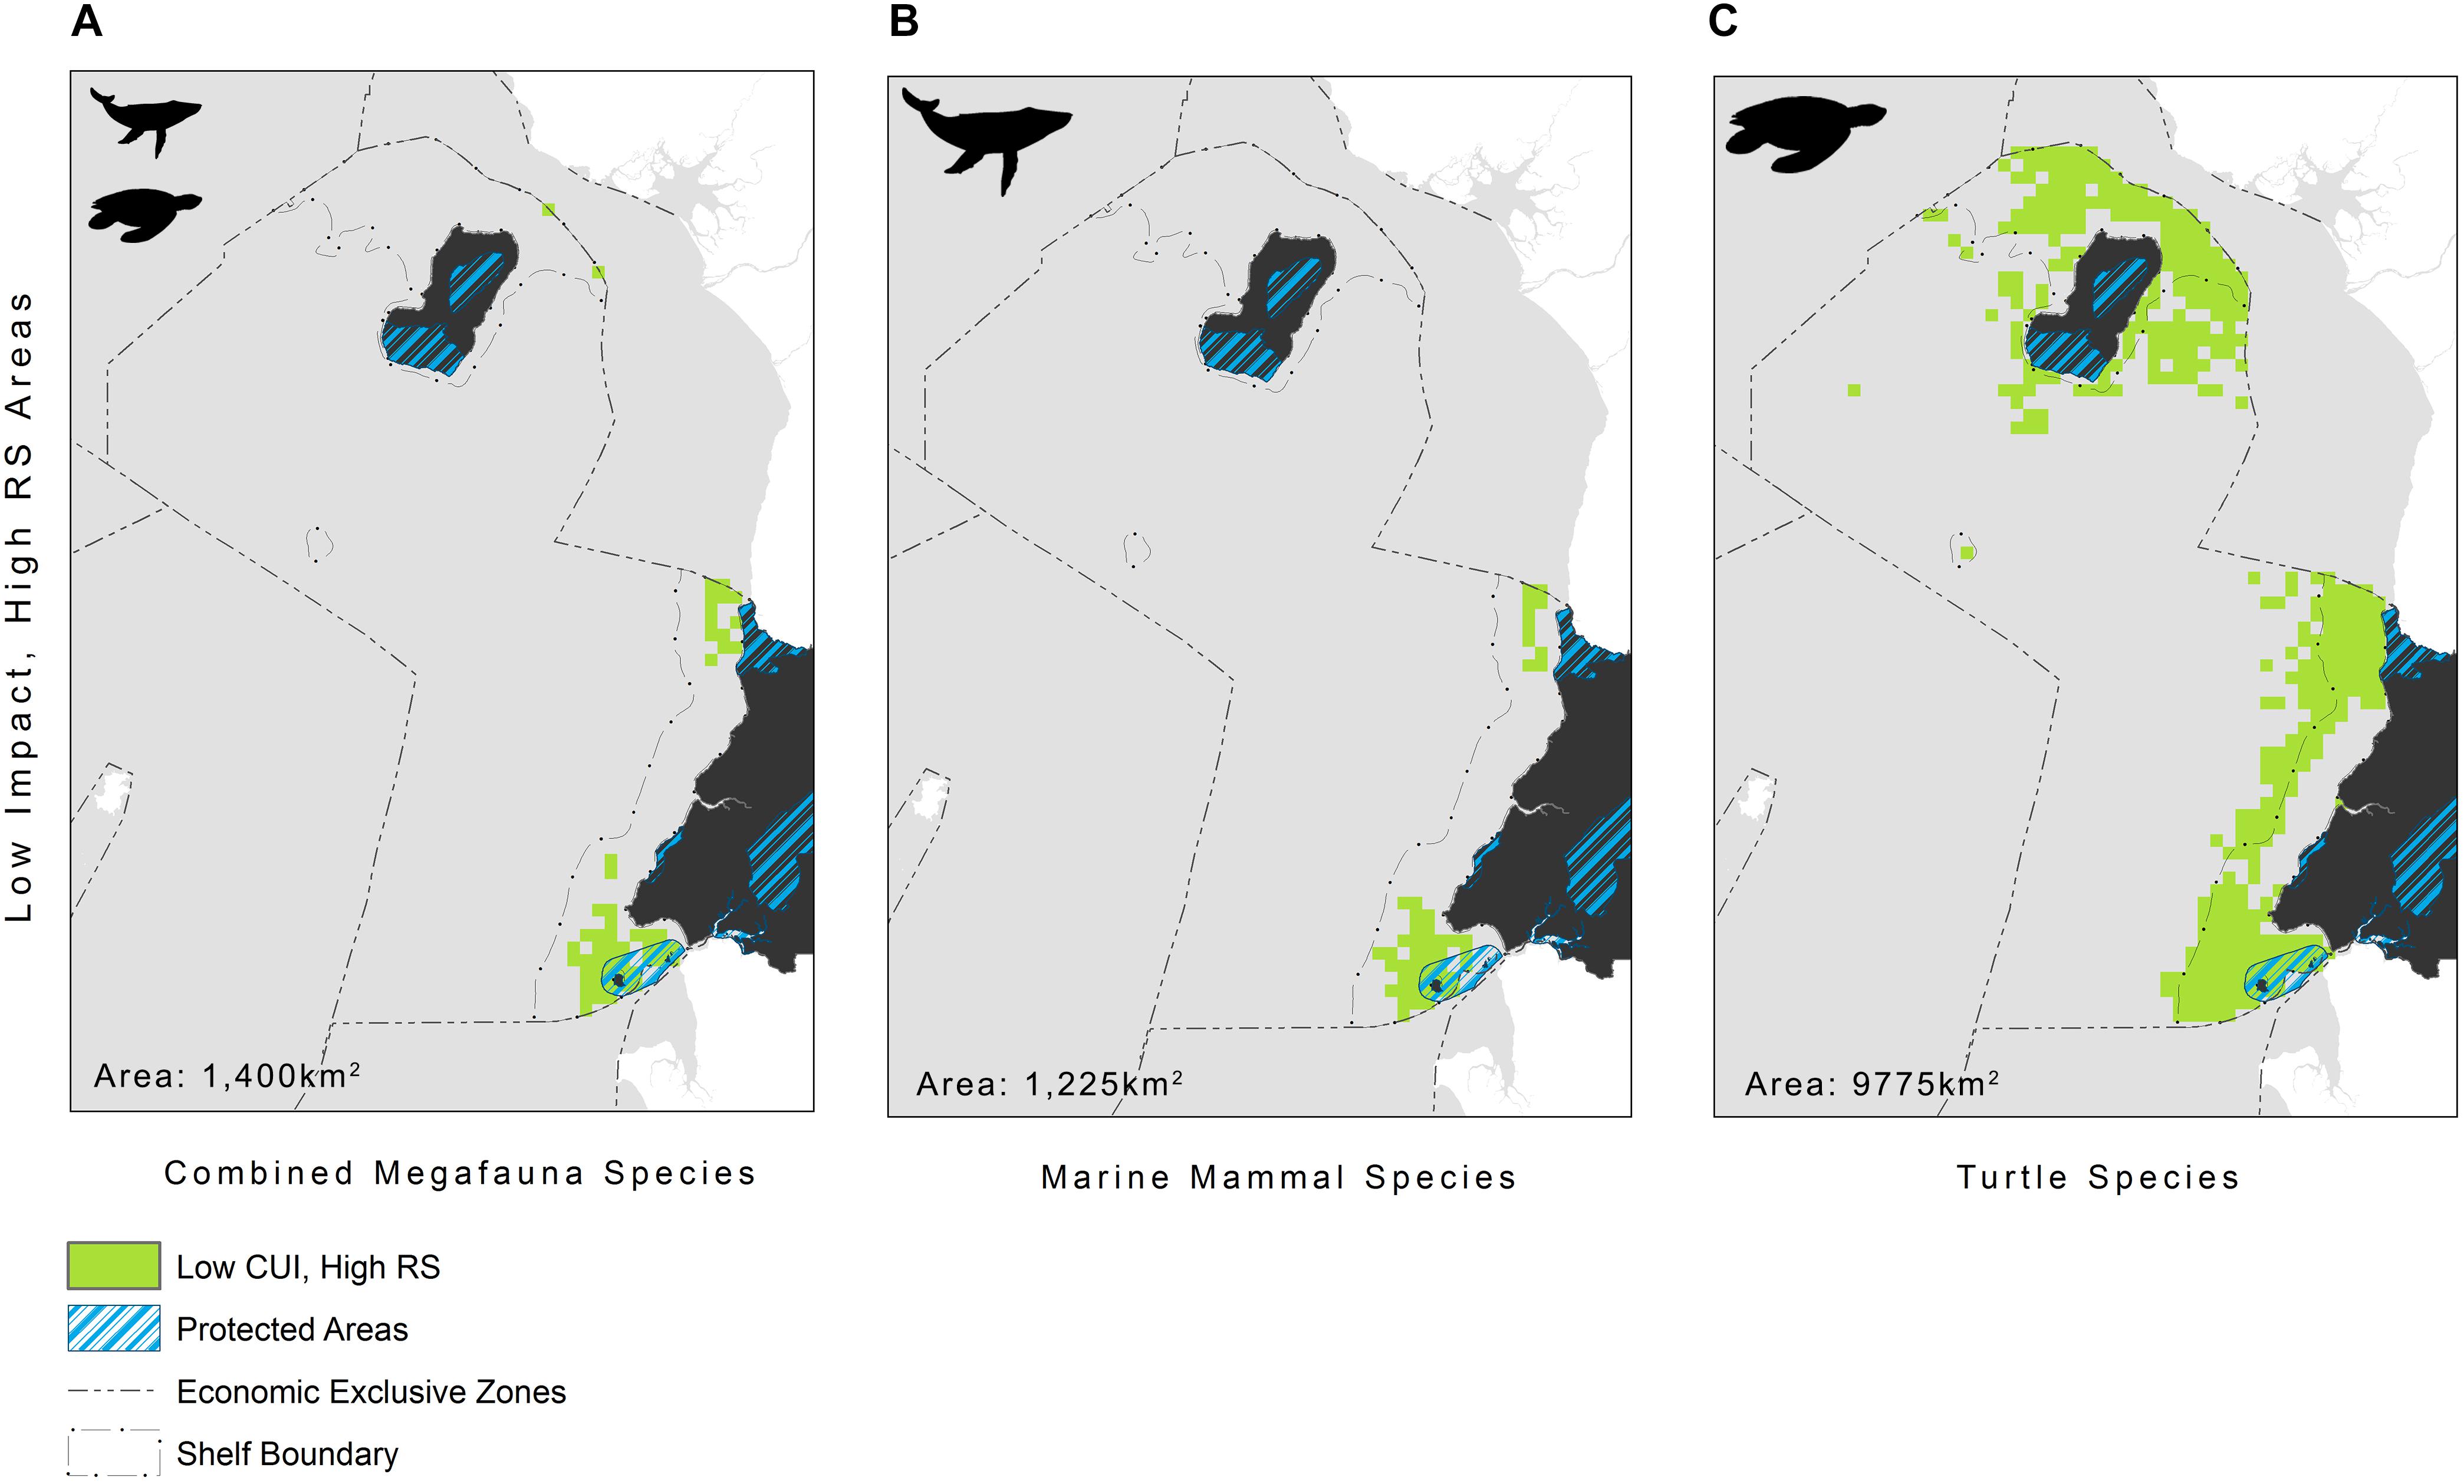
Figure 5. Areas where low impact (CUI scores ≤ 50%) and high relative habitat suitability (RS ≥ 75%) overlap, representing areas needing protection, for: (A) all megafauna species (n = 5: humpback whale, bottlenose and Atlantic humpback dolphin, leatherback and olive ridley sea turtles); (B) marine mammals (n = 3: humpback whale, bottlenose and Atlantic humpback dolphin); and (C) sea turtles (n = 2: leatherback and olive ridley sea turtles) within Equatorial Guinea’s exclusive economic zone. See Figure 1 for additional geographical information for the Bioko-Corisco-Continental area of Equatorial Guinea’s exclusive economic zone.
Ocean-based pollution was the CUI layer with the most influence on the overall CUI values for all species combined (R2 = 0.87), followed by shipping (R2 = 0.84) and ocean engineering (R2 = 0.78; Table 3). At an individual species level, ocean-based pollution may be having the greatest impact on dolphin and turtle species (Table 4). Humpback whale species results showed the only difference, with commercial shipping likely having the greatest impact. The olive ridley turtle was equally impacted by commercial shipping and ocean-based pollution. Finally, with respect to activity types (fishing, pollution, and industry), the highest CUI scores for all three types were largely concentrated on the continental shelf adjacent to major urban areas and river mouths, along the mainland, and surrounding Bioko Island (Supplementary Figure S1). The resulting CUI scores show variation in the locations of high impact hotspots depending on activity type, and they clearly show that industrial based activities and stressors are likely to have the most widespread impact on marine megafauna compared to fishing and pollution.
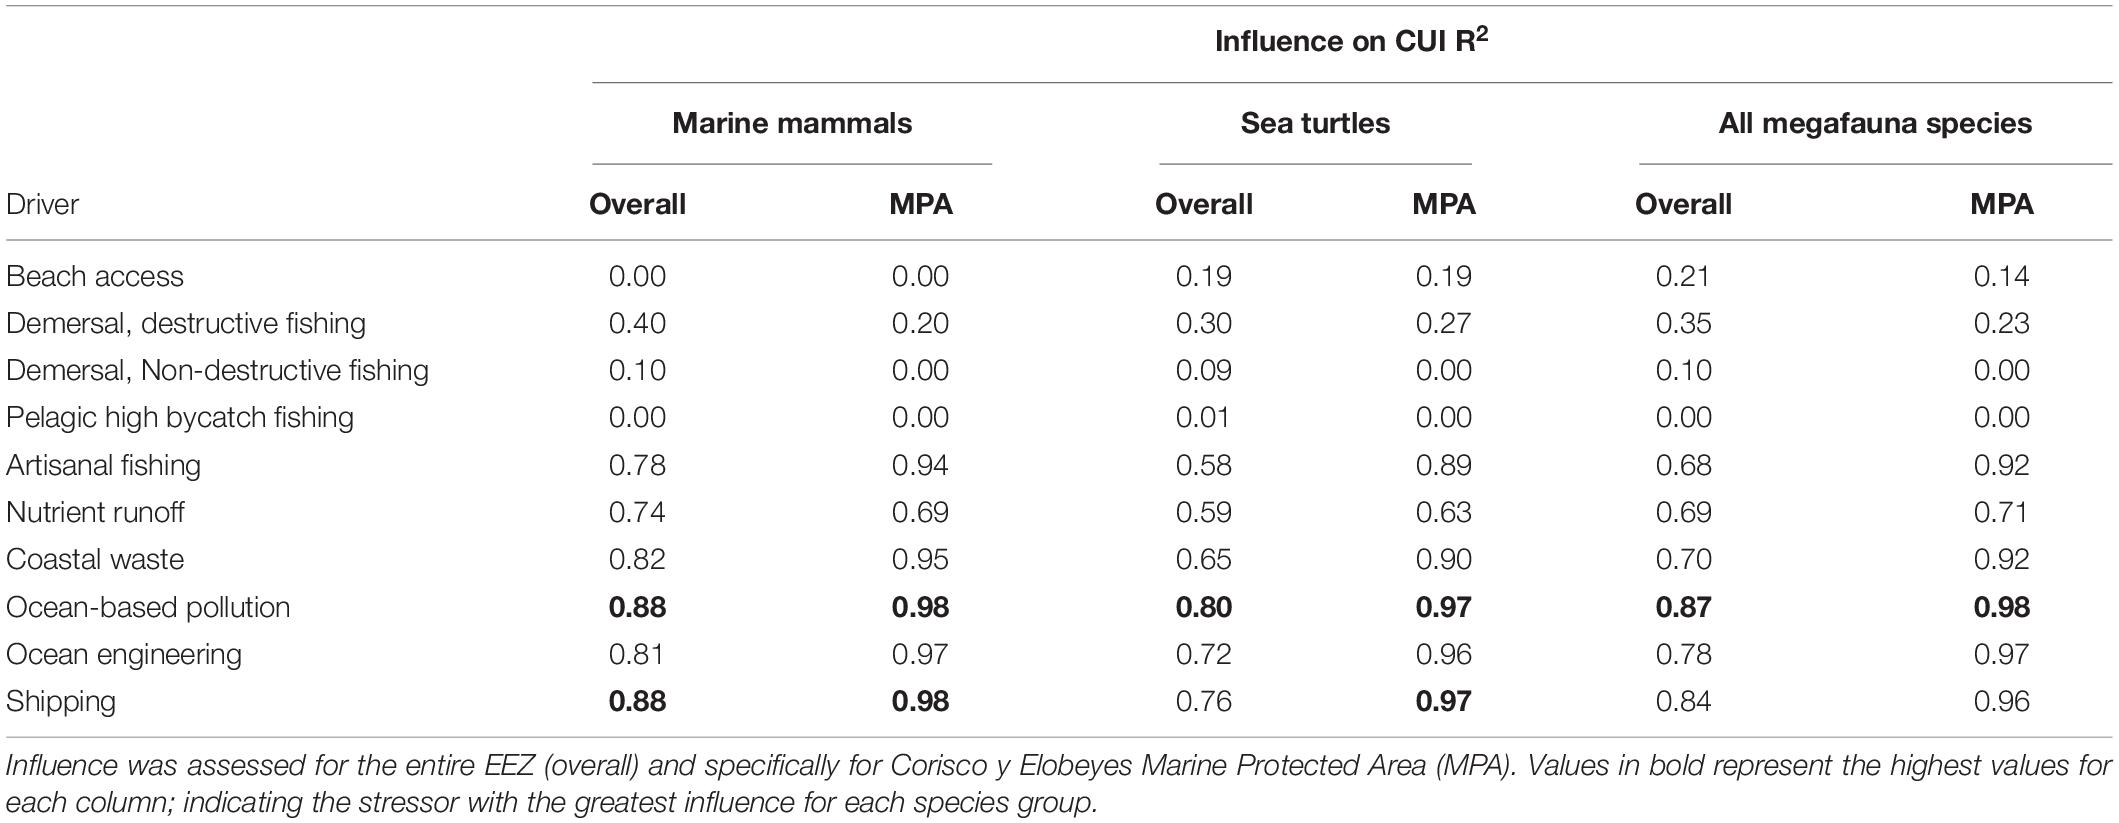
Table 3. Influence of individual CUI layers on overall CUI distributions for marine mammals, sea turtles, and combined megafauna species.
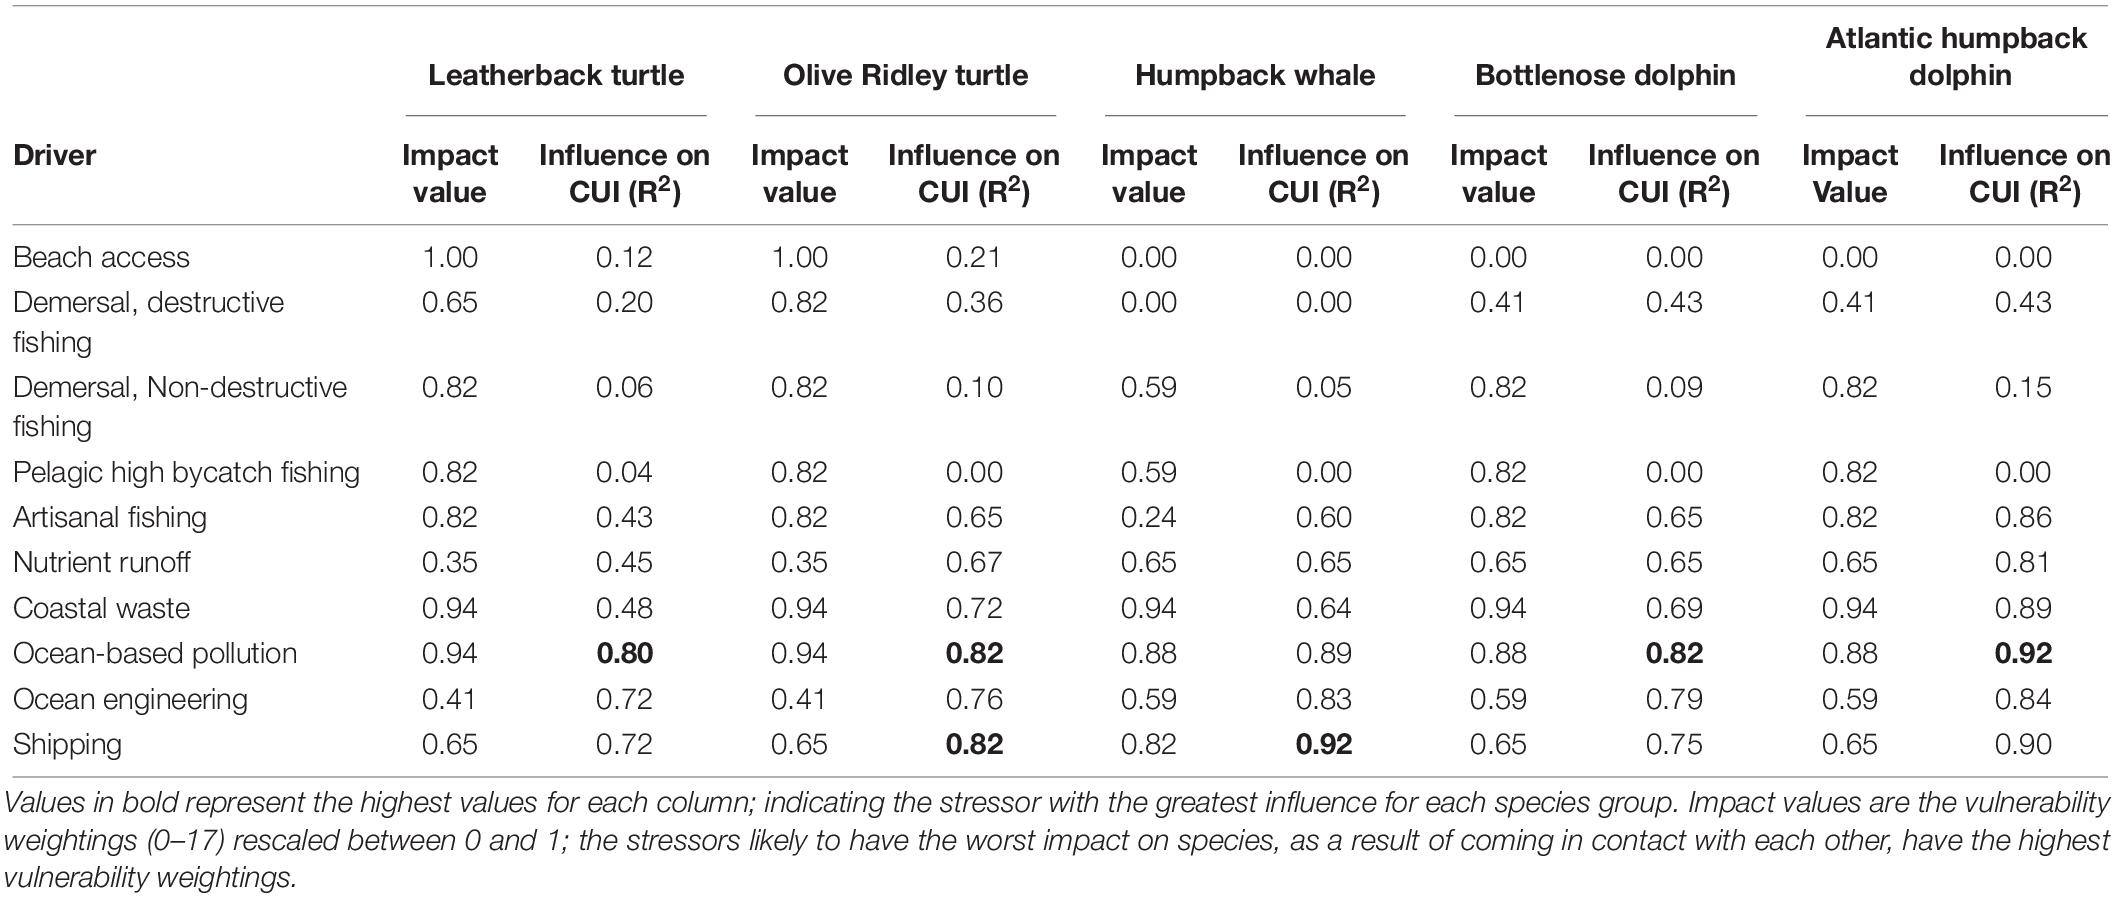
Table 4. Influence of individual CUI layers on overall CUI distributions for individual species (R2).
Discussion
Despite the Gulf of Guinea being identified as a marine biodiversity hotspot, many countries in the region are failing to adequately protect and manage marine biodiversity from anthropogenic threats such as overfishing, and coastal and offshore developments (Aryeetey, 2002; Marinesque et al., 2012; Watson et al., 2014; Pérez-Jorge et al., 2015). Additionally, efforts to reduce pressures and increase protection in Equatorial Guinea are complicated by a lack of fine-scale data on the distribution of globally important species and the anthropogenic activities potentially impacting them. As a result, decision making processes and targeted conservation efforts, such as MPA creation or coastal zone management are hampered by a lack of understanding. This paper represents the first attempt to address these knowledge gaps and build an evidence base by: (1) using an EENM approach to develop habitat suitability models for a suite of marine megafauna occurring within the Gulf of Guinea; (2) visualizing the potential cumulative impacts of human activities on these species; and (3) highlighting areas which could form the basis for efforts to expand the protection of marine megafauna in the region.
In order to better understand data poor regions, surrogate data is often required as a proxy for habitat in adjacent areas (Redfern et al., 2017). Here, we used data gathered from Gabon and Congo to improve the knowledge on the potential suitability of Equatorial Guinea’s waters for marine megafauna species; with the outputs of the models corroborating our limited understanding of the behavioral ecology and spatial distribution of these species. These findings further validate calls to use available species data to predict species distributions in data-poor regions (Redfern et al., 2017). For instance, the EENMs for the Atlantic humpback dolphin agreed with published studies that showed this species has a restricted range and strong preference for shallow (<30 m) coastal and nearshore waters (Weir et al., 2011; Collins, 2015; Weir and Collins, 2015). Additionally, habitat suitability models for the humpback whale overlapped with important areas derived from satellite tracking (Rosenbaum et al., 2014) as well as occurrence records from the Gulf of Guinea (including the waters off of São Tomé and Príncipe; Carvalho et al., 2011), and West Africa (Nigeria, Ghana, Cote d’Ivoire and Liberia) (Weir et al., 2011; Van Waerebeek et al., 2017). More specifically, the EENMs revealed that the areas with the highest habitat suitability were concentrated in shallow continental shelf waters (<200 m) along the Rio Muni mainland, particularly Corisco Bay (along the maritime border with Gabon) and in the waters surrounding Bioko Island. These findings echo those of other studies that have shown higher levels of habitat utilization for highly mobile marine megafauna in continental shelf waters (Maxwell et al., 2013); that is often linked to higher levels of productivity, nutrient upwelling and frontal activity (Miller et al., 2015; Scales et al., 2018).
Continental shelf waters particularly along the mainland are, associated with the highest levels of human activity and the highest cumulative impact distribution scores for marine megafauna compared to offshore waters. These results are not particularly surprising as Equatorial Guinea hosts an important fisheries sector (Belhabib et al., 2016), as well as offshore petrochemical infrastructure and shipping, that are largely concentrated on the continental shelf. Similar trends are also evident in neighboring countries like Gabon and the Republic of Congo, where continental shelf waters are subject to more persistent pressure from human activities such as shipping and fisheries than offshore waters (Dawson et al., 2017; Metcalfe et al., 2018; Pikesley et al., 2018).
There was little variation in the distribution of highly impacted areas among species groups or individual species on the continental shelf, with several areas emerging as clear priorities for targeted conservation or mitigation efforts. These areas were located along the coast of the Rio Muni mainland, adjacent to major urban centers and river mouths, and in the waters surrounding Bioko Island. There was, however, variation in the intensity of impacts across these areas, particularly for leatherback turtles and humpback whales, with a greater frequency of high CUI scores and a larger geographical spread of moderate to high impact areas across the continental shelf and in the waters surrounding Bioko Island for these species. CUI results for our study species showed multiple areas of overlap between areas of high habitat suitability (≥75%) and high impact (≥50%). Marine mammals are particularly affected with over 25% of highly suitable habitat heavily impacted by human activity; reflecting the reliance of our focal cetacean species on continental shelf waters. Of our studied species, the Atlantic humpback dolphin is revealed as highly susceptible to human pressures, with most stressors having a higher influence on CUI scores than for other species. Critical habitats for the Atlantic humpback dolphin are especially affected with over 40% of highly suitable habitat overlapping with high cumulative impact scores. These findings reflect this species’ reliance on nearshore and estuarine habitat (Weir and Collins, 2015), which is dominated by human activities in Equatorial Guinea.
While investigating threats to marine megafauna we revealed that CUI scores for species groups were largely influenced by a few key drivers, with ocean-based pollution, commercial shipping and coastal waste being major contributors to cumulative impacts, with the highest influences on impact varying between individual species. While it is well known that pollution and shipping activities exert major pressures on ecosystems worldwide (Halpern et al., 2008, 2012; Coll et al., 2012; Maxwell et al., 2013; Redfern et al., 2013; Jensen et al., 2015; Lu et al., 2018), this analysis shows that reducing the effects of these local stressors could lead to a reduction in cumulative impact. Many of these local stressors are closely linked to the daily operations of the hydrocarbon industry, weak enforcement of statutory rules, and inadequate or ineffective regulations for environmental protection, as well as poor infrastructure that is unable to cope with the demands of a growing population (Ogri, 2001). Analyses of CUI scores for different anthropogenic activity types indicated that industrial activities, in particular, are likely to have the most widespread effect on marine megafauna across the region. Marine and coastal pollution, is also pervasive along the coastal shelf with the greatest impacts concentrated around coastal urban centers (Scheren et al., 2002). Similar trends were noted here, especially on the Rio Muni mainland around Mbini at the Benito river mouth. This is likely due to a combination of high relative suitability values for our suite of species in the estuary area and high pollution intensity as a result of riparian output; including nutrient run-off and coastal waste. The majority of ocean-based pollution comes from everyday domestic and industrial operations including sewage outputs and ship bilges (Ogri, 2001) due to a lack of regulatory standards on vessel discharge and no mechanisms for enforcement (Rosenbaum and Collins, 2006). Nevertheless, a lack of a dedicated vessel monitoring system data, as well as spatial information on illegal industrial fishing activity, which is highly prevalent in this region (Belhabib et al., 2016) means that the impact of fisheries in the region is largely underestimated given that our analyses are based on Automatic Identification System (AIS) data (see Kroodsma et al., 2018). It is likely that industrial fishing is having a much greater impact than the results show here; particularly in the coastal and nearshore waters that are favored by many of the species in this study. Dealing with individual activities is likely to be difficult for conservation practitioners in Equatorial Guinea, and so targeting economic sectors may allow for a broader scope of initiatives. However, there is obviously an urgent need for additional research into legal and illegal industrial fisheries operating in the Gulf of Guinea waters.
There are well-documented limitations and assumptions of adopting a cumulative impact mapping approach. In particular this method assumes a linear response of species to the stressors studied, as a result of poor understanding of non-linear responses at present. Additionally, by including weightings in the analysis we have assumed that all individuals at any given location will respond in the same way as the rest of the population. Most significantly though, cumulative impact mapping assumes that stressor interactions are additive, as very little is known regarding where, when, why, or to what degree stressors interact; yet these interactions – whether they be synergistic or antagonistic – are likely to affect the outcome of conservation interventions (see Halpern and Fujita (2013) and references within for a more detailed description of limitations and assumptions). Nonetheless, the findings of this study remain the best available assessment or snapshot of the potential impact of human activities on marine megafauna in this data poor region, and can serve as a foundation for informing a wide range of policy and management objectives aimed at protecting marine biodiversity such as marine spatial planning, as well as highlighting areas for further research. For instance, the results of this study reveal that there are a few areas of high habitat suitability for marine megafauna that are subject to low levels of impact by anthropogenic activities. These areas represent critical habitat for marine megafauna, and may be suitable candidates for MPA expansion, as they have fewer opportunity costs and high benefits. One such area that might be a suitable candidate is Corisco Bay, where Equatorial Guinea’s existing MPA (Corisco y Elobeyes) could be expanded, effectively creating a transboundary marine park with a newly established marine park in northern Gabon (Figure 5). The results, however, also show that high impact areas are pervasive on the continental shelf, particularly near populated areas, highlighting that increasing protection of marine megafauna in this region will require more than just the implementation of MPAs. Specifically, turtle species were found to be highly impacted by access to nesting beaches, so the expansion of terrestrial protected areas in coastal areas also warrants further exploration. MPAs, however, will only be effective if they are supported by the development of national standards, best practice guidelines and management strategies to reduce the impact of terrestrial and marine human activities mentioned herein. Our results may therefore help initiate discussions among national implementing agencies, different sectors (e.g., fishing and industry) and key stakeholders by increasing awareness of current pressures on marine biodiversity, as well as facilitating the identification of viable strategies to mitigate and reduce pressures in areas of high impact. For instance, impacts on many of these species from industry which was identified as having the greatest impact on marine megafauna are likely to be exacerbated in the future given increasing investment to further develop offshore petrochemical infrastructure.
Ultimately, our study emphasizes that there is likely to be significant value in future implementation of marine protected areas in critical habitats that are currently experiencing low levels of human activity, in addition to more widespread implementation of environmental policies to reduce threats more broadly. This study also highlights fundamental gaps in our understanding of the distribution of marine megafauna and fisheries. There is thus an urgent need for continued research into the region’s marine wildlife and its vulnerability, as well as thorough investigations into the potentially damaging human activities highlighted herein. Nonetheless, our results highlight that there is clear a need for action at a national level to address the impact of human activities and lack of effective protection across the Gulf of Guinea.
Data Availability Statement
Ensemble ecological niche models (EENMs) and threat maps (anthropogenic footprint, cumulative impact, and cumulative utilization and impact) for each species (Atlantic humpback dolphin Sousa teuszii; bottlenose dolphin Tursiops truncatus; humpback whale Megaptera novaeangliae; leatherback Dermochelys coriacea; and olive ridley sea turtle Lepidochelys olivacea) are available from the Dryad Digital Repository doi: 10.5061/dryad.v6wwpzgr9 (Trew et al., 2019).
Ethics Statement
The animal study was reviewed and approved by the University of Exeter.
Author Contributions
HG, BG, and KM conceived the study. PD, AF, BG, SM, DT, MW, and KM deployed the PTTs on sea turtles in Gabon. TC collated and provided the cetacean sighting data. SP produced the EENMs. BT conducted the cumulative impact analyses and interpreted the results. All co-authors contributed to writing of the manuscript, and gave final approval for publication.
Funding
CB and HG were supported by funding from the Wildlife Conservation Society through the Waitt Foundation and acknowledge the Ministry of Fisheries and Aquatic Resources in Equatorial Guinea for providing permits to conduct research that supported this study. KM, DT, MW, and BG were supported by funding from the Darwin Initiative (Projects 17-005/20-009/23-011/26-014) through the Department for Environment, Food and Rural Affairs (Defra) in the United Kingdom and the Waterloo Foundation. PD was supported by a NERC Science Innovation Placement (NE/R007039/1). AF and the Gulf of Guinea Sea Turtle Program were supported by funding from the Marine Turtle Conservation Fund (United States Fish and Wildlife Service, United States Department of the Interior). Satellite tracking of leatherback and olive ridley sea turtles was supported by funding from Vaalco Energy, Harvest Natural Resources, the Sea World and Busch Gardens Conservation Fund, Tullow Oil, the Old Dominion University, WWF, the Wildlife Conservation Society, and the University of Exeter.
Conflict of Interest
The authors declare that the research was conducted in the absence of any commercial or financial relationships that could be construed as a potential conflict of interest.
Acknowledgments
We thank Global Fishing Watch (a partnership between Oceana, Skytruth, and Google) for providing industrial fishing effort data (available from globalfishingwatch.org). We also thank Dr. Nicola Weber (University of Exeter) for providing comments on an earlier draft.
Supplementary Material
The Supplementary Material for this article can be found online at: https://www.frontiersin.org/articles/10.3389/fmars.2019.00717/full#supplementary-material
References
Aryeetey, E. B. D. (2002). “Socio-economic aspects of artisanal marine fisheries management in West Africa,” in The Gulf of Guinea Large Marine Ecosystem: Environmental Forcing and Sustainable Development of Marine Resources, eds J. M. Mcglade, P. Cury, K. A. Koranteng, and N. J. Hardman-Mountford (Amsterdam: Elsevier), 323–344. doi: 10.1016/s1570-0461(02)80045-3
Ban, N., and Alder, J. (2008). How wild is the ocean? assessing the intensity of anthropogenic marine activities in British Columbia, Canada. Aqua. Conserv. 18, 55–85. doi: 10.1002/aqc.816
Ban, N. C., Alidina, H. M., and Ardron, J. A. (2010). Cumulative impact mapping: advances, relevance and limitations to marine management and conservation, using Canada’s Pacific waters as a case study. Mar. Policy 34, 876–886. doi: 10.1016/j.marpol.2010.01.010
Barbier, E. B. (2017). Marine ecosystem services. Curr. Biol. 27, R507–R510. doi: 10.1016/j.cub.2017.03.020
Belhabib, D., Campredon, P., Lazar, N., Sumaila, U. R., Baye, B. C., Kane, E. A., et al. (2016). Best for pleasure, not for business: evaluating recreational marine fisheries in West Africa using unconventional sources of data. Palgrave Commun. 2:15050.
Brown, C. J., Saunders, M. I., Possingham, H. P., and Richardson, A. J. (2014). Interactions between global and local stressors of ecosystems determine management effectiveness in cumulative impact mapping. Diver. Distrib. 20, 538–546. doi: 10.1111/ddi.12159
Butynski, T. M. (1996). Marine turtles on Bioko Island, Equatorial Guinea. Oryx 30, 143–149. doi: 10.1371/journal.pone.0213231
Carvalho, S. B., Brito, J. C., Crespo, E. G., Watts, M. E., and Possingham, H. P. (2011). Conservation planning under climate change: Toward accounting for uncertainty in predicted species distributions to increase confidence in conservation investments in space and time. Biol. Conserv. 144, 2020–2030. doi: 10.1016/j.biocon.2011.04.024
Casale, P., Abitsi, G., Aboro, M. P., Agamboue, P. D., Agbode, L., Allela, N. L., et al. (2017). A first estimate of sea turtle bycatch in the industrial trawling fishery of Gabon. Biodiver. Conserv. 26, 2421–2433.
Cayula, J.-F., and Cornillon, P. (1992). Edge detection algorithm for SST images. J. Atmospheric Ocean. Technol. 9, 67–80. doi: 10.1175/1520-0426(1992)009<0067:edafsi>2.0.co;2
Coll, M., Piroddi, C., Albouy, C., Ben Rais Lasram, F., Cheung, W. W. L., Christensen, V., et al. (2012). The Mediterranean sea under siege: spatial overlap between marine biodiversity, cumulative threats and marine reserves. Glob. Ecol. Biogeogr. 21, 465–480. doi: 10.1111/j.1466-8238.2011.00697.x
Collins, T. (2015). “Chapter three - re-assessment of the conservation status of the atlantic humpback dolphin, sousa teuszii (Kükenthal, 1892), using the IUCN red list criteria,” in Advances in Marine Biology, eds T. A. Jefferson and B. E. Curry (Cambridge, MA: Academic Press), 47–77. doi: 10.1016/bs.amb.2015.09.001
Collins, T., Cerchio, S., Pomilla, C., Loo, J., Carvalho, I., Ngouessono, S., et al. (2010). “Estimates of abundance for humpback whales in Gabon between 2001 – 2006 using photographic and genotypic data,” in Proceedings of the Scientific Committee Meeting of the International Whaling Commission (Agadir, MO).
Coyne, M. S., and Godley, B. J. (2005). Satellite tracking and analysis tool (STAT): an integrated system for archiving, analyzing and mapping animal tracking data. Mar. Ecol. Prog. Ser. 301, 1–7. doi: 10.3354/meps301001
Dawson, T. M., Formia, A., Agamboué, P. D., Asseko, G. M., Boussamba, F., Cardiec, F., et al. (2017). Informing marine protected area designation and management for nesting olive ridley sea turtles using satellite tracking. Front. Mar. Sci. 4:312. doi: 10.3389/fmars.2017.00312
De Solla, S. R., Bonduriansky, R., and Brooks, R. J. (1999). Eliminating autocorrelation reduces biological relevance of home range estimates. J. Anim. Ecol. 68, 221–234. doi: 10.1046/j.1365-2656.1999.00279.x
Dormann, C., Mcpherson, J., Araújo, M., Bivand, R., Bolliger, J., Carl, G., et al. (2007). Methods to account for spatial autocorrelation in the analysis of species distributional data: a review. Ecography 30, 609–628. doi: 10.1111/j.2007.0906-7590.05171.x
Foden, J., Rogers, S. I., and Jones, A. P. (2011). Human pressures on UK seabed habitats: a cumulative impact assessment. Mar. Ecol. Prog. Ser. 428, 33–47. doi: 10.3354/meps09064
Formia, A., Tiwari, M., Fretey, J., and Billes, A. (2003). Sea turtle conservation along the Atlantic coast of Africa. Mar. Turtle Newsl. 100, 33–37. doi: 10.1371/journal.pone.0088746
Fretey, J., Billes, A., and Tiwari, M. (2007). Leatherback, dermochelys coriacea, nesting along the Atlantic Coast of Africa. Chelonian Conserv. Biol. 6, 126–129. doi: 10.2744/1071-8443(2007)6
Frynas, J. G. (2004). The oil boom in equatorial Guinea. Afr. Affairs 103, 527–546. doi: 10.1093/afraf/adh085
Griggs, D., Stafford-Smith, M. O. G., Rockstrom, J., Ohman, M. C., and Shyamsundar, P. (2013). Policy: sustainable development goals for people and planet. Nature 495:305.
Halpern, B. S., and Fujita, R. (2013). Assumptions, challenges, and future directions in cumulative impact analysis. Ecosphere 4, art131. doi: 10.1890/es13-00181.1
Halpern, B. S., Kappel, C. V., Selkoe, K. A., Micheli, F., Ebert, C. M., Kontgis, C., et al. (2009). Mapping cumulative human impacts to California current marine ecosystems. Conserv. Lett. 2, 138–148. doi: 10.1371/journal.pone.0079889
Halpern, B. S., Lester, S. E., and Mcleod, K. L. (2010). Placing marine protected areas onto the ecosystem-based management seascape. PNAS 107, 18312–18317. doi: 10.1073/pnas.0908503107
Halpern, B. S., Longo, C., Hardy, D., Mcleod, K. L., Samhouri, J. F., Katona, S. K., et al. (2012). An index to assess the health and benefits of the global ocean. Nature 488:615. doi: 10.1038/nature11397
Halpern, B. S., Walbridge, S., Selkoe, K. A., Kappel, C. V., Micheli, F., D’agrosa, C., et al. (2008). A global map of human impact on marine ecosystems. Science 319, 948–952.
Hijmans, R. J., Van Etten, J., Cheng, J., Mattiuzzi, M., Sumner, M., Greenberg, J. A., et al. (2016). Raster: Geographic Data Analysis and Modeling”. R package version 2.5, 8th Edn.
Honarvar, S., Fitzgerald, D. B., Weitzman, C. L., Sinclair, E. M., Echube, J. M. E., O’connor, M., et al. (2016). Assessment of important marine turtle nesting populations on the Southern Coast of Bioko Island. Equa. Guinea. Chelonian Conserv. Biol. 15, 79–89. doi: 10.2744/ccb-1194.1
Jensen, C. M., Hines, E., Holzman, B. A., Moore, T. J., Jahncke, J., and Redfern, J. V. (2015). Spatial and temporal variability in shipping traffic off San Francisco. California. Coastal Manag. 43, 575–588. doi: 10.1080/08920753.2015.1086947
Joppa, L. N., O’connor, B., Visconti, P., Smith, C., Geldmann, J., Hoffmann, M., et al. (2016). Filling in biodiversity threat gaps. Science 352, 416–418.
Klein, C. J., Chan, A., Kircher, L., Cundiff, A. J., Gardner, N., Hrovat, Y., et al. (2008). Striking a balance between biodiversity conservation and socioeconomic viability in the design of marine protected areas. Conserv. Biol. 22, 691–700. doi: 10.1111/j.1523-1739.2008.00896.x
Korpinen, S., Meski, L., Andersen, J. H., and Laamanen, M. (2012). Human pressures and their potential impact on the Baltic Sea ecosystem. Ecol. Indic. 15, 105–114. doi: 10.1016/j.ecolind.2011.09.023
Kroodsma, D. A., Mayorga, J., Hochberg, T., Miller, N. A., Boerder, K., Ferretti, F., et al. (2018). Tracking the global footprint of fisheries. Science 359, 904–908. doi: 10.1126/science.aao5646
Lester, S. E., Halpern, B. S., Grorud-Colvert, K., Lubchenco, J., Ruttenberg, B. I., Gaines, S. D., et al. (2009). Biological effects within no-take marine reserves: a global synthesis. Mar. Ecol. Prog. Ser. 384, 33–46. doi: 10.3354/meps08029
Lombana, A., Halpern, B. S., Recchia, C. A., Mcmanus, E., Allen, G. R., Fox, H. E., et al. (2007). Marine ecoregions of the world: a bioregionalization of coastal and Shelf Areas. BioScience 57, 573–583. doi: 10.1641/b570707
Lu, Y., Yuan, J., Lu, X., Su, C., Zhang, Y., Wang, C., et al. (2018). Major threats of pollution and climate change to global coastal ecosystems and enhanced management for sustainability. Environ. Poll. 239, 670–680. doi: 10.1016/j.envpol.2018.04.016
Lucifora, L. O., García, V. B., and Worm, B. (2011). Global diversity hotspots and conservation priorities for sharks. PLoS one 6:e19356. doi: 10.1371/journal.pone.0019356
Marinesque, S., Kaplan, D. M., and Rodwell, L. D. (2012). Global implementation of marine protected areas: is the developing world being left behind? Mar. Policy 36, 727–737. doi: 10.1016/j.marpol.2011.10.010
Maxwell, S. M., Breed, G. A., Nickel, B. A., Makanga-Bahouna, J., Pemo-Makaya, E., Parnell, R. J., et al. (2011). Using satellite tracking to optimize protection of long-lived marine species: olive ridley sea turtle conservation in Central Africa. PLoS One 6:e19905. doi: 10.1371/journal.pone.0019905
Maxwell, S. M., Hazen, E. L., Bograd, S. J., Halpern, B. S., Breed, G. A., Nickel, B., et al. (2013). Cumulative human impacts on marine predators. Nat. Commun. 4:2688. doi: 10.1038/ncomms3688
Metcalfe, K., Agamboué, P. D., Augowet, E., Boussamba, F., Cardiec, F., Fay, J. M., et al. (2015). Going the extra mile: ground-based monitoring of olive ridley turtles reveals Gabon hosts the largest rookery in the Atlantic. Biol. Conserv. 190, 14–22. doi: 10.1016/j.biocon.2015.05.008
Metcalfe, K., Breheret, N., Bal, G., Chauvet, E., Doherty, P. D., Formia, A., et al. (in press). Tracking foraging green turtles in the Republic of Congo: insights into spatial ecology from a data poor region. Oryx.
Metcalfe, K., Bréheret, N., Chauvet, E., Collins, T., Curran, B. K., Parnell, R. J., et al. (2018). Using satellite AIS to improve our understanding of shipping and fill gaps in ocean observation data to support marine spatial planning. J. Appl. Ecol. 55, 1834–1845. doi: 10.1111/1365-2664.13139
Metcalfe, K., Collins, T., Abernethy, K. E., Boumba, R., Dengui, J.-C., Miyalou, R., et al. (2017). Addressing uncertainty in marine resource management; combining community engagement and tracking technology to characterize human behavior. Conserv. Lett. 10, 460–469.
Micheli, F., Halpern, B. S., Walbridge, S., Ciriaco, S., Ferretti, F., Fraschetti, S., et al. (2013). Cumulative human impacts on mediterranean and black sea marine ecosystems: assessing current pressures and opportunities. PLoS One 8:e79889. doi: 10.1371/journal.pone.0079889
Miller, P. I., Scales, K. L., Ingram, S. N., Southall, E. J., Sims, D. W., and Costa, D. (2015). Basking sharks and oceanographic fronts: quantifying associations in the north-east Atlantic. Func Ecol. 29, 1099–1109. doi: 10.1111/1365-2435.12423
Moore, J. E., Wallace, B. P., Lewison, R. L., Žydelis, R., Cox, T. M., and Crowder, L. B. (2009). A review of marine mammal, sea turtle and seabird bycatch in USA fisheries and the role of policy in shaping management. Mar. Policy 33, 435–451. doi: 10.1016/j.marpol.2008.09.003
Myers, N., Mittermeier, R. A., Mittermeier, C. G., Da Fonseca, G. A. B., and Kent, J. (2000). Biodiversity hotspots for conservation priorities. Nature 403:853. doi: 10.1038/35002501
Ogri, O. R. (2001). A review of the nigerian petroleum industry and the associated environmental problems. Environmentalist 21, 11–21.
Olds, A. D., Connolly, R. M., Pitt, K. A., and Maxwell, P. S. (2012). Habitat connectivity improves reserve performance. Conserv. Lett. 5, 56–63. doi: 10.1111/j.1755-263x.2011.00204.x
Pérez-Jorge, S., Pereira, T., Corne, C., Wijtten, Z., Omar, M., Katello, J., et al. (2015). Can static habitat protection encompass critical areas for highly mobile marine top predators? insights from coastal East Africa. PLoS One10:e0133265. doi: 10.1371/journal.pone.0133265
Pikesley, S., Agamboue, P. D., Bayet, J. P., Bibang, J. N., Bonguno, E. A., Boussamba, F., et al. (2018). A novel approach to estimate the distribution, density and at-sea risks of a centrally-placed mobile marine vertebrate. Biol. Conserv. 221, 246–256. doi: 10.1016/j.biocon.2018.03.011
Pikesley, S. K., Broderick, A. C., Cejudo, D., Coyne, M. S., Godfrey, M. H., Godley, B. J., et al. (2015). Modelling the niche for a marine vertebrate: a case study incorporating behavioural plasticity, proximate threats and climate change. Ecography 38, 803–812. doi: 10.1111/ecog.01245
Pikesley, S. K., Maxwell, S. M., Pendoley, K., Costa, D. P., Coyne, M. S., Formia, A., et al. (2013). On the front line: integrated habitat mapping for olive ridley sea turtles in the southeast Atlantic. Diver. Distrib. 19, 1518–1530. doi: 10.1111/ddi.12118
Polidoro, B. A., Ralph, G. M., Strongin, K., Harvey, M., Carpenter, K. E., Arnold, R., et al. (2017). The status of marine biodiversity in the eastern central atlantic (West and Central Africa). Aqua. Conserv. 27, 1021–1034. doi: 10.1111/mec.13943
R Core Team (2016). R: A Language and Environmnet for Statistical Computing. Vienna: R Foundation for Statistical Computing.
Redfern, J. V., Mckenna, M. F., Moore, T. J., Calambokidis, J., Deangelis, M. L., Becker, E. A., et al. (2013). Assessing the risk of ships striking large whales in marine spatial planning. Conserv. Biol. 27, 292–302. doi: 10.1111/cobi.12029
Redfern, J. V., Moore, T. J., Fiedler, P. C., De Vos, A., Brownell, R. L. Jr., Forney, K. A., et al. (2017). Predicting cetacean distributions in data-poor marine ecosystems. Diver. Distrib. 23, 394–408. doi: 10.1111/ddi.12537
Roberts, J., Best, B., Dunn, D., Treml, E., and Halpin, P. (2010). Marine Geospatial Ecology Tools: an Integrated Framework for Ecological Geoprocessing with ArcGIS, Python, R, MATLAB, and C++. New York, NY: ACM.
Rosenbaum, H., and Collins, T. (2006). The ecology, population characteristics and conservation efforts for humpback whales (Megaptera novaeangliae) on their wintering grounds in the coastal waters of Gabon. Bull. Biol. Soc. 12, 633–641.
Rosenbaum, H. C., Maxwell, S. M., Kershaw, F., and Mate, B. (2014). Long-range movement of humpback whales and their overlap with anthropogenic activity in the south atlantic ocean. Conserv. Biol. 28, 604–615. doi: 10.1111/cobi.12225
Salafsky, N., and Margoluis, R. (2003). What conservation can learn from other fields about monitoring and evaluation. BioScience 53, 120–122.
Scales, K. L., Hazen, E. L., Jacox, M. G., Castruccio, F., Maxwell, S. M., Lewison, R. L., et al. (2018). Fisheries bycatch risk to marine megafauna is intensified in Lagrangian coherent structures. Proc. Natl. Acad. Sci. U.S.A. 115, 7362–7367. doi: 10.1073/pnas.1801270115
Scheren, P., Ibe, A., Janssen, F., and Lemmens, A. M. (2002). Environmental pollution in the Gulf of Guinea–a regional approach. Mar. Poll. Bull. 44, 633–641. doi: 10.1016/s0025-326x(01)00305-8
Selig, E. R., Turner, W. R., Troeng, S., Wallace, B. P., Halpern, B. S., Kaschner, K., et al. (2014). Global priorities for marine biodiversity conservation. PLoS One 9:e82898. doi: 10.1371/journal.pone.0082898
Selkoe, K. A., Halpern, B. S., Ebert, C. M., Franklin, E. C., Selig, E. R., Casey, K. S., et al. (2009). A map of human impacts to a “pristine” coral reef ecosystem, the Papahânaumokuâkea Marine National Monument. Coral Reefs 28, 635–650. doi: 10.1007/s00338-009-0490-z
Spalding, M. D., Ruffo, S., Lacambra, C., Meliane, I., Hale, L. Z., Shepard, C. C., et al. (2014). The role of ecosystems in coastal protection: adapting to climate change and coastal hazards. Ocean Coastal Manag. 90, 50–57. doi: 10.1016/j.ocecoaman.2013.09.007
Strindberg, S., Ersts, P. J., Collins, T., Sounguet, G. P., and Rosenbaum, H. C. (2011). Line transect estimates of humpback whale abundance and distribution on their wintering grounds in the coast waters of Gabon. J. Cetacean Res. Manag. 3, 153–160.
Teck, S. J., Halpern, B. S., Kappel, C. V., Micheli, F., Selkoe, K. A., Crain, C. M., et al. (2010). Using expert judgment to estimate marine ecosystem vulnerability in the California Current. Ecol. Appl. 20, 1402–1416. doi: 10.1890/09-1173.1
Thuiller, W., Georges, D., Engler, R., and Breiner, F. (2014). Biomod2: Ensemble Platform for Species Distribution Modeling”. R Package Version 3.1, 64 Edn.
Tomás, J., Godley, B. J., Castroviejo, J., and Raga, J. A. (2010). Bioko: critically important nesting habitat for sea turtles of West Africa. Biodiver. Conserv. 19, 2699–2714. doi: 10.1007/s10531-010-9868-z
Trew, B. T., Grantham, H. S., Barrientos, C., Collins, T., Doherty, P. D., Formia, A., et al. (2019). Using cumulative impact mapping to prioritise marine conservation efforts in Equatorial Guinea. Front. Mar. Sci. doi: 10.5061/dryad.v6wwpzgr9
Tulloch, V. J., Tulloch, A. I., Visconti, P., Halpern, B. S., Watson, J. E., Evans, M. C., et al. (2015). Why do we map threats? linking threat mapping with actions to make better conservation decisions. Front. Ecol. Environ. 13:91–99. doi: 10.1890/140022
Ukwe, C. N., Ibe, C. A., Alo, B. I., and Yumkella, K. K. (2003). Achieving a paradigm shift in environmental and living resources management in the Gulf of Guinea: the large marine ecosystem approach. Mar. Poll. Bull. 47, 219–225. doi: 10.1016/s0025-326x(02)00473-3
UNEP-WCMC (2019). Protected Area Profile for Equatorial Guinea from the World Database of Protected Areas. Cambridge: UNEP-WCMC.
United Nations. (2015). United Nations Sustainable Development Goals. San Francisco, CA: United Nations.
Van Waerebeek, K., Uwagbae, M., Segniagbeto, G. H., Bamy, I. L., and Ayissi, I. (2017). New records of Atlantic humpback dolphin (Sousa teuszii) in Guinea, Nigeria, Cameroon and Togo underscore pressure from fisheries and marine bushmeat demand. Rev. Ecol. 72, 192–205. doi: 10.1016/bs.amb.2015.08.001
Watson, R., Zeller, D., and Pauly, D. (2014). Primary productivity demands of global fishing fleets. Fish Fisher. 15, 231–241. doi: 10.1111/faf.12013
Weir, C. R. (2010). A review of cetacean occurrence in West African waters from the gulf of guinea to angola. Mamm. Rev. 40, 2–39. doi: 10.1111/j.1365-2907.2009.00153.x
Weir, C. R., and Collins, T. (2015). “Chapter four - a review of the geographical distribution and habitat of the atlantic humpback dolphin (Sousa teuszii),” in Advances in Marine Biology, eds T. A. Jefferson and B. E. Curry (Cambridge, MA: Academic Press), 79–117. doi: 10.1016/bs.amb.2015.08.001
Weir, C. R., and Pierce, G. J. (2013). A review of the human activities impacting cetaceans in the eastern tropical Atlantic. Mamm. Rev. 43, 258–274. doi: 10.1111/j.1365-2907.2012.00222.x
Weir, C. R., Van Waerebeek, K., Jefferson, T. A., and Collins, T. (2011). West Africa’s Atlantic humpback dolphin (Sousa teuszii): endemic, enigmatic and soon Endangered? Afr. Zool. 46, 1–17. doi: 10.3377/004.046.0101
Witt, M. J., Baert, B., Broderick, A. C., Formia, A., Fretey, J., Gibudi, A., et al. (2009). Aerial surveying of the world’s largest leatherback turtle rookery: a more effective methodology for large-scale monitoring. Biol. Conserv. 142, 1719–1727. doi: 10.1016/j.biocon.2009.03.009
Witt, M. J., Bonguno, E. A., Broderick, A. C., Coyne, M. S., Formia, A., Gibudi, A., et al. (2011). Tracking leatherback turtles from the world’s largest rookery: assessing threats across the South Atlantic. Proc. R. Soc. B 278, 2338–2347. doi: 10.1098/rspb.2010.2467
Witt, M. J., Broderick, A. C., Coyne, M. S., Ellick, J., Formia, A., Hays, G. C., et al. (2010). Assessing accuracy and utility of satellite-tracking data using Argos-linked Fastloc-GPS. Anim. Behav. 80, 571–581. doi: 10.1016/j.anbehav.2010.05.022
Witt, M. J., Broderick, A. C., Coyne, M. S., Formia, A., Ngouessono, S., Parnell, R. J., et al. (2008). Satellite tracking highlights difficulties in the design of effective protected areas for Critically Endangered leatherback turtles Dermochelys coriacea during the inter-nesting period. Oryx 42, 296–300.
Keywords: cumulative impacts, Gulf of Guinea, marine conservation, marine protected areas, marine mammals, threat mapping, sea turtles, species distribution models
Citation: Trew BT, Grantham HS, Barrientos C, Collins T, Doherty PD, Formia A, Godley BJ, Maxwell SM, Parnell RJ, Pikesley SK, Tilley D, Witt MJ and Metcalfe K (2019) Using Cumulative Impact Mapping to Prioritize Marine Conservation Efforts in Equatorial Guinea. Front. Mar. Sci. 6:717. doi: 10.3389/fmars.2019.00717
Received: 23 August 2019; Accepted: 06 November 2019;
Published: 26 November 2019.
Edited by:
Rochelle Diane Seitz, College of William & Mary, United StatesReviewed by:
Carolyn J. Lundquist, National Institute of Water and Atmospheric Research (NIWA), New ZealandAndrew M. Fischer, University of Tasmania, Australia
Copyright © 2019 Trew, Grantham, Barrientos, Collins, Doherty, Formia, Godley, Maxwell, Parnell, Pikesley, Tilley, Witt and Metcalfe. This is an open-access article distributed under the terms of the Creative Commons Attribution License (CC BY). The use, distribution or reproduction in other forums is permitted, provided the original author(s) and the copyright owner(s) are credited and that the original publication in this journal is cited, in accordance with accepted academic practice. No use, distribution or reproduction is permitted which does not comply with these terms.
*Correspondence: Hedley S. Grantham, aGdyYW50aGFtQHdjcy5vcmc=; Kristian Metcalfe, a3Jpc3RpYW4ubWV0Y2FsZmVAZXhldGVyLmFjLnVr