 René Janßen1
 Wael Skeff2
 Johannes Werner1Marisa A. Wirth2
 Bernd Kreikemeyer3
 Detlef Schulz-Bull2
 Matthias Labrenz1*
- 1Department of Biological Oceanography, Leibniz Institute for Baltic Sea Research Warnemünde, Rostock, Germany
- 2Department of Marine Chemistry, Leibniz Institute for Baltic Sea Research Warnemünde, Rostock, Germany
- 3Institute of Medical Microbiology, Virology and Hygiene, University of Rostock, Rostock, Germany
The widespread herbicide glyphosate has been detected in aquatic coastal zones of the southern Baltic Sea. We monitored community dynamics in glyphosate-impacted chemostats for 20 weeks to evaluate the potential impact of the herbicide on free-living and biofilm-associated bacterial community assemblages in a brackish ecosystem. A HPLC-MS/MS method was developed to measure glyphosate, aminomethylphosphonic acid and sarcosine concentrations within a brackish matrix. These concentrations were analyzed weekly, together with prokaryotic succession, determined by total cell counts and next generation 16S rRNA (gene) amplicon sequencing. Shotgun metagenomics provided insights into the glyphosate degradation potential of the microbial communities. Temporal increases in total cell counts, bacterial diversity and the abundances of distinct bacterial operational taxonomic units were identified in the water column. Biofilm communities proved to be less affected than pelagic ones, but their responses were of longer duration. The increase of glyphosate oxidoreductase (gox) and thiO gene as well as the phn operon abundance indicated glyphosate degradation by first the aminomethylphosphonic acid pathway and possibly a subsequent cleavage of the C-P bond. However, although glyphosate concentrations were reduced by 99%, 1 μM of the herbicide remained until the end of the experiment. Thus, when present at low concentrations, glyphosate may evade bacterial degradation and persist in Baltic Sea waters.
Introduction
Microorganisms are ubiquitous on Earth and respond rapidly to environmental changes. The majority of microorganisms live within biofilms, which promote high cell abundances and activities (Costerton et al., 1995). In mature biofilms, extracellular polymeric substances produced by resident species give rise to a distinct three dimensional structure. That way microorganisms are protected from disturbances that for planktonic cells or even higher organisms induce toxicity and other forms of stress (Davey and O’Toole, 2000; Reese et al., 2016). However, biofilms are not completely invulnerable (Qu et al., 2017), as evidenced by changes in their assemblages in response to a wide range of disturbances.
A potential environmental stressor is glyphosate, which has been in use since the 1970s. Following assessments demonstrating its relatively low environmental toxicity, it has become the most widely produced and sold herbicide worldwide. However, as a synthetic combination of glycine and a phosphate residue, coupled to form a stable phosphonate, glyphosate provides carbon (C), nitrogen (N), and phosphorus (P) for bacteria and fungi (Lipok et al., 2007; Duke and Powles, 2008). Two major routes of glyphosate biodegradation have been described according to their first respective intermediate: the sarcosine pathway and the aminomethylphosphonic acid (AMPA) pathway, encoded mainly by the phn operon and the glyphosate oxidoreductase (gox) gene, respectively. The phn operon encodes a C-P lyase, whose activity makes the P component of phosphonate bioavailable. In the AMPA pathway, glyphosate is cleaved at the C-N bond, resulting in AMPA and glyoxylate. An alternative pathway to yield AMPA from glyphosate was discovered with the enzyme glycine oxidase encoded by thiO. However, this enzyme possesses an unspecific Km of 87 mM for glyphosate, compared to 0.6 mM for glycine (Pedotti et al., 2009).
Glyphosate has been detected in marine and freshwater systems (Van Bruggen et al., 2018; Carles et al., 2019), representing a disturbance to microbial communities at concentrations upwards of 5.92 nM (Stachowski-Haberkorn et al., 2008). Moreover, its dissipation is enhanced by biofilms, probably due to their adsorption capacities (Klátyik et al., 2017). The presence of glyphosate in the brackish Baltic Sea from agricultural runoff has been reported (Skeff et al., 2015), but the effects of the herbicide on its ecosystems are as yet unknown. The Baltic Sea is known for elevated contamination levels and monitoring of the environmental state is mandatory (Helcom, 2018). Thus, the aim of this study was to investigate the impact of glyphosate on the state and succession of bacterial community assemblages in a Baltic-Sea-like environment. Potential effects were compared between free-living and biofilm communities, as biofilm communities are expected to be more resilient. Furthermore, the potential for and means of biodegradation, as well as the possibly involved OTUs, were analyzed to evaluate the fate of glyphosate entering the Baltic Sea.
Materials and Methods
Experimental Setup
Microcosm Experiment
The experiment was conducted in two 12 L (20 × 30 × 20 cm) microcosms (Rebie Aquaristik, Bielefeld, Germany) made of float glass plates sealed with silicone glue. The microcosms were filled with 2 kg of combusted quartz sand as hard substrate, 8 L artificial brackish water (ABW) amended with casamino acids as liquid medium (modified after Bruns et al., 2002) and combusted GF/F microfiber filters (Ø 47 mm, Whatman, Little Chalfont, United Kingdom) as collectible, inert biofilm substrate. An air pump aerated and mixed the system continuously. The microcosms were incubated with a Baltic Sea-derived inoculum and the 140-day experiment started with an equilibration period from day −69 until day 0 to allow biofilm to form and mature. On day −31 the system switched from batch to continuous cultivation mode with an average efflux rate of 475–489 mL⋅d–1. During the whole period microbial succession in both microcosms was monitored. On day 0, a sterile-filtrated glyphosate solution (final concentration of 82.45 μM; Dr. Ehrenstorfer, Augsburg, Germany) was syringe-injected into the water column of the treatment microcosm and dispersed throughout by manual stirring. Monitoring went on until day +71. For further details on experimental procedures see Janßen et al. (2019).
Prevention of Glyphosate Adsorption to Abiotic Surfaces
Glyphosate can adsorb to glass or sediment surfaces (Bergström et al., 2011; Huang and Zhang, 2011) and might also adhere to biofilms. Adsorption may affect not only glyphosate degradation in the liquid phase but also act as a glyphosate reservoir during incubations. However, a surface adsorption test performed prior to the start of our experiment showed stable glyphosate concentrations in the water column of the glyphosate-containing microcosms (Supplementary Material 1).
Sampling Procedure
Five-mL water samples for glyphosate, AMPA, sarcosine/L-alanine and nutrient analyses were stored at −20°C without further treatment. For nucleic acid extraction and subsequent next-generation sequencing (NGS) of planktonic cells, 100 mL of water was filtered through 0.22-μM GVWP filters in three replicates. For the analysis of biofilm communities, three overgrown GF/F filters were selected with sterile tweezers. The total data set consisted of 287 samples, with water samples covering 16 time points (days −25, −7, 0, +3, +7, +10, +14, +17, +22, +29, +36, +43, +50, +57, +64, +71) and biofilm filters eight time points (days −7, 0, +7, +17, +29, +43, +57, +71). Detailed meta-information describing the samples is provided in Supplementary Material 2. The filters were shock frozen in liquid nitrogen and stored at −80°C until their use for DNA/RNA extractions. Planktonic cell counts were determined in 1-mL water samples fixed with 1/10 v⋅v–1 formol (37%, sterile filtered, Rotipuran p.a. ACS, Carl Roth GmbH, Karlsruhe, Germany), incubated for at least 2 h at room temperature or overnight at 4°C and processed within 24 h. For C and N analyses, 100 mL of water was collected on day +71.
Determination of Total Cell Counts
Water column cell counts were determined by 4′,6-diamidino-2-phenylindole (DAPI; Applichem GmbH, Darmstadt, Germany) staining according to Porter and Feig (1980). To ensure that cells on the filter surfaces were evenly distributed, the cells on the filter were diluted, if necessary, using sterile ABW. The cells obtained by filtering 50–500 μL of water on a Cyclopore filter (PC BLK, 25 mm, 0.2 μm, Whatman, Maidstone, United Kingdom) were stained with 10 mg DAPI⋅L–1 for 3 min and embedded using AF1 (Citifluor Ltd, London, United Kingdom) and Vectashield (H 1000, Vector Laboratories, Burlington, CA, United States) at a 7:1 ratio. Total cell counts were determined in triplicate samples using an Axio Lab. A1 equipped with a N-Achroplan 100× oil dispersion objective (both Carl Zeiss AG, Göttingen, Germany). Twenty small quadrats were counted in 25 different fields of view per filter.
Significance Testing Applied to Total Cell Counts
To test for a statistically significant change in total cell counts after the addition of glyphosate, the cell counts prior to (days −7 to +3) and after (days +28 to +36) the cell number increase were combined and compared with the counts from days in which cell numbers increased (days +7 to +22). A second comparison was performed between treatment and control microcosms for the cell counts from day +7 to +22 only. Total cell counts were analyzed in triplicate samples using a two tailed t-test for two heteroscedastic samples. Significant changes (p < 0.05) are marked with ∗ in Figure 1A.
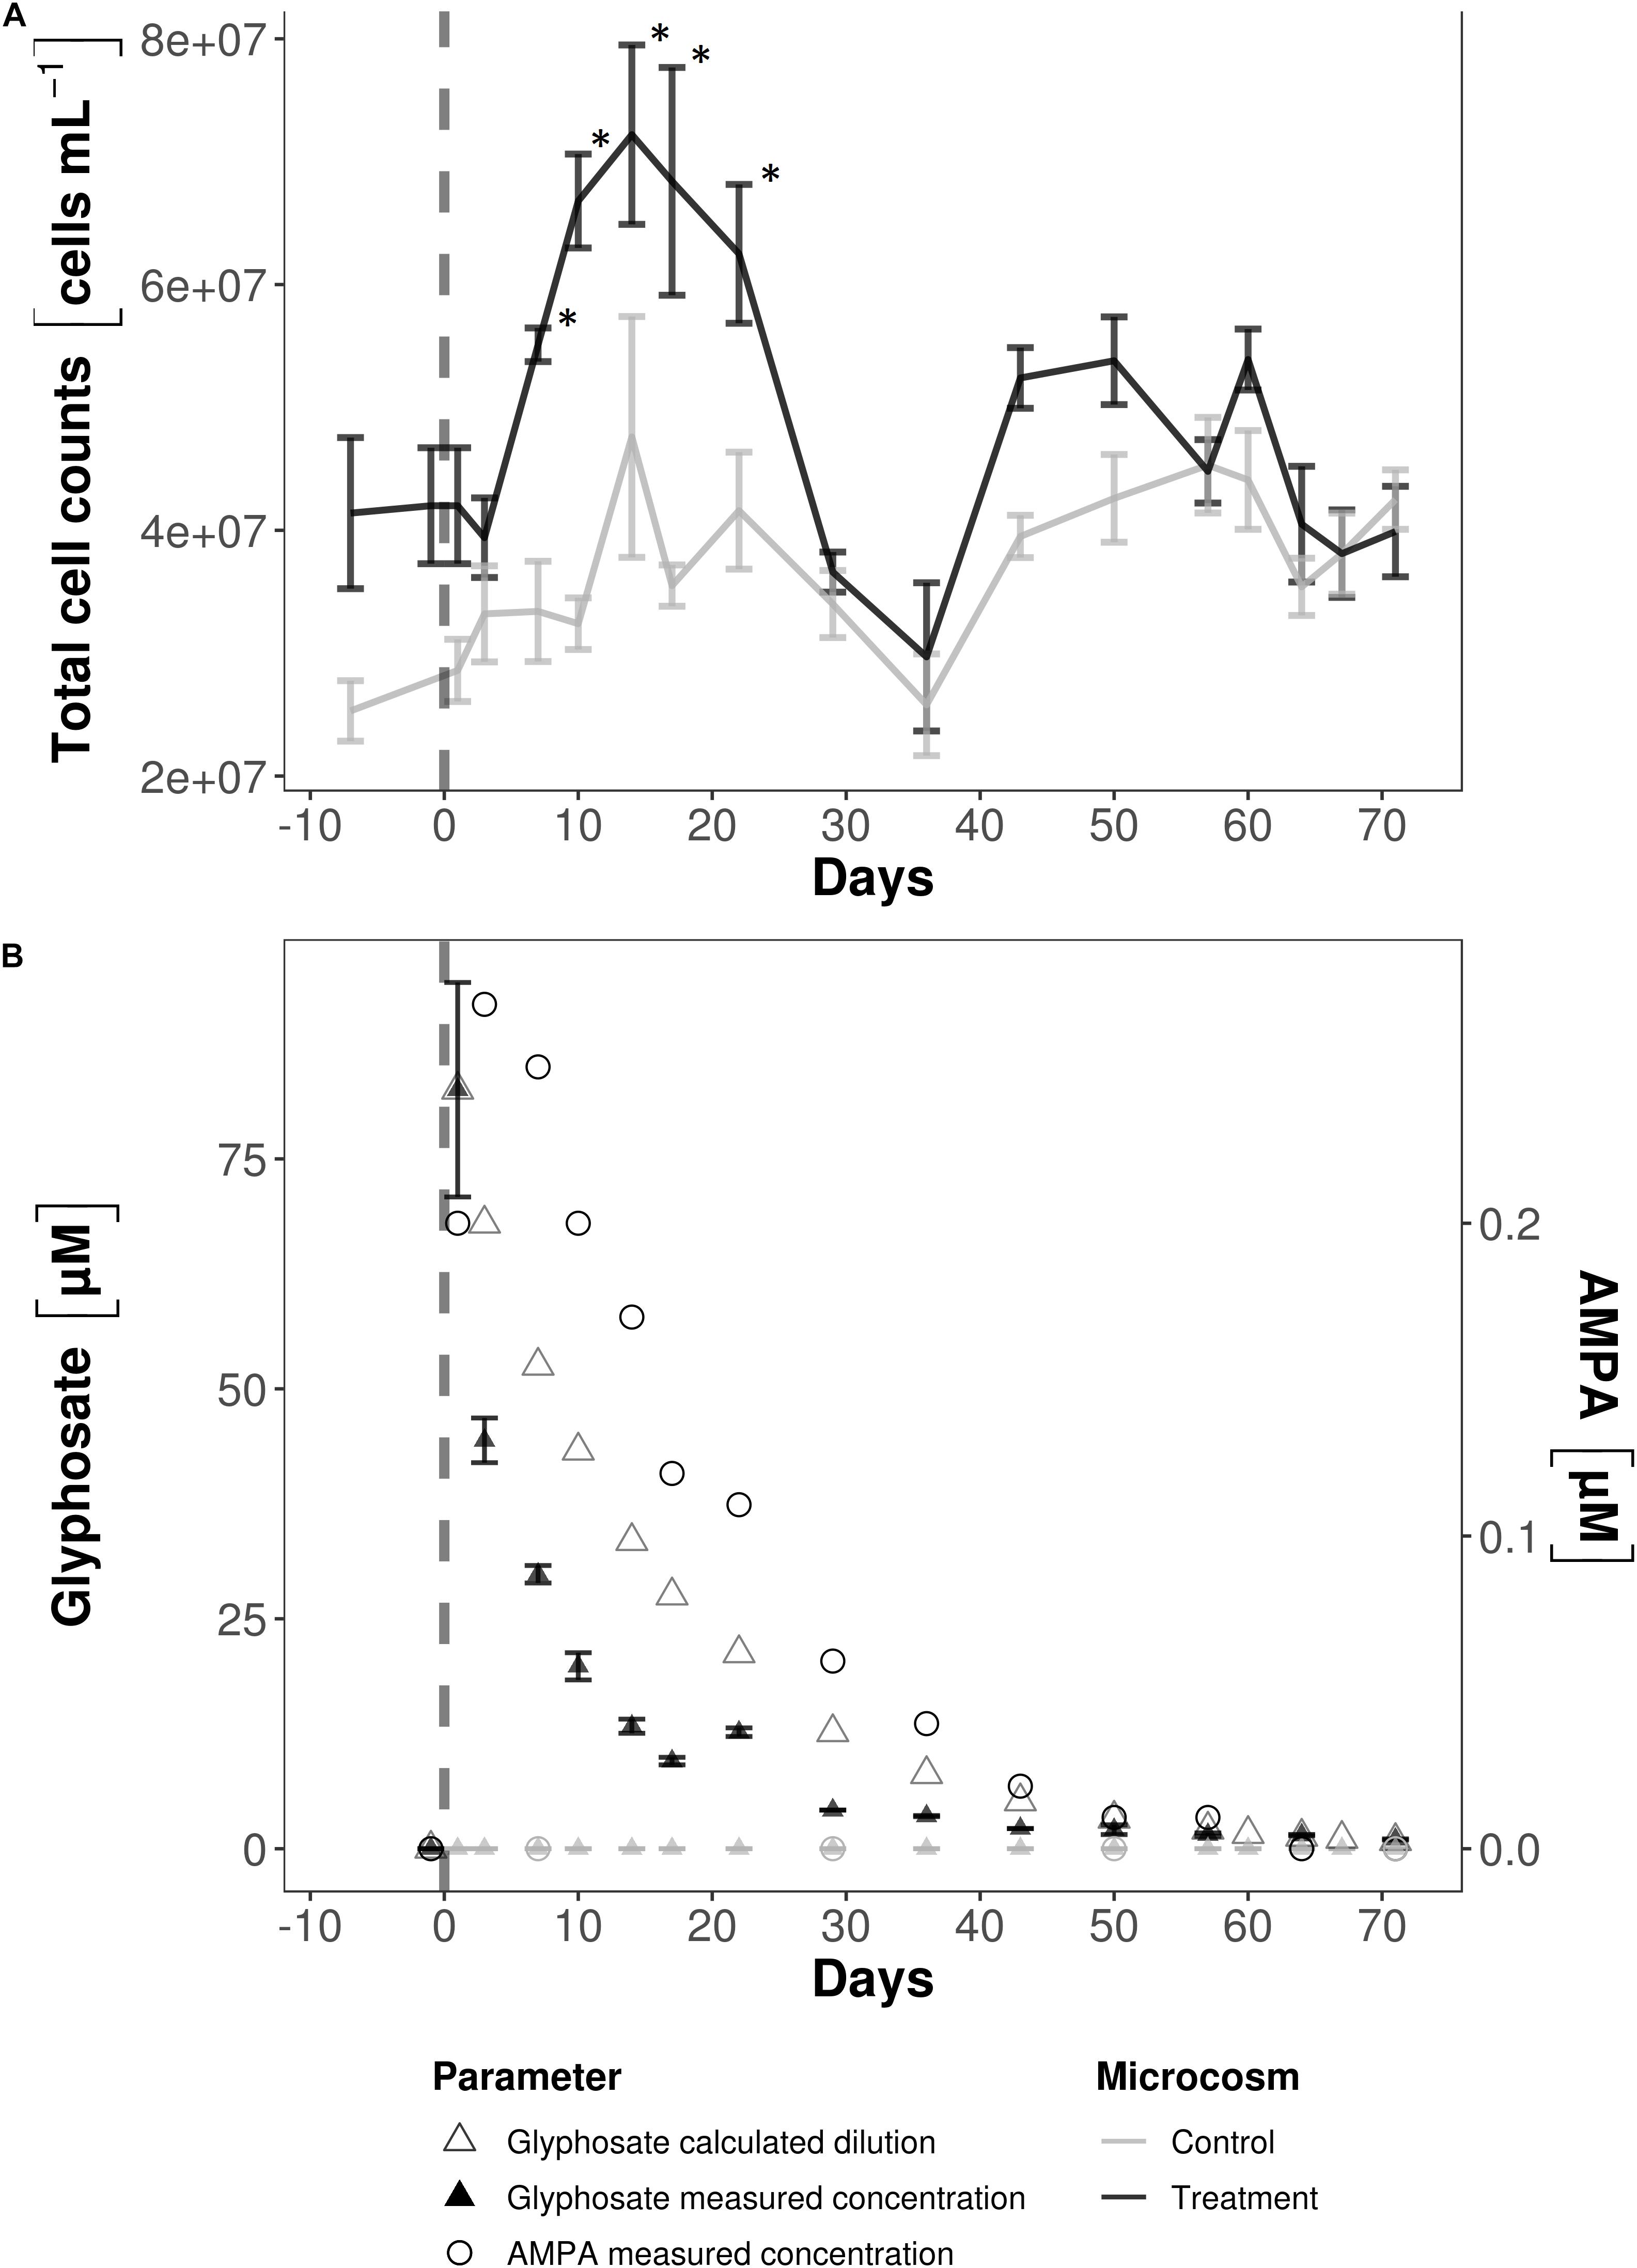
Figure 1. Total cell counts (A) and glyphosate and AMPA concentrations (B) in the water column of the microcosms. (A) Total cell counts after glyphosate addition at day 0 increased significantly (∗) compared to cell numbers before and later after herbicide addition (p < 0.001) and to the cell counts of the control microcosms during the same time period (p < 0.001). (B) On day 0, the concentration was measured before and after glyphosate addition. AMPA was already present in the first sample taken 4 h afterward, though not at its highest concentration. The decrease in the calculated glyphosate concentration was slower than the measured values. Note the different scales for glyphosate and AMPA and that at the end of the experiment glyphosate persisted at a concentration > 1 μM.
Nutrient Analysis
To understand the nutritional relevance of glyphosate, particulate organic nitrogen and carbon (POC/PON) concentrations were analyzed using an vario Micro element analyzer (Elementar Analysensysteme GmbH, Langenselbold, Germany), and dissolved organic carbon and nitrogen (DOC/DON) concentrations using a Shimadzu TOC-V + TNM1 analyzer (Duisburg, Germany). Dissolved inorganic phosphorus (DIP) was measured following the method of Grasshoff et al. (2007).
Glyphosate and AMPA Analysis
Glyphosate and AMPA analyses followed the procedure of Skeff et al. (2015, 2016). Internal standards of glyphosate (1-2-13C2 15N glyphosate) and AMPA (13C 15N AMPA) were prepared in the same sample matrices and added to the samples. The samples were adjusted to pH 9 by the addition of 100 μL of borate buffer and then derivatized by treatment with 100 μL of 19.8 mM FMOC-Cl in acetonitrile. After 4 h of incubation at 21°C, the derivatized samples were filtered through a 0.45-μm Phenex-RC 15-mm syringe filter and subjected to LC–MS/MS. The target compounds were analyzed using an Accela HPLC system connected to a TSQ Vantage triple quadrupole mass analyzer with a heated electrospray ionization source interface. Chromatographic reversed-phase separation was achieved on a Gemini-NX C18 column coupled to a Gemini-NX Security Guard cartridge. The samples were eluted gradually from the column with (a) a 2 mM ammonium hydrogen carbonate buffer and ammonia solution (32%, v⋅v–1) at pH 9 and (b) acetonitrile. Before the analysis, the instrument was calibrated for the target substances using the same sample matrices. Each compound, including the internal standard, was scanned for two transitions in selected reaction monitoring mode. The most abundant transition was used for quantification and the other transition for confirmation.
Additional measurements for AMPA and sarcosine were carried out after an initial evaluation of the data. The applied method generally followed the procedure described above, with the following differences: After derivatization of the samples, 1 mL of dichloromethane was added to the mixture to extract the remaining FMOC-Cl. Samples were shaken and then centrifuged for 10 min at 1000 rpm. The supernatant was removed and transferred into a vial for analysis. Chromatographic separation and mass spectrometric detection was carried out as described above, but with a LC-2040C Nexera-I and a triple quadrupole mass spectrometer LCMS-8060 as also described in Wirth et al. (2019). Compounds were detected through SRM events, as described above. Sarcosine has the same MS fragments and retention time as L-alanine, since the two compounds are isomers. Thus, they could not be differentiated with the utilized method. To acquire evidence for the presence or absence of sarcosine in the samples, comparative measurements between samples from both microcosms were conducted, since the L-alanine concentration should be identical.
Nucleic Acid Extraction and Sequencing
The kit-based extraction of nucleic acids from free-living bacteria and subsequent DNAse digestion of the RNA extracts were performed according to Bennke et al. (2018). Biofilm samples were extracted using the phenol-chloroform method described in Weinbauer et al. (2002). cDNA synthesis was performed using 20 ng of DNA-free total RNA as the input for the MultiScribe (Fisher Scientific GmbH, Germany) reverse transcriptase system using the reverse primer 1492r (5′ TACGGYTACCTTGTTACGACTT, Lane, 1991). Illumina amplicon sequencing was prepared as described in Bennke et al. (2018). The V3-V4 region of the 16S rRNA gene was targeted using the primer set 341f-805r (forward: CCTACGGGNGGCWGCAG, reverse: GACTACHVGGGTATCTAATCC, Herlemann et al., 2011). Indexed amplicon libraries were pooled to a concentration of 4 μM. The PhiX control was spiked into the library pools at a concentration of 10%. Each final library pool (4 pM) was subjected to one of three consecutive individual paired-end sequencing runs using 600 cycle V3 chemistry kits on an Illumina MiSeq.
Bioinformatic and Statistical Analysis of the Amplicon Data
Amplicon read processing and annotation were conducted using Mothur v. 1.39.5 (Schloss et al., 2009). Sequences were combined in a pre-cluster step if there were less than 2 mismatches. Chimeras were removed using VSEARCH (Rognes et al., 2016). OTUs were picked based on a 98% similarity threshold. When counting the number of OTUs, singletons were ignored, but not removed from the data set. OTUs were only removed where mentioned and all parameters are deposited in the Github repository listed in the data availability statement.
The operational taxonomic unit (OTU) and taxonomy table were imported into R v. 3.5.1 (R Core Team, 2018) and analyzed using phyloseq v. 1.26.0 (McMurdie and Holmes, 2013), ggplot2 v. 3.1.0 (Wickham, 2009) and DESeq2 v. 1.22.1 (Love et al., 2016). Taxonomic annotation of the data presented herein was accomplished using the Silva release 132 (Yilmaz et al., 2014), including the taxonomic changes proposed by Parks et al. (2018).
Basic information on the amplicon sequencing-based approaches is provided in Supplementary Material 3, including the MiSeq run statistics, sequencing depth and average sequence length in the 16S complementary rRNA and 16S rRNA gene libraries.
The composition of the microbial communities was plotted enforcing a relative abundance cut-off value of 0.15% at order level to reduce the legend size. To identify OTUs whose abundance changed after glyphosate addition, unfiltered 16S rRNA gene and 16S rRNA OTU tables were used separately as input for DESeq2, as suggested by McMurdie and Holmes (2014). DESeq2 performed the Wald test on two time points (in three technical replicates) before glyphosate addition versus five time points directly thereafter. For the less-frequent biofilm sampling, the time span was the same, resulting in comparisons of two time points before versus two time points immediately after glyphosate addition. The abundances of selected OTUs were plotted. The relative abundances of the OTUs in treatment and control microcosms were compared manually to identify those OTUs that responded to glyphosate.
The similarity of microbial communities was visualized in non-metric multidimensional scaling (NMDS) analyses based on Bray–Curtis dissimilarities. Relative abundances were used as input, square-root-transformed and Wisconsin double-standardized. The ordination with the lowest stress was determined based on 100 runs. OTUs with at least three reads were included. OTU tables for the Chao1 richness estimate and Shannon index included singletons. A t-test was applied to analyze the significance of a change in α-diversity after glyphosate addition and was performed for all sample subsets from day −22 to day 0 vs. day +3 to day +17.
To include the concentration of glyphosate into the ordination, canonical correspondence analysis (CCA) and redundancy analysis (RDA) were performed within phyloseq using its ordinate function. The input data was as described for NMDS and glyphosate concentration was the constraint. The resulting plots are shown in Supplementary Material 4.
Metagenomic Analysis
For metagenomic analyses, technical replicates of DNA extracts were pooled. Metagenomic reads of seven treatment and three control microcosm water-column samples were generated by a full run on an Illumina Nextseq500 (LGC Genomics GmbH, Berlin, Germany). Reads were quality checked using FastQC v. 0.11.71 and trimmed with Trimmomatic v. 0.38 (Bolger et al., 2014). The individual samples were merged and co-assembled using MEGAHIT v. 1.1.3 (Li et al., 2014) with the k-mer list 21, 25, 29, 33, 37, 41, 45, 49, 53, 57, 61, 65, 69, 73, 77, 81, 85, 89, 93, 97, and 99. The genes were predicted and functionally annotated using Prokka v. 1.13.0 (Seemann, 2014). For gene quantification, the reads of the individual samples were mapped on the assembled contigs using Kallisto v. 0.44.0 (Bray et al., 2016).
Functional Tree Calculation
Correlations between the abundances of OTUs and glyphosate degradation genes were identified. Protein sequences of organisms related to the OTUs identified in this study were downloaded from UniProt (Bateman et al., 2017). The corresponding genes identified in the assembled metagenome were translated and added to this sequence set. After the removal of exact duplicates using CD-Hit auxtools v.4.6.8 (Fu et al., 2012), a multiple sequence alignment was built using Mafft v. 7.407 (Katoh and Standley, 2013). A phylogenetic tree was calculated using RAxML v. 8.2.12 (Stamatakis, 2014), with “PROTCATAUTO” as the amino acid substitution model, and plotted together with the respective abundances using R package ggtree v. 1.8.2 (Yu et al., 2018). This workflow was implemented in Nextflow v. 18.10.1 (Di Tommaso et al., 2017).
No gox genes were annotated in the metagenomes. Instead, a sequence-based approach was used: reference sequences of gox were downloaded from UniProt and GenBank to create a DIAMOND database (v. 0.9; Buchfink et al., 2014). The metagenomic sequences were blasted against the DIAMOND database (e-value of 1E–8, sequence identity ≥ 40%, query coverage ≥ 70%) and eventually phylogenetic trees with the corresponding abundance were plotted as described above.
Results
Total Cell Counts, Glyphosate and AMPA Concentrations and Nutrients
Total cell counts in the water column were in the range of 2–4 × 10⁷ cells⋅mL–1 both in the treatment and control water samples (Figure 1A). Following glyphosate addition, they increased significantly, up to 7 × 10⁷ cells⋅mL–1, and remained elevated over the following 14-day period, during which the decrease in glyphosate was the strongest (Figure 1B). Based on the chemostat’s volume and flow rate, the theoretical glyphosate concentration after approximately 60 days of incubation was close to zero. With a starting glyphosate concentration of 82.45 μM at day 0, the measured glyphosate concentrations, especially within the first two weeks of incubation, were 18–24 μM lower than the theoretical values. The results of the adsorption test (Supplementary Material 1) suggested that glyphosate was neither incorporated into biofilms nor adsorbed onto surfaces under our experimental conditions. After 71 days, glyphosate concentrations were reduced by 99%. AMPA was detected as soon as 4 h after addition in the first sample. 3 days later AMPA concentrations ranged from 0.27 μM to below the detection limit (LOD) by day +64 and +71. The highest ratio of AMPA to glyphosate was 1.35% on day +29. Peaks representing the isomers sarcosine and L-alanine could also be detected but were not reliably quantifiable, as their concentration (−0.017 to 0.016 μM) was close to the LOD. The peaks were present in both microcosms, before and after the addition of glyphosate.
The DIP concentration on day −69 was 15 μM, and on day 0 before and after glyphosate addition 23.3 and 24 μM, respectively. On day +71, at the end of the experiment, it declined to 16 μM. DOC and DN concentrations in the microcosms on day +71 were 80,000 and 20,000 μM, respectively. The resulting DOC:DN:DIP ratios were 238:56:1 for 24 μM DIP and 380:90:1 for 15 μM DIP.
16S rRNA and rRNA Gene Based Community Compositions
Among the 12,852 OTUs with more than one read, 10,692 originated from the water column. Two thousand nine hundred and three OTUs stem from the biofilm and 743 OTUs were present in both habitats. Planktonic 16S rRNA was roughly twice as rich in OTUs as either the planktonic 16S rRNA genes or the biofilm communities (Supplementary Material 2). Based on the number of reads, free-living (Figure 2) and biofilm (Supplementary Material 5) microbial community assemblages consisted almost exclusively of Proteobacteria, mainly Alpha- and Gammaproteobacteria. After the glyphosate pulse Alphaproteobacteria eventually comprised > 90% of the bacterial assemblages in the treatment microcosm. Therein, Rhizobiales and Rhodospirillales represented large and increasing portions thereof. Unclassified Rhizobiales OTU 1 was the most abundant OTU, up to 84% in the biofilm 16S rRNA (Supplementary Material 6). However, Pseudomonas OTU 7 reads (Supplementary Material 6) represented up to 25% of the 16S rRNA community in the water column of the treatment microcosm. Pseudomonas OTU 7 increased in abundance after the glyphosate pulse together with Alteromonadales, which includes the genus Gallaecimonas. In total, the OTUs covered > 320 genera, with 280 genera represented by 1–10 OTUs each. Ten very abundant genera, including Hoeflea, Ferrovibrio and undistinguished taxa (e.g., “unclassified” or “uncultured”), were represented by 100–318 OTUs. Based on a 0.01% relative abundance threshold, the biofilm community consisted of 90 genera and the water column community of 75 genera, with 59 shared genera (Supplementary Material 2). The diversity of members of the Gammaproteobacteria was evidenced by the finding that 10,088 of the 12,852 OTUs belonged to Pseudomonas, although > 98% of them were present at abundances of < 0.01%.
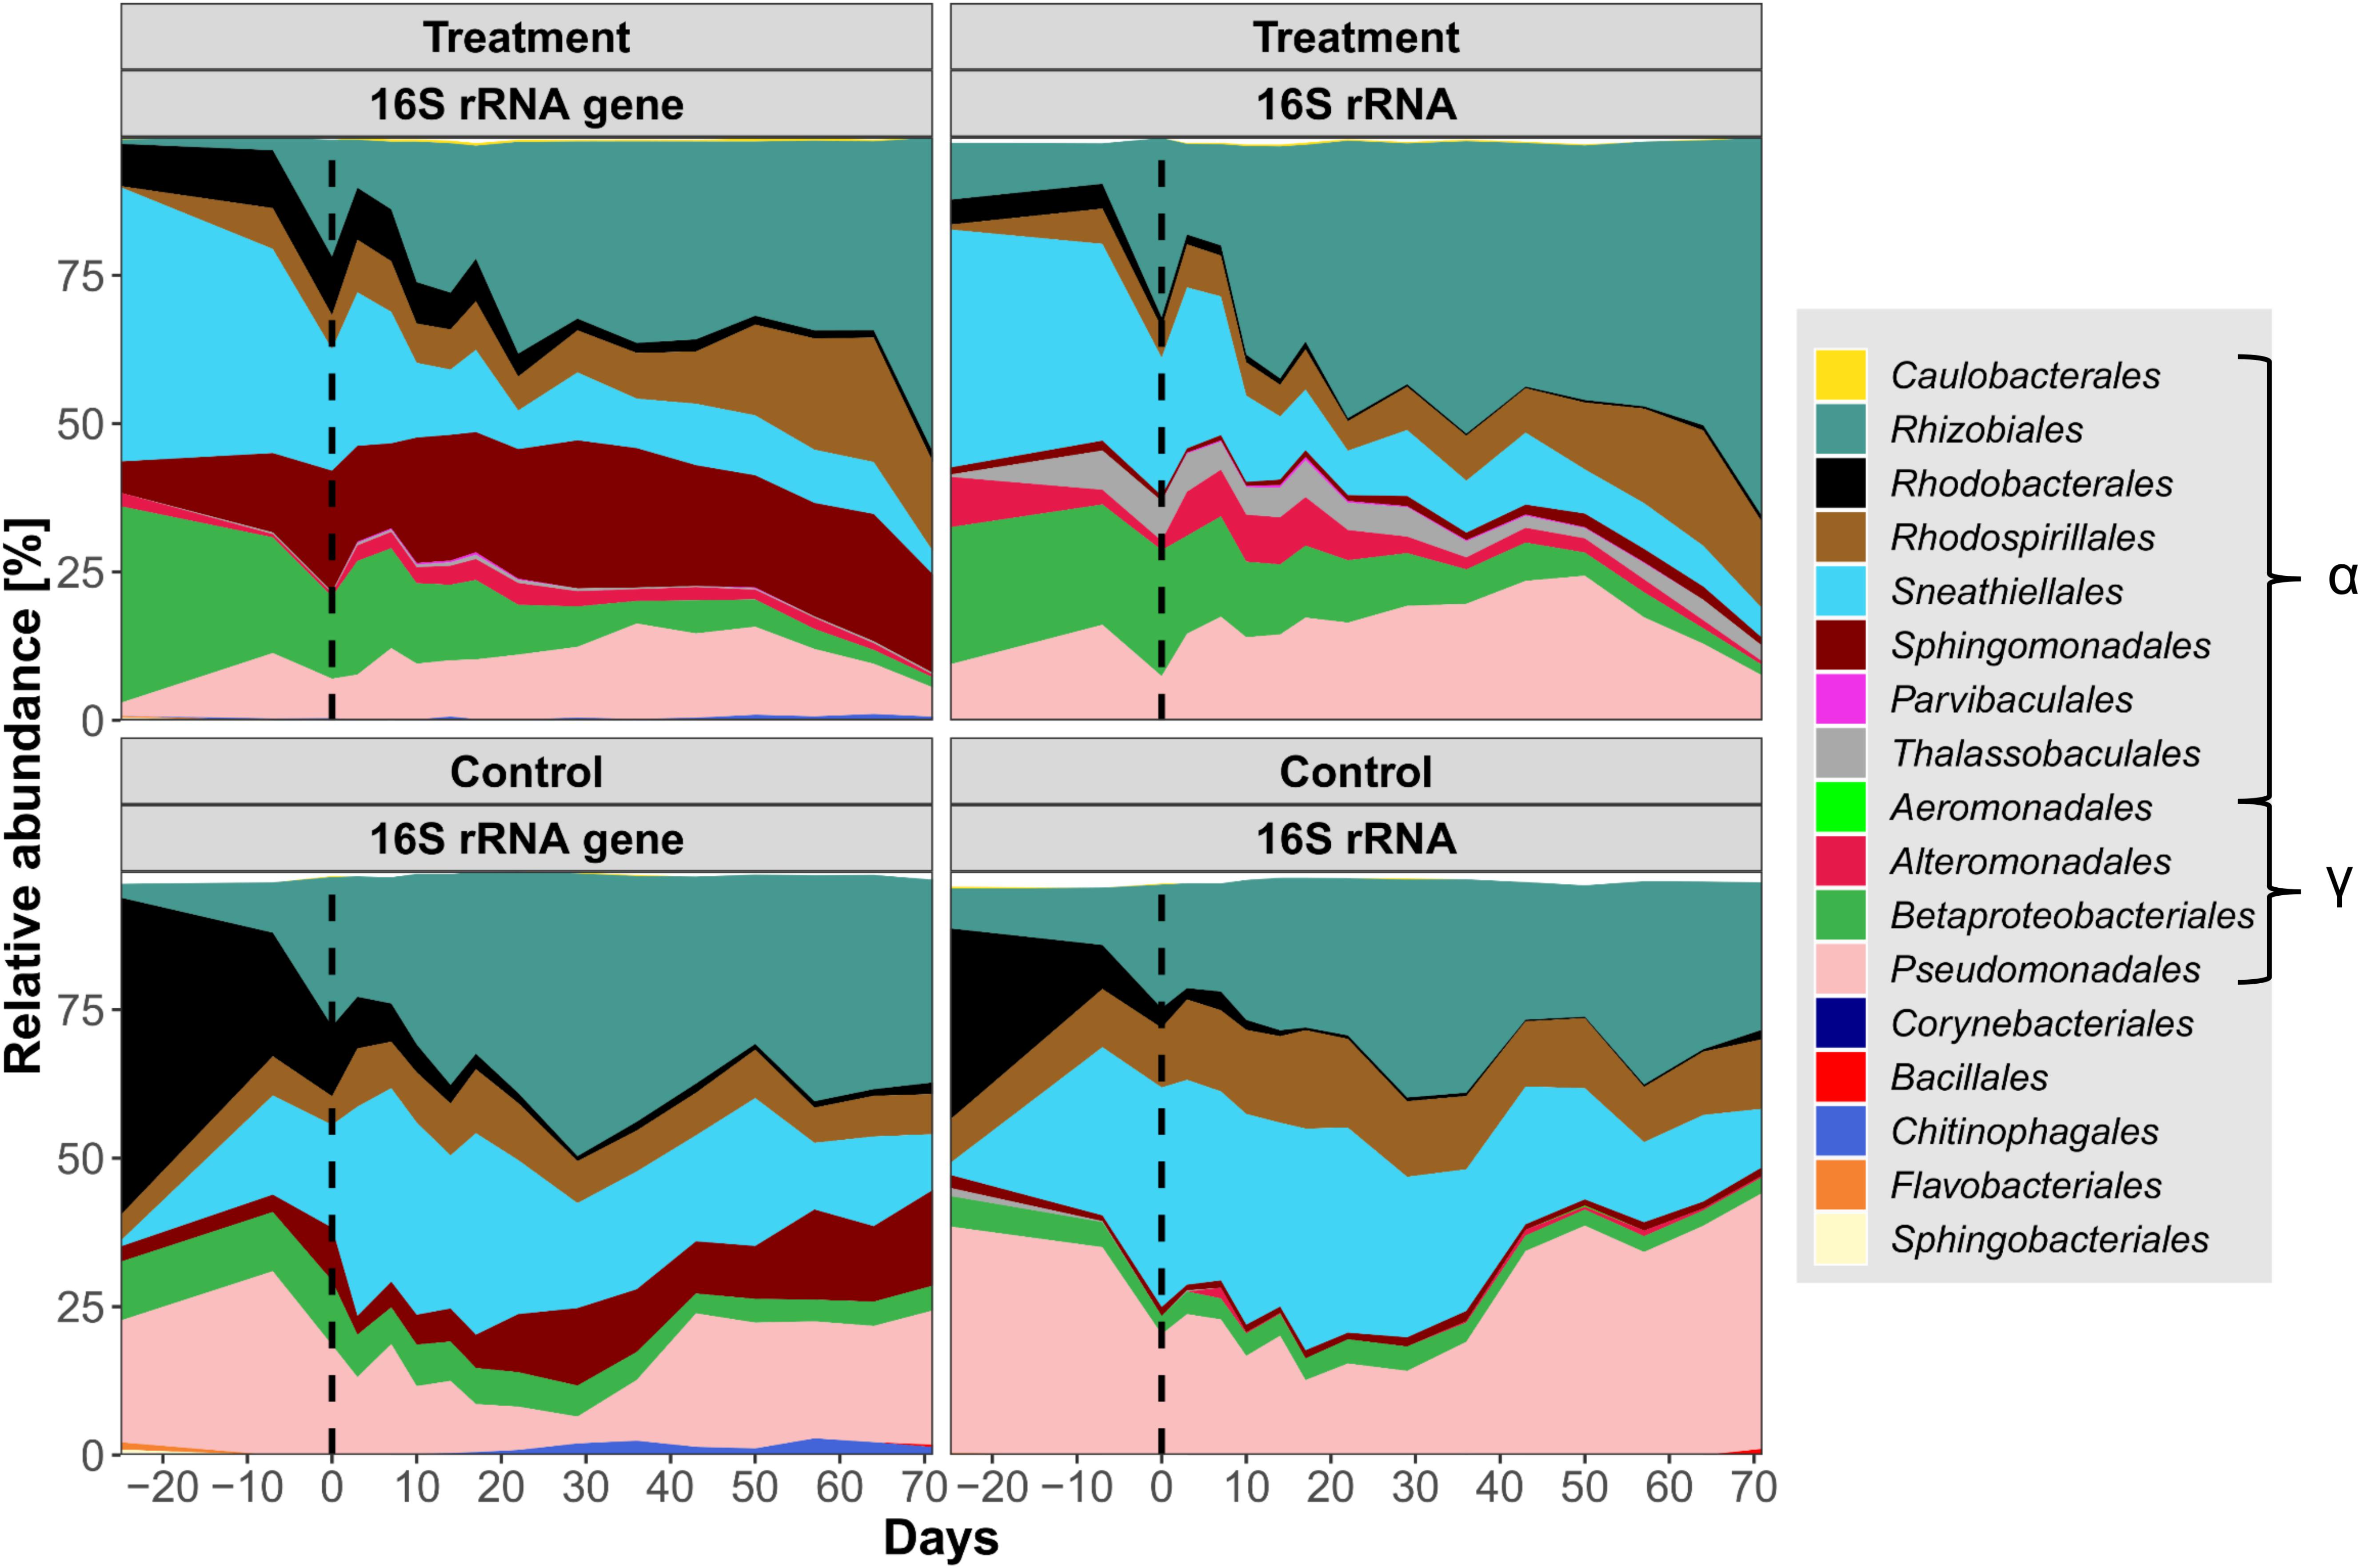
Figure 2. Relative planktonic community composition in the treatment and control microcosms based on 16S rRNA gene and 16S rRNA abundances. Taxa were cumulated on the order level, sorted by class. α = Alphaproteobacteria, γ = Gammaproteobacteria. All orders with a relative abundance > 0.15% are displayed. Time of glyphosate addition is indicated by a vertical dashed line. Notice the dominance of Proteobacteria and the overall increase of planktonic Alphaproteobacteria.
NMDS Ordination
Overall changes in 16S rRNA and 16S rRNA gene OTU composition were visualized via NMDS. Both 16S rRNA genes and 16S rRNA based assemblages were mainly arranged along the NMDS 2 axis, thus correlating with the sampling time (Figure 3). Samples from treatment and control microcosms were clearly separated. The PERMANOVA yielded p-values of <0.001, with no significant differences in the dispersion of the control vs. the treatment groups for all subsets. In general, the water column samples from the treatment microcosms were more similar along NMDS 2 than were the control microcosms. Water column 16S rRNA gene (stress 0.113) and 16S rRNA (stress 0.102) based community compositions produced similar ordinations. However, the 16S rRNA gene data formed two main clusters that were separated by the glyphosate pulse (day 0 vs. day +3). As long as glyphosate concentrations exceeded 5.92 μM (day +3 to day +22), the free-living community composition in the treatment microcosm formed a subcluster (red polygons in Figure 3). These observations also applied to the 16S rRNA data but the differences were less distinctive.
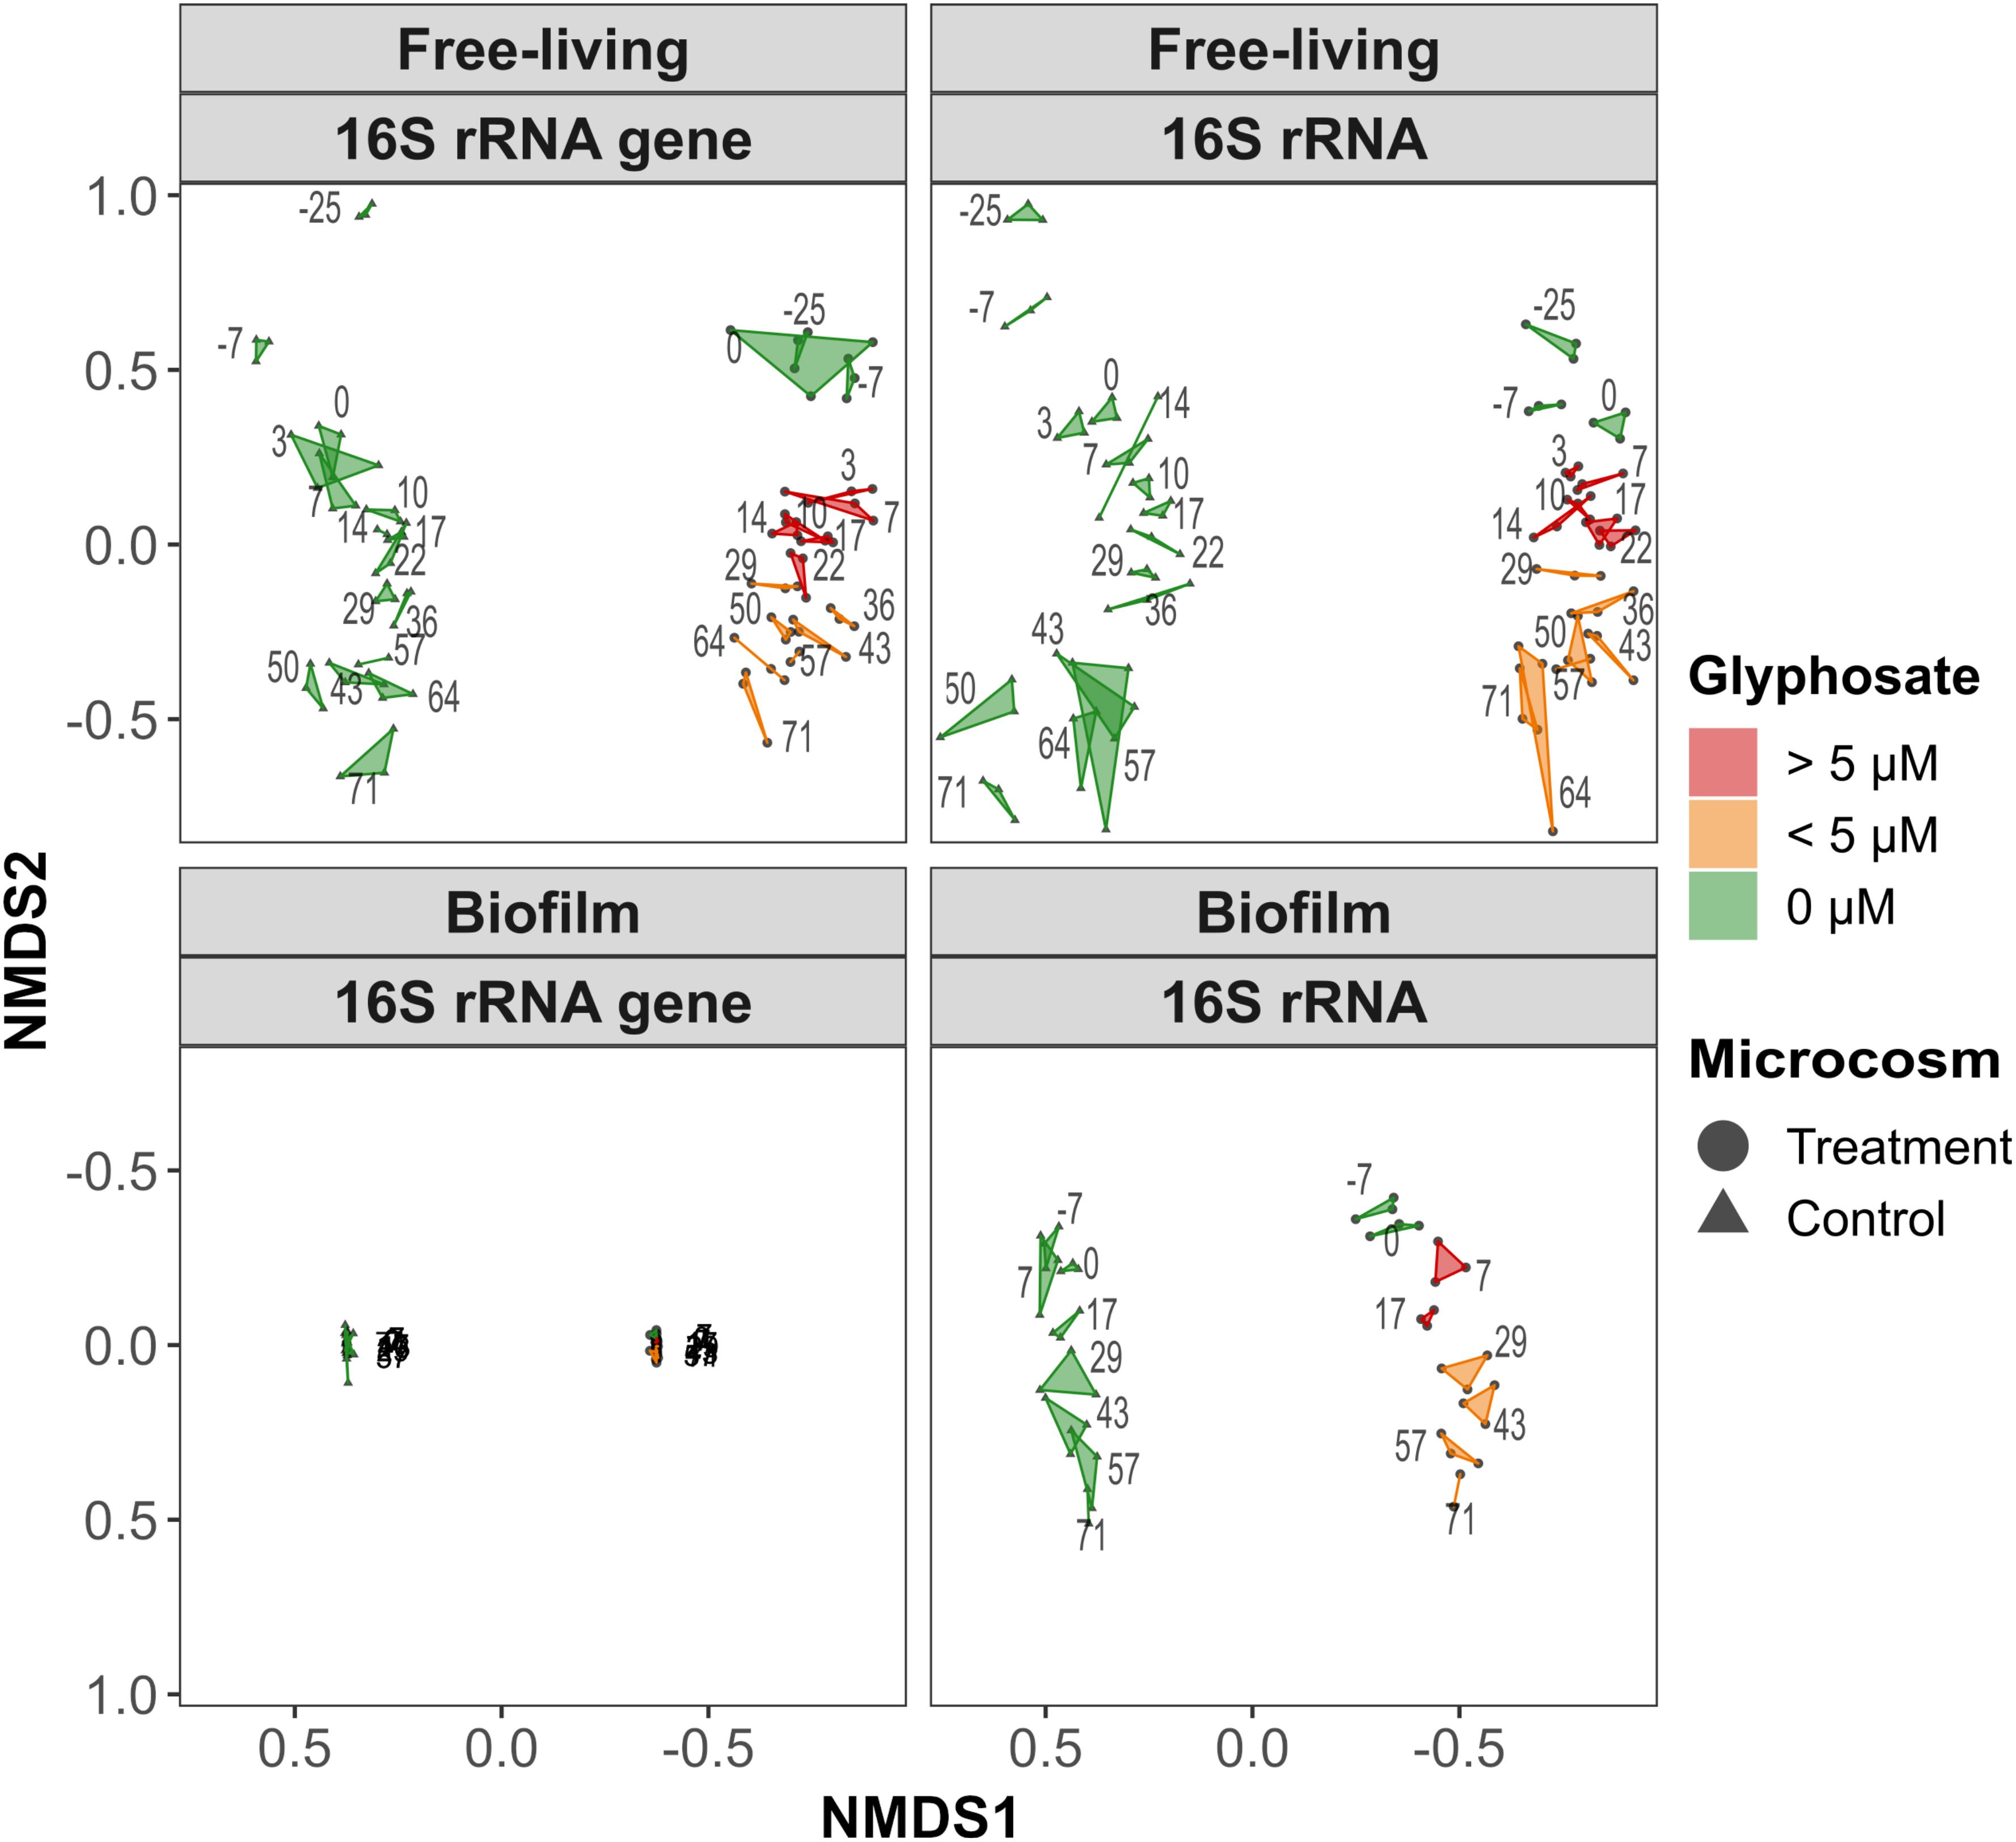
Figure 3. NMDS ordination plots based on the Bray–Curtis dissimilarity of the square-root-transformed and Wisconsin double-standardized 16S rRNA gene and 16S rRNA based community composition in the biofilms and water column. The axis direction for the biofilm ordinations was reversed to correspond to the pelagic orientation. The numbers refer to the sampling day; glyphosate was added before day 3. Technical replicates are connected by a polygon colored according to the measured glyphosate concentration.
Based on 16S rRNA gene data from the biofilm (stress 0.042), all communities remained stable. Biofilm community succession was generally less pronounced than that of planktonic communities, while control and treatment assemblages spanned a similar distance on NMDS2. In contrast to the control samples, the overall biofilm 16S rRNA (stress 0.072) communities before and after glyphosate addition (days −7 to +7) formed distinguishable clusters.
Alpha Diversity Measures
The Shannon index was statistically assessed to test the impact of glyphosate on community diversity. Samples were grouped before and after day 0. For planktonic samples, the trend in the diversity of control microcosm communities was toward lower indices whereas in the treatment microcosm diversity increased temporarily after glyphosate addition, from a Shannon index of about 2.2 to >2.5 (Figure 4). This development was again more pronounced for the 16S rRNA gene data, in which a significantly higher estimated richness (Chao1) after the pulse was also evident.
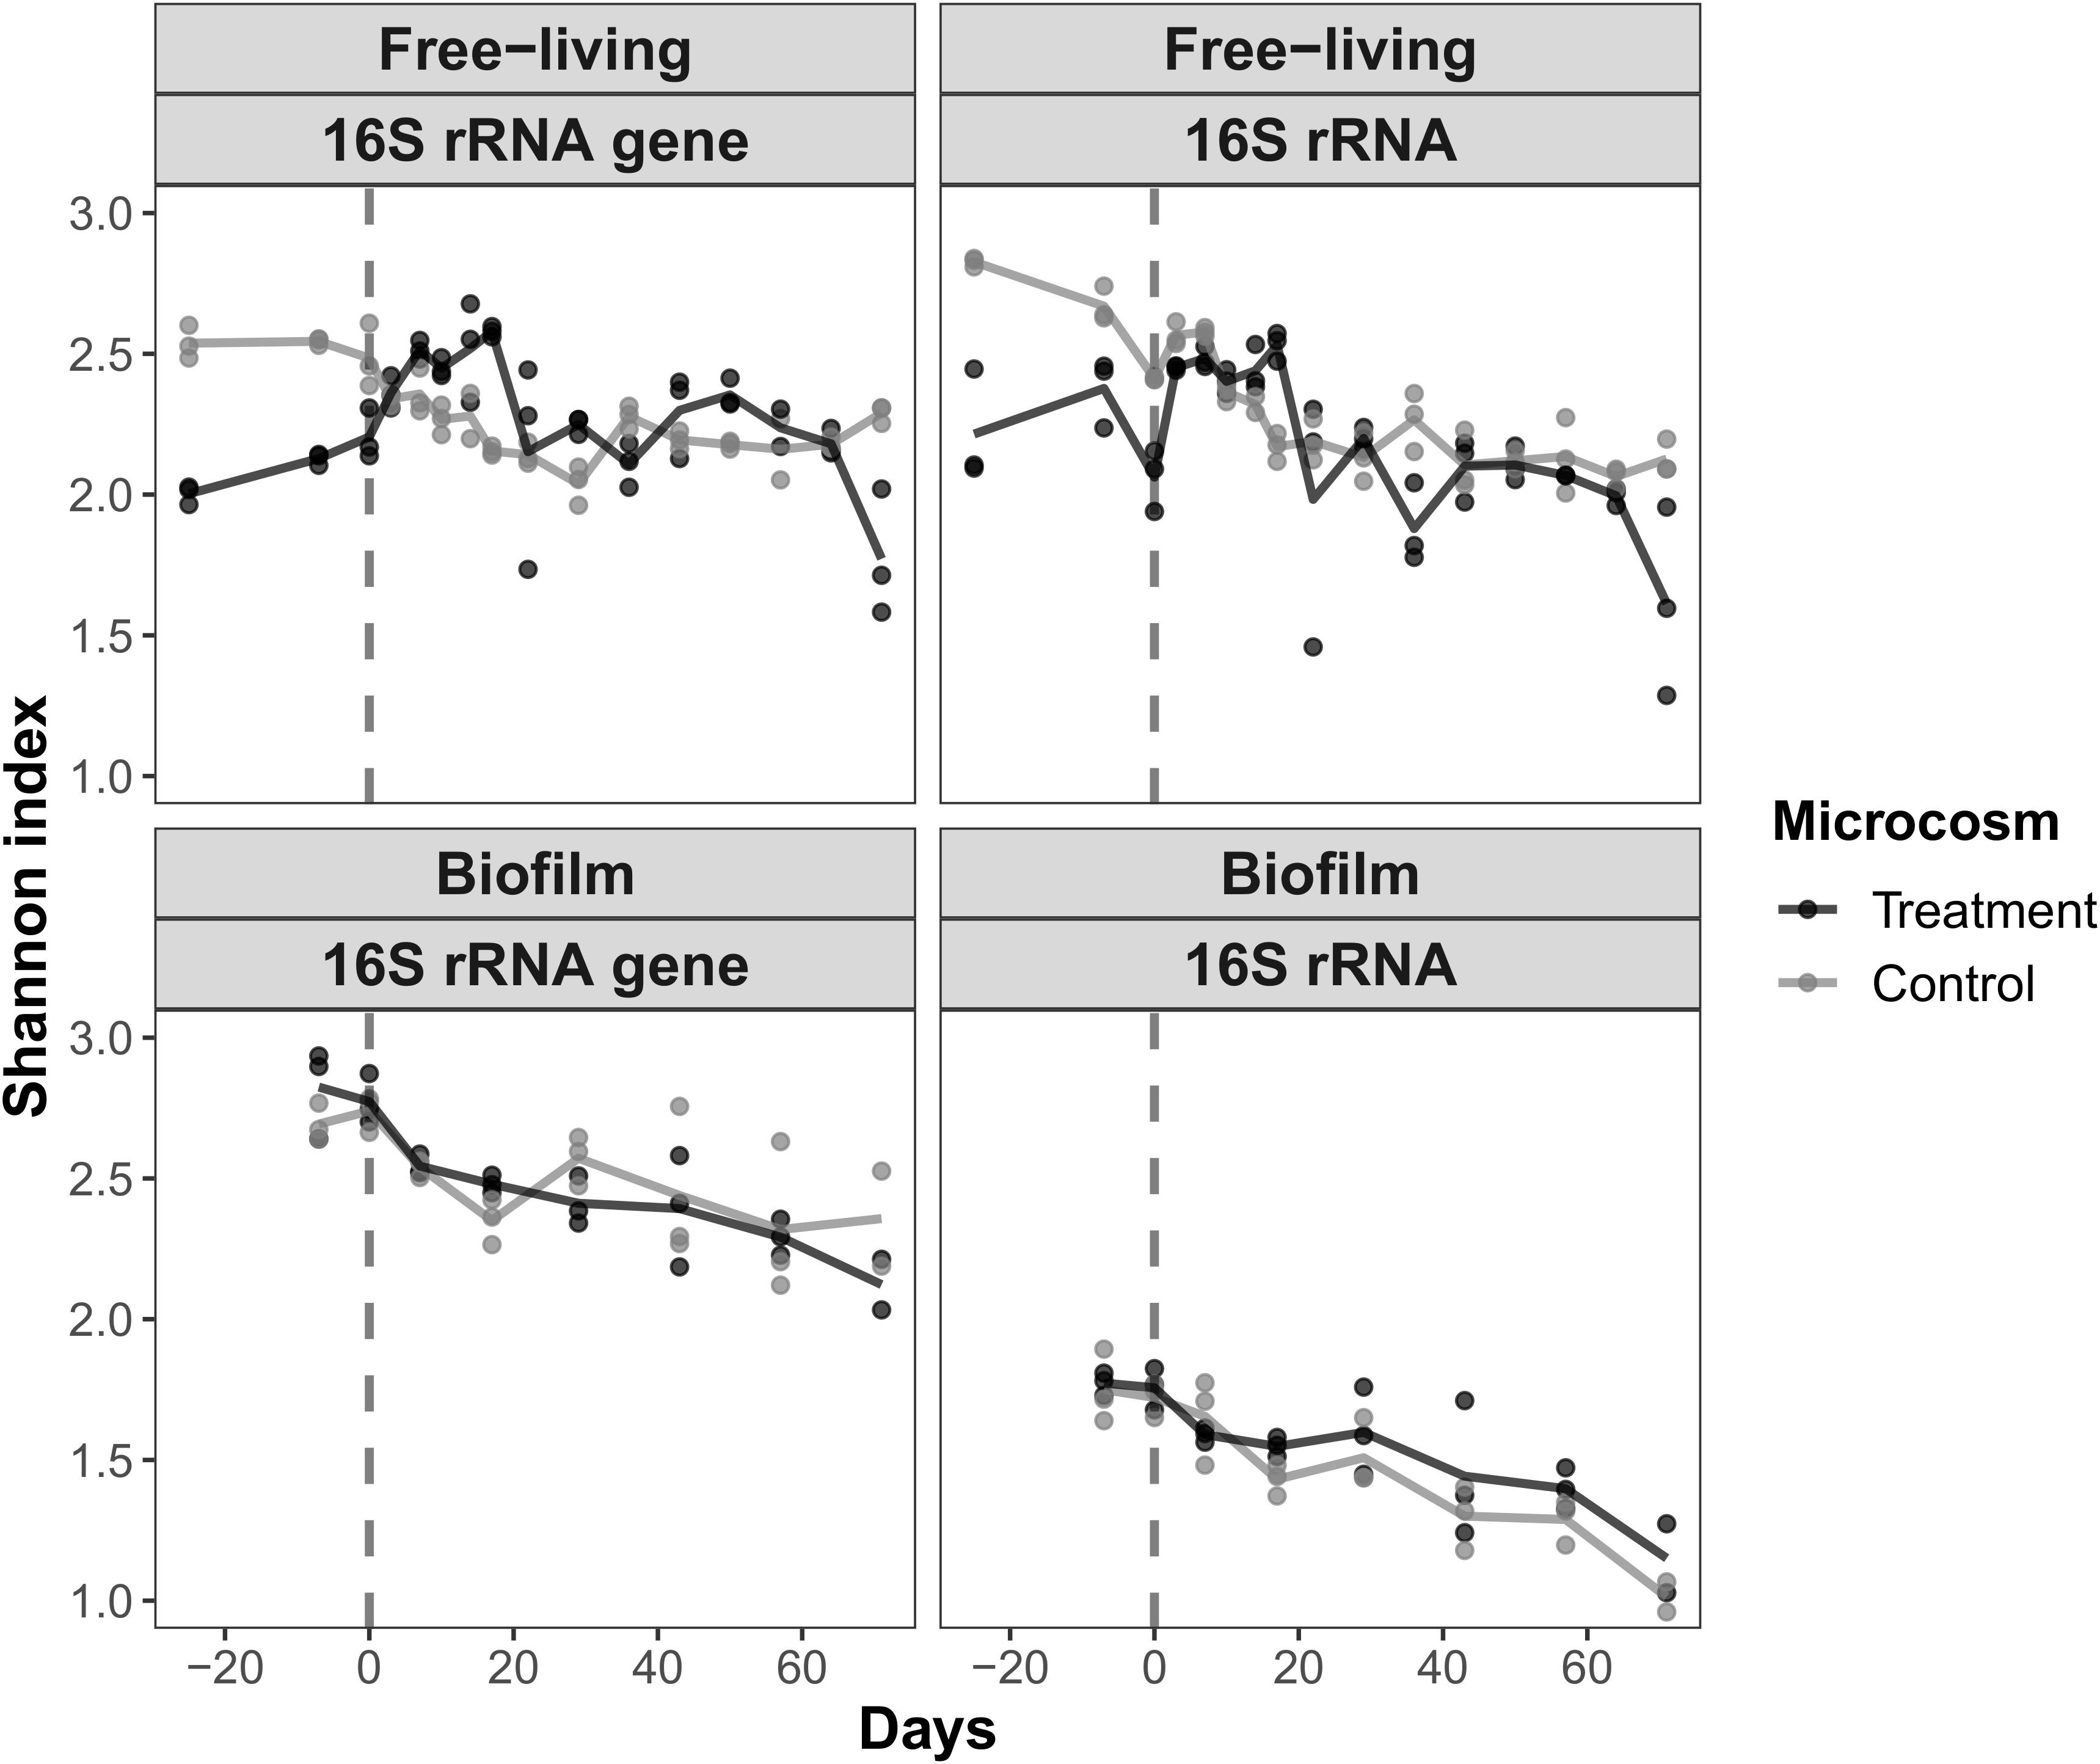
Figure 4. The change in α-diversity (Shannon index) of the free-living and biofilm communities according to the 16S rRNA gene and 16S rRNA data from the treatment and control microcosms. The vertical dashed line indicates the time of glyphosate addition. Samples obtained between the start of the experiment and day 0 (group 1) and from day +3 to day +17 (group 2) were compared in a t-test. The increase in the diversity of the free-living communities was significant.
By contrast, the Shannon index of the biofilm community samples decreased after day 0 regardless of the treatment, from approximately 2.7–2.3 (16S rRNA gene) and from 1.8–1.2 (16S rRNA), hence displaying a uniform mode of succession. A decrease in the diversity of the planktonic control communities was also observed. Shannon indices between sample groups before and after day 0 were significant, ranging from a p-value of 1.04⋅10–07 for changes in the 16S rRNA gene of the treated planktonic samples to 0.03 for changes in the control 16S rRNA of the biofilm (Supplementary Material 7).
OTUs Increasing in Abundance After Glyphosate Treatment
The succession in planktonic and biofilm community composition was analyzed based on the relative OTU abundances that increased significantly after glyphosate addition. The analysis identified 24 OTUs, assigned to seventeen genera, that responded to glyphosate in the water column; three more OTUs originated from biofilms (Table 1, detailed statistics are provided in Supplementary Material 8). Distinctive positive responses were determined for OTUs of three Gallaecimonas spp. (Figure 5 and Supplementary Material 6, OTU 109/129), Methylotenera spp., Hyphomonas spp. and Parvibaculum spp., with both 16S rRNA and rRNA gene abundances increasing immediately after glyphosate addition (Supplementary Material 6, OTU 44/25/46). In agreement with the results reported above, the corresponding biofilm abundances for these OTUs remained stable.
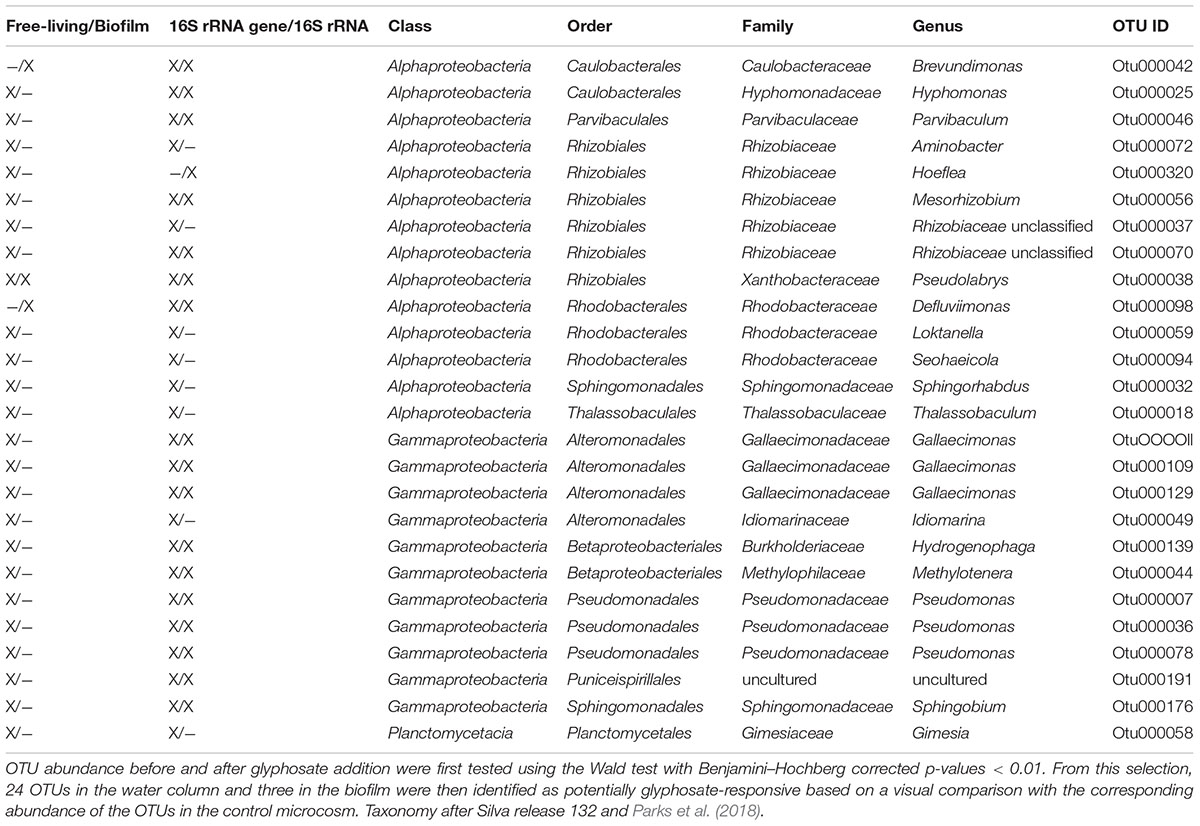
Table 1. Differentially abundant OTUs in the treatment microcosm after the addition of glyphosate.
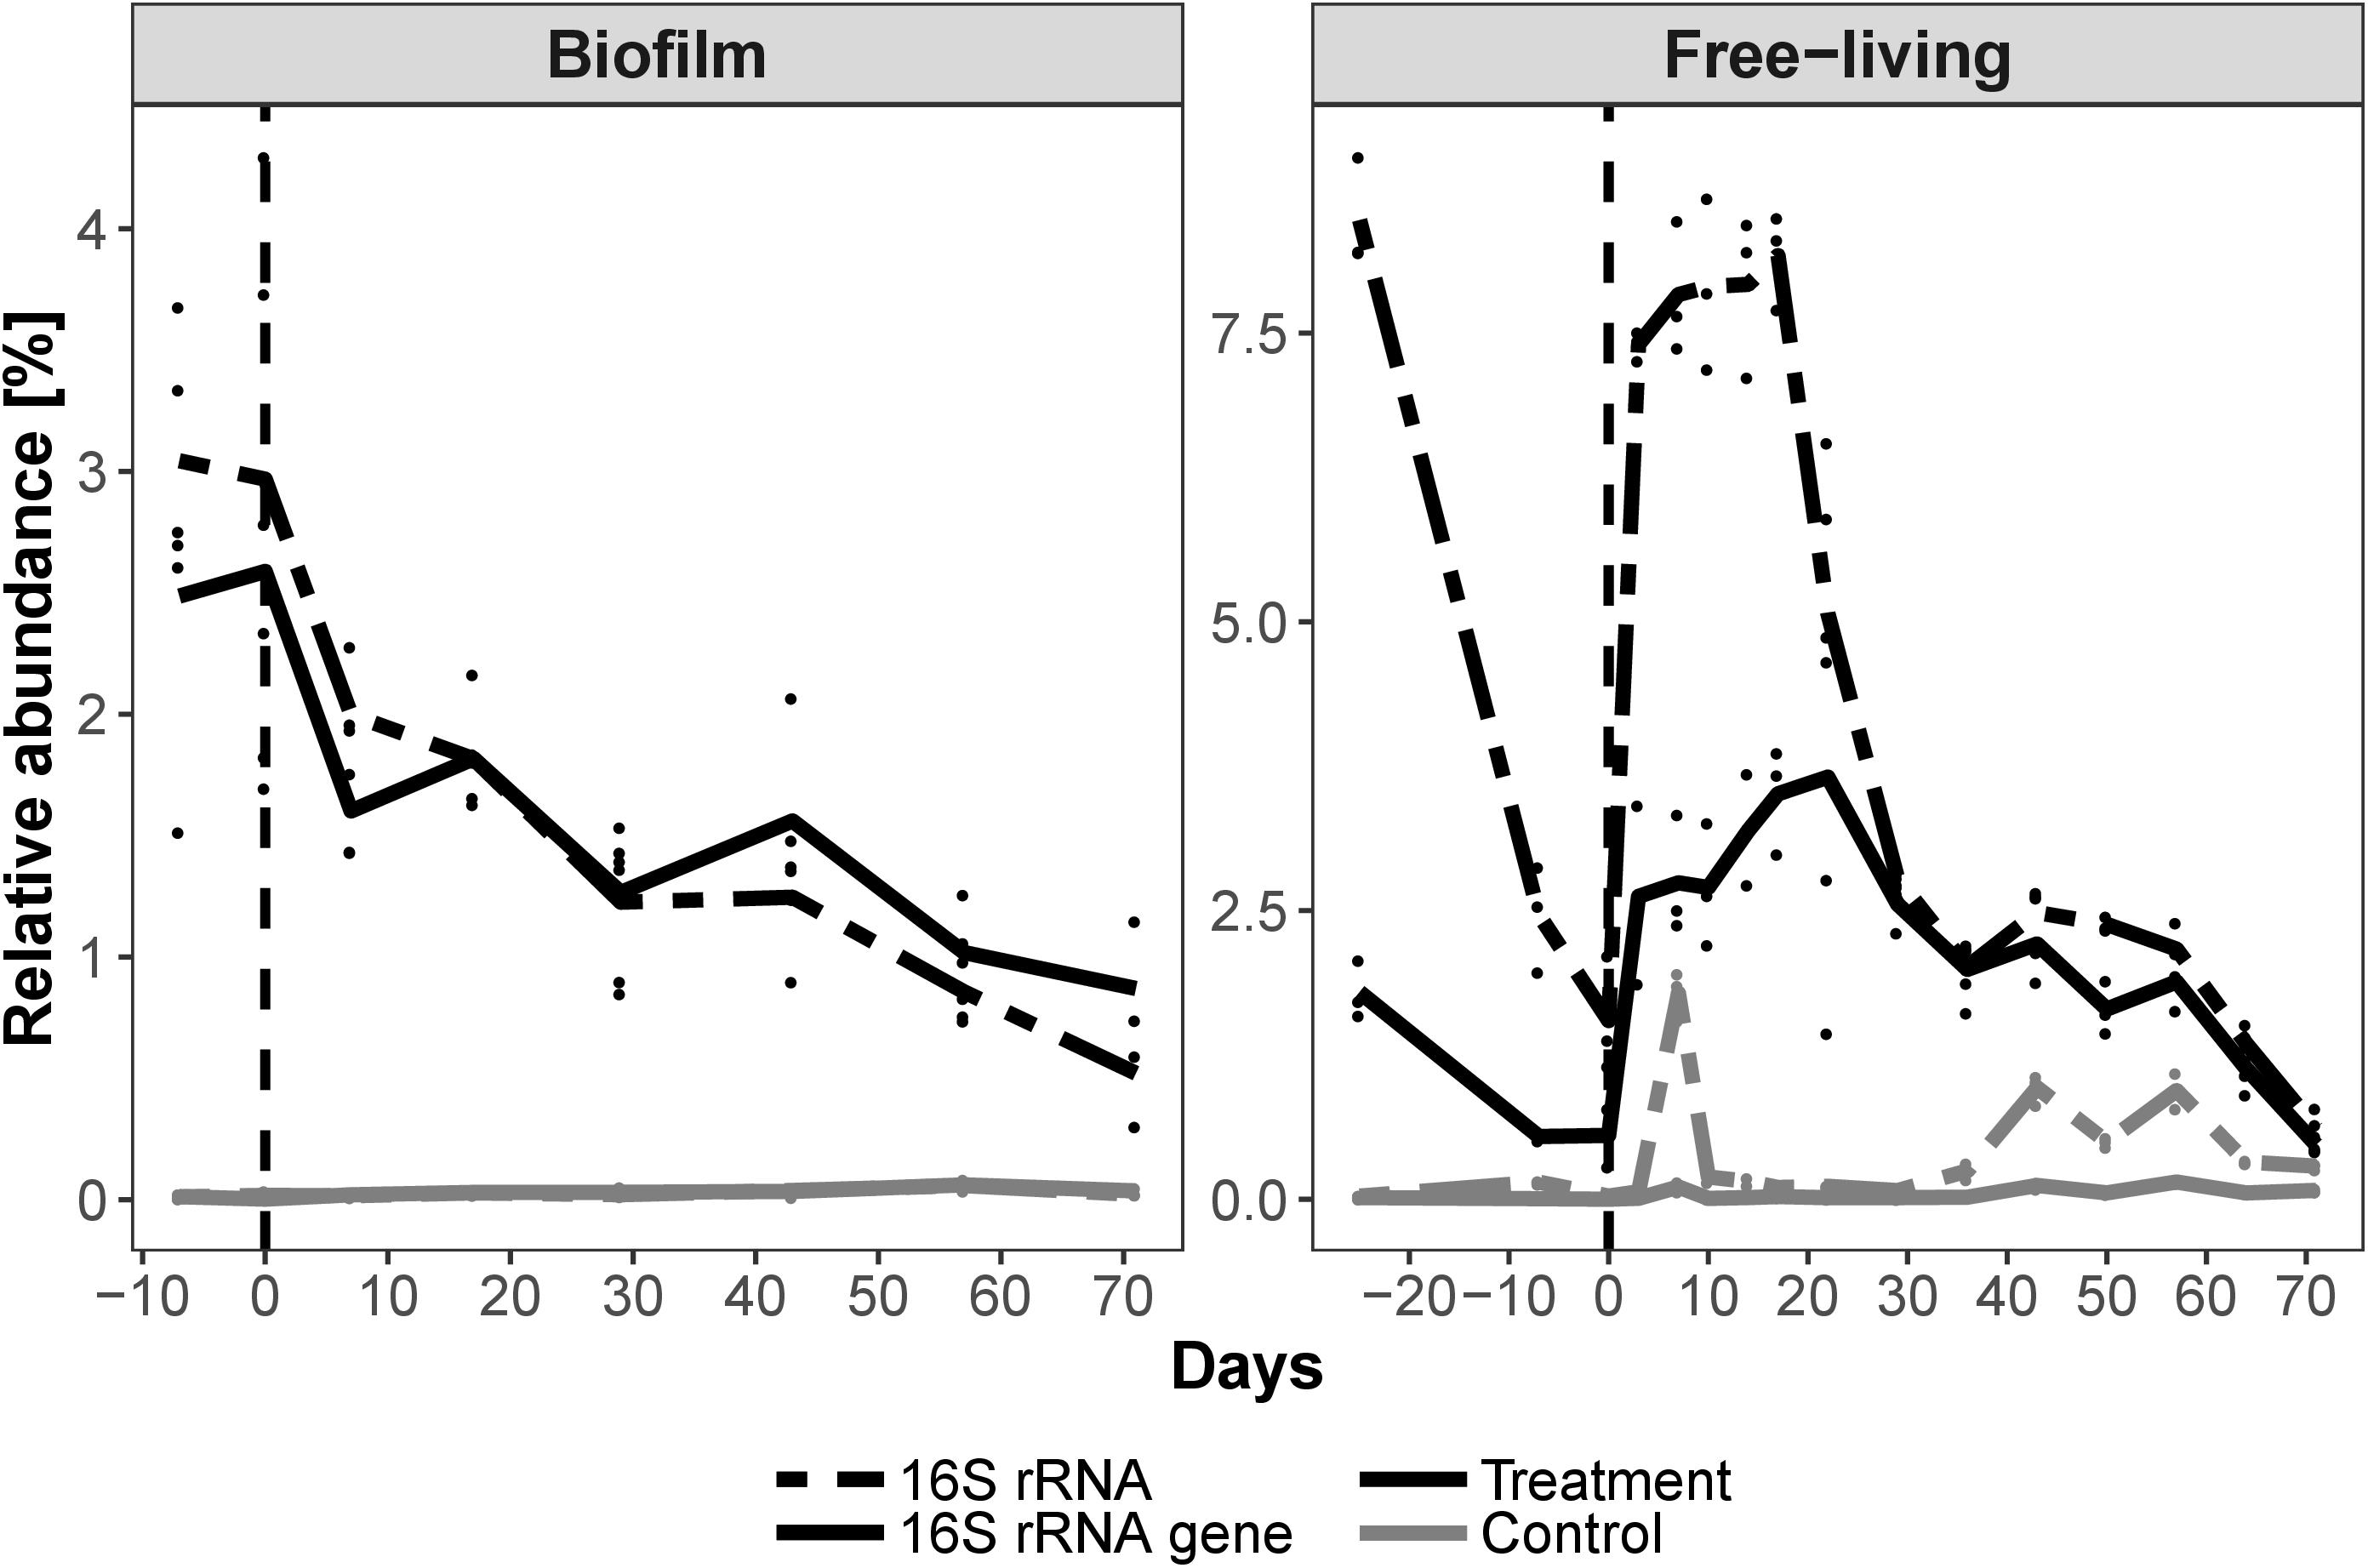
Figure 5. Changes in the relative abundance of Gallaecimonas OTU 11 in the treatment and control microcosms over time as determined by 16S rRNA gene and rRNA amplicon analyses. The vertical dashed line indicates the time of glyphosate addition. There was no evidence of an impact of glyphosate on OTU 11 in the biofilm whereas planktonic OTU 11 responded rapidly based on 16S rRNA gene and 16S rRNA abundances.
The genus Pseudomonas accounted for most of the overall diversity within the microcosms, with variable responses by individual Pseudomonas OTUs to glyphosate addition. Thus, while the relative abundances of planktonic OTUs 7, 36 and 78 increased significantly, the abundance of OTU 29 was unaffected (Supplementary Material 6).
Duration of the Detected Signals
The detected microbial signals representative of free-living and biofilm communities after the glyphosate pulse differed in length and intensity. Total cell counts in the water column increased significantly from day +7 to day +22, whereupon the glyphosate concentration remained ≤ 4.4 μM and AMPA < 0.1 μM. The Shannon index increased significantly from day +3 to day +17 for both the 16S rRNA and 16S rRNA gene based planktonic communities. The clusters in the NMDS of the 16S rRNA gene (except for one technical replicate) and 16S rRNA data from free-living bacteria indicated that the community composition from day +3 to +22 (Figure 3; red polygons) was more similar among these samples than in subsequent samples. The relative abundances of the responding planktonic OTUs generally increased from day +3 to day +22. Some of the detected planktonic OTUs retained elevated abundances for a longer period, until day 64, such as several Pseudomonas OTUs. However, this behavior was commonly observed for biofilm OTUs, and specifically for Brevundimonas OTU 42, Defluviimonas OTU 98 and Pseudolabrys OTU 38 (Supplementary Material 6). The increase in abundance began gradually and was first detected typically after day +7, but it continued until the end of the experiment. For these biofilm OTUs, the continuously high abundances were accompanied by corresponding changes in planktonic abundances. Thus, biofilm reactions were maintained whereas most planktonic reactions ended on day +22, when the glyphosate concentration was 12.7 μM.
Distribution of Glyphosate Degradation Genes in Metagenomic Samples
Metagenomes of free-living microbial communities were analyzed to gain insights into glyphosate-related bacterial functions. All relevant glyphosate-degradation genes gox, thiO and phnC-P were detected. The phn operon might be involved in metabolization at two steps, either degrading glyphosate to sarcosine or cleaving the C-P bond in AMPA. Identifying the responsible pathway, if not all of them, was required.
For the sarcosine pathway, whether a particular phn operon enables glyphosate degradation at all depends on the encoded substrate specificity. Therefore, we screened for sequence clusters that became more abundant after glyphosate addition, as these may also have contained sequence motifs typical of glyphosate degradation. An example is the phnJ gene, which codes for an essential protein within the C-P lyase multienzyme core complex. Nonetheless, in samples from the treatment microcosm, the abundance profiles proved to be complex even for closely related sequences of phnJ genes (Figure 6). Based on phylogenetic analyses, phnJ genes similar to that of the alphaproteobacteria Yoonia vestfoldensis spp. (formerly Loktanella vestfoldensis, UniProtKB: A0A1Y0ECC7) were most abundant on day +14, when the total cell count reached a peak. This development was similar for the phnJ sequences of Ruegeria pomeroyi strain ATCC 700808 (UniProtKB: Q5LW71), Rhizobium meliloti strain 1021 (UniProtKB: Q52987) and Agrobacterium radiobacter strain ATCC BAA-868 (UniProtKB: B9J6Q8). Moreover, phnJ sequence reads correlated with the abundance of 16S rRNA gene OTUs, such as those of Yoonia spp., based on the taxonomy of the reference genes (Supplementary Material 6, OTU 59).
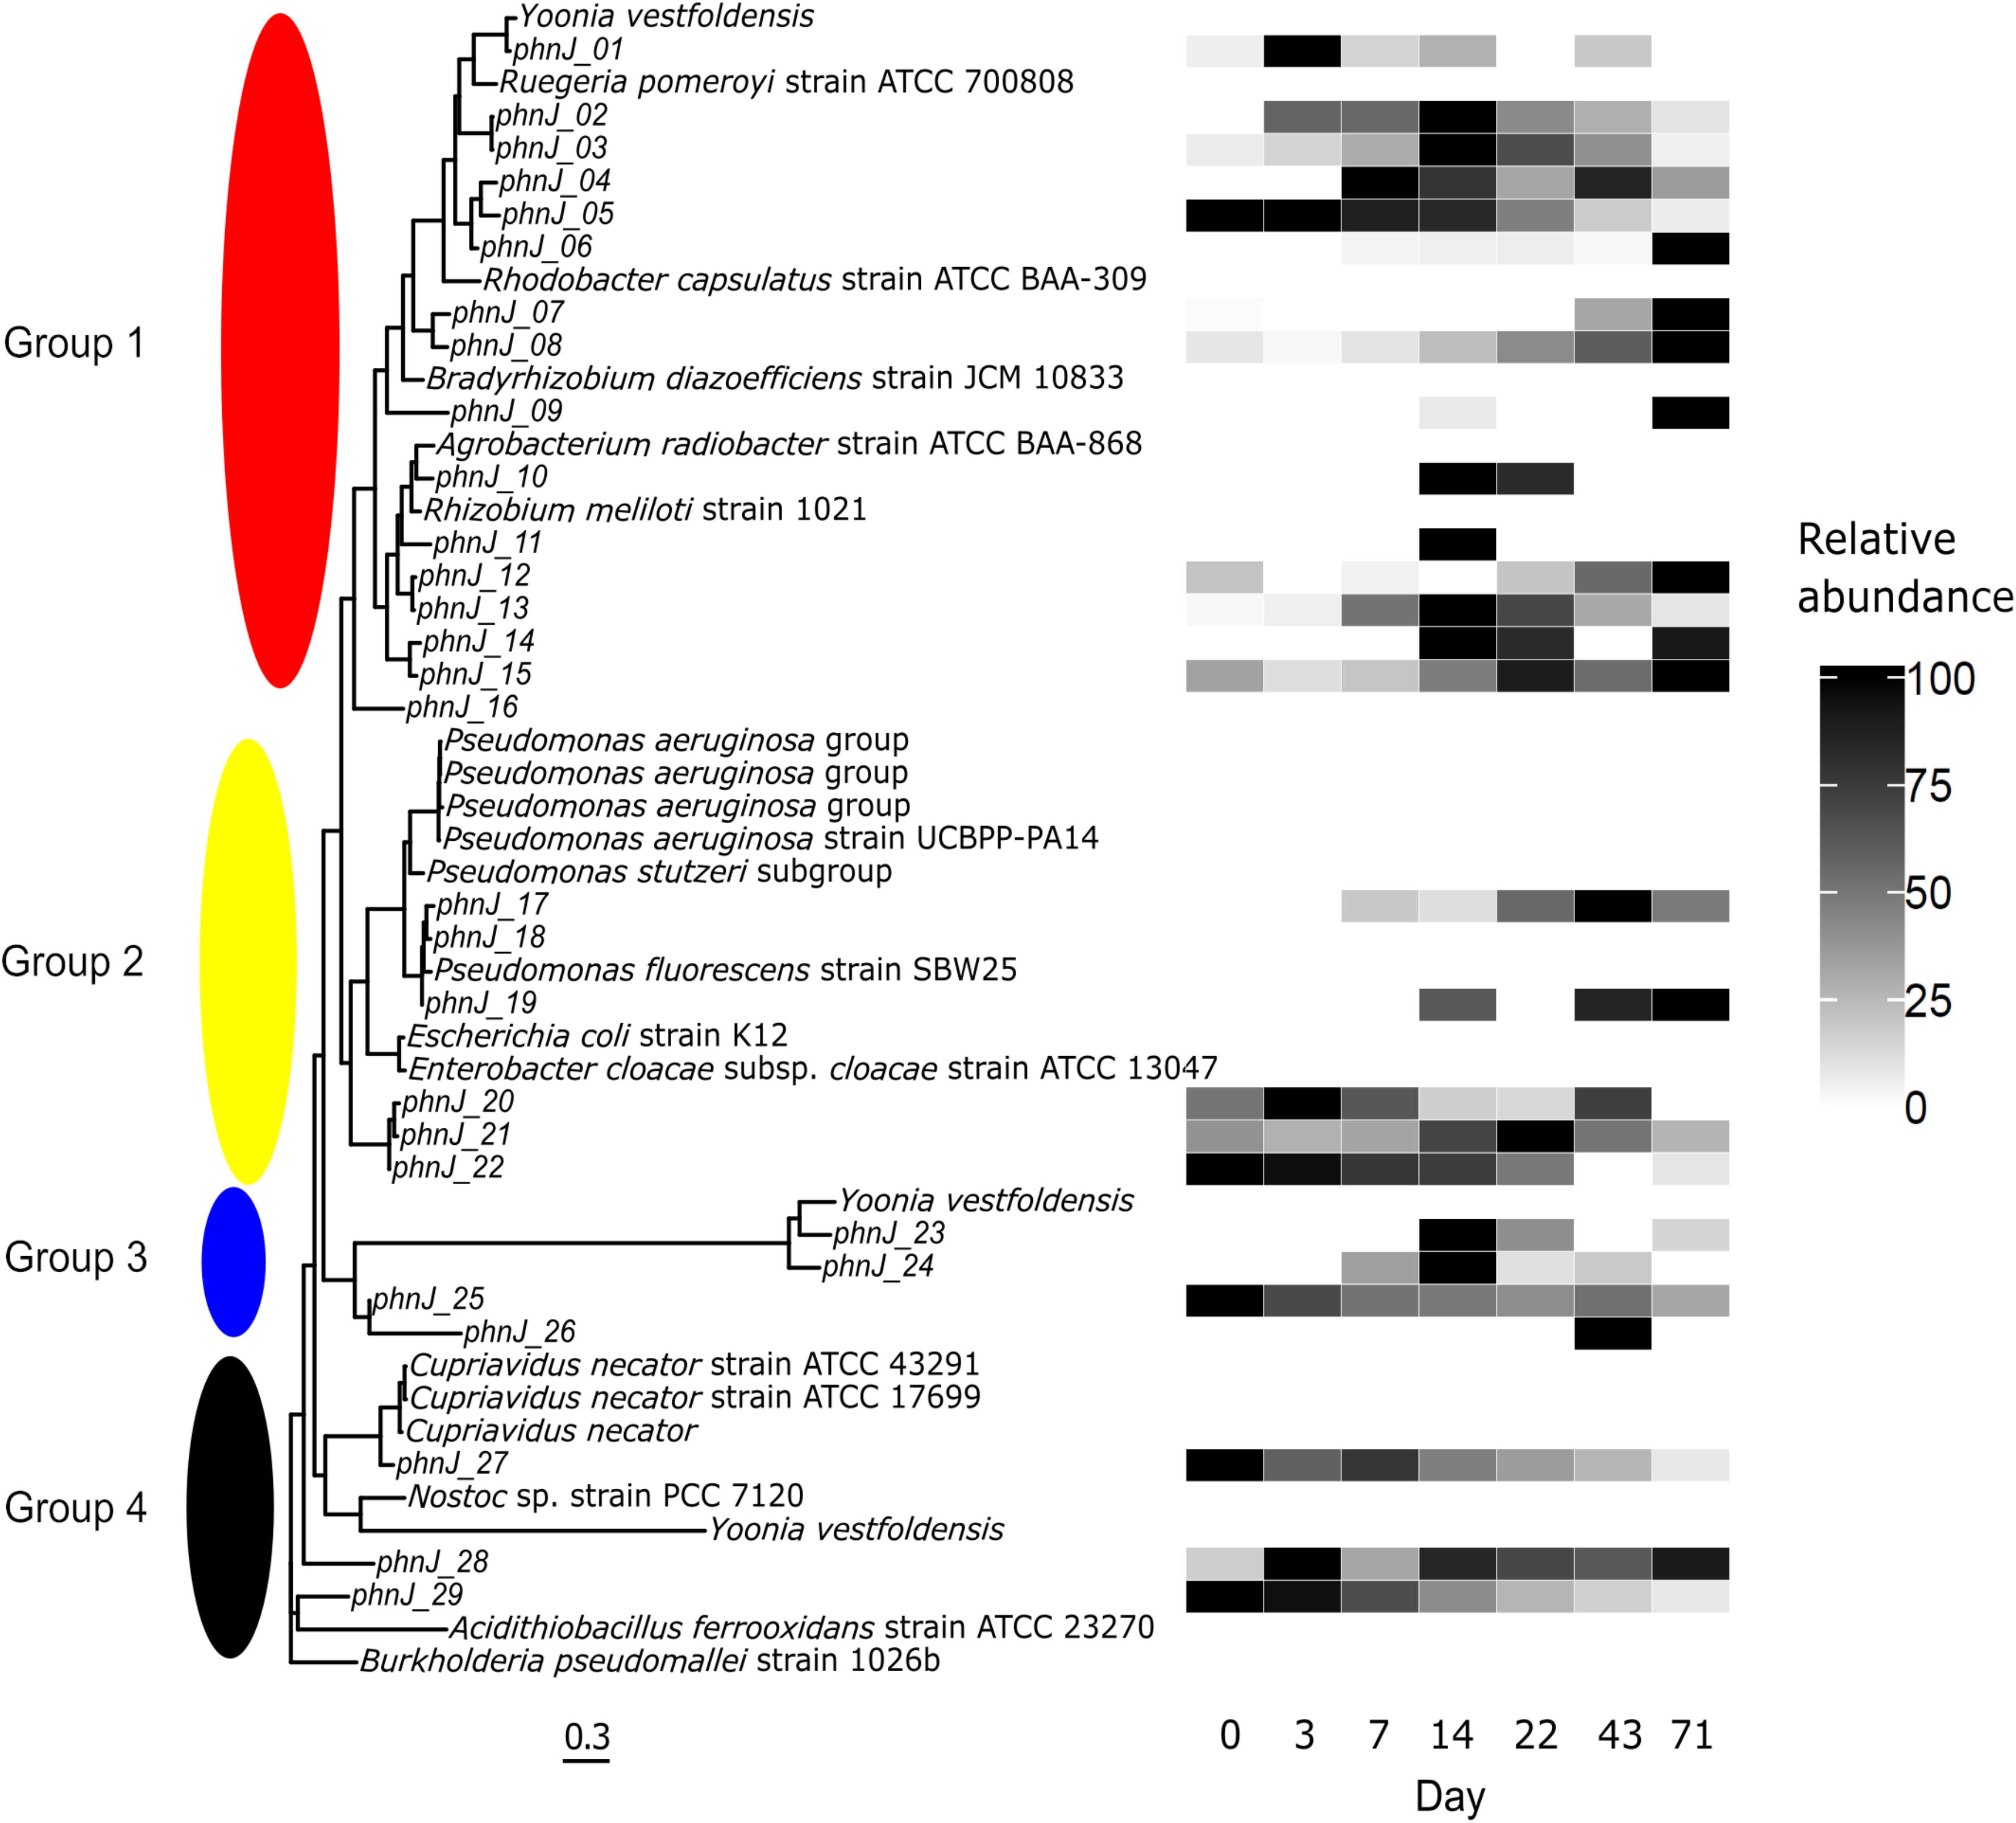
Figure 6. Multiple sequence alignment of protein fasta sequences of the phnJ gene from the free-living treatment metagenomes. As a reference, the tree contains sequences from cultivated organisms related to the differentially abundant OTUs detected in this experiment. Taxonomy is presented according to UniProt. The heat map shows the abundance of a given phnJ gene relative to the other samples over time. Relative abundances in (%). Four groups are labeled, the first two consisting exclusively of Alphaproteobacteria and Gammaproteobacteria, respectively.
From the 29 phnJ genes annotated in the treatment microcosm, four main groups could be recognized. Based on the embedded reference genes from known organisms, the largest group consisted solely of the alphaproteobacterial phnJ sequences grouping with sixteen genes from the metagenomes. Alphaproteobacteria were by far the most abundant class inhabiting the microcosms. The second group solely contained gammaproteobacterial reference genes and six metagenomic genes. For the first two groups, phylogenetic relationships based on the 16S rRNA gene were similar to the clustering of the phnJ sequences, as highlighted by the subgroup of sequences from Enterobacter cloacae ssp. cloacae strain ATCC 13047 (UniProtKB: A0A0H3CFJ4) and Escherichia coli K12 (UniProtKB: P16688). Groups 3 and 4 gathered phnJ sequences from several less-related organisms. Also in these groups multiple phnJ sequences were those of the alphaproteobacteria Yoonia vestfoldensis spp. and were encountered in the first, third and fourth group. In the latter two groups, there was a low similarity with their closest relatives, which even included the cyanobacterium Nostoc sp. strain PCC 7120. Interestingly, the highly diverse genus Pseudomonas was represented by only three sequences; these were most closely related to phnJ from P. fluorescens strain SBW25 (UniProtKB: C3K5L9). Comparable results, i.e., varying numbers of Pseudomonas-related genes (data not shown), were achieved for other phn and the sarcosine oxidase (sox) genes.
The gox gene was not identified by Prokka in the metagenomes. A manually conducted comparison, however, detected thirteen closely related sequences which were annotated by Prokka as dadA (D-amino acid dehydrogenase), but instead appear to be more closely related to gox genes. The reference gox genes create a distinct group (UniProtKB: D2KI28, A0A142MF04, D4NZ76, D4NZ75; GenBank: ATE50174.1, ADV58259.1), whereas the metagenomic sequences are distinguished from this group (Figure 7). When challenged, the annotation of these sequences, by adding the Prokka-referenced dadA sequences (UniProtKB: P0A6J5, Q9HTQ0, A3KEZ1), the metagenomic sequences were indeed more similar to gox genes. The abundance of the potential gox sequences gox_1, 3, 5, 12, and 13 converged with the total cell counts peak. Due to the separate clustering of the reference sequences, the taxonomic inference remains unknown. However, a basic online BLASTp analysis assigned gox_10, 11 and 12 (Figure 7, purple ellipse) to FAD-binding oxidoreductase from Hoeflea marina (UniProtKB: A0A317PMM8) and Hoeflea sp. BRH c9 (UniProtKB: A0A0F2P8D1) with a query coverage of 100% and an identity > 88%.
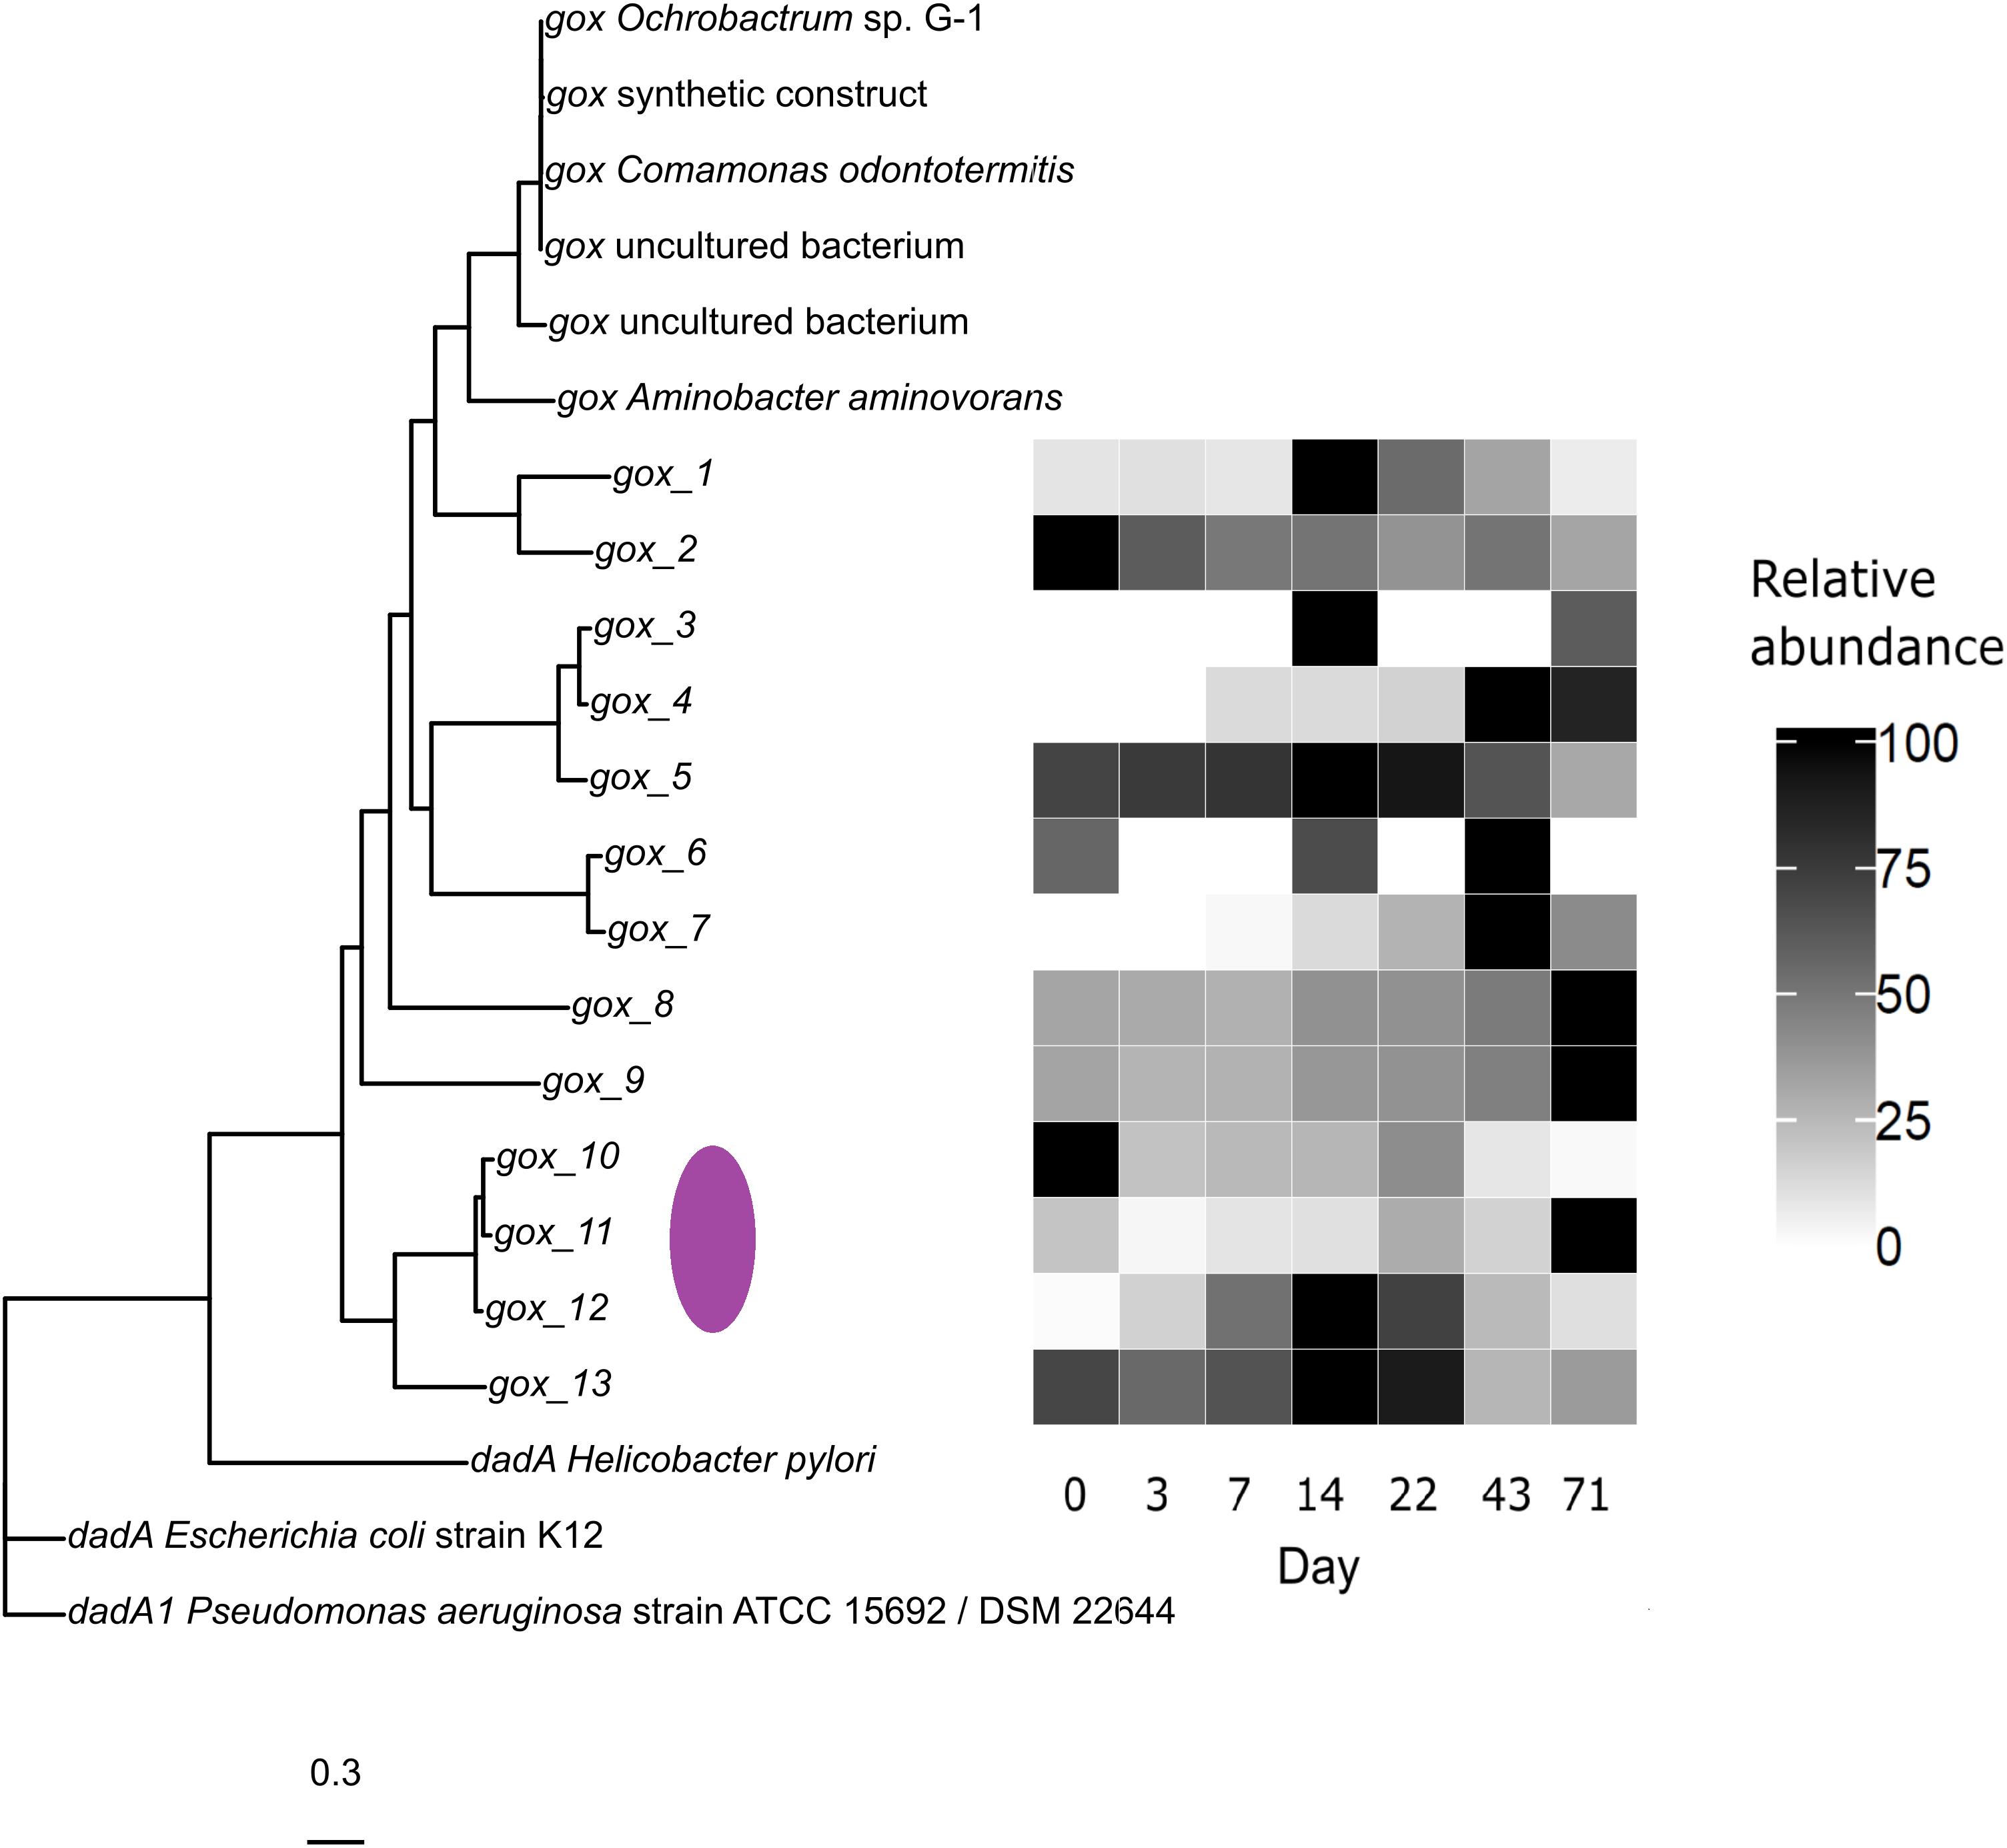
Figure 7. Multiple sequence alignment of protein fasta sequences of the gox and dadA genes deposited in Uniprot and GenBank. gox and dadA reference sequences clustered separately with the metagenomic sequences more related to gox. The purple ellipse marks sequences similar to those of the genus Hoeflea. Relative abundances in (%).
thiO sequences were detected 28 times (Figure 8) with no clear taxonomic separation based on the positioning of the reference sequences. Three sequences were most abundant at day +14 in time with the cell counts peak (thiO_9, 12, 19) with thiO_19 being somewhat related to Yoonia vestfoldensis (UniProtKB: A0A1Y0E718). thiO_1 to 9 grouped with Pseudomonas aeruginosa ATCC 15692 (UniProtKB: G8PX29). Betaproteobacteria clustered together (Cupriavidus, UniProtKB: Q0KF33, G0ETC1, A0A1K0I947 and Burkholderia, UniProtKB: A0A0H3HPX7), although alphabacterial sequences were also similar. Interestingly, Yoonia vestfoldensis (UniProtKB: A0A1Y0EFI8, A0A1Y0E718) and Pseudomonas (UniProtKB: P33642, G8PX29) harbored dissimilar thiO sequences, which might be obtained by horizontal gene transfer.
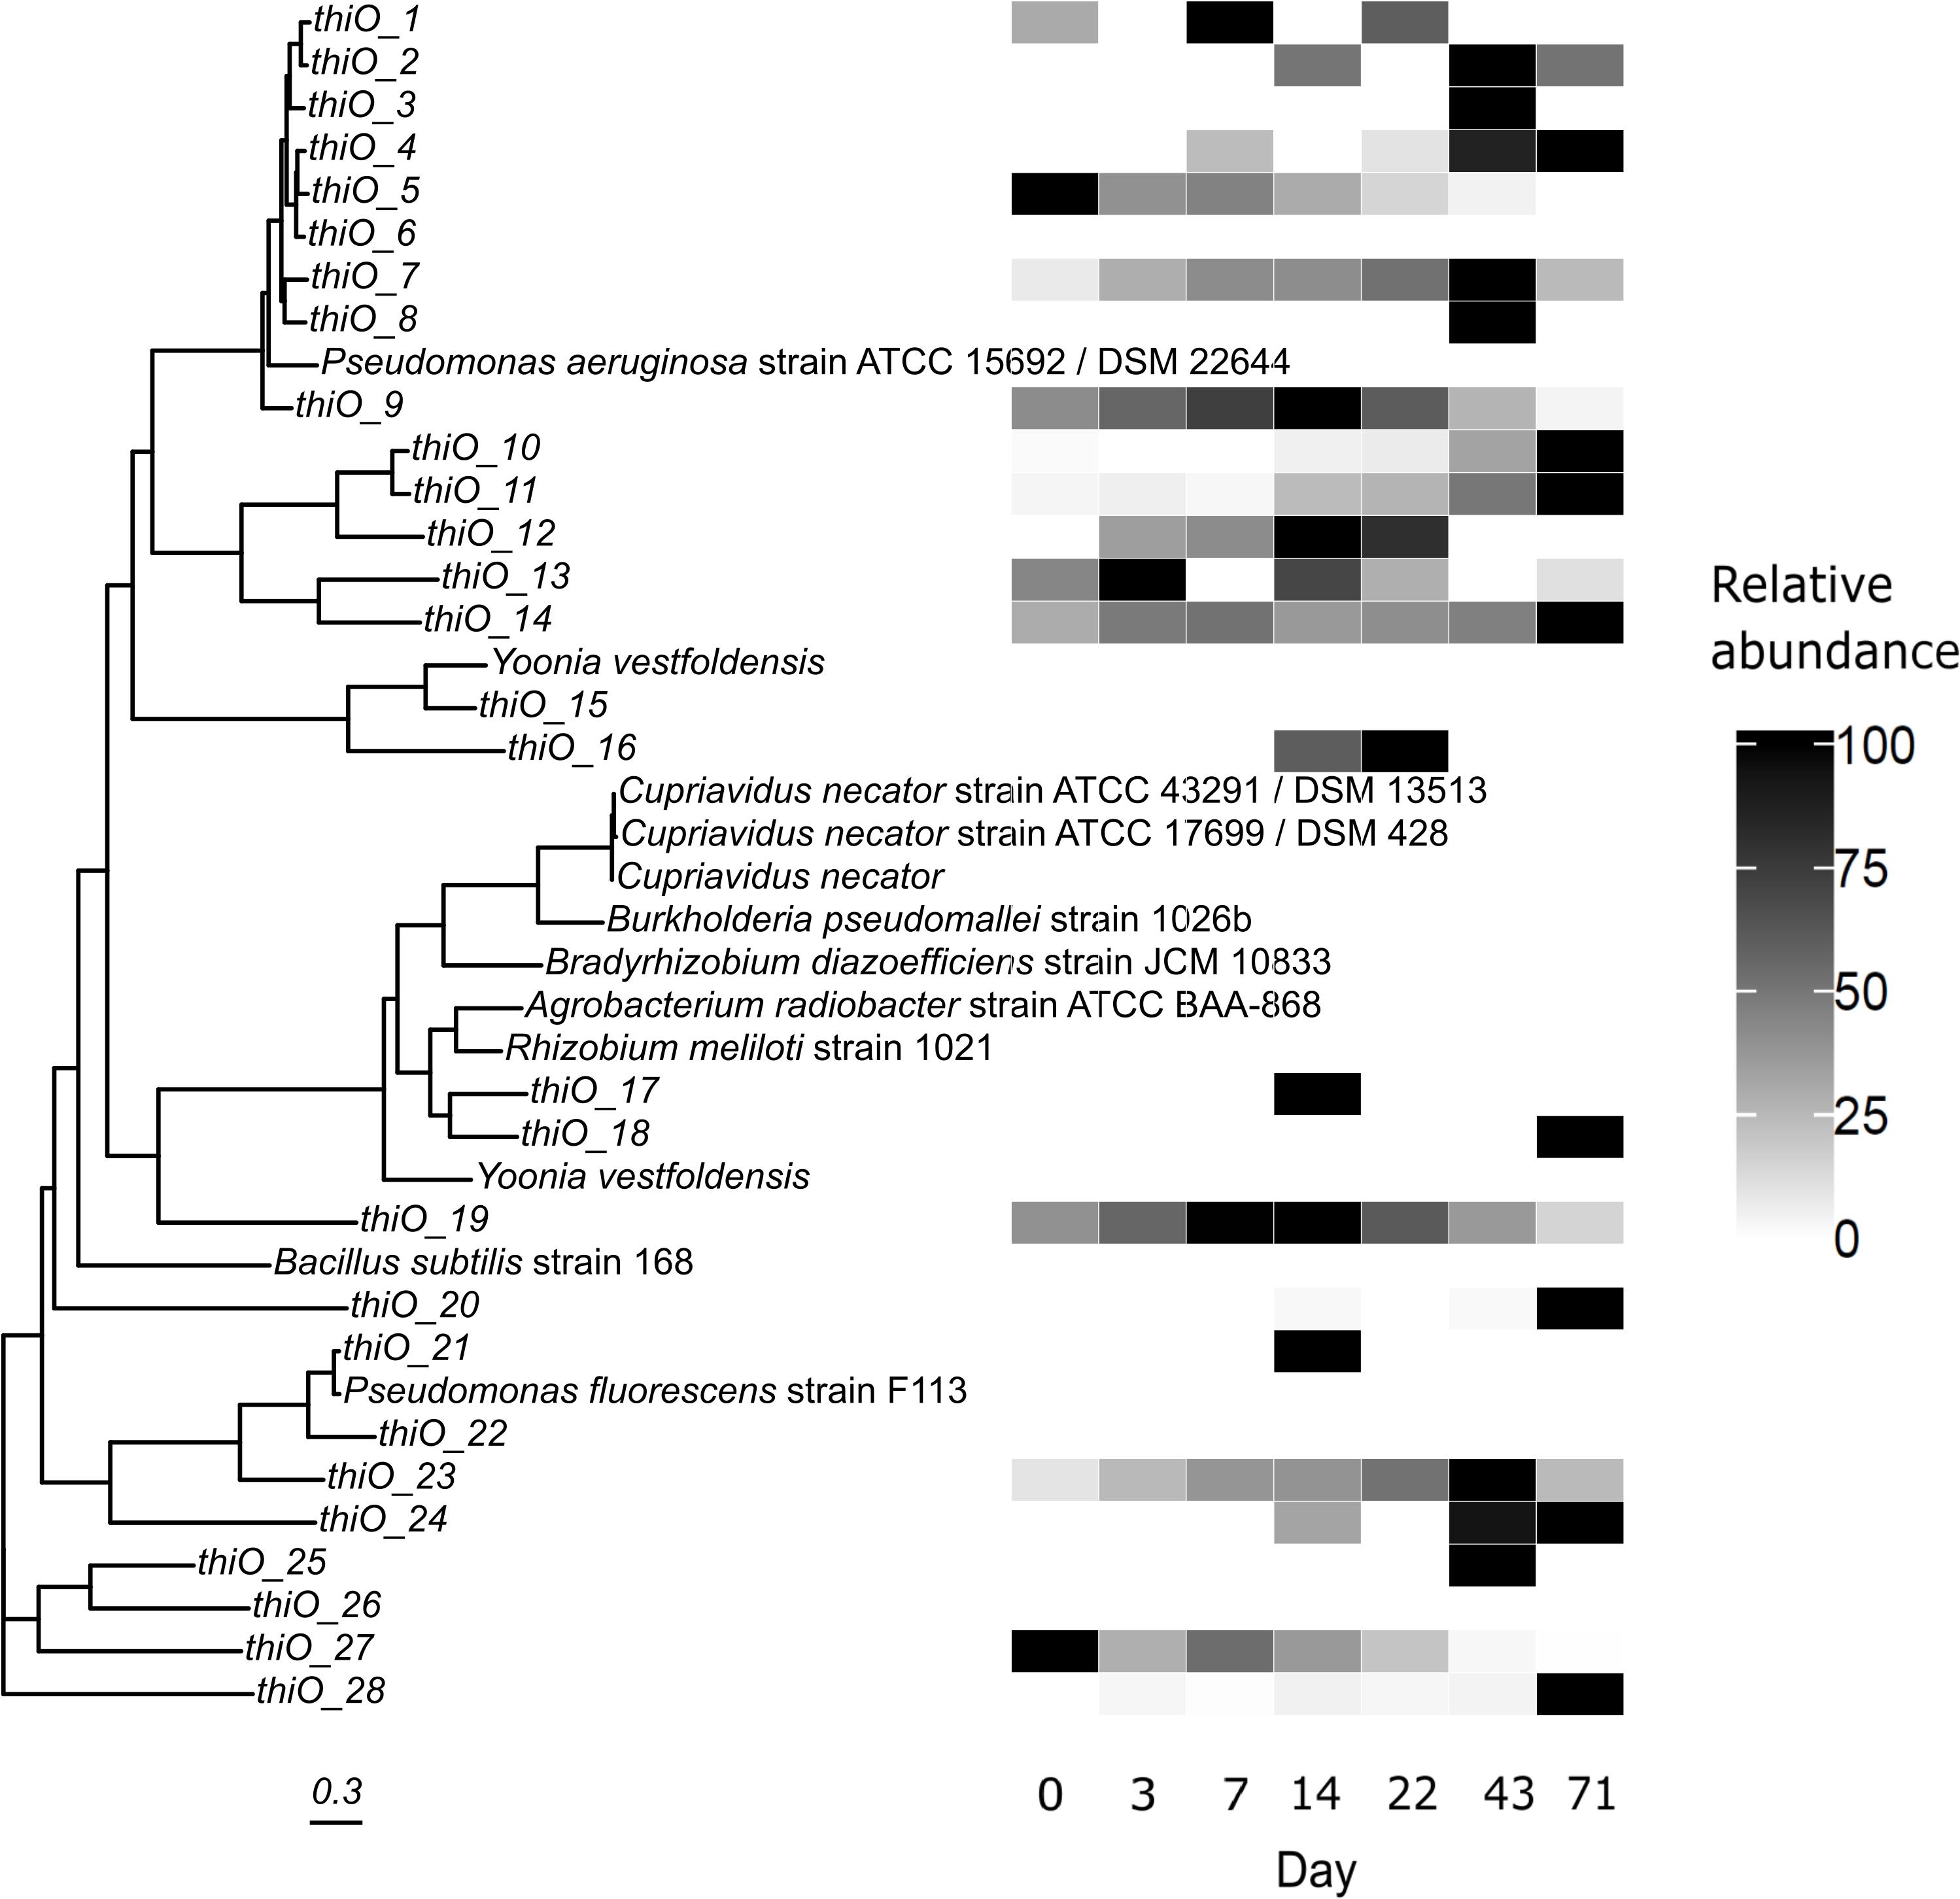
Figure 8. Multiple sequence alignment of protein fasta sequences of the thiO gene. Placement of sequences could be different between the same or closely related organisms such as Yoonia vestfoldensis or Pseudomonas. The presence of thiO genes over all sampled time points was less comprehensive compared to gox and phnJ genes. Relative abundances in (%).
Discussion
Potential Impacts of Glyphosate on a Brackish Microbial Ecosystem
A glyphosate incubation experiment with a brackish water community was conducted to investigate the impact of glyphosate on free-living and biofilm microbial assemblages. Following the glyphosate pulse, changes in community composition and increases in total cell counts, α-diversity and the abundances of specific 16S rRNA (gene) OTUs were detected in the water column. By contrast, with a few exceptions, the biofilm, which was 69 days old when glyphosate was added, remained undisturbed. Other studies have also shown that organisms embedded in a biofilm are less responsive to disturbances in the surrounding medium (Davey and O’Toole, 2000; Tlili et al., 2011). Similarly, in this study, compared to the water column, fewer OTUs in the biofilm were affected by glyphosate. A smaller impact of glyphosate on freshwater biofilms, and especially on phototrophic organisms, was previously reported. Khadra et al. (2018) investigated periphytic biofilms differing in age (at least 2 months) and exposed to different glyphosate concentrations (35.4, 383.5, and 3540 nM) in a lake. They concluded that glyphosate had no effect on biofilms, a finding also reported by Lozano et al. (2018), who showed that periphyton was more resistant than phytoplankton to 17.7 μM glyphosate. Although the latter study did not find a biomass-based effect on periphyton, the abundance of certain taxa decreased. Vera et al. (2010) noted a delayed increase in the biomass of periphyton exposed to 47.3 μM glyphosate in freshwater mesocosms.
In our study, from the initial 82.45 μM glyphosate added at day 0, 1 μM remained at the end of the experiment. Thus, with the decreasing availability of glyphosate, the cost-benefit ratio of producing proteins for its metabolism seems to become increasingly unfavorable. This is supported by the absence of AMPA as indication of degradation in the later samples. Given that at 4.4 μM glyphosate a response by planktonic communities was no longer detectable, then at the pM to nM concentration ranges measured in estuaries of the Baltic Sea (Skeff et al., 2015) neither biofilms (harboring the majority of microbial cells) nor planktonic bacteria in the Baltic Sea are likely to be disturbed by the herbicide. However, the nutrient regime in Baltic seawater differs from that of the rich medium provided in this study. In addition, the long-term effects of glyphosate on microbial communities are as yet unknown. Mercurio et al. (2014) demonstrated an unexpected glyphosate persistence in seawater in the presence and absence of light. The study of Stachowski-Haberkorn et al. (2008) suggested that even low-nM glyphosate concentrations can affect natural coastal microbial communities in marine environments. According to our results, planktonic bacteria better reflect short-term disturbances, whereas the accompanying biofilm provides a reference for examining overall succession trends occurring as a result of exchange with the water column. A biofilm response would thus indicate that a threshold of disturbance tolerance had been exceeded. Expanding the shotgun sequencing to involve the biofilms could support this idea.
Differences in the Responses of Water Column and Biofilm Communities to Glyphosate Addition
The response of biofilm OTUs to glyphosate addition, as measured by abundance, was minor but detectable until the end of the experiment. One interpretation of this result is that the glyphosate pulse favored these OTUs over others in the biofilm community. Glyphosate has been shown to accumulate in biofilms, including those within a Brazilian river (59.2–1806 nmol⋅kg–1, AMPA 450.29–6033.89 nmol⋅kg–1; Fernandes et al., 2019), or to persist at a very small percentage of the initial concentration, as demonstrated in a microcosm study of biofilms in a French river (Carles et al., 2019). Either would provide glyphosate-degrading OTUs with a nutritional advantage. Our initial tests conducted prior to the experiment showed that the biofilms did not enrich glyphosate, at least not during the first 3 days after the glyphosate pulse. However, in the few cases in which a response by biofilm OTUs was identified, the respective signal was also detected in the water column, both for a longer time and indicative of a higher abundance. Several of the abundant biofilm OTUs, however, were characterized by a concise albeit constant changes in abundance regardless of the condition, which complicated the detection of glyphosate-responding OTUs (Figure 5). It should be noted that the growth substrates for the biofilm were initially sterile and that all colonization occurred via the inoculated water column. This could explain the overall concordance between abundant OTUs in the water column and in the biofilms.
Microbial responses within the water column were in most cases limited to day +22, which coincided with the strongest decrease in the glyphosate concentration to ≤4.4 μM, the AMPA concentration fell below 0.1 μM afterward. Transient effects on microbial communities by glyphosate have been previously described. For example, Weaver et al. (2007) found small, brief (<7 days) changes in the levels of fatty acid methyl esters and a reduction in the hydrolytic activity of a soil microbial community exposed to a glyphosate concentration of 277–828 μmol⋅kg–1. Using Biolog assays and phospholipid fatty acids analyses, Ratcliff et al. (2006) measured a non-specific, short-term stimulation of bacteria at a high glyphosate concentration. The increased α-diversity determined in this study confirmed the findings of Lu et al. (2017), who analyzed the rhizosphere of a glyphosate-tolerant soybean line based on 16S rRNA gene amplicon sequencing. The authors also found a higher diversity and varying OTU abundances in the rhizosphere of the treated than of the control cultivar. In a metatranscriptomic analysis, Newman et al. (2016) investigated changes in bacterial gene patterns in response to long-term glyphosate exposure. The results indicated a potential shift in bacterial community composition toward more glyphosate-tolerant bacteria. Wang et al. (2017) described the effects of two glyphosate concentrations on the microbial community associated with the dinoflagellate Prorocentrum donghaiense and showed that 36 μM glyphosate caused a decrease and 360 μM an increase in α-diversity. Several OTUs detected in our study belonged to genera whose abundance increased following glyphosate treatment (Methylotenera, Pseudomonas, Sphingobium, Thalassobaculum), demonstrating the ability of glyphosate to cause favorable conditions for these genera across various habitats. On a further note, the herein identified Rhodobacteraceae and Rhizobiaceae OTUs were confirmed in a novel approach using artificial neural networks and Random Forest to detect responding OTUs (Janßen et al., 2019).
Glyphosate-Induced Changes in OTU Abundance
In our study, temporally highly resolved NGS data revealed increased OTU abundances, but the mechanisms of the increases were unclear. While glyphosate can be considered as a source of C, N, or P, the microcosms were supplied with sufficient amounts of C and N (evidenced by the medium composition and end-of-experiment data points) and P from other sources.
Specific reactions to glyphosate have been described in studies of bacterial cultures, especially those of degraders (Wang et al., 2016) and resistant cyanobacteria (Lópes-Rodas et al., 2007). Within the same species, different strains may or may not be capable of degrading glyphosate and several pathways for glyphosate degradation may be present in a single strain. This is the case in Pseudomonas (Jacob et al., 1988; White and Metcalf, 2004; Zhao et al., 2015; Lidbury et al., 2016) and would explain why some, but not all of the Pseudomonas OTUs detected in our study became abundant after glyphosate addition. Thus, the pronounced diversity of Pseudomonas was also expressed by its reactions toward glyphosate.
Probability of Glyphosate Degradation
The responses mainly by free-living bacteria, such as the increase in cell counts and the presence of AMPA indicated that glyphosate was degraded. The amount of AMPA detected in comparison to the corresponding glyphosate concentrations suggests that only a minor fraction was metabolized, a quality associated with the glycine oxidase thiO. The increase in total cell counts and the discrepancy between the measured and the calculated glyphosate levels require a more complete degradation of glyphosate. Sarcosine/L-alanine levels do not compensate for this difference and as they did not change after glyphosate addition and were present in both microcosms it was more likely only L-alanine was present due to the inclusion of the casamino acids. This implicates that glyphosate was not metabolized by the sarcosine pathway. It is possible that rapid degradation of the intermediate product could have occurred, thus rendering it hardly detectible. However, it is unlikely that the glycine oxidase would be capable of such a degradation rate due to its low specificity toward glyphosate. A possible explanation is the degradation of glyphosate by gox into AMPA with an immediate continuation by C-P lyase. Sviridov et al. (2015) concluded in their review that the majority of described glyphosate-degrading bacteria use the gox gene and consequently export AMPA into their environment, but also stated that organisms not being capable of degrading glyphosate might still metabolize AMPA.
Furthermore, the abundances of gox genes, thiO genes, the phn operon, sox genes and aroA genes correlated with those of the detected OTUs (via multiple sequence alignment and reference sequences; Figure 6). It must be noted that phn operons encode functions that result in the degradation of a variety of phosphonates, although not necessarily including glyphosate. The respective genes are subject to extensive lateral transfer, which complicates data interpretation (Huang et al., 2005). The results of our metagenomic analysis suggested that phn genes have a higher sequence similarity based on phylogeny than on substrate specificity. Sequence abundances of a phnJ gene correlated with OTU 59 (classified as Yoonia/Loktanella spp.). This suggested that this OTU possesses phn genes whose abundances’ increase might be in response to the presence of glyphosate or AMPA as a nutrient source. The same reference organism, as well as Pseudomonas aeruginosa, correlated with the abundance of thiO genes. The phylogenetic comparison of gox, dadA and our metagenomic sequences (Figure 7) underlined the demand of properly described references and the potential of undiscovered gox variants. For the Hoeflea-related gox sequences, no treatment-specific abundance change could be assigned to Hoeflea OTUs. In conclusion, a metatranscriptomic analysis that describes the expressed phn, gox, and thiO mRNAs may have provided clearer evidence of the pathways used for glyphosate degradation (Martínez et al., 2013; Wang et al., 2016) as well as the involved organisms.
However, amplicon sequences still proved to be a cost efficient and sensitive method for community analysis, as comparisons of 16S rRNA (gene) and shotgun sequencing data indicated that glyphosate-responsive low-abundance OTUs were not covered in the metagenome. Furthermore, the 16S rRNA gene amplicon counts were a better indicator of community changes than 16S rRNA, indicating that DNA is a better proxy of abundance. Field experiments or laboratory studies involving more than one determinant should further investigate the potential of using detailed community composition data as an indicator of community disturbance.
Data Availability Statement
The datasets generated for this study can be found in the NCBI database under BioProject ID PRJNA434253 and SRA accession SRP151042. OTU and taxonomy table as well as corresponding code to process and analyze the data are available in the GitHub repo: https://github.com/RJ333/Glyphosate_gene_richness, code for the metagenomic analysis is available under https://github.com/RJ333/calculate- functional-trees.
Author Contributions
RJ and ML designed the experiment. RJ conducted the experiment, lab work, amplicon data processing, analysis and statistics and wrote the manuscript. JW processed and analyzed the metagenomic data and contributed to the manuscript. WS performed the glyphosate and AMPA analysis, designed and conducted the adsorption experiment and contributed to the manuscript. MW re-performed the AMPA with more sensitive equipment and developed a method for sarcosine/L-alanine analytics. ML, DS-B, and BK provided invaluable comments and intellectual input. ML, BK, and DS-B provided laboratory equipment and measurement of data. ML revised the manuscript. All authors have read and approved the final version of the manuscript.
Funding
This work was funded partially by the German national BMBF project “Sektorale Verwertung” (01IO1448) and from the BONUS Blueprint project supported by BONUS (Art 185), funded jointly by the EU and the Swedish Research Council FORMAS and The Federal Ministry of Education and Research (BMBF). RJ and JW personally acknowledge the use of de. NBI cloud and the support by the High Performance and Cloud Computing Group at the Zentrum für Datenverarbeitung of the University of Tübingen and the Federal Ministry of Education and Research (BMBF) through grant no 031 A535A. Purchase of the Illumina MiSeq was kindly supported by the EU-EFRE (European Funds for Regional Development) program and funds from the University Medicine Rostock awarded to BK.
Conflict of Interest
The authors declare that the research was conducted in the absence of any commercial or financial relationships that could be construed as a potential conflict of interest.
Acknowledgments
We would like to thank Mercè Berga Quintana for the introduction to R, Christin Laudan and Jenny Jeschek for measuring nutrient concentrations, Stephanie Mothes for extracting nucleic acids from biofilm and Jana Bull for running the MiSeq. RJ would like to thank Anders Andersson, Johannes Alneberg and Luisa Hugerth for the introduction into bioinformatics and metagenomic analysis. We would also like to thank the two reviewers for their helpful critics, which improved the quality of this manuscript and Alexander S. Tagg for proofreading the revised version.
Supplementary Material
The Supplementary Material for this article can be found online at: https://www.frontiersin.org/articles/10.3389/fmars.2019.00758/full#supplementary-material
Footnotes
References
Bateman, A., Martin, M. J., O’Donovan, C., Magrane, M., Alpi, E., Antunes, R., et al. (2017). UniProt: the universal protein knowledgebase. Nucleic Acids Res. 45, D158–D169. doi: 10.1093/nar/gkw1099
Bennke, C. M., Pollehne, F., Müller, A., Hansen, R., Kreikemeyer, B., and Labrenz, M. (2018). The distribution of phytoplankton in the Baltic Sea assessed by a prokaryotic 16S rRNA gene primer system. J. Plankton Res. 40, 244–254. doi: 10.1093/plankt/fby008
Bergström, L., Börjesson, E., and Stenström, J. (2011). Laboratory and lysimeter studies of glyphosate and aminomethylphosphonic acid in a sand and a clay soil. J. Environ. Qual. 40, 98–108. doi: 10.2134/jeq2010.0179
Bolger, A. M., Lohse, M., and Usadel, B. (2014). Trimmomatic: a flexible trimmer for Illumina sequence data. Bioinformatics 30, 2114–2120. doi: 10.1093/bioinformatics/btu170
Bray, N. L., Pimentel, H., Melsted, P., and Pachter, L. (2016). Near-optimal probabilistic RNA-Seq quantification. Nat. Biotechnol. 34, 525–527. doi: 10.1038/nbt.3519
Bruns, A., Cypionka, H., and Overmann, J. (2002). Cyclic AMP and acyl homoserine lactones increase the cultivation efficiency of heterotrophic bacteria from the central Baltic Sea. Appl. Environ. Microbiol. 68, 3978–3987. doi: 10.1128/AEM.68.8.3978
Buchfink, B., Xie, C., and Huson, D. H. (2014). Fast and sensitive protein alignment using DIAMOND. Nat. Methods 12, 7–9. doi: 10.1038/nmeth.3176
Carles, L., Gardon, H., Joseph, L., Sanchís, J., Farré, M., and Artigas, J. (2019). Meta-analysis of glyphosate contamination in surface waters and dissipation by biofilms. Environ. Int. 124, 284–293. doi: 10.1016/j.envint.2018.12.064
Costerton, J. W., Lewandowski, Z., Caldwell, D. E., Korber, D. R., and Lappin-Scott, H. M. (1995). Microbial biofilms. Annu. Rev. Microbiol. 49, 711–745.
Davey, M. E., and O’Toole, G. A. (2000). Microbial biofilms: from ecology to molecular genetics. Microbiol. Mol. Biol. Rev. 64, 847–867. doi: 10.1128/MMBR.64.4.847-867.2000
Di Tommaso, P., Chatzou, M., Floden, E. W., Barja, P. P., Palumbo, E., and Notredame, C. (2017). Nextflow enables reproducible computational workflows. Nat. Biotechnol. 35, 316–319. doi: 10.1038/nbt.3820
Duke, S. O., and Powles, S. B. (2008). Glyphosate: a once-in-a-century herbicide. Pest Manag. Sci. 64, 319–325. doi: 10.1002/ps.1518
Fernandes, G., Aparicio, V. C., Bastos, M. C., De Gerónimo, E., Labanowski, J., Damian, P. O., et al. (2019). Indiscriminate use of glyphosate impregnates river epilithic biofilms in southern Brazil. Sci. Total Environ. 651, 1377–1387. doi: 10.1016/j.scitotenv.2018.09.292
Fu, L., Niu, B., Zhu, Z., Wu, S., and Li, W. (2012). CD-HIT: accelerated for clustering the next-generation sequencing data. Bioinformatics 28, 3150–3152. doi: 10.1093/bioinformatics/bts565
Grasshoff, K., Kremling, K., and Ehrhardt, M. (eds) (2007). Methods of Seawater Analysis. Third. Weinheim: Wiley-VCH, doi: 10.1002/9783527613984
Helcom. (2018). State of the Baltic Sea - Second HELCOM holistic assessment 2011-2016. Balt. Sea Environ. Proc. 155, 1–155.
Herlemann, D. P. R., Labrenz, M., Jürgens, K., Bertilsson, S., Waniek, J. J., and Andersson, A. F. (2011). Transitions in bacterial communities along the 2000 km salinity gradient of the Baltic Sea. ISME J. 5, 1571–1579. doi: 10.1038/ismej.2011.41
Huang, J., Su, Z., and Xu, Y. (2005). The evolution of microbial phosphonate degradative pathways. J. Mol. Evol. 61, 682–690. doi: 10.1007/s00239-004-0349-4
Huang, X. L., and Zhang, J. Z. (2011). Phosphorus sorption on marine carbonate sediment: phosphonate as model organic compounds. Chemosphere 85, 1227–1232. doi: 10.1016/j.chemosphere.2011.07.016
Jacob, G. S., Garbow, J. R., Hallas, L. E., Kimack, N. M., Kishore, G. M., and Schaefer, J. (1988). Metabolism of glyphosate in Pseudomonas sp. strain LBr. Appl. Environ. Microbiol. 54, 2953–2958.
Janßen, R., Zabel, J., von Lukas, U., and Labrenz, M. (2019). An artificial neural network and Random Forest identify glyphosate-impacted brackish communities based on 16S rRNA amplicon MiSeq read counts. Mar. Pollut. Bull. 149:110530. doi: 10.1016/j.marpolbul.2019.110530
Katoh, K., and Standley, D. M. (2013). MAFFT multiple sequence alignment software version 7: improvements in performance and usability. Mol. Biol. Evol. 30, 772–780. doi: 10.1093/molbev/mst010
Khadra, M., Planas, D., Girard, C., and Amyot, M. (2018). Age matters: submersion period shapes community composition of lake biofilms under glyphosate stress. Facets 3, 934–951. doi: 10.1139/facets-2018-9
Klátyik, S., Takács, E., Mörtl, M., Földi, A., Trábert, Z., and Ács, É, et al. (2017). Dissipation of the herbicide active ingredient glyphosate in natural water samples in the presence of biofilms. Int. J. Environ. Anal. Chem. 97, 901–921. doi: 10.1080/03067319.2017.1373770
Lane, D. (1991). “16/23S rRNA sequencing,” in Nucleic Acid Techniques in Bacterial Systematics, eds E. Stackebrandt and M. Goodfellow, (New York, NY: John Wiley & Sons).
Li, D., Liu, C. M., Luo, R., Sadakane, K., and Lam, T. W. (2014). MEGAHIT: an ultra-fast single-node solution for large and complex metagenomics assembly via succinct de Bruijn graph. Bioinformatics 31, 1674–1676. doi: 10.1093/bioinformatics/btv033
Lidbury, I. D. E. A., Murphy, A. R. J., Scanlan, D. J., Bending, G. D., Jones, A. M. E., Moore, J. D., et al. (2016). Comparative genomic, proteomic and exoproteomic analyses of three Pseudomonas strains reveals novel insights into the phosphorus scavenging capabilities of soil bacteria. Environ. Microbiol. 18, 3535–3549. doi: 10.1111/1462-2920.13390
Lipok, J., Owsiak, T., Młynarz, P., Forlani, G., and Kafarski, P. (2007). Phosphorus NMR as a tool to study mineralization of organophosphonates — The ability of Spirulina spp. to degrade glyphosate. Enzyme Microb. Technol. 41, 286–291. doi: 10.1016/j.enzmictec.2007.02.004
Lópes-Rodas, V., Flores-Moya, A., Maneiro, E., Perdigones, N., Marva, F., García, M. E., et al. (2007). Resistance to glyphosate in the cyanobacterium Microcystis aeruginosa as result of pre-selective mutations. Evol. Ecol. 21, 535–547. doi: 10.1007/s10682-006-9134-8
Love, M. I., Anders, S., and Huber, W. (2016). Differential analysis of count data – the DESeq2 package. Genome Biol. 15:550.
Lozano, V. L., Vinocur, A., Sabio y García, C. A., Allende, L., Cristos, D. S., Rojas, D., et al. (2018). Effects of glyphosate and 2,4-D mixture on freshwater phytoplankton and periphyton communities: a microcosms approach. Ecotoxicol. Environ. Saf. 148, 1010–1019. doi: 10.1016/j.ecoenv.2017.12.006
Lu, G. H., Zhu, Y. L., Kong, L. R., Cheng, J., Tang, C. Y., Hua, X. M., et al. (2017). Impact of a glyphosate-tolerant soybean line on the rhizobacteria, revealed by illumina Miseq. J. Microbiol. Biotechnol. 27, 561–572. doi: 10.4014/jmb.1609.09008
Martínez, A., Ventouras, L. A., Wilson, S. T., Karl, D. M., and DeLong, E. F. (2013). Metatranscriptomic and functional metagenomic analysis of methylphosphonate utilization by marine bacteria. Front. Microbiol. 4:1–18. doi: 10.3389/fmicb.2013.00340
McMurdie, P. J., and Holmes, S. (2013). Phyloseq: an R package for reproducible interactive analysis and graphics of microbiome census data. PLoS One 8:e61217. doi: 10.1371/journal.pone.0061217
McMurdie, P. J., and Holmes, S. (2014). Waste not, want not: why rarefying microbiome data is inadmissible. PLoS Comput. Biol. 10:e1003531. doi: 10.1371/journal.pcbi.1003531
Mercurio, P., Flores, F., Mueller, J. F., Carter, S., and Negri, A. P. (2014). Glyphosate persistence in seawater. Mar. Pollut. Bull. 85, 385–390. doi: 10.1016/j.marpolbul.2014.01.021
Newman, M. M., Lorenz, N., Hoilett, N., Lee, N. R., Dick, R. P., Liles, M. R., et al. (2016). Changes in rhizosphere bacterial gene expression following glyphosate treatment. Sci. Total Environ. 553, 32–41. doi: 10.1016/j.scitotenv.2016.02.078
Parks, D. H., Chuvochina, M., Waite, D. W., Rinke, C., Skarshewski, A., Chaumeil, P. A., et al. (2018). A standardized bacterial taxonomy based on genome phylogeny substantially revises the tree of life. Nat. Biotechnol. 36, 996–1004. doi: 10.1038/nbt.4229
Pedotti, M., Rosini, E., Molla, G., Moschetti, T., Savino, C., Vallone, B., et al. (2009). Glyphosate resistance by engineering the flavoenzyme glycine oxidase. J. Biol. Chem. 284, 36415–36423. doi: 10.1074/jbc.M109.051631
Porter, K. G., and Feig, Y. S. (1980). The use of DAPI for identifying and counting aquatic microflora. Limnol. Ocean. 25, 943–948. doi: 10.4319/lo.1980.25.5.0943
Qu, X., Ren, Z., Zhang, H., Zhang, M., Zhang, Y., Liu, X., et al. (2017). Influences of anthropogenic land use on microbial community structure and functional potentials of stream benthic biofilms. Sci. Rep. 7, 1–12. doi: 10.1038/s41598-017-15624-x
R Core Team, (2018). R: A Language and Environment for Statistical Computing. Available at: http://www.R-project.org/ (accessed May, 2019).
Ratcliff, A. W., Busse, M. D., and Shestak, C. J. (2006). Changes in microbial community structure following herbicide (glyphosate) additions to forest soils. Appl. Soil Ecol. 34, 114–124. doi: 10.1016/j.apsoil.2006.03.002
Reese, A. T., Savage, A., Youngsteadt, E., McGuire, K. L., Koling, A., Watkins, O., et al. (2016). Urban stress is associated with variation in microbial species composition—but not richness—in Manhattan. ISME J. 10, 751–760. doi: 10.1038/ismej.2015.152
Rognes, T., Flouri, T., Nichols, B., Quince, C., and Mahé, F. (2016). VSEARCH: a versatile open source tool for metagenomics. PeerJ 4, 1–22. doi: 10.7717/peerj.2584
Schloss, P. D., Westcott, S. L., Ryabin, T., Hall, J. R., Hartmann, M., Hollister, E. B., et al. (2009). Introducing mothur: open-source, platform-independent, community-supported software for describing and comparing microbial communities. Appl. Environ. Microbiol. 75, 7537–7541. doi: 10.1128/AEM.01541-9
Seemann, T. (2014). Prokka: rapid prokaryotic genome annotation. Bioinformatics 30, 2068–2069. doi: 10.1093/bioinformatics/btu153
Skeff, W., Neumann, C., and Schulz-Bull, D. E. (2015). Glyphosate and AMPA in the estuaries of the Baltic Sea method optimization and field study. Mar. Pollut. Bull. 100, 577–585. doi: 10.1016/j.marpolbul.2015.08.015
Skeff, W., Recknagel, C., and Schulz-Bull, D. E. (2016). The influence of salt matrices on the reversed-phase liquid chromatography behavior and electrospray ionization tandem mass spectrometry detection of glyphosate, glufosinate, aminomethylphosphonic acid and 2-aminoethylphosphonic acid in water. J. Chromatogr. A 1475, 64–73. doi: 10.1016/j.chroma.2016.11.007
Stachowski-Haberkorn, S., Becker, B., Marie, D., Haberkorn, H., Coroller, L., and de la Broise, D. (2008). Impact of Roundup on the marine microbial community, as shown by an in situ microcosm experiment. Aquat. Toxicol. 89, 232–241. doi: 10.1016/j.aquatox.2008.07.004
Stamatakis, A. (2014). RAxML version 8: a tool for phylogenetic analysis and post-analysis of large phylogenies. Bioinformatics 30, 1312–1313. doi: 10.1093/bioinformatics/btu033
Sviridov, A. V., Shushkova, T. V., Ermakova, I. T., Ivanova, E. V., Epiktetov, D. O., and Leontievsky, A. A. (2015). Microbial degradation of glyphosate herbicides (Review). Appl. Biochem. Microbiol. 51, 188–195. doi: 10.1134/S0003683815020209
Tlili, A., Corcoll, N., Bonet, B., Morin, S., Montuelle, B., Bérard, A., et al. (2011). In situ spatio-temporal changes in pollution-induced community tolerance to zinc in autotrophic and heterotrophic biofilm communities. Ecotoxicology 20, 1823–1839. doi: 10.1007/s10646-011-0721-2
Van Bruggen, A. H. C., He, M. M., Shin, K., Mai, V., Jeong, K. C., Finckh, M. R., et al. (2018). Environmental and health effects of the herbicide glyphosate. Sci. Total Environ. 616–617, 255–268. doi: 10.1016/j.scitotenv.2017.10.309
Vera, M. S., Lagomarsino, L., Sylvester, M., Pérez, G. L., Rodríguez, P., Mugni, H., et al. (2010). New evidences of Roundup® (glyphosate formulation) impact on the periphyton community and the water quality of freshwater ecosystems. Ecotoxicology 19, 710–721. doi: 10.1007/s10646-009-0446-7
Wang, C., Lin, X., Li, L., Lin, L. X., and Lin, S. (2017). Glyphosate shapes a dinoflagellate-associated bacterial community while supporting algal growth as sole phosphorus source. Front. Microbiol. 8:2530. doi: 10.3389/fmicb.2017.02530
Wang, C., Lin, X., Li, L., and Lin, S. (2016). Differential growth responses of marine phytoplankton to herbicide glyphosate. PLoS One 11:1–20. doi: 10.1371/journal.pone.0151633
Weaver, M. A., Krutz, L. J., Zablotowicz, R. M., Reddy, K. N., Zablatowicz, R. M., and Reddy, K. N. (2007). Effects of glyphosate on soil microbial communities and its mineralization in a Mississippi soil. Pest Manag. Sci. 63, 388–393. doi: 10.1002/ps.1351
Weinbauer, M. G., Fritz, I., Wenderoth, D. F., and Höfle, M. G. (2002). Simultaneous extraction from bacterioplankton of total RNA and DNA suitable for quantitative structure and function analyses simultaneous extraction from bacterioplankton of total RNA and DNA suitable for quantitative structure and function analyses. Appl. Environ. Microbiol. 68, 1082–1087. doi: 10.1128/AEM.68.3.1082
White, A. K., and Metcalf, W. W. (2004). Two C-P lyase operons in Pseudomonas stutzeri and their roles in the oxidation of phosphonates, phosphite, and hypophosphite. J. Bacteriol. 186, 4730–4739. doi: 10.1128/JB.186.14.4730-4739.2004
Wirth, M. A., Sievers, M., Habedank, F., Kragl, U., et al. (2019). Electrodialysis as a sample processing tool for bulk organic matter and target pollutant analysis of seawater. Mar. Chem. 217:103719. doi: 10.1016/j.marchem.2019.103719
Yilmaz, P., Parfrey, L. W., Yarza, P., Gerken, J., Pruesse, E., Quast, C., et al. (2014). The SILVA and “all-species Living Tree Project (LTP)” taxonomic frameworks. Nucleic Acids Res. 42, 643–648. doi: 10.1093/nar/gkt1209
Yu, G., Lam, T. T.-Y., Zhu, H., and Guan, Y. (2018). Two methods for mapping and visualizing associated data on phylogeny using ggtree. Mol. Biol. Evol. 35, 3041–3043. doi: 10.1093/molbev/msy194
Keywords: glyphosate, AMPA, Baltic Sea, phn, gox, next-generation sequencing, Gallaecimonas, bacteria
Citation: Janßen R, Skeff W, Werner J, Wirth MA, Kreikemeyer B, Schulz-Bull D and Labrenz M (2019) A Glyphosate Pulse to Brackish Long-Term Microcosms Has a Greater Impact on the Microbial Diversity and Abundance of Planktonic Than of Biofilm Assemblages. Front. Mar. Sci. 6:758. doi: 10.3389/fmars.2019.00758
Received: 26 August 2019; Accepted: 21 November 2019;
Published: 10 December 2019.
Edited by:
Xiaoshou Liu, Ocean University of China, ChinaReviewed by:
Ying Wang, Tianjin University of Commerce, ChinaWenyan Zhang, Institute of Oceanology (CAS), China
Copyright © 2019 Janßen, Skeff, Werner, Wirth, Kreikemeyer, Schulz-Bull and Labrenz. This is an open-access article distributed under the terms of the Creative Commons Attribution License (CC BY). The use, distribution or reproduction in other forums is permitted, provided the original author(s) and the copyright owner(s) are credited and that the original publication in this journal is cited, in accordance with accepted academic practice. No use, distribution or reproduction is permitted which does not comply with these terms.
*Correspondence: Matthias Labrenz, bWF0dGhpYXMubGFicmVuekBpby13YXJuZW11ZW5kZS5kZQ==