 Dominique A. Cowart
 Marjolaine Matabos
 Miriam I. Brandt
 Julien Marticorena
 Jozée Sarrazin
- 1Ifremer Centre de Bretagne, REM/EEP, Laboratoire Environnement Profond, Plouzané, France
- 2IRD, CNRS, MARBEC, Ifremer, Université de Montpellier, Sète, France
Deep ocean hydrothermal vent ecosystems face physical disturbances from naturally occurring volcanic and tectonic activities and are at increasing risk of mineral resource exploitation, raising concerns about the resilience of endemic biological communities. Following destructive events, efficient and rapidly applicable surveys of organisms are required to monitor the state, evolution and a possible return of these ecosystems to their original baseline status. In this study, we explored the environmental DNA (eDNA) approach as a tool (1) to assess biodiversity of benthic communities associated with deep-sea hard substrata and (2) tracked the recolonization dynamics of benthic invertebrate communities living on the Montségur edifice within the Lucky Strike vent field (Mid-Atlantic Ridge), after an induced disturbance that consisted of faunal clearance within experimental quadrats. Hard substratum samples were collected prior to and one year after the disturbance, for eDNA metabarcoding using one marker of the mitochondrial Cytochrome Oxidase I (COI) gene and three markers of the nuclear 18S ribosomal RNA (18S) gene. We also generated a DNA barcoding inventory that consisted of taxa physically collected from Montségur and morphologically identified. This inventory contained amplified barcodes from COI, 18S and the nuclear large subunit ribosomal RNA (28S) gene. The resulting sequence information from the COI and 18S were used for eDNA taxonomic assignment. The eDNA datasets uncovered a high diversity of metazoan OTUs, which included macro- and meiofauna common to Lucky Strike. Baseline data collected at the start of the experiment identified higher OTU richness at sites peripheral to the active edifice, as well as at inactive sites. One year following the initial disturbance, analysis of recolonization data found no statistical difference in presence/absence from baseline communities. The eDNA protocols provide a reproducible strategy to quickly assess biodiversity associated with deep sea hard substratum, enabling comparisons across various habitats. To follow recolonization dynamics at small spatial scales, however, we recommend an approach that uses both molecular and morphological-based traditional methods. Finally, we present original data on the “unseen” diversity of the fauna inhabiting the poorly studied inactive sites, locations that are targeted by commercial mining. Continued monitoring of these sites is currently ongoing and will bring new insight on recovery potential over time, with the ultimate goal of informing conservation and management decisions in relation to the protection of hydrothermal vent ecosystems.
Introduction
Deep ocean hydrothermal vent ecosystems are dynamic and irregular habitats that experience severe environmental conditions, including a complete absence of sunlight, high hydrostatic pressures, wide variations in local temperatures, as well as toxic levels of sulfides and heavy metals (Johnson et al., 1988; Childress and Fisher, 1992; Tunnicliffe, 1992). Despite these harsh conditions, several species of benthic invertebrates exhibit physiological tolerances that allow them to successfully colonize vent habitats (Desbruyères et al., 2000). Vent communities are sustained by a complex trophic network, in which microorganisms serve as primary producers/consumers that harvest energy from the chemical compounds present within the hot fluids (up to 400°C) emitted from the seafloor (Karl et al., 1980; Baross and Hoffman, 1985; Tunnicliffe et al., 1997). This chemosynthetic activity drives thriving faunal communities that often consist of assemblages dominated by large symbiotic taxa such as mytilid mussels, siboglinid polychaetes and alvinocaridid shrimp (Tunnicliffe, 1991; Cuvelier et al., 2011a).
Communities living at active vents are often characterized as transitory, due to variations in environmental conditions caused by tectonic activity and sporadic volcanic eruptions (Lutz and Kennish, 1993; Butterfield et al., 1997). These naturally occurring disturbances can lead to the alteration of vent fluid chemistry, the reduction or sealing off of fluid emission and changes in the physical environment such as the collapse of sulfide edifices, thus greatly influencing community presence, composition and trophic dynamics (Tunnicliffe and Juniper, 1990; Sarrazin et al., 1997; Sarrazin and Juniper, 1999; Tsurumi, 2003; Kelly et al., 2007). Active vent ecosystems host high biomass of endemic organisms capable of coping with this unique environment as well as intermittent changes in fluid flow and oxygen access. Less active areas, such as sites peripheric to active vent edifices, as well as inactive sulfide mounds, are known to host lower densities and biomass as a result of less energy flow provided by hydrothermal output (Levin et al., 2016). Furthermore, active hydrothermal sediments are characterized by greater dominance and lower diversity relative to inactive background sediments (Vanreusel et al., 1997; Levin et al., 2009). Recovery of communities living at active vent sites after a disturbance is influenced by several factors. Among these are reproductive strategies, larval life histories and dispersal distances from nearby established assemblages, the presence of ideal substratum for settlement, biotic and abiotic chemical cues, as well as competition and predation levels (Mullineaux, 2000; Micheli et al., 2002; Mullineaux et al., 2003; Hunt et al., 2004; Kelly et al., 2007; Cuvelier et al., 2014).
While the most common disturbance experienced at vents originates from tectonic and volcanic events, human activities have increasingly emerged as additional sources of perturbation (Ramirez-Llodra et al., 2011). These activities range from having no measurable impact, such as photo surveys, to those having substantial impacts, such as drilling, trawling and mineral extraction (Van Dover, 2014). Mineral mining of deep-sea resources, notably seafloor massive sulfides (SMS), is one such activity with the potential for substantial destruction of vent habitats. SMS form by rapid mineral precipitation from overheated vent fluids as they are ejected from the seafloor and interact with cooler ambient seawater (Fisher et al., 2007; Rona, 2008; Boschen et al., 2013). The resulting deposits exist in active or inactive zones and can take hundreds of years to form high concentrations of lead, zinc, copper, cobalt, gold and silver; this consistency of some deposits make them economically valuable and of possible interest to prospecting companies (Krasnov et al., 1995; Hoagland et al., 2010; ISA, 2010; Boschen et al., 2013). While little is known regarding how commercial mineral extraction efforts would proceed at vents, collections of deposits will be similar to open-cut mining seen at land-based sites, with the extraction phase causing the removal of organisms, the loss of habitat, decreases in primary productivity and biodiversity, as well as extinctions of rare taxa, particularly at inactive locations where faunal communities are poorly known (Van Dover, 2011, 2014; Boschen et al., 2013; Gollner et al., 2017). The potential for mining deposits has therefore raised concerns about the future of benthic communities present at sites where SMS are found, as well as encouragement for continued investigations into the resilience of possibly impacted communities (Ramirez-Llodra et al., 2011; Mengerink et al., 2014; Gollner et al., 2017).
The Mid-Atlantic Ridge (MAR) vent system is one such region where unique geological features and geochemical attributes allow SMS formation (Hannington et al., 2011; Monecke et al., 2015). While slower-spreading and more stable compared to vents at Juan de Fuca ridge and East Pacific Rise, MAR systems may also experience occasional volcanic events (Humphris et al., 2002; Van Dover et al., 2002). So far, however, the scarcity of these events prevented the study of faunal recovery after natural disturbance, as was done along the East Pacific ridge systems (Shank et al., 1998; Mullineaux et al., 2010). One alternative approach to gain insights into colonization and recovery processes is the deployment of artificial substrata on the seafloor. At the Lucky Strike (LS) hydrothermal vent field along the MAR, such an experiment showed that after 2 years, vent activity and biological interactions were the most important structuring factors explaining meio- and macrofaunal colonization of newly available substrata (Cuvelier et al., 2014). The deployment of a separate set of experiments in the same area found that after only 9 months, different meiofaunal taxa had preferentially colonized one substratum or the other, but the 9 months time scale still supported hydrothermal activity as the prominent factor influencing community structure (Zeppilli et al., 2015). These studies suggest that colonization at LS can occur fairly rapidly, however, how quickly communities can return to their baseline status (recolonize) after a disturbance requires additional investigation (Mengerink et al., 2014; Van Dover, 2014).
The assessments of vent faunal colonization patterns based on the deployment of artificial substratum involves identification of settled fauna through video stream (only larger species) and/or physical taxa sorting (Hunt et al., 2004; Kelly et al., 2007; Gaudron et al., 2010; Cuvelier et al., 2014; Zeppilli et al., 2015). These strategies request extensive handling of collections and taxonomic expertise for identification, which can be difficult when working with early life stages or faunal remains. Furthermore, these methods may miss microscopic, rare or cryptic fauna possibly critical for interpreting community dynamics. In contrast, High-Throughput Sequencing technologies (HTS) have enabled the development of sensitive biodiversity surveys to allow the screening of bulk environmental samples (water, sediment, and other mass collections) containing a mix of genetic information from many organisms (“biodiversity soup,” Yu et al., 2012). DNA metabarcoding – the use of one or more genes to simultaneously identify taxa present within bulk samples (Coissac et al., 2012) – has already provided rapid and thorough assessments of entire communities, while revealing higher levels of diversity than physical sampling methods (Ji et al., 2013; Lindeque et al., 2013; Cowart et al., 2015; Leray and Knowlton, 2015). In particular, environmental samples containing free cells and nucleic acids released by organisms into their habitat (environmental DNA/RNA – eDNA/eRNA, Taberlet et al., 2012a; Barnes and Turner, 2016) have provided a comprehensive characterization of organisms from both past and contemporary assemblages and helped inform on the ecological trajectory of impacted communities (Hänfling et al., 2016; Valentini et al., 2016; Laroche et al., 2017, 2018). The relative inaccessibility of hydrothermal vents due to technological and logistical constraints and sampling difficulties makes eDNA metabarcoding monitoring particularly attractive for evaluating biodiversity and the recolonization of faunal communities. First, eDNA is often less destructive when compared to surveys that require animal collection (Thomsen and Willerslev, 2015); this is especially important when attempting to obtain data from newly established communities hosting early life stages. Secondly, eDNA is effective for recovering genetic signals of small, rare or transient taxa missed by physical collection or observational surveys (Thomsen et al., 2016; Valentini et al., 2016). This characteristic is useful within the deep-sea framework, where collections are done by remote mechanical manipulation that may overlook these “hidden” organisms.
In the present investigation, we explore eDNA as a method for assessing the diversity of deep-sea benthic communities living on hard substrata, as well as provide an early evaluation of the resilience of hydrothermal vent biological communities to a disturbance experiment by following the recolonization dynamics of benthic invertebrate communities at the LS vent field on the MAR. The experiment was carried out at 1,700 m depth along an environmental gradient that includes the Montségur active sulfide structure, a sedimentary site at its periphery (∼30 m) and an inactive site, approximately 400 m away from it. This experimental setting allowed us to monitor community recolonization on active sites, approximately 1 year after the induced disturbance. As there were no significant changes to fluid flow during the induced disturbance event, we primarily address the role of biotic processes on recolonization dynamics, which have been shown to be critical in structuring vent communities. We chose to perform eDNA metabarcoding of retrieved substratum to (1) provide a comprehensive overview of taxa (Operational Taxonomic Units – OTUs) present at experimental sites prior to and 1 year after the disturbance, (2) examine the possible impact of mobile predators on community re-establishment during this time period and (3) investigate how vent activity along an environmental gradient influences the structure of communities. We additionally provide protocols for eDNA collection and processing of hydrothermal sulfide remains, an inventory of taxa physically collected, morphologically identified and DNA barcoded for comparison against eDNA sequence data, as well as suggested improvements for future studies.
Materials and Methods
Location of the Experiment
The LS hydrothermal vent field is located within a marine protected area along the MAR, southwest of the Azores Archipelago (Figure 1, top left, center). LS has a mean depth of 1,700 m and consists of three seamounts that surround a lava filled depression (“lava lake,” Barreyre et al., 2014). The vent field hosts over twenty active vent edifices, including Montségur situated in the southeastern sector of LS and encompassing an area of ∼384 m2 (Figure 1 top right, Langmuir et al., 1997; Ondréas et al., 2009; Barreyre et al., 2014). Montségur is a large active sulfide edifice surrounded by a large fissured slab through which diffused fluids expel. Samples were taken both on the structure itself and at its base on the seafloor. The site at the periphery is likely composed of a mixture of hydrothermal particles and surface material sediments. Finally, the inactive site, located approximately 400 m away from Montségur, is composed of indurated sulfides.
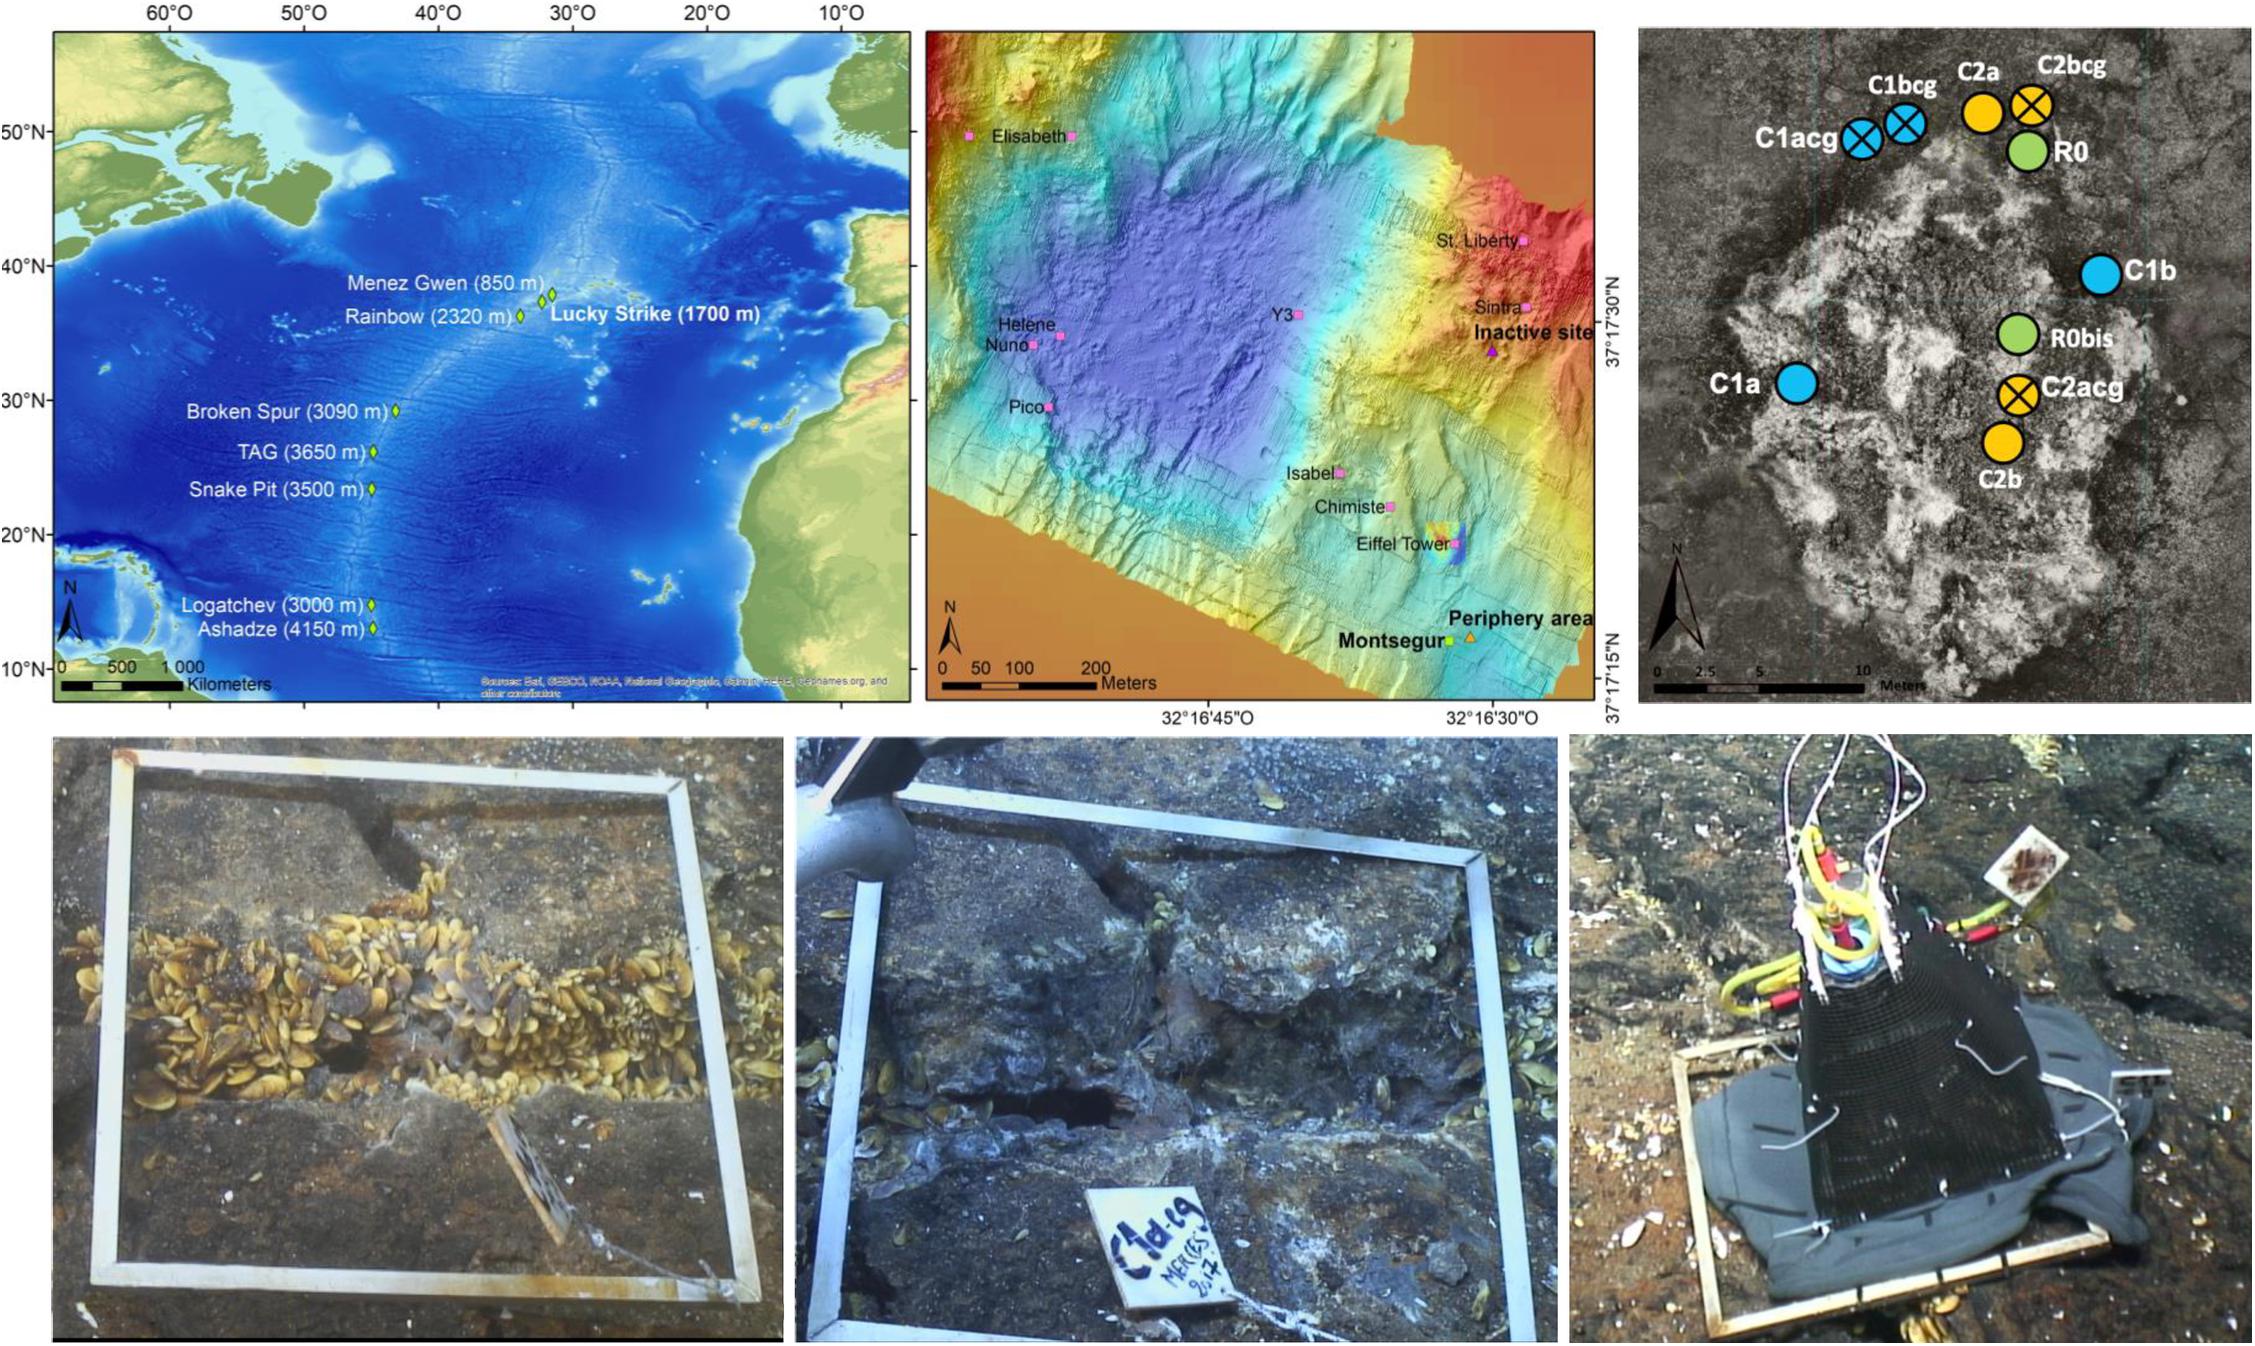
Figure 1. (Top left) Location of the Lucky Strike vent field on the Mid-Atlantic Ridge, south of the Azores. (Top center) The 1 km2 Lucky Strike vent field with the Montségur edifice on the south-east. (Top right) View of the full in situ experiment on the Montségur hydrothermal edifice. (Bottom left) Experimental quadrat C1a_cg at the base of Montségur and Bathymodiolus assemblage, prior to clearance. (Bottom center) Experimental quadrat C1a_cg after clearance; the suction device (metal pipe) is shown at the top left corner of this panel. (Bottom right) Experimental quadrat that has been covered by pyramidal cage and a skirt in 2018. All quadrats measure 50 × 50 cm in size.
The Montségur edifice harbors a similar faunal composition to Eiffel Tower, another active but better studied vent edifice within LS (Figure 1, top center Cuvelier et al., 2011a, b). From this particular edifice, approximately 70 taxa are known, and conspicuous species include Bathymodiolus azoricus mussels, Mirocaris fortunata shrimp, Branchipolynoe seepensis and Amphisamytha lutzi polychaetes, as well as Lepetodrilus atlanticus and Protolira valvatoides gastropods (Sarrazin et al., 2015). These dominant macrofaunal species live in association with a variety of other organisms including those belonging to the meiofaunal compartment primarily composed of nematodes and copepods (Zeppilli et al., 2015; Plum et al., 2017). Two faunal assemblages were described in this area: the first is dominated by Bathymodiolus azoricus mussels that live in lower temperatures and chemical outputs, while exhibiting higher taxonomic diversity and densities. The second is dominated by Mirocaris fortunata shrimp that live in higher temperatures and chemical outputs, while exhibiting lower taxonomic diversity and densities (Desbruyères et al., 2000; Cuvelier et al., 2009, 2011a; Sarrazin et al., 2015).
Experiment Deployment and Sample Acquisition
The in situ experiment was deployed at LS during the Momarsat 2017 cruise that occurred in July 2017 on the R/V Pourquoi pas? using the ROV Victor6000, as part of the EMSO-Azores observatory annual maintenance. It consisted of ten quadrats sized 50 x 50 cm each, deployed on and at the base of Montségur in Bathymodiolus azoricus assemblages described previously (Figure 1, bottom left). Eight of these quadrats were positioned to study recolonization processes following faunal clearance after 1 year (C1) and 2 years (C2). Replicate samples for each year were denoted as “a” or “b” (Table 1). In addition, two quadrats were sampled the first year as reference (R) for comparison with experimental (C) quadrats. All 10 quadrats were placed at approximately 1,700 m depth and used to either observe natural succession patterns (reference) or passive recolonization of communities after disturbance (experimental).
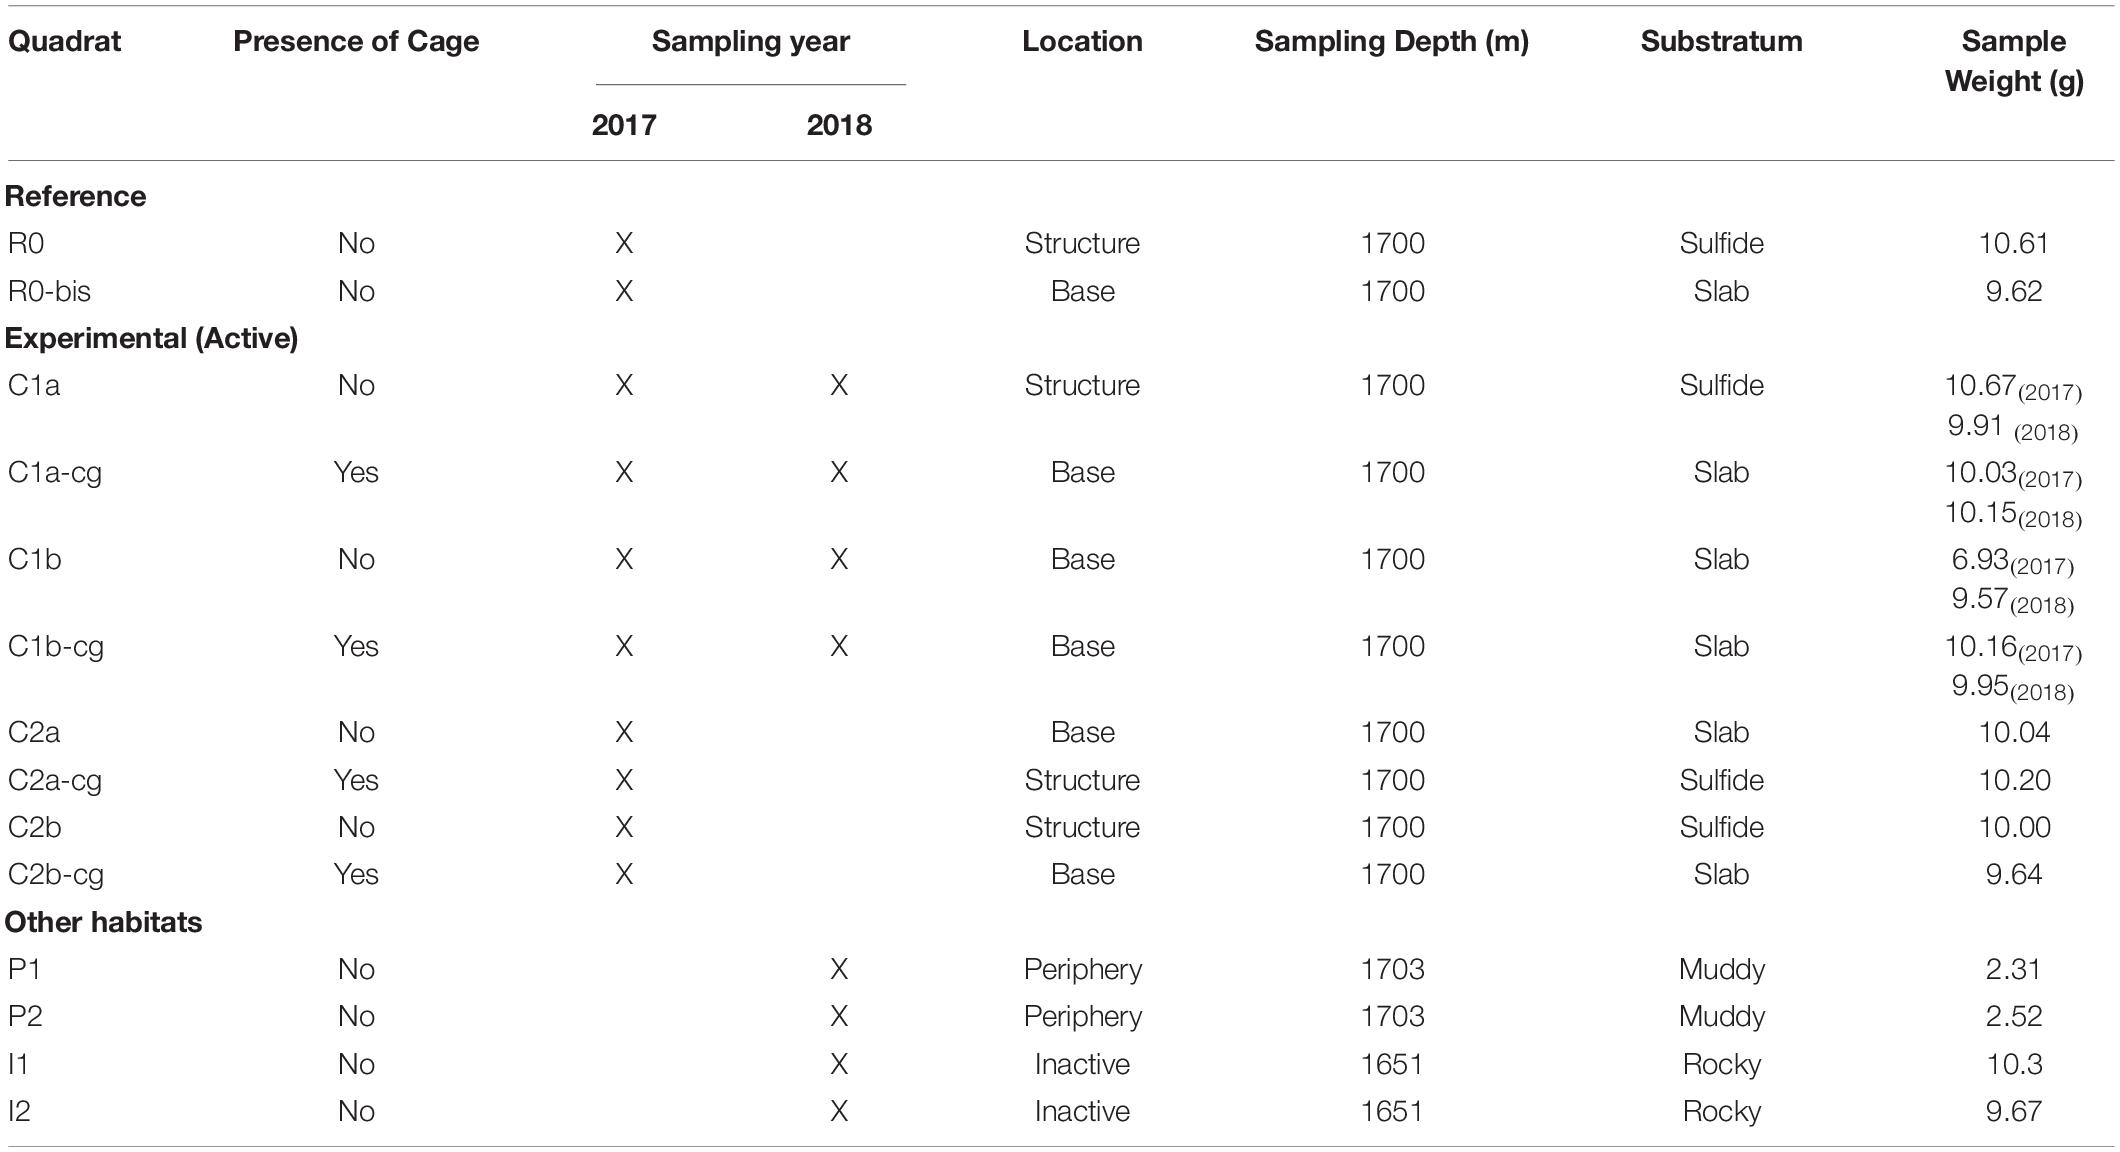
Table 1. Details of each substratum sample obtained from the in situ experiment that was deployed on and at the base of the Montségur edifice, as well as at the peripheric and inactive habitats.
Prior to clearance, initial physical and chemical characterizations were done. Fauna was then removed/cleared from the experimental quadrats using the robotic arm and claw of Victor6000 to physically grab and scrub the animals from the hard substrata; animals were then placed in bioboxes (Figure 1, bottom center). This operation was followed by the use of a suction device to vacuum the remaining organisms within the quadrat. There were, however, animals remaining underneath some quadrats in small fractures, as access for removal was difficult (Figure 1). After clearance, quadrats underwent a final physico-chemical characterization of the bare substratum. To better evaluate the role of mobile predators on local recolonization, pyramidal structures encased in 1 cm plastic mesh were placed over specific quadrats denoted as “cg” for caged (Figure 1, bottom right). When possible, paired quadrats (caged and uncaged) were placed next to each other (Figure 1, top right). Upon arrival of the bioboxes onboard the ship and prior to faunal sorting, 9 – 10 g of substratum, debris and pebbles from each quadrat collection was immediately removed directly from the bioboxes using tweezers and spoons previously sterilized with 10% bleach solution. Each sample was then placed in sterile 50-ml centrifuge tubes and stored at −80°C until eDNA extraction could be carried out at the shore-based laboratory. Fauna remaining after substratum collection were preserved in 96° ethanol for further identification.
The Montségur experiment was re-visited 13 months later during the Momarsat 2018 cruise on the R/V L’Atalante, using the ROV Victor6000 to retrieve additional faunal and substratum samples. At this time, quadrats dedicated to the study of 1-year recolonization processes following disturbance (C1 experimental quadrats) were sampled (Table 1). To complement our experiment with baseline data from additional habitats, four new quadrats were deployed: two replicate samples were collected at 1,703 m depth in a sedimented peripheral area (denoted as “P”), located about 30 m away from Montségur, and two replicate samples were collected at 1,651 m depth on an inactive edifice (denoted as “I”) situated 400 m north of Montségur (Figure 1 top center and Table 1). In these areas, only the suction device was used to vacuum the substrata along with its fauna, collecting approximately 2.50 g of substratum for the peripheral sites and 9 – 10 g of substratum for inactive sites (Table 1). Onboard processing was conducted as stated above. For every quadrat visited in 2018, characterization of abiotic conditions and substratum sampling were performed following the same strategy and protocols as in 2017, yielding a total of 18 substratum samples across both years (Table 1).
DNA Extraction and Barcoding of Taxa
Individuals from each faunal group were identified on the basis of morphology to the lowest taxonomic group possible prior to DNA extraction, which was most frequently the species level. DNA from every individual was extracted separately for genetic confirmation of their putative morphological identities. Genomic DNA was extracted from the tissues of 1–12 individuals of each morphologically identified taxon, depending on the number of individuals available for processing. Extracted DNA was obtained from multiple individuals per taxonomic group, in an attempt to account for intraspecific diversity. DNA extractions occurred using either the CTAB method (Doyle, 1991) or the DNeasy Blood and Tissue kit (Qiagen, Hildren, Germany) following the manufacturer’s instructions. Negative control samples, containing only reagents, were included for each extraction series. Following extraction, an aliquot of each sample was electrophoresed on a 1 % agarose gel stained with ethidium bromide to visualize extract quality. Newly extracted DNA samples were stored at −20°C until end-point PCR amplification assays.
PCR assays were performed to amplify fragments of the mitochondrial gene Cytochrome Oxidase I (COI) and nuclear genes 28S large subunit ribosomal RNA (28S) and 18S small subunit ribosomal RNA (18S); each assay round included a negative control with molecular grade H2O instead of DNA extract and extraction negative controls to assess for potential contamination. Fragments of the COI gene were amplified using degenerate versions of Folmer’s primers (Folmer et al., 1994; Leray et al., 2013), while 28S gene regions D2D3 and D9D10 were amplified using primers from De Ley et al. (1999) and Machida and Knowlton (2012). For 18S, the V1V2, V7V8 and V9 regions were amplified using primers developed by Amaral-Zettler et al. (2009), Stoeck et al. (2010), Machida and Knowlton (2012), and Sinniger et al. (2016). All protocols, including PCR master mixes and cycling conditions for each gene region, are detailed in Supplementary Material S1. Prior to Sanger sequencing, all PCR products were electrophoresed as described above; none of the negative controls or extraction blanks showed evidence of contamination. PCR products showing evidence of amplification were sent to Eurofins/GATC Biotech or Macrogen where purification and sequencing reactions were performed using the ABI BigDye® Terminator v3.1 Cycle Sequencing Kit (Applied Biosystems, Waltham, MA, United States) and read on an ABI 3730xl sequencer following the protocols supplied by the manufacturer. Resulting sequence chromatograms were visualized, assembled and edited using Geneious v.10.0.5 (Kearse et al., 2012). Finally, the NCBI blastn algorithm (Johnson et al., 2008) was used to match sequences to publicly available databases and determine their nearest identities at <98 – 100%; confirmed sequences were integrated into larger reference databases for the eventual matching to eDNA sequence data.
eDNA Extraction, Library Construction and Metabarcoding
Genomic DNA was extracted from up to 10 g of substrate from each of the 18 samples using the Qiagen PowerMax® Soil DNA Isolation kit following the manufacturer’s instructions. To reduce the risk of contamination, eDNA extractions were carried out under a Captair® bio BioCap DNA/RNA workstation (rlab, Rowley, MA, United States) with UV sterilization and filtered airflow. Tools and equipment were UV sterilized and washed with 50% bleach solution as per sterilization protocols suggested by Goldberg et al. (2016). Samples were manipulated using a newly purchased and dedicated set of pipettes fitted with filter tips to avoid cross-contamination. Negative extraction controls (no substratum, only reagents) and positive extraction controls (local shallow water sand collected at 0 m depth from Plage du Dellec, Plouzané, France) were included during each set of extractions to assess potential contamination (−) or confirm that the protocol was successful (+). Aliquots of extract were used to determine the concentration of each sample via the Qubit® dsDNA HS Assay Kit (Thermo Fisher Scientific, Waltham, MA, United States) prior to submission to MR DNA (Shallowater, TX, United States) for amplicon generation, library preparation and subsequent metabarcode sequencing. Positive controls contained measurable quantities of DNA; none of the seven negative controls showed evidence of contamination and were sent, along with the true eDNA samples, to MR DNA for amplicon sequencing.
Given the (1) extensiveness of the publicly available sequence databases for COI and 18S genes, (2) the ability of the COI and 18S primer sets to amplify across several taxa (“universality”) and (3) the short length of amplicons necessary for working with fragmented eDNA, primers amplifying 18S-V1V2 (350-bp), 18S-V4 (270-bp), 18S-V9 (130-bp), and COI (313-bp) were used for eDNA metabarcoding. PCR amplification was completed using the Qiagen HotStarTaq Plus Master Mix Kit, in a final volume of 25 μl. The final concentration for each reagent of the master mix was: 1.44 mM MgCl2, 192 μM of each dNTP, 0.25 μM for each primer, 0.8 units of HotStarTaq Plus DNA polymerase and 1 μl of each sample was added to the reaction. Additionally, assays were optimized by increasing the final concentration of MgCl2 to 1.64 mM, as well as adding a final concentration of 1.6 mg/ml bovine serum albumin (BSA). Each sample underwent cycling conditions as follows: 94°C for 3 min, followed by 28 cycles of 94°C for 30 s, 53°C for 40 s and 72°C for 1 min, finalizing an elongation step at 72°C for 5 min. Generated amplicons were used for the preparation of sequencing libraries by mixing all amplicon products from different samples in equal concentrations and purifying using Agencourt Ampure beads (Agencourt Bioscience Corporation, Beverly, MA, United States). The manufacturer’s recommendation of 100 ng (350-bp insert size) of the purified amplicon pool was used as input for the Illumina TruSeq DNA protocol. After library purification, the final concentration of the pooled library was calculated using the Qubit® dsDNA HS assay and diluted to 10 nM in preparation for sequencing. Libraries were sequenced paired end for 600 cycles (300 cycles in one direction and 300 cycles in the opposite direction) on the Illumina MiSeq, ensuring the complete insert was sequenced.
Bioinformatic Workflow and Statistical Strategy for Analyzing eDNA Datasets
Resulting raw sequence reads were processed with the FROGS v.2.0 pipeline (Escudié et al., 2017), using both Galaxy web and command-line interfaces. Reads were first demultiplexed then merged at a mismatch rate of 0.1 for each gene. Given the short length of the 18S-V9 fragment and the 2 × 300-bp read length achieved by Illumina sequencing, Trimmomatic v.0.39 (Bolger et al., 2014) was used to trim the length of each direction for this dataset to 140-bp, prior to merging the reads in FROGS. After merging, the minimum and maximum amplicon lengths for each gene were as follows: 250 and 450-bp for COI; 300 and 500-bp for 18S-V1V2; 280 and 500-bp for 18S-V4; 50 and 250-bp for 18S-V9. Next, datasets underwent swarm clustering (Mahé et al., 2014) at small local linking threshold of d = 2. Chimera and singleton filtering followed, with FROGS implementing VSEARCH (Rognes et al., 2016) to detect chimeras de novo in each sample. Next, filtering was done to keep OTUs that had a minimum number of 2 sequences assigned. Afterward, blastn+ was implemented to assign taxonomy by finding alignments between the resulting OTUs and specifically compiled reference databases. FROGS recommended the use of taxonomic filters in situations of well-known communities, when poorly characterized taxa are of no interest, or if researchers are interested only in some chosen and known taxa. An initial test implementing Blastn+ to assign taxonomy only to the COI dataset using a 96% percent identity threshold (Hebert et al., 2003; Bellec et al., 2018) ejected the majority of the OTUs and reduced the power of statistical analyses. Given this result, as well as our interest in the identities of multiple species in largely unknown and poorly characterized communities, taxonomic thresholds were not implemented at this stage. Additional filters, however, were performed during downstream bioinformatic processing describe below. Further, all resulting assignments produced e-values below 8e-7, while percentage identities were between 72.5 and 100%, with metazoans matches from 85% and above. Reference databases for taxonomic assignment were compiled by retrieving publicly available sequences from the Silva release 132 (Quast et al., 2012) for the 18S fragments and the NCBI GenBank Core Nucleotide, October 2017 release for COI. DNA barcoded taxa from this study were concatenated onto the relevant public reference databases prior to taxonomic assignment.
Additional processing, including filtering, data normalization, total taxa and metazoan specific community composition visualization and statistical analyses of curated data was conducted using the Phyloseq R package (McMurdie and Holmes, 2013) in R Studio v.3.5.1. Briefly, Phyloseq was implemented to examine the overall sequencing depth across samples before and after the removal of non-metazoan taxa to determine if sequencing was sufficient to characterize communities at the time of sampling, as well as normalization via rarefaction without replacement and the filtering of OTUs with fewer than 3 reads per sample. The generation of rarefaction curves and biodiversity analyses were performed within the R vegan package (v2.5-2) (Oksanen, 2015), including the estimation of metazoan species richness for incidence data (Chao 2, Chao and Chiu, 2016).
We sought to explore potential dissimilarities in faunal compositions and diversity between differing treatment factors. Our strategy for comparing communities is based on the experimental design that takes into account (1) habitat type for reference (or “baseline”) data (active, periphery and inactive) to test for the influence of vent activity; (2) location in the active area (edifice vs. base) to test for substratum type (sulfide versus slab); (3) collection year (2017 “baseline data” vs. 2018 “recolonization data”) to test for the disturbance impact; (4) the presence of cages (2018 cage data vs. 2018 non-caged data) to test for the effect of predators on recolonization patterns. Aided by the vegan package, the role of each factor (habitat, location, year and cages) was tested using Analysis of Similarity (ANOSIM, Clark, 1993), or the anosim function, to examine potential differences among communities. In addition, we tested for differences between samples based on a given factor using Permutational multivariate analysis of variance (PERMANOVA, Anderson, 2001), or the adonis function, implemented with 999 permutations and the Jaccard distance for pairwise distance between groups to minimize the weight given to absence values. When testing of factors was significant, pairwise comparisons under Bonferroni corrections were done with PAST3 (Hammer et al., 2001). Furthermore, Canonical correspondence analysis (Goldberg et al., 2016) ordination plots were generated using Jaccard distance matrices in Phyloseq to visualize relationships between treatments and identify which environmental factors are most important (Ter Braak and Verdonschot, 1995).
Results
DNA Barcode Database
Morphological inventories identified several taxonomic groups collected from the Montségur edifice; from these, 22 were available in sufficient numbers for DNA barcoding for the present project, which encompassed a total of 144 individuals (Table 2). The barcoding effort produced a total of 580 sequences; 318 (55%) of these sequences were amplified from the 18S regions V1V2 and V9, as well as the short COI fragment (313-bp), and were added to their respective taxonomic reference databases, against which the eDNA metabarcoding datasets were assigned. The remaining 262 sequences (45%) were amplified from 28S regions D2D3 and D9D10, 18S region V7V8 and the long COI fragment (500 – 660-bp, Supplementary Material S1) and were not added to any reference databases for the present study, as we did not survey eDNA samples using these amplicons. Every sequence, however, has been made publicly available at NCBI GenBank under accession numbers MK591147–MK591726. Table 2 provides general information for each successfully barcoded taxon using one or more of the gene fragments described in this study, and whether or not the taxon was recovered in the respective eDNA dataset.
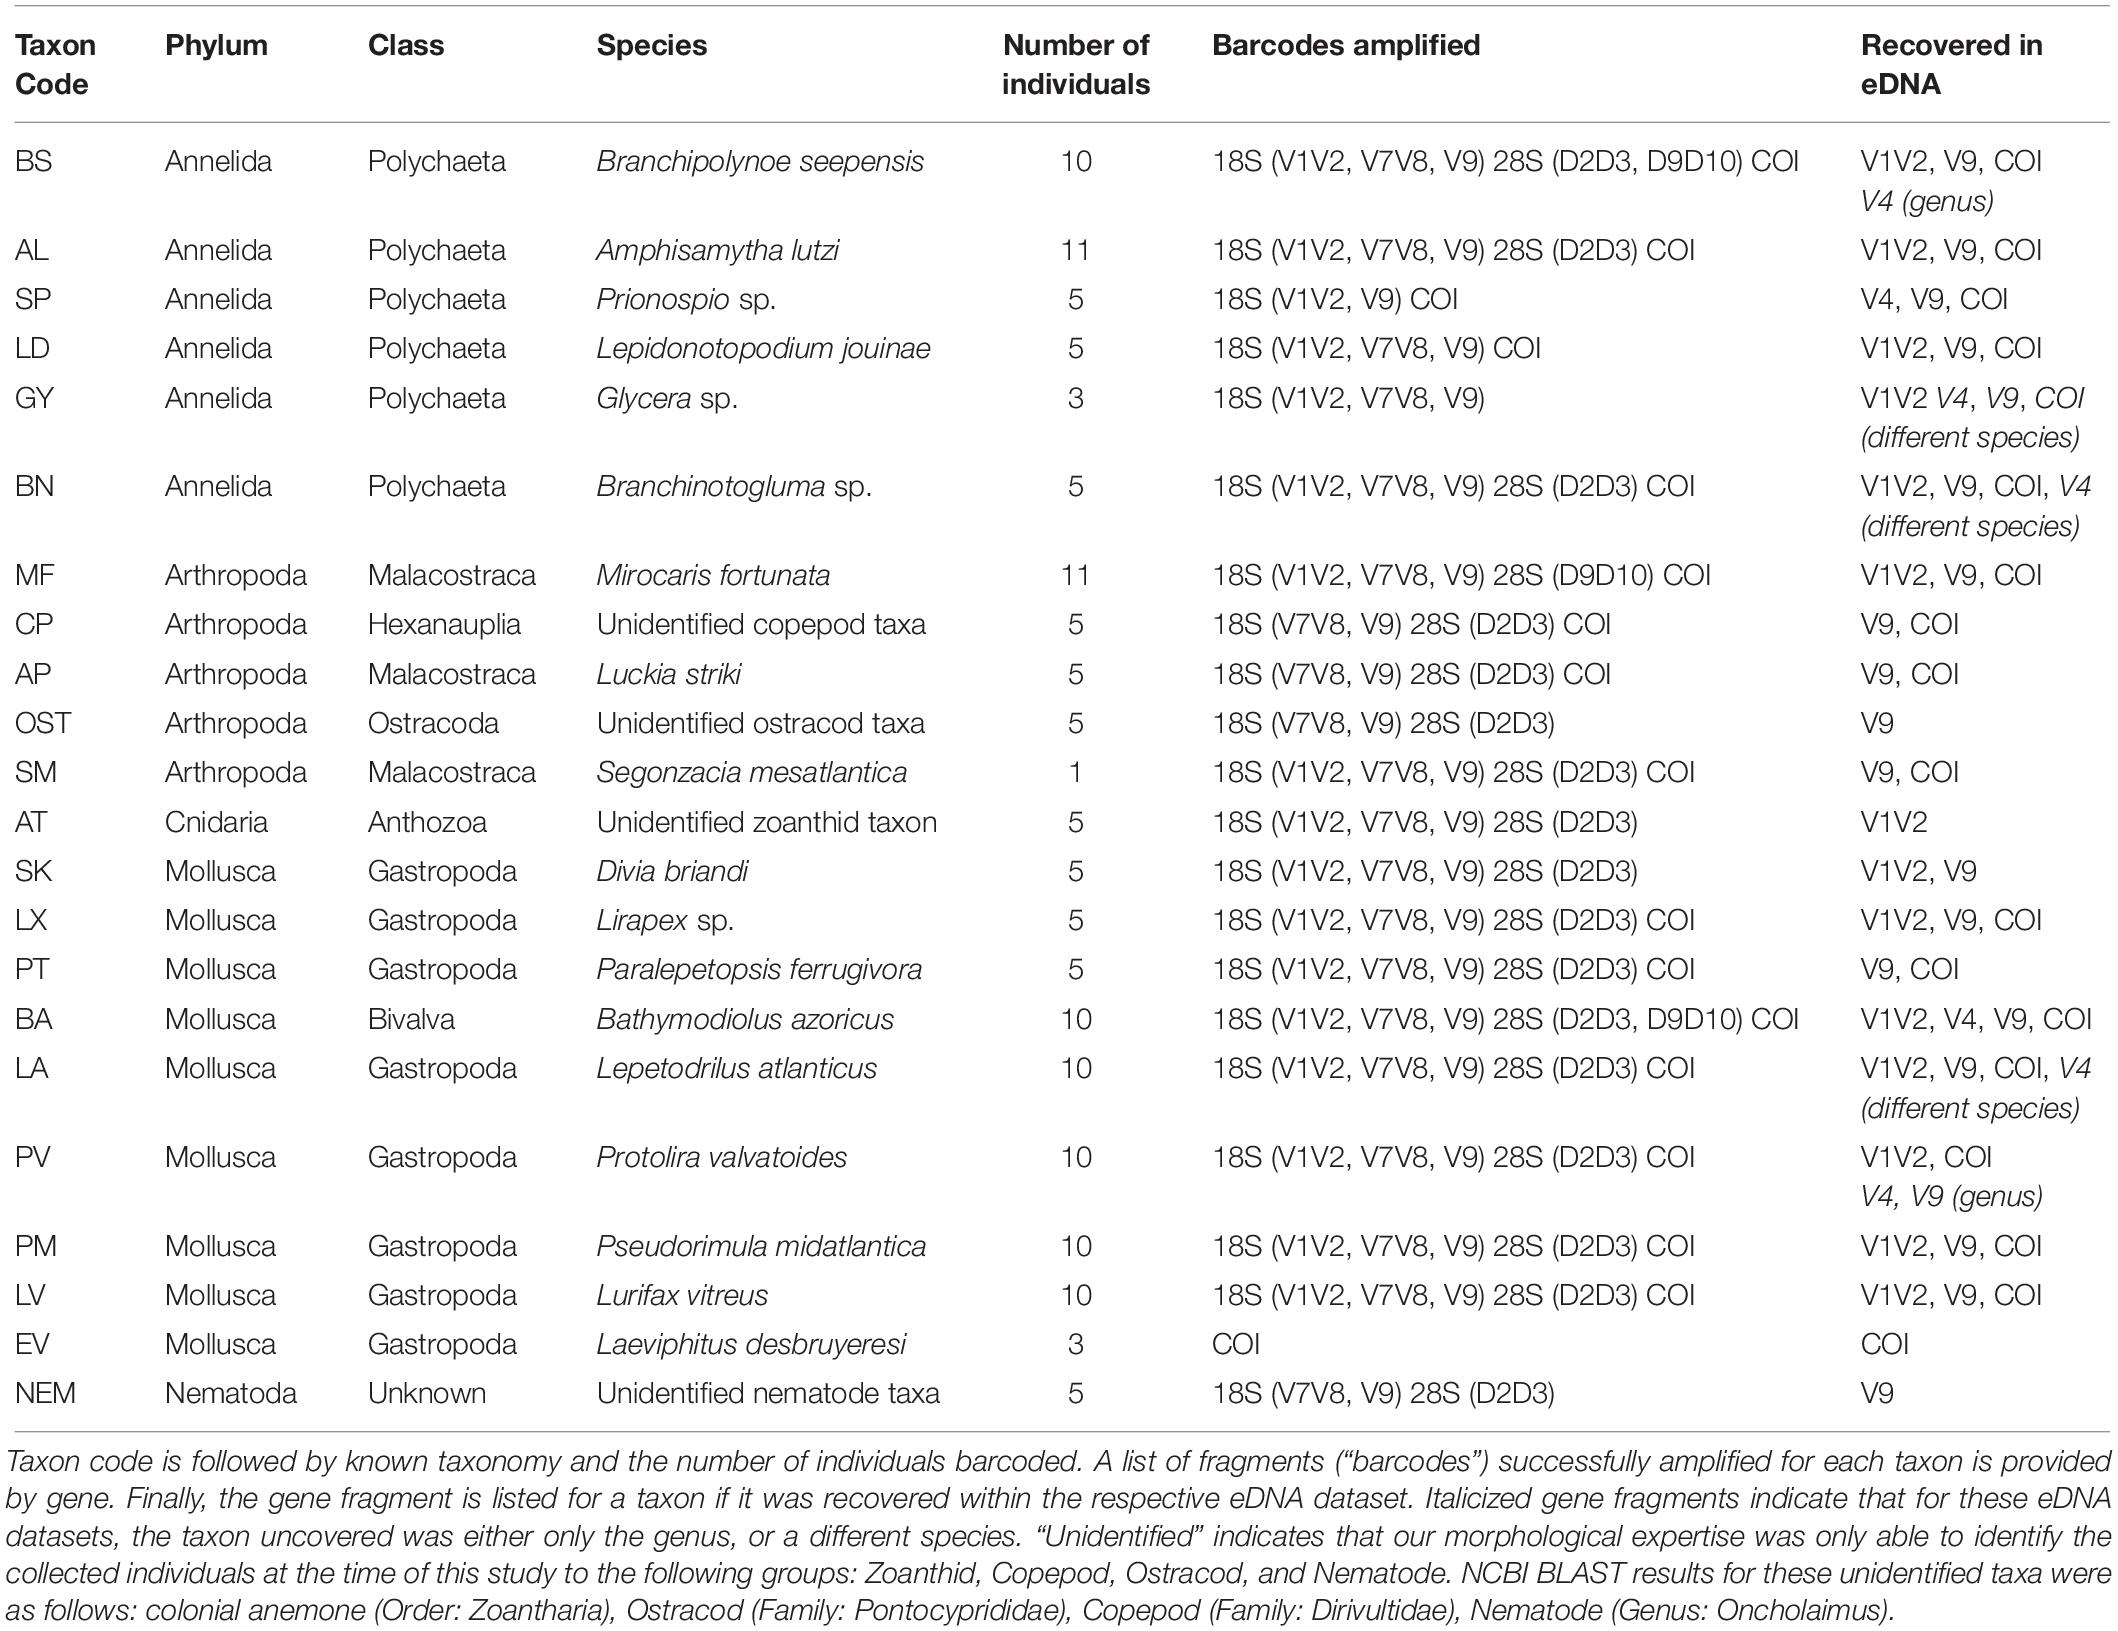
Table 2. DNA barcode inventory for 22 taxa collected from the Montségur edifice.
eDNA Metabarcoding Datasets
A total of 18 eDNA samples and seven negative extraction controls were sent for metabarcoding using four gene fragments: COI; 18S-V1V2, 18S-V4 and 18S-V9, which will be referred to as V1V2, V4 and V9. None of the negative controls produced amplicons for library preparation, and thus were considered clear of contamination. After bioinformatic filtering, the metabarcoding effort yielded a total of 701,880 sequences for V1V2, 618,384 sequences for V4, 920,241 sequences for V9 and 1,098,025 sequences for the COI datasets. Additional information on sequencing depths for each dataset, mean number of reads per sample and OTU, as well as mean number of OTUs per sample can be found in Supplementary Figures S1, S2 and Supplementary Table S1.
Non-metazoan taxa included archaea, bacteria, fungi, plants (photosynthetic eukaryotes), protists or organisms unknown/unassigned at the phylum level; these non-metazoans comprised between 65.86% (COI) to 93.43% (V9) of all OTUs. Figure 2 illustrates the top 10 most common taxonomic groups, including non-metazoans, in each dataset, described by percentage of OTUs versus percentage of sequences for each phylum. While taxonomic patterns of OTU percentages were variable among markers, Annelida and Mollusca were clearly represented in each eDNA datasets in terms of high percentage of sequences assigned to few OTUs. Regarding the total number of sequences, Annelida represented 29.8% (V9), 33.1% (V4), 32.7% (COI), and 40.7% (V1V2), while Mollusca represented 17.3% (V4), 35% (V9), 37.1% (V1V2) and 37.6% (COI). For V1V2 and V4, the majority of OTUs originated from Protista, although the percentage of sequences comprising these OTUs was much smaller, suggesting the presence of many distinct species (Figure 2). Within V4, however, many OTUs were unknown/unidentified, though they were only a small proportion of total sequences. Further, the V9 fragment dataset uncovered a high percentage of OTUs and sequences assigned to Bacteria and other non-metazoans (Figure 2). COI identified the most OTUs assigned to Arthropoda, compared to few OTUs originating from Annelida and Mollusca, comprising nearly two-thirds of all sequences in this dataset. As with the V4 dataset, unknown/undefined assignments dominated a large percentage of OTUs within COI.
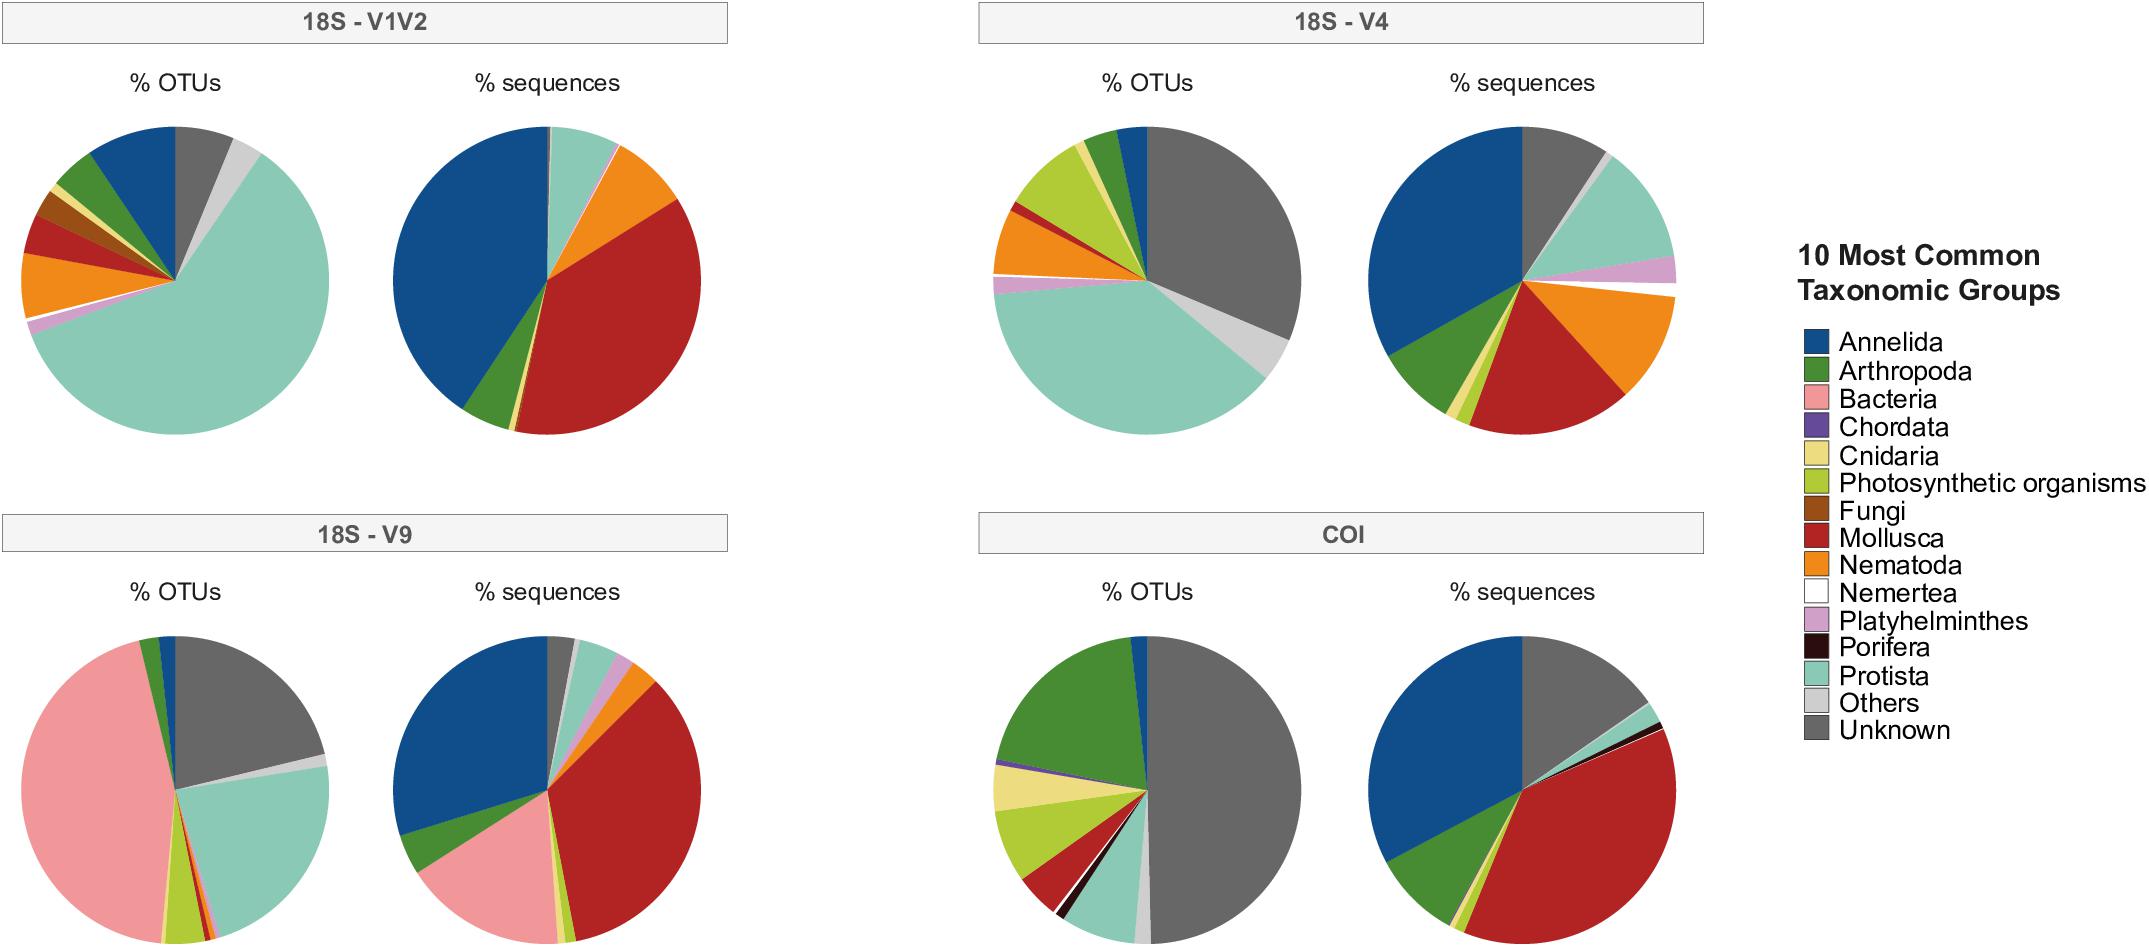
Figure 2. The top 10 most common taxonomic groups, including non-metazoans, from the global eDNA sequencing effort for the four eDNA datasets. Percentage of OTUs refers to the proportion of OTUs (“species”) originating from each phylum and percentage of sequences (“abundance”) refers to the proportion of reads originating from each phylum.
The 18S fragments uncovered Nematoda and Platyhelminthes within the top 10 most common taxonomic groups, while COI identified Chordata, Cnidaria and Porifera. After non-metazoan taxa were filtered from each dataset, metazoan OTUs numbered 414 for V1V2, 304 for V4, 291 for V9 and 560 for COI. Unless otherwise stated, the proceeding results are primarily concerned with these metazoan datasets.
Common Metazoans Uncovered in eDNA From Montségur
Every metazoan taxon that underwent DNA barcoding was recovered in the global environmental DNA dataset of four markers (Table 2). This included taxa not yet identified to the species level, such as zoanthids (colonial anemones), copepods, ostracods and nematodes (Table 2). In addition, nearly all taxa identified to the genus or species level were found within the eDNA dataset for which they had been successfully barcoded. Exceptions were Paralepetopsis ferrugivora and Prionospio sp., which despite being barcoded for V1V2, were not identified within that eDNA dataset, as well as the unidentified zoanthid taxon, found only in V1V2, and not in V9 eDNA (Table 2). Bathymodiolus azoricus was the only barcoded species present in every eDNA dataset. Furthermore, Protolira valvatoides gastropods and Glycera sp. polychaetes either matched to the genus level (Protolira sp.) or to a particular species (Glycera capitata or tesselata), despite being DNA barcoded.
The top 10 most common species, in terms of sequence abundance, for the V1V2 and COI datasets are shown in Figure 3. Each graph identifies expected species (those collected from Montségur and DNA barcoded, see Table 2) and additional species. “Additional” species are those not barcoded by us, yet present within the Silva or NCBI public databases, some of which are not known from hydrothermal vents (Figure 3, non-bold). The top 10 most common species uncovered within the V1V2 dataset are all found at vents; however, the “non-vent species” for V4, V9 and COI datasets represented only 4.5, 7.3, and <2%, of these sequences, respectively (Figure 3 and Supplementary Figure S3). The V1V2 dataset found that expected species Amphisamytha lutzi, Bathymodiolus azoricus, and Branchinotogluma sp. comprise the majority of metazoan sequences. Oncholaimidae sp., a family of nematodes whose members are found in aquatic sediments world-wide including at LS, is the next most abundant group in this dataset (Figure 3), supporting the presence of local vent nematode species matching to this family. The COI dataset identified expected species A. lutzi, Branchinotogluma sp., Protolira valvatoides, Mirocaris fortunata, and Lepetodrilus atlanticus dominating metazoan abundance, while sequences assigned to Hesiolyra cf. bergi, an hesionid polychaete known from hydrothermal vents in the eastern Pacific (Blake, 1985), represents another common species in the dataset. While expected species such as B. azoricus, Branchinotogluma sp., Branchipolynoe seepensis and P. valvatoides are some of the most abundant within the V4 dataset, there are few species not expected from Montségur (including non-vent taxa, Supplementary Figure S3). Finally, for the V9 dataset, the majority of metazoan sequences were assigned to expected species B. azoricus, A. lutzi and B. seepensis (Supplementary Figure S3).
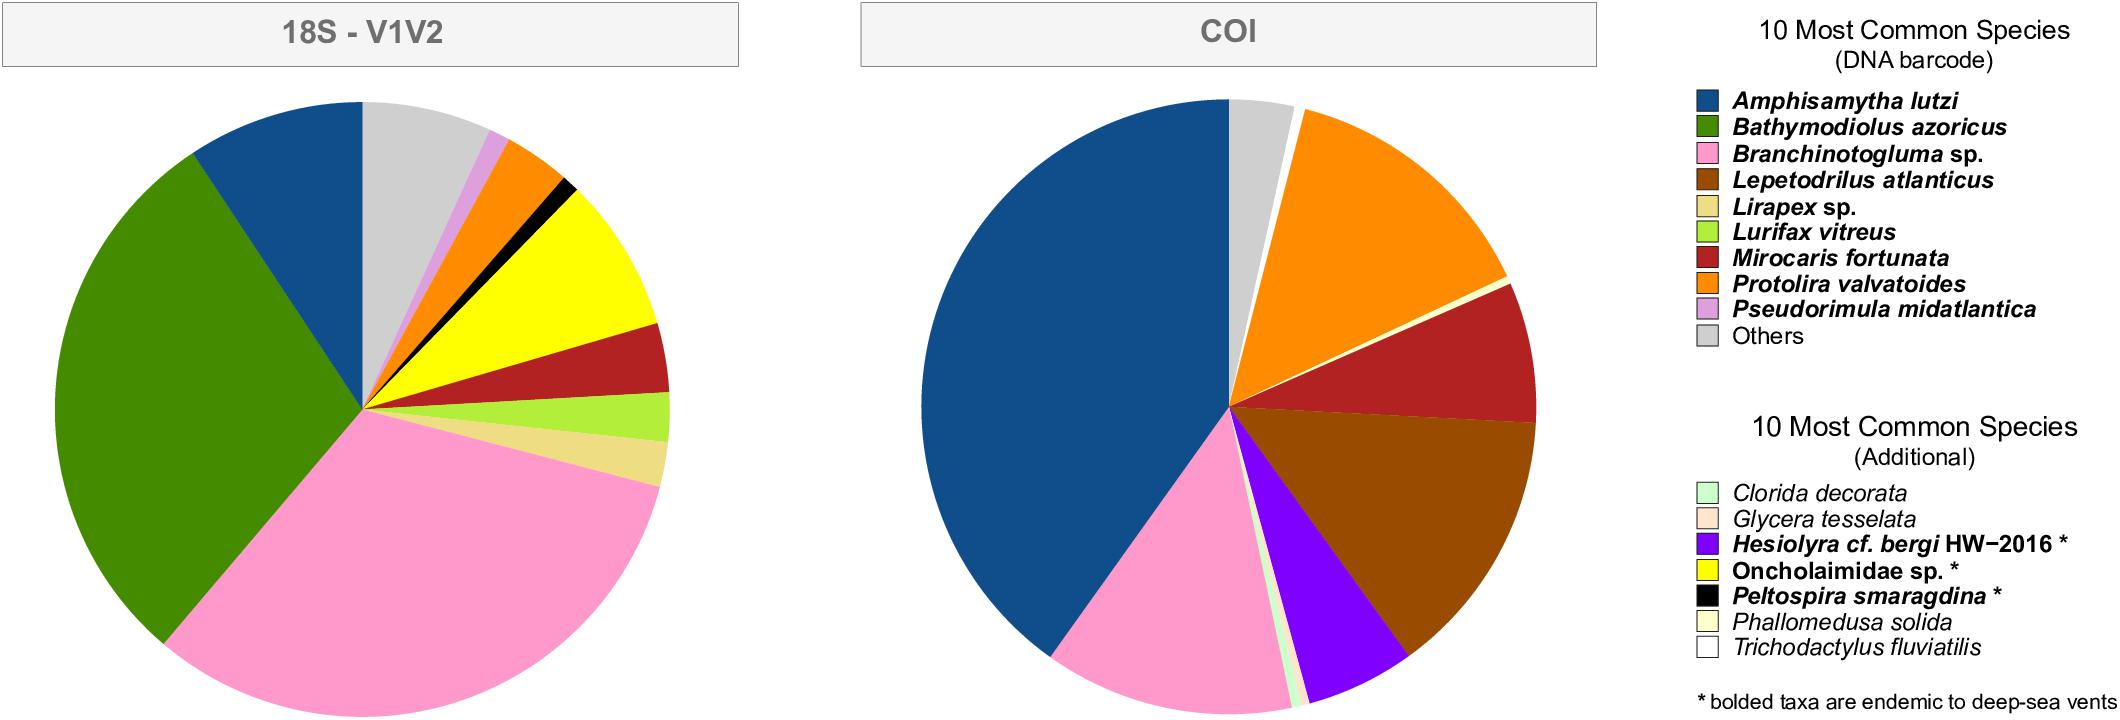
Figure 3. The top 10 most common species, in terms of sequence abundance, for the 18S-V1V2 and COI eDNA datasets. “DNA barcode” are those species that were physically collected from Montségur and DNA barcoded in the current project (Table 1). “Additional” are species that were not DNA barcoded by the present project yet were within the NCBI GenBank database prior to the taxonomic assignment of eDNA. Species in bold are those found at hydrothermal vents, while non-bolded species are not found at hydrothermal vents. The presence of these non-vent assignments suggests that these sequences were assigned to the closest taxon within the database, and not that these non-vent species are present in the deep-sea.
Baseline Data: Effect of Habitat (Venting Influence) and Location
Baseline accumulation curves for V1V2 highlight differences between communities based on habitat/venting influence (Figure 4). When considering all taxa, peripheric and inactive sites exhibit much higher OTU counts compared to active sites at Montségur, with no difference seen between structure and base communities (Figure 4, top left). A similar pattern is seen with COI (Figure 5, top left), as well as within the other markers (Supplementary Figures S4, S5). Curves for all “baseline” taxa begin to reach plateau with increasing number of sequences, identifying that the sequencing depth was effective for characterizing most of the diversity present within each sample originating from the differing habitats. Upon considering baseline metazoan taxa only, a contrasting picture emerges: periphery and inactive sites are more similar to active sites in terms of OTUs counts for V1V2 (Figure 4, bottom left), V4 and V9 (Supplementary Figures S4, S5), although the initial slope of the curves remains steeper for inactive sites. The exception is COI, in which higher metazoan diversity is maintained for inactive, compared to peripheric and active sites (Figure 5, bottom left). Noting the differing graphic scales for baseline data between all taxa and metazoans-only, comparisons between the two clarify that much of the diversity recovered from the inactive habitat is non-metazoan taxa, though V1V2 and COI also identify similar or even higher levels of metazoan diversity at inactive sites, comparative to the other habitats (Figures 4, 5). These patterns are supported by estimated OTU richness (Table 3), which varied depending on the habitat and location. Notably, the COI dataset identifies the inactive site as having the highest number of OTUs at 321 and an estimated OTU richness of 484.8 + 30.5, compared to the other habitats (Table 3). The 18S datasets, however, show contrasting values, with active sites, particularly the base of Montségur, as having higher estimated OTU richness than the structure itself, the periphery or inactive sites.
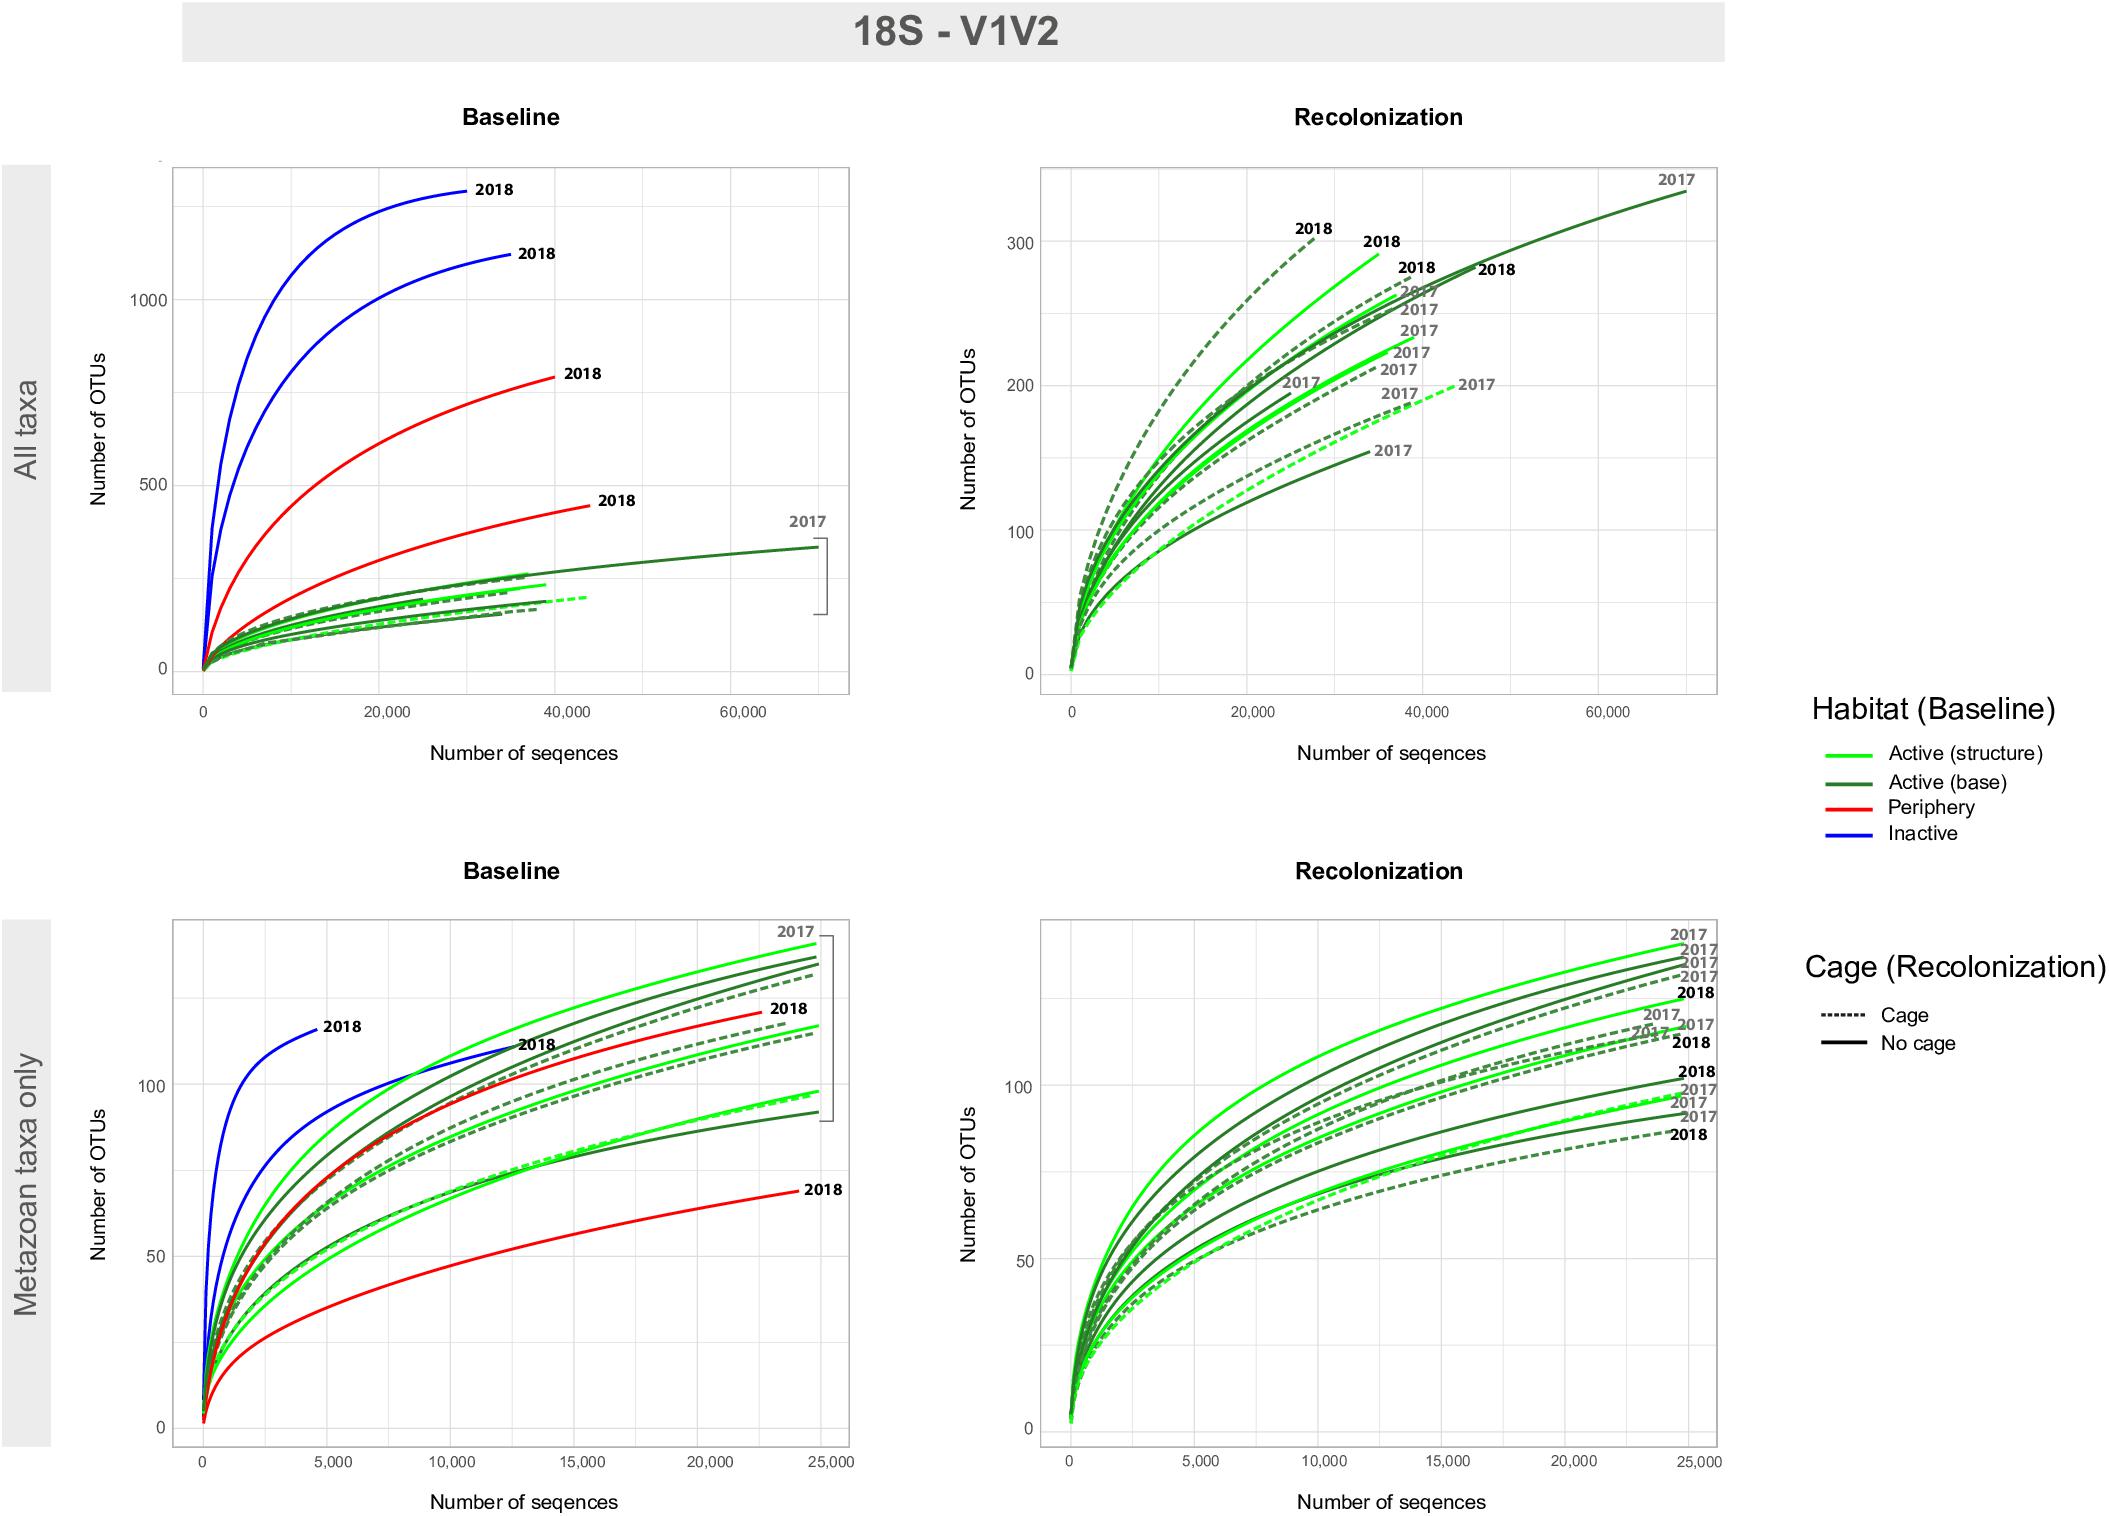
Figure 4. Accumulation curves for the 18S-V1V2 eDNA dataset, for both baseline (left) and recolonization (right) data across all taxa (non-metazoans and metazoans, top) and metazoan taxa only (bottom). Baseline data focuses on sample communities from differing habitats/vent activity, as well as those from differing locations on the active edifice (base and structure). Recolonization data focuses on sample communities from differing years, as well as those that were caged against those non-caged at active sites. Note the difference in scales for number of OTUs and number of sequences between “All taxa” and “Metazoan taxa only.” Recolonization data are only available for the active sites.
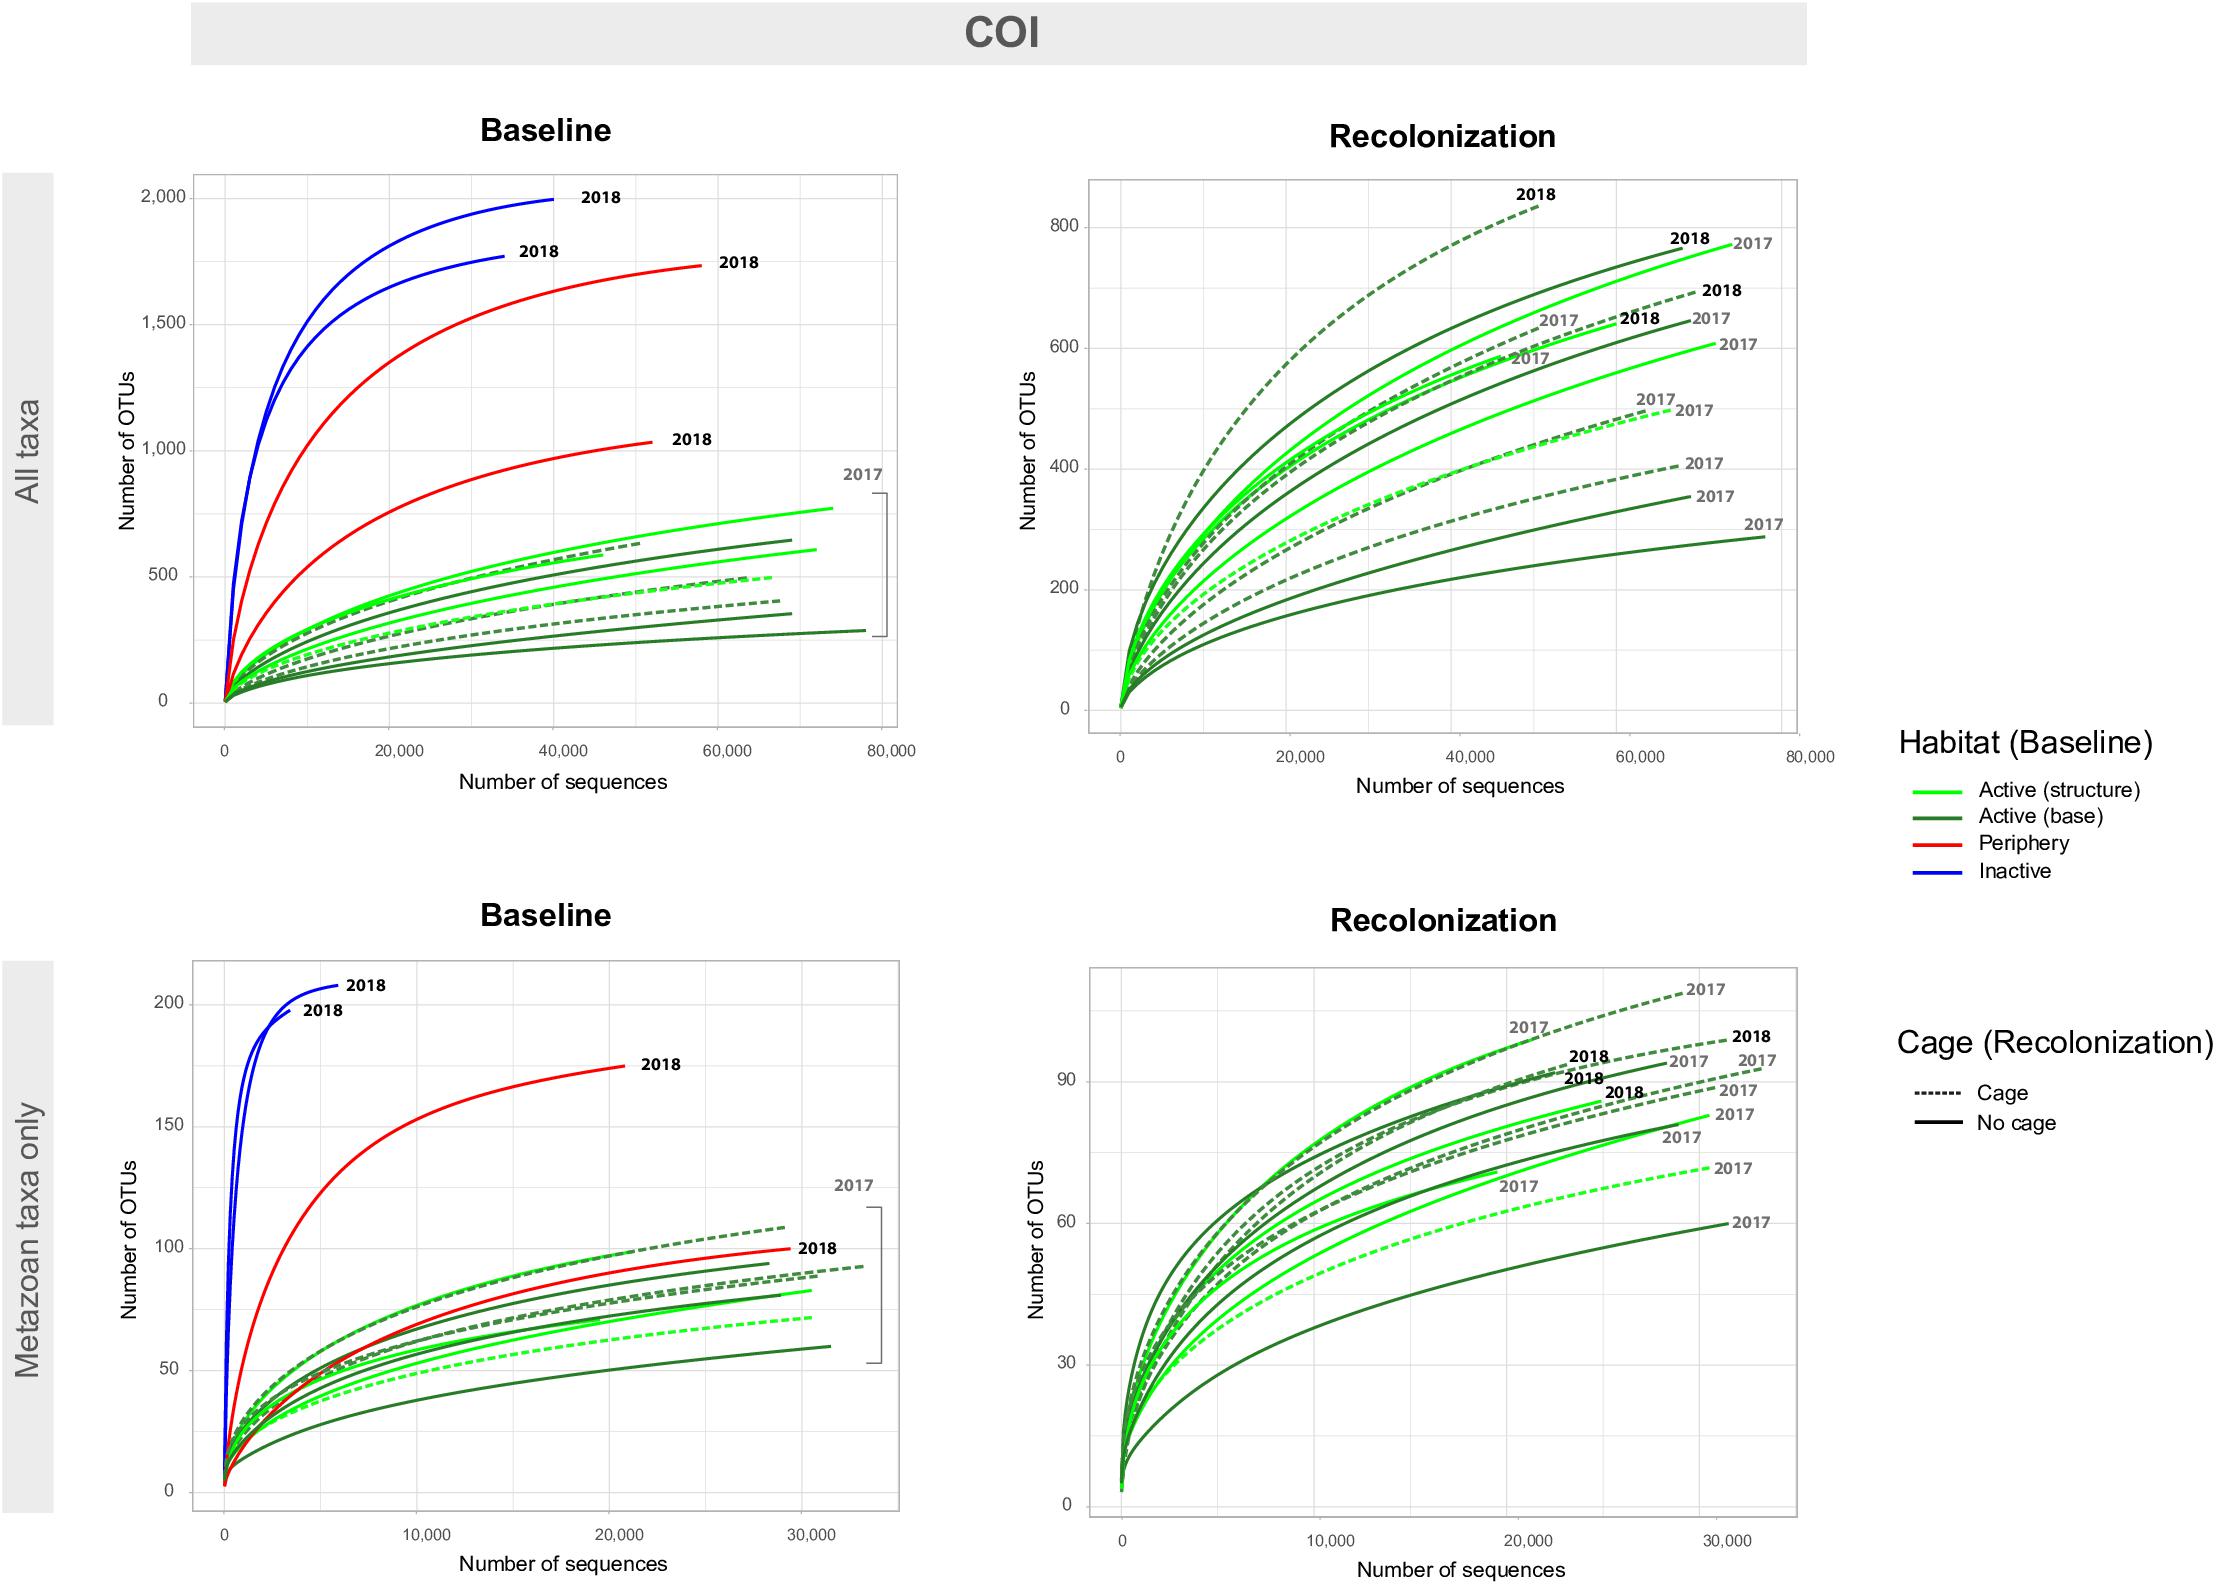
Figure 5. Accumulation curves for the COI eDNA dataset, for both baseline (left) and recolonization (right) data across all taxa (non-metazoans and metazoans, top) and metazoan taxa only (bottom). Baseline data focuses on sample communities from differing habitats/vent activity, as well as those from differing locations on the active edifice (base and structure). Recolonization data focuses on sample communities from differing years, as well as those that were caged against those non-caged at active sites. Note the difference in scales for number of OTUs and number of sequences between “All taxa” and “Metazoan taxa only.” Recolonization data are only available for the active sites.
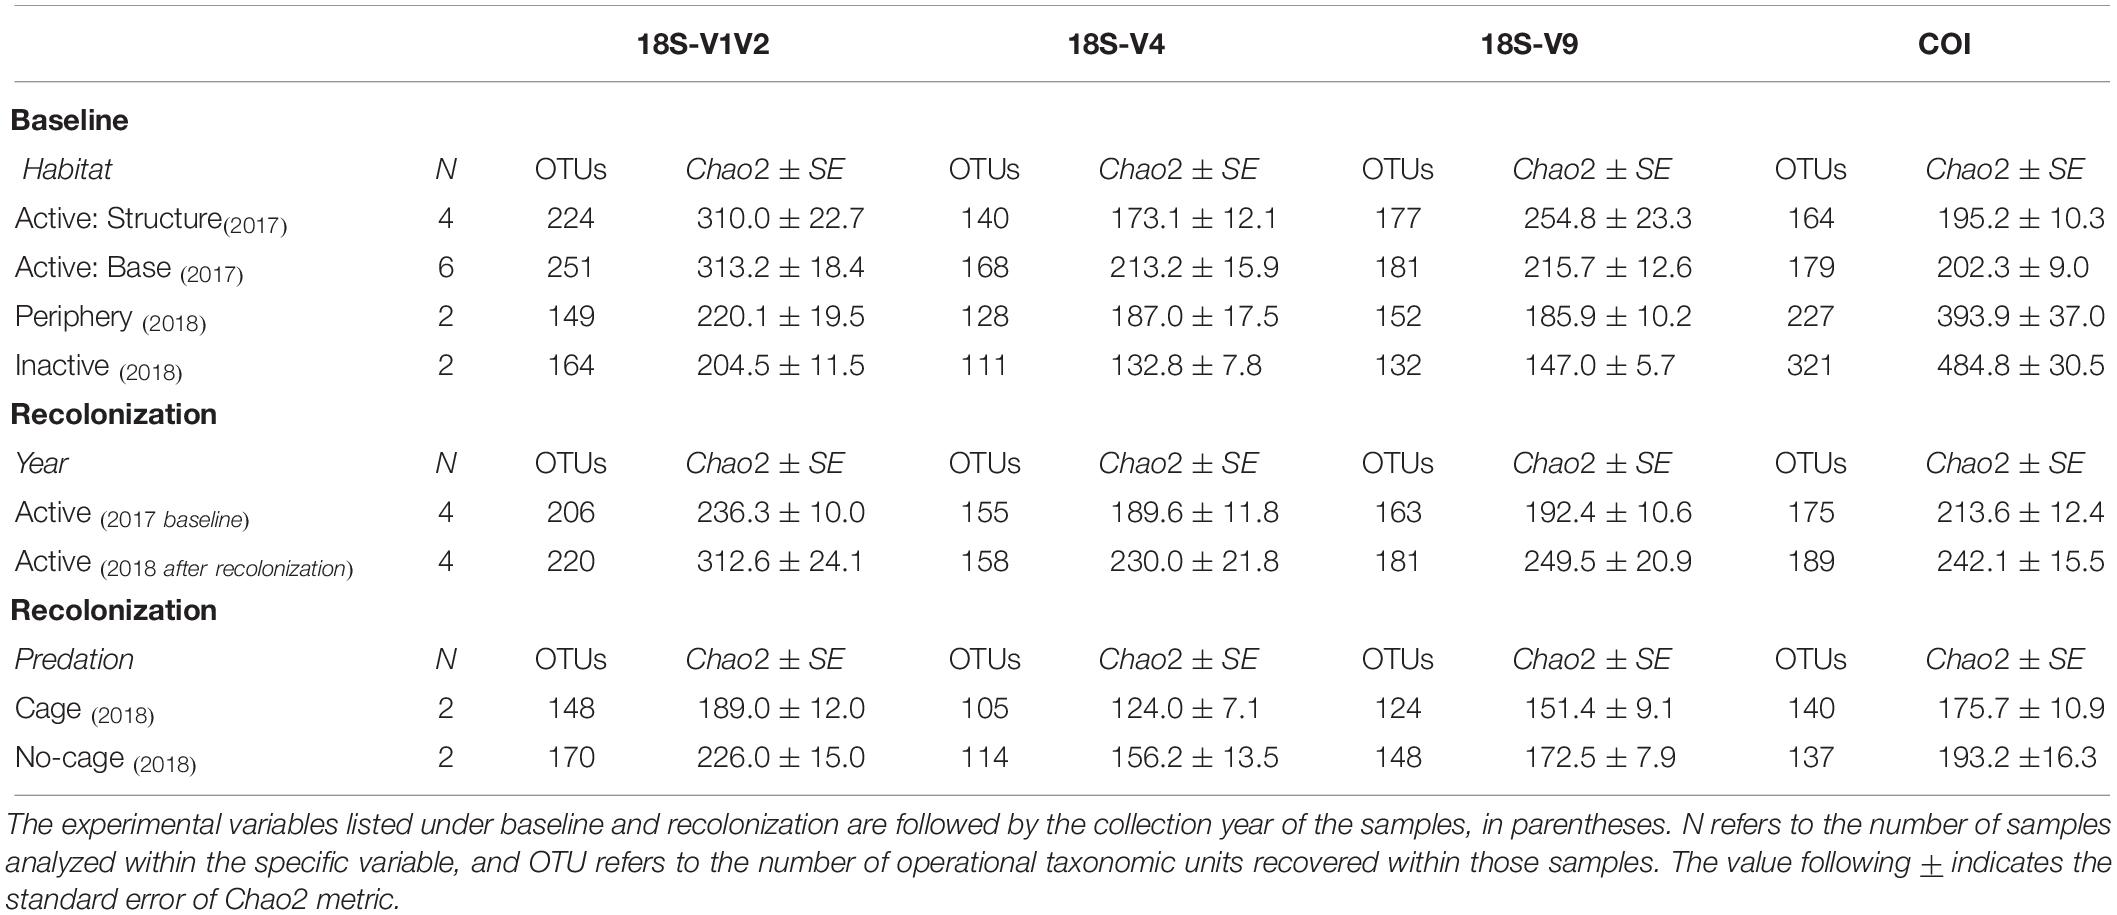
Table 3. Metazoan species richness values of baseline and recolonization data for the four eDNA datasets.
ANOSIM testing revealed that the habitats host significantly different metazoan communities, a pattern seen across all four eDNA datasets (Table 4). Habitat differentiation based on community is spatially illustrated by the CCA ordination for V1V2 and COI in Figure 6, as well for V4 and V9 in Supplementary Figure S6. With 26.3–35.5% of taxonomic variation explained within the two axes, habitat is supported as the most important factor influencing taxonomic composition and distance away from or toward active sites determines composition (Figure 6). PERMANOVA testing was also significant for the habitat factor, supporting a lack of homogeneity of communities among the habitat sample groups (Table 4). Pairwise comparisons between the differing habitats identified the strongest distinction between active and inactive sites (p < 0.05). Following the location factor that compares Montségur structure and base active communities, statistical analyses reveal dissimilarities among these communities from V4 and V9 datasets, though PERMANOVA testing suggest weak effects of this factor, as does the unclear separation of communities shown in Supplementary Figure S6. The dissimilarities between structure and base communities, however, are most strongly supported within the V9 dataset (Table 4).
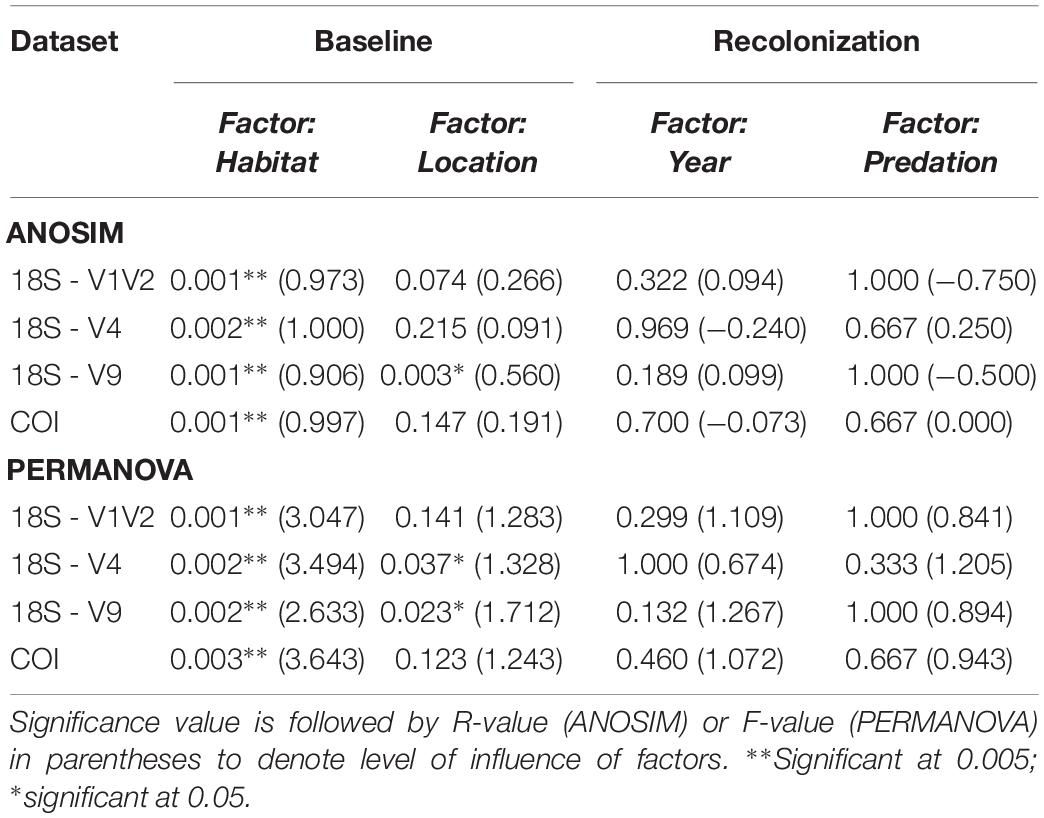
Table 4. ANOSIM and PERMANOVA statistical results for testing baseline and recolonization data.
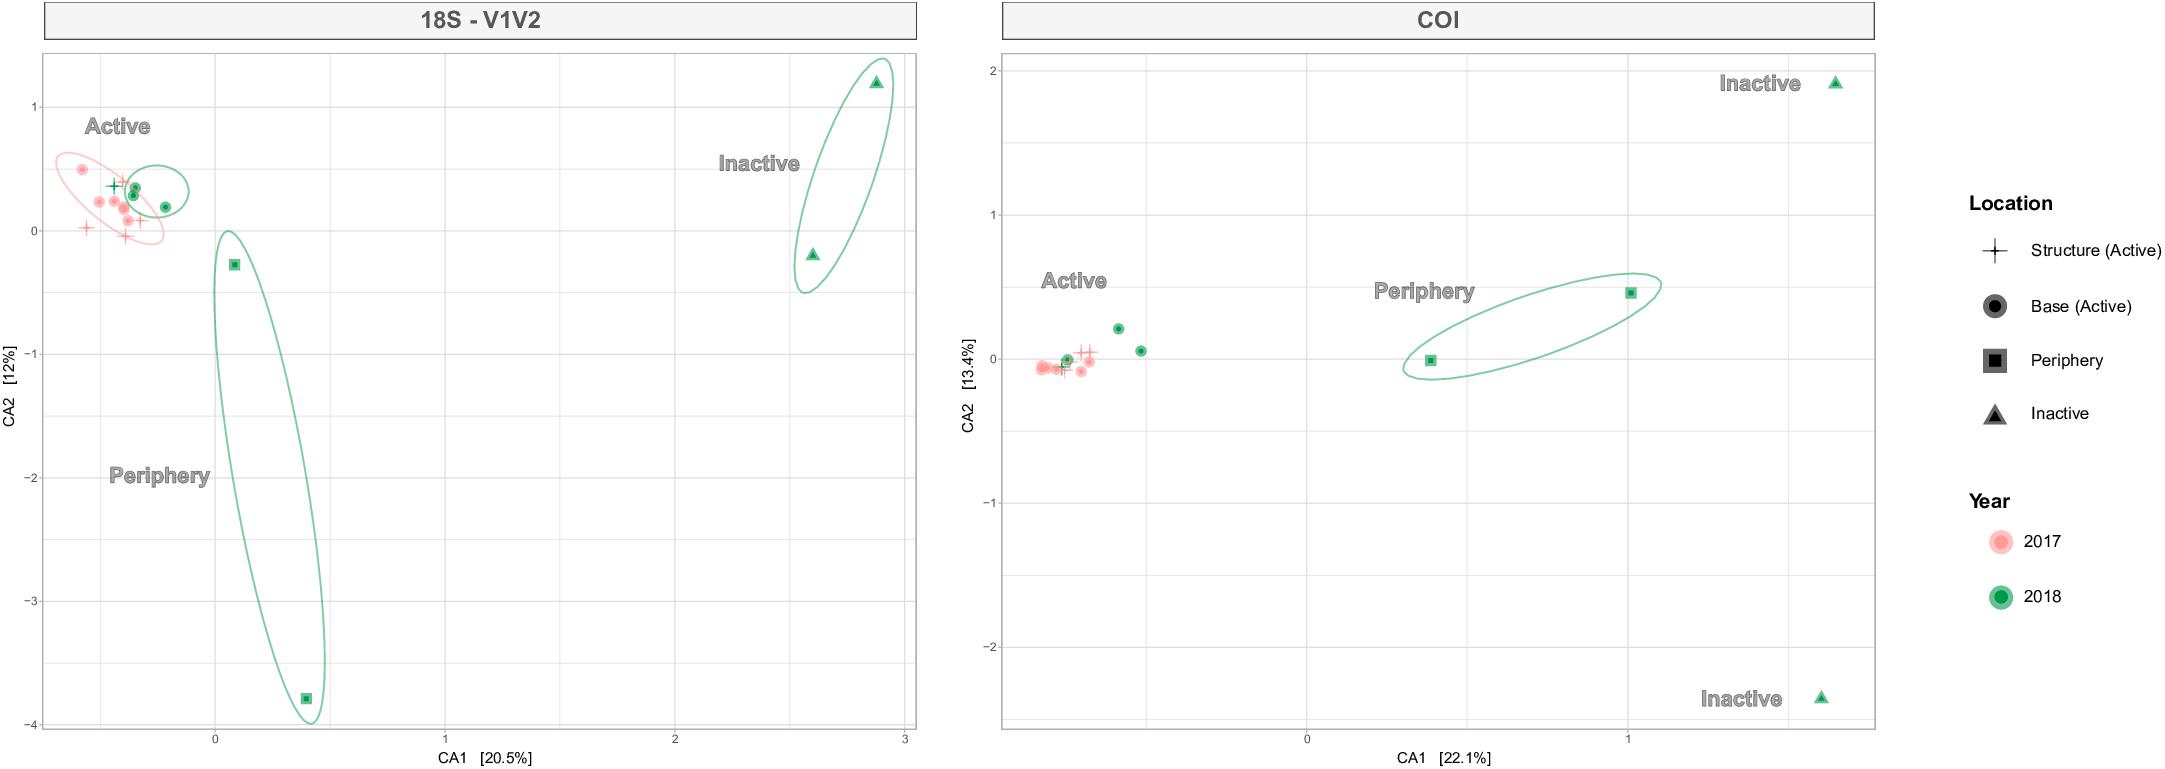
Figure 6. Canonical correspondence analysis (CCA) plots for 18S-V1V2 and COI, illustrating metazoan community distributions by active, periphery or inactive habitats. Shapes denote habitat type and location (active only) and the number of shapes corresponds to the number of eDNA samples retrieved from each habitat. Colors refer to year and ellipses identify the relationships within habitats. The environmental gradient moves from right to left with increasing level of venting influence.
Examining taxonomic composition identified specific differences in metazoan composition across habitats, samples and eDNA datasets. Higher numbers of OTUs assigned to Annelida were found at active locations, compared to inactive sites, which was true for all datasets (Figure 7 and Supplementary Figure S7). However, fewer OTUs originating from Arthropoda were observed at active sites, compared to the non-active sites. Higher numbers of OTUs assigned to Cnidaria, Echinodermata and Porifera were observed within the COI dataset, specifically within periphery and inactive samples, compared to 18S (Figure 7). Conversely, 18S markers identified higher numbers of OTUs from Nematoda, particularly V1V2 (Figure 7, left) and V4 (Supplementary Figure S7). Furthermore, the 18S datasets uncovered less well studied meiofaunal taxa, such as Xenacoelomorpha at peripheric and inactive sites within V1V2 and V9, as well as Gastrotricha and Kinorhyncha from V4 and V9 (Supplementary Figure S7).
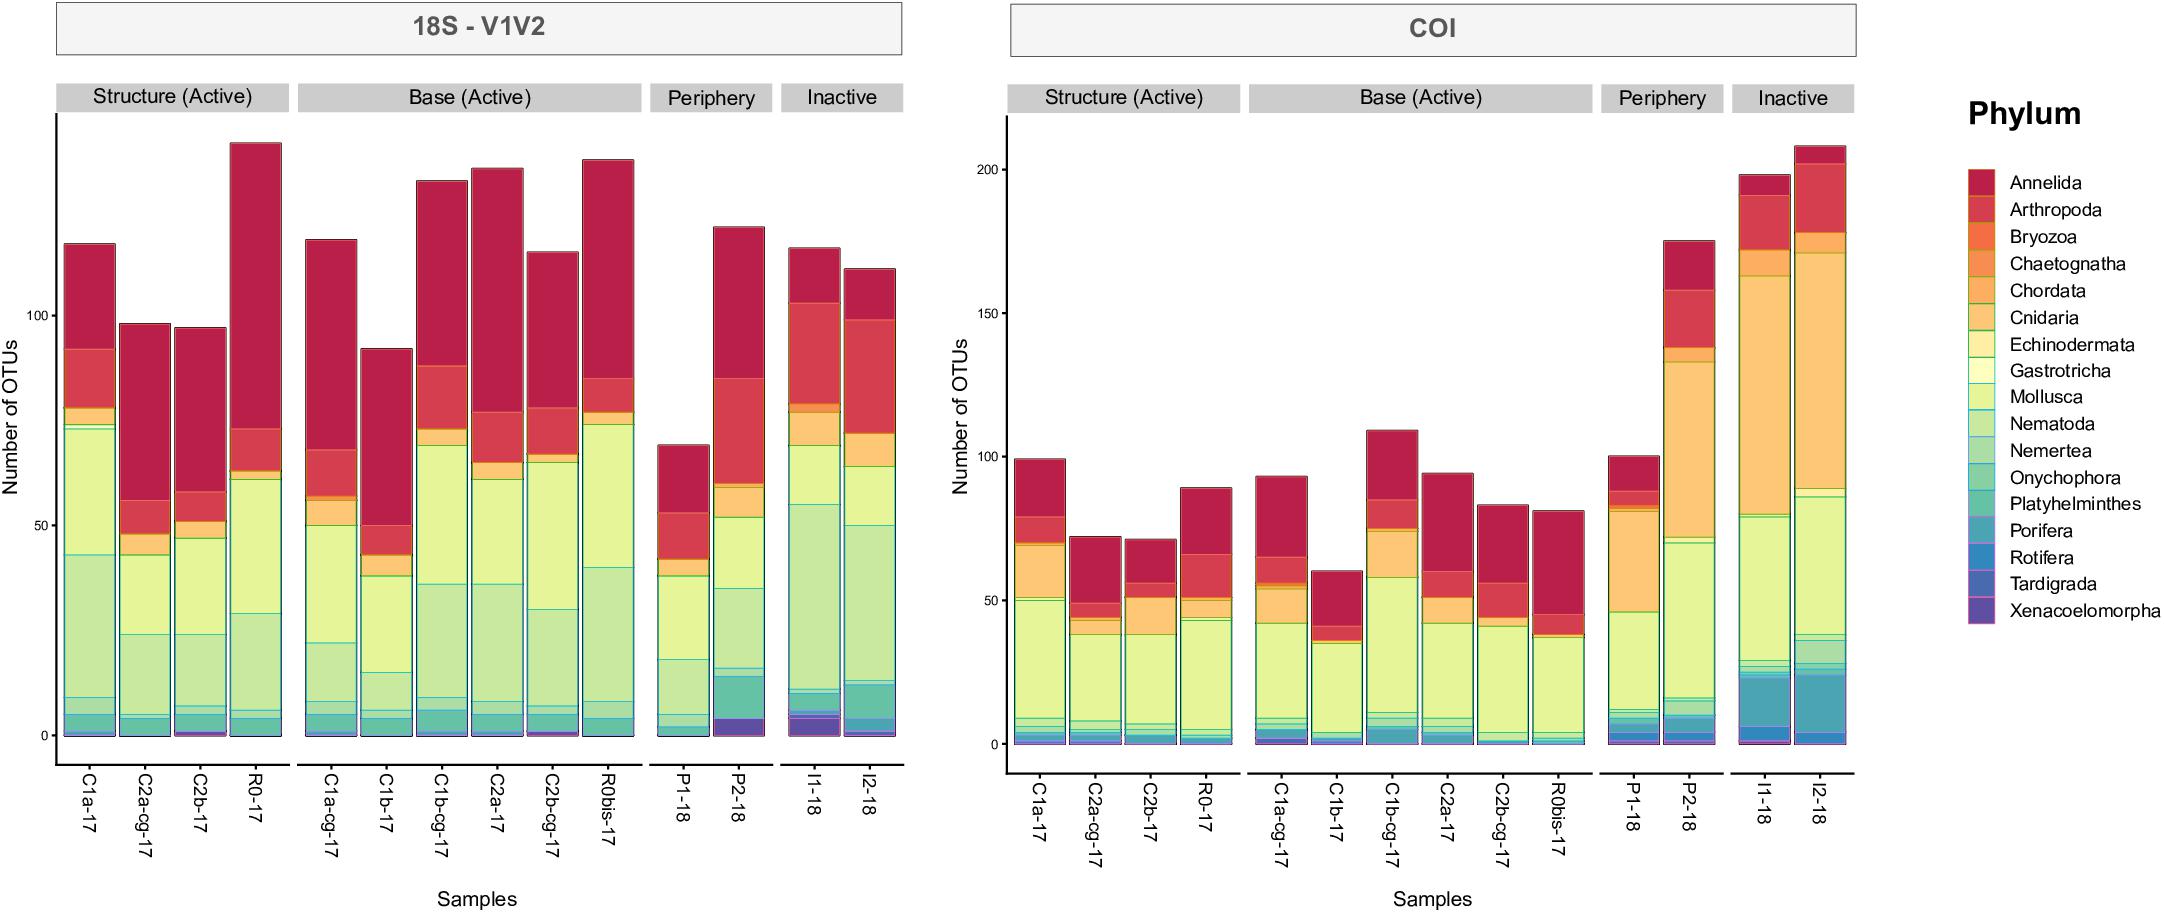
Figure 7. Taxonomic characterizations of 18S-V1V2 and COI eDNA datasets by phylum, based on number of OTUs (incidence) and identified from samples distributed around the active edifice, periphery and inactive sites.
Recolonization Processes: Effect of Time and Cages
Accumulation curves comparing 2017 “baseline” samples with 2018 caged and uncaged samples identified similar trajectories for these communities, across all datasets (Figures 4, 5 and Supplementary Figures S4, S5). Considering all taxa, the curves for each dataset begin to level into a plateau shape, but still indicating that additional diversity remains undescribed (Figures 4, 5, top right). When focusing on only metazoan taxa, we observed no specific pattern of differentiation between years or cage presence (Figures 4, 5, bottom right). Estimated OTU richness is consistently higher in 2018 active communities compared to 2017 active communities, while non-caged communities have higher richness compared to those that were caged, a finding seen across all eDNA datasets (Table 3).
The lack of community differentiation depending on time and predation factors seen in Figures 4, 5 was also supported by statistical testing (Table 4). In terms of taxonomic composition, no strikingly different patterns based on sample or treatment are observed, though the COI dataset uncovered higher numbers of OTUs originating from Cnidaria and Mollusca across sample years, while 18S genes were still better at uncovering animal groups known from the meiofaunal compartment (Supplementary Figure S8). Overall, the characterization of communities across the time and cage treatments, using several gene fragments originating from mitochondrial and nuclear genes, identified a similar community composition after one year of passive recolonization.
Discussion
The present study offers a broad taxonomic characterization of LS Bathymodiolus assemblages and their associated macro- and meiofaunal communities, present along an environmental gradient from an active sulfide edifice, to a more distant, inactive zone. We also provide original findings from an in-situ experiment and monitoring effort for tracking faunal recolonization at an active hydrothermal vent edifice located within the LS vent field (MAR). For this, we implemented the normally less intrusive environmental DNA (eDNA) metabarcoding method for comparing community temporal changes following the induced disturbance. Our protocol for processing hydrothermal vent material produced a comprehensive eDNA dataset composed of information from four genetic markers and encourages replication along a longer temporal scheme, as well as for future, unrelated survey efforts.
Seafloor Massive Sulfides (SMS) and Benthic Assemblages Along an Environmental Gradient
The International Seabed Authority reports that commercial interest in seafloor massive sulfides (SMS) is expected to occur in the near future, with calls for the establishment of environmental baseline data (Juniper, 2002; ISA, 2010). Using a new approach that allows for quick assessment of taxonomic biodiversity, our results contribute to fulfilling these recommendations by providing a consistent taxonomic richness comparison along a gradient of venting influence. Our eDNA analyses of substratum samples, retrieved from an inactive location where conspicuous fauna were not observed, revealed genetic signals from Cnidaria, Porifera, Mollusca and Nematoda. Inactive zones are known for low biomass assemblages of long-lived, slow growing suspension feeders and scavengers, including sponges, cnidarians (hydroids, corals and anemones) and echinoderms. These communities are referred to as “background fauna,” as they are non-vent specialists that can be found in differing habitats on the seafloor (Levin et al., 2009, 2016; Collins et al., 2012). A third and relatively unknown community consisting of endemic fauna inhabiting inactive zones is also suspected, possibly having nutritional dependencies linked to weathering inactive sulfide deposits (Van Dover, 2011; Boschen et al., 2013). Assemblages in inactive zones are far less studied than their active counterparts (Juniper, 2002), yet the possibility of inactive zones being the primary target of lucrative prospective initiatives makes these slow-growing communities especially vulnerable (Hoagland et al., 2010; Gollner et al., 2017). To date, there is an absence of information on recovery potential or resilience of inactive SMS communities and further investigations are warranted to fill these gaps in our knowledge.
Our analyses uncovered distinct differences between communities inhabiting active and inactive zones at LS, as well as high levels of estimated OTU richness associated with active periphery and inactive sites. These findings are in line with those on macrofaunal communities at some Pacific SMS locations, including those sites proposed for mining off of Papua New Guinea (Manus Basin) and New Zealand (Levin et al., 2009; Collins et al., 2012; Boschen et al., 2016), as well as meiofaunal (nematode) communities off of Fiji (Vanreusel et al., 1997). Results suggest that inactive sites at LS are highly diverse compared to their active counterparts, and that the metazoans and non-metazoans at these locations may have several origins. Those organisms not found at active sites possibly represent a combination of background organisms, pelagic organisms that settled from the surface to the seafloor and unclassified communities suspected to be endemic to inactive SMS habitats. Additionally, more accurate information on levels of diversity in these habitats may come from a more thorough analysis of protists. Deep-sea protists, specifically foraminifera, have been found to be important for structuring metazoan communities and are associated with high eukaryotic richness (Levin, 1991; Lecroq et al., 2009). Within our eDNA survey, protists represent a substantial number of OTUs across all four gene marker datasets (Figure 2) but lack investigation in active and inactive vent environments. Integrating protist taxonomic information with that of metazoans would likely reveal previously unknown information about biodiversity patterns in the vicinity of vents.
Recolonization at Montségur
Abiotic and biotic factors are responsible for driving colonization at vents. As this experiment was an artificial clearance of vent fauna, there were no significant changes in abiotic conditions such as fluid flow or chemistry that often accompany natural disturbance events. Thus, for the purposes of this project, the intensity of the induced disturbance could be classified as minor, as it consisted of small localized changes (at scale of centimeters) as opposed to a large-scale activities (at scale of hundreds of meters) projected to occur during mining activities (Van Dover, 2014). We therefore focus primarily on the role of biotic interactions on recolonization processes.
Contrary to what was expected, the exclusion of predators led to a lower taxonomic richness in our samples than for the uncaged experiments; though using the eDNA approach, we saw no significant difference between the two treatments after 13 months (Table 4). Several temporal studies have shown that in addition to environmental conditions, facilitation, competition and predation would trigger successional processes at vents (Sarrazin et al., 1997; Shank et al., 1998; Micheli et al., 2002; Mullineaux et al., 2003). Here, the lower values can be due to the influence of the cage that could have blocked the settlement of certain species. Micheli et al. (2002), through the deployment of caged and uncaged recruitment substrata, found that the exclusion of predators enhanced taxonomic richness. Their experiment, however, lasted less than a year (i.e., 5 and 8 months) and the authors used a smaller mesh size for the cages (6 mm). It is thus possible that our larger mesh size (10 mm) did not exclude the full range of possible predators on new recruits. As an example, gastropods are known to graze on new recruits (Mullineaux et al., 2003) and are often smaller than a centimeter. We also suspect that the cages used were not as effective as we thought, as a fish was found in one of them upon returning to the experiment. The addition of a skirt in the 2018 experiment should help better seal the cage to the substratum.
The 2018 recolonization samples proved to have slightly higher species richness than prior to the disturbance, possibly recruiting from adjacent populations, but these differences were not statistically significant. Indeed, recolonization is possible at active sites as a result of migration of mobile adults from nearby sites, though primarily from the dispersing local larval pool (Mullineaux, 2014). These metapopulations may also be at risk of destruction in case of large-scale mining, limiting recolonization capabilities, especially if the other populations are too far away to replenish impacted sites (Juniper, 2002; Mullineaux et al., 2018). It is possible that the newly recruited community is more diverse upon settlement and that taxa are lost over time in response to competition for space and/or food, and predation (e.g., grazing) (Micheli et al., 2002; Mullineaux et al., 2003; Sancho et al., 2005). Our present eDNA results, however, may not provide the most accurate results in terms of tracking recolonization, as abundance data from physical sampling show a severe decrease in abundance from 2017 to 2018 (Marticorena et al., unpublished). This suggests that eDNA metabarcoding of hard substrata alone is not suitable for monitoring temporal changes in faunal communities after a disturbance at smaller spatial scales.
After the clearance effort, few animals remained within some quadrats, especially in small factures, given the difficulties of removing every single animal in such rough topographies with submersible sampling tools (Figure 1). The presence of these individuals may have had an effect on the statistical lack of difference in terms of recolonization. Indeed, at the scale of our study and with the current technology (ROV sampling tools), it is nearly impossible to effectively clean all DNA from a small surface and therefore, remaining animals and persisting extracellular DNA may create false positive detections at sample sites with surveys using presence/absence criteria, such as eDNA (Chambert et al., 2015). More precise diversity assessments of these habitats would require coupling eDNA data with (1) traditional surveys where animals were physically collected, morphologically identified and counted, which is currently ongoing (Marticorena et al., unpublished) and (2) models that estimate the probability of detecting OTUs present (site occupancy detection models [SODM], Guillera-Arroita et al., 2017) which can account for both false positive and negative detection errors (MacKenzie et al., 2002; Chambert et al., 2015), especially in eDNA studies (Ficetola et al., 2015; Lahoz-Monfort et al., 2016; Guillera-Arroita et al., 2017). At present, we focused on extracting eDNA from substratum, which would be the primary type of media to be removed by mining activities. However, the simultaneous collection and comparison of substrate and water samples as a “double-eDNA” survey would likely improve detection probabilities of taxa. Further, with the exception of the peripheral site, our sample substrata weights were similar across habitats (Table 1). Nevertheless, differing sample weights may influence OTUs detection (Wei et al., 2018) and therefore, we suggest improved standardization for future studies. Given these findings, this molecular approach appears to be better suited over longer term investigations and at the larger scales of industrial mining, which would potentially affect hundreds of square meters of seafloor.
At Montségur, no significant difference was observed between the composition and diversity of communities of each active location (i.e., base and edifice). This supports the use of these data as “baseline” information in terms of diversity and community composition, as the presence of historical baseline data is important for assessing the magnitude of future recovery attempts (Lotze et al., 2011). Finally, the baseline data obtained for the periphery and inactive sites in 2018 encourage the analysis of additional samples along longer temporal scales to assess their recovery potential compared to active areas.
Benefits and Limitations of eDNA Metabarcoding at Hydrothermal Vents
The success of environmental DNA over the last several years is in part due to its ubiquity in the environment: animals continuously expel DNA into their surroundings and this genetic material is freely available to be collected and analyzed (Thomsen and Willerslev, 2015). There are many benefits for extending this approach to deep-sea ecosystems. Indeed, this environment is logistically challenging to sample, requiring the use of submersibles – most notably Human Occupied Vehicles (HOVs) and Remotely Operated Vehicles (ROVs). Historically, biological studies at depth have been performed by video streams and physical sampling of animals which require the observation of whole animals for identification (Cuvelier et al., 2009, 2012). In addition, sampling protocols related to the use of vehicles to collect animals, combined with the fastidiousness of animal sorting and identification, still result in the oversight of organisms that are small, rare or transient (Gauthier et al., 2010). Conversely, eDNA does not require whole animals and provides a mix of genetic information from even the smallest organisms that can be collected through bulk sampling and preserved for later sequencing and informatic-based taxonomic assignment. eDNA processing also lends itself more easily to technical standardization compared to methods dependent upon sorting of complex samples and taxonomic expertise, the later becoming a major issue as the number of skilled experts decreases (Hebert et al., 2003; Bohmann et al., 2014). Once baseline studies are established and protocols optimized, eDNA has the potential to be less costly and less-destructive than physical sampling (Rees et al., 2014; Sigsgaard et al., 2015), which is particularly important for conservation studies that seek to track re-establishment of previously impacted populations. eDNA also contributes to increasing the amount of information on habitat diversity while augmenting bio-inventories (Bohmann et al., 2014), useful for poorly studied habitats, such as deep-sea active and inactive hydrothermal vents.
The application of eDNA for characterizing metazoan communities is still relatively new and making rapid advances. There are, however, still several limitations to the method that require resolving that accompanies continued development. First, eDNA is most accurate when focusing on incidence data (presence/absence), given the number of times that a sequence is observed can be influenced by factors other than the abundance of taxa (i.e., number of biological cells present, the physical parameters of the local environment, etc.) (Lacoursière-Roussel et al., 2016). In this context, morphological approaches that require observation and/or physical collection of individuals can provide more precise estimates of abundance, as well as the ability to distinguish between living and dead animals, various life stages and sexes (Rees et al., 2014; Thomsen and Willerslev, 2015). While primarily focusing on a single or few species, some studies have already successfully linked eDNA concentrations with abundance in the form of biomass, organismal density or both (Lacoursière-Roussel et al., 2016; Yamamoto et al., 2016; Doi et al., 2017).
Furthermore, total DNA in the environment (hard and soft substrata) includes intracellular DNA that originates from living cells and extracellular DNA that originates from cell lysis (Pietramellara et al., 2009). Upon being released, extra-cellular DNA can persist in the environment after an organism is no longer present, possibly impacting the accuracy of eDNA biodiversity surveys (Corinaldesi et al., 2011; Dejean et al., 2011), although more recent research has shown that under certain conditions, extracellular DNA has a surprisingly minimal effect on genetic estimates of taxonomic and phylogenetic diversity (Lennon et al., 2018; Torti et al., 2018). In attempts to improve the efficiency of molecular methods for detecting living communities, as well as provide more accurate assessments of biodiversity over time, studies have used treatments during the DNA extraction phase to separate intra and extracellular DNA within environmental samples (Wagner et al., 2008; Taberlet et al., 2012b; Seidel et al., 2017). Additional strategies have extracted eRNA of microorganisms, as eRNA is less stable and degrades more rapidly than eDNA and can thus improve biodiversity assessment of contemporary communities (Barnes and Turner, 2016; Pochon et al., 2017; Laroche et al., 2018; Brandt et al., 2019). Next, the incompleteness of public databases used for taxonomic assignment during high-throughput sequencing projects, as well as the selection of genetic markers, heavily influence eDNA studies. Gaps in databases will continue to be a limitation for habitats where communities are not well characterized to the species level (Thomsen and Willerslev, 2015), though repositories are rapidly expanding (Porter and Hajibabaei, 2018). In our case, some taxa denoted as “common” correspond to species not found in the deep sea or at hydrothermal vents. When taxa are poorly represented or absent in the database, sequences may have no match or may match to the nearest relative that has more abundant and available data (Dayrat, 2005; Kvist, 2013). The presence of non-vent assignments in our datasets suggests that sequences were assigned to the closest taxon within the database and not that these “non-vent species” are present in the deep-sea. Alternatively, our bioinformatic assignment protocol may not have been optimal for finding the best matches present. To address these shortcomings, the best strategy includes the continued inclusion of well curated data from hydrothermal vent and deep-sea fauna into public inventories, to which we have contributed in the present study via our barcoding efforts. Furthermore, the use of a standardized bioinformatic pipeline targeting poorly surveyed marine habitats that outlines specific parameters and filters would allow more precise and uniform results and this effort is currently underway (Brandt et al., 2019). These outcomes also emphasize the importance of collaborative efforts of morphological and molecular approaches, at least during the initial stages of community characterization (Cowart et al., 2015).
Finally, challenges for finding optimal metabarcoding markers for the simultaneous characterization of several taxonomic groups are partially linked to differing rates of evolution across animals and the lengths of amplicons (Hebert et al., 2003; Epp et al., 2012; Sinniger et al., 2016). Notably, some fragments of the 18S SSU ribosomal RNA (18S) exhibit uneven phylogenetic resolution across taxonomic groups and have difficulties disentangling taxa at the genus and species levels when compared to lesser conserved mitochondrial markers (Tang et al., 2012; Wu et al., 2015). Additionally, smaller amplicons, termed “mini-barcodes,” often provide taxonomic information for samples containing highly degraded DNA (Meusnier et al., 2008; Barnes et al., 2014) but in some cases, may be too short to be phylogenetically informative. The marker 18S-V9 was chosen due to its short amplicon length and availability of primers, yet the 18S-V9 dataset primarily uncovered taxa of non-interest such as Bacteria (Figure 2), possibly as a result of both its conservation and size. Thus, for environments where community composition remains largely unknown, such as deep-sea vents, future studies could instead employ less conserved mitochondrial mini barcodes, such as the COI-mini barcode proposed by Günther et al. (2018).
In comparison, the Cytochrome Oxidase I (COI) gene has often been designated the DNA barcode standard for animals, as it is better at resolving taxa at the species level given its faster mutational rate, as well as the presence of robust “universal” primers, all aided by an extensive reference databank for taxonomic matching (Hebert et al., 2003; Hajibabaei et al., 2007; Bucklin et al., 2011; Porter and Hajibabaei, 2018). COI, however, is not without limitations that have been discussed extensively; this includes biases associated with maternal inheritance, overestimations of species divergence and the presence of pseudogenes, which can skew diversity assessments (Frézal and Leblois, 2008; Buhay, 2009; Bucklin et al., 2011; Deagle et al., 2014). Another disadvantage of the COI primers we used is their degeneracy which is useful for providing broad coverage of metazoans, but also allows for the amplification of some non-metazoans (Lear et al., 2018).
The novelty of our project and the goal to sequence across several hydrothermal vent taxa led us to implement four COI and 18S fragments that produced amplicons small enough to amplify degraded DNA material, yet long enough to provide information at various taxonomic levels. Comparing taxonomic results between COI and 18S, some taxa were found within certain datasets, yet not others (Figure 2). Previous authors also had similar findings while employing COI and 18S markers on environmental data (Cowart et al., 2015; Günther et al., 2018), linked to the factors described above. As an example, COI is known to have poor species resolution in some taxa and is unreliable for barcoding nematodes (De Ley et al., 2005; Pochon et al., 2013) and as such, 18S is preferred in these instances (Bhadury et al., 2006, 2008). This further supports that several factors, including marker amplicon length, the presence of pseudogenes or introns and differing evolution rates influence taxonomic “preferences” of markers. Despite these differences, the comparison of our eDNA datasets identified congruent statistical findings (Table 4), which included differences in community composition across habitats, as well as high diversity in inactive sites, similar to what has been seen using more traditional sampling strategies (Vanreusel et al., 1997; Levin et al., 2009). As there is no currently known perfect marker for properly characterizing all phyla, recommended strategies suggest using either a single marker for investigations of specific groups, or the use of multiple markers simultaneously to enhance biodiversity resolution (Dupuis et al., 2012; De Barba et al., 2014; Cowart et al., 2015). Other genes, such as 12S SSU rRNA and 28S LSU rRNA, should also be considered as viable options for metabarcoding due to their variability, ease of amplification and presence of public sequence data (Machida and Knowlton, 2012; Valentini et al., 2016; Lear et al., 2018).
Future of SMS Disturbances at Vents
The effects of mining activities on animal communities differ from natural disturbances, as mining would include not only the removal of substratum and associated faunal communities by machinery, but also generate a particulate plume that could smother individuals, as well as alter venting activity and fluid flow by clogging fluid channels (Juniper, 2002; Van Dover, 2011, 2014). If the scale of this destruction is widespread, these actions could not only hinder recovery, but may force the affected habitat past its tipping point, causing irreversible damages (Lotze et al., 2011; Veraart et al., 2012; Mullineaux et al., 2018). The current in situ experiment simulates a minor disturbance event in which fluid flow or chemistry was not altered. Additionally, our recolonization experiment focused on active areas, rather than inactive areas, where commercial mining is expected to occur. Finally, it was done at a far smaller scale than those expected for mining activities, although in the event of a large-scale mining operation, particulate plumes could likely affect nearby active venting sites. Despite these limitations, we provide foundational data on the diversity present at inactive sites, demonstrating that despite the absence of visible fauna, these sites may harbor an incredible level of diversity, especially in the microbial realm. To date, information regarding recolonization processes in these habitats are fully missing, and the resampling of these quadrats after one or two more years of recolonization will bring new insight on inactive SMS recovery potential. Extending these types of experiments in space and time might also prove useful for the development of new methodologies for ecosystem monitoring using quick and reproducible approaches, such as environmental DNA.
Data Availability Statement
DNA barcoding and metabarcoding datasets are available online at NCBI under GenBank accessions MK591147–MK591726 and SRA accession PRJNA540908. DOI of the cruises: SARRADIN Pierre-Marie, CANNAT Mathilde (2017) MOMARSAT2017 cruise, RV Pourquoi pas?, https://doi.org/10.17600/17000500; CANNAT Mathilde (2018) MOMARSAT2018 cruise, RV L’Atalante, https://doi.org/10.17600/18000514.
Ethics Statement
Our project occurred within the Portuguese EEZ and also a Marine Protected Area available for scientific access. Specific permissions were required to work and perform collections at the Lucky Strike hydrothermal vent field. Our work did not involve the collection or handling of endangered nor protected species.
Author Contributions
MM and JS conceptualized the study, secured funding, and provided supervision for the work. MM, JM, and JS performed the acquisition and preservation of samples. JM performed analyses and laboratory curation of the morphological data. DC undertook all other laboratory analyses, sequencing preparation, bioinformatic and statistical analyses, as well as wrote the manuscript. MB contributed to the choice of markers and statistical analyses. MM, JM, MB, and JS edited the manuscript.
Conflict of Interest
The authors declare that the research was conducted in the absence of any commercial or financial relationships that could be construed as a potential conflict of interest.
Funding
This research was supported by the European H2020 MERCES (Project ID 689518) and the Ifremer ABYSS projects. It is part of the EMSO-Azores (http://www.emso-fr.org) regional node, and of the EMSO ERIC Research Infrastructure (http://emso.eu/).
Acknowledgments
We would like to thank the captains and crews of the oceanographic cruise campaigns of Momarsat 2017 and 2018 aboard the vessels N/O Pourquoi pas? and L’Atalante, as well as the ROV Victor6000 team. We are also sincerely thankful to the following people for their assistance in various aspects of this project: Sophie Arnaud-Haond, Laure Quintric, Patrick Durand, Johanne Aube, Olivier Soubigou, Colomban de Vargas, Cathy Liautard-Haag, and the technicians and engineers of the deep sea Ifremer lab.
Supplementary Material
The Supplementary Material for this article can be found online at: https://www.frontiersin.org/articles/10.3389/fmars.2019.00783/full#supplementary-material
FIGURE S1 | Sequencing depth of non-metazoans and metazoans combined (“overall”) for the four eDNA datasets. The number of reads in each OTU (right) and 18 samples (left) are shown for each gene marker.
FIGURE S2 | Sequencing depth of metazoans only for the four eDNA datasets. The number of reads in each OTU (right) and 18 samples (left) are shown for each gene marker.
FIGURE S3 | The top 10 most common species, in terms of sequence abundance, for the 18S-V4 and 18S-V9 eDNA datasets. “DNA barcode” are those species that were physically collected from Montségur and DNA barcoded in the current project (Table 1). “Additional” are species that were not DNA barcoded by the present project yet were apparently within the NCBI GenBank database prior to the taxonomic assignment of eDNA. Species in bold are those found at hydrothermal vents, while non-bolded species are not found at hydrothermal vents. The presence of these non-vent assignments suggests that these sequences were assigned to the closest taxon within the database, and not that these non-vent species are present in the deep-sea.
FIGURE S4 | Accumulation curves for the 18S-V4 eDNA dataset, for both baseline (left) and recolonization (right) data across all taxa (non-metazoans and metazoans) and metazoan taxa only. Baseline data focuses on sample communities from differing habitats/vent activity, as well as those from differing locations on the active edifice (base and structure). Recolonization data focuses on sample communities from differing years, as well as those that were caged against those non-caged at active sites. Note the difference in scales for number of OTUs and number of sequences between “All taxa” and “Metazoan taxa only.” Recolonization data are only available for the active sites.
FIGURE S5 | Accumulation curves for the 18S-V9 eDNA dataset, for both baseline (left) and recolonization (right) data across all taxa (non-metazoans and metazoans) and metazoan taxa only. Baseline data focuses on sample communities from differing habitats/vent activity, as well as those from differing locations on the active edifice (base and structure). Recolonization data focuses on sample communities from differing years, as well as those that were caged against those non-caged at active sites. Note the difference in scales for number of OTUs and number of sequences between “All taxa” and “Metazoan taxa only.” Recolonization data are only available for the active sites.
FIGURE S6 | Canonical correspondence analysis (CCA) plots for 18S-V4 and 18S-V9, illustrating metazoan community distributions by active, periphery or inactive habitats. Shapes denote habitat type and location (active only) and the number of shapes corresponds to the number of eDNA samples retrieved from each habitat. Colors refer to year and ellipses identify the relationships within habitats. The environmental gradient moves from right to left with increasing level of venting influence.
FIGURE S7 | Taxonomic characterizations of 18S-V4 and 18S-V9 eDNA datasets by phylum, based on number of OTUs (incidence) and identified from samples distributed around the active edifice, periphery and inactive sites.
FIGURE S8 | Taxonomic characterizations of the four eDNA datasets by phylum, based on number of OTUs (incidence) and identified from samples collected in 2017 and 2018, for visualization of recolonization across years and presence of cages.
TABLE S1 | Sequencing depth values for all taxa and metazoan taxa only, for the four eDNA datasets and across the 18 collected samples.
MATERIAL S1 | PCR protocols for DNA barcoding of animal tissue.
References
Amaral-Zettler, L. A., McCliment, E. A., Ducklow, H. W., and Huse, S. M. (2009). A method for studying protistan diversity using massively parallel sequencing of V9 hypervariable regions of small-subunit ribosomal RNA genes. PLoS One 4:e6372. doi: 10.1371/journal.pone.0006372
Anderson, M. (2001). A new method for non-parametric multivariate analysis of variance. Austral Ecol. 26, 32–46. doi: 10.1111/j.1442-9993.2001.01070.pp.x
Barnes, M., and Turner, C. (2016). The ecology of environmental DNA and implications for conservation genetics. Conserv. Genet. 17, 1–17. doi: 10.1007/s10592-015-0775-4
Barnes, M., Turner, C., Jerde, C., Renshaw, M., Chadderton, W., and Lodge, D. (2014). Environmental conditions influence eDNA persistence in aquatic systems. Environ. Sci. Technol. 48, 1819–1827. doi: 10.1021/es404734p
Baross, J., and Hoffman, S. (1985). Submarine hydrothermal vents and associated gradient environments as sites for the origin and evolution of life. Orig. Life Evol. Biosph. 15, 327–345. doi: 10.1007/bf01808177
Barreyre, T., Escartin, J., Sohn, R., Cannat, M., Ballu, V., and Crawford, W. (2014). Temporal variability and tidal modulation of hydrothermal exit-fluid temperatures at the Lucky Strike deep-sea vent field, Mid-Atlantic Ridge. J. Geophys. Res. Solid Earth 119, 2543–2566. doi: 10.1002/2013jb010478
Bellec, L., Cambon-Bonavita, M.-A., Cueff-Gauchard, V., Durand, L., Gayet, N., and Zeppilli, D. (2018). A nematode of the Mid-Atlantic Ridge hydrothermal vents harbors a possible symbiotic relationship. Front. Microbiol. 9:2246. doi: 10.3389/fmicb.2018.02246
Bhadury, P., Austen, M., Bilton, D., Lambshead, P., Rogers, A., and Smerdon, G. (2006). Development and evaluation of a DNA-barcoding approach for the rapid identification of nematodes. Mar. Ecol. Prog. Ser. 320, 1–9. doi: 10.3354/meps320001
Bhadury, P., Austen, M., Bilton, D., Lambshead, P., Rogers, A., and Smerdon, G. (2008). Evaluation of combined morphological and molecular techniques for marine nematode (Terschellingia spp.) identification. Mar. Biol. 154, 509–518. doi: 10.1007/s00227-008-0945-8
Blake, J. (1985). Polycaeta from the vicinity of deep-sea geothermal vents in the eastern Pacific. I: euphrosinidae, phyllodocidae, hesionidae, nereididae, glyceridae, dorvilleidae, orbiniidae and maldanidae. Bull. Biol. Soc. Washington 6, 67–101.
Bohmann, K., Evans, A., Gilbert, M., Carvalho, G., Creer, S., Knapp, M., et al. (2014). Environmental DNA for wildlife biology and biodiversity monitoring. Trends Ecol. Evol. 29, 358–365.
Bolger, A., Lohse, M., and Usadel, B. (2014). Trimmomatic: a flexible trimmer for Illumina sequence data. Bioinformatics 30, 2114–2120. doi: 10.1093/bioinformatics/btu170
Boschen, R., Rowden, A., Clark, M., and Gardner, J. (2013). Mining of deep-sea seafloor massive sulfides: a review of the deposits, their benthic communities, impacts from mining, regulatory frameworks and management strategies. Ocean Coast. Manag. 84, 54–67. doi: 10.1016/j.ocecoaman.2013.07.005
Boschen, R., Rowden, A., Clark, M., Pallentin, A., and Gardner, J. (2016). Seafloor massive sulfide deposits support unique megafaunal assemblages: implications for seabed mining and conservation. Mar. Environ. Res. 115, 78–88. doi: 10.1016/j.marenvres.2016.02.005
Brandt, M., Trouche, B., Quintric, L., Wincker, P., Poulain, J., and Arnaud-Haond, S. (2019). A flexible pipeline combining bioinformatic correction tools for prokaryotic and eukaryotic metabarcoding. bioRxiv [Preprint]. doi: 10.1101/717355
Bucklin, A., Steinke, D., and Blanco-Bercial, L. (2011). DNA barcoding of marine metazoa. Ann. Rev. Mar. Sci. 3, 471–508. doi: 10.1146/annurev-marine-120308-080950
Buhay, J. (2009). “COI-like” sequences are becoming problematic in molecular systematic and DNA barcoding studies. J. Crustacean Biol. 29, 96–110. doi: 10.1651/08-3020.1
Butterfield, D., Jonasson, I., Massoth, G., Feely, R., Roe, K., Embley, R., et al. (1997). Seafloor eruptions and evolution of hydrothermal fluid chemistry. Philos. Trans. R. Soc. Lond. Ser. A Math. Phys. Eng. Sci. 355, 369–386.
Carr, C. M., Hardy, S. M., Brown, T. M., Macdonald, T. A., and Hebert, P. D. (2011). A tri-oceanic perspective: DNA barcoding reveals geographic structure and cryptic diversity in Canadian polychaetes. PLoS One 6:e22232. doi: 10.1371/journal.pone.0022232
Chambert, T., Miller, D., and Nichols, J. (2015). Modeling false positive detections in species occurrence data under different study designs. Ecology 96, 332–339. doi: 10.1890/14-1507.1
Chao, A., and Chiu, C. H. (2016). Species Richness: Estimation and Comparison. Hoboken, NJ: Wiley, 1–26.
Childress, J., and Fisher, C. (1992). The biology of hydrothermal vent animals: physiology, biochemistry and autotrophic symbioses. Oceanogr. Mar. Biol. Annu. Rev. 20, 337–441.
Clark, K. (1993). Non-parametric multivariate analyses of changes in community structure. Aust. J. Ecol. 18, 117–143. doi: 10.1111/j.1442-9993.1993.tb00438.x
Coissac, E., Riaz, T., and Puillandre, N. (2012). Bioinformatic challenges for DNA metabarcoding of plants and animals. Mol. Ecol. 21, 1834–1847. doi: 10.1111/j.1365-294X.2012.05550.x
Collins, P., Kennedy, R., and Van Dover, C. (2012). A biological survey method applied to seafloor massive sulphides (SMS) with contagiously distributed hydrothermal-vent fauna. Mar. Ecol. Prog. Ser. 452, 89–107. doi: 10.3354/meps09646
Corinaldesi, C., Barucca, M., Luna, G., and Dell’Anno, A. (2011). Preservation, origin and genetic imprint of extracellular DNA in permanently anoxic deep-sea sediments. Mol. Ecol. 20, 642–654. doi: 10.1111/j.1365-294X.2010.04958.x
Cowart, D., Pinheiro, M., Mouchel, O., Maguer, M., Grall, J., Miné, J., et al. (2015). Metabarcoding is powerful yet still blind: a comparative analysis of morphological and molecular surveys of seagrass communities. PLoS One 10:e0117562. doi: 10.1371/journal.pone.0117562
Cuvelier, D., Beesau, J., Ivanenko, V., Zeppilli, D., Sarradin, P., and Sarrazin, J. (2014). First insights into macro-and meiofaunal colonisation patterns on paired wood/slate substrata at Atlantic deep-sea hydrothermal vents. Deep Sea Res Part I Oceanogr. Res. Pap. 87(Part 1), 70–81. doi: 10.1016/j.dsr.2014.02.008
Cuvelier, D., Busserolles, F. D., Lavaud, R., Floc’h, E., Fabri, M., Sarradin, P., et al. (2012). Biological data extraction from imagery - How far can we go? A case study from the Mid-Atlantic Ridge. Mar. Environ. Res. 82, 15–27. doi: 10.1016/j.marenvres.2012.09.001
Cuvelier, D., Sarradin, P., Sarrazin, J., Colaço, A., Copley, J., Desbruyères, D., et al. (2011a). Hydrothermal faunal assemblages and habitat characterisation at the Eiffel Tower edifice (Lucky Strike, Mid-Atlantic Ridge). Mar. Ecol. 32, 243–255. doi: 10.1111/j.1439-0485.2010.00431.x
Cuvelier, D., Sarrazin, J., Colaço, A., Copley, J., Glover, A., Tyler, P., et al. (2011b). Community dynamics over 14 years at the Eiffel Tower hydrothermal edifice on the Mid-Atlantic Ridge. Limnol. Oceanogr. 56, 1624–1640. doi: 10.4319/lo.2011.56.5.1624
Cuvelier, D., Sarrazin, J., Colaço, A., Copley, J., Desbruyères, D., Glover, A., et al. (2009). Distribution and spatial variation of hydrothermal faunal assemblages at LuckyStrike (Mid-AtlanticRidge) revealed by high-resolution video image analysis. Deep Sea Res. Part I Oceanogr. Res. Pap. 56, 2026–2040. doi: 10.1016/j.dsr.2009.06.006
Dayrat, B. (2005). Towards integrative taxonomy. Biol. J. Linn. Soc. 85, 407–415. doi: 10.1111/j.1095-8312.2005.00503.x
De Barba, M., Miquel, C., Boyer, F., Mercier, C., Rioux, D., Coissac, E., et al. (2014). DNA metabarcoding multiplexing and validation of data accuracy for diet assessment: application to omnivorous diet. Mol. Ecol. Resour. 14, 306–323. doi: 10.1111/1755-0998.12188
De Ley, P., De Ley, I., Morris, K., Abebe, E., Mundo-Ocampo, M., Yoder, M., et al. (2005). An integrated approach to fast and informative morphological vouchering of nematodes for applications in molecular barcoding. Philos. Trans. R. Soc. B Biol. Sci. 360, 1945–1958. doi: 10.1098/rstb.2005.1726
De Ley, P., Félix, M., Frisse, L., Nadler, S., Sternberg, P., and Thomas, W. (1999). Molecular and morphological characterisation of two reproductively isolated species with mirror-image anatomy (Nematoda: Cephalobidae). Nematology 1, 591–612. doi: 10.1163/156854199508559
Deagle, B., Jarman, S., Coissac, E., Pompanon, F., and Taberlet, P. (2014). DNA metabarcoding and the cytochrome c oxidase subunit I marker: not a perfect match. Biol. Lett. 10:20140562. doi: 10.1098/rsbl.2014.0562
Dejean, T., Valentini, A., Duparc, A., Pellier-Cuit, S., Pompanon, F., Taberlet, P., et al. (2011). Persistence of environmental DNA in freshwater ecosystems. PLoS One 6:e23398. doi: 10.1371/journal.pone.0023398
Desbruyères, D., Almeida, A., Biscoito, M., Comtet, T., Khripounoff, A., Le Bris, N., et al. (2000). A review of the distribution of hydrothermal vent communities along the northern Mid-Atlantic Ridge: dispersal vs. environmental controls. Hydrobiologia 440, 201–216. doi: 10.1007/978-94-017-1982-7_19
Doi, H., Inui, R., Akamatsu, Y., Kanno, K., Yamanaka, H., Takahara, T., et al. (2017). Environmental DNA analysis for estimating the abundance and biomass of stream fish. Freshw. Biol. 62, 30–39. doi: 10.1371/journal.pone.0218823
Doyle, J. (1991). “DNA protocols for plants,” in Molecular Techniques in Taxonomy, eds G. M. Hewitt, A. W. B. Johnston, and J. P. W. Young, (Berlin: Springer), 283–293. doi: 10.1007/978-3-642-83962-7_18
Dupuis, J., Roe, A., and Sperling, F. (2012). Multi-locus species delimitation in closely related animals and fungi: one marker is not enough. Mol. Ecol. 21, 4422–4436. doi: 10.1111/j.1365-294X.2012.05642.x
Epp, L., Boessenkool, S., Bellemain, E., Haile, J., Esposito, A., Riaz, T., et al. (2012). New environmental metabarcodes for analysing soil DNA: potential for studying past and present ecosystems. Mol. Ecol. 21, 1821–1833. doi: 10.1111/j.1365-294X.2012.05537.x
Escudié, F., Auer, L., Bernard, M., Mariadassou, M., Cauquil, L., Vidal, K., et al. (2017). FROGS: find, rapidly, OTUs with galaxy solution. Bioinfomatics 34, 1287–1294. doi: 10.1093/bioinformatics/btx791
Ficetola, G., Pansu, J., Bonin, A., Coissac, E., Giguet-Covex, C., De Barba, M., et al. (2015). Replication levels, false presences and the estimation of the presence/absence from eDNA metabarcoding data. Mol. Ecol. Resour. 15, 543–556. doi: 10.1111/1755-0998.12338
Fisher, C., Takai, K., and Le Bris, N. (2007). Hydrothermal vent ecosystems. Oceanography 20, 14–23. doi: 10.5670/oceanog.2007.75
Folmer, O., Black, M., Hoeh, W., Lutz, R., and Vrijenhoek, R. (1994). DNA primers for amplification of mitochondrial cytochrome c oxidase subunit I from diverse metazoan invertebrates. Mol. Mar. Biol. Biotechnol. 3, 294–299.
Frézal, L., and Leblois, R. (2008). Four years of DNA barcoding: current advances and prospects. Infect. Genet. Evol. 8, 727–736. doi: 10.1016/j.meegid.2008.05.005
Gaudron, S., Pradillon, F., Pailleret, M., Duperron, S., Le Bris, N., and Gaill, F. (2010). Colonization of organic substrates deployed in deep-sea reducing habitats by symbiotic species and associated fauna. Mar. Environ. Res. 70, 1–12. doi: 10.1016/j.marenvres.2010.02.002
Gauthier, O., Sarrazin, J., and Desbruyères, D. (2010). Measure and mis-measure of species diversity in deep-sea chemosynthetic communities. Mar. Ecol. Prog. Ser. 402, 285–302. doi: 10.3354/meps08395
Goldberg, C., Turner, C., Deiner, K., Klymus, K., Thomsen, P., Mruphy, M., et al. (2016). Critical considerations for the application of environmental DNA methods to detect aquatic species. Methods Ecol. Evol. 7, 1299–1307. doi: 10.1111/2041-210x.12595
Gollner, S., Kaiser, S., Menzel, L., Jones, D., Brown, A., Mestre, N., et al. (2017). Resilience of benthic deep-sea fauna to mining activities. Mar. Environ. Res. 129, 76–101. doi: 10.1016/j.marenvres.2017.04.010
Guillera-Arroita, G., Lahoz-Monfort, J., van Rooyen, A., Weeks, A., and Tingley, R. (2017). Dealing with false-positive and false-negative errors about species occurrence at multiple levels. Methods Ecol. Evol. 8, 1081–1091. doi: 10.1111/2041-210x.12743
Günther, B., Knebelsberger, T., Neumann, H., Laakmann, S., and Martínez Arbizu, P. (2018). Metabarcoding of marine environmental DNA based on mitochondrial and nuclear genes. Sci. Rep. 8:14822.
Hajibabaei, M., Singer, G., Hebert, P., and Hickey, D. (2007). DNA barcoding: how it complements taxonomy, molecular phylogenetics and population genetics. Trends Genet. 23, 167–172. doi: 10.1016/j.tig.2007.02.001
Hammer, Ø., Harper, D., and Ryan, P. (2001). PAST: paleontological statistics software package for education and data analysis. Palaeontol. Electronica 4, 1–9.
Hänfling, B., Lawson Handley, L., Read, D., Hahn, C., Li, J., Nichols, P., et al. (2016). Environmental DNA metabarcoding of lake fish communities reflects long-term data from established survey methods. Mol. Ecol. 25, 3101–3119. doi: 10.1111/mec.13660
Hannington, M., Jamieson, J., Monecke, T., Petersen, S., and Beaulieu, S. (2011). The abundance of seafloor massive sulfide deposits. Geology 39, 1155–1158. doi: 10.1128/mBio.00279-11
Hebert, P., Cywinska, A., Ball, S., and Dewaard, J. (2003). Biological identifications through DNA barcodes. Proc. R. Soc. Lond. Ser. B Biol. Sci. 270, 313–321. doi: 10.1098/rspb.2002.2218
Hoagland, P., Beaulieu, S., Trivey, M., Eggert, R., German, C., Glowka, L., et al. (2010). Deep-sea mining of seafloor massive sulfides. Mar. Policy 34, 728–732. doi: 10.1016/j.marenvres.2016.02.005
Humphris, S., Fornari, D., Scheirer, D., German, C., and Parson, L. (2002). Geotectonic setting of hydrothermal activity on the summit of Lucky Strike Seamount (37 17’N, Mid-Atlantic Ridge). Geochem. Geophys. Geosyst. 3, 1–24.
Hunt, H., Metaxas, A., Jennings, R., Halanych, K., and Mullineaux, L. (2004). Testing biological control of colonization by vestimentiferan tubeworms at deep-sea hydrothermal vents (East Pacific Rise, 9 50’N). Deep Sea Res. Part Oceanogr. Res. Pap. 1, 225–234. doi: 10.1016/j.dsr.2003.10.008
ISA, (2010). Polymetallic Sulphides [Online]. Available at: https://ran-s3.s3.amazonaws.com/isa.org.jm/s3fs-public/documents/EN/Brochures/ENG8.pdf doi: 10.1016/j.dsr.2003.10.008 (accessed November 8, 2018).
Ji, Y., Ashton, L., Pedley, S., Edwards, D., Tang, Y., Nakamura, A., et al. (2013). Reliable, verifiable and efficient monitoring of biodiversity via metabarcoding. Ecol. Lett. 16, 1245–1257. doi: 10.1111/ele.12162
Johnson, K., Childress, J., and Beehler, C. (1988). Short-term temperature variability in the Rose Garden hydrothermal vent field: an unstable deep-sea environment. Deep Sea Res. Part A Oceanogr. Res. Pap. 35, 1711–1721. doi: 10.1016/0198-0149(88)90045-3
Johnson, M., Zaretskaya, I., Raytselis, Y., Merezhuk, Y., Mcginnis, S., and Madden, T. (2008). NCBI Blast: a better web interface. Nucleic Acids Res. 36, W5–W9. doi: 10.1093/nar/gkn201
Juniper, S. (2002). “Impact of the development of seafloor massive sulphides on the vent ecosystem,” in Polymetallic Massive Sulphides and Cobalt-Rich Ferromanganese Crusts: Status and Prospects, (Kingston: International Seabed Authority).
Karl, D., Wirsen, C., and Jannasch, H. (1980). Deep-sea primary production at the Galapagos hydrothermal vents. Science 207, 1345–1347. doi: 10.1126/science.207.4437.1345
Kearse, M., Moir, R., Wilson, A., Stones-Havas, S., Cheung, M., Sturrock, S., et al. (2012). Geneious Basic: an integrated and extendable desktop software platform for the organization and analysis of sequence data. Bioinfomatics 28, 1647–1649. doi: 10.1093/bioinformatics/bts199
Kelly, N., Metaxas, A., and Butterfield, D. (2007). Spatial and temporal patterns of colonization by deep-sea hydrothermal vent invertebrates on the Juan de Fuca Ridge, NE Pacific. Aquat. Biol. 1, 1–16. doi: 10.3354/ab00001
Krasnov, S., Cherkashev, G., Stepanova, T., Batuyev, B., Krotov, A., Malin, B., et al. (1995). Detailed geological studies of hydrothermal fields in the North Atlantic. Hydrothermal vents and processes. Geol. Soc. 87, 43–64.
Kvist, S. (2013). Barcoding in the dark?: a critical view of the sufficiency of zoological DNA barcoding databases and a plea for broader integration of taxonomic knowledge. Mol. Phylogenet. Evol. 69, 39–45. doi: 10.1016/j.ympev.2013.05.012
Lacoursière-Roussel, A., Rosabal, M., and Bernatchez, L. (2016). Estimating fish abundance and biomass from eDNA concentrations: variability among capture methods and environmental conditions. Mol. Ecol. Resour. 16, 1401–1414. doi: 10.1111/1755-0998.12522
Lahoz-Monfort, J., Guillera-Arroita, G., and Tingley, R. (2016). Statistical approaches to account for false positive errors in environmental DNA samples. Mol. Ecol. Resour. 16, 673–685. doi: 10.1111/1755-0998.12486
Langmuir, C., Humphris, S., Fornari, D., Van Dover, C., Von Damm, K., Tivey, M., et al. (1997). Hydrothermal vents near a mantle hot spot: the Lucky Strike vent field at 37°N on the Mid-Atlantic Ridge. Earth Planet. Sci. Lett. 148, 69–91. doi: 10.1016/s0012-821x(97)00027-7
Laroche, O., Wood, S., Tremblay, L., Ellis, J., Lear, G., and Pochon, X. (2018). A cross-taxa study using environmental DNA/RNA metabarcoding to measure biological impacts of offshore oil and gas drilling and production operations. Mar. Pollut. Bull. 127, 97–107. doi: 10.1016/j.marpolbul.2017.11.042
Laroche, O., Wood, S., Tremblay, L., Lear, G., Ellis, J., and Pochon, X. (2017). Metabarcoding monitoring analysis: the pros and cons of using co-extracted environmental DNA and RNA data to assess offshore oil production impacts on benthic communities. PeerJ 5:e3347. doi: 10.7717/peerj.3347
Lear, G., Dickie, I., Banks, J., Boyer, S., Buckley, H., Tr, B., et al. (2018). Methods for the extraction, storage, amplification and sequencing of DNA from environmental samples. N. Z. J. Ecol. 42, 10–50.
Lecroq, B., Gooday, A., Cedhagen, T., Sabbatini, A., and Pawlowski, J. (2009). Molecular analyses reveal high levels of eukaryotic richness associated with enigmatic deep-sea protists (Komokiacea). Mar. Biodivers. 39, 45–55. doi: 10.1007/s12526-009-0006-7
Lennon, J., Muscarella, M., Placella, S., and Lehmkuhl, B. (2018). How, when, and where relic DNA affects microbial diversity. mBio 9:e00637-18. doi: 10.1128/mBio.00637-18
Leray, M., and Knowlton, N. (2015). DNA barcoding and metabarcoding of standardized samples reveal patterns of marine benthic diversity. Proc. Natl. Acad. Sci. U.S.A. 112, 2076–2081. doi: 10.1073/pnas.1424997112
Leray, M., Yang, J., Meyer, C., Mills, S., Agudelo, N., Ranwez, V., et al. (2013). A new versatile primer set targeting a short fragment of the mitochondrial COI region for metabarcoding metazoan diversity: application for characterizing coral reef fish gut contents. Front. Zool. 10:34. doi: 10.1186/1742-9994-10-34
Levin, L. (1991). Interactions between metazoans and large, agglutinating protozoans: implications for the community structure of deep-sea benthos. Am. Zool. 31, 886–900. doi: 10.1093/icb/31.6.886
Levin, L., Baco, A., Bowden, D., Colaco, A., Cordes, E., Cunha, M., et al. (2016). Hydrothermal vents and methane seeps: rethinking the sphere of influence. Front. Mar. Sci. 3:72. doi: 10.3389/fmars.2016.00072
Levin, L., Mendoza, G., Konotchick, T., and Lee, R. (2009). Macrobenthos community structure and trophic relationships within active and inactive Pacific hydrothermal sediments. Deep Sea Res. II Top. Stud. Oceanogr. 56, 1632–1648. doi: 10.1016/j.dsr2.2009.05.010
Lindeque, P., Parry, H., Harmer, R., Somerfield, P., and Atkinson, A. (2013). Next generation sequencing reveals the hidden diversity of zooplankton assemblages. PLoS One 8:e81327. doi: 10.1371/journal.pone.0081327
Lotze, H., Coll, M., Magera, A., Ward-Paige, C., and Airoldi, L. (2011). Recovery of marine animal populations and ecosystems. Trends Ecol. Evol. 26, 595–605. doi: 10.1016/j.tree.2011.07.008
Lutz, R., and Kennish, M. (1993). Ecology of deep-sea hydrothermal vent communities: a review. Rev. Geophys. 31, 211–242.
Machida, R., and Knowlton, N. (2012). PCR primers for metazoan nuclear 18S and 28S ribosomal DNA sequences. PLoS One 7:e46180. doi: 10.1371/journal.pone.0046180
MacKenzie, D., Nichols, J., Lachman, G., Droege, S., Royle, A., and Langtimm, C. (2002). Estimating site occupancy rates when detection probabilities are less than one. Ecology 38, 2248–2255. doi: 10.1890/0012-9658(2002)083
Mahé, F., Rognes, T., Quince, C., de Vargas, C., and Dunthorn, M. (2014). Swarm: robust and fast clustering method for amplicon-based studies. PeerJ 2:e593. doi: 10.7717/peerj.593
McMurdie, P., and Holmes, S. (2013). phyloseq: an R package for reproducible interactive analysis and graphics of microbiome census data. PLoS One 8:e61217. doi: 10.1371/journal.pone.0061217
Mengerink, K., Van Dover, C., Ardron, J., Baker, M., Escobar-Briones, E., Gjerde, K., et al. (2014). A call for deep-ocean stewardship. Science 344, 696–698. doi: 10.1126/science.1251458
Meusnier, I., Singer, G., Landry, J.-F., Hickey, D., Hebert, P., and Hajibabaei, M. (2008). A universal DNA mini-barcode for biodiversity analysis. BMC Genomics 9:214. doi: 10.1186/1471-2164-9-214
Micheli, F., Peterson, C., Mullineaux, L., Fisher, C., Mills, S., Sancho, G., et al. (2002). Predation structures communities at deep-sea hydrothermal vents. Ecol. Monogr. 72, 365–382. doi: 10.1890/0012-9615(2002)072
Monecke, T., Petersen, S., Hannington, M., and Grant, H. (2015). The Global Rare Element Endowment of Seafloor Massive Sulfide Deposits. Kiel: Helmholtz Centre for Ocean Research.
Mullineaux, L. (2000). Tubeworm succession at hydrothermal vents: use of biogenic cues to reduce habitat selection error? Oecologia 123, 275–284. doi: 10.1007/s004420051014
Mullineaux, L. (2014). “Deep-sea hydrothermal vent communities,” in Marine Community Ecology and Conservation, eds M. D. Bertness, J. F. Bruno, B. R. Silliman, and J. J. Stachowicz, (Sunderland, MA: Sinauer Associates Inc), 383–400.
Mullineaux, L., Adams, D., Mills, S., and Beaulieu, S. (2010). Larvae from afar colonize deep-sea hydrothermal vents after a catastrophic eruption. Proc. Natl. Acad. Sci. U.S.A. 107, 7829–7834. doi: 10.1073/pnas.0913187107
Mullineaux, L., Metaxas, A., Beaulieu, S., Bright, M., Gollner, S., Grupe, B., et al. (2018). Exploring the ecology of deep-sea hydrothermal vents in a metacommunity framework. Front. Mar. Sci. 5:49. doi: 10.3389/fmars.2018.00049
Mullineaux, L., Peterson, C., Micheli, F., and Mills, S. (2003). Successional mechanism varies along a gradient in hydrothermal fluid flux at deep-sea vents. Ecol. Monogr. 73, 523–542. doi: 10.1890/02-0674
Oksanen, J. (2015). Multivariate analysis of ecological communities in R: vegan tutorial. R. Doc. 43, 11–12.
Olu-Le Roy, K., Von Cosel, R., Hourdez, S., Carney, S. L., and Jollivet, D. (2007). Amphi-Atlantic cold-seep Bathymodiolus species complexes across the equatorial belt. Deep Sea Res. Part I Oceanogr. Res. Pap. 54, 1890–1911. doi: 10.1016/j.dsr.2007.07.004
Ondréas, H., Cannat, M., Fouquet, Y., Normand, A., Sarradin, P., and Sarrazin, J. (2009). Recent volcanic events and the distribution of hydrothermal venting at the Lucky Strike hydrothermal field, Mid-Atlantic Ridge. Geochem. Geophys. Geosyst. 10:Q02006.
Pietramellara, G., Ascher, J., Borgogni, F., Ceccherini, M., Guerri, G., and Nannipieri, P. (2009). Extracellular DNA in soil and sediment: fate and ecological relavance. Biol. Fertil. Soils 45, 219–235. doi: 10.1007/s00374-008-0345-8
Plum, C., Pradillon, F., Yoshihiro, F., and Sarrazin, J. (2017). Copepod colonization of organic and inorganic substrata at a deep-sea hydrothermal vent site on the Mid-Atlantic Ridge. Deep Sea Res. Part II Top. Stud. Oceanogr. 137, 335–348. doi: 10.1016/j.dsr2.2016.06.008
Pochon, X., Bott, N., Smith, K., and Wood, S. (2013). Evaluating detection limits of next-generation sequencing for the surveillance and monitoring of international marine pests. PLoS One 8:e73935. doi: 10.1371/journal.pone.0073935
Pochon, X., Zaiko, A., Fletcher, L., Laroche, O., and Wood, S. (2017). Wanted dead or alive? Using metabarcoding of environmental DNA and RNA to distinguish living assemblages for biosecurity applications. PLoS One 12:e0187636. doi: 10.1371/journal.pone.0187636
Porter, T., and Hajibabaei, M. (2018). Over 2.5 million COI sequences in GenBank and growing. PLoS One 13:e0200177. doi: 10.1371/journal.pone.0200177
Quast, C., Pruesse, E., Yilmaz, P., Gerken, J., Schweer, T., Yarza, P., et al. (2012). The SILVA ribosomal RNA gene database project: improved data processing and web-based tools. Nucleic Acids Res. 41, D590–D596. doi: 10.1093/nar/gks1219
Ramirez-Llodra, E., Tyler, P., Baker, M., Bergstad, O., Clark, M., Escobar, E., et al. (2011). Man and the last great wilderness: human impact on the deep sea. PLoS One 6:e22588. doi: 10.1371/journal.pone.0022588
Rees, H., Maddison, B., Middleditch, D., Patmore, J., and Gough, K. (2014). The detection of aquatic animal species using environmental DNA - a review of eDNA as a survey tool in ecology. J. Appl. Ecol. 51, 1450–1459. doi: 10.1111/1365-2664.12306
Rognes, T., Flouri, T., Nichols, B., Quince, C., and Mahé, F. (2016). VSEARCH: a versatile open source tool for metagenomics. PeerJ. 4:e2584. doi: 10.7717/peerj.2584
Rona, P. (2008). The changing vision of marine minerals. Ore Geol. Rev. 33, 618–666. doi: 10.1016/j.oregeorev.2007.03.006
Sancho, G., Fisher, C., Mills, S., Micheli, F., Johnson, G., Lenihan, H., et al. (2005). Selective predation by zoarcid fish Thermarces cerberus at hydrothermal vents. Deep Sea Res. I Oceanogr. Res. Pap. 52, 837–844. doi: 10.1016/j.dsr.2004.12.002
Sarrazin, J., and Juniper, S. (1999). Biological characteristics of a hydrothermal edifice mosaic community. Mar. Ecol. Prog. Ser. 185, 1–19. doi: 10.3354/meps185001
Sarrazin, J., Legendre, P., De Busserolles, F., Fabri, M., Guilini, K., Ivanenko, V., et al. (2015). Biodiversity patterns, environmental drivers and indicator species on a high-temperature hydrothermal edifice, Mid-Atlantic Ridge. Deep Sea Res. II Top. Stud. Oceanogr. 121, 177–192. doi: 10.1016/j.dsr2.2015.04.013
Sarrazin, J., Robigou, V., Juniper, S., and Delaney, J. (1997). Biological and geological dynamics over four years on a high-temperature sulfide structure at the Juan de Fuca Ridge hydrothermal observatory. Mar. Ecol. Prog. Ser. 153, 5–24. doi: 10.3354/meps153005
Seidel, L., Strathmann, M., and Nocker, A. (2017). The feasibility of improved live-dead distinction in qPCR-based microbial source tracking. J. Microb. Methods 140, 23–31. doi: 10.1016/j.mimet.2017.06.013
Shank, T., Fornari, D., Von Damm, K., Lilley, M., Haymon, R., and Lutz, R. (1998). Temporal and spatial patterns of biological community development at nascent deep-sea hydrothermal vents (9 50’N, East Pacific Rise). Deep Sea Res. Part II Top. Stud. Oceanogr. 45, 465–515. doi: 10.1016/s0967-0645(97)00089-1
Sigsgaard, E., Carl, H., Møller, P., and Thomsen, P. (2015). Monitoring the near-extinct European weather loach in Denmark based on environmental DNA from water samples. Biol. Conserv. 183, 46–52. doi: 10.1016/j.biocon.2014.11.023
Sinniger, F., Pawlowski, J., Harii, S., Gooday, A., Yamamoto, H., Chevaldonné, P., et al. (2016). Worldwide analysis of sedimentary DNA reveals major gaps in taxonomic knowledge of deep-sea benthos. Front. Mar. Sci. 3:92. doi: 10.3389/fmars.2016.00092
Stoeck, T., Bass, D., Nebel, M., Christen, R., Jones, M., Breiner, H., et al. (2010). Multiple marker parallel tag environmental DNA sequencing reveals a highly complex eukaryotic community in marine anoxic waters. Mol. Ecol. 19, 21–31. doi: 10.1111/j.1365-294X.2009.04480.x
Taberlet, P., Coissac, E., Hajibabaei, M., and Riesenberg, L. (2012a). Environmental DNA. Mol. Ecol. 21, 1789–1793.
Taberlet, P., Prud’Homme, S., Campione, E., Roy, J., Miquel, C., Shehzad, W., et al. (2012b). Soil sampling and isolation of extracellular DNA from large amount of starting material suitable for metabarcoding studies. Mol. Ecol. 21, 1816–1820. doi: 10.1111/j.1365-294X.2011.05317.x
Tang, C., Leasi, F., Obertegger, U., Kieneke, A., Barraclough, T., and Fontaneto, D. (2012). The widely used small subunit 18S rDNA molecule greatly underestimates true diversity in biodiversity surveys of the meiofauna. Proc. Natl. Acad. Sci. U.S.A. 109, 16208–16212. doi: 10.1073/pnas.1209160109
Ter Braak, C., and Verdonschot, P. (1995). Canonical correspondence analysis and related multivariate methods in aquatic ecology. Aquat. Sci. 57, 255–289. doi: 10.1007/bf00877430
Thomsen, P., Møller, P., Sigsgaard, E., Knudsen, W., Jørgensen, O., and Willerslev, E. (2016). Environmental DNA from seawater samples correlate with trawl catches of subarctic, deepwater fishes. PLoS One 11:e0165252. doi: 10.1371/journal.pone.0165252
Thomsen, P., and Willerslev, E. (2015). Environmental DNA - An emerging tool in conservation for monitoring past and present biodiversity. Biol. Conserv. 183, 4–18. doi: 10.1016/j.biocon.2014.11.019
Torti, A., Jørgensen, B., and Lever, M. (2018). Preservation of microbial DNA in marine sediments: insights from extracellular DNA pools. Environ. Microbiol. 20, 4526–4542. doi: 10.1111/1462-2920.14401
Tsurumi, M. (2003). Diversity at hydrothermal vents. Glob. Ecol. Biogeogr. 12, 181–190. doi: 10.1046/j.1466-822x.2003.00016.x
Tunnicliffe, V. (1991). The biology of hydrothermal vents: ecology and evolution. Oceanogr. Mar. Biol. Annu. Rev. 29, 319–407.
Tunnicliffe, V., Embley, R., Holden, J., Butterfield, D., Massoth, G., and Juniper, S. (1997). Biological colonization of new hydrothermal vents following an eruption on Juan de Fuca Ridge. Deep Sea Res. Part I Oceanogr. Res. Pap. 44, 1627–1644. doi: 10.1016/s0967-0637(97)00041-1
Tunnicliffe, V., and Juniper, S. (1990). Dynamic character of the hydrothermal vent habitat and the nature of sulphide chimney fauna. Prog. Oceanogr. 24, 1–13. doi: 10.1016/0079-6611(90)90015-t
Valentini, A., Taberlet, P., Miaud, C., Civade, R., Herder, J., Thomsen, P., et al. (2016). Next-generation monitoring of aquatic biodiversity using environmental DNA metabarcoding. Mol. Ecol. 25, 929–942. doi: 10.1111/mec.13428
Van Dover, C. (2011). Mining seafloor massive sulphides and biodiversity: what is at risk? ICES J. Mar. Sci. 68, 341–348. doi: 10.1093/icesjms/fsq086
Van Dover, C. (2014). Impacts of anthropogenic disturbances at deep-sea hydrothermal vent ecosystems: a review. Mar. Environ. Res. 102, 59–72. doi: 10.1016/j.marenvres.2014.03.008
Van Dover, C., German, C., Speer, K., Parson, L., and Vrijenhoek, R. (2002). Evolution and biogeography of deep-sea vent and seep invertebrates. Science 295, 1253–1257. doi: 10.1126/science.1067361
Vanreusel, A., Van Den Bossche, I., and Thiermann, F. (1997). Free-living marine nematodes from hydrothermal vent sediments: similarities with communities from diverse reduced habitats. Mar. Ecol. Prog. Ser. 157, 207–219. doi: 10.3354/meps157207
Veraart, A., Ej, F., Dakos, V., Van Nes, E., Lürling, M., and Scheffer, M. (2012). Recovery rates reflect distance to a tipping point in a living system. Nature 481, 357–360. doi: 10.1038/nature10723
Wagner, A., Malin, C., Knapp, B., and Illmer, P. (2008). Removal of free extracellular DNA from environmental samples by ethnidium monoazide and propidium monoazide. Appl. Environ. Microbiol. 74, 2537–2539. doi: 10.1128/AEM.02288-07
Wei, N., Nakajima, F., and Tobino, T. (2018). Effects of treated sample weight and DNA marker length on sediment eDNA based detection of a benthic invertebrate. Ecol. Indic. 93, 267–273. doi: 10.1016/j.ecolind.2018.04.063
Wu, S., Xiong, J., and Yu, Y. (2015). Taxonomic resolutions based on 18S rRNA genes: a case study of subclass Copepoda. PLoS One 10:e0131498. doi: 10.1371/journal.pone.0131498
Yamamoto, S., Minami, K., Fukaya, K., Takahashi, K., Sawada, H., Murakami, H., et al. (2016). Environmental DNA as a ‘Snapshot’ of fish distribution: a case study of Japanese jack mackerel in Maizuru Bay, Sea of Japan. PLoS One 11:e0149786. doi: 10.1371/journal.pone.0149786
Yu, D., Ji, Y., Emerson, B., Wang, X., Ye, C., Yang, C., et al. (2012). Biodiversity soup: metabarcoding of arthropods for rapid biodiversity assessment and biomonitoring. Methods Ecol. Evol. 3, 613–623. doi: 10.1111/j.2041-210x.2012.00198.x
Keywords: natural regeneration, clearance, Bathymodiolus azoricus, monitoring, hard substratum, active and inactive vent sites
Citation: Cowart DA, Matabos M, Brandt MI, Marticorena J and Sarrazin J (2020) Exploring Environmental DNA (eDNA) to Assess Biodiversity of Hard Substratum Faunal Communities on the Lucky Strike Vent Field (Mid-Atlantic Ridge) and Investigate Recolonization Dynamics After an Induced Disturbance. Front. Mar. Sci. 6:783. doi: 10.3389/fmars.2019.00783
Received: 30 July 2019; Accepted: 04 December 2019;
Published: 09 January 2020.
Edited by:
Cinzia Corinaldesi, Marche Polytechnic University, ItalyReviewed by:
James Davis Reimer, University of the Ryukyus, JapanOlivier Laroche, University of Hawai‘i at Mānoa, United States
Copyright © 2020 Cowart, Matabos, Brandt, Marticorena and Sarrazin. This is an open-access article distributed under the terms of the Creative Commons Attribution License (CC BY). The use, distribution or reproduction in other forums is permitted, provided the original author(s) and the copyright owner(s) are credited and that the original publication in this journal is cited, in accordance with accepted academic practice. No use, distribution or reproduction is permitted which does not comply with these terms.
*Correspondence: Dominique A. Cowart, ZG9taW5pcXVlLmNvd2FydEBnbWFpbC5jb20=; Marjolaine Matabos, bWFyam9sYWluZS5tYXRhYm9zQGlmcmVtZXIuZnI=; Jozée Sarrazin, am96ZWUuc2FycmF6aW5AaWZyZW1lci5mcg==