 Andrew Carr-Harris
 Scott Steinback
- National Marine Fisheries Service, Northeast Fisheries Science Center, Woods Hole, MA, United States
Understanding how recreational angling effort responds to regulatory adjustment is important for rebuilding overfished stocks such as Atlantic striped bass Morone saxatilis. In this paper, we use stated preference choice experiment data to evaluate how individual angler participation may respond to changes in fishing trip characteristics, particularly the number of small, medium-sized, and trophy striped bass kept and released. We use these results to simulate the aggregate effect of alternative fishing policies in Massachusetts, Rhode Island, and Connecticut on angler welfare, angler effort, recreational fishing mortality, and female spawning stock biomass (SSB). We find that a wide range of economically efficient policies are available if the primary management objective is to control recreational fishing mortality. In contrast, we find that the range of efficient policies is quite narrow if the primary management objective is to protect female SSB. Additionally, only one of the 36 alternative policies analyzed; a one-fish harvest slot of 28″ to 36″, is expected to achieve a non-trivial reduction in both total and female spawning stock removals relative to the actual 2015 policy of one fish, 28″ or longer. Implementing a one-fish harvest slot of 28″ to 36″ comes with minimal costs in terms of foregone angler welfare due to the relatively low rate at which trophy striped bass in excess of 36″ are encountered.
Introduction
Daily bag and size limits are primary management tools used to control the impact of recreational angling on fish stocks. For these policies to be effective, angler effort responses must align with management objectives because any perceived change in fishing quality, policy-induced or otherwise, factors into angler decision-making processes and inevitably affects realized angler welfare, behavior, and contributions to fish mortality (Fenichel et al., 2013). Predicting angler effort responses to regulatory adjustment is difficult, however, because they depend on many factors, including the structure of prevailing and proposed regulations and the drivers of angler behavior. Nonetheless, inaccurately accounting for angler effort responses can result in policies that fail to meet intended conservation objectives or overly reduce the well-being of fishery participants. In this paper, we evaluate the drivers of recreational Atlantic striped bass Morone saxatilis angler behavior and use this knowledge to form reasonable expectations about the immediate effect of alternative bag and size limits on angler welfare, behavior, and the two conservation metrics most relevant for managers of this fishery: recreational fishing mortality and female spawning stock biomass (SSB).
Commonly called stripers, Atlantic striped bass are among the most prominent and heavily targeted recreational species in the United States. An iconic American species that can live for up to 30 years, grow up to 5 feet (152 cm) long, and weigh up to 75 pounds (34 kg), stripers have been described as “intelligent, crafty, [and] the ultimate challenge for a rod-and-reeler” (Russell, 2005). Striped bass are an anadromous and highly migratory species, which makes them vulnerable to heavy fishing pressure from boat- and shore-based anglers across a wide geographic range that spans from the Gulf of Maine to the Albemarle Sound in North Carolina. In 2017, for example, 17.8 million angler fishing trips targeted or caught Atlantic striped bass, which represents 9% of the 202 million marine angler fishing trips taken across the entire United States that year (National Marine Fisheries Service [NMFS], 2018). Perhaps unsurprisingly, recreational striped bass harvest by weight in 2017, and in many years past, was the largest among all recreationally targeted species in the United States (National Marine Fisheries Service [NMFS], 2015, 2016, 2017, 2018).
Consistently high levels of recreational Atlantic striped bass removals1 have contributed to a steady decline in female SSB throughout the last decade.2 The most recent stock assessment showed that in 2017, female SSB declined to a roughly 25-year low, falling far below its management threshold value and prompting managers to declare the Atlantic striped bass stock overfished (Northeast Fisheries Science Center [NEFSC], 2019). It also showed the estimated rate of total fishing mortality (F) in 2017 to be above its management threshold value, meaning that the stock is currently experiencing overfishing. These indications are particularly concerning because they come in the wake of a recent coast-wide harvest reduction mandate aimed at reducing F and rebuilding female SSB. In 2015, the Atlantic States Marine Fisheries Commission (ASMFC) mandated coastal and Chesapeake Bay states to take action that would reduce harvest by 25 and 20.5% relative to 2012 levels, respectively, in order to reach new fishing mortality reference points established in 2014 (Atlantic States Marine Fisheries Commission [ASMFC], 2014). Many states responded to the mandate by decreasing the recreational bag limit from two to one fish, 28″ or longer in total length in 2015. While the constrained bag limits achieved a 22.4% relative reduction in coast-wide harvest and successfully reduced total F to below the target level in 2015, they had little effect on female SSB in that year (Atlantic States Marine Fisheries Commission [ASMFC], 2016b, 2017). In 2016 and 2017, recreational bag and size limits remained unchanged in most coastal jurisdictions. During these years, total F increased and, apart from a marginal increase in 2016, female SSB continued its downward trajectory (Northeast Fisheries Science Center [NEFSC], 2019).
Given the limited success of recently constrained recreational bag limits at improving the Atlantic striped bass stock, a primary focus of this research is to evaluate the immediate biological consequences of alternative harvest size restrictions such as minimum length limits, harvest slots, and protected harvest slots.3 These types of size restrictions are employed by fishery managers to prevent recruitment overfishing, a condition in which the spawning stock is depleted to a level at which future recruitment declines strongly (Allen et al., 2013).
Recently, harvest slot (HS) policies have been proposed as alternatives to minimum length (ML) policies in some recreational fisheries for their ability to maintain more naturally occurring age structures, more positively affect spawning and recruitment potential, produce higher harvest numbers and trophy catch, reduce risk of population decline, and distribute sex-biased fishing exploitation more evenly across sexes (Arlinghaus et al., 2010; Koehn and Todd, 2012; Morson et al., 2017; Ayllón et al., 2019). To evaluate the long-term effect of ML and HS policies on fishery outcomes across a range of representative fisheries, Gwinn et al. (2015) simulated an age- and size-structured fish population model under multiple exploitation levels and life-history parameterizations. For each parameterization, the authors defined three management objectives (harvest-oriented, trophy-catch oriented, and a compromise between the two), chose the objective-meeting ML and HS policy, and calculated fishery and conservation metrics at that regulation. Most relevant to the current study are Gwinn et al.’s (2015) simulation results pertaining to the life-history parameterization of “large-bodied fish with slow growth, late maturation, and high levels of density-dependent recruitment compensation (e.g., striped bass M. saxatilis, Moronidae)”. Across the three management objectives, each evaluated under low and high levels of exploitation, they found that compared to ML policies, HSs led to more desirable long-term outcomes in terms of recreational harvest levels, trophy catch, spawning potential ratio, and the proportion of fecundity produced by the older population, but less desirable outcomes in terms of biomass yields. Despite the latter finding and taken together with other results, the authors posited that HS policies can produce more favorable compromises between fishing-quality and conservation outcomes than ML policies for a range of management objectives. Arising from these studies is a question that has yet to be addressed thoroughly in the current body of literature. That is, to what extent does aggregate angler effort and welfare vary with the imposition of ML versus HS policies? We address this question in the context of the recreational Atlantic striped bass fishery by quantifying the immediate economic and biological returns to several types of harvest size restrictions and in doing so, complement this stream of biological literature.
The recreational Atlantic striped bass fishery provides an excellent canvas for illustrating the immediate economic and biological tradeoffs created by harvest restrictions that protect trophy-sized striped bass, about 34″ (86 cm) in total length or longer, because these fish are almost exclusively part of the female spawning stock (Bigelow and Schroeder, 1953). Additionally, our empirical results indicate that anglers place a relatively high value on catching trophy stripers compared to other size-classes. To illustrate these tradeoffs, we build an aggregate demand model that links recreational striped bass fishing regulations in Massachusetts, Rhode Island, and Connecticut to individual, trip-level outcomes. The model is parameterized with the results of a choice experiment survey, where individual angler welfare and participation is conditional on trip cost and the expected number and size of striped bass kept and released. We simulate the fishery under actual and alternative 2015 regulations and compute expected differences in aggregate angler welfare and participation. Estimated changes in angler participation induced by alternative 2015 policies are used to compute expected impacts to total and mature female recreational fishing mortality.
Materials and Methods
Choice Experiment Survey
To understand the drivers of recreational striped bass angler behavior, we employed one of the most common stated preference methods for non-market valuation applied in recreational fisheries contexts: a discrete choice experiment (DCE). In a DCE question, respondents are presented with two or more hypothetical, multi-attribute alternatives that vary in attribute levels and asked to indicate or rank their most-preferred alternatives. Responses to these questions can be used to evaluate choice behavior, preferences, and willingness-to-pay values for marginal changes in attribute levels (Louiviere et al., 2000). Our DCE was embedded in a dual mode, i.e., mail and web-based, angler survey that was implemented during 2016. Each DCE question instructed respondents to indicate their first and second choice among three options: two striped bass fishing trips that varied in terms of catch, regulations, and trip costs, and a third non-fishing option. An example DCE question is displayed in Figure 1.
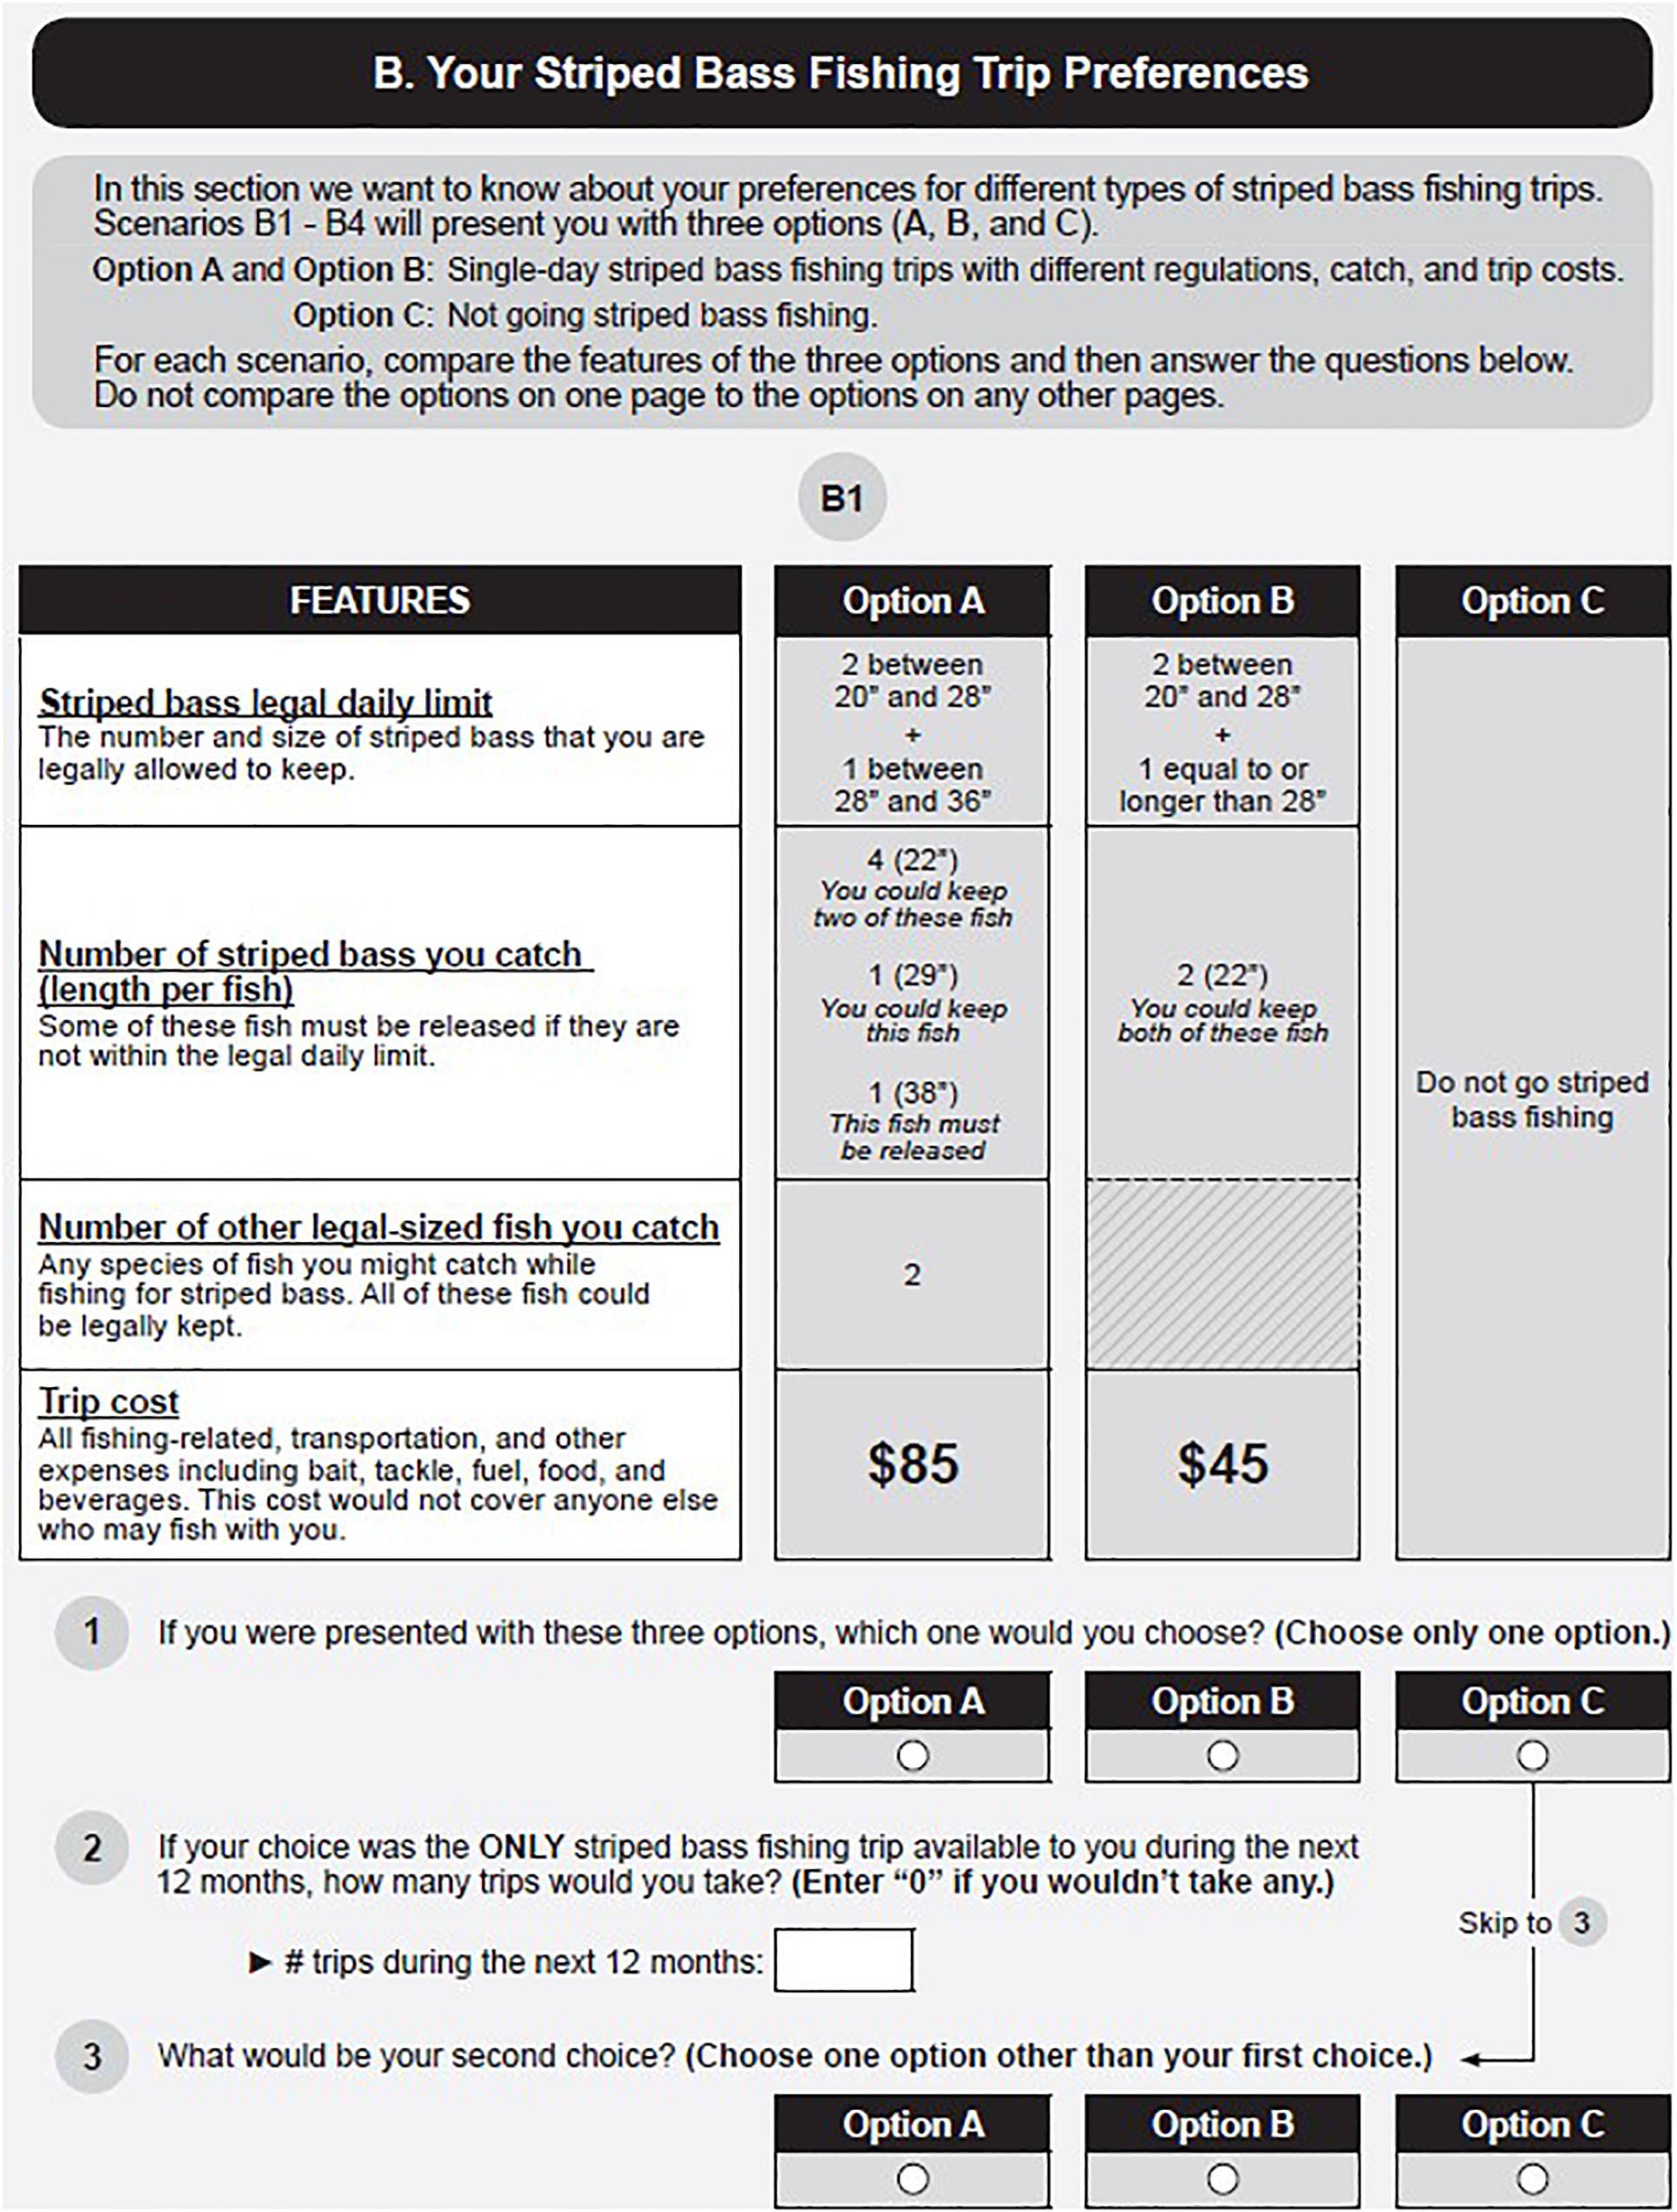
Figure 1. Example DCE question.
The attributes used to create the DCE questions are shown in Table 1. They included catch of 22″, 29″, and 38″ (i.e., small, medium, and trophy) stripers, catch of legal-sized fish other than striped bass, an indicator of a 30″ rather than a 28″ minimum size limit, an indicator of a 36″ maximum size limit, the bag limit for stripers longer than the minimum size limit (bag limit), the bag limit for stripers between 20″ and the minimum size value (small slot limit), and the trip cost. We selected striper regulatory attributes that would, to the extent possible, encompass the suite of regulations that have been employed by state agencies across the study region (Figure 2). Our fractional-factorial experimental design for main effects and selected interactions selected a subset of all attribute-level combinations that maximized the statistical efficiency of ensuing model parameters (Kuhfeld et al., 1994).4 We removed choice scenarios in which one trip option depicted a higher level of total striper catch and a lower trip cost than the alternative trip option, as well as those that included trip alternatives in which the number of striped bass kept and released could not be determined unambiguously.5 To ensure that DCE questions presented respondents with conceivable sets of regulations, we also removed scenarios in which the total possession limit, the sum of bag limit and small slot limit, was greater than three striped bass. The procedure yielded 72 choice scenarios, blocked into 18 unique sub-versions of the survey that each contained four DCE questions.
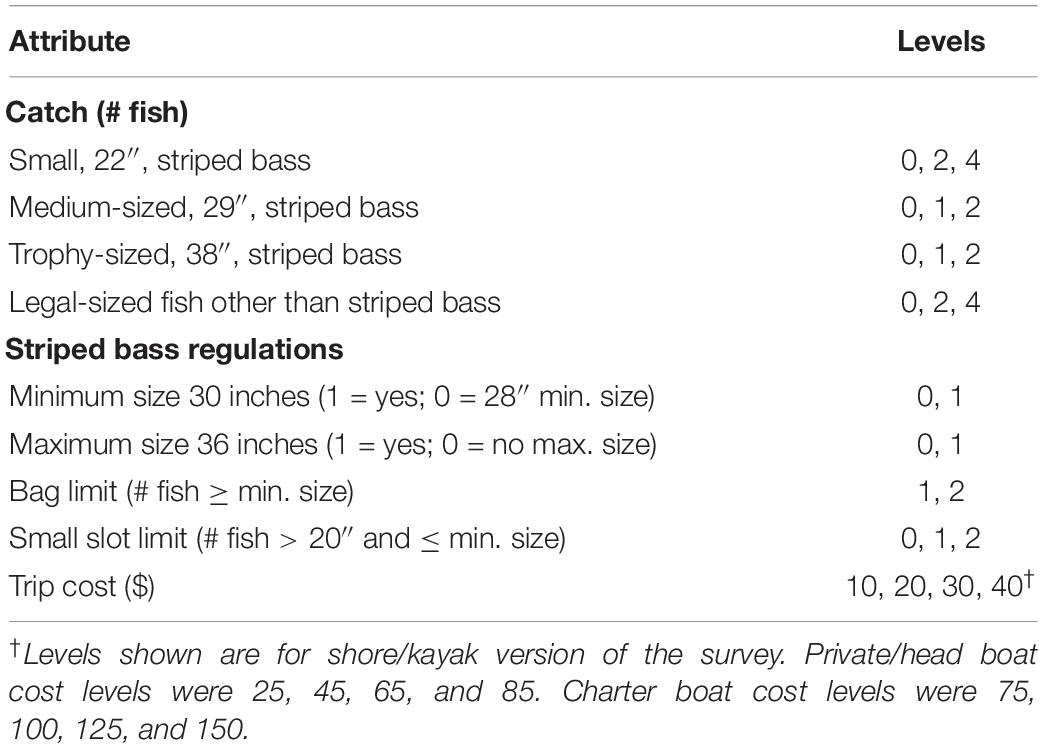
Table 1. Choice experiment attributes and levels.
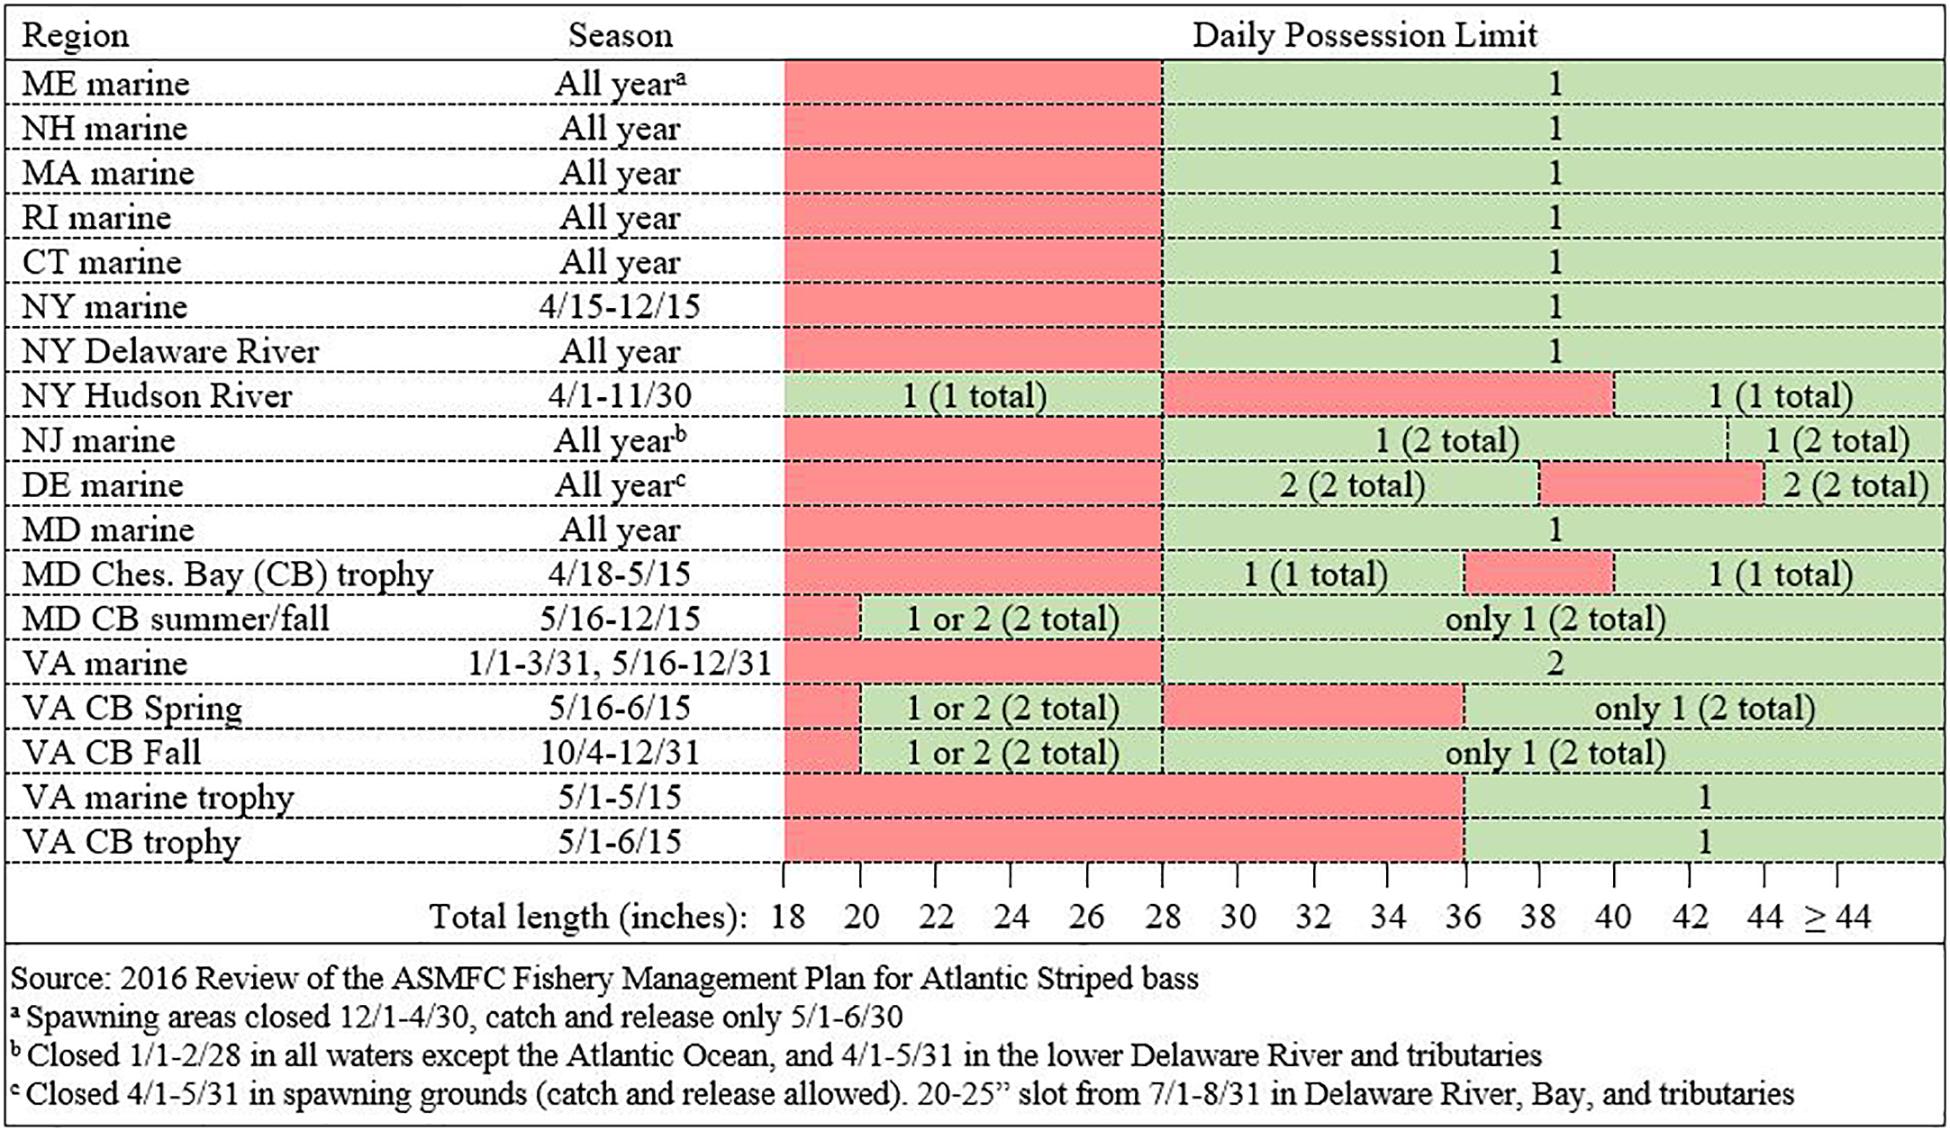
Figure 2. 2015 recreational striped bass regulations.
Prior to implementation, we tested the survey instrument by conducting two focus group sessions each in Massachusetts, New York, and Maryland with recreational striped bass anglers. We intentionally selected focus group participants who differed in terms of gender, age, and striped bass fishing experience to obtain feedback from a diverse mix of anglers. Based on participant feedback, we adjusted the survey language to account for regional differences in dialect, ensuring that survey questions would be consistently interpreted. We also used focus group feedback to design contextually realistic and straightforward choice experiment questions. For example, focus group participants who mostly fish for striped bass from shore had trouble choosing among trip options whose cost reflected a private or charter boat fishing trip. Failing to account for this source of cognitive burden would have threatened the reliability of the DCE data and potentially dampened the survey response rate because, unlike many other recreational species in the region, striped bass are heavily targeted by both boat- and shore-based anglers.6 Therefore, in final versions of the DCE, we displayed trip cost levels customized to respondents’ primary method of striped bass fishing, if known.7 All web respondents answered DCE questions containing appropriate trip costs because we linked these costs to a preceding survey question that solicited primary fishing mode information. However, some mail survey respondents who did not complete the telephone pre-screening interview (discussed in section “Survey Implementation and Response”), in which fishing mode information was collected, may have answered DCE questions that displayed atypical trip cost levels.
Survey Implementation and Response
Survey participants were selected at random from a database comprised of all recreational anglers who were licensed or registered for saltwater fishing during 2015 in any of the ten coastal states from Maine to Virginia (Figure 3).8 We used a stratified random sampling approach to reach the target population, defined as recreational anglers who fish for striped bass along the coast from Maine to Virginia. From each state license or registration frame, we drew survey participants in proportion to that state’s contribution to the total number of recreational striped bass fishing trips taken during 2015 across the study region (Table 2). Closely following the methods outlined in Dillman et al. (2009), we made up to six contacts with an original sample of 2,200 anglers: a telephone pre-screening interview, an advance letter or email invite, an initial survey mailing or email invite, a reminder letter or email, a second survey mailing or email invite, and a final reminder letter or email9.
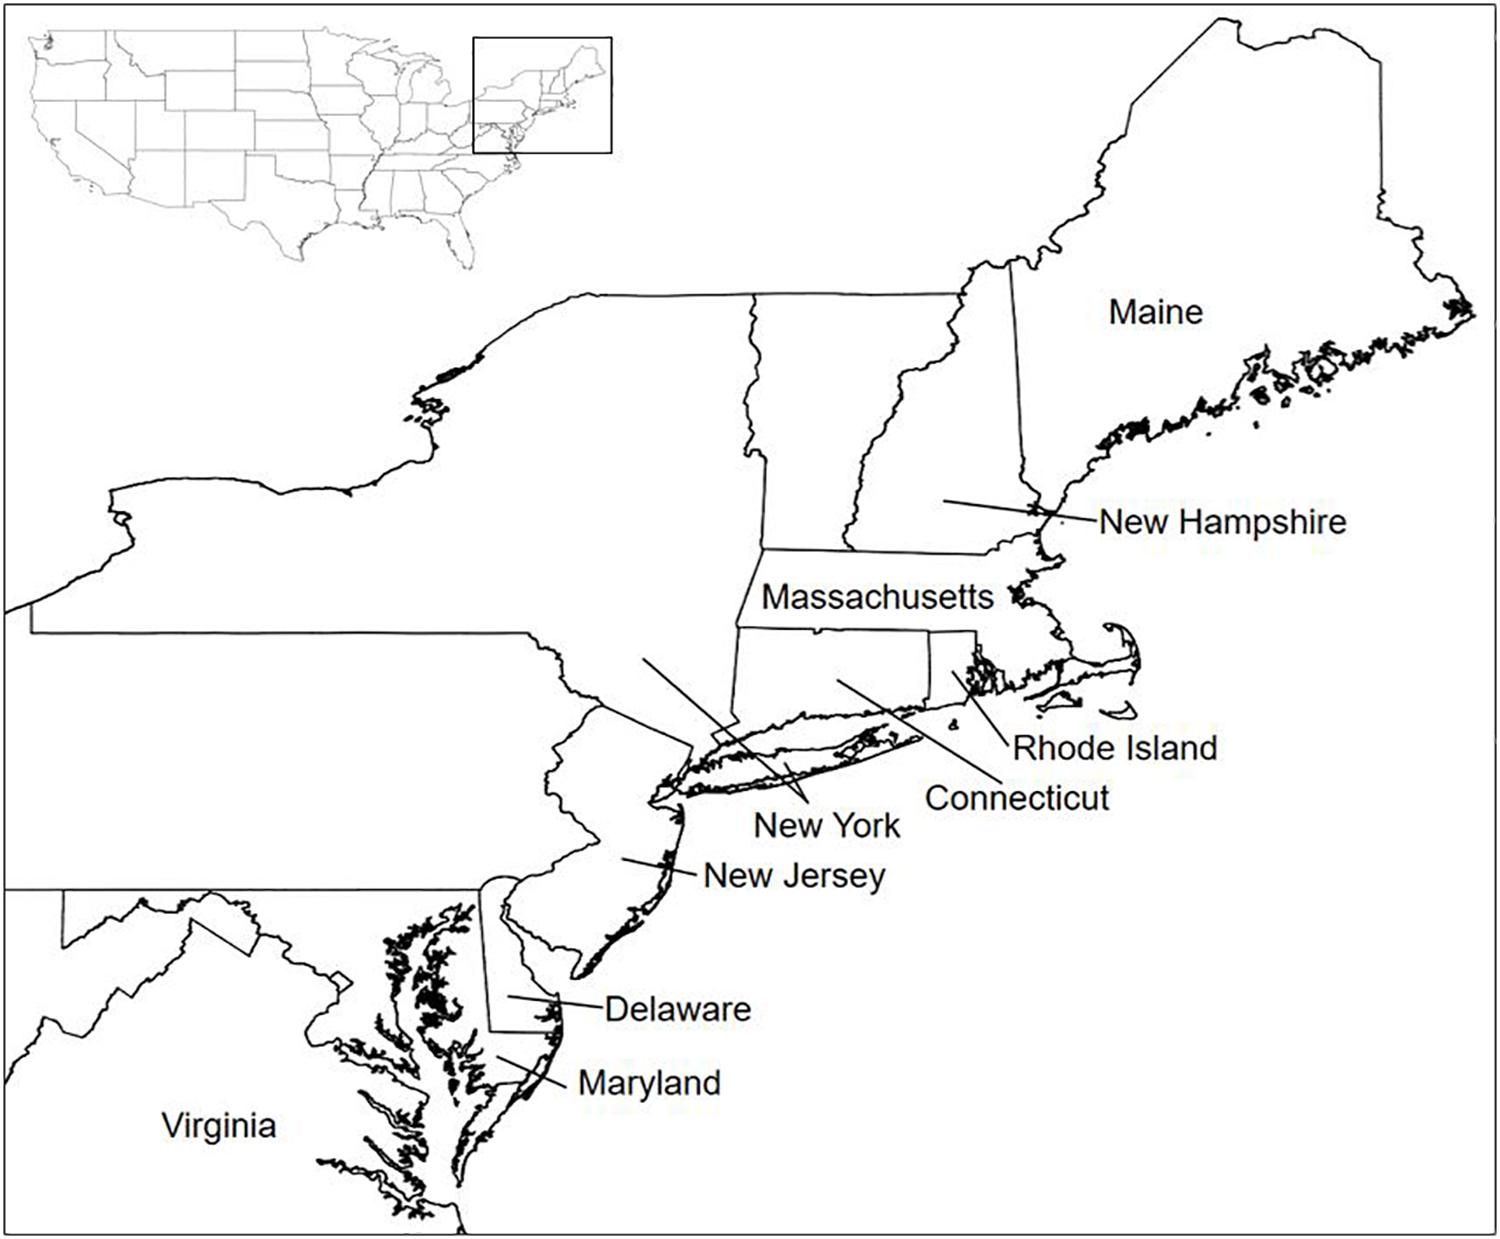
Figure 3. Map of the 10 coastal states included in the survey sampling frame. Simulation model is calibrated to 2015 fishing conditions in Massachusetts, Rhode Island, and Connecticut.
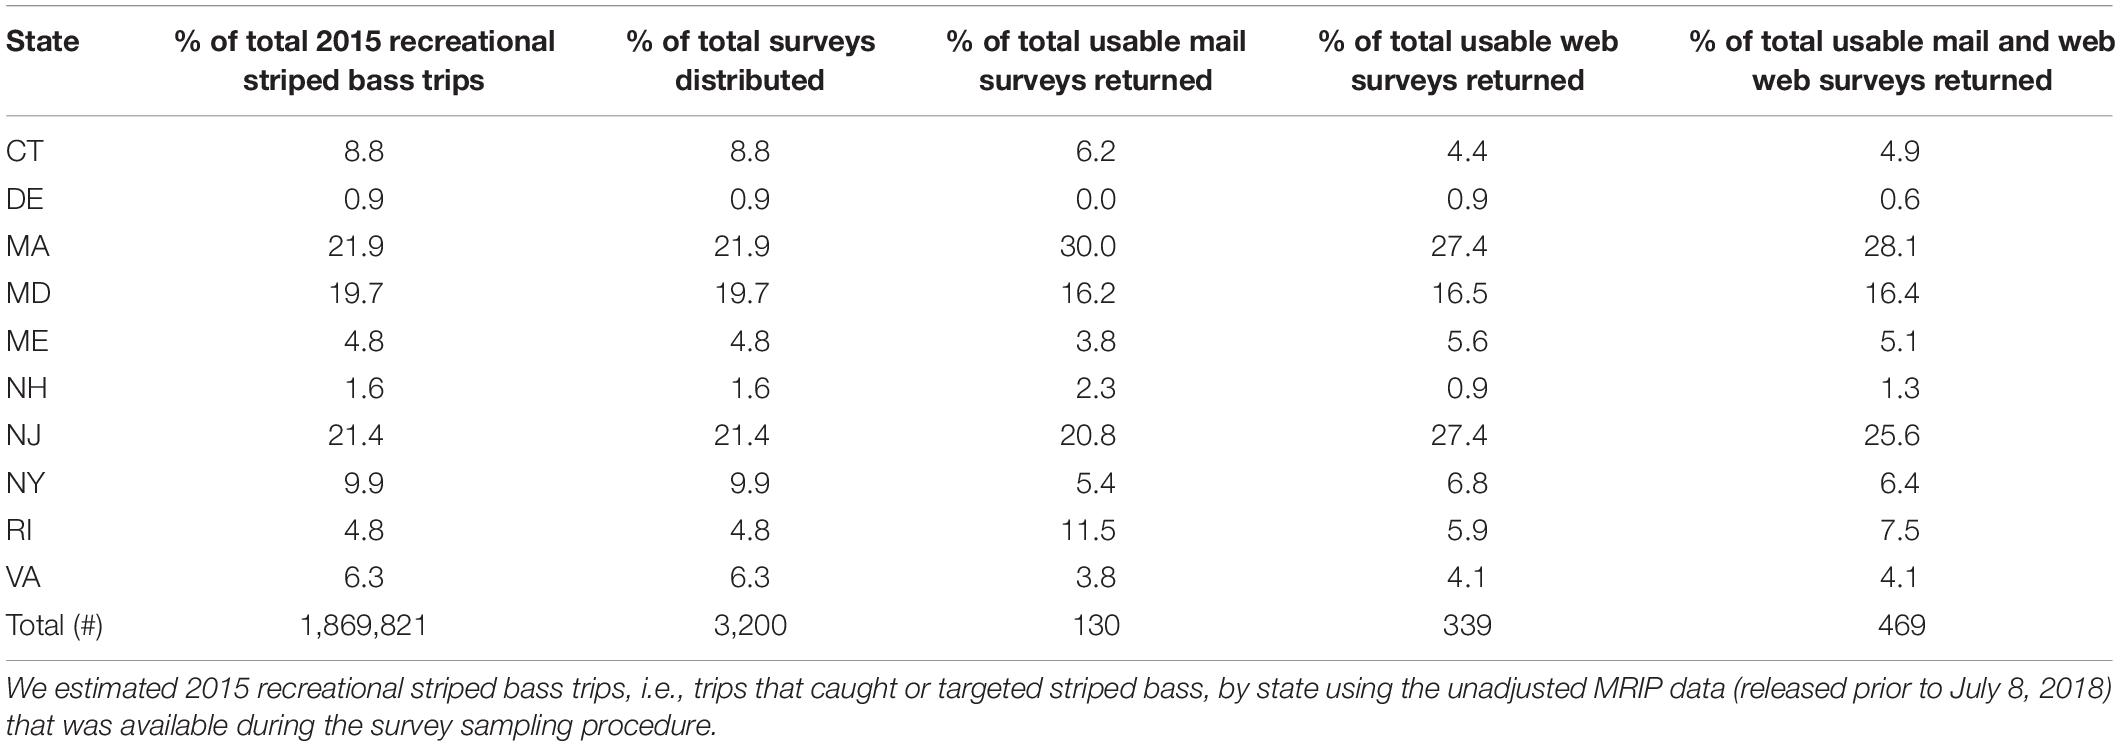
Table 2. 2015 striped bass trips, surveys distributed, and surveys returned by state.
The first potential point of contact with survey participants, a telephone pre-screening interview, allowed us to determine eligibility and thus focus survey efforts on anglers with relevant fishery experience. We attempted to call all of the licensees with telephone contact information (2,085). Based on responses to the first question of the telephone survey, we deemed ineligible those who indicated not having fished for striped bass within the past three years and excluded these anglers from subsequent solicitation procedures. Of the 577 people who completed the pre-screening interview, 325 were deemed eligible to participate in the survey. After establishing eligibility, we solicited anglers’ primary method of striped bass fishing, total number and targeted striped bass fishing trips taken in the past 12 months, likelihood of striped bass fishing next season, age, and income in order to assess and potentially correct for systematic differences between sample anglers survey non-respondents (discussed in section “Sample Characteristics”). Then, we invited those who completed the interview to participate in the full version of the angler survey. If willing to participate, respondents indicated their preference for receiving a mail, a web, or both a mail and a web version of the survey. The telephone pre-screening interviews proved effective at boosting response rates; the survey completion rate for unscreened and screened anglers was 29 and 55%, respectively. Due to a lower than expected response rate, we drew an additional, web-only sample of 1,000 anglers. These anglers received an advance email invitation to participate in the survey, a first reminder email, and a final reminder email.
The overall survey response rate, which excludes ineligible participants, the deceased, those with non-working email addresses, and those with undeliverable mailing addresses, is 22.7%. When adjusted for estimated ineligibility based on the results of the telephone pre-screening interview, the survey response rate was approximately 35%.
From the full sample of survey respondents, we removed those who indicated not having fished for striped bass within the past three years and focused instead on eliciting the preferences of anglers who are more likely to be affected by changes in striped bass fishing conditions. We also removed respondents who exhibited protest behavior in the form of always selecting the non-fishing option as their most-preferred option despite considerable variation in attribute levels across choice scenarios. Additionally, for reasons discussed in section “Choice Experiment Survey,” we excluded mail survey respondents who answered DCE questions containing trip cost levels that did not reflect these respondents’ indicated primary mode of striped bass fishing. Our final estimation sample consists of 469 anglers. Table 2 shows state-level contributions to the total number 2015 recreational striped bass trips taken across the study region, the total number of angler surveys distributed, and the number of usable web and mail surveys returned.
Sample Characteristics
Table 3 displays demographic and fishing-related information about our sample. It also includes results from two recent angler surveys to which we compare the characteristics of our sample. One of these surveys was directed at licensed recreational striped bass anglers in Connecticut and Massachusetts (Murphy et al., 2015), and the other was directed at the United States population of recreational anglers (Lovell et al., 2016). The striped bass anglers in our sample have a mean age of 54.3, which is consistent with the median age of sampled anglers from Murphy et al. (2015), and spent an average of 26.7 days fishing for saltwater species in the past 12 months. These characteristics are comparable to the nationwide statistics in Lovell et al. (2016). In contrast to the population of United States recreational anglers at large, the anglers in our sample are predominantly more male, slightly more affluent, and have attained higher levels of education. Gautum and Steinback (1998) found similar socioeconomic differences between anglers who indicated fishing for striped bass and all other anglers among a sample of more than twenty thousand anglers that were interviewed after fishing on a private or charter boat. Like those in Murphy et al. (2015), the recreational striped bass anglers in our sample have been fishing for striped bass for about 22 years and spent an average of 14.7 days fishing for striped bass during the past 12 months. Finally, more than 90% of the anglers in our sample fish for striped bass primarily from the shore (36.2%) or from a private boat (54.6%).
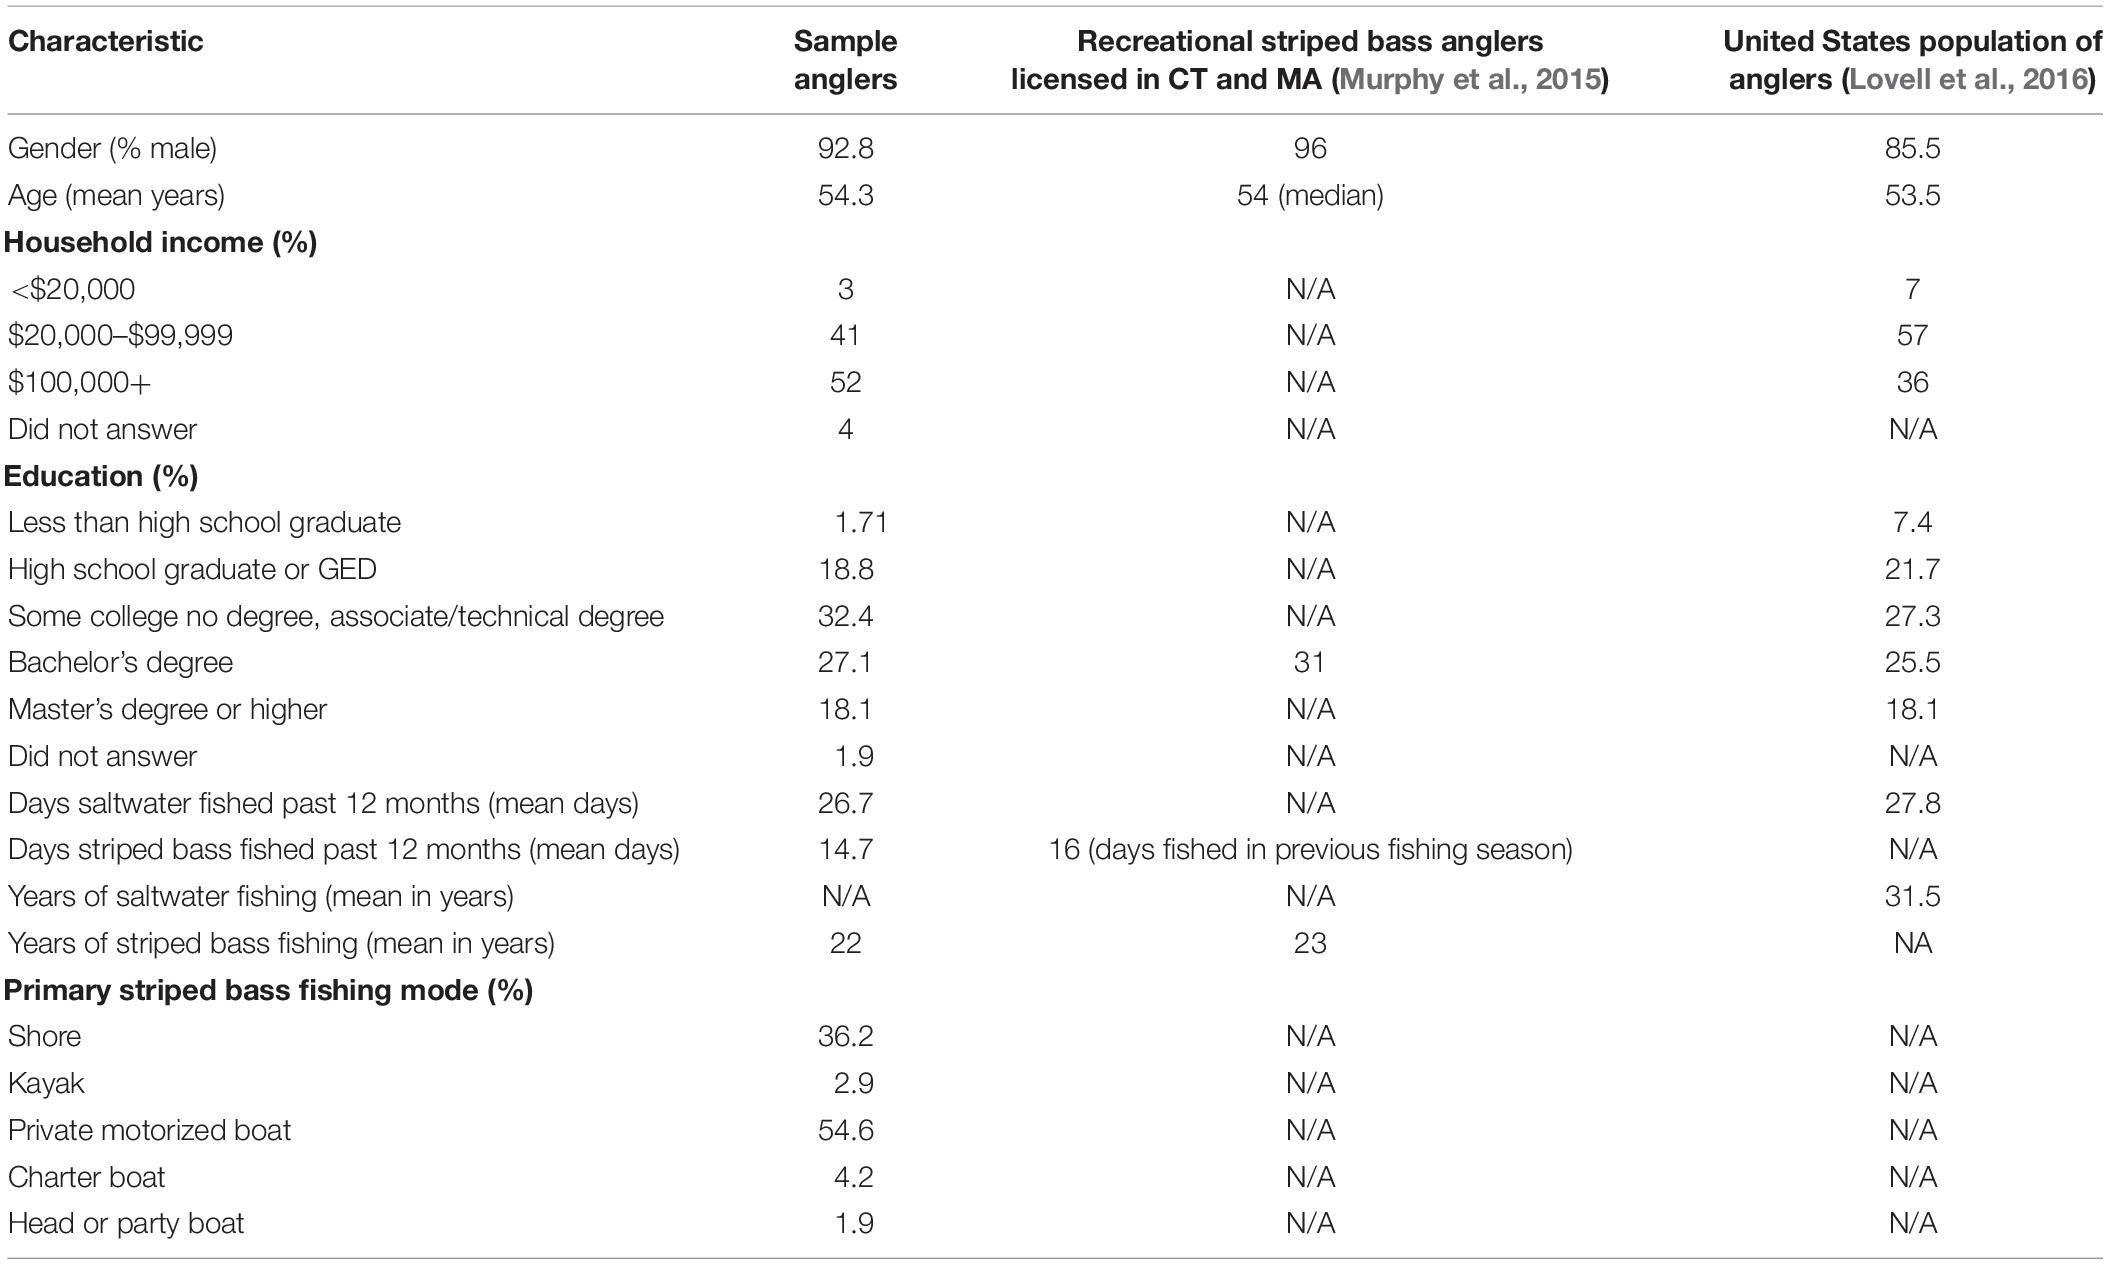
Table 3. Characteristics of recreational striped bass anglers and the United States population of anglers.
As noted in section “Survey Implementation and Response,” before implementing the survey we conducted telephone pre-screening interviews that collected fishing-related and sociodemographic information from potential survey respondents. After comparing this information between sample anglers and survey non-respondents,10 we found no significant differences in terms of days spent saltwater fishing in the past 12 months or primary striped bass fishing mode. However, sample anglers and survey non-respondents differed significantly in days spent fishing for striped bass in the past 12 months, age, income, and likelihood of fishing in the next 12 months. If these differences influenced both the propensity to respond to the survey and the preference parameters estimated using the realized sample of respondents, then the latter would be biased (Groves, 2006). We tested for non-response bias by comparing estimates from our preferred behavioral model specification with non-response adjusted estimates. First, we estimated the effect of primary fishing mode, income, age, and likelihood of fishing on the propensity to respond to the survey using a binomial logit model.11 Then, we used the inverse of sample anglers’ predicted response propensity as weights in our preferred behavioral model specification. Non-response adjusted estimates of mean preference parameters, displayed in Supplementary Table A3, were consistent with those presented in the main paper. We take this as evidence that our main results do not suffer substantively from non-response bias.
Stated Preference Choice Experiment Model
Random utility theory suggests that an angler will choose to take a fishing trip if it provides maximum utility over all alternatives available to him or her in a given choice scenario. We analyzed our DCE data using random utility models (McFadden, 1973), which decompose the overall utility angler n receives from fishing alternative j (j = A,B,orC)in choice scenario t (t = 1,…,T) into two component parts: Vnjt, a function that relates observed fishing trip attributes xnjt to utility, and εnjt, a random component capturing the influence of all unobserved angler-specific factors on utility. Angler utility can be expressed as
where β is a vector of preference parameters measuring the average part-worth utility contribution from each trip attribute across the sample of anglers, μn is a vector of random terms with zero mean that represent unobserved angler-specific deviations in tastes relative to the average tastes across the sample, and εnjt is an independent and identically distributed Type I extreme value error term.
We estimated random parameters logit (RPL) models, which allow for unobserved angler-specific deviations in tastes for some or all of the observed trip attributes. This feature of the RPL model is operationalized by specifying preference parameters for these attributes to be randomly distributed over the sample. That is, for each of these attributes we estimated both a mean and deviation parameter, the latter a diagonal element of the variance-covariance matrixΓ that measures heterogeneity around the mean. Allowing for such random taste variation distinguishes the RPL model from the basic multinomial logit (MNL) model, in which preferences are assumed uniform across a sample of decision makers. It also resolves some behavioral limitations of the MNL model, including the independence of irrelevant alternatives (IIA) property and the assumption that unobserved factors that influence decisions are uncorrelated across alternatives and over repeated choice situations (Train, 2003). In essence, the RPL model assumes anglers use the same idiosyncratic preferences to evaluate the relative utilities of alternatives in and across choice situations.
We made two additional modifications to our RPL model based on the nature of our DCE data. First, we treated the data as a panel because respondents answered up to four choice questions. Second, we treated the response variable as a full ranking of alternatives, exploiting additional information obtained from asking respondents to select a first- and second-most preferred trip option in each choice scenario. With full preference rankings, each choice scenario can be decomposed, or “exploded,” into J-1 statistically independent pseudo-observations, thereby increasing the amount of information gleaned from each respondent. Compared to those that use unranked data, choice models estimated using ranked data have been shown to improve the precision of estimated utility parameters (Chapman and Staelin, 1982). With these modifications, we arrived at a panel rank-ordered RPL model. Details about estimating this model can be found in Lew and Larson (2012).
We assumed Vnjt to be a linear additive function of the number of small, medium, and trophy stripers kept and released (Smallkeep, Mediumkeep, Trophykeep, Smallrelease,Mediumrelease, and Trophyrelease),12 the number legal-sized fish other than striped bass caught (Othercatch), the trip cost (Cost), and a dummy variable indicating the no-fishing alternative (Opt_out). Vnjt also includedTotalbaglimit, which equals the sum of legal-sized striped bass that can be kept in each trip alternative, as well as three other regulatory variables that represent catch-and-release restrictions on one or more of the three striper size-classes examined. The first of these, Nosmall, is a dummy variable that equals one if the “small slot limit” attribute equals zero. This variable captures the relative effect a catch-and-release restriction on stripers shorter than 28″ compared to a catch-and-release restriction on stripers shorter than 20″. We then interacted Nosmall with a dummy variable for the “minimum size 30 inches” attribute to create Nosmallormedium, which captures the additional utility derived from a two-inch increase in the minimum size limit from 28″ to 30″ after an initial, eight-inch increase from 20″ to 28″.13 Lastly, we included in the utility functionNotrophy, a dummy variable for the “maximum size 36 inches” attribute that captures the relative effect of a catch-and-release restriction on stripers longer than 36″. Thus, the utility angler n receives from the jth trip alternative in choice scenario t is specified as:
We specified parameters on the striped bass keep and release variables to be normally distributed across the sample and treated the other parameters as fixed. Alternative model specifications in which all non-cost parameters were specified to be normally distributed yielded qualitatively similar results but less precise coefficient estimates. Additionally, we allowed for covariation among random parameters by estimating both the diagonal and lower diagonal elements of the variance-covariance matrix Γ. These models outperformed those that did not allow for random parameter covariation according to a comparison of Akaike Information Criterion (AIC) statistics. Thus, our RPL model specification allows for correlation in individual anglers’ preferences for keeping and releasing striped bass as well as heterogeneity in these preferences across the sample.
Simulation Model Procedure
To evaluate expected impacts of alternative 2015 striped bass regulations on angler welfare and participation, total recreational removals, and mature female recreational removals, we integrated estimates from our preferred behavioral model specification and historical catch and effort data into an aggregate demand model. Similar aggregate demand models have been employed for the summer flounder Paralichthys dentatus (Holzer and McConnell, 2017) and Atlantic cod Gadus morhua and haddock Melanogrammus aeglefinus (Lee et al., 2017) recreational fisheries in the Northeast, but these models explicitly assumed that the utility anglers derive from keeping and releasing fish is constant across fish size-classes. This assumption is untenable in the context of the recreational Atlantic striped bass fishery given our findings in section “Results” which indicate that angler utility derived from keeping or releasing striped bass increases considerably with the size of fish caught. Thus, we expanded on the framework provided by Holzer and McConnell (2017) and Lee et al. (2017) by incorporating keep and release utility parameters for small, medium-sized, and trophy fish in the model. This means that a policy change affects angler welfare, behavior, and subsequent levels of recreational fishing mortality not only by influencing the rate at which legally harvestable fish are encountered, as in Holzer and McConnell (2017) and Lee et al. (2017), but also by influencing the proportion of small, medium-sized, and trophy fish that constitute the legally harvestable stock.
We simulated the 2015 recreational striped bass fishery at the trip (choice occasion) level in Massachusetts, Rhode Island, and Connecticut, which together accounted for about 32% of the estimated 20,282,820 recreational striped bass fishing trips taken during 2015 in the ten coastal states from Maine through Virginia (NMFS-FSD, 2019). We selected these states because in 2015, they accounted for the majority, about 89%, of total striped bass catch in the North Atlantic coastal region (Maine through Connecticut) (NMFS-FSD, 2019). Simulated choice occasions were first assigned a level of striper catch that was randomly drawn from a catch-per-trip probability distribution (negative binomial) fitted using 2015 Marine Recreational Information Program (MRIP) catch data. We excluded from these data trips that recorded catching 20 or more stripers, which accounted for 1.2% of the total number of directed striped bass trips taken in 2015 across the study region. Catch-per-trip probability distributions for boat- and shore-based fishing trips are shown in Figure 4A.14 After assigning striper catch levels, the size of each striper caught was randomly drawn from a catch-at-length probability distribution created using a combination of MRIP and state-level volunteer angler logbook (VAL) data collected by Maine’s VAL Program, Connecticut’s Volunteer Angler Survey Program, and Massachusetts’ Sportfish Data Collection Team Program. We fitted a mixture of two normal distributions to these data, explicitly accounting for the underlying population structure which, in 2015, was comprised in part by a strong 2011 year-class. We then used predicted catch-at-length densities to calculate the probability of an angler catching a length-l striped bass. The resulting 2015 catch-per-trip probability distribution is shown in Figure 4B.
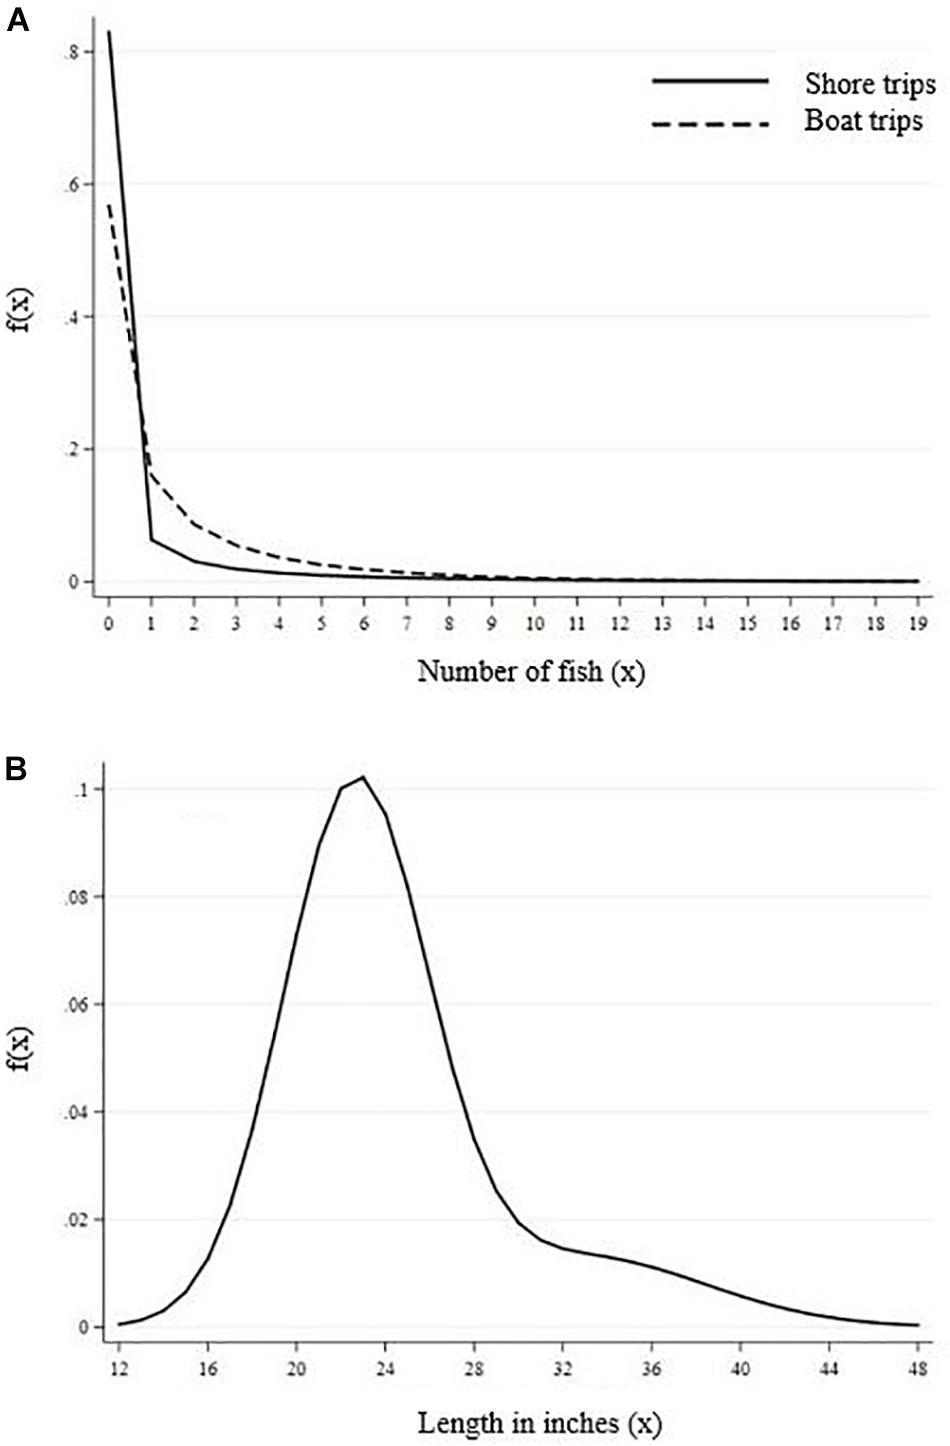
Figure 4. 2015 striped bass catch-per-trip (A) and catch-at-length (B) probability distribution.
Next, we imposed actual and counterfactual regulations on each choice occasion that, along with catch levels, determined the realized number and size of striped bass kept and released. These fish were allocated into one of six bins – small (≤25″) keep or release, medium (26″–34″) keep or release, and trophy (≥35″) keep or release – that correspond to the choice experiment attributes, but we retained catch lengths to calculate age, sex, and maturity distributions of recreational removals. Lastly, choice occasions were assigned a representative, mode-specific trip cost derived from the most recent angler expenditure survey in which this information was available (Lovell et al., 2013).15 The probability of observing each choice occasion j, conditional on the number and size of striped bass kept and released and the trip cost, was calculated as
where the vector β includes the β1 through β6 and β8 parameters from Eq. (2).
We calculated pj under both actual and alternative regulatory scenarios and used these values to determine expected changes in recreational fishing mortality. The expected number of length-l striped bass kept (released) on each choice occasion is the probability-weighted number of length-l fish kept (released). Summing these values across choice occasions gives the total number of length-l striped bass harvested and released under each policy scenario. We applied the 0.09 discard mortality rate used in the striped bass stock assessment to releases-at-length to determine dead releases-at-length. Adding dead releases-at-length to harvest-at-length provides removals-at-length; total recreational removals is the sum of these values across length-classes. To calculate mature female removals, we first converted removals-at-length to removals-at-age. We determined the proportion of length l stripers that are age a using combined data from three separate 2015 striped bass age-length keys provided each by Massachusetts’ Division of Marine Fisheries, New York’s Department of Environmental Conservation Division of Marine Resources, and Rhode Island’s Division of Fish and Wildlife. These proportions were smoothed using a LOWESS (Cleveland, 1979) and are shown in Figure 5. We then multiplied removals-at-age by stock assessment-based indices of female sex proportions-at-age and proportions-at-age of mature females and summed these values across age-classes. We translated total and mature female recreational removal numbers-at-age to weights-at-age using stock assessment conversion indices.
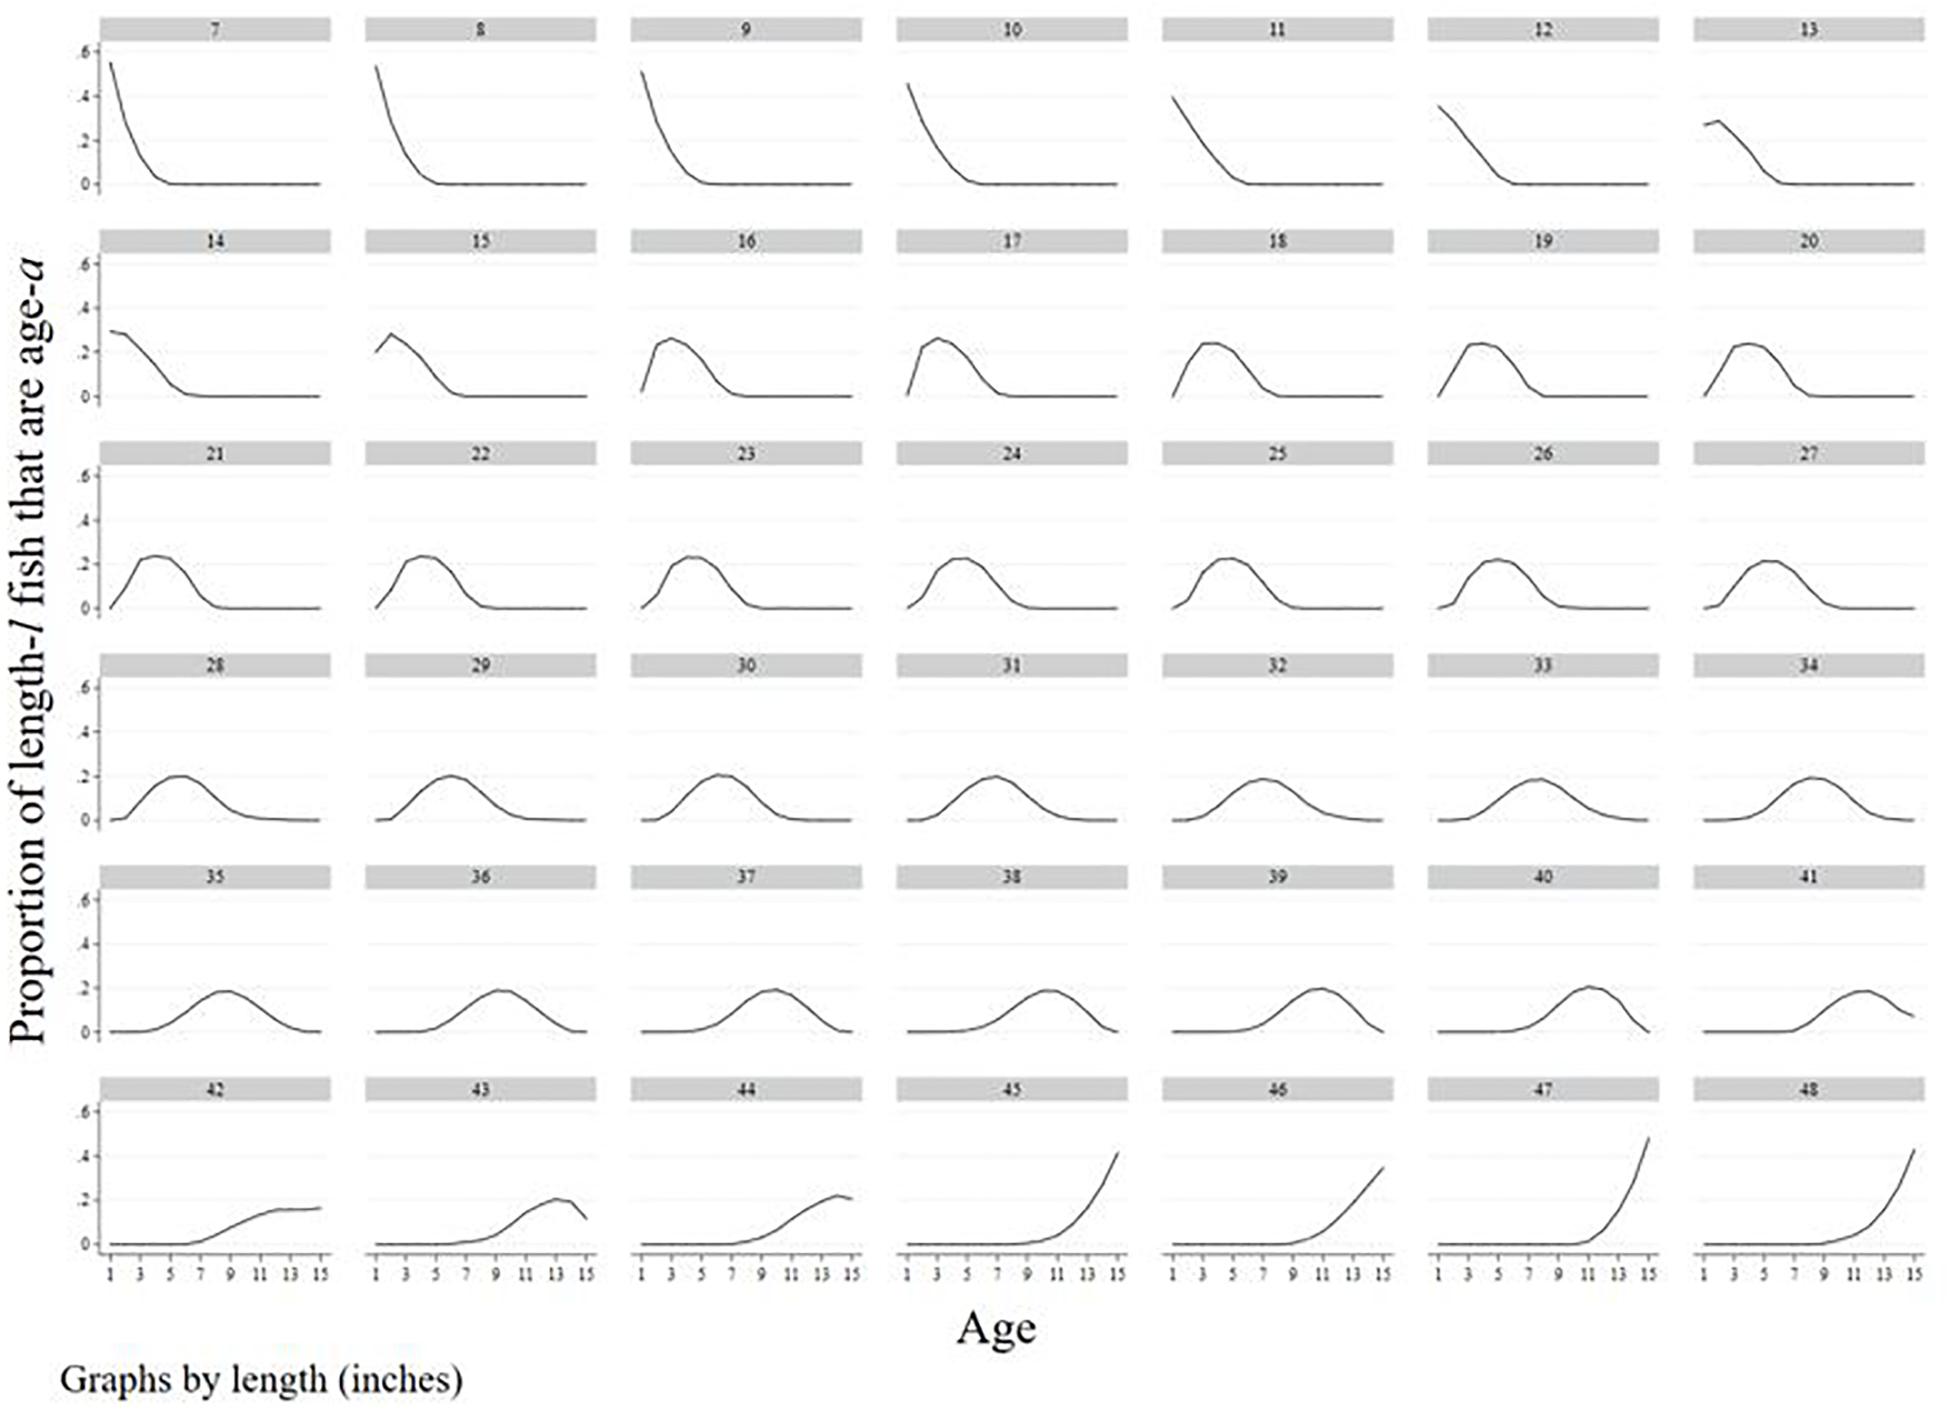
Figure 5. 2015 striped bass length-age conversions by length.
Since a major focus of this article is to evaluate the expected impacts of alternative size restrictions on female SSB, it is pertinent to explore the relationship between striped bass length and fecundity. Using the LOWESS-smoothed 2015 striped bass age-length key data, the female sex proportions-at-age index, and the proportion mature-at-age for females index, we calculated proportions of mature females-at-length and plot these results in Figure 6. The figure shows that striped bass fecundity increases exponentially with length up to about 32″, with the most dramatic increase occurring between 24″ and 32″. At lengths 32″ and longer, fecundity increases at a decreasing rate and nearly all striped bass are mature females.
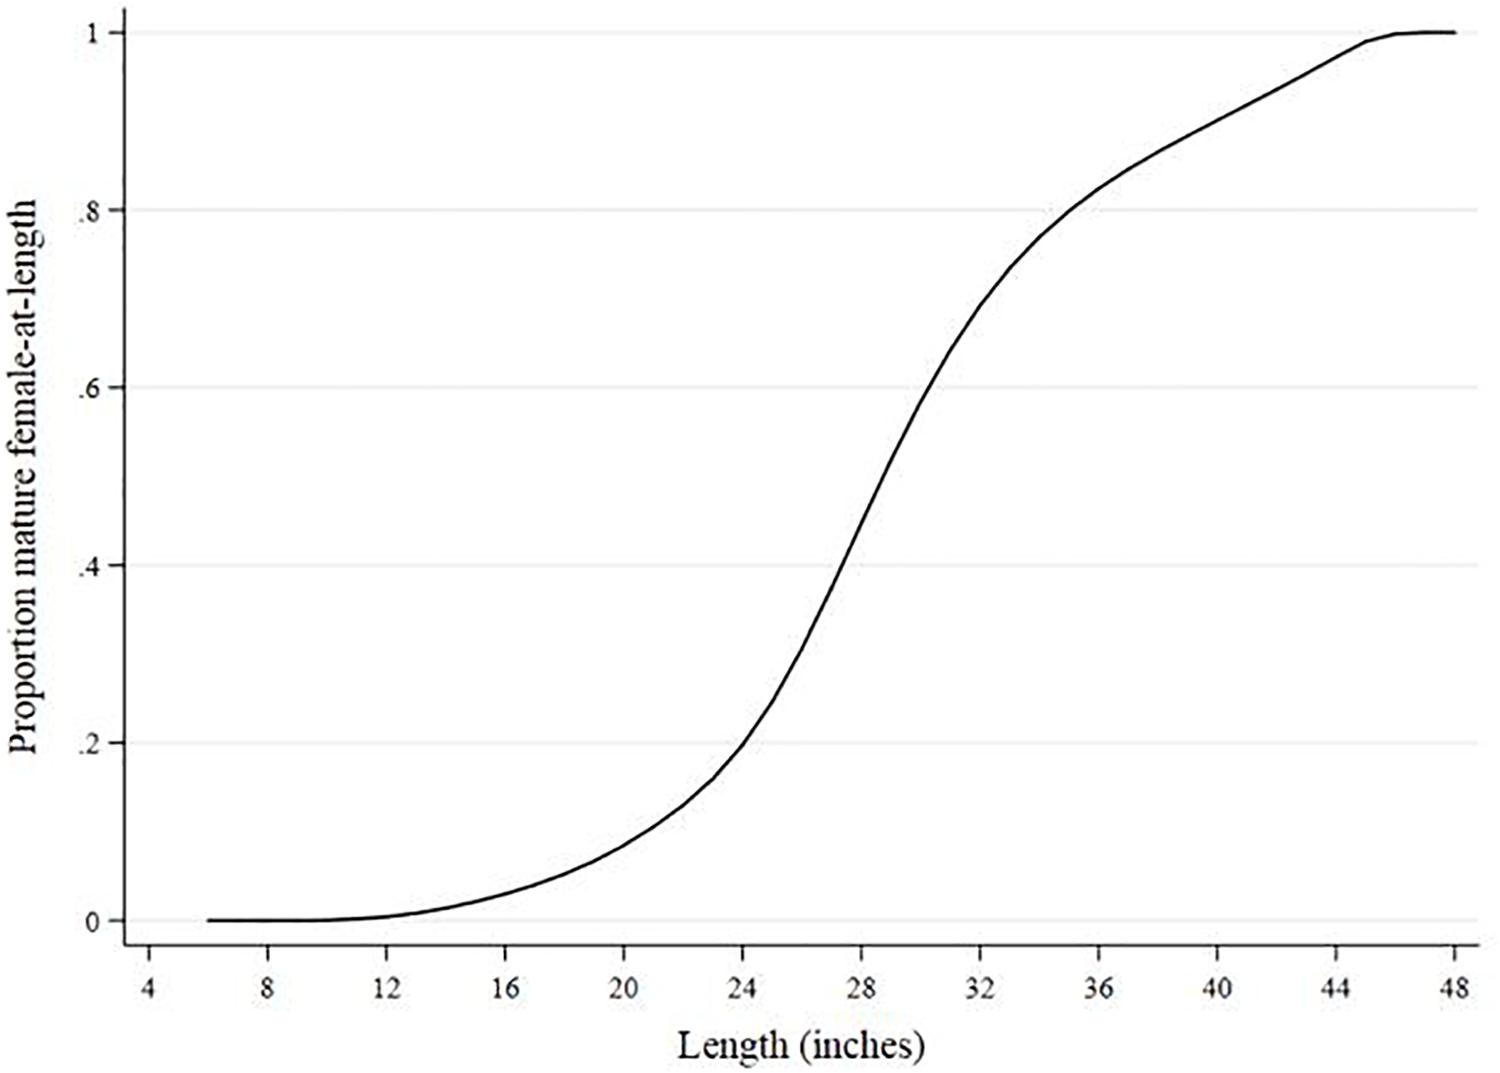
Figure 6. 2015 striped bass proportions mature female-at-length.
To measure the effect of alternative recreational striped bass regulations on angler welfare, we computed compensating variation (CV) for each choice occasion. In our case, CV indicates the level of compensation required to hold anglers’ expected utility constant after a policy-induced change in fishing trip quality. Following Haab and McConnell (2002), CV for choice occasionj is
where and index anglers’ expected utility under current and changed regulatory conditions, respectively. We summed CVj across all choice occasions to infer the aggregate welfare effect of alternative regulations.
We calibrated the simulation model by randomly selecting a subset of choice occasions such that under the actual 2015 striper possession limit of one fish 28″ or longer approximated the number of fishing trips taken in Massachusetts, Rhode Island, and Connecticut during 2015. This process was employed using samples of shore- and boat-based choice occasion separately given differences in costs and catch-per-trip levels between the two fishing modes. The calibrated model predicted the occurrence of 4,045,157 shore- and 2,427,208 boat-based choice occasions, which closely matches the 4,045,181 and 2,427,178 respective trips taken from each mode in Massachusetts, Rhode Island, and Connecticut during 2015.
Before turning to our results, it is necessary to discuss some important assumptions about angler harvest behavior that we incorporated in the simulation procedure. First, we assumed that simulated anglers harvest legal-sized striped bass as they are encountered until the bag limit is reached and discard subsequent catch. In other words, simulated anglers do not selectively harvest or high-grade.16 Based on anecdotal and empirical evidence, however, we did incorporate volunteer release behavior, the practice of releasing legal-sized fish despite not reaching the bag limit.17 To do this, we randomly selected choice occasions and reclassified a pre-specified portion of harvestable striped bass as recreational releases. Although this reclassification affected expected recreational fishing mortality, it did not affect expected utility, participation, or welfare because we assumed the utility anglers derive from voluntarily releasing a harvestable striped bass is no less than that derived from keeping that same fish.18 We specified the overall number of voluntary released striped bass to be 40% of total number of legally harvestable fish caught, a conservative estimate based on calculations from Connecticut Volunteer Angler Survey (VAS) Program data that span the period 2013–2016.19
Results
Behavioral Model Results
We estimated our panel rank-ordered mixed logit model using maximum simulated likelihood estimation (Train, 2003) in NLOGIT version 5 and display the results in Table 4. Model 1 is a restricted version of Eq. (3) which excludes the four regulatory variables that are included in Model 2.
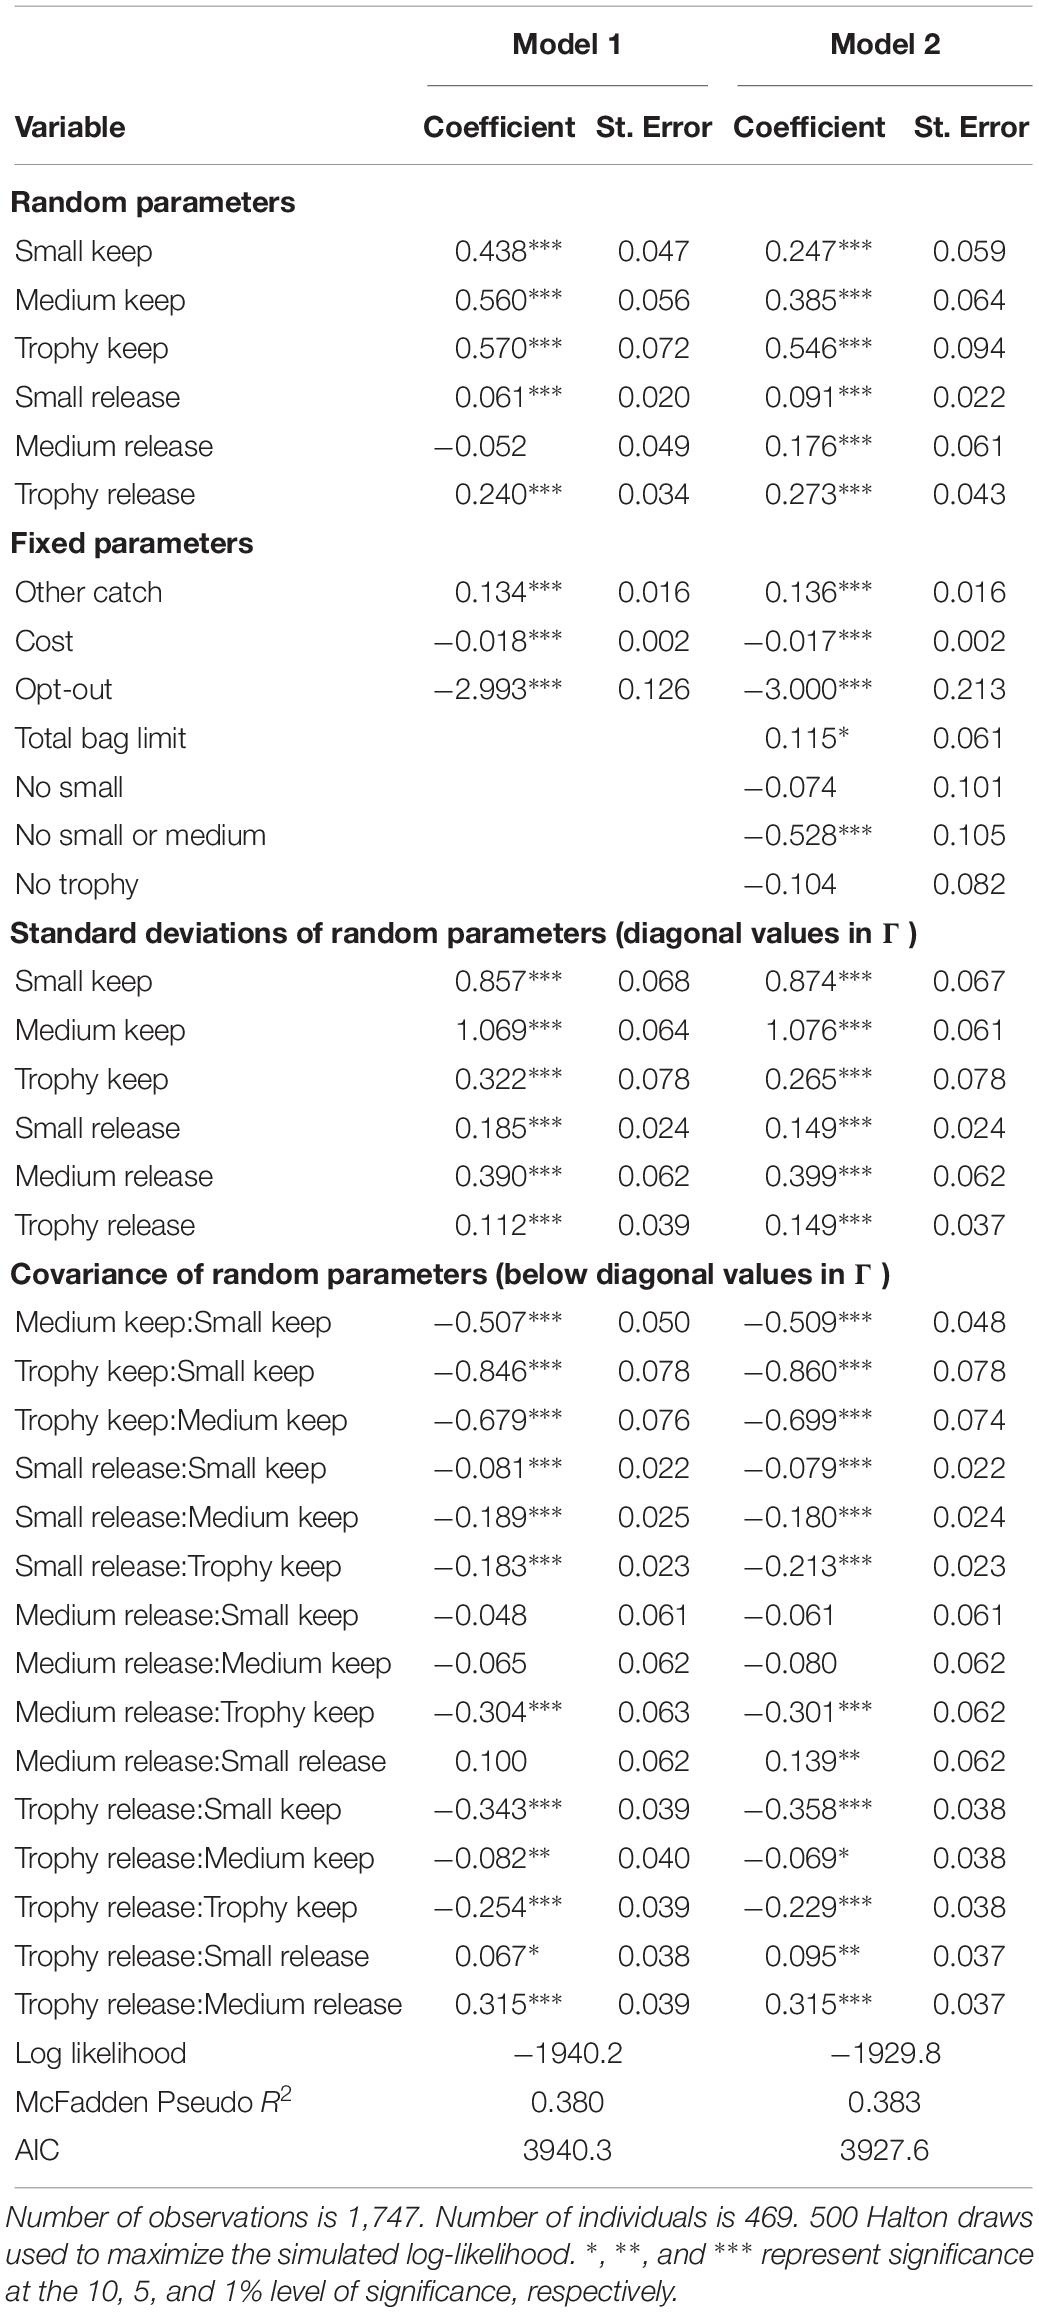
Table 4. Utility parameter estimates from panel rank-ordered mixed logit model.
Both models in Table 4 performed reasonably well, as indicated by a high goodness of fit statistic, McFadden’s pseudo R2. However, estimated utility coefficients on a few of the striper catch attributes were questionable in Model 1. Mean coefficients on the striped bass keep attributes were positive as expected, yet their magnitudes imply a virtually indistinguishable difference between the value anglers place on keeping medium- and trophy-sized stripers. Additionally, while the coefficients on Smallrelease and Trophyrelease were positive, significant, and had magnitudes that aligned with a priori expectations, the coefficient on Mediumrelease was negative and statistically insignificant, implying that catching and having to release a medium-sized striper has no impact on angler utility. Both of these results are inconsistent with opinions voiced by participants of the survey pre-testing focus groups. Compared to Model 1, Model 2 had a lower AIC value, implying greater support for this model. Furthermore, a likelihood ratio test for the inclusion of the four regulatory variables suggests that these variables improved model fit. For these reasons, we selected Model 2 as our preferred specification.
Estimated parameters on the non-striped bass related trip attributes in Model 2 were stable and consistent with expectations. The positive and statistically significant coefficient on Othercatch suggests that catching legal-sized fish other than striped bass while fishing for striped bass is a boon to angler utility. The trip cost parameter, which represents the marginal utility of price, was negative and statistically significant. The estimated coefficient on the opt-out variable was negative and statistically significant, intuitively suggesting that striped bass anglers prefer fishing for striped bass when such an opportunity is available.
Point estimates of the keep and release parameters in Model 2 also followed patterns that align with a priori expectations. To begin, mean coefficients on the striped bass keep and release variables noticeably and significantly increased in magnitude with respect to each stepwise increase in the size of fish caught. This result implies that the average striper angler considers keeping or releasing small, medium, and trophy stripers each as distinct, desirable features of a recreational striped bass fishing trip. It also corroborates focus group participants’ characterization of the recreational Atlantic striped bass fishery as both a sport and a meat fishery. Next, the utility weight anglers place on keeping a striper was found to be greater than that placed on releasing one of the same size. Lastly, the Trophyrelease and Trophykeep parameters were relatively large in magnitude, highlighting the importance of trophy catch on angling utility. The estimated utility parameter on Trophyrelease, for example, was greater in magnitude than that on Smallkeep, suggesting that the average angler derives more utility from catching-and-releasing a trophy striper than from catching-and-keeping a small one.
Estimated utility coefficients on the regulatory attributes in Model 2 provide insight into the value anglers place on changing harvest restrictions. The statistically significant coefficient on Totalbaglimit indicates a positive relationship between marginal increases in the daily bag limit and angler utility, as expected. The coefficient on Nosmall was statistically insignificant, meaning that the average striped bass angler is indifferent between a minimum size limit of 20″ or 28″. In contrast, the effect of 30″ minimum size limit, given by the sum of the coefficients on Nosmall and Nosmallormedium, was -0.603 and highly significant (p-value < 0.001), indicating that anglers have strong preferences against policies that restrict harvest of stripers shorter than 30″. The coefficient on Notrophywas statistically insignificant, implying that the average angler is unaffected by harvest restrictions on trophy stripers. Taken together, estimated coefficients on the regulatory variables suggest that the average striped bass angler derives utility from increases in the overall bag limit while exhibiting strong preferences against policies that constrain their ability to land medium-sized stripers.
While the point estimates from Model 2 suggest that angler utility increases with marginal increases in the number of small, medium, and trophy stripers kept or released, the statistically significant diagonal elements of the variance-covariance matrix indicate that preferences for these attributes vary across the angler population. The extent of this variation, however, is shown to depend on striper catch size and disposition. For example, we found relatively low variation in angler preferences for keeping and releasing trophy stripers. The estimated mean and standard deviation parameters onTrophykeep in Model 2 imply that for roughly 2% of the angler population, keeping a trophy striper detracts from fishing utility. Likewise, the implied distribution for the Trophyrelease attribute suggests that only about 3% of the angler population would obtain disutility from releasing a trophy striper. In contrast, we found a higher degree of dispersion in preferences for keeping and releasing small and medium stripers; the estimated mean and standard deviation parameters on Smallkeep andMediumkeep, for example, suggest that 39 and 36% of the angler population would not receive positive utility from a marginal increase in the number of small and medium stripers kept, respectively.
The below diagonal values of the variance-covariance matrix in Model 2 identify the degree to which angler preferences for keeping and releasing stripers are correlated. Thirteen of the fifteen estimated correlation coefficients were statistically significant. Conforming to intuition, anglers who have preferences for keeping stripers also have preferences against releasing stripers of the same or of different sizes, as implied by the negative correlations between each paired keep and release parameter. However, correlation coefficients on Mediumrelease:Smallkeep and Mediumrelease:Mediumkeep were statistically insignificant. The positive and statistically significant correlations between each pair of release parameters suggest that anglers who have preferences for releasing a given size-class of stripers also have preferences for releasing any other size-class. This is consistent with the notion that some anglers among the sport-fishing subpopulation exclusively practice catch-and-release fishing. Correlation coefficients between each pair of striped bass keep parameters were negative, significant, and relatively large in magnitude. These estimates imply that anglers who have preferences for keeping small or medium stripers, for example, have strong preferences against keeping trophy stripers, and vice versa.
Simulation Model Calibration
Simulation model calibration diagnostics are shown in Table 5. Overall, expected and actual 2015 fishery outcomes were closely aligned. The largest discrepancy pertains to mature female release weight. Despite approximating 2015 mature female release numbers, the calibrated model overestimated mature female release weight by 21 percent. Put differently, the average weight of a mature female striper actually released in 2015 was about two pounds heavier than that expected by the calibrated model. This inconsistency is likely driven by our failure to account for size-selective voluntary release behavior, as the simulation procedure randomly reclassified a portion of harvestable stripers as (voluntary) releases with no differentiation based on size-class. However, the average recreational striped bass angler is almost certainly more prone to voluntarily release harvestable, trophy-sized stripers compared to smaller ones. We make this claim based on focus group participant feedback and responses to a non-DCE question included in the angler survey. In this question, we asked respondents to indicate the number of small (20″–26″), medium (27″–36″), and trophy-sized (37″–43″) stripers they would actually keep if they caught and could legally keep two of each size-class. To these data we fit a simple regression of the form:
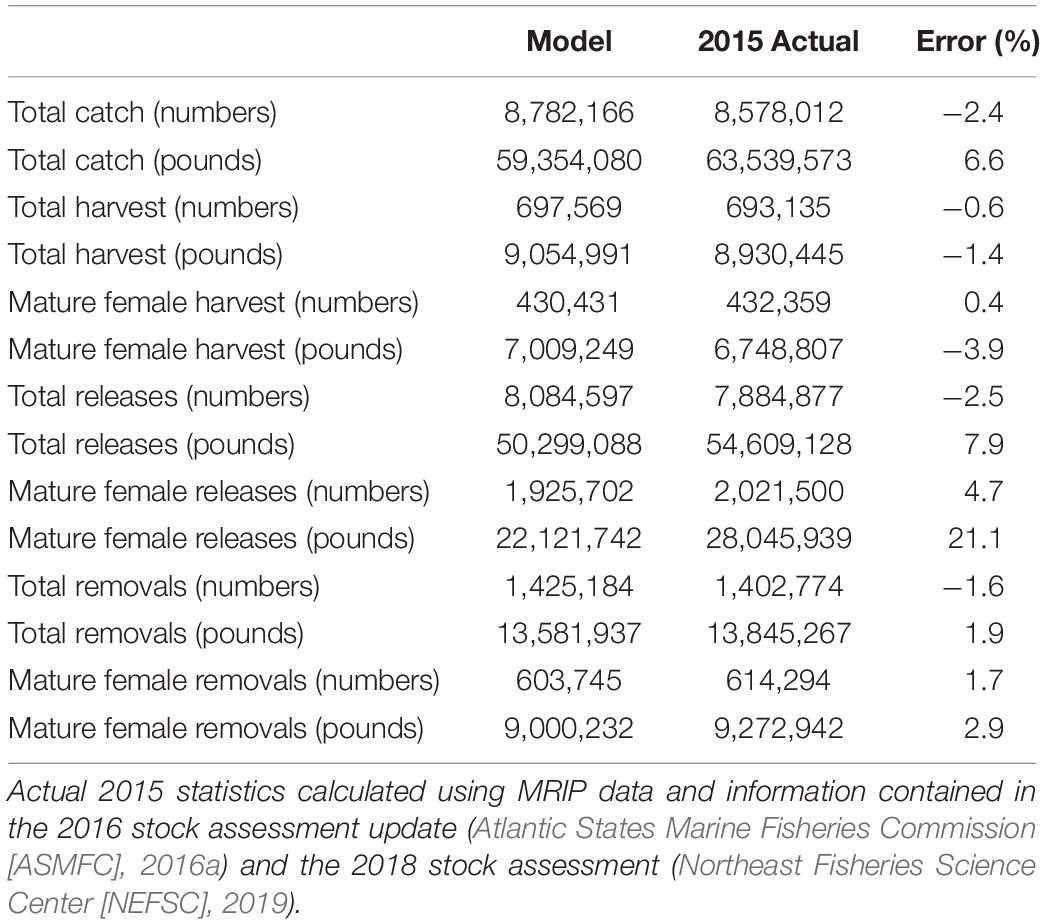
Table 5. Simulation model calibration diagnostics.
where Yi is the number of stripers a respondent indicated they would actually keep (0, 1, or 2) if they could catch and legally keep two, D_medium and D_small are dummy variables for whether the size of the striper in question was medium or small, respectively. The coefficient (standard error) on α, β1, and β2 in Eq. 5 is 1.01 (0.03), 0.20 (0.05), and −0.04 (0.05), respectively. These estimates suggest that the average angler in our sample would keep 1.01 out of two possible trophy stripers, which is significantly fewer by 0.2 fish than the number of medium stripers they would keep, but insignificantly different than the number small stripers they would actually keep.
Simulation Model Results
We evaluated the effect of 36 alternative 2015 recreational striped bass fishing policies, defined in Table 6, on expected angler welfare, total recreational removals, and mature female recreational removals relative to the simulated outcome of the actual 2015 policy of one fish, 28″ or longer. Each alternative policy analyzed specified a one- or two-fish daily bag limit and a 20″, 24″, or 28″ minimum size limit. To examine how harvest restrictions on trophy stripers affect fishery outcomes, we varied the maximum size limit across policies. In addition to those excluding a maximum size limit, some policies specified a maximum size limit that was eight or sixteen inches longer than the minimum size limit; we refer to these policies as narrow and wide harvest slots, respectively. We also simulated fishery outcomes under protected harvest slot policies, which place harvest restrictions on intermediate striper size-classes. These policies specified eight- or twelve-inch protected harvest slots with lower bounds of 24″, 28″, or 32″. Among the group of two-fish bag limit policies analyzed, some specified an adjacent narrow harvest slot for each fish in the bag limit (dual harvest slot), while others specified a narrow harvest slot for the first fish in the bag limit only (partial harvest slot). The last type of harvest restriction analyzed among this group of policies, a slot-option, permitted harvest of either two smaller, or one smaller and one larger striped bass.
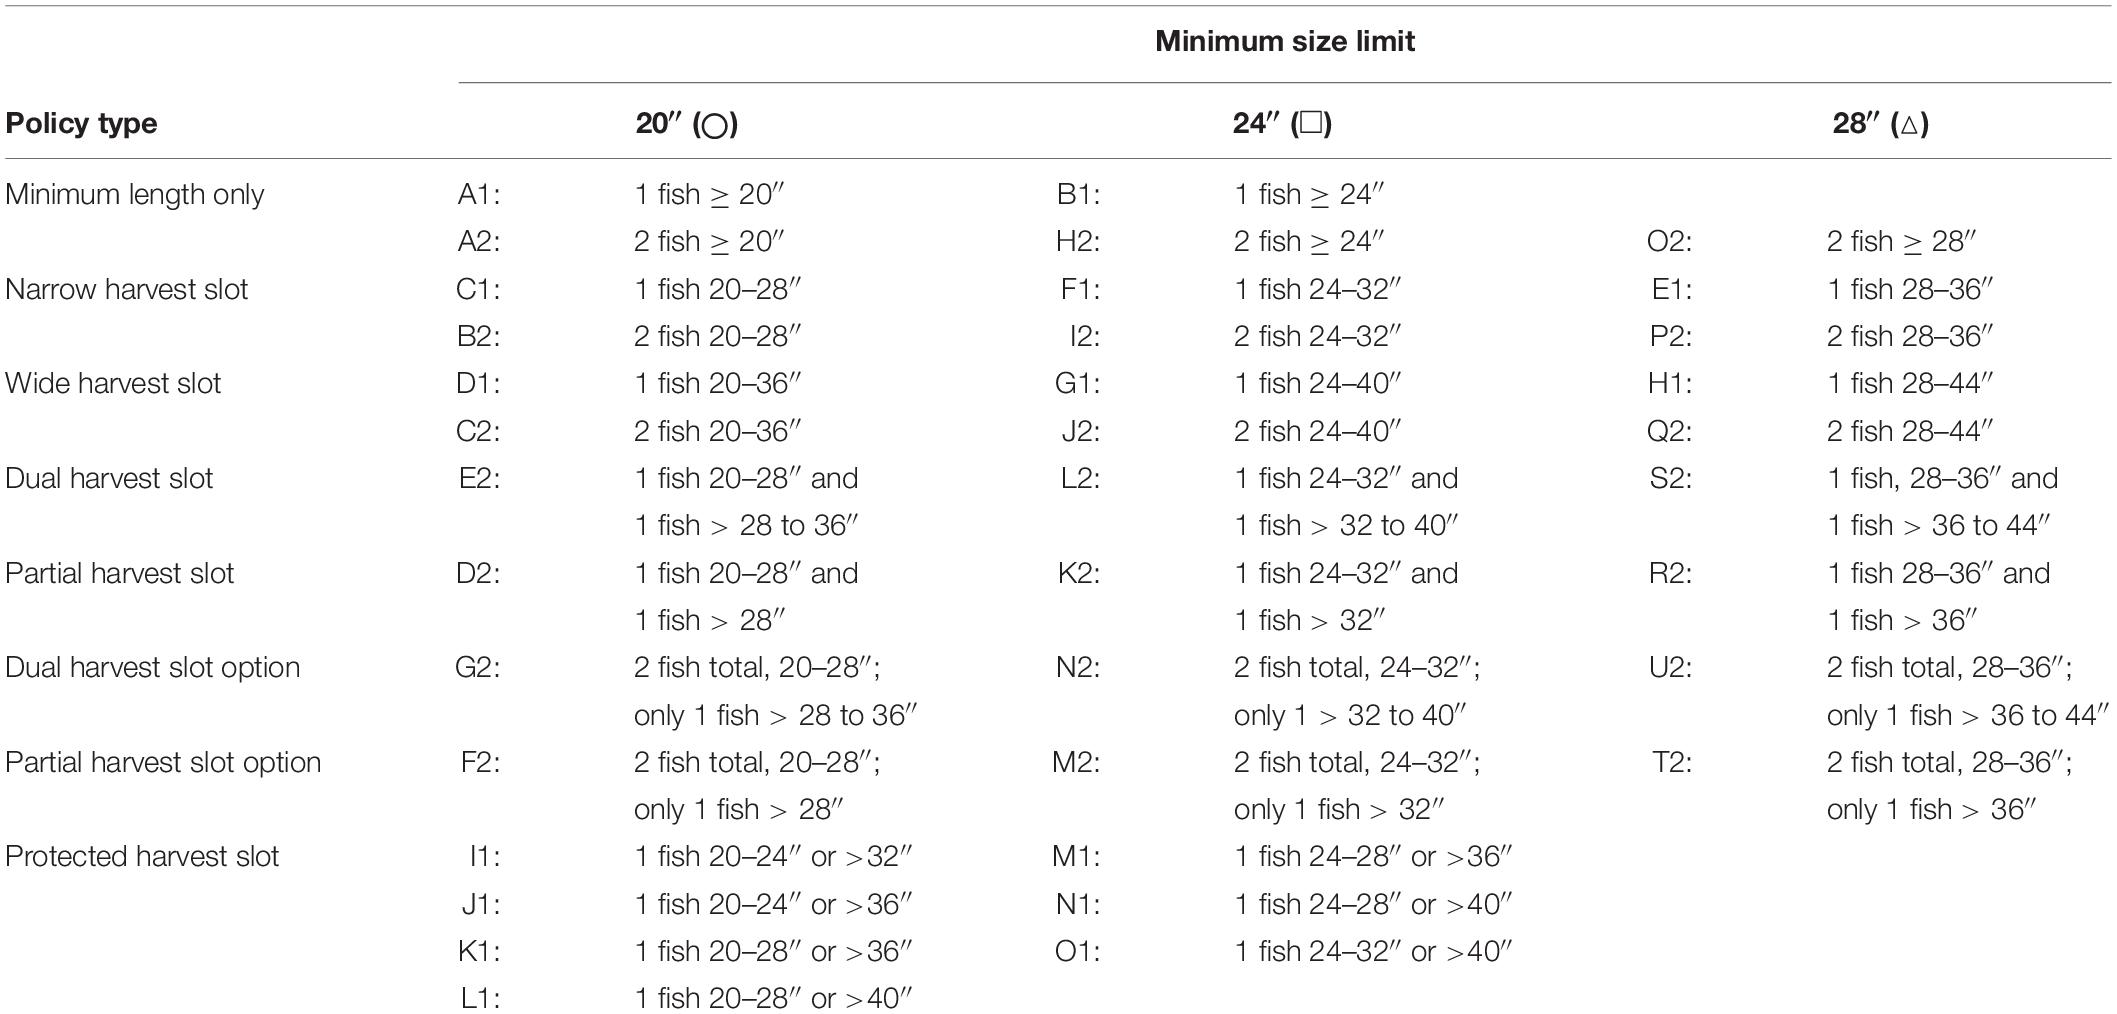
Table 6. Alternative 2015 policies evaluated.
Expected fishery outcomes are plotted in Figures 7, 8. Figure 7 displays each policy’s short-term production plan in terms of welfare and total recreational removal numbers, while Figure 8 displays production plans in terms of welfare and mature female recreational removal weight. For each simulated policy, we translated raw CV into the percent change in aggregate welfare relative to aggregate welfare under the baseline policy, which we calculated to be $147,727,528. We display percent changes in total and mature female recreational removals in terms of fish numbers and biomass weight, corresponding to metrics used in the stock assessment for estimating F and female SSB levels, respectively. These indices can be interpreted as inputs to the production of welfare such that in each figure, the outermost policies plotted shape the efficient frontier. Policies below the efficient frontier are suboptimal, in that angler welfare or recreational fishing mortality could be improved at no cost to the other.
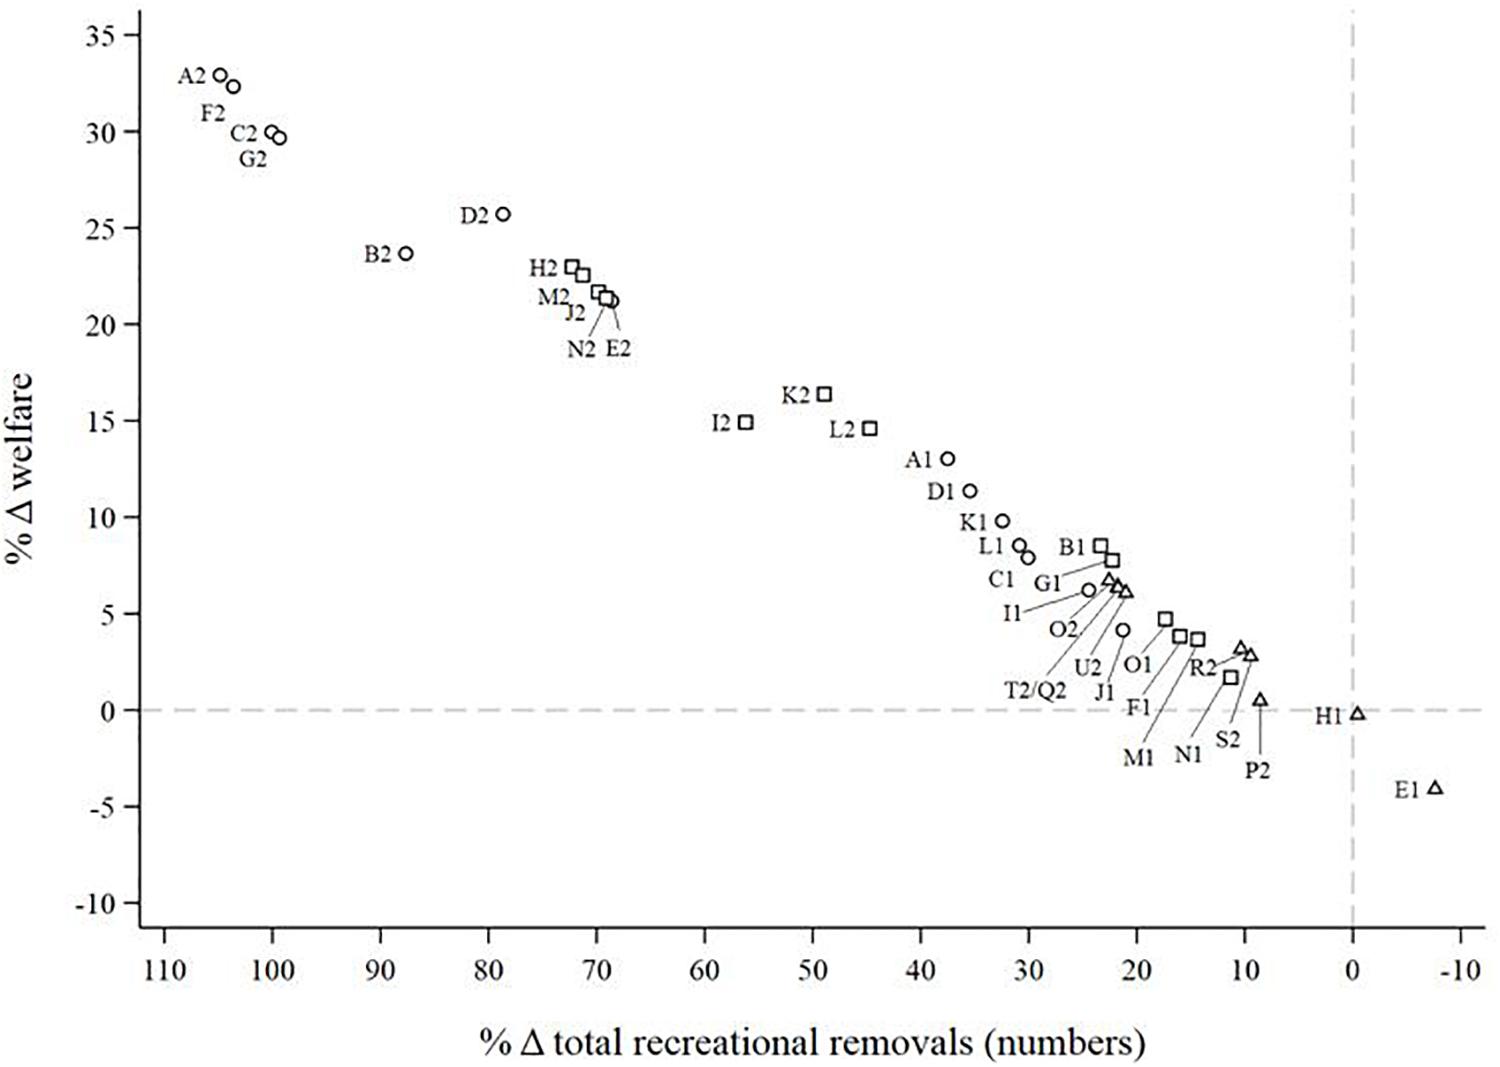
Figure 7. Expected changes in welfare and total recreational removals under alternative 2015 policies in Massachusetts, Connecticut, and Rhode Island. See Table 6 for alternative policy definitions. Actual 2015 policy of one-fish, 28″ or longer used as the baseline policy.
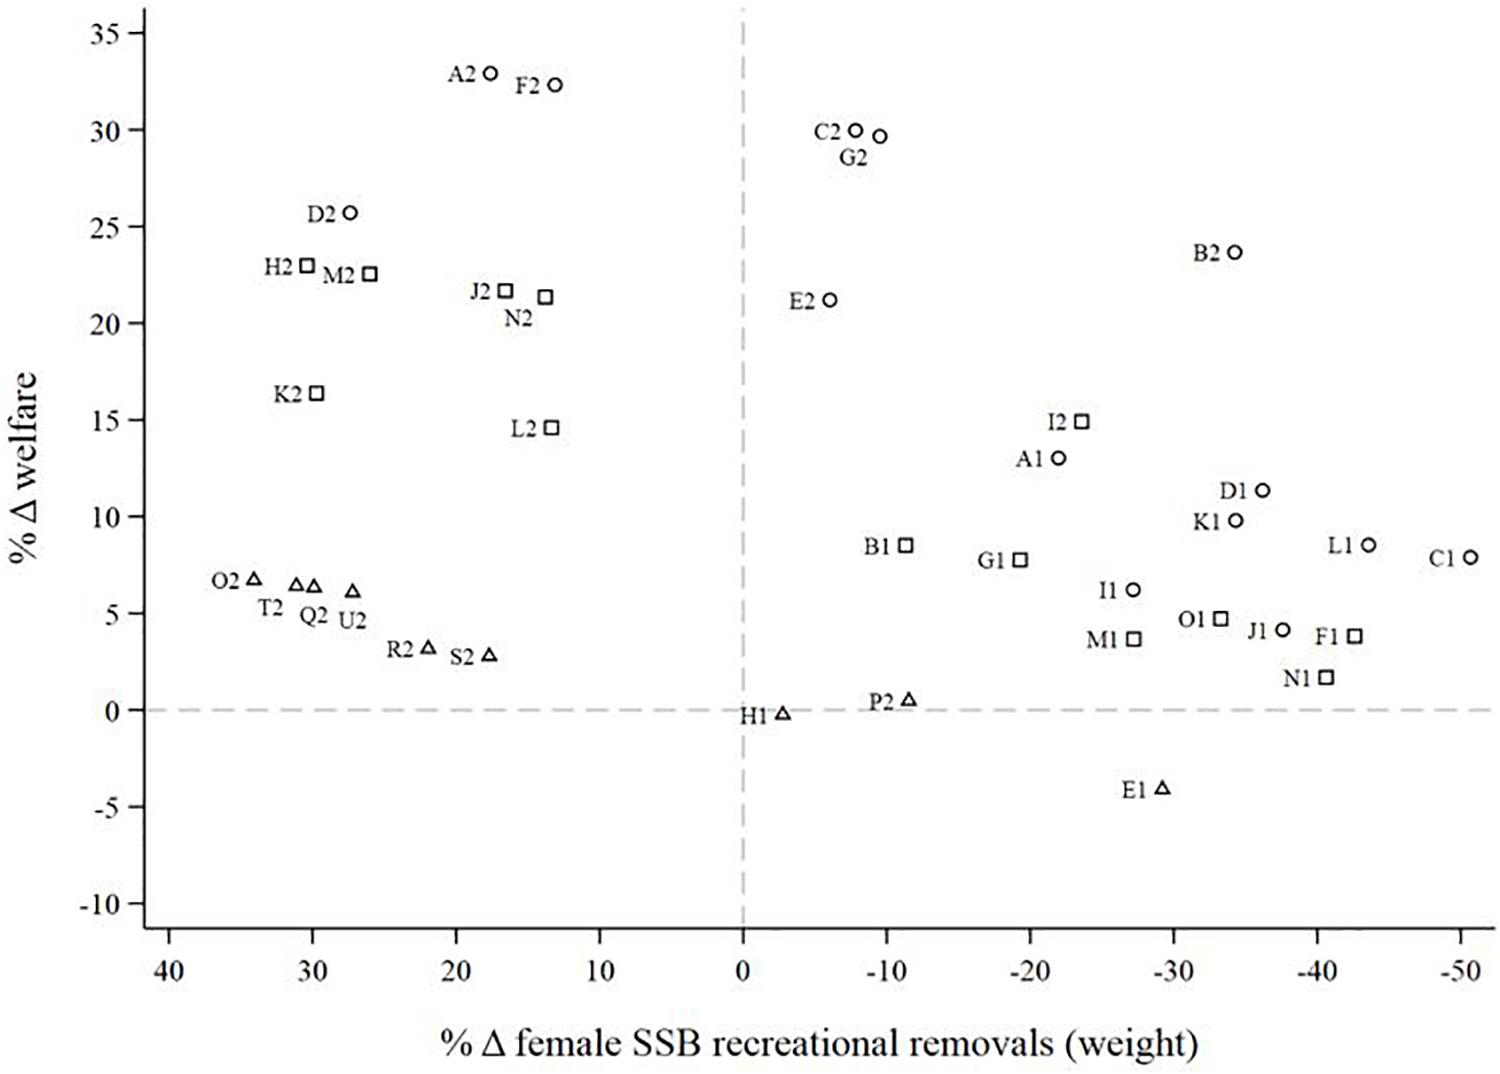
Figure 8. Expected changes in welfare and female SSB removal weight under alternative 2015 policies in Massachusetts, Connecticut, and Rhode Island. See Table 6 for alternative policy definitions. Actual 2015 policy of one-fish, 28″ or longer used as the baseline policy.
Figure 7 reveals a positive and linear relationship between welfare and recreational removals, with the least- and most-restrictive policies analyzed, A2 (2 fish ≥ 20″) and E1 (1 fish 28–36″), expected to yield the highest and lowest relative increases in both outcomes, respectively. Few policies analyzed were expected to lead to suboptimal outcomes in terms of welfare and recreational removals, and almost any desired change in recreational removals between -10 and 110% relative to 2015 levels could be accomplished efficiently through some combination of a bag and size limit.
Across policy types, incremental four-inch decreases in the baseline minimum size limit led to increases in recreational removals and welfare relative to 2015 levels. This relationship is driven by the concurrent, disproportionate increase in the rate at which anglers encounter legal-sized stripers that occurs as the minimum size limit decreases, and it reflects the shape of the 2015 striped bass catch-at-length probability distribution (Figure 4B). The simulated outcomes of policies A1 (1 fish ≥ 20″) and B1 (1 fish ≥ 24) exemplify the aggregate economic tradeoffs faced by anglers regarding the number and size of striped bass that can be legally kept. Despite constraining the bag limit to one fish, these policies were expected to produce larger returns to angler welfare than that expected under all of the two-fish, 28″ minimum size limit policies analyzed. These findings suggest that, rather than differences in non-market values between small, medium, and trophy-sized stripers, the effect of policy action on welfare is driven largely by how it affects the rate at which anglers encounter legal-sized stripers.
The results in Figure 7 also suggest that overly directing harvest toward smaller stripers may be excessively costly to both anglers and the striped bass stock. There were seven policies expected to inefficiently generate welfare from recreational removals: policies O2 (2 fish ≥ 28″), C1 (1 fish 20–28″), B2 (2 fish 20–28″), I2 (2 fish 24–32″), I1 (1 fish 20–24″ or > 32″), J1 (1 fish 20–24″ or > 36″), and N1 (1 fish 24–28″ or > 40″). The latter six of these policies are similar in that each (a) specified a narrow harvest slot with a baseline minimum size limit of 20″ or 24″, and (b) fully or partially restricted harvest of medium- or trophy-sized stripers. Thus, by directing harvest toward frequently encountered yet lower-valued smaller stripers while constraining harvest of rarely encountered yet higher-valued ones, managers can expect increases in recreational removals that are incommensurate with concurrent welfare gains.
The expected outcome of policy E1 (1 fish 28–36″) in Figure 7 provides insight about the economic and biological ramifications of implementing a harvest slot policy without changing the 28″ status quo minimum size limit. Policy E1 was the sole policy analyzed expected to achieve a non-trivial reduction in recreational removals relative to the actual 2015 minimum length only policy (1 fish ≥ 28″). Furthermore, this policy produced only a slight reduction in angler welfare due to the relatively low frequency at which striped bass 36″ or longer are encountered.
While we found that several sets of efficient recreational striped bass fishing policies are available when proposed policy action intends to influence total recreational removals, there exist many fewer efficient policy options when the primarily goal is to protect the mature female population. This can be seen in Figure 8, where we plot expected changes in welfare and female SSB removal weight. The number of policies forming the efficient frontier was reduced dramatically compared to Figure 7 and only eight policies, each defined by a baseline minimum size limit of 20″, were expected to achieve efficient changes in female SSB removal weight relative to the actual 2015 policy. This result should be interpreted with caution, however, as it could be influenced by our assumption that simulated anglers harvest the first fish of legal-size. Nonetheless, across policy types other than partial and protected harvest slots, expected changes in female SSB removal weight increased in magnitude with each incremental, four-inch increase in the baseline minimum size limit from 20″. This relationship is intuitive because increasing the minimum size limit directs harvest toward the mature female population.
Conforming to intuition, we found that minimum length only and harvest slot policies differed considerably in their effect on female SSB removal weight. For example, policies H2 (2 fish ≥ 24″) and A2 (2 fish ≥ 20″) were expected to achieve a 30%, and 18% increase in female SSB removal weight relative to the simulated outcome of the actual 2015 policy, respectively. Conversely, the harvest slot analogs of policies H2 and A2, policies I2 (2 fish 24–32″) and B2 (2 fish 20–28″), were expected to achieve a 24, and 34% relative decrease in female SSB removal weight, respectively. Policy E1 (1 fish 28–36″) was also expected to yield a decrease in female SSB removal weight relative to the actual 2015 policy (1 fish ≥ 28″), thus rendering it the sole policy analyzed expected to lead to non-trivial, favorable outcomes in terms of both total and mature female recreational fishing mortality.
The expected outcomes of policies O2 (2 fish ≥ 28″) and G1 (1 fish 24–40″) further our understanding of the economic and biological tradeoffs created by different harvest size restrictions. Figure 7 revealed that these two policies were expected to induce roughly the same relative change in welfare and total recreational removals compared to the actual 2015 policy. Yet Figure 8 shows a marked divergence in each policy’s impact on female SSB removal weight: while policy O2 was expected to achieve a 34% relative increase, policy G1 was expected to achieve a 19% relative decrease in female SSB recreational removal weight compared to the actual 2015 policy.
More broadly, results in Figure 8 suggest that curtailing female SSB removal weight requires policy action that explicitly protects medium- to trophy-sized stripers. Except for policies A1 (1 fish ≥ 20″) and B1 (1 fish ≥ 24″), only those policies imposing maximum size limits or protected harvest slots were expected to reduce female SSB removal weight relative to 2015 levels. This intuitive pattern derives from the shape of 2015 proportion mature female-at-length distribution (Figure 6), which indicates that between 75 and 100% of striped bass length 32″ or longer are mature females. Ultimately, this finding reflects the interface between regulations and the biological characteristics that govern the natural growth and reproductive processes of Atlantic striped bass, thus highlighting the importance of accounting for such characteristics when proposed policy action intends to protect the fecund population.
Discussion
Atlantic striped bass are a fundamental component of the recreational fishing community along the coast from Maine to North Carolina. Over the past several years, however, the species has faced heavy fishing pressure – to the point where it is currently overfished and experiencing overfishing (Northeast Fisheries Science Center [NEFSC], 2019) – and managers must make tradeoffs between achieving conservation objectives and satisfying angler demand when designing policy. To illuminate these tradeoffs, we evaluated the immediate economic and biological impacts of different types of recreational Atlantic striped bass fishing policies. We did this by first understanding the drivers of individual angler behavior using data from a choice experiment survey. Then, we integrated these results into a simulated aggregate demand model that measured the effect of policy-induced changes in trip expectations on angler welfare, angler participation, recreational fishing mortality, and female SSB. Importantly, this procedure allowed us to examine the immediate economic and biological consequences of full or partial harvest restrictions on trophy-sized striped bass that to-date have not been considered jointly in the policymaking process.
Results of the angler behavioral model were broadly consistent with the results of other recreational fishing research. Similar to Hunt et al. (2019)’s review of recreational fishing site choice research over the past three decades, we found that the average recreational striped bass angler prefers catching larger fish to smaller ones, less restrictive regulations, and lower trip costs. Keeping a striper was more important to the average angler than releasing one of the same size, a finding that has been uncovered in other discrete choice studies applied to a variety of recreational species in the United States (Atlantic cod, haddock, and pollock Pollachius pollachius: Lee et al., 2017; summer flounder caught along the northeast coast: Holzer and McConnell, 2017; wild and hathery-reared king salmon Oncorhynchus tshawytscha and silver salmon Oncorhynchus kisutch caught in Oregon and Washington: Anderson and Lee, 2013; Pacific halibut Hippoglossus stenolepis, king salmon, and silver salmon caught off the coast of Southeast and Southcentral Alaska: Lew and Larson, 2014; groupers Epinephelus spp. and Mycteroperca spp., red snapper Lutjanus campechanus, dolphinfish Coryphaena hippurus, and king mackerel Scomberomorus cavalla caught along the southeast coast: Carter and Liese, 2012). Additionally, we found that compared to other size-classes, anglers place a relatively high value on keeping and releasing trophy-sized stripers. For example, the estimated parameters indicated that the average angler would obtain more utility from catching-and-releasing a 38″ trophy striper than from catching-and-keeping a 22″ striper. These results agree with recent research suggesting that recreational striped bass anglers in Massachusetts, Connecticut, North Carolina, and Virginia are more highly motivated to fish by the prospect of catching trophy stripers than they are by the prospect of keeping stripers (Murphy et al., 2019).
Our study also provided important insight into public perceptions about catch-and-release only restrictions on Atlantic striped bass. The behavioral model indicated that, for the average angler, a catch-and-release only restriction on stripers between 20″ and 30″ strongly and negatively affects utility. Surprisingly, a catch-and-release only restriction on stripers between 20″ and 28″ did not evoke a similar response, as the estimated utility parameter on this regulatory variable was statistically insignificant. Given that most anglers in our sample fish primarily in waters where a minimum size limit of 28″ has been adopted in recent years (Atlantic States Marine Fisheries Commission [ASMFC], 2015, 2016b, 2017), these results could be suggestive of loss aversion to changes in the status quo (Tversky and Kahneman, 1991); specifically, the utility loss from a movement in the minimum size limit from 20″ to 30″ loomed disproportionately larger than that associated with a movement from 20″ to the status quo minimum size limit of 28″.
In terms of harvest restrictions on trophy stripers, the behavioral model revealed a statistically insignificant relationship between angler utility and a maximum size limit of 36″. Thus, separate from its indirect impact on the number and size of striped bass an angler can keep or must release, implementing a 36″ maximum size limit would not adversely affect the average angler. This finding corroborates that of a survey directed at striped bass anglers in Massachusetts and Connecticut, wherein over 55% of the sampled recreational striped bass anglers were supportive or had neutral opinions toward a proposed maximum size limit of 36” (Murphy et al., 2015). One possible explanation for these results is the strong conservation ethic for striped bass that began with the widely publicized stock collapse in the late 1970s and subsequent recovery in 1995 after a 5 year fishing moratorium that was initiated through the passage of the 1984 Atlantic Striped Bass Conservation Act (Shepherd et al., 2018). Currently, there exists support for conservation-minded trophy fishing practices across the study region. In addition to being implicit in recreational regulations that fully or partially restrict harvest of trophy stripers, many states encourage such practices through voluntary catch-and-release award programs or tournaments; in Maryland, for example, recreational anglers who release alive a striped bass longer than 40″ can receive the Governor’s Striped Bass Conservation Award. Some volunteer conservation organizations employ similar tactics; Striper Forever’s Release a Breeder Club recognizes anglers who release unharmed striped bass longer than 36″ in total length. Nonetheless, our contributions to a better understanding of public perceptions about catch-and-release only restrictions may be informative for managers when considering the potential for regulatory non-compliance across proposed policy actions.
Results of the simulation model highlighted the importance of accounting for the empirical size distribution of catch when considering the effect of alternative harvest size restrictions on angler welfare. For example, decreasing the 28″ status quo minimum size limit with or without an accompanying maximum size limit yielded disproportionate increases in the rate at which anglers encounter legally harvestable stripers. This type of policy-induced change in fishing conditions outweighed any differences in non-market value that exist between catching small, medium, or trophy-sized stripers and led to considerable net welfare gains. In contrast, maintaining the status quo minimum size limit of 28″ while placing harvest restrictions on trophy stripers lead to only modest reductions in angler welfare because trophy stripers are rarely encountered.
Conforming to intuition, we found that harvest slot policies, which specify both a minimum and maximum size limit, were expected to mitigate female SSB removals more effectively than minimum length only policies. Like minimum length only policies, changes in harvest slot minimum size limits were inversely related to changes in aggregate angler welfare and total recreational removals. However, some harvest slot policies with minimum size limits shorter than 28″ and full or partial harvest restrictions on medium- and trophy-sized stripers lead to inefficient outcomes in terms of aggregate angler welfare and total recreational removals. We found that only one of the 36 alternative policies analyzed, specified by a one-fish harvest slot of 28″ to 36″, was expected to achieve a non-trivial reduction in both total and mature female recreational removals relative to the actual 2015 policy of one fish, 28″ or longer. Given the relatively small loss in angler welfare that was expected to occur under a 28″ to 36″ harvest slot and the overfished status of the stock, additional consideration for this or similar policies is warranted.
More broadly, our study shows how assessing angler behavioral responses to regulatory stimuli can help guide selection of efficient and effective policies, particularly when fisheries managers seek to balance socioeconomic goals with multiple conservation objectives. We found that a wide range of economically efficient policies are available if the primary management objective is to control recreational fishing mortality. In contrast, if the primary management objective is to curtail mature female recreational fishing mortality, failing to account for potential economic consequences will often lead to inefficient outcomes, as exemplified by many of the policies analyzed lying inside the efficient frontier of welfare and female SSB recreational removal weight.
Even though our DCE modeling framework is commonly employed to examine recreational fishing behavior and our results generally align with the results of other recreational fishing research, there is certainly still room for improvement. We specified a linear-in-catch utility function based on the attribute levels included in the experimental design, but diminishing returns to keeping and releasing striped bass may more accurately depict the preferences of some anglers. Regarding our simulation model, we assumed that anglers harvest the first legal-size striper encountered up to the bag limit, but it is likely that some anglers selectively harvest based on catch size. Some anglers might exhibit such behavior when encountering a striper blitz, while others may do so for culinary or environmental reasons. Relatedly, we assumed that the rate of voluntary legal release was constant across policy types. However, angler voluntary release behavior may depend on the total number and size of legal fish caught as suggested by Wallmo and Gentner (2008), who found that this type of behavior was correlated with a number of personal and situational factors. These behavioral assumptions will undoubtedly cause a discrepancy between the expected and the realized distribution of recreational removals-at-length from any given policy change.
Our simulation model was also limited by its relatively narrow geographical scope and static nature. Because we evaluated aggregate impacts of policy changes in Massachusetts, Rhode Island, and Connecticut, any conclusions drawn from this portion of our analysis may only have direct implications for fishery management in this region. We leave expanding the simulation model to the coast-wide fishery for future work. Additionally, the model captured the immediate effect of policy changes on total and female SSB recreational removals. However, these outcomes may differ in the medium- and long-run; changes in total recreational removals, for example, may be endogenous to changes in female SSB over a longer time horizon. Other anthropogenic impacts, such as degraded water quality in spawning and nursing habitats, may also exacerbate or attenuate the medium- and long-run effects of changes in fishing mortality on the health of the stock (Richards and Rago, 1999). Integrating a biological growth model into the simulation model would allow us to consider these dynamics and assess the potential future stock impacts of recreational striped bass fishing policy. Despite these shortcomings, use of this simulation modeling approach by policymakers would increase the likelihood that striped bass management policies meet intended conservation objectives while simultaneously maximizing the well-being of anglers. Management decisions that are derived from empirically estimated relationships between angler behavior, biomass levels, fishing mortality, and regulations would be a substantial step forward in the science of fishery management.
Data Availability Statement
The datasets generated for this study are available on request to the corresponding author.
Ethics Statement
The studies involving human participants were reviewed and approved by the Protection of Human Subjects Review Board, University of Maine. Written informed consent for participation was not required for this study in accordance with the national legislation and the institutional requirements.
Author Contributions
AC-H and SS procured funding, developed the survey instrument, and contributed to subsequent drafts. AC-H analyzed the data and wrote the initial draft.
Funding
This work was funded by National Oceanic and Atmospheric Administration Cooperate Institutes (CINAR-NMFS, Grant Number 12161497).
Conflict of Interest
The authors declare that the research was conducted in the absence of any commercial or financial relationships that could be construed as a potential conflict of interest.
Acknowledgments
We would like to thank Keith Evans for helping to design and implement the angler survey, Sabrina Lovell for helping to conduct focus groups, and Hirotsugu Uchida and Min-Yang Lee for valuable input throughout various stages of the study and survey development. Special thanks to members of the ASMFC striped bass technical, stock assessment, and tagging committees for sharing volunteer angler logbook and striped bass sampling data.
Supplementary Material
The Supplementary Material for this article can be found online at: https://www.frontiersin.org/articles/10.3389/fmars.2019.00814/full#supplementary-material
Footnotes
- ^ Harvested fish plus discards (releases) that are assumed to die.
- ^ The recreational sector typically accounts for the lion’s share of total removals, i.e., commercial and recreational harvest, commercial discards, and recreational release mortality. In 2018, for example, the recreational sector accounted for 88% of total removals by number (Atlantic States Marine Fisheries Commission [ASMFC], 2019).
- ^ Minimum size limits specify a minimum length of legally harvestable fish, harvest slots specify a minimum and maximum length of legally harvestable fish, and protected harvest slots specify a minimum and maximum length of fish that cannot be legally harvested.
- ^ We generated the design in SAS using the Kuhfeld macros (Kuhfeld, 2010).
- ^ An example of such an alternative would contain the following attribute levels: small striped bass catch = 2, medium striped bass catch = 1, bag limit = 1, small slot limit = 1. In this example, it is not possible to determine whether a respondent would keep two small stripers or one small and one medium striper.
- ^ In any given year, boat- and shore-based directed striped bass trips each typically account for about half of the total number of directed striped bass trips taken across the study region (NMFS-FSD, 2019).
- ^ We generated three sets of trip costs associated with shore and kayak, private and party boat, and charter boat fishing.
- ^ Across the study area, anglers younger than 16 years of age are exempt from purchasing a license or registering for saltwater fishing. There are other exemptions that vary by state. Our sampling frame therefore excludes anglers exempt from purchasing a license or registering for saltwater fishing and those fishing illegally. We are unaware of the typical number of these anglers operating annually within the study region.
- ^ All survey mailings provided respondents with the option to participate in the web version of the survey. All email correspondences contained a web-link to the survey.
- ^ This information can be found in Supplementary Table A1.
- ^ We did not include the total number of saltwater fishing trips nor the number of striped bass fishing trips anglers took in the past 12 months as explanatory variables in this model because 50 respondents did not provide this information. Results of the response propensity model are shown in Supplementary Table A2.
- ^ We generated these variables from the combination of catch and regulatory attributes presented in each DCE choice scenario. Choice scenarios in which the value of these variables could not be unambiguously determined were removed from the experimental design.
- ^ Given the definitions of the regulatory attributes used in the DCE, we are unable to estimate the marginal effect of a catch-and-release restriction pertaining solely to medium-sized stripers.
- ^ We aggregated private, charter, and head boat trips when generating the boat-based catch-per-trip distribution.
- ^ Shore trip cost is the weighted average of each state’s mean shore trip expenditure minus lodging expenses and tournament fees, with weights proportional to state-level contributions to the total number of directed shore trips taken during 2015 across the study region. Boat trip cost is the weighted average of each state’s mean private and head/charter boat trip expenditure minus lodging expenses and tournament fees, with weights proportional to state-level contributions to the total number of directed private and head/charter boat trips taken during 2015 across the study region.
- ^ Selective harvesting is when anglers discard legal-sized fish to subsequently harvest fish of a more preferred size; high-grading is when anglers retain but then discard legal-sized fish to subsequently harvest fish of a more preferred size.
- ^ In theory, angler voluntary release preferences should be captured by the estimated marginal utilities for keeping striped bass. However, the choice experiment framed these attributes as numbers of fish that could be kept, but it is not necessarily the case that sample anglers would actually keep these fish.
- ^ It is reasonable to assume that rational anglers would not voluntarily release a legal-sized striped bass if they obtain more utility from harvesting that same fish.
- ^ We calculated voluntarily release proportions using self-reported trip information about legal-sized catch levels and dispositions, catch lengths, and numbers of anglers. Calculations were based on a total of 414 trips that reported catching at least one legal-sized striped bass during the 4-year period. Voluntarily releases were defined as legal-sized fish that could have been kept based on the regulations in place at the time of the reported trip date, but were instead released. In 2013 and 2014, the daily possession limit in Connecticut was two fish equal to or longer than 28″; in 2015 and 2016, the daily possession limit was one fish equal to or longer than 28″. We found that during 2013 and 2014, 51% of the total number of harvestable striped bass caught by VAS participants were released voluntarily, compared to 68% in 2015 and 2016. The overall proportion of harvestable striped bass that were released by VAS participants across the four years was 57%. It is likely, however, that anglers who participate in the Connecticut VAS Program are more avid than the population of anglers at large, and therefore may be more inclined to catch-and-release harvestable fish. Thus, we use a more conservative estimate of voluntary release in the simulation model.
References
Allen, M., Ahrens, R., Hansen, M., and Arlinghaus, R. (2013). Dynamic angling effort influences the value of minimum-length limits to prevent recruitment overfishing. Fish. Manag. Ecol. 20, 247–257. doi: 10.1111/j.1365-2400.2012.00871.x
Anderson, L., and Lee, T. (2013). Untangling the recreational value of wild and hatchery salmon. Mar. Resour. Econ. 28, 175–197. doi: 10.5950/0738-1360-28.2.175
Arlinghaus, R., Matsumura, S., and Dieckmann, U. (2010). The conservation and fishery benefits of protecting large pike (Esox lucius L.) by harvest regulations in recreational fishing. Biol. Conserv. 143, 1444–1459. doi: 10.1016/j.biocon.2010.03.020
Atlantic States Marine Fisheries Commission [ASMFC], (2014). Addendum IV to Ammendment 6 to the Atlantic Striped Bass Interstate Fishery Management Plan. Washington, DC: Atlantic States Marine Fisheries Commission.
Atlantic States Marine Fisheries Commission [ASMFC], (2015). 2015 Review of the Atlantic States Marine Fisheries Comission Fishery Management Plan for Atlantic Striped Bass. Arlington, VA: Atlantic States Marine Fisheries Commission.
Atlantic States Marine Fisheries Commission [ASMFC], (2016a). 2016 Atlantic Striped Bass Stock Assessment Update. Arlington, VA: Atlantic States Marine Fisheries Commission.
Atlantic States Marine Fisheries Commission [ASMFC], (2016b). 2016 Review of the Atlantic States Marine Fisheries Commission Fishery Management Plan for Atlantic Striped Bass. Arlington, VA: Atlantic States Marine Fisheries Commission.
Atlantic States Marine Fisheries Commission [ASMFC], (2017). 2017 Review of the Atlantic States Marine Fisheries Comission Fishery Management Plan for Atlantic Striped Bass. Arlington, VA: Atlantic States Marine Fisheries Commission.
Atlantic States Marine Fisheries Commission [ASMFC], (2019). 2019 Review of the Atlantic States Marine Fisheries Commission Fishery Management Plan for Atlantic Striped Bass. Arlington, VA: Atlantic States Marine Fisheries Commission.
Ayllón, D., Nicola, G., Elvira, B., and Almodóvar, A. (2019). Optimal harvest regulations under conflicting tradeoffs between conservation and recreational fishery objectives. Fish. Res. 216, 47–58. doi: 10.1016/j.fishres.2019.03.021
Bigelow, H., and Schroeder, W. (1953). Fishes of the gulf of maine. U.S. Fish Wildl. Serv. Fish. Bull. 53, 1–576.
Carter, D., and Liese, C. (2012). The economic value of catching and keeping or releasing saltwater sport fish in the Southeast USA. N. Am. J. Fish. Manage. 32, 613–625. doi: 10.1080/02755947.2012.675943
Chapman, R., and Staelin, R. (1982). Exploiting rank ordered choice set data within the stochastic utility model. J. Mark. Res. 19, 288–301. doi: 10.1177/002224378201900302
Cleveland, W. (1979). Robust locally weighted regression and smoothing scatterplots. J. Am. Stat. Assoc. 74, 829–836. doi: 10.1080/01621459.1979.10481038
Dillman, D., Smyth, J., and Christian, L. (2009). Internet, Mail, and Mixed-Mode Surveys: The Tailored Design Method, 3rd Edn. New York: Wiley.
Fenichel, E., Abbott, J., and Huang, B. (2013). Modelling angler behaviour as a part of the management system: synthesizing a multi-disciplinary literature. Fish Fish. 14, 137–157. doi: 10.1111/j.1467-2979.2012.00456.x
Gautum, A., and Steinback, S. (1998). “Valuation of recreational fisheries in the North-East U.S. striped bass: a case study,” in Recreational Fisheries: Social, Economic and Management Aspects, eds P. Hickley and H. Tompkins, (Oxford: Fishing News Books), 165–183.
Groves, R. (2006). Nonresponse rates and nonresponse bias in household surveys. Public Opin. Q. 70, 646–675. doi: 10.1093/poq/nfl033
Gwinn, D., Allen, M., Johnston, F., Brown, P., Todd, C., and Arlinghaus, R. (2015). Rethinking length-based fisheries regulations: the value of protecting old and large fish with harvest slots. Fish Fish. 16, 259–281. doi: 10.1111/faf.12053
Haab, T., and McConnell, K. (2002). Valuing Environmental and Natural Resources: The Econometrics of Non-market Valuation. Northampton: Edward Elgar Publishing.
Holzer, J., and McConnell, K. (2017). Risk preferences and compliance in recreational fisheries. J. Assoc. Environ. Resour. Econ. 4, S1–S43.
Hunt, L., Camp, E., van Poorten, B., and Arlinghaus, R. (2019). Catch and non-catch-related determinants of where anglers fish: a review of three decades of site choice research in recreational fisheries. Rev. Fish. Sci. Aquac. 27, 261–286. doi: 10.1080/23308249.2019.1583166
Koehn, J., and Todd, C. (2012). Balancing conservation and recreational fishery objectives for a threatened fish species, the Murray Cod, Maccullochella Peelii. Fish. Manage. Ecol. 19, 410–425. doi: 10.1111/j.1365-2400.2012.00856.x
Kuhfeld, W. (2010). Marketing Research Methods in SAS: Experimental Design, Choice, Conjoint, and Graphical Techniques. Cary, NC: SAS Institute Inc.
Kuhfeld, W., Tobias, R., and Garratt, M. (1994). Efficient experimental design with marketing research applications. J. Mark. Res. 31, 545–557. doi: 10.1177/002224379403100408
Lee, M., Steinback, S., and Wallmo, K. (2017). Applying a bioeconomic model to recreational fisheries management: groundfish in the Northeast United States. Mar. Resour. Econ. 32, 191–216. doi: 10.1086/690676
Lew, D., and Larson, D. (2012). Economic values for saltwater sport fishing in Alaska: a stated preference analysis. N. Am. J. Fish. Manage. 32, 745–759. doi: 10.1080/02755947.2012.681012
Lew, D., and Larson, D. (2014). Is a fish in hand worth two in the sea? Evidence from a stated preference study. Fish. Res. 157, 124–135. doi: 10.1016/j.fishres.2014.04.005
Louiviere, J., Hensher, D., and Swait, J. (2000). Stated Choice Methods: Analysis and Applications. New York, NY: Cambridge University Press.
Lovell, S., Hilger, J., Steinback, S., and Hutt, C. (2016). “The economic contribution of marine angler expenditures on durable goods in the United States, 2014,” in U.S. Dep. Commerce, NOAA Tech. Memo. NMFS-F/SPO-165. Seattle, WA: NMFS Scientific Publications Office.
Lovell, S., Steinback, S., and Hilger, J. (2013). “The Economic Contribution of Marine Angler Expenditures in the United States, 2011,” in U.S. Dep. Commerce, NOAA Tech. Memo. NMFS-F/SPO-134. Seattle, WA: NMFS Scientific Publications Office, 188.
McFadden, D. (1973). “Conditional logit analysis of qualitative choice behavior,” in Frontiers in Econometrics, ed. P. Zarembka, (New York: Academic Press), 105–142.
Morson, J., Munroe, D., Harner, R., and Marshall, R. (2017). Evaluating the potential for a sex-balanced harvest approach in the recreational Summer Flounder Fishery. N. Am. J. Fish. Manage. 37, 1231–1242. doi: 10.1080/02755947.2017.1362490
Murphy, R., Scyphers, S., and Grabowski, J. (2015). Assessing fishers’ support of Striped Bass management strategies. PLoS One 10:e0136412. doi: 10.1371/journal.pone.0136412
Murphy, R., Scyphers, S., Gray, S., and Grabowski, J. (2019). Angler attitudes explain disparate behavioral reactions to fishery regulations. Fisheries 44, 475–487. doi: 10.1002/fsh.10286
National Marine Fisheries Service [NMFS] (2015). “Fisheries of the United States, 2014,” in U.S. Department of Commerce, NOAA Current Fishery Statistics No. 2014. Available at: http://www.fisheries.noaa.gov/resource/document/fisheries-united-states-2017-report (accessed March 21, 2019).
National Marine Fisheries Service [NMFS] (2016). “Fisheries of the United States 2015,” in U.S. Department of Commerce, NOAA Current Fishery Statistics No. 2015. Available at: http://www.fisheries.noaa.gov/resource/document/fisheries-united-states-2017-report (accessed March 21, 2019).
National Marine Fisheries Service [NMFS] (2017). “Fisheries of the United States, 2016,” in U.S. Department of Commerce, NOAA Current Fishery Statistics No. 2016. Available at: http://www.fisheries.noaa.gov/resource/document/fisheries-united-states-2017-report (accessed March 21, 2019).
National Marine Fisheries Service [NMFS] (2018). “Fisheries of the United States, 2017,” in U.S. Department of Commerce, NOAA Current Fishery Statistics No. 2017. Available at: http://www.fisheries.noaa.gov/resource/document/fisheries-united-states-2017-report (accessed March 21, 2019).
NMFS-FSD (2019). Marine Recreational Information Program Data. Available at: www.fisheries.noaa.gov/recreational-fishing-data/recreational-fishing-data-and-statistics-queries (accessed November 21, 2019).
Northeast Fisheries Science Center [NEFSC] (2019). “66th regional stock assessment workshop (66th SAW) assessment report,” in U.S. Department of Commerce, Northeast Fish Sci. Cent. Ref. Doc. 19–08, 1170. Available at http://www.nefsc.noaa.gov/publications/
Richards, A., and Rago, P. (1999). A case history of effective fishery management: Chesapeake Bay striped bass. N. Am. J. Fish. Manage. 19, 356–375. doi: 10.1577/1548-8675(1999)019<0356:achoef>2.0.co;2
Shepherd, G., Nelson, G., Rago, P., Richards, A., and Goodyear, P. (2018). “A chronicle of striped bass population restoration and conservation in the Northwest Atlantic, 1979–2016,” in NOAA Technical Memorandum NMFS-NE-246 (Woods Hole, MA: National Marine Fisheries Service).
Tversky, A., and Kahneman, D. (1991). Loss aversion in riskless choice: a reference-dependent model. Q. J. Econ. 106, 1039–1061. doi: 10.2307/2937956
Keywords: recreational fisheries management, discrete choice experiment, bag limits, size limits, Atlantic striped bass
Citation: Carr-Harris A and Steinback S (2020) Expected Economic and Biological Impacts of Recreational Atlantic Striped Bass Fishing Policy. Front. Mar. Sci. 6:814. doi: 10.3389/fmars.2019.00814
Received: 13 September 2019; Accepted: 17 December 2019;
Published: 15 January 2020.
Edited by:
Lyne Morissette, M – Expertise Marine, CanadaReviewed by:
Pablo Pita, University of Santiago de Compostela, SpainChristian T. K.-H. Stadtlander, Independent Researcher, St. Paul Minnesota, United States
Copyright © 2020 Carr-Harris and Steinback. This is an open-access article distributed under the terms of the Creative Commons Attribution License (CC BY). The use, distribution or reproduction in other forums is permitted, provided the original author(s) and the copyright owner(s) are credited and that the original publication in this journal is cited, in accordance with accepted academic practice. No use, distribution or reproduction is permitted which does not comply with these terms.
*Correspondence: Andrew Carr-Harris, YW5kcmV3LmNhcnItaGFycmlzQG5vYWEuZ292