 Paul Vriend
 Caroline van Calcar
 Merel Kooi
 Harm Landman5
 Tim van Emmerik
- 1The Ocean Cleanup, Rotterdam, Netherlands
- 2Hydrology and Quantitative Water Management Group, Wageningen University & Research, Wageningen, Netherlands
- 3Faculty of Civil Engineering and Geosciences, Delft University of Technology, Delft, Netherlands
- 4Aquatic Ecology and Water Quality Management Group, Wageningen University & Research, Wageningen, Netherlands
- 5Tauw BV, Capelle aan den IJssel, Netherlands
Most marine litter pollution is assumed to originate from land-based sources, entering the marine environment through rivers. To better understand and quantify the risk that plastic pollution poses on aquatic ecosystems, and to develop effective prevention and mitigation methods, a better understanding of riverine plastic transport is needed. To achieve this, quantification of riverine plastic transport is crucial. Here, we demonstrate how established methods can be combined to provide a rapid and cost-effective characterization and quantification of floating macroplastic transport in the River Rhine. We combine visual observations with passive sampling to arrive at a first-order estimate of macroplastic transport, both in number (10–75 items per hour) and mass per unit of time (1.3–9.7 kg per day). Additionally, our assessment gives insight in the most abundant macroplastic polymer types the downstream reach of the River Rhine. Furthermore, we explore the spatial and temporal variation of plastic transport within the river, and discuss the benefits and drawbacks of current sampling methods. Finally, we present an outlook for future monitoring of major rivers, including several suggestions on how to expand the rapid assessment presented in this paper.
Introduction
Global plastic production has increased exponentially over the last decades and is expected to further increase (Thompson et al., 2004; Geyer et al., 2017). Plastic enters the environment mainly as the result of mismanaged waste (Lebreton and Andrady, 2019). Besides ethical and esthetic concerns, plastic potentially has negative effects on human livelihood and organisms in aquatic environments (Derraik, 2002; Gall and Thompson, 2015; Wilcox et al., 2015; Koelmans et al., 2017; O Conchubhair et al., 2019). Most research to date focuses either on the marine environment and on microplastics (i.e., particles <5 mm), despite the assumption that rivers are considered a major source of marine macroplastic litter (Wagner et al., 2014; Jambeck et al., 2015; Best, 2018; Blettler et al., 2018; van Emmerik and Schwarz, 2020). Recent modeling efforts suggest that 1.15–2.41 million tonnes of plastic waste enters the oceans via rivers annually (Lebreton et al., 2017). Improving such modeling estimates requires field data for calibration, but data on macroplastic transport remains scarce.
Three types of quantification methods are commonly employed to quantify plastic transport from rivers to oceans: (1) active sampling, (2) passive sampling, and (3) visual observations (van Emmerik and Schwarz, 2020). Active sampling methods include the grabbing of water and sediment samples (Guerranti et al., 2017; Leslie et al., 2017), trawling from boats or bridges (Moore et al., 2011; Lechner et al., 2014; van Emmerik et al., 2018), and motor water pumps with attached nets or sieves (Di and Wang, 2018; Rodrigues et al., 2018). Data collection aims at answering specific questions and can be done at different locations and times, allowing for good comparison between rivers. Active sampling methods are suited for quantifying aquatic microplastic concentrations, but are less suited for macroplastic since sample volumes are usually rather small and sampling is limited by e.g., net openings or pump outlet sizes (e.g., Di and Wang, 2018). Additionally, these methods require special equipment and even infrastructure, and are often labor intensive (van der Wal et al., 2015).
Passive sampling is performed using existing infrastructure, without the need of additional equipment. Passive sampling includes the analysis of plastic collected by municipal waste handlers (Lindquist, 2016; Lahens et al., 2018), fish fykes (Morritt et al., 2014) and waste collection booms (Gasperi et al., 2014; Tramoy et al., 2019b). Using existing infrastructure without extra equipment makes passive sampling relatively cheap and less labor intensive. However, samples often either are not tailored toward specific research questions or have a hotspot approach. Additionally, they are not flexible in terms of sampling location since they are dependent on existing infrastructure (e.g., Gasperi et al., 2014; Tramoy et al., 2019b).
Visual observations are (often) simple and straightforward. They include visual counting from bridges (González-Fernández and Hanke, 2017; Crosti et al., 2018; van Emmerik et al., 2018; van Calcar and van Emmerik, 2019) and plastic litter identification on riverbanks (Rech et al., 2015; Kiessling et al., 2019). These methods are easy to apply, and data collection can be done by either professionals or through citizen science (e.g., Rech et al., 2015; Kiessling et al., 2019). Visual observation can be done at different locations and times, allowing for good comparison between rivers. A disadvantage is the human bias that can occur when visually identifying plastics, for example, small or transparent particles are easily overlooked (Geraeds et al., 2019). Furthermore, infrastructure such as bridges and the availability of skilled observers are a prerequisite for applying this method (Geraeds et al., 2019).
To date, most rivers lack (long-term) measurement infrastructure to quantify plastic transport. Yet, we urgently need to characterize riverine plastic transport in order to quantify the plastic concentrations in rivers, and the transport from rivers to the oceans. Increased understanding of plastic transport processes can in turn be used to improve modeling approaches (e.g., Lebreton et al., 2017; Schmidt et al., 2017), and to develop prevention and mitigation strategies.
We present a rapid assessment of macroplastics in rivers, which combines passive sampling and visual observations. This method is a variation on existing methods (e.g., González-Fernández and Hanke, 2017; van Emmerik et al., 2018; van Calcar and van Emmerik, 2019) that has been altered for situations where data on riverine transport is required in a short timeframe, such as for the determination of locations for long term monitoring campaigns for riverine macroplastic transport. Using this method, we monitored both the plastic flux and the plastic composition in the river Rhine. To date, research on plastic pollution in the Rhine has been mainly focused on microplastics (<5 mm, e.g., Kiessling et al., 2019; Klein et al., 2015; Leslie et al., 2017; Mani et al., 2019). The only reported assessment of macroplastic transport was done by van der Wal et al. (2015). The River Rhine is one of Europe’s main rivers, and a long-term monitoring strategy is crucial to quantify, understand and decrease riverine macroplastic transport. The goals of this paper are to (1) demonstrate the application of visual and passive macroplastic quantification methods to a major river in a limited timeframe, (2) estimate macroplastic transport from the Rhine to the North Sea, and (3) provide an outlook to future plastic long-term monitoring in rivers.
Methods
We characterized macroplastic transport in one of the Rhine’s distributaries that discharges into the North Sea (Figure 1A). The Rhine is 1,230 km long and is the main drain of North-Western Europe (Mani et al., 2015). Its catchment area encompasses densely populated and heavily industrialized areas such as the Ruhr area and the port of Rotterdam. We collected plastic data through visual observations and passive sampling, which will be discussed in more detail in the next sections. Additional wind speed and direction data were gathered from the weather station at Rotterdam-The Hague airport1. Discharge data at “Lobith” (120 km upstream) and “Hagestein hoog” (45 km upstream) stations were retrieved from Rijkswaterstaat2.
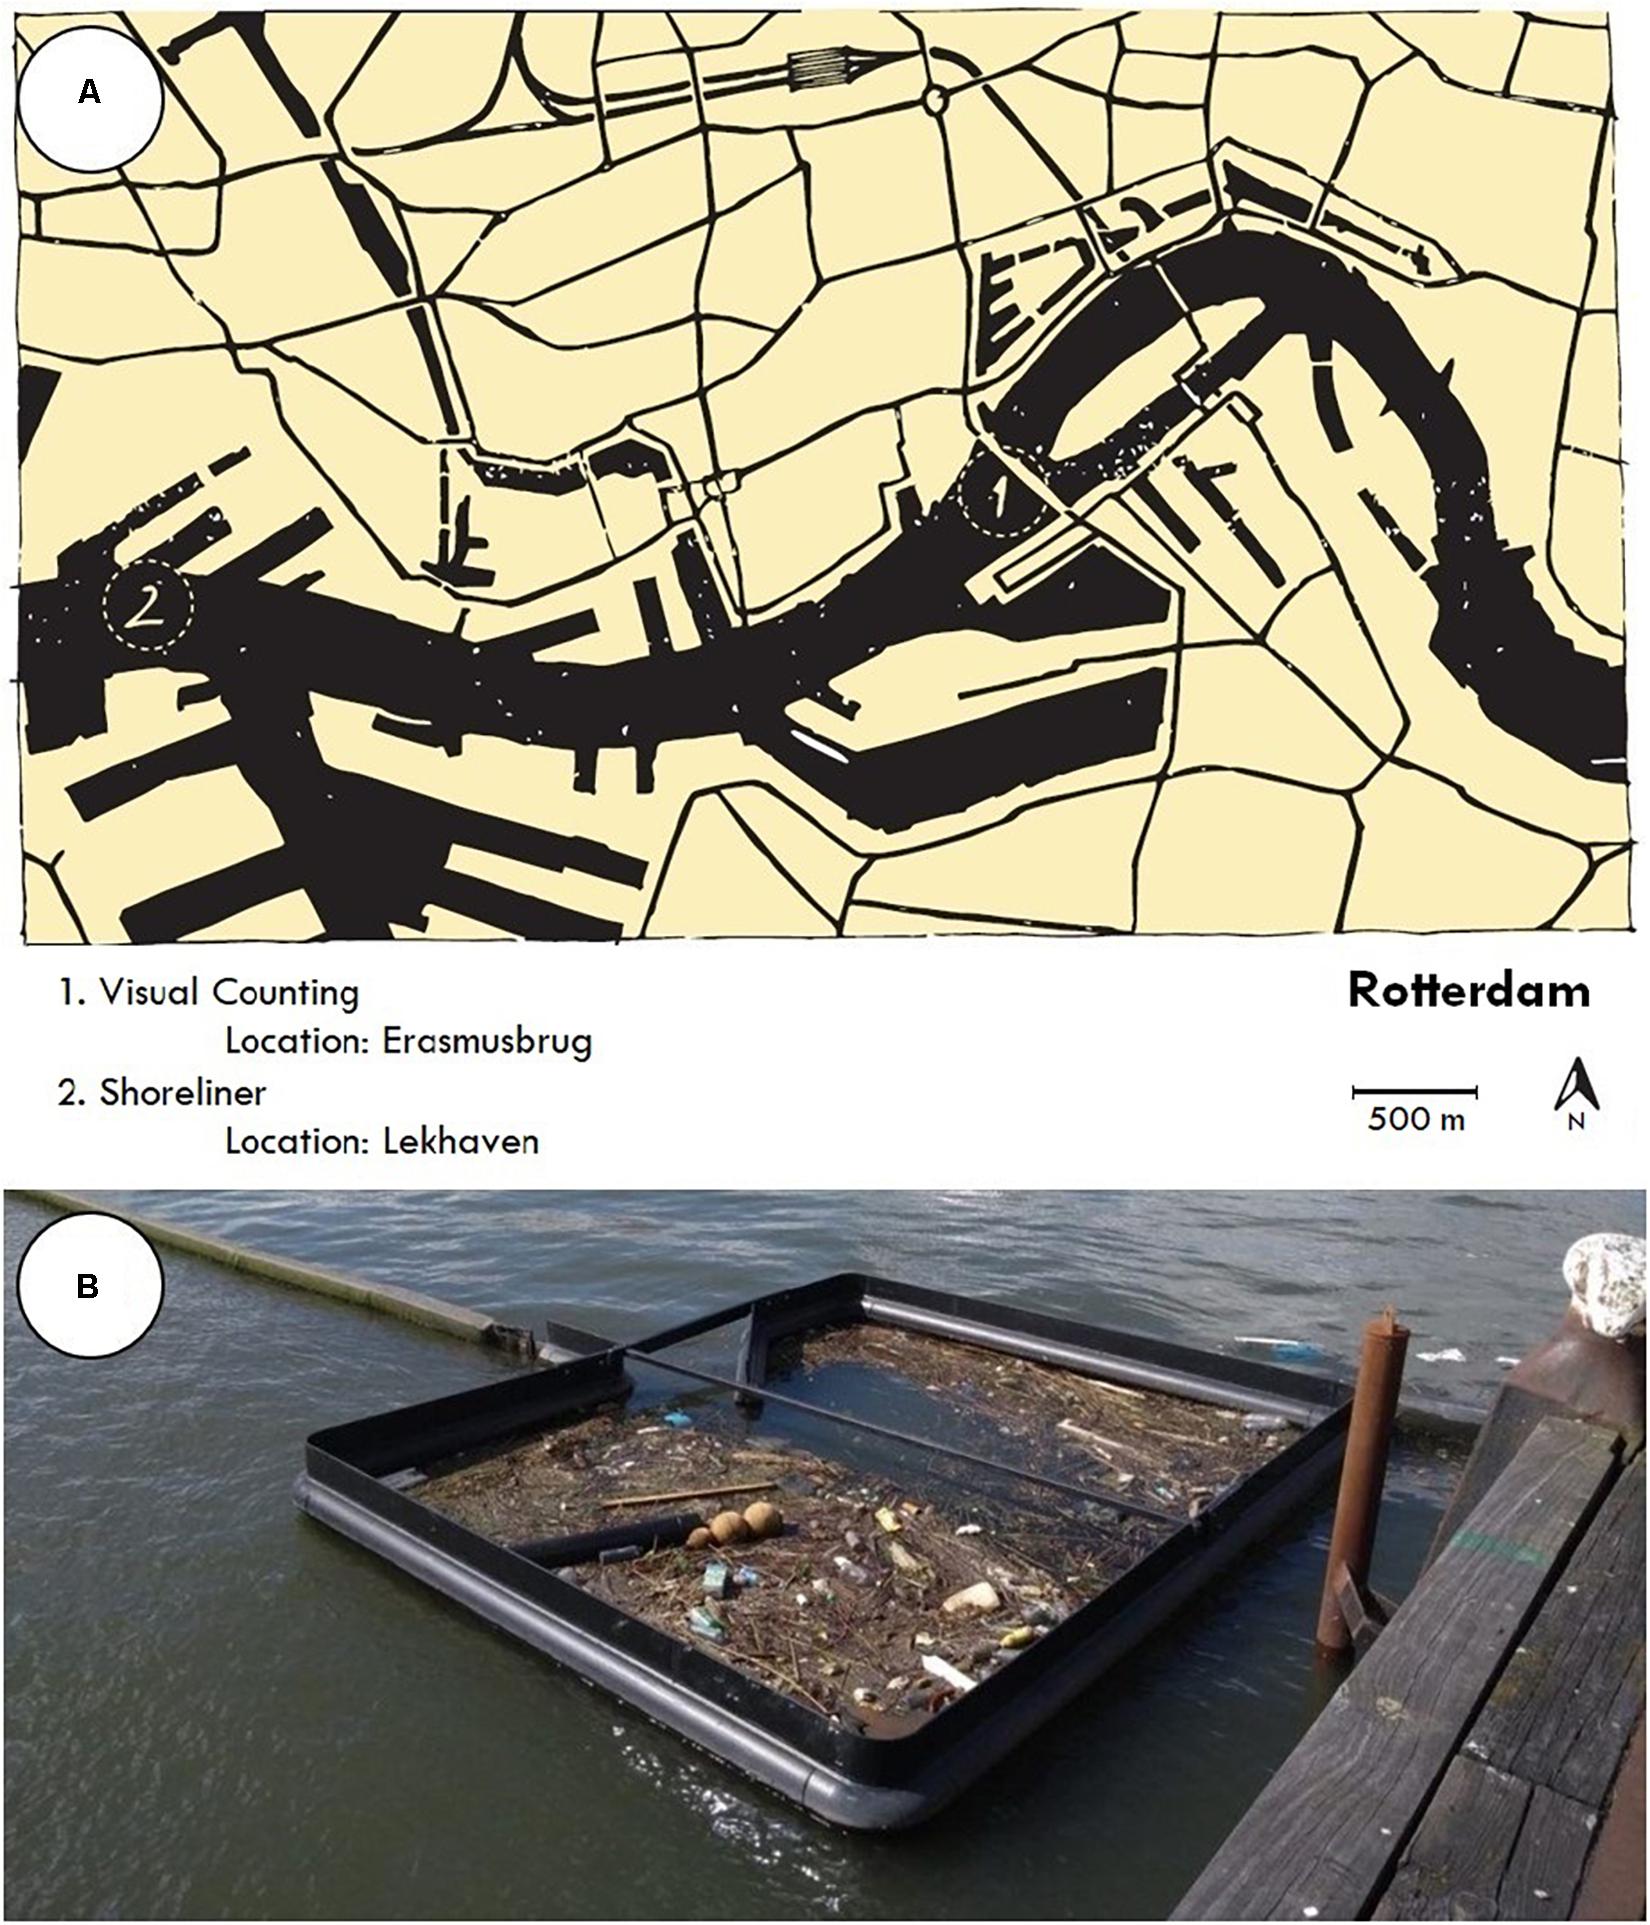
Figure 1. Sampling location and setup, with (A) the measurement locations, with the river mouth located approximately 30 km westwards (Credit: Cher van den Eng) and (B) a photo of the Shoreliner located in the Lekhaven, with the collection boom leading to the collection eye via a non-return valve (Credit: Tauw).
Visual Observation
Plastic flux measurements were done following the visual observation method of González-Fernández and Hanke (2017) and van Emmerik et al. (2018). Visual counting was performed daily on the Erasmusbrug (bridge) in Rotterdam, Netherlands, on three consecutive days, from 23 to 25 October 2018, in a period typically characterized by low river discharge in the Rhine (Shabalova et al., 2003). Measurements were done between 10 AM and 3 PM. At this location, the Rhine experiences tidal influences. Plastic observations were only done during ebb tide, when the flow was directed toward the ocean. The river is approximately 500 m wide at the measuring location. The bridge was divided into six equal segments. At each of these segments, macroplastic transport was counted for 20 min. Three observers were counting simultaneously, resulting in the full width of the bridge being counted in 40 min. Three full cross sections of the river were counted per day. These cross sections were used to determine the total macroplastic (particles >5 cm) flux in items per hour as well as its horizontal distribution. A 5 cm lower limit was chosen as it was the estimated limit of observation given the distance between the observers and the water surface.
Passive Sampling
The plastic composition was measured via passive sampling, using riverine litter collected from the Shoreliner litter trap (Tauw), located in the Lekhaven (port), Rotterdam (Figure 1B). The Shoreliner passively collected riverine litter that accumulated in ports predominantly due to wind, tidal influences and flow of the river. The Shoreliner has a conductor boom and a collection eye. The conductor consists of an expanded polystyrene (EPS) beam surrounded by a woven water permeable filter cloth that extends half a meter below the water surface. The EPS beam runs along the entire riverbank (approximately 115 m), guiding the floating waste to the collection eye. This collection eye is approximately 25 m2 and contains a non-return valve that closes when the wind direction changes. For this study, a subsample of 6 kg wet mass was collected and characterized following the protocol of van Emmerik et al. (2018). First, the sample was divided into plastics, organics and rest litter, and weighed per category. Second, the plastic was subdivided into six polymer types: polystyrene (PS), expanded polystyrene (EPS), polyethylene terephthalate (PET), soft polyolefins (POsoft), hard polyolefins (POhard) and other plastics. Note that PO (soft and hard) includes both polyethylene (PE) and polypropylene (PP). This classification was used as it is easily applicable in the field (van Emmerik et al., 2018). The total dry weight was determined per polymer type, as well as for each individual plastic item. Additionally, the longest diameter of each individual plastic item was measured.
Combining Passive Sampling With Visual Observation
The previously elaborated plastic flux measurements were summed over the river width to arrive at the total plastic transport in plastic items per 20 min, which was then scaled linearly to hourly values. The plastic item analysis from the sample of the Shoreliner was used to determine the mean mass per plastic item, for items ≥5 cm, as that was the estimated minimum observed item size during the visual observations. The floating macroplastic transport Mp (kg/h) was estimated using:
with hourly mean plastic transport p [items/hour] and mean mass per plastic item mp [kg/item].
Results and Discussion
Plastic concentrations in the Rhine were found to vary over time and space (Figure 2). The total plastic flux varied between 10 and 75 items per hour, with no constant distribution over the cross-sections (Figure 2). On October 23, most plastics were transported at the south-eastern side of the river, but on October 24 and 25, most plastics were transported at the opposite, north-western side. Observed discharge remained stable during the measuring period (737 m3/s) at Lobith (entry point of the Rhine to the Netherlands). Discharge at the measurement location is influenced by both the two tributary rivers (Waal and Lek) and the tidal dynamics. At the location closest to the measurement location (Hagestein hoog, 45 km upstream), discharge was flowing downstream 71, 84, and 42% of the time on 23, 24, and 25 October, respectively. This variation in flow dynamics may explain the changes in the cross-sectional distribution of macroplastics. Moreover, changing wind direction and navigation activities are likely to have caused the variation in horizontal spreading.
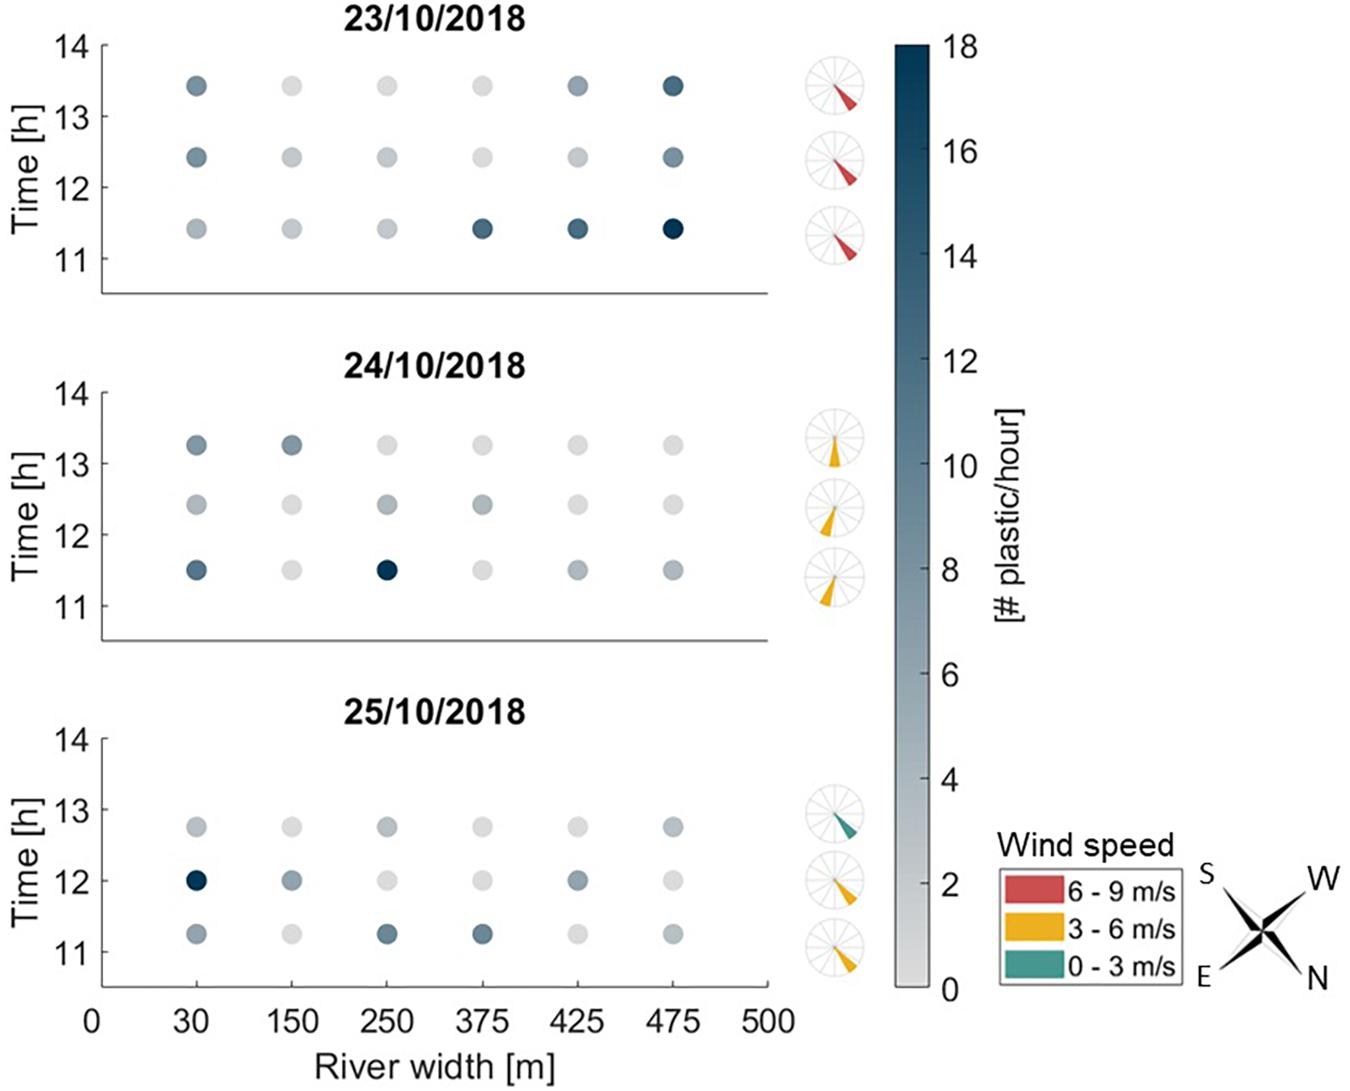
Figure 2. Plastic concentrations in the river Rhine, with the concentration distribution over the river width (blue dots), the wind direction (with the wind direction oriented according to compass given) and wind velocity in m/s, all for 3 days, three time points per day.
In total, 508 plastic items were collected from the Shoreliner (Supplementary Material). The average mass of items ≥5 cm (n = 311) was 5.38 g (σ = 30.45 g). Polyolefin (PO) was found to be the most abundant plastic, with hard PO contributing most to the total plastic mass, and soft PO pieces counted most often (Figures 3A,B) Plastics comprised 13% in mass from the total sample from the Shoreliner (Landman and Pikaar, 2019). The majority of the analyzed items were smaller than 50 cm, although one item of 115 cm was sampled. Number concentrations decreased with increasing item size, with most items (85%) smaller than 10 cm.
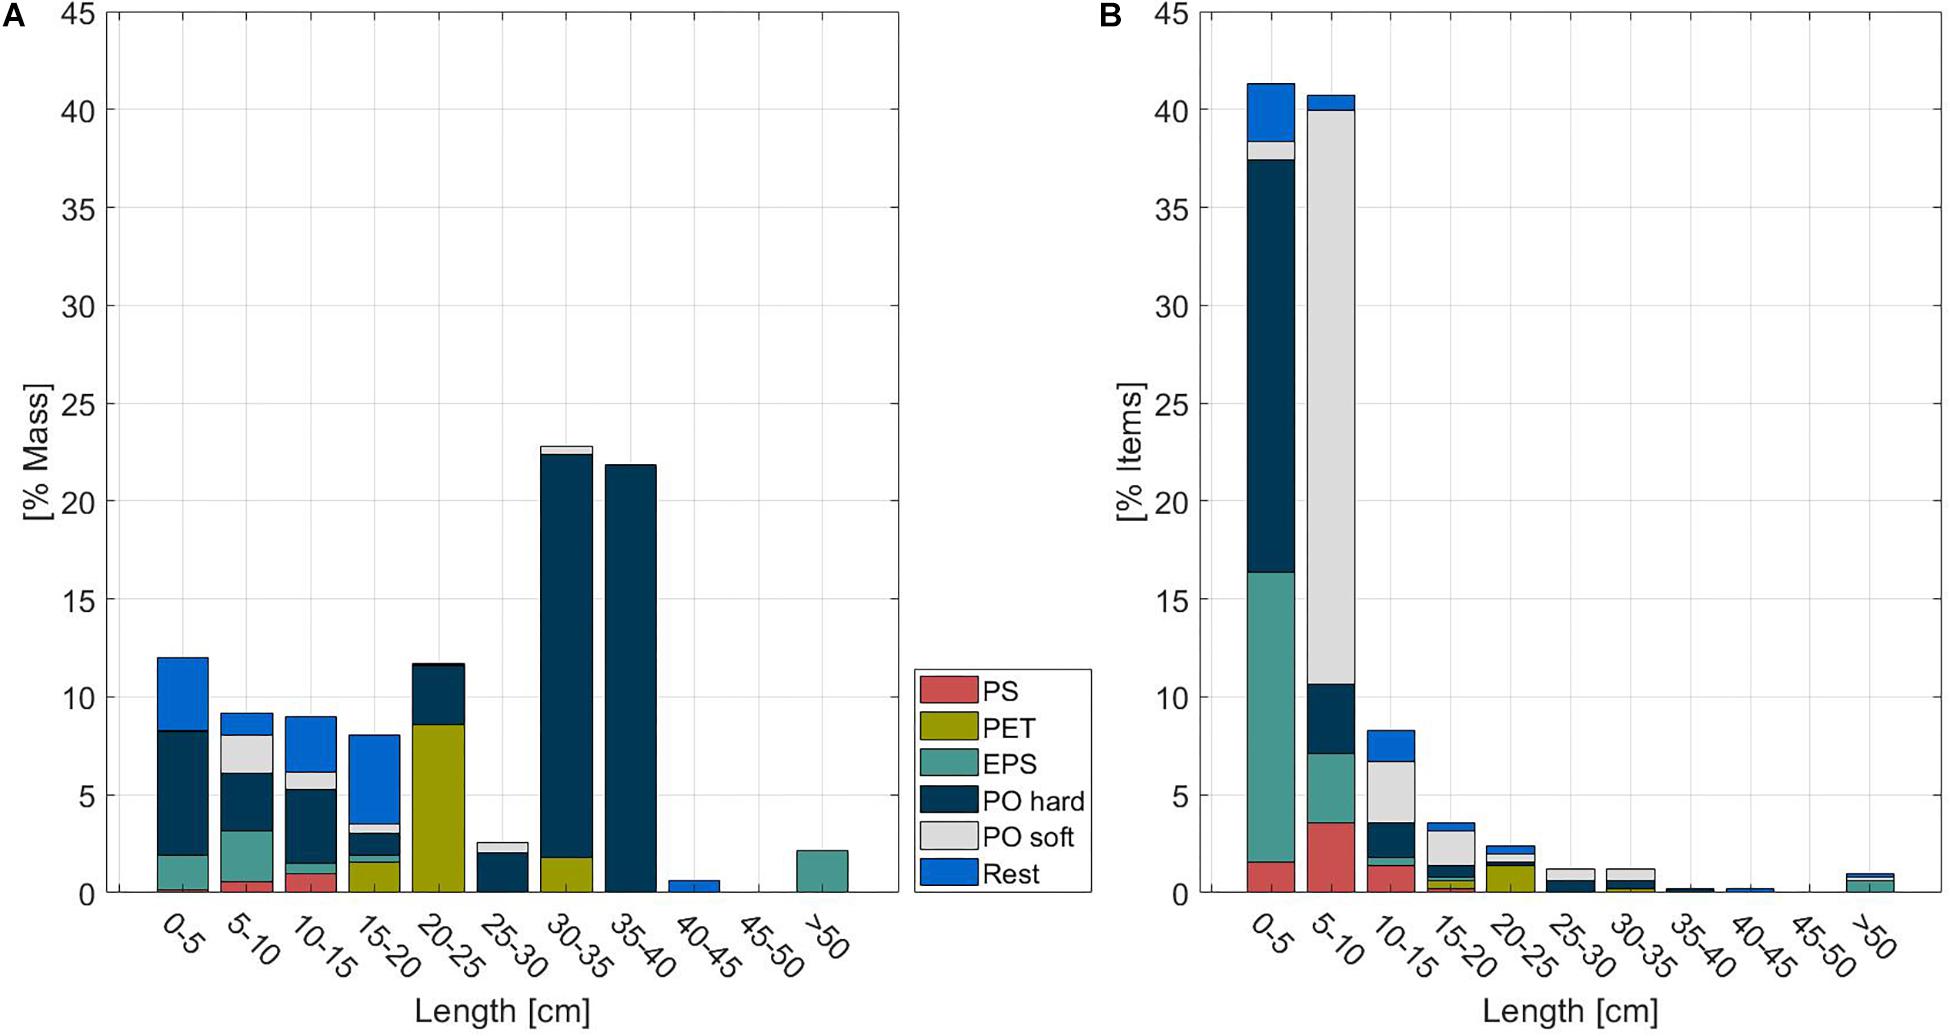
Figure 3. The plastic composition as collected in the Shoreliner as (A) a function of mass and (B) the plastic composition as collected in the Shoreliner as a function of number of items.
Assuming the distribution of plastic items collected in the Shoreliner is representative for the distribution of plastic items in the Rhine, the macroplastic mass transport from the Rhine to the North Sea was calculated by combining the mean plastic transport of 10–75 items per hour with the mean mass of the items ≥5 cm. This resulted in a mean transport of 1.3–9.7 kg per day, with a median transport of 5.8 kg daily. Using the average mass of 3.2 g per plastic item, as measured by van Emmerik et al. (2018) in the Saigon River, and used by Castro-Jiménez et al. (2019) for the Rhône River, with the observed 10–75 items per hour, yields a similar transport of 0.8–5.8 kg per day. Both mean plastic transport estimates are lower than the estimated surface transport of approximately 16–160 kg per day found by van der Wal et al. (2015). Differences in these numbers could be explained by seasonal differences since van der Wal et al. (2015) collected data during August and the beginning of September. River discharge in the Rhine is typically at its annual low in October, which may have resulted in an annual minimum plastic transport as well. Moreover, van der Wal et al. (2015) included a larger item size range for their analysis (≥3.2 cm) which could further explain the differences.
Comparing the observed macroplastic transport in the Rhine (10–75 items/hour) to other rivers that have been examined with similar methods and during low discharge, it can be concluded that the Rhine falls at the lower end of the spectrum (van Calcar and van Emmerik, 2019). The transport is comparable to other European rivers, such as the Tiber in Italy, which was observed to transport between 10–50 items per hour in low discharge conditions (Crosti et al., 2018), the Rhone, France, which was observed to transport between 0–20 items per hour in low discharge conditions (Castro-Jiménez et al., 2019), and the Seine, France, which transports 106–160 items per hour in low discharge conditions (van Emmerik et al., 2019c). However, the biggest difference is observed when comparing the results of the Rhine and South-East Asian rivers such as the Saigon River in Vietnam or the Ciliwung in Jakarta, Indonesia. For these rivers, macroplastic transport was measured between 2,000 –20,000 items per hour (van Emmerik et al., 2018, 2019b) and 3,000–28,000 items per hour (van Emmerik et al., 2019a), respectively.
Although item transport rates were similar, the plastic mass transport of the Rhine was three times higher than the Rhône (5.8 vs. 1.9 kg/day, respectively) (Castro-Jiménez et al., 2019). These differences can be explained by the differences in the average mass of the plastic items in both rivers. The real mass transport values could be more similar since the average mass utilized by Castro-Jiménez et al. (2019) is based on data obtained in Vietnam. The Rhine mass transport is several orders of magnitude lower than what was found for the Saigon River (200–300 kg/day) (van Emmerik et al., 2018) and the Jakarta rivers (5700 kg/day) (van Emmerik et al., 2019a), which is more in line with the modeling results from Jambeck et al. (2015) and Lebreton et al. (2017). These studies expected that Asia is the main source of marine plastic litter. However, the measured mass transport in the Rhine is considerably less than the 1900–6300 kg per day as predicted by Lebreton et al. (2017). This discrepancy can be caused by (1) limited measurement period for the Rhine, (2) limited plastic transport component examined by the method, and (3) overestimation of the model. Rivers with longer available plastic transport time series demonstrated that plastic transport may exhibit strong seasonality, with monthly variations up to an order of magnitude (e.g., Crosti et al., 2018; Castro-Jiménez et al., 2019; van Emmerik et al., 2019c). Our estimate of daily macroplastic transport may therefore be an underestimation. Further underestimation is introduced since the current method does not consider plastic transport within the water column or on the riverbed. On the other hand, the available models (Lebreton et al., 2017; Schmidt et al., 2017) overestimate large river basins because of a concave upward relation between catchment runoff and plastic transport, which is an artifact of few available calibration data. A recent modeling study estimated the mean daily transport that is in the same order of magnitude of the transport our assessment (Meijer et al., 2019).
The macroplastic composition observations differ from other rivers that have been observed with a similar methodology. For example, EPS was the main plastic category being observed in the Saigon River (van Emmerik et al., 2018) and POsoft in the Ciliwung (van Emmerik et al., 2019a). These data therefore suggest that rivers can exhibit a specific plastic footprint unique to that river. Erni-Cassola et al. (2019) have shown that the most abundant plastics at the ocean surface are polypropylene and polyethylene, both polyolefins. Therefore, it seems that the Rhine does emit the most commonly found plastic in the ocean to the marine environment. It is therefore important to expand these measurements to better understand plastic composition.
Comparing applicability of the method described in this paper with other methods used on the same river by van der Wal et al. (2015) reveals the advantages of combining visual observations with passive sampling. First, unlike van der Wal et al. (2015), this method does not require large equipment such as cranes, boats and sampling equipment. Instead, plastic statistic can be gathered using infrastructure that is already in place such as the Shoreliner, or by gathering samples at natural collection zones such as riverbanks, weirs and sluices (Tramoy et al., 2019a). Because of this, the rapid assessment method can be applied using less resources. Second, the rapid assessment also gives an indication on the spatial and temporal distribution of floating macroplastics in the river, which can help with understanding the behavior of plastic within rivers. This information is lost when samples are taken across the whole river width (van der Wal et al., 2015). Last, although the current measuring period was rather limited, upscaling the method in both space and can be facilitated using limited effort and resources. Due to its limited dependency on resources and human labor, an assessment as presented in our study can be easily used for either first-order rapid assessments or long-term monitoring campaigns to study spatiotemporal variations in riverine macroplastic transport.
Outlook
We have identified three steps that can be taken to expand monitoring riverine macroplastic: (1) further development of the method, (2) expansion in space, and (3) expansion in time. First, we see opportunities for further development of the method. For example, visual counting could be automated using cameras and artificial intelligence models (machine learning) detecting the plastic particles in the river (van Oeveren et al., 2018; Basurko et al., 2019). This would allow for autonomous monitoring of plastic flux in rivers, significantly reducing manual labor requirements and reducing the biases introduced by humans. Furthermore, Unmanned Aerial Vehicles (UAVs) could be used to collect footage of plastic transport in rivers, allowing this method to be deployed anywhere, independent of the infrastructure. This would allow for measuring at for example the river mouth, to accurately determine the plastic emissions into the ocean (Geraeds et al., 2019). A similar method was already presented by Martin et al. (2018) to monitor beach litter. Protocols should be developed for taking a representative sample from litter traps or from other infrastructure, and for analyzing the samples. We also see opportunities to predict the microplastic flux using the presented method. Microplastics are omnipresent in rivers, but measurements are very labor intensive (Shim et al., 2017). However, a recent study showed that microplastic have continuous size, shape and density properties (Kooi and Koelmans, 2019). Similar to their findings, we also found a rapid, continuous decrease in concentration with increasing particle size (Figure 3B). It is possible that the continuous distributions for microplastic could also apply to macroplastic. If we were to link micro- and macroplastic properties and concentrations, macroplastic flux measurements could potentially form a proxy for the microplastic fluxes. Last, current method assumes that the observed macroplastic is directly transported toward the North Sea. However, the effects of tidal dynamics could influence the transport of macroplastics toward the sea, which is a topic that remains understudied (van Emmerik et al., 2018, 2019b,c). Therefore, the method could be developed further to include the behavior of macroplastics in the estuary.
Second, it is necessary to expand the spatial scale at which this method is applied. This expansion should be both in the amount of monitoring locations on the same river, and the total number of rivers monitored. The expansion in the number of monitoring locations on the same river would increase the understanding of riverine macroplastic behavior and allows for the answering of other fundamental questions on plastic transport such as the influence of population density (by having measuring points before and after major cities), and the identification of plastic sources and sinks. Due to its simple nature, visual counting can be scaled up easily through citizen science, similar to how Davids et al. (2019) and Seibert et al. (2019) applied citizen science to perform hydrological observations. Citizen science would allow for large scale monitoring around the world, especially with the use of simple apps such as CrowdWater (Seibert et al., 2019). With the increase in total number of rivers monitored, it is important to consider for which purposes the data is collected (Buytaert et al., 2014). A central use for this data is for calibration of plastic emission models (Lebreton et al., 2017; Schmidt et al., 2017). It would therefore be important to prioritize the monitoring of these rivers to be able to verify or falsify these estimates and to aid the direct targeting of mitigation strategies.
Finally, we emphasize the importance of long-term monitoring efforts. The current method was developed to gather data on a short time scale. This data can be used for a quick comparison between two locations in a river, or to determine where long term measuring campaigns should be located. The results were gathered in a relatively short amount of time compared to other plastic quantification studies, and with low hydrometeorological variability. Long term research allows for studying plastic transport variability and its relationship with rainfall, wind speed and direction, and river discharge.
Concluding Remarks
Our results demonstrate that the combination of visual observations and passive sampling allows for the rapid assessment of floating macroplastics in rivers. With this paper we (1) provide new insights in macroplastic debris transport for the river Rhine, that can be used to develop long-term monitoring strategies, and (2) show how a combination of simple methods can be used to perform a rapid assessment of macroplastic debris transport in a major European river. We emphasize that similar, and more extended, efforts are crucial to optimize plastic pollution prevention and mitigation strategies.
Data Availability Statement
All datasets generated for this study are included in the article/Supplementary Material.
Author Contributions
PV, CC, and TE designed the study. PV and CC collected the data. PV prepared the initial draft. PV, TE, HL, and MK wrote the final manuscript. RP and HL designed and operated the Shoreliner.
Conflict of Interest
RP and HL are employed by the company Tauw BV. PV, CC, and TE were formerly employed by The Ocean Cleanup.
The remaining author declares that the research was conducted in absence of any commercial or financial relationships that could be construed as a potential conflict of interests.
Acknowledgments
We thank The Ocean Cleanup donors who helped fund this research. We thank Cher van den Eng for providing the artwork for Figure 1A, Paul Stook for his efforts in the design process of the Shoreliner, and Gert Vriend for his input during the writing process. We thank Selma Damsteeg – van Berkel, Mathijs Bruins, and Henning Lagemann for their efforts as plastic observers. We also thank the reviewers for their constructive feedback that helped improving this manuscript.
Supplementary Material
The Supplementary Material for this article can be found online at: https://www.frontiersin.org/articles/10.3389/fmars.2020.00010/full#supplementary-material
Footnotes
References
Basurko, O. C., Epelde, I., Liria, P., Ruiz, I., Delpey, M., Declerck, A., et al. (2019). Monitoring riverine litter by advanced technology. Eur. Geosci. Union Gen. Assemb. 21, EGU2019–EGU18999.
Best, J. (2018). Anthropogenic stresses on the world’s big rivers. Nat. Geosci. 12, 7–21. doi: 10.1038/s41561-018-0262-x
Blettler, M. C., Abrial, E., Khan, F. R., Sivri, N., and Espinola, L. A. (2018). Freshwater plastic pollution: Recognizing research biases and identifying knowledge gaps. Water Res. 143, 416–424. doi: 10.1016/j.watres.2018.06.015
Buytaert, W., Zulkafli, Z., Grainger, S., Acosta, L., Alemie, T. C., Bastiaensen, J., et al. (2014). Citizen science in hydrology and water resources: opportunities for knowledge generation, ecosystem service management, and sustainable development. Front. Earth Sci. 2:26. doi: 10.3389/feart.2014.00026
Castro-Jiménez, J., González-Fernández, D., Fornier, M., Schmidt, N., and Sempere, R. (2019). Macro-litter in surface waters from the Rhone River: Plastic pollution and loading to the NW Mediterranean Sea. Mar. Pollut. Bull. 146, 60–66. doi: 10.1016/j.marpolbul.2019.05.067
Conchubhair, D., Fitzhenry, D., Lusher, A., King, A. L., Van Emmerik, T., Lebreton, L., et al. (2019). Joint effort among Research Infrastructures to quantify the impact of plastic debris in the ocean. Environ. Res. Lett. 14:65001.
Crosti, R., Arcangeli, A., Campana, I., Paraboschi, M., and González, D. (2018). ‘Down to the river’ : amount, composition, and economic sector of litter entering the marine compartment, through the Tiber river in the Western Mediterranean Sea. Rend. Lincei. Sci. Fis. e Nat. 29, 859–866. doi: 10.1007/s12210-018-0747-y
Davids, J. C., Devkota, N., Pandey, A., Prajapati, R., Ertis, B. A., Rutten, M. M., et al. (2019). Soda bottle science-citizen science monsoon precipitation monitoring in Nepal. Front. Earth Sci. 7:46. doi: 10.3389/feart.2019.00046
Derraik, J. G. B. (2002). The pollution of the marine environment by plastic debris: a review. Mar. Pollut. Bull. 44, 842–852. doi: 10.1016/s0025-326x(02)00220-5
Di, M., and Wang, J. (2018). Microplastics in surface waters and sediments of the Three Gorges Reservoir. China. Sci. Tot. Environ. 616, 1620–1627. doi: 10.1016/j.scitotenv.2017.10.150
Erni-Cassola, G., Zadjelovic, V., Gibson, M. I., and Christie-Oleza, J. A. (2019). Distribution of plastic polymer types in the marine environment. A meta-analysis. J. Hazard. Mater. 369, 691–698. doi: 10.1016/j.jhazmat.2019.02.067
Gall, S. C., and Thompson, R. C. (2015). The impact of debris on marine life. Mar. Pollut. Bull. 92, 170–179. doi: 10.1016/j.marpolbul.2014.12.041
Gasperi, J., Dris, R., Bonin, T., Rocher, V., and Tassin, B. (2014). Assessment of floating plastic debris in surface water along the Seine River. Environ. Pollut. 195, 163–166. doi: 10.1016/j.envpol.2014.09.001
Geraeds, M., Van Emmerik, T., De Vries, R., and Ab Razak, M. (2019). Riverine plastic litter monitoring using unmanned aerial vehicles (UAVs). Remote Sens 11:2045. doi: 10.3390/rs11172045
Geyer, R., Jambeck, J. R., and Lavender Law, K. (2017). Production, use, and fate of all plastics ever made. Sci. Adv. 3:e1700782. doi: 10.1126/sciadv.1700782
González-Fernández, D., and Hanke, G. (2017). Toward a harmonized approach for monitoring of riverine floating macro litter inputs to the marine environment. Front. Mar. Sci. 4:86. doi: 10.3389/fmars.2017.00086
Guerranti, C., Cannas, S., Scopetani, C., Fastelli, P., Cincinelli, A., and Renzi, M. (2017). Plastic litter in aquatic environments of Maremma Regional Park (Tyrrhenian Sea, Italy): Contribution by the Ombrone river and levels in marine sediments. Mar. Pollut. Bull. 117, 366–370. doi: 10.1016/j.marpolbul.2017.02.021
Jambeck, J. R., Geyer, R., Wilcox, C., Siegler, T., Perryman, M., Andrady, A., et al. (2015). Plastic waste inputs from land into the ocean. Science 347, 768–771. doi: 10.1126/science.1260352
Kiessling, T., Knickmeier, K., Kruse, K., Brennecke, D., Nauendorf, A., and Thiel, M. (2019). Plastic Pirates sample litter at rivers in Germany - Riverside litter and litter sources estimated by schoolchildren. Environ. Pollut. 245, 545–557. doi: 10.1016/j.envpol.2018.11.025
Klein, S., Worch, E., and Knepper, T. P. (2015). Occurrence and spatial distribution of microplastics in river shore sediments of the Rhine-Main area in Germany. Environ. Sci. Technol. 49, 6070–6076. doi: 10.1021/acs.est.5b00492
Koelmans, A. A., Besseling, E., Foekema, E., Kooi, M., Mintenig, S., Ossendorp, B. C., et al. (2017). Risks of plastic debris: unravelling fact, opinion, perception, and belief. Environ. Sci. Technol. 51, 11513–11519. doi: 10.1021/acs.est.7b02219
Kooi, M., and Koelmans, A. A. (2019). Simplifying Microplastic via Continuous Probability Distributions for Size, Shape, and Density. Environ. Sci. Technol. Lett. 6, 551–557. doi: 10.1021/acs.estlett.9b00379
Lahens, L., Strady, E., Kieu-Le, T. C., Dris, R., Boukerma, K., Rinnert, E., et al. (2018). Macroplastic and microplastic contamination assessment of a tropical river (Saigon River, Vietnam) transversed by a developing megacity. Environ. Pollut. 236, 661–671. doi: 10.1016/j.envpol.2018.02.005
Landman, H., and Pikaar, R. (2019). Eindrapportage Shoreliner Lekhaven Rotterdam. Tauw, Kenmerk: R002-1261397HLM-V02-nnc-NL. doi: 10.1016/j.envpol.2018.02.005
Lebreton, L., and Andrady, A. (2019). Future scenarios of global plastic waste generation and disposal. Palgr. Commun. 23:47.
Lebreton, L. C., Van der Zwet, J., Damsteeg, J. W., Slat, B., Andrady, A., and Reisser, J. (2017). River plastic emissions to the world’s oceans. Nat. Commun. 8:15611. doi: 10.1038/ncomms15611
Lechner, A., Keckeis, H., Lumesberger-Loisl, F., Zens, B., Krusch, R., Tritthart, M., et al. (2014). The Danube so colourful: A potpourri of plastic litter outnumbers fish larvae in Europe’s second largest river. Environ. Pollut. 188, 177–181. doi: 10.1016/j.envpol.2014.02.006
Leslie, H. A., Brandsma, S. H., Van Velzen, M. J. M., and Vethaak, A. D. (2017). Microplastics en route: Field measurements in the Dutch river delta and Amsterdam canals, wastewater treatment plants. North Sea Sediments and biota. Environ. Int. 101, 133–142. doi: 10.1016/j.envint.2017.01.018
Mani, T., Blarer, P., Storck, F. R., Pittroff, M., Wernicke, T., and Burkhardt-Holm, P. (2019). Repeated detection of polystyrene microbeads in the lower Rhine River. Environ. Pollut. 245, 634–641. doi: 10.1016/j.envpol.2018.11.036
Mani, T., Hauk, A., Walter, U., and Burkhardt-Holm, P. (2015). Microplastics profile along the Rhine River. Sci. Rep. 5:17988. doi: 10.1038/srep17988
Martin, C., Parkes, S., Zhang, Q., Zhang, X., McCabe, M. F., and Duarte, C. M. (2018). Use of unmanned aerial vehicles for efficient beach litter monitoring. Mar. Pollut. Bull. 131, 662–673. doi: 10.1016/j.marpolbul.2018.04.045
Meijer, L. J. J., van Emmerik, T., Lebreton, L., Schmidt, C., and van der Ent, R. (2019). Over 1000 rivers accountable for 80% of global riverine plastic emissions into the ocean. EarthArXiv doi: 10.31223/osf.io/zjgty
Moore, C. J., Lattin, G. L., and Zellers, A. F. (2011). Quantity and type of plastic debris flowing from two urban rivers to coastal waters and beaches of Southern California. J. Integr. Coastal Zone Manag. 11. 1, 65–73. doi: 10.5894/rgci194
Morritt, D., Stefanoudis, P. V., Pearce, D., Crimmen, O. A., and Clark, P. F. (2014). Plastic in the Thames: a river runs through it. Mar. Pollut. Bull. 78, 196–200. doi: 10.1016/j.marpolbul.2013.10.035
Rech, S., Macaya-Caquilpán, V., Pantoja, J. F., Rivadeneira, M. M., Campodónico, C. K., and Thiel, M. (2015). Sampling of riverine litter with citizen scientists-findings and recommendations. Environ. Monit. Assess. 187:335. doi: 10.1007/s10661-015-4473-y
Rodrigues, M. O., Abrantes, N., Gonçalves, F. J. M., Nogueira, H., Marques, J. C., and Gonçalves, A. M. M. (2018). Spatial and temporal distribution of microplastics in water and sediments of a freshwater system (Antuã River, Portugal). Sci. Total Environ. 633, 1549–1559. doi: 10.1016/j.scitotenv.2018.03.233
Schmidt, C., Krauth, T., and Wagner, S. (2017). Export of plastic debris by rivers into the sea. Environ. Sci. Technol. 51, 12246–12253. doi: 10.1021/acs.est.7b02368
Seibert, J., Strobl, B., Etter, S., Hummer, P., and van Meerveld, H. J. (2019). Virtual staff gauges for crowd-based stream level observations. Front. Earth Sci. 7:70. doi: 10.3389/feart.2019.00070
Shabalova, M. V., Van Deursen, W. P. A., and Buishand, T. A. (2003). Assessing future discharge of the river Rhine using regional climate model integrations and a hydrological model. Clim. Res. 23, 233–246. doi: 10.3354/cr023233
Shim, W. J., Hong, S. H., and Eo, S. E. (2017). Identification methods in microplastic analysis: a review. Analytic. Methods 9, 1384–1391. doi: 10.1039/c6ay02558g
Thompson, R. C., Olsen, Y., Mitchell, R. P., Davis, A., Rowland, S. J., John, A. W., et al. (2004). Lost at sea: where is all the plastic? Science 304, 838–838. doi: 10.1126/science.1094559
Tramoy, R., Gasperi, J., Dris, R., Colasse, L., Fisson, C., Sananes, S., et al. (2019b). Assessment of the plastic inputs from the Seine basin to the sea using statistical and field approaches. Front. Mar. Sci. 6:151. doi: 10.3389/fmars.2019.00151
Tramoy, R., Colasse, L., Gasperi, J., and Tassin, B. (2019a). Plastic debris dataset on the Seine river banks: Plastic pellets, unidentified plastic fragments and plastic sticks are the Top 3 items in a historical accumulation of plastics. Data Brief 23:103697. doi: 10.1016/j.dib.2019.01.045
van Calcar, C., and van Emmerik, T. (2019). Abundance of plastic debris across European and Asian rivers. Environ. Res. Lett. 14:124051. doi: 10.1088/1748-9326/ab5468
van der Wal, M., van der Meulen, M., Tweehuijsen, G., Peterlin, M., Palatinus, A., Kovac, M., et al. (2015). SFRA0025: Identification and Assessment of Riverine Input of (Marine) Litter – Final report for the European Commission DG Environment under Framework. Contract No ENV.D.2/FRA/2012/0025.
van Emmerik, T., Kieu-Le, T. C., Loozen, M., van Oeveren, K., Strady, E., Bui, X. T., et al. (2018). A Methodology to Characterize Riverine Macroplastic Emission Into the Ocean. Front. Mar. Sci. 5:372. doi: 10.3389/fmars.2018.00372
van Emmerik, T., Loozen, M., van Oeveren, K., Buschman, F., and Prinsen, G. (2019a). Riverine plastic emission from Jakarta into the ocean. Environ. Res. Lett. 14:8.
van Emmerik, T., and Schwarz, A. (2020). Plastic debris in rivers. WIREs Water 7:e1398. doi: 10.1002/wat2.1398
van Emmerik, T., Strady, E., Kieu-Le, T. C., Nguyen, L., and Gratiot, N. (2019b). Seasonality of riverine macroplastic transport. Sci. Rep. 9, 1–9. doi: 10.1038/s41598-019-50096-1
van Emmerik, T., Tramoy, R., van Calcar, C., Alligant, S., Treilles, R., Tassin, B., et al. (2019c). Seine plastic debris transport tenfolded during increased river discharge. Front. Mar. Sci. 6:642. doi: 10.3389/fmars.2019.00642
van Oeveren, K., Loozen, M., and Van Emmerik, T. (2018). Towards automated plastic detection in rivers. MICRO 2018, 19–23. doi: 10.1016/j.chroma.2016.06.051
Wagner, M., Scherer, C., Alvarez-Muñoz, D., Brennholt, N., Bourrain, X., Buchinger, S., et al. (2014). Microplastics in freshwater ecosystems: what we know and what we need to know. Environ. Sci. Eur. 26:12. doi: 10.1186/s12302-014-0012-7
Keywords: macroplastic, passive sampling, visual sampling, riverine plastic, flux measurements, hydrology, marine litter
Citation: Vriend P, van Calcar C, Kooi M, Landman H, Pikaar R and van Emmerik T (2020) Rapid Assessment of Floating Macroplastic Transport in the Rhine. Front. Mar. Sci. 7:10. doi: 10.3389/fmars.2020.00010
Received: 19 August 2019; Accepted: 09 January 2020;
Published: 28 January 2020.
Edited by:
Francois Galgani, Institut Français de Recherche pour l’Exploitation de la Mer (IFREMER), FranceReviewed by:
Monica F. Costa, Federal University of Pernambuco, BrazilHai Doan-Nhu, Institute of Oceanography, Vietnam
Copyright © 2020 Vriend, van Calcar, Kooi, Landman, Pikaar and van Emmerik. This is an open-access article distributed under the terms of the Creative Commons Attribution License (CC BY). The use, distribution or reproduction in other forums is permitted, provided the original author(s) and the copyright owner(s) are credited and that the original publication in this journal is cited, in accordance with accepted academic practice. No use, distribution or reproduction is permitted which does not comply with these terms.
*Correspondence: Paul Vriend, cGF1bC52cmllbmRAd3VyLm5s