 Ina Nilsen
 Jeppe Kolding
 Cecilie Hansen
 Daniel Howell
- 1Department of Biology, High Technology Centre, University of Bergen, Bergen, Norway
- 2Institute of Marine Research, Bergen, Norway
“Balanced Harvesting” (BH) has been suggested as a possible strategy to meet the objectives of the Ecosystem Approach to Fisheries, ensuring a high sustainable yield while maintaining ecosystem structure and function. BH proposes a moderate fishing mortality in proportion to productivity spread across the widest possible range of species, stocks, and sizes in an ecosystem producing a sustainable and overall non-selective harvest. The Norwegian and Barents Seas have been subjected to moderate fishing pressure on commercial species, and elements of an ecosystem-based approach to management for many years, but not the fishing pattern proposed by BH. By using an Atlantis ecosystem model of the Nordic and Barents Seas, we investigated the effects of applying a BH regime to a region with existing successful fisheries management. This was done by running simulations with combinations of historic fishing pressure and fishing mortality rates proportional to 25% of the productivity of most species and sizes. The simulations were then compared to a control run where the historical fisheries were applied. The model results showed that implementing a BH regime in the Norwegian and Barents Seas would only produce marginal increases in total yields of currently commercially exploited stocks, likely because the Norwegian fisheries are already mostly well-managed. However, expanding the fishery to include species that are not commercially exploited today did produce higher yields, especially on lower trophic levels. This study represents the first attempted examination of implementing BH based on productivity using an Atlantis ecosystem model, as well as the first investigation of BH in the Norwegian and Barents Seas. We use this model as a case study to identify the gains that species-based BH can be expected to give over well-implemented traditional fisheries management rather than simply comparing to an over-exploited system.
Introduction
Fisheries today are generally considered to be in a scarce condition with little room for further expansion with some even proclaiming that there will be nothing left to fish within the next 50 years if current trends continue (Black, 2006). According to the FAO statistics global marine capture fisheries have been flat for over 30 years with an increasing number of the unassessed stocks regarded as overfished (FAO, 2018). One of the main challenges of modern fisheries management is to develop harvest strategies that ensure efficient and maximum sustainable utilization of marine production (UNCLOS, 1982), while also preserving the structure and functioning of harvested stocks and ecosystems (CBD, 1992). The concept of Ecosystem Approach to Fisheries (EAF), based on the 1998 Malawi Principles (UNEP/CBD, 1998), has been proposed as a holistic framework to deal with these objectives.
Norway is committed by law to implement an Ecosystem-Based Fisheries Management (EBFM) in the North Sea, Norwegian Sea, and Barents Sea (Miljøverndepartementet, 2006, 2009, 2011; Olsen et al., 2007). According to Pitcher et al. (2009), implementing ecosystem-based management in Norway, in line with the code of conduct of responsible fisheries (FAO, 1995), should be relatively straightforward. Although largely regulated by conventional single-species management, Norway already scores high on ecosystem-based principles. An example of ecosystem considerations is the management of Northeast Arctic cod and Barents Sea capelin where the importance of capelin as food for cod has been considered in the capelin fishery since 1991 (ICES, 2015a). Although the broad principles of EBFM are agreed, there are uncertainties in the specific implementation, for example how to find the balance between “exploitation” and “conservation” (Howell et al., 2016).
To operationalize the objectives of the EAF, “Balanced Harvesting” (hereafter BH) has been suggested as one possible strategy to ensure a high sustainable yields while maintaining ecosystem structure and function. Garcia et al. (2012) defined BH as “a moderate fishing pressure spread across the widest possible range of species, stocks, and sizes of an ecosystem, in proportion to their natural productivity so that the relative size and species composition is maintained.” Clearly, BH is not a necessary part of an EAFs. Nor would it be a complete solution since any overall harvesting strategy would need to work hand in hand with, for example, strategies to protect vulnerable habitats. However, BH has been proposed as one possible component of full Ecosystem-Based Fishery Management, and we therefore seek to analyze the potential consequences of implementation of BH in a specific ecosystem.
We should note here that BH has been the subject of considerable debate in the scientific literature, with papers both supporting and opposing the idea. The concept of BH has received a number of criticisms on ethical and theoretical grounds (e.g., Burgess et al., 2016; Froese et al., 2016; Pauly et al., 2016). One issue that arises is that of practicality: to what extent is it practical to harvest across a wide range of the ecosystem (e.g., Howell et al., 2016). This objection encompasses the physical difficulty of harvesting some ecosystem components, the difficulty in providing scientific advice to support such harvesting, and economics of such harvesting which could render some of the fishery uneconomic.
The question we ask is “Given the model with the assumed best realism that we have, for an ecosystem which is already relatively well-managed, what would happen if BH were to be implemented in the Norwegian and Barents Sea ecosystem?” (Figure 1). Specifically, are there are gains to be made, and if so where do they come from, and what are the corresponding losses or structural changes to the system? We explicitly do not address issues of the practicality of such a fishery, nor do we attempt to model the economics or socio-economics of such a change. These are valuable questions but beyond the scope of the current work.
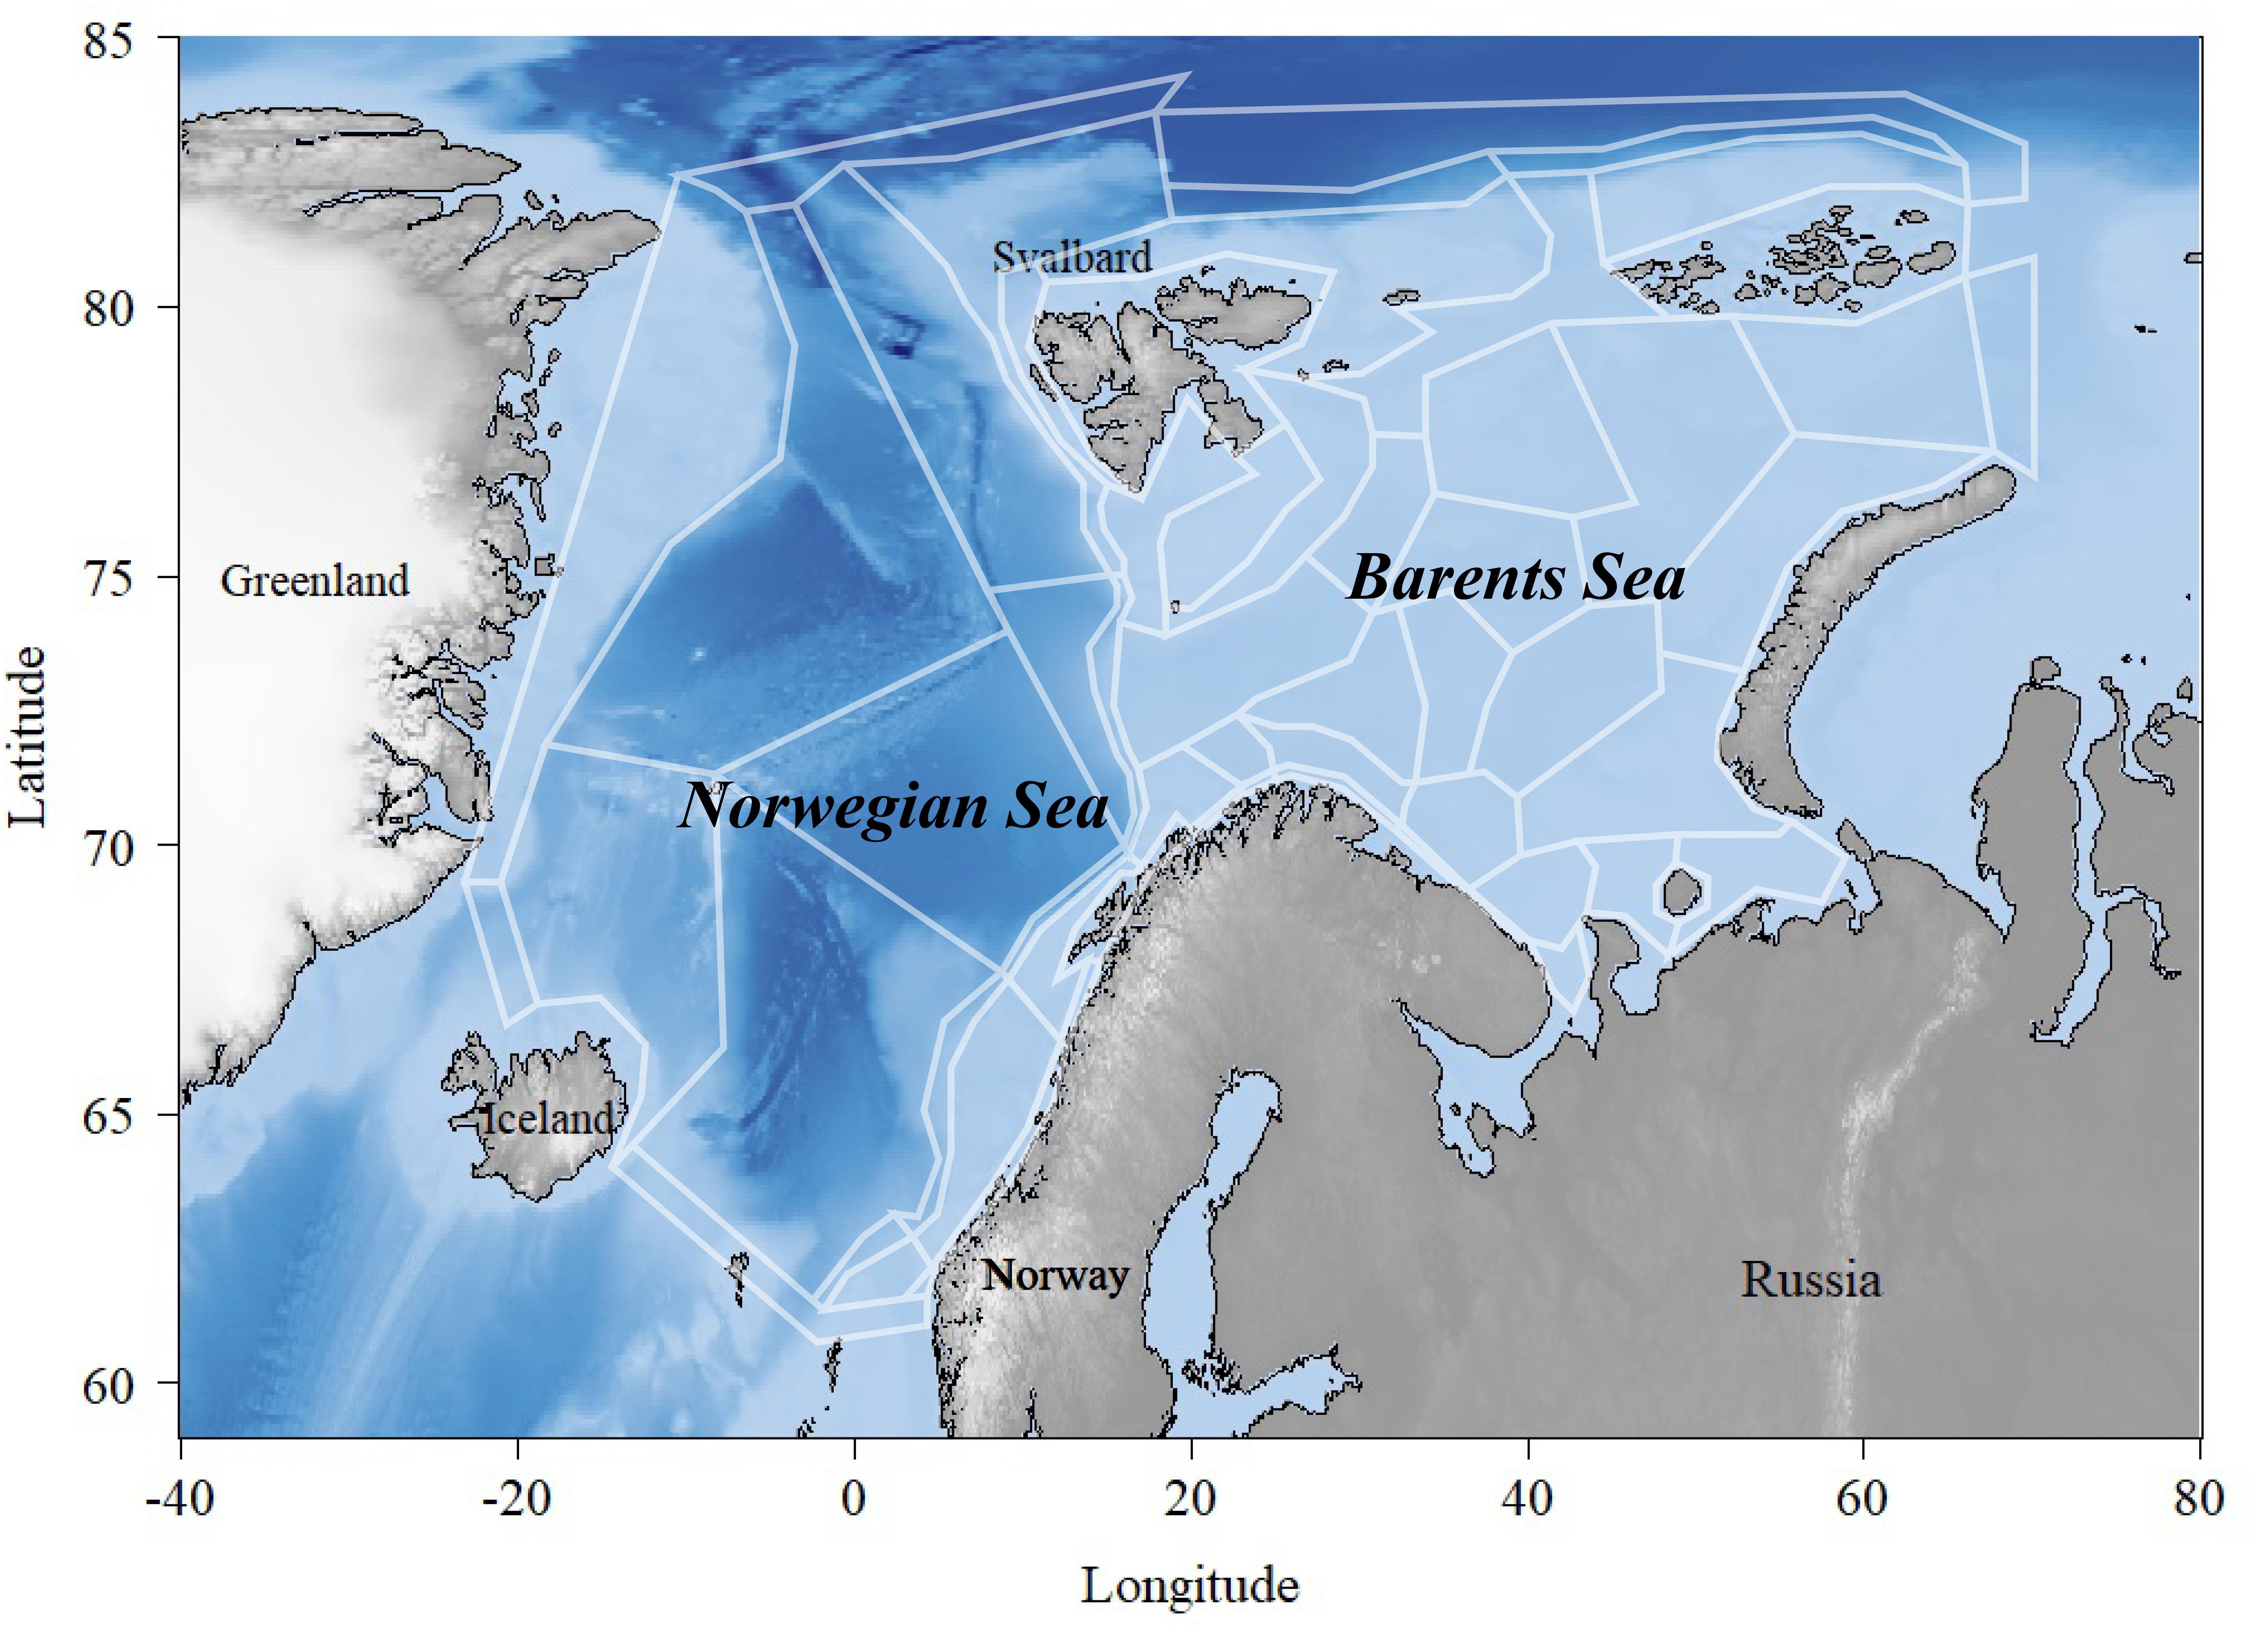
Figure 1. Overview of the Norwegian and the Barents Seas covered by the polygons in the NoBa Atlantis model.
Balanced harvesting can be considered as one possible method to take fisheries management to the ecosystem level through exposing as many components of the ecosystem as possible to a fishing mortality proportional to their specific productivity. The idea has attracted broad interest worldwide and has been supported by both empirical studies in African lake ecosystems with small-scale fisheries (Kolding and van Zwieten, 2014; Kolding et al., 2015) and by modeling studies of marine systems (Garcia et al., 2012; Law et al., 2013). These studies suggest that a balanced harvest may increase the total sustainable yield while maintaining ecosystem structure compared to today’s selective harvesting.
The concept of BH emerged from a widespread concern of the problems caused by conventional selective fishing management resulting in a stagnation in global catches (FAO, 2016), overfishing of target species (Costello et al., 2012; Sumaila et al., 2012), depletion of large predatory fish (Christensen et al., 2014) and potential fisheries-induced evolution that favors early maturation resulting in smaller fish (Heino and Godø, 2002; Law, 2007; Hsieh et al., 2010). Selectivity is deeply engrained in our fishery historically, and fishermen usually target the largest individuals and species for economic and ethical reasons (Kolding and van Zwieten, 2011). However, any kind of selective removal will inevitably alter the composition of a population and consequently the structure and biodiversity of the ecosystem – even at moderate fishing levels (Garcia et al., 2012).
It should be emphasized that BH does not call for unselective and indiscriminate fishing. In fact, it has been argued that BH fishing may actually require a higher level of selectivity (Reid et al., 2016). BH simply suggests a different type of selectivity at ecosystem level where the overall fishing pressure is spread over different species and body sizes in line with productivity in order to maintain the ecosystem structure (Garcia et al., 2015). If BH results in mimicking the natural mortality with predation-like fishing mortality, the evolutionary selection on life-history traits would be expected to be reduced. An implementation of BH would result in a more diverse fishing fleet with a wider range of fishing gears, and the risk of fishery induced selection on any trait is reduced (Zhou et al., 2019).
As productivity tends to decrease as a function of body size (Peters, 1986), moving toward a full implementation of BH would imply a reduced harvest of large fish and increased fishing on smaller species and individuals that are generally considered low-value and unusable in industrial countries. Although BH has been shown to be effective in giving high biomass yields with low impacts to the ecosystem size spectra in African small-scale subsistence fisheries, it is not clear that these results translate to large-scale modern commercial oceanic fisheries (Burgess et al., 2016; Howell et al., 2016). As a result it has been suggested that any implementation of BH would be a partial implementation (e.g., Howell et al., 2016), and we attempt to address this by running simulations to distinguish the effects of BH in different parts of the system. Ethical issues also arise over the question of which fractions of the ecosystem should be considered as harvestable resources (e.g., Pauly et al., 2016). Finally, criticisms have arisen over the modeling techniques employed. Often, although not exclusively, the modeling studies have used simplified size-based model structures which do not well-resolve the species-specific dynamics of the ecosystem components. As noted above we do not intend to enter this theoretical debate here. We merely aim to investigate what might occur if BH were to be implemented in an Atlantis model of the Barents Sea, and hope that the results of our work give some more concrete input into the overall debate. This paper does not focus further on this discussion, which is covered in a recent review of Zhou et al. (2019), except to note that by using the Atlantis model we aim to include as much species realism in our analysis as is currently possible. Where species-specific details are poorly captured, we note this in the discussion.
The Norwegian fishery is currently considered as fairly well-managed with most commercial fish stocks harvested using harvest control rules (HCRs) with moderate fishing pressure. In these rules the fishing pressure is close to that which produces the maximum long-term yield without imposing an undue risk of over-fishing the stock, i.e., close to the maximum sustainable yield (MSY) as used in ICES fisheries management (ICES, 2018a). The Norwegian fishery scores high on the BH principle of targeting a range of species at different trophic levels, as it includes exploitation on low-level species like the copepod Calanus finmarchicus (Calanus, 2018) and higher-level species like bird eggs, seals and whales (Howell et al., 2016).
However, several relatively abundant stocks are either only lightly harvested (i.e., polar cod, Boreogadus saida) or completely unexploited (i.e., mesopelagic fish) (ICES, 2016). For all fisheries, minimum individual size restrictions apply, usually somewhat below the average size at maturation. Thus, the fishing intensity is not balanced between all the key species and harvesting within species is not balanced; rather a strong “traditional” size selectivity applies (Gullestad et al., 2014).
To investigate the implications of a BH fishery we will use an end-to-end Atlantis ecosystem model (Fulton et al., 2011) parameterized and tuned for the Nordic and Barents Seas (hereinafter the NoBa model) by Hansen et al. (2016, 2019). By running simulation scenarios of 50 years over the period 1980 to 2030 we study the interaction effects of components harvested with a fishing mortality rate relative to productivity. This is done by first exposing selected species (both commercial and non-commercial) one-at-a-time to a fishing mortality proportional to productivity, to investigate the ecosystem effects of harvesting individual species according to BH and identify those species which have a particular effect on the combined community. Subsequently, we progress gradually to a full implementation with combined runs with multiple species subjected to BH were set up in order to assess the cumulative effects of a BH regime. In addition, a gear selectivity option was applied to all age-structured groups to balance over age groups within species.
Balanced harvesting has been partly studied in multi-species models before (Bundy et al., 2005; Garcia et al., 2012; Kolding et al., 2016; Heath et al., 2017), but this study represents the first attempt of implementing a BH regime with fishery mortalities based on productivity in an Atlantis model. It is also the first model application to study the ecosystem effects of BH in the Norwegian and Barents Seas.
Materials and Methods
Atlantis is currently considered one of the most advanced “what if”-scenario models of marine ecosystems (Plagányi, 2007). The model simulates spatial variation in both biogeochemical and socio-economic processes. The NoBa model domain is divided into 60 polygons covering the Nordic and Barents Sea of a total area of 4 million km2 with up to seven depth layers depending on total depth (Figure 1) (Hansen et al., 2016). The Barents Sea is a relatively shallow shelf sea, with an average depth of 230 m located north of Norway and Russia, while the Norwegian Sea has a much deeper average depth of 2000 m and is located between Norway, Iceland and Svalbard (Sakshaug et al., 2009). The pelagic part of the Norwegian Sea has a relatively low biodiversity dominated by large stocks of migratory fish such as Norwegian spring-spawning herring (Clupea harengus), mackerel (Scomber scombrus), and blue whiting (Micromesistius poutassou). The Barents Sea, on the other hand, is relative diverse given its high-altitude location. It holds the largest cod stock in the world (Gadus morhua), in addition to other commercially important species such as haddock (Melanogrammus aeglefinnus), saithe (Pollachius virens), Greenland halibut (Reinhardtius hippoglossoides), capelin (Mallotus villosus), redfish (Sebastes spp. and Sebastes norvegicus), and prawns (Pandalus borealis).
Currently, the NoBa model contains 53 species and functional groups (Table 1) that are connected through a diet matrix. Most vertebrate species are age-structured while invertebrates are gathered into biomass pools. Atlantis does not calculate water fluxes between the polygons but uses outputs from oceanographic models. NoBa is forced bottom–up with time series on temperature, salinity, and currents from a Regional ocean modeling system (ROMS: Shchepetkin and McWilliams, 2005) covering the Northeast Atlantic (Skogen et al., 2007). The harvest sub-model deals with the human exploitation of the marine ecosystems, with a focus on the dynamics of fishing fleets. It allows for multiple fleets with its own set of characteristics like specific gear selectivity, target species and management structure (Fulton et al., 2011). The NoBa model includes 27 fisheries, so-called metiérs (Reid et al., 2016), with distinct characteristics and commercially targeted species (Hansen et al., 2019).
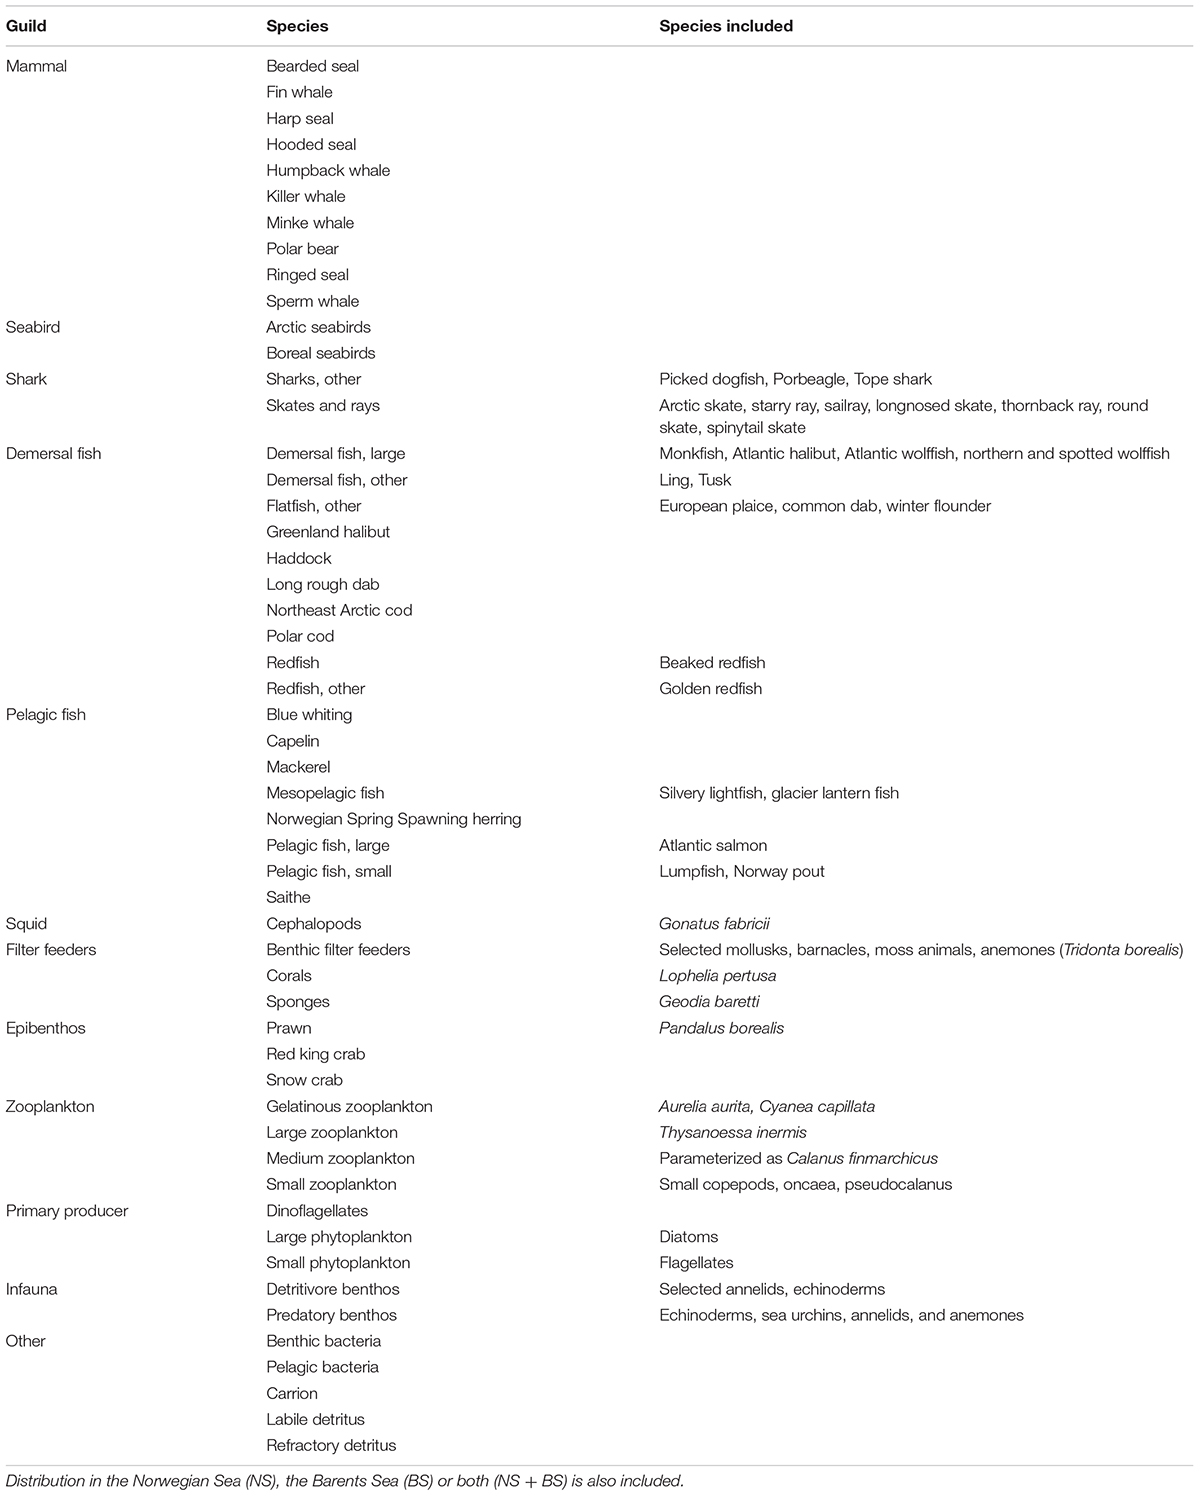
Table 1. List of species and functional groups in the NoBa model, including which species the group is parameterized as.
Implementation of BH requires information on the production or productivity of all species, but the literature does not provide a single clear answer of how these should be used to set fishing mortality. There is an ongoing debate (Heath et al., 2017; Zhou et al., 2019) on whether fishing mortality should be set in proportion to productivity (P/B with the unit ‘per time,’ as in this study) or in proportion to production (P with the unit ‘mass per time’). The key difference between the two is that production (BH1) is density-dependent, while productivity (BH2) can be density-independent (Eqs. 1 and 2):
For both equations, the fishing mortality F, on species x, is determined by the magnitude of the exploitation constant, c, and the species-specific production, P(x), calculated from the biomass, B, and growth, g. Since fishing in proportion to BH1 is density-dependent, it tends to be low when the biomass is low and thereby protects species from collapse. Fishing according to BH2 on the other hand, is less sensitive to current biomass, and thereby allow species to be exploited to extinction, as the results of the current examination shows.
Heath et al. (2017) argued that since BH is an ecosystem approach to fishing with an explicit aim of maintaining the species richness of marine ecosystems, the density-dependent fishing mortality in BH1 should be applied and recommended. We followed the method described in Garcia et al. (2012) where gross production is described as individual growth plus recruitment, i.e., the amount of living material produced each year. The gross production was divided by the corresponding biomass to get a “per capita” productivity rate, often referred to as a P/B-ratio. This approach, setting fishing mortality proportional to the productivity or P/B ratio, is one of the alternatives suggested amongst BH-scientists (Jacobsen et al., 2014; Kolding et al., 2016; Zhou et al., 2019) and was the approach chosen for this study. It should be noted that there are other possible formulations (for a discussion of this, see Zhou et al., 2019).
Unlike the ECOPATH models, which uses the P/B ratio (or total mortality) as an input parameter, this is not included in the Atlantis model. Calculation of the P/B ratio was therefore done by using growth and production output generated by an initial run set up prior to this study with the intent of representing the historical fisheries. Atlantis has several ways of applying fishing mortality. For this purpose, the best option was a fishery-induced mortality rate where a proportion of biomass is set to be harvested each day. To capture yearly variations in productivity, the P/B ratio was calculated for each year. Information on growth, weight and numbers was extracted from model outputs to estimate the productivity and biomass of age-structured vertebrate groups. For invertebrates, the production was retrieved directly from the model outputs. Then the P/B-ratio of all selected components was calculated for each year and converted to a proportional fishing mortality by the following equation:
The BH based fishing mortality,FBH, is then the productivity (P) given in tons pr. year over biomass (B) given in tons, multiplied with a dimensionless constant, c, determining the intensity of exploitation. Based on the Cadima estimator (Troadec, 1977) several values of exploitation intensity has been suggested, mainly ranging from 0.2 to 0.4 (Shepherd, 1982; Beddington and Cooke, 1983; Pauly, 1984; Garcia et al., 1989; Sparre and Venema, 1998). However, it was decided to follow Kolding (1993) and use a relatively conservative constant of 0.25, corresponding to harvesting 25% of the stock’s total annual production. However, during the simulation runs it became evident that, while sustainable for all commercial species, a harvest rate of 25% of production was too high for most of the non-commercial species. The FBH for these species were then halved to 12.5% to avoid immediate collapse (Table 2).
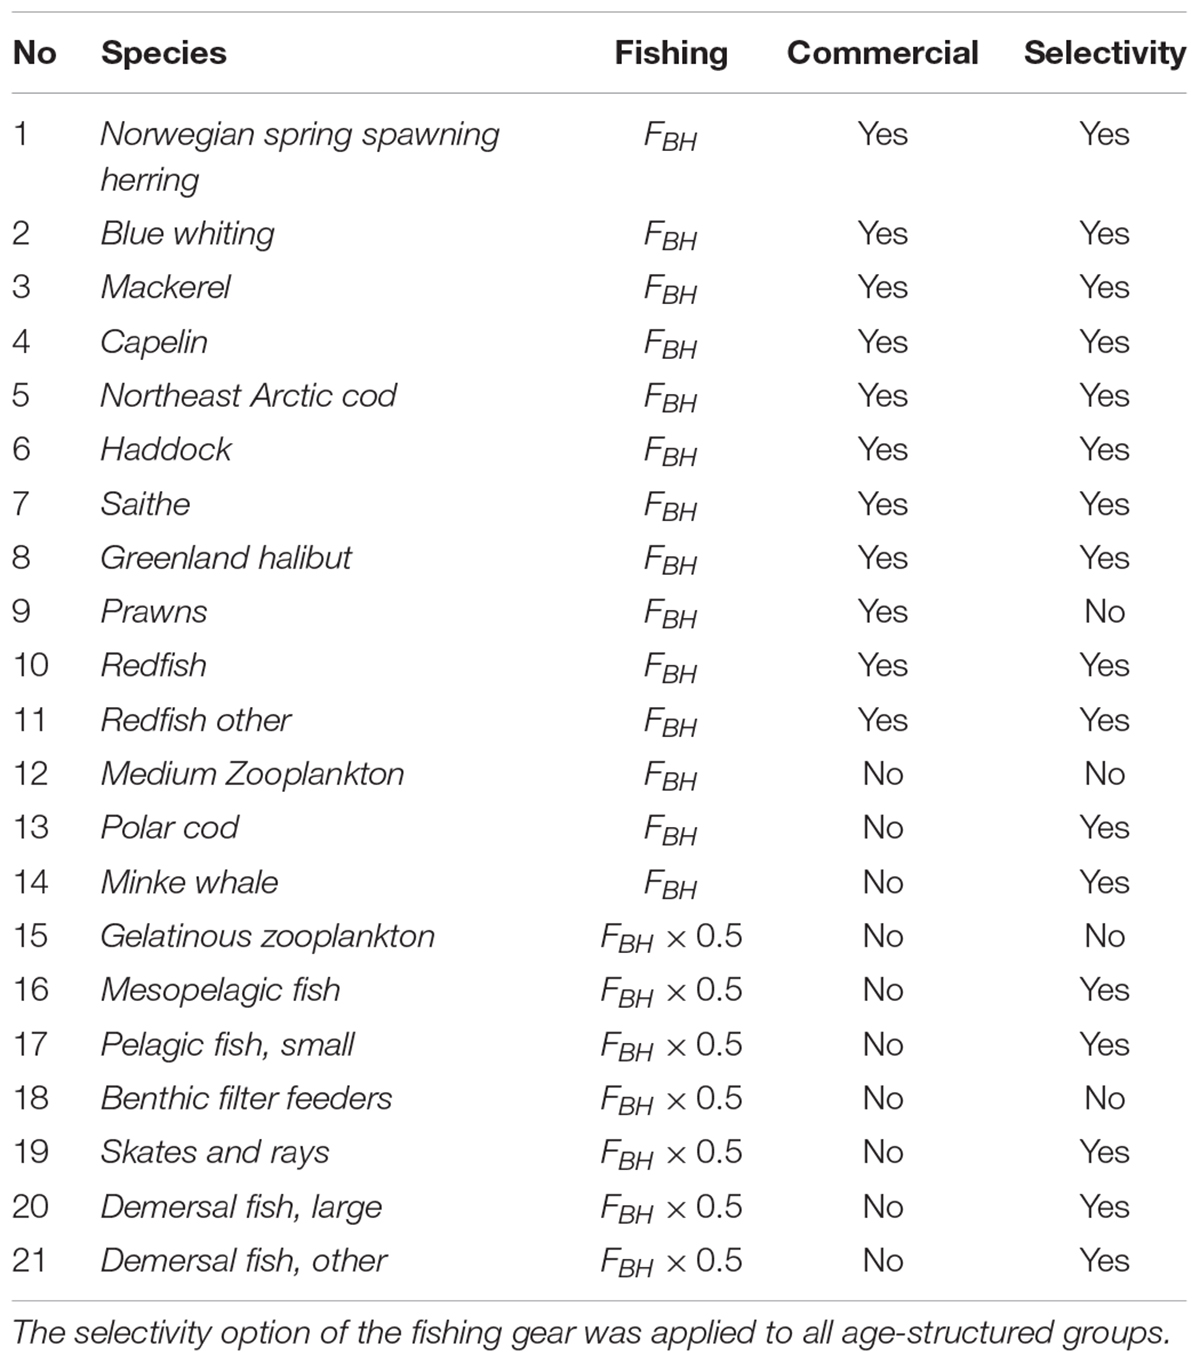
Table 2. List of all the species subjected to BH in the study, as well as the Fbh-level and whether the species were regarded as commercial in the model.
A size-specific selectivity was also applied to all age-structured groups (Table 2) based on the mean productivity of the age group throughout the simulated years (i.e., 1980–2030). A logistic length-based selectivity curve was chosen as the selectivity option, as it allows for different fishing pressures on age groups according to the productivity level within age-structured species. The selectivity curve usually follows the shape of a sigmoid curve ranging from 0 to 1, where the possibility of retention at lengths span from 0 to 100% (Sparre and Venema, 1998). The curve is given as
The selectivity curve (psel) of species i, is determined by the inflection point (lsm), i.e., the length at 50% selectivity where 50% escape and 50% are retained, selb which determines the steepness of the curve, and the lengths (L) in cm of the different age classes. Since the productivity typically decreases as a function of body size (Peters, 1986), the selection curve was expected to be descending with a negative selb to exert a greater pressure on young productive age classes. Atlantis uses the length-weight relationship to convert to length, as its cohorts are weight-based. To find the appropriate values for lsm and selb, the mean length of all species at different ages had to be calculated by solving the length-weight relationship equation (Hile, 1936; Martin, 1947) with respect to length:
The lengths (L) in cm were determined by two species-dependent parameters, (a) and (b), collected from literature and applied in the model (Hansen et al., 2016), and the weight by age (W) in kg was retrieved from the model outputs. A non-linear least square regression was used to find the best values for lsm and selb. By assuming some initial start values for lsm and selb and applying the selectivity curve equation (Eq. 4), the lsm and selb values giving the selectivity curve closest to the productivity levels were selected. This differs from the traditional gear selectivity curves, which aims to protect the young, i.e., smaller sizes, and target larger sizes.
The species and groups chosen to be subjected to BH are listed in Table 2. These were either species that were already commercially harvested (species 1–11) or non-commercial species selected on the basis of being relatively abundant, feasible to catch and a good source of food (species 12–21). The non-commercial components were not harvested in the control run and consisted of species that are either lightly harvested (e.g., Calanus, minke whale) or species that are completely unexploited in Norwegian fisheries (e.g., mesopelagic fish, jellyfish). Species like phytoplankton (impracticable to catch), corals (not edible) and polar bear (protected) were excluded in this study.
The runs were set up to first track the individual effects of BH on one species at the time (presented in the Supplementary Material and briefly described below), before the gradual full implementation where multiple species were subjected to BH simultaneously. This was done to investigate the isolated effect of BH on individual species, as well as the cumulative effect of harvesting multiple species within a BH regime. In addition, there are clear practical difficulties in extending BH to currently unharvested (or lightly harvested) species, so we have examined these separately from the main commercial species. The three combined runs were:
(1) “BH on commercial” where all the commercial species were subjected to BH while non-commercial species were not harvested
(2) “BH on non-commercial” where non-commercial species were harvested according to BH while commercial species were harvested at historic levels
(3) “BH on all” where both commercial and non-commercial species were subjected to BH.
Table 3 gives a complete list of the runs that will be presented for analysis in this paper. All runs were performed by modifying the control run through adjustments of fishing effort and by adding selection curves for all vertebrate groups. The commercial species that were not subjected to BH were harvested according to the fishing mortalities in the control run (FHisto in Table 2) with a flat constant selectivity applied. The results are presented through changes in biomass (tons wet weight), catch (tons wet weight) and a set of indicators based on Fay et al. (2019). Price per kilo catch was taken from Sildesalgslaget (Norges Sildesalgslag, 2019) for the pelagic components and Råfisklaget (Norsk Råfisklag, 2019) for the demersal components. Trophic levels were based on the values applied in Coll et al. (2016). All plotting was carried out through “R studio” (RStudio Team, 2015) under version 3.5.2.
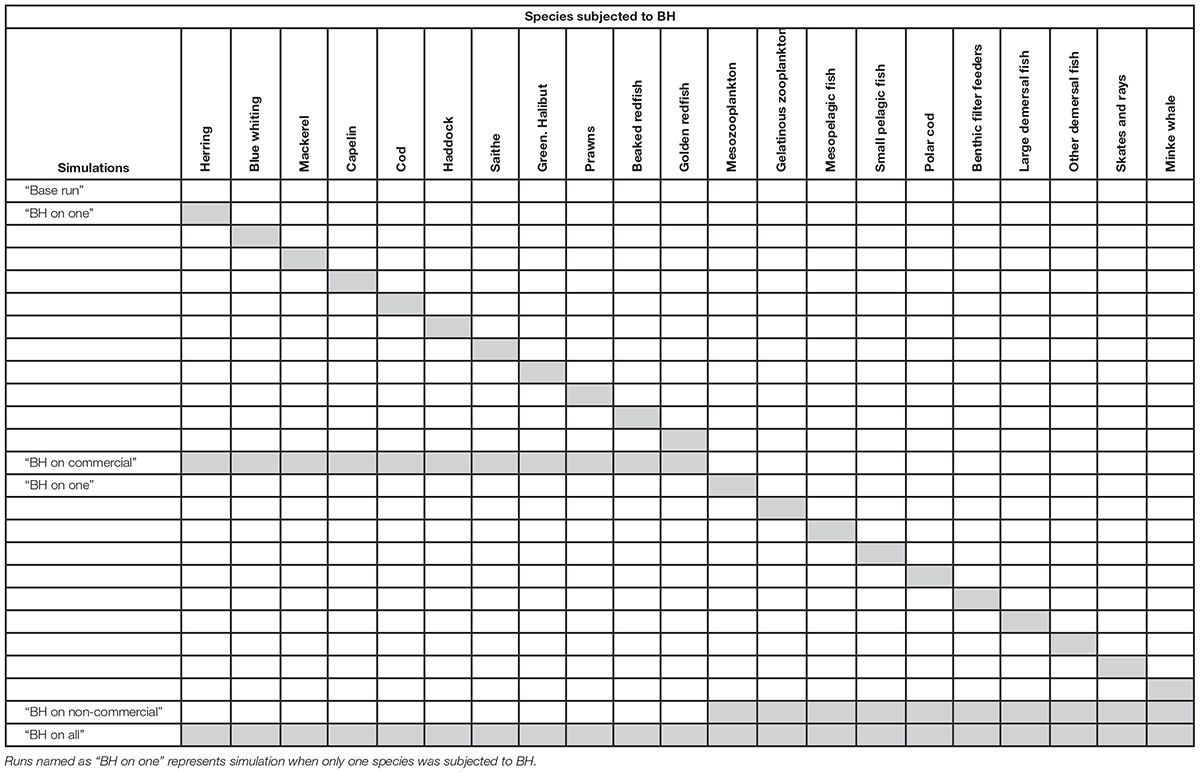
Table 3. List of all simulations selected for analysis.
Results
The results first focus on changes in biomass as the result of implementing BH on both commercial and non-commercial species. The next part concentrates on the effects on the total catch under different BH regimes, while the last part investigates the effects on ecosystem structure and economy through chosen indicators.
The Effects of BH on Biomass
The commercial fishery in the Norwegian Sea is dominated by large pelagic stocks of mackerel, blue whiting and Norwegian Spring Spawning herring (hereafter herring). In the Barents Sea, the main commercial species are the Northeast Arctic cod (hereafter cod), capelin, haddock, saithe, Greenland halibut, beaked redfish, golden, redfish and prawns. The mean of the calculated fishing mortalities proportional to production (FBH) for all commercial species are shown in Table 4 together with the mean historic fishing levels in the control run (FHisto) and the fishing level based on MSY (FMSY).
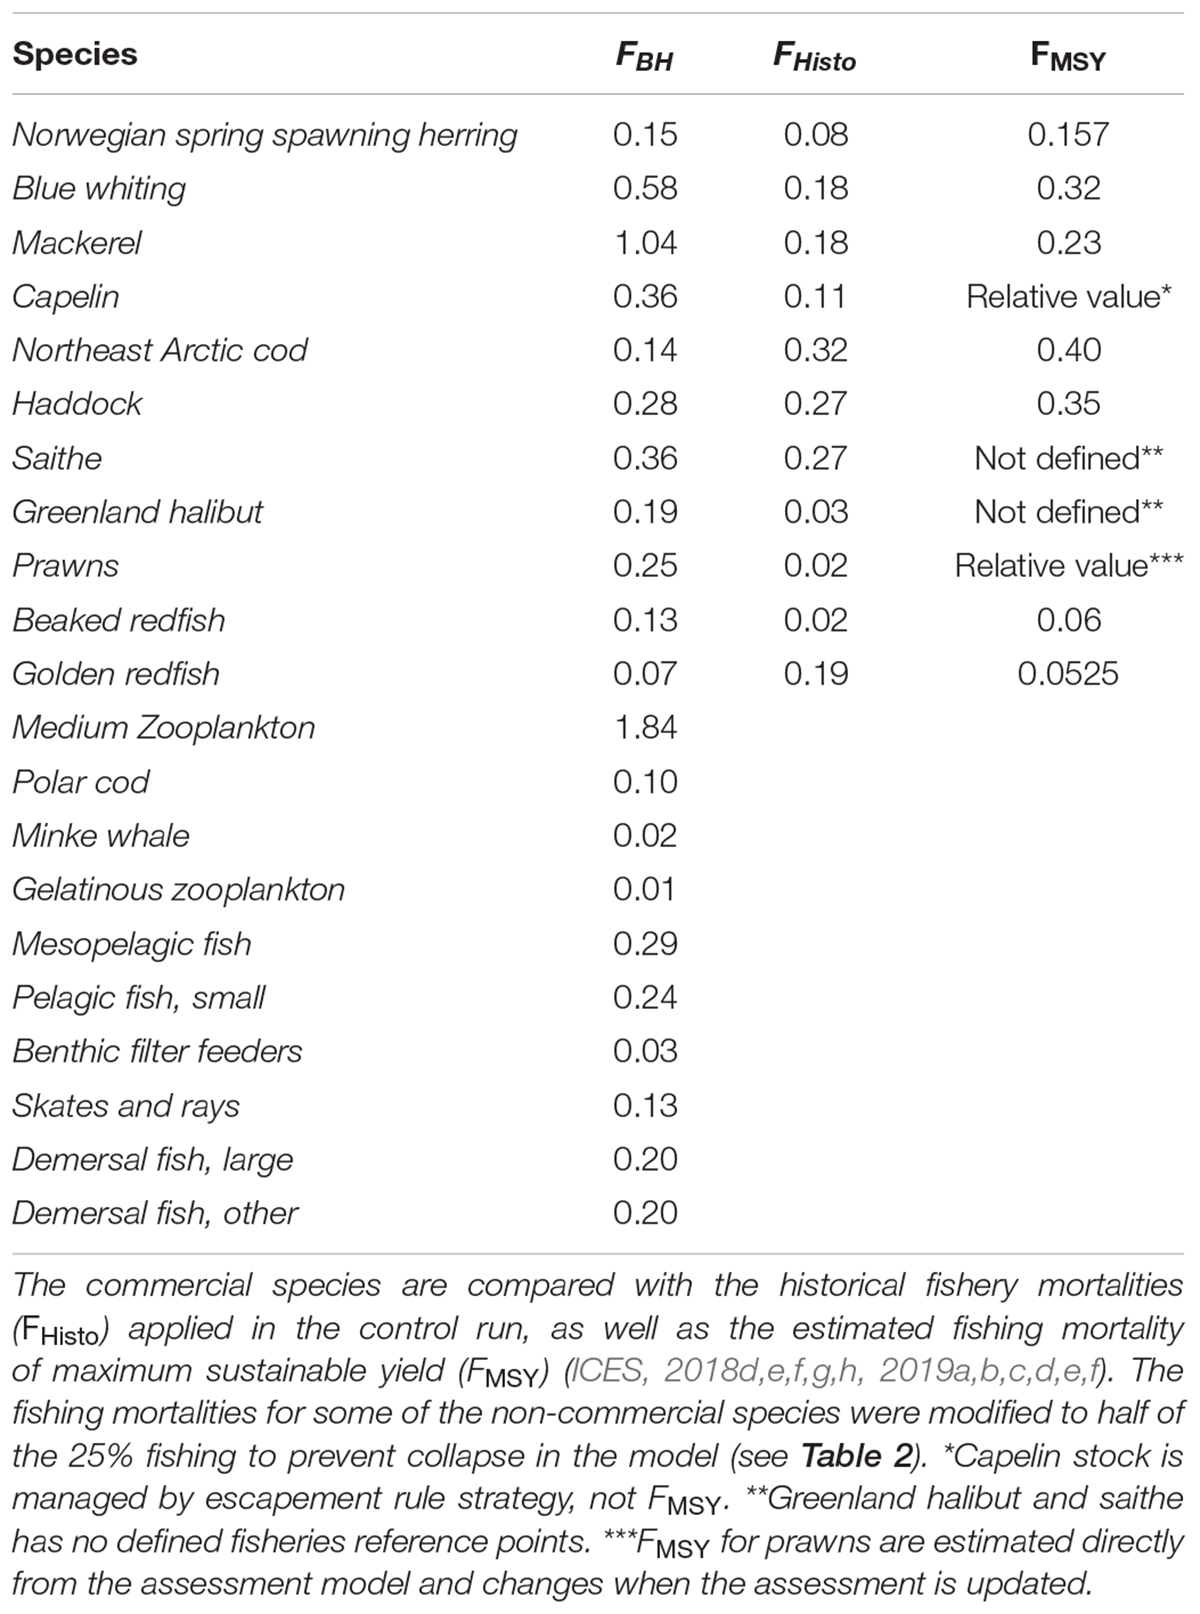
Table 4. Mean fishing mortalities (FBH) of 25% of the estimated productivity for all species in the study.
To evaluate both the direct and indirect effects of a BH regime on each species, we used simulations where only one species was subjected to BH, and subsequently when all chosen species were fished at FBH levels. Figure 2 shows the biomass of commercial species, when (i) only one species was subjected to BH (light green line) and when (ii) all selected species were subjected to BH (dark green line). The black line represents the biomass in the control run where the traditional fishery was applied.
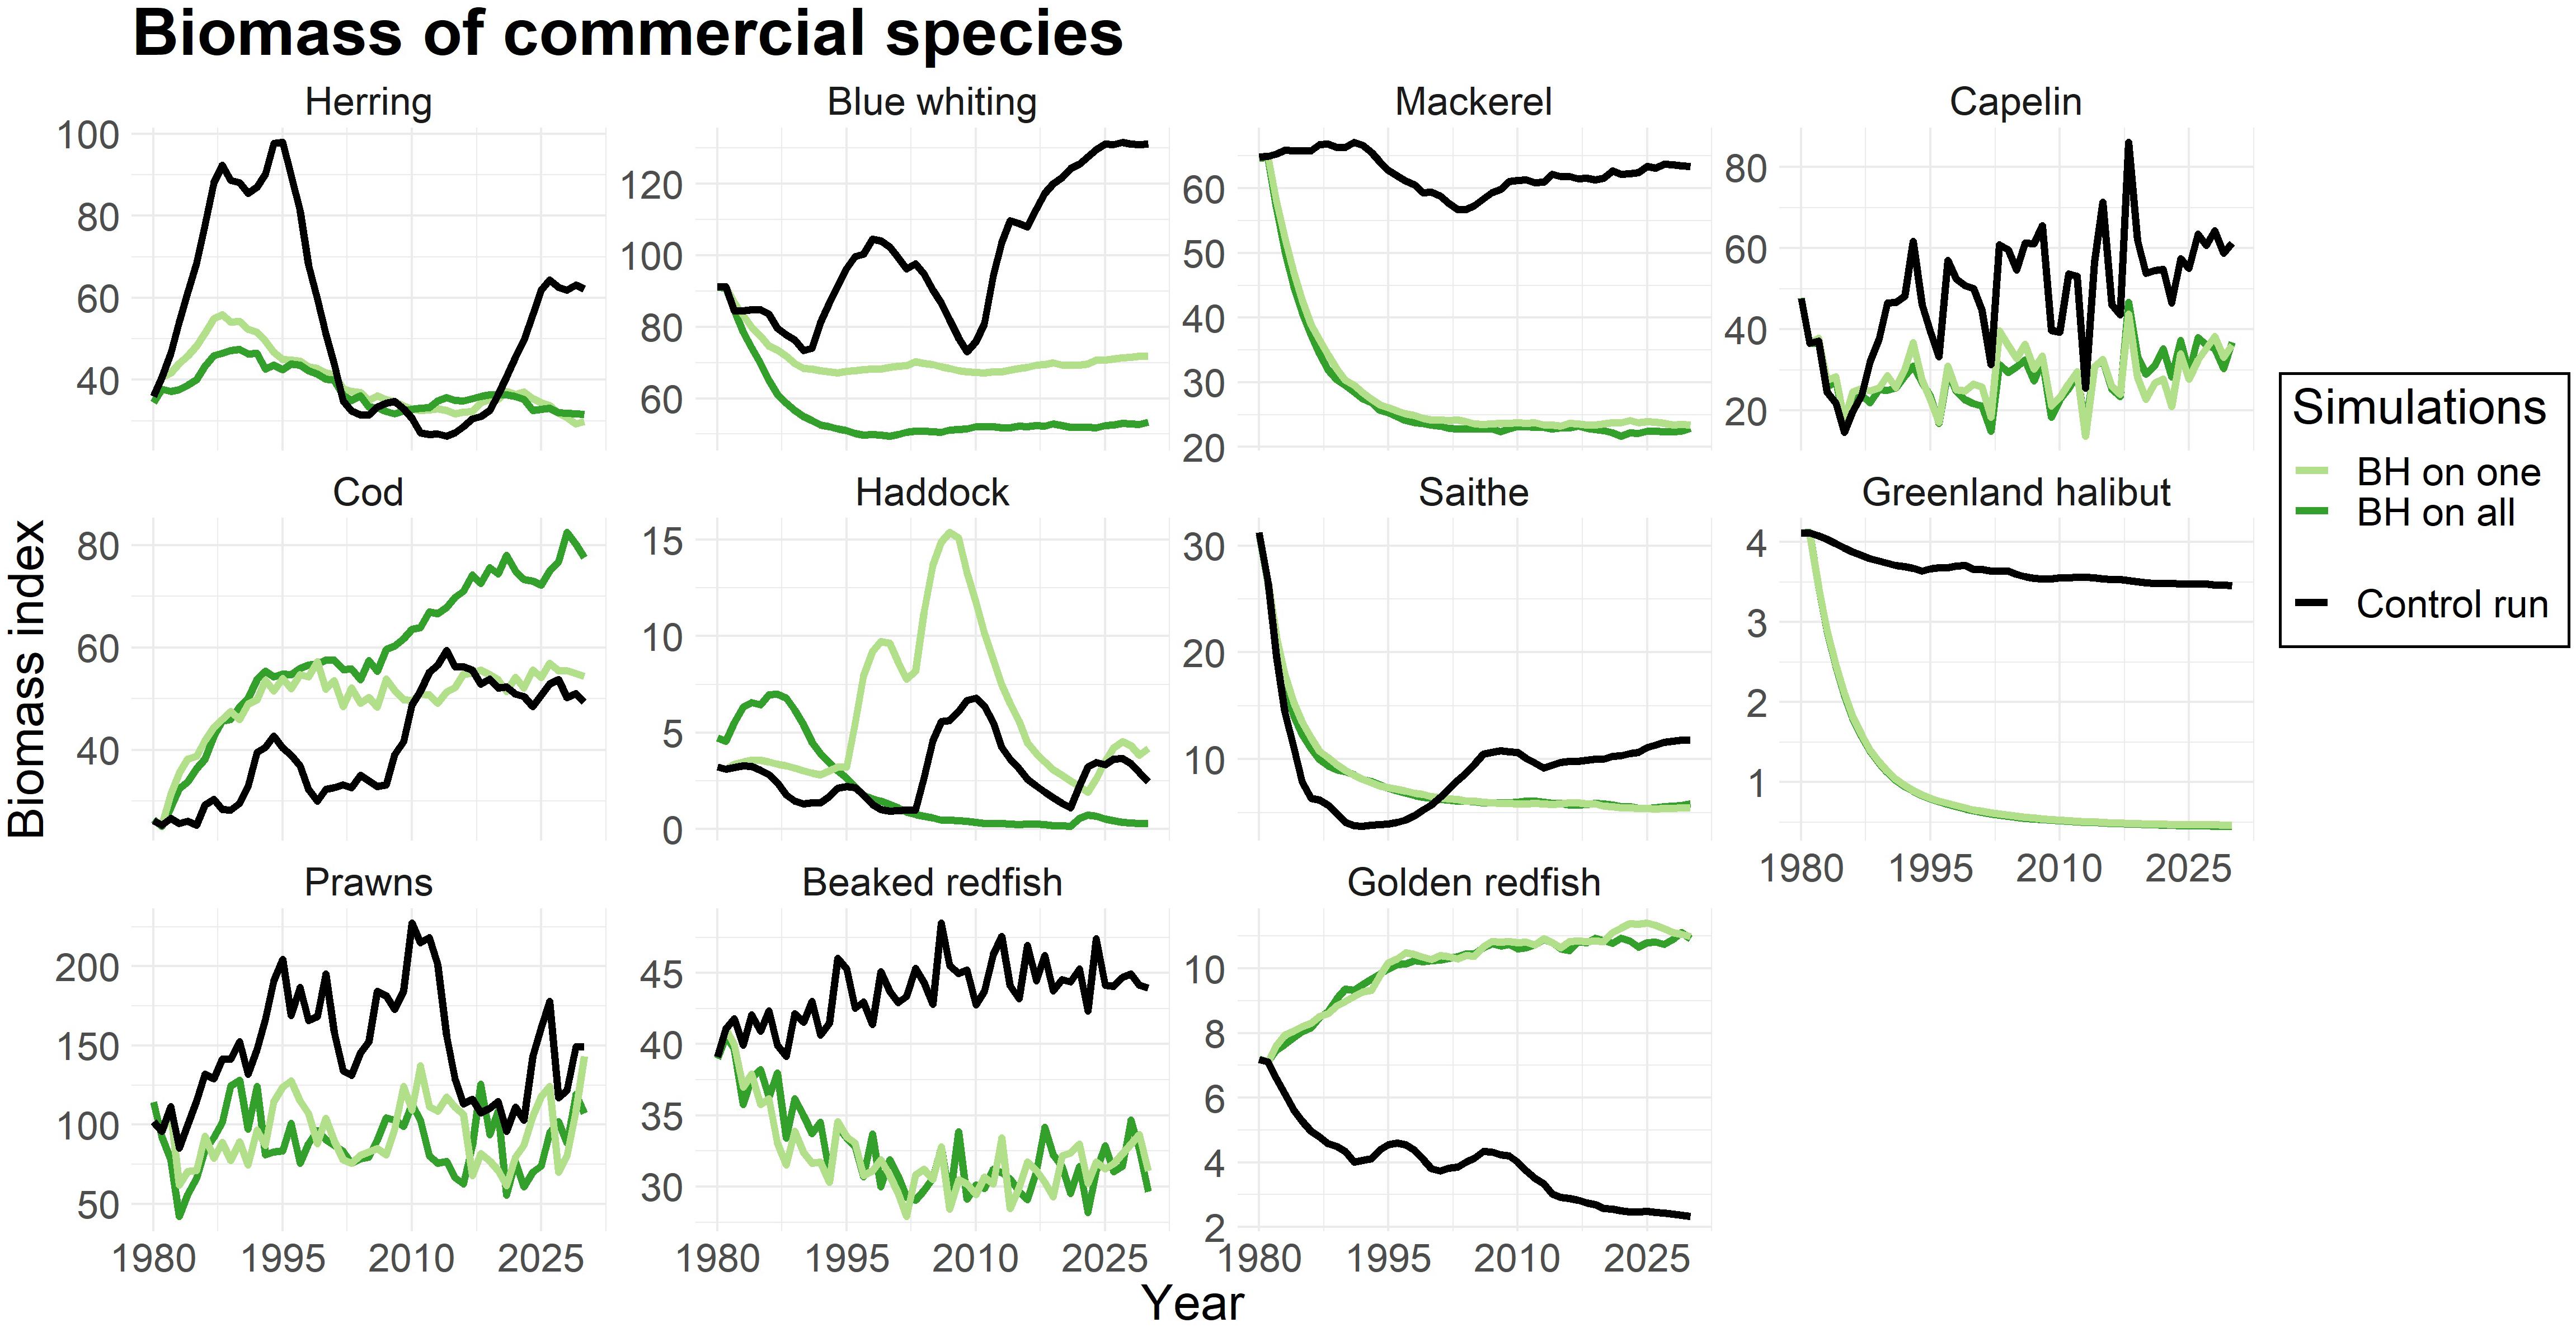
Figure 2. Change in biomass compared to control run for commercial species. The light green line represents simulations were only that species were subjected to a BH regime, while the dark green line shows the biomass when all species in the study were subjected to BH. The black line displays the control run where a traditional fishing regime was applied. The biomass is given as an index.
As expected, Figure 2 reflected the effects on biomass to changes in fishing mortalities (Table 4). Species with lower fishing mortality (like cod and golden redfish) showed an increase in biomass, while the biomasses of mackerel, Greenland halibut, and prawns were greatly reduced due to a much higher fishing pressure.
Yet, a decrease in biomass due to a higher fishing pressure is not necessarily critical for the stock as long as it does not result in recruitment overfishing. To evaluate this we plotted the spawning stock biomass (SSB) of the species and the bpa which is the precautionary reference point (ICES, 2017, 2018a) at which the stock runs the risk of recruitment overfishing. Figure 3 showed that although the biomass of blue whiting, capelin and beaked redfish were greatly reduced under the BH scenarios, the SSBs were above the bpa. In contrast, the SSBs of mackerel and herring were driven to a level below the bpa under a BH regime. Golden redfish represents an example where the traditional fishing regime in the control run resulted in a critically low SSB below bpa, while the BH regimes increased the SSB to a safe level above the precautionary reference point.
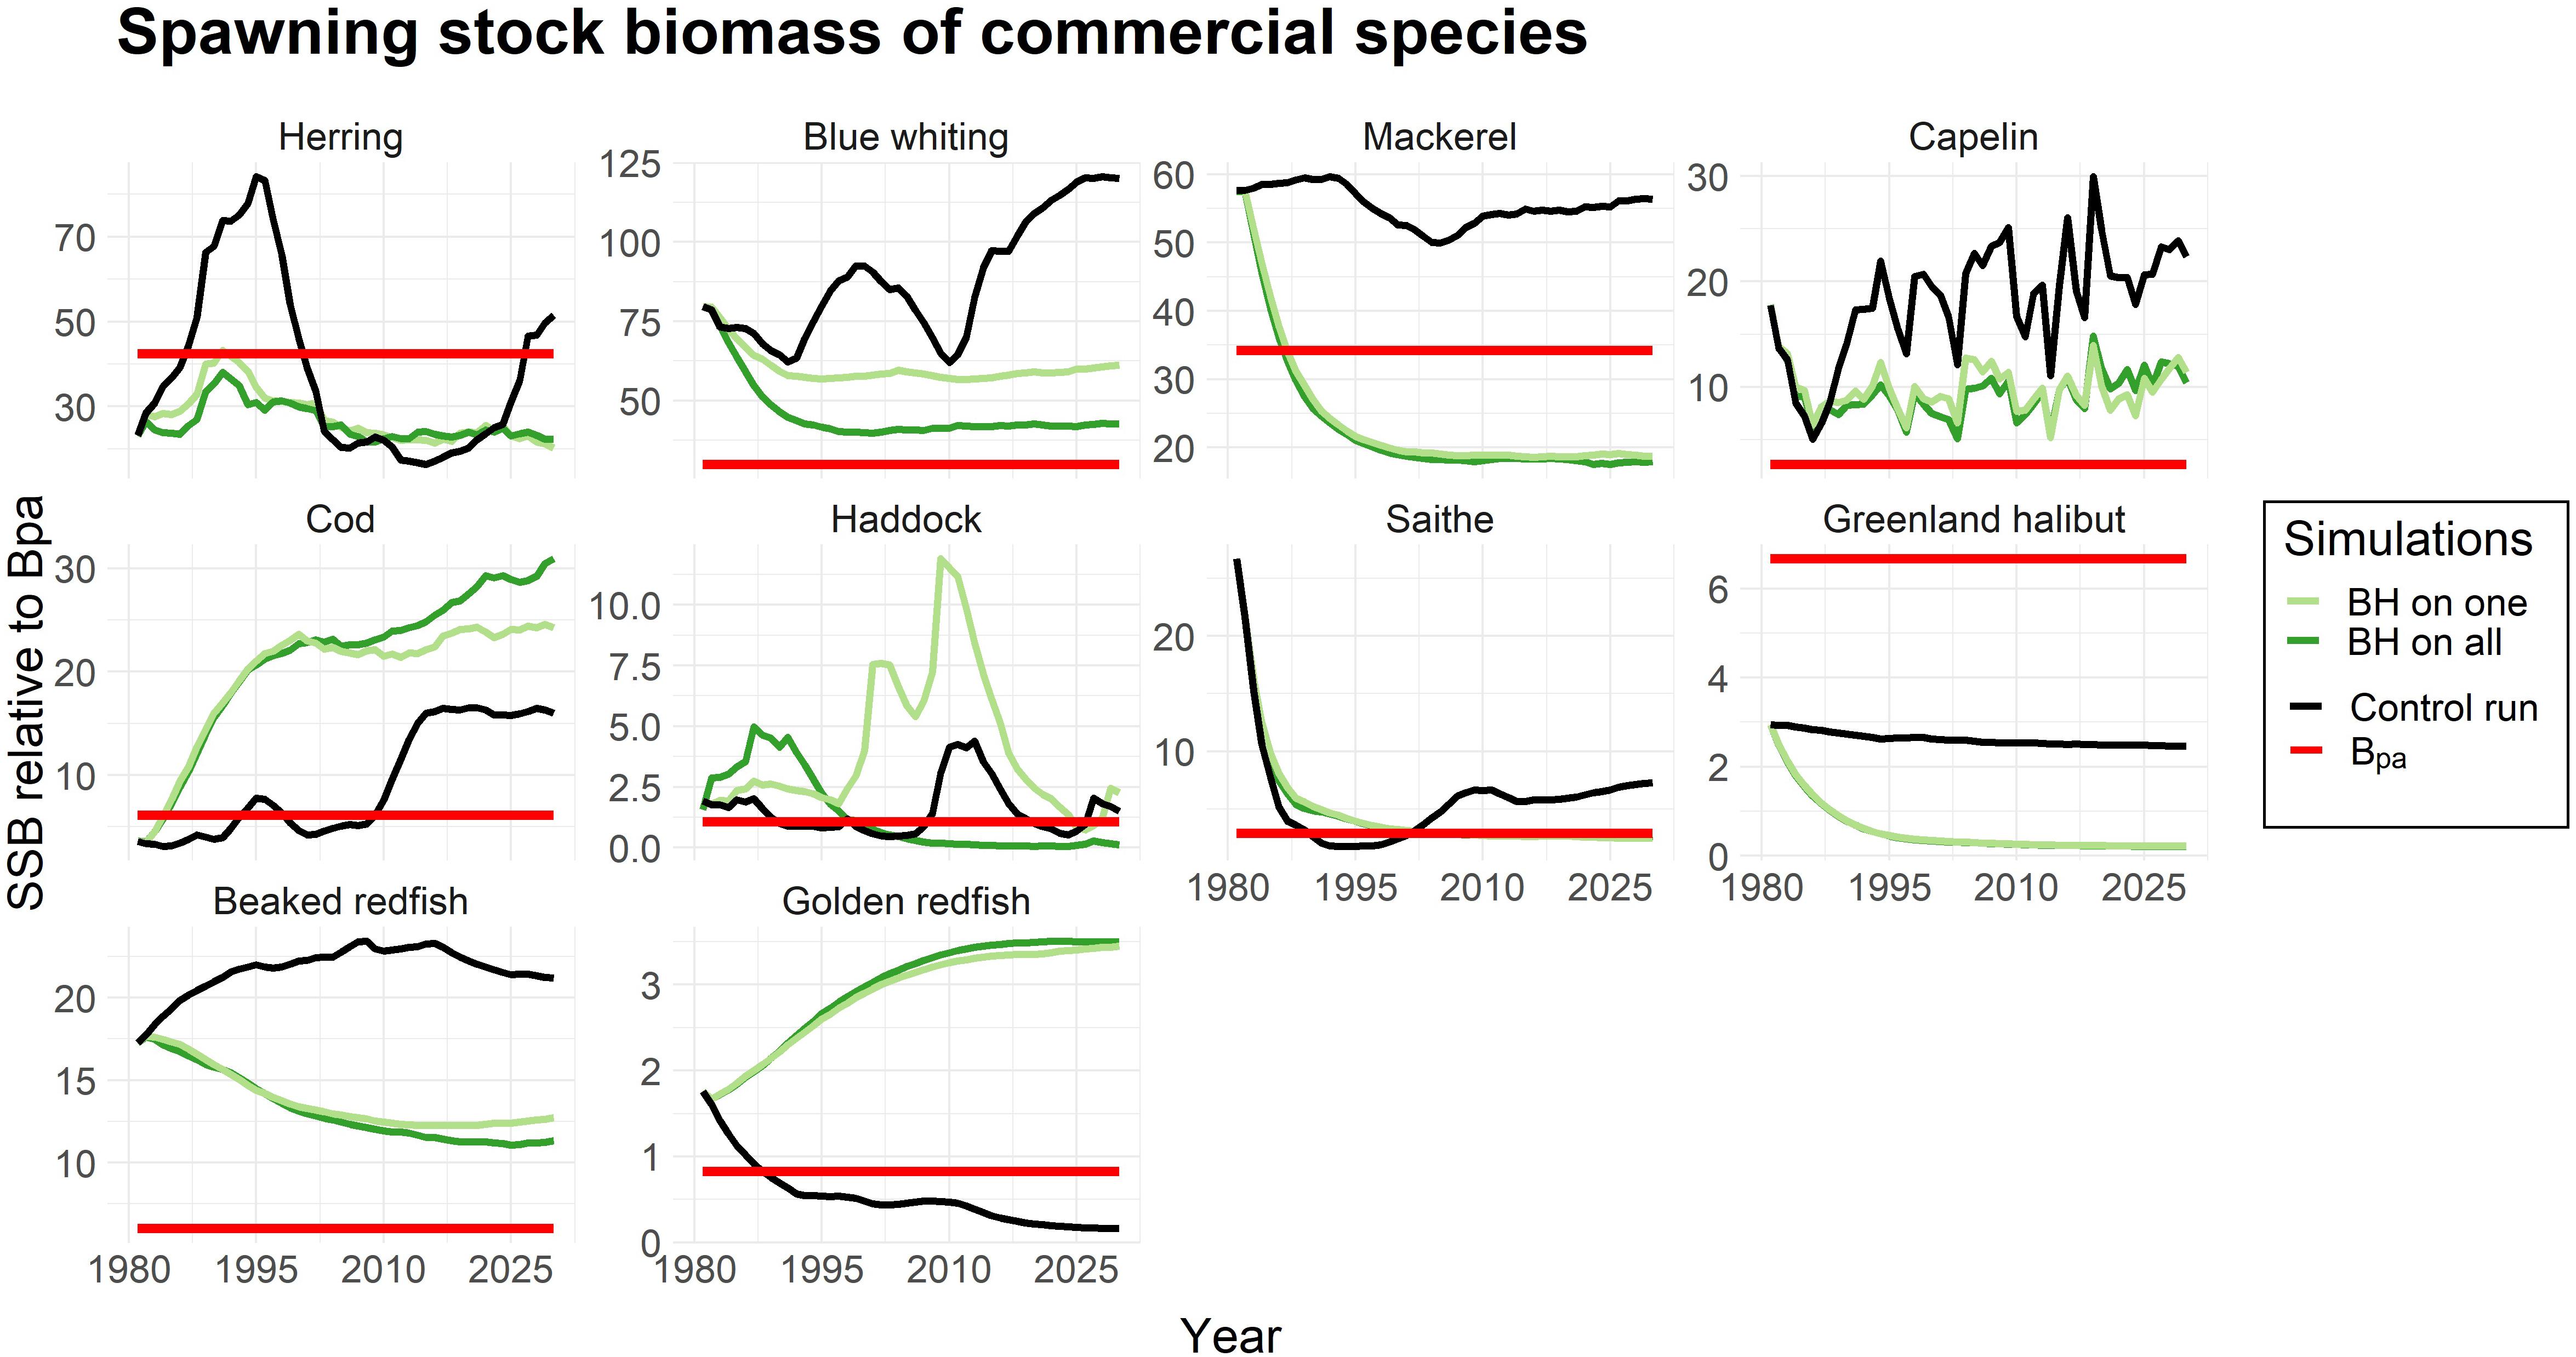
Figure 3. Spawning stock biomass (SSB) of all commercial species in the study compared to the precautionary reference point (Bpa) which is marked as a red line. The SSB is given as an index for the simulations when only one species is harvested according to BH (light green), all species are subjected to BH (dark green) and a control run where traditional fishing mortalities were applied (black line).
The study also included harvesting of species that were considered “non-commercial”, and not targeted in the control run. The calculated fishing mortalities (FBH) for these species are listed in Table 4. Figure 4 showed that all of the non-commercial species experienced a decrease in biomass when being subjected to a BH regime, which is what one would expect when subjected to fishing. However, the magnitude of the reduction varied greatly among the species. Mesopelagic fish was driven to a near collapse, and both of the demersal fish groups (including ling, tusk and wolffish), as well as skates and rays, were reduced by close to 75%. Mesozooplankton and small pelagic fish experienced less decrease of around 50%, while gelatinous zooplankton, polar cod, benthic filter feeders and minke whale were even less affected.
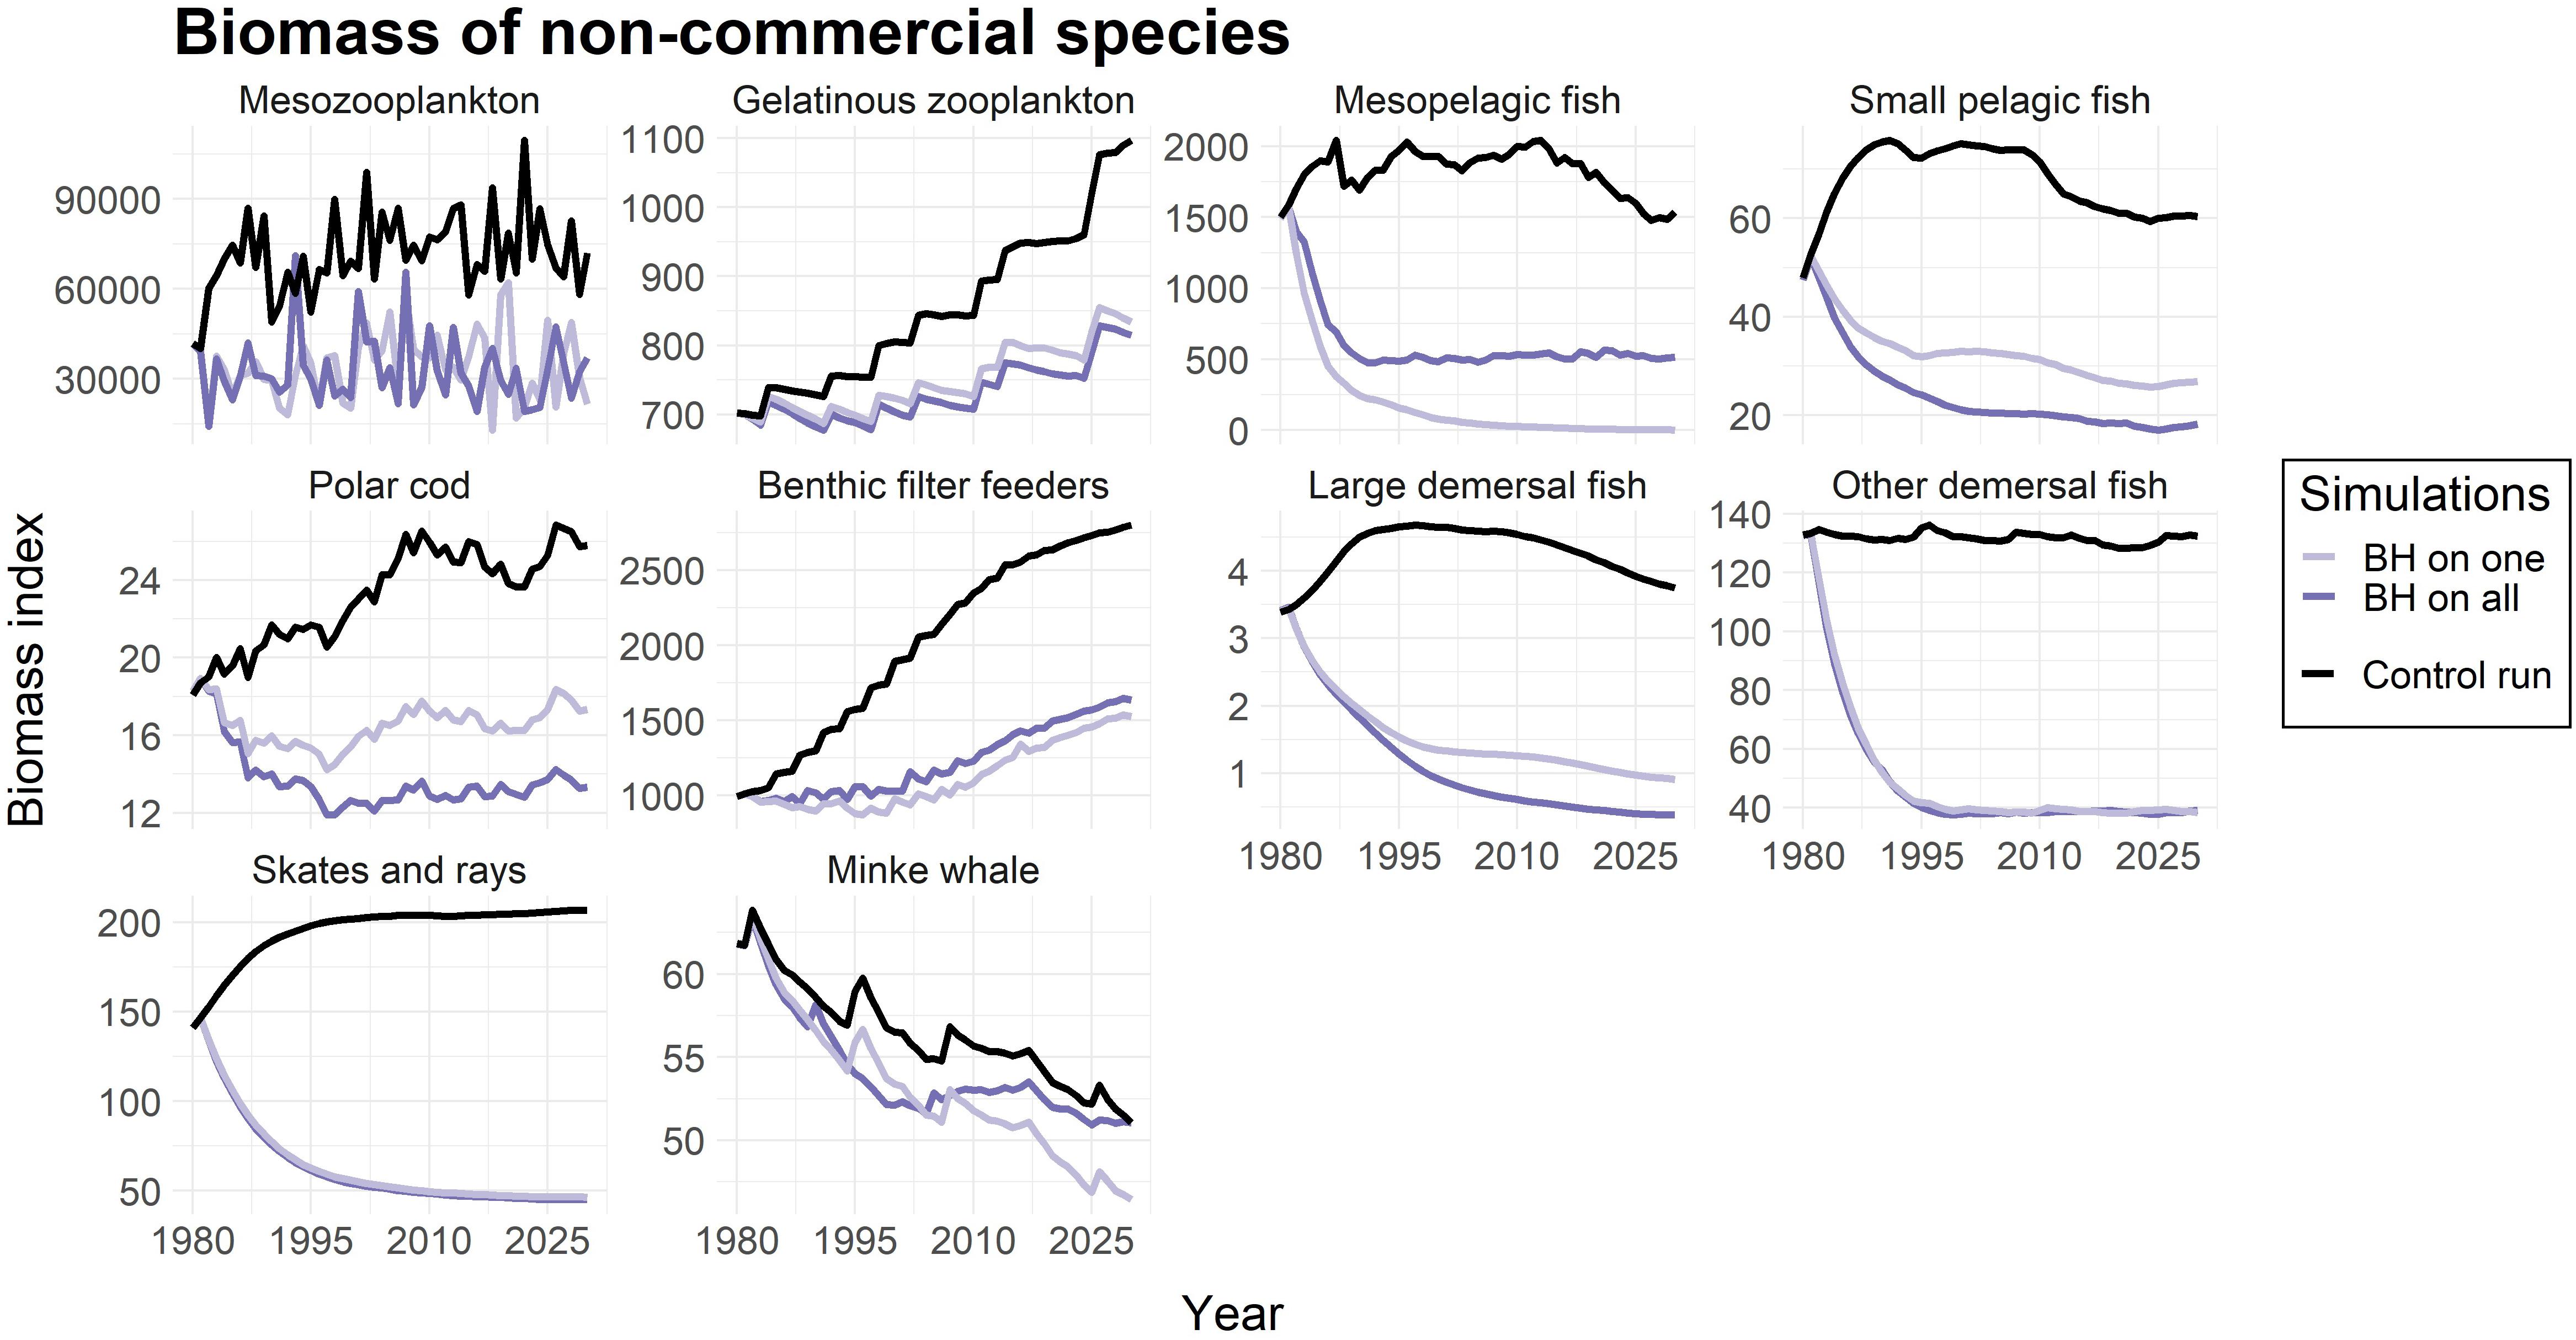
Figure 4. Change in biomass compared to control run for non-commercial species. The light purple line represents simulations were only that species were subjected to a BH regime, while the dark purple line shows the biomass when all species in the study were subjected to BH. The black line represents the control run where a traditional fishing regime was applied to the commercial species and the non-commercial species were not harvested. The biomass is given as an index.
Effects of BH on Catch
Balanced harvesting aims to provide higher yields while better preserving ecosystem structure and functioning than conventional selective fishing. In the second part of the analysis we explored the effects on catches under various BH scenarios. The estimated annual total catch was represented as an average from the 20 last years of the simulations (year 2010–2030) to avoid bias from unsustainable short-term spikes in catches during the first years after implementation, as well as any other short-term dynamics imposed by the change of fishing regime.
Figure 5 displays the catch of commercial species when subjected to BH individually and when all species together were subjected to BH, compared to the control run. The results showed higher catches for some species (e.g., mackerel, capelin, beaked redfish) and lower catches of others (e.g., cod, golden redfish). Although the catches were initially unstable during the first years after BH implementation, the catches of most of the commercial species seemed to become more stable under a BH regime compared to the traditional fishing a few years into the simulations.
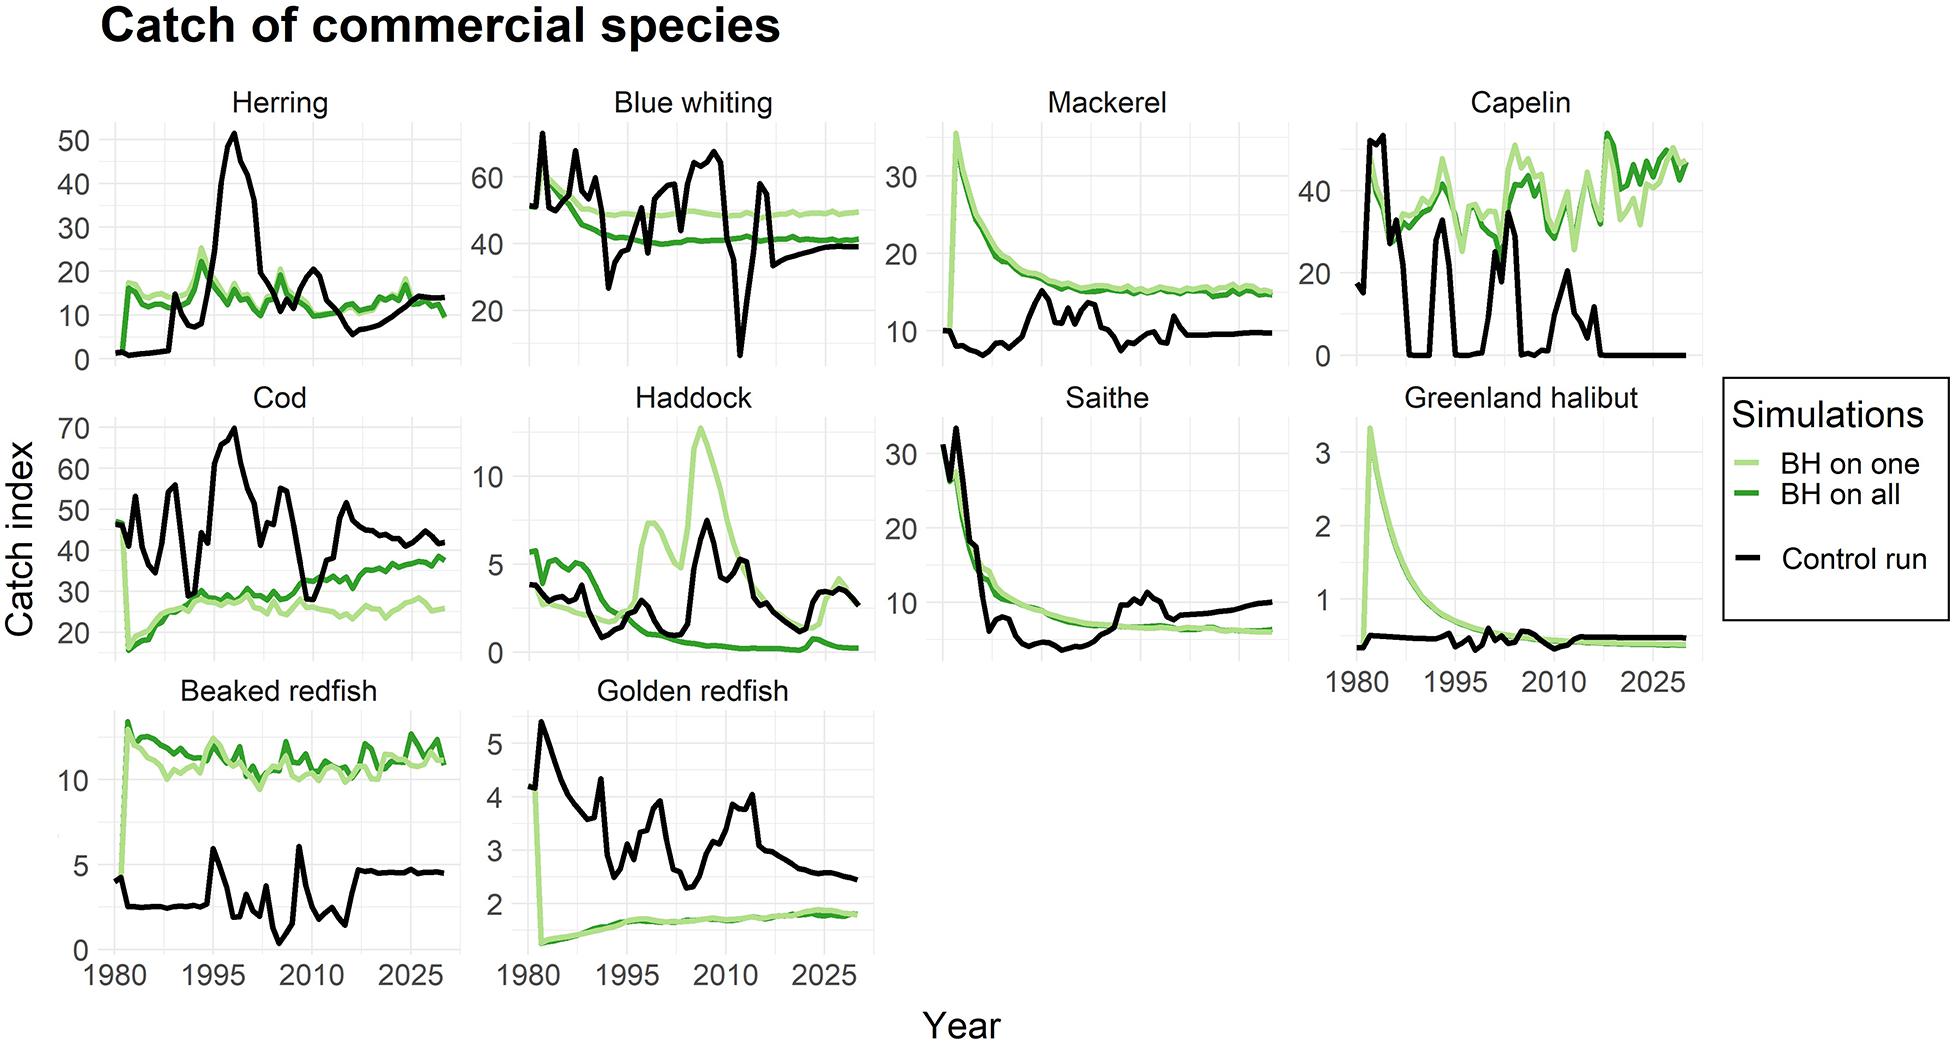
Figure 5. The catches of commercial species when subjected to a BH regime. The light green line represents simulations were only that species were subjected to a BH regime, while the dark green line shows the biomass when all species in the study were subjected to BH. The black line represents the control run where a traditional fishing regime was applied. The catch is given as an index.
The next question was which of the BH combinations (i.e., “BH on commercial,” “BH on non-commercial,” or “BH on all”) that would give the highest total yields. The three combined runs were compared to the control run in which the commercial species were harvested at historic levels and non-commercial species were unharvested. The average total catch of the last 20 years of the simulations (year 2010–2030), when catches had stabilized, was used to evaluate the long term yields.
Figure 6 shows the total catch composition when subjected to different variations of BH. Total catch increased when more species were included and harvested by a BH regime, but this increase was mainly caused by higher catches of capelin, prawns, and non-commercial species. The catch of the non-commercial species is lumped together in Figure 6A and shows nearly 80 mill tons additional yields. However, nearly all this catch (98%) consisted of mesozooplankton, which was excluded in Figure 6B for easier comparison of the remaining species.
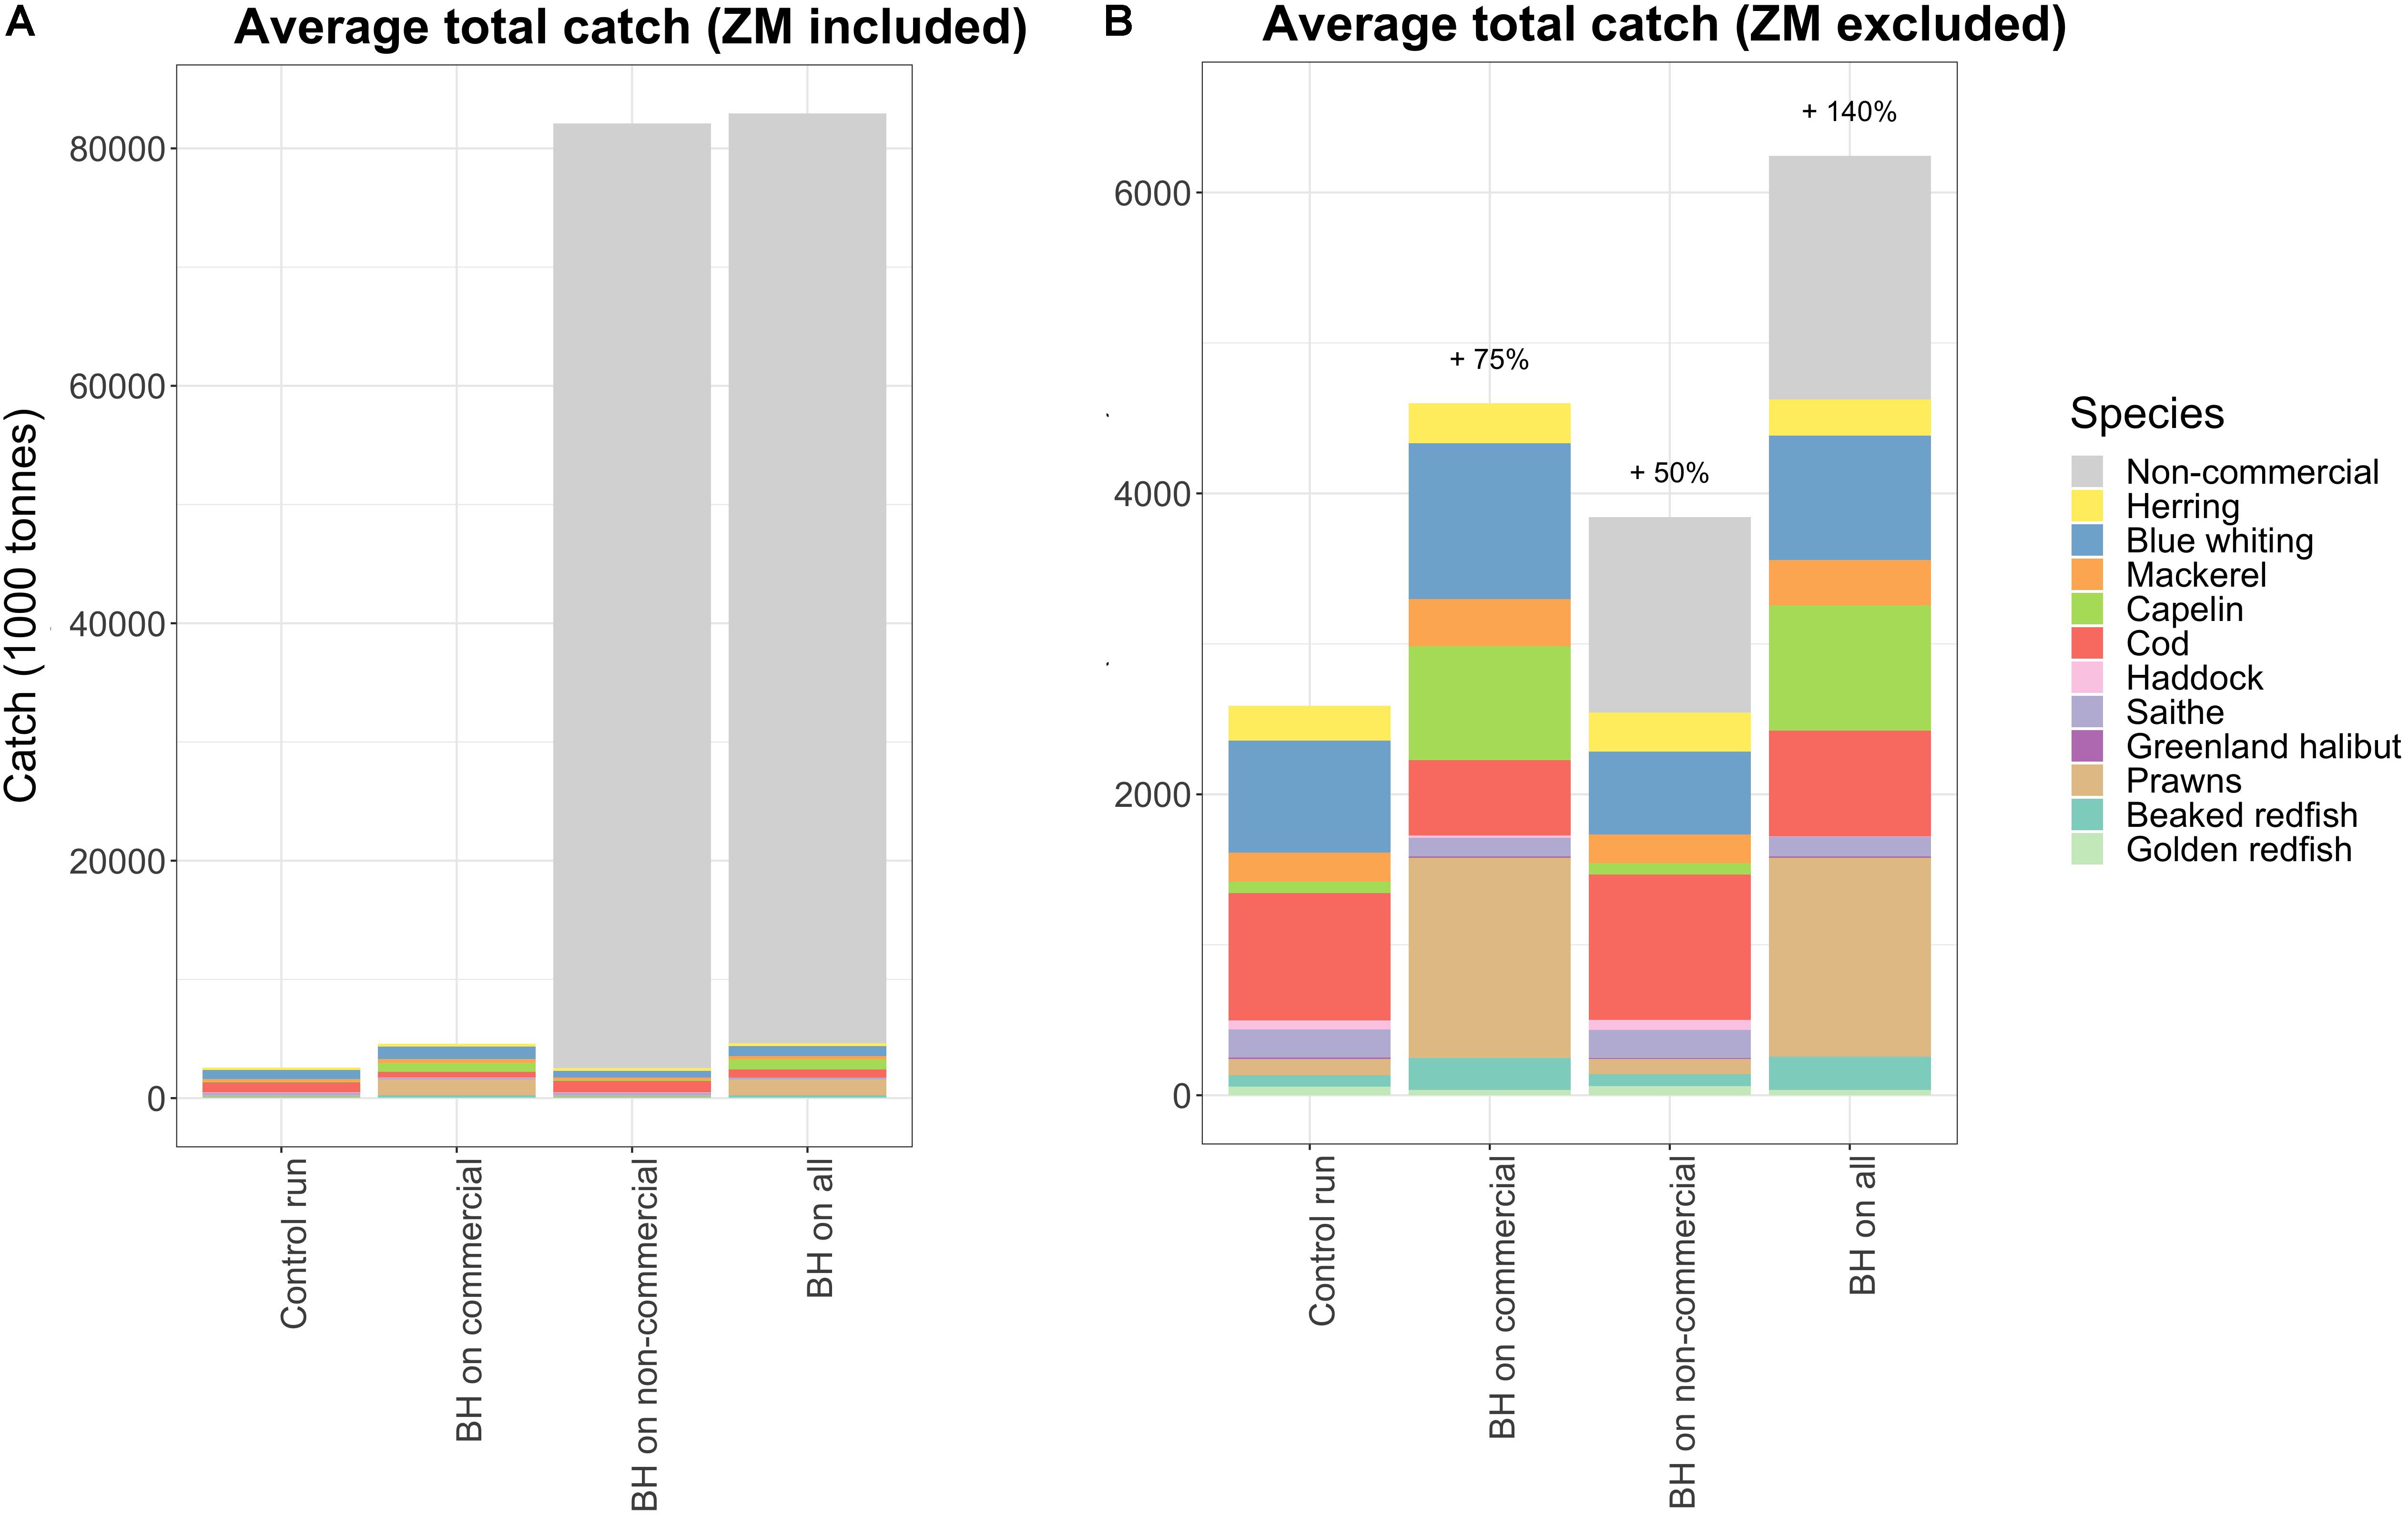
Figure 6. The total catches of all harvested species in the selected runs, (A) with and (B) without mesozooplankton (ZM) included. All non-commercial species are lumped together in one category called “Non-com” in this plot.
When exposing only non-commercial species to a BH regime the total catch of the commercial species decreased by 24,000 tons (Figure 6, which is a relatively small reduction compared to the added 80 mill tons (of mainly low trophic level species). Figure 7 shows that the reduction in catches of commercial species was primarily caused by blue whiting which was reduced by 200,000 tons, but this was partly compensated for by an increase in catches of herring and cod.
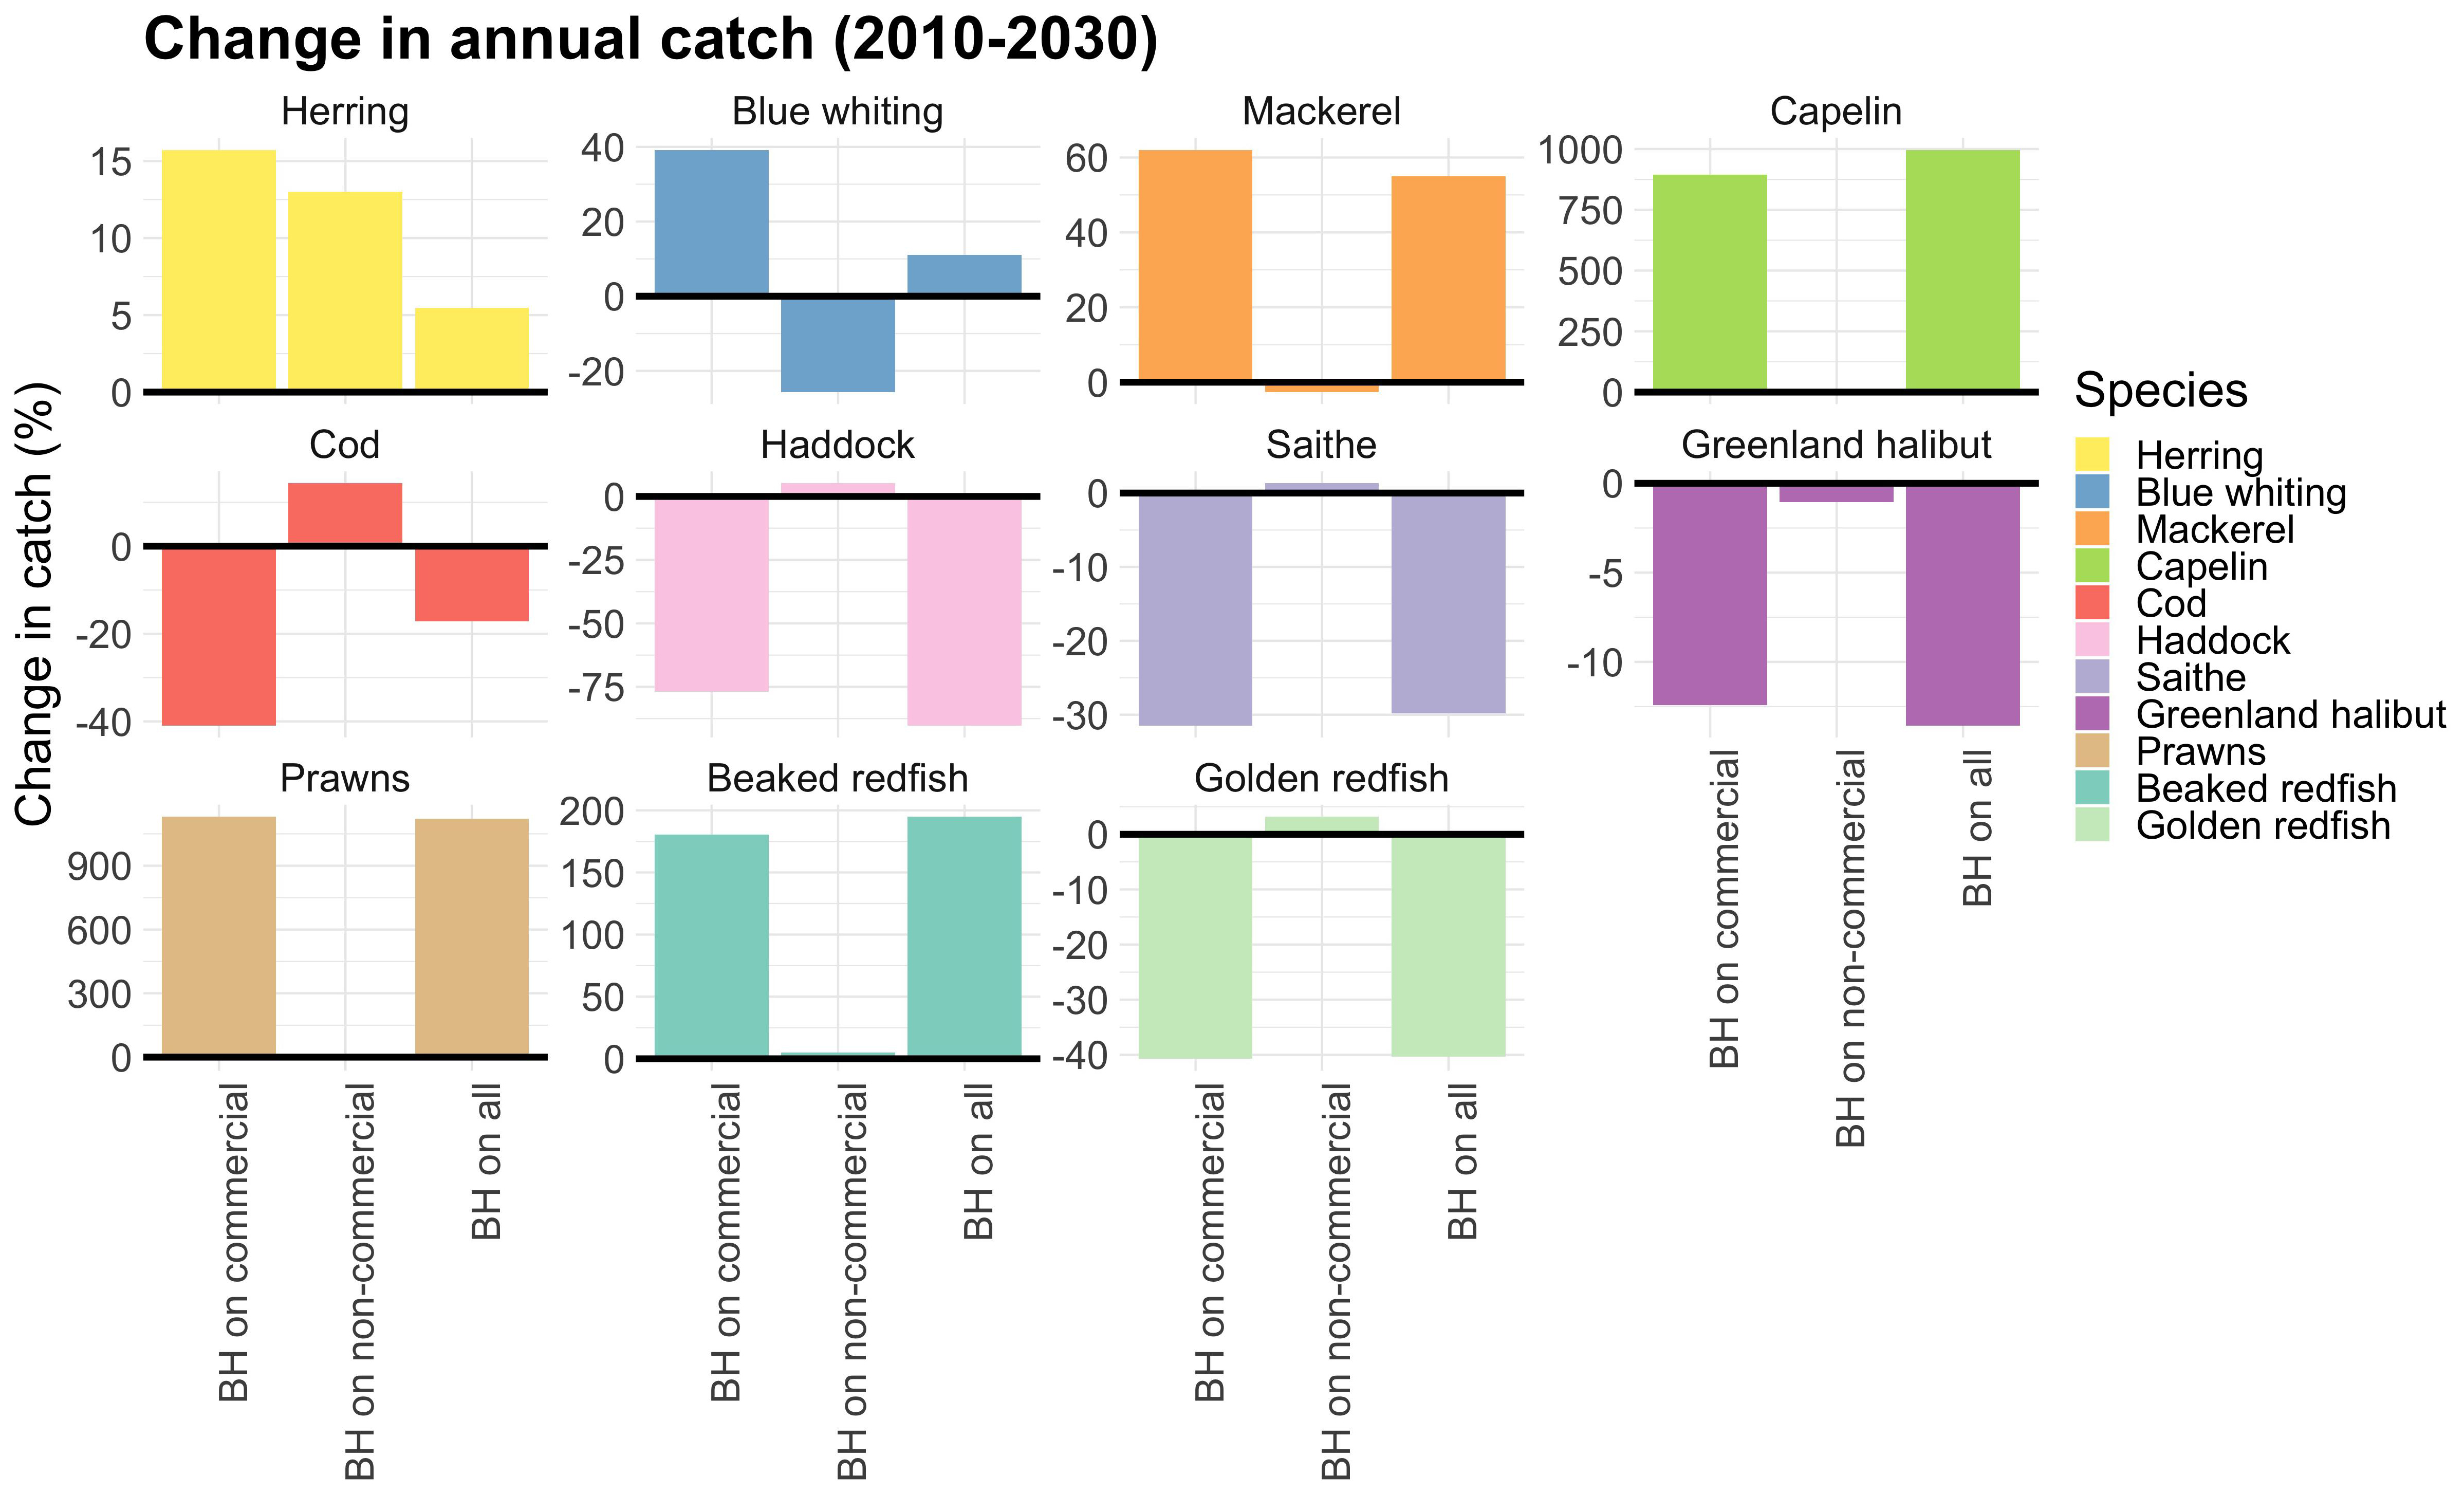
Figure 7. Relative change in total catch of commercial species over the last 20 years of the simulations compared to the control run. Note the different scales of the y-axis.
The added catch of the non-commercial species when excluding mesozooplankton, was approximately 1,6 mill tons. Most of this new catch consisted of mesopelagic fish and benthic filter feeders, as well as some smaller contributions of demersal fish, jellyfish, skates and small pelagic fish (Figure 8).
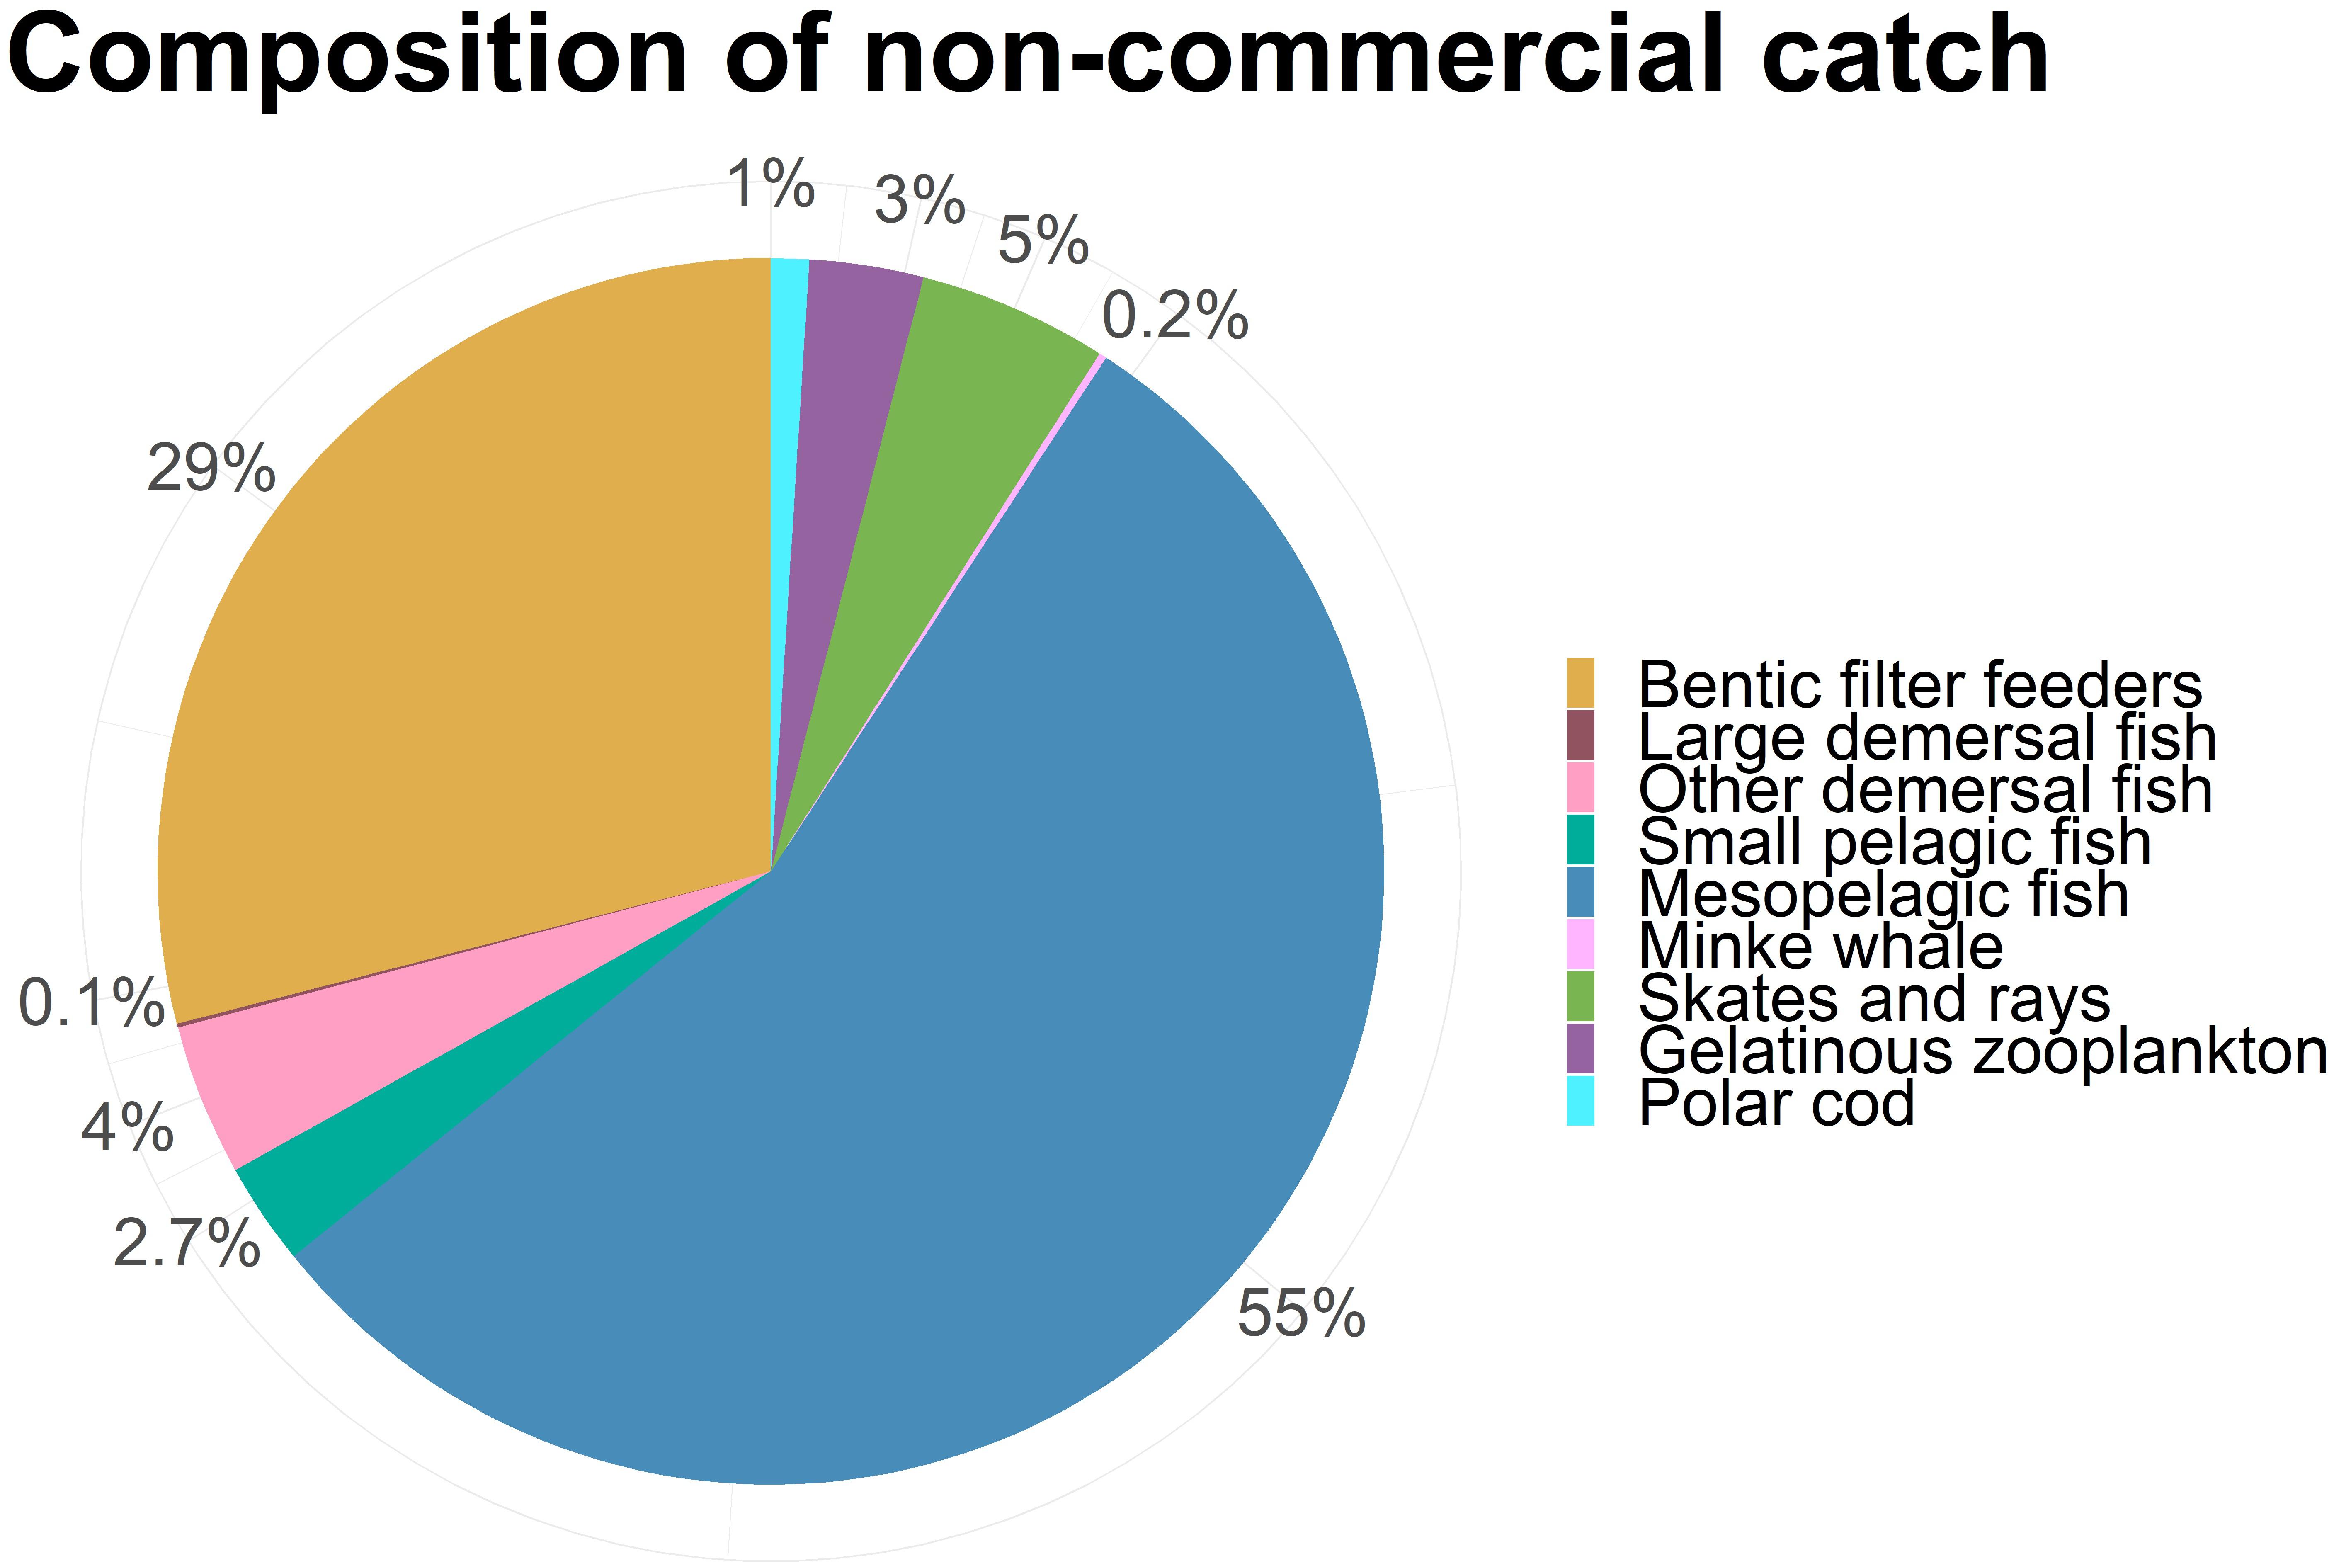
Figure 8. The composition of the total catch of non-commercial species (Excluding mesozooplankton).
Effects of BH on the Ecosystem Structure
Figure 9 illustrates how the whole ecosystem responded through changes in biomass for each guild. The individual species and functional groups belonging to each guild can be found in Table 1 and were represented as triangles in the figure. The figure showed that guilds with species subjected to BH had the strongest responses. However, the group of primary producers seemed most affected when non-commercial species were subjected to BH.
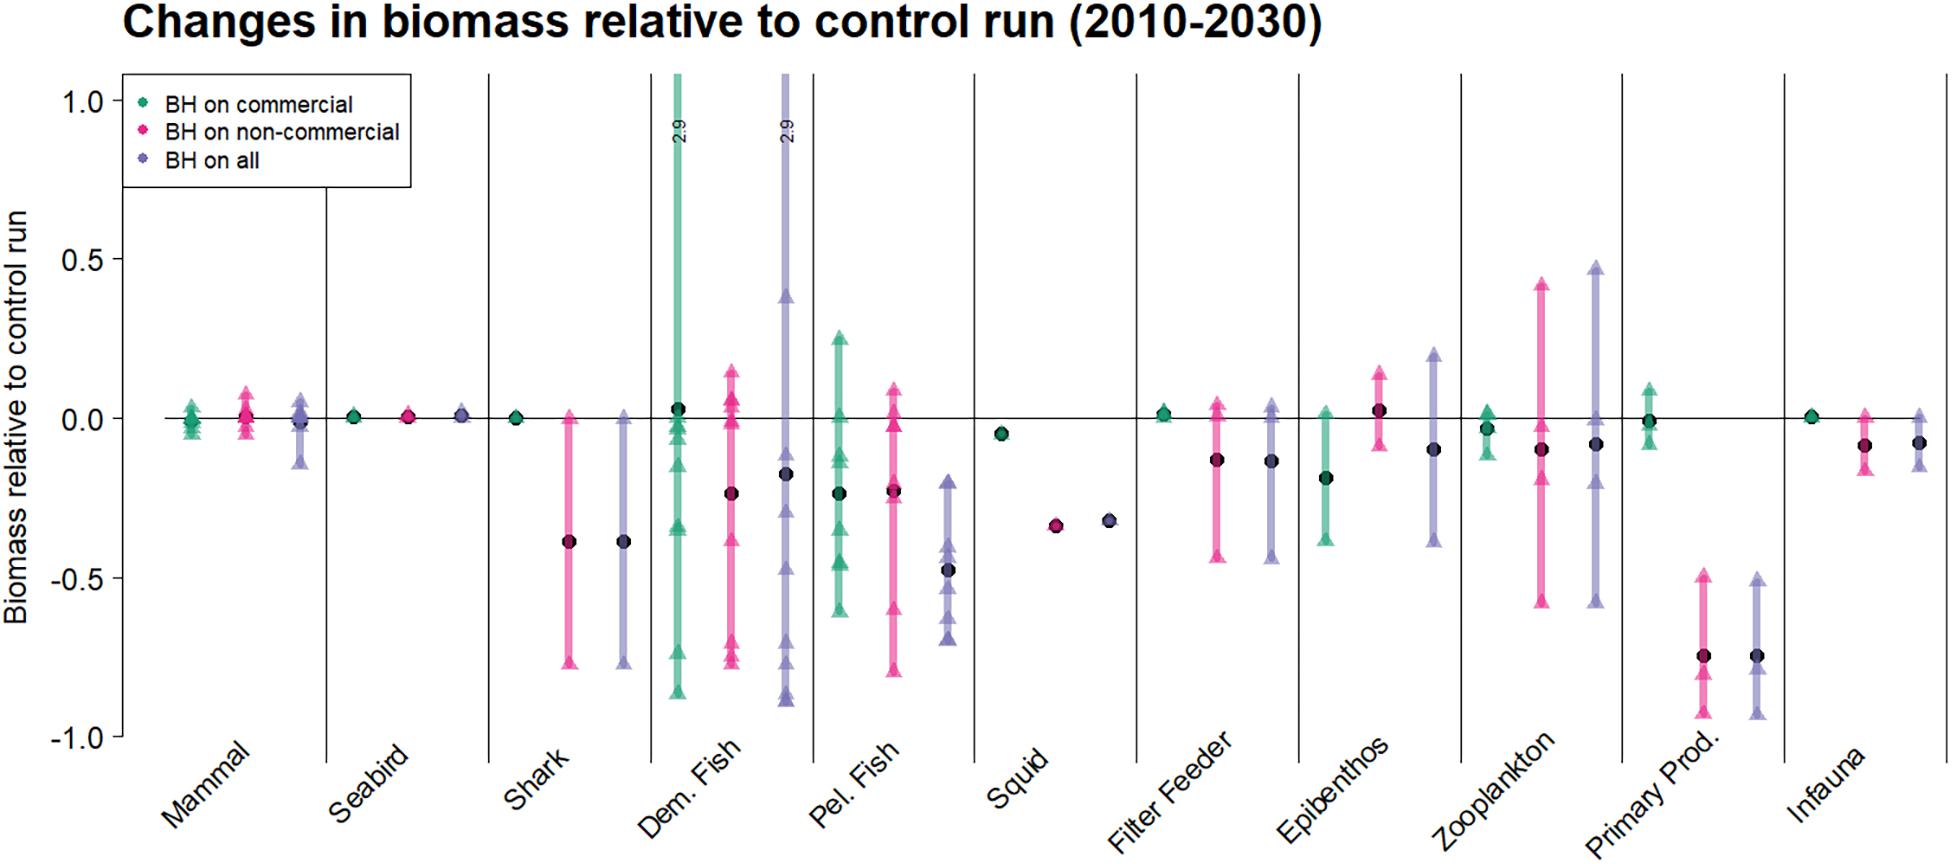
Figure 9. The effects on the biomass where species are grouped as guilds. The plot shows the relative changes in biomass for the last 20 years of the simulations for three runs compared to the initial control run were traditional fisheries were applied. The colored bars cover the range of responses from minimum to maximum, the black circles are the mean response within a guild, while the triangles show the response of individual species or functional groups.
To better understand the full effects of implementing a BH regime we needed to include more aspects than catch and biomass. Figure 10 compares five additional indicators (i) the mean trophic level of the catch (MTLCatch); (ii) the mean trophic level of the biomass (MTLBiom); (iii) the relationship between zooplankton and pelagic fish (ZooPel); (iv) the relationship between pelagic fish and demersal fish (DemPel); and (v) the value of the commercial catch only, by the three combined scenarios as well as the control run. The fully balanced run “BH on all” was the scenario which gave the highest value for all indicators except the mean trophic level of the catch. Conversely, the historic control run gave the opposite result with the lowest values for all indicators except MTLCatch. The scenarios where either the commercial or the non-commercial species were harvested balanced ended up somewhere in between the other two, with “BH on commercial” giving a higher value of the catch, while “BH on non-commercial” gave a higher mean trophic level of the biomass in the system. The “BH on all” scenario also scored the highest on the ratio of zooplankton to pelagic fish, as well as demersal fish to pelagic fish.
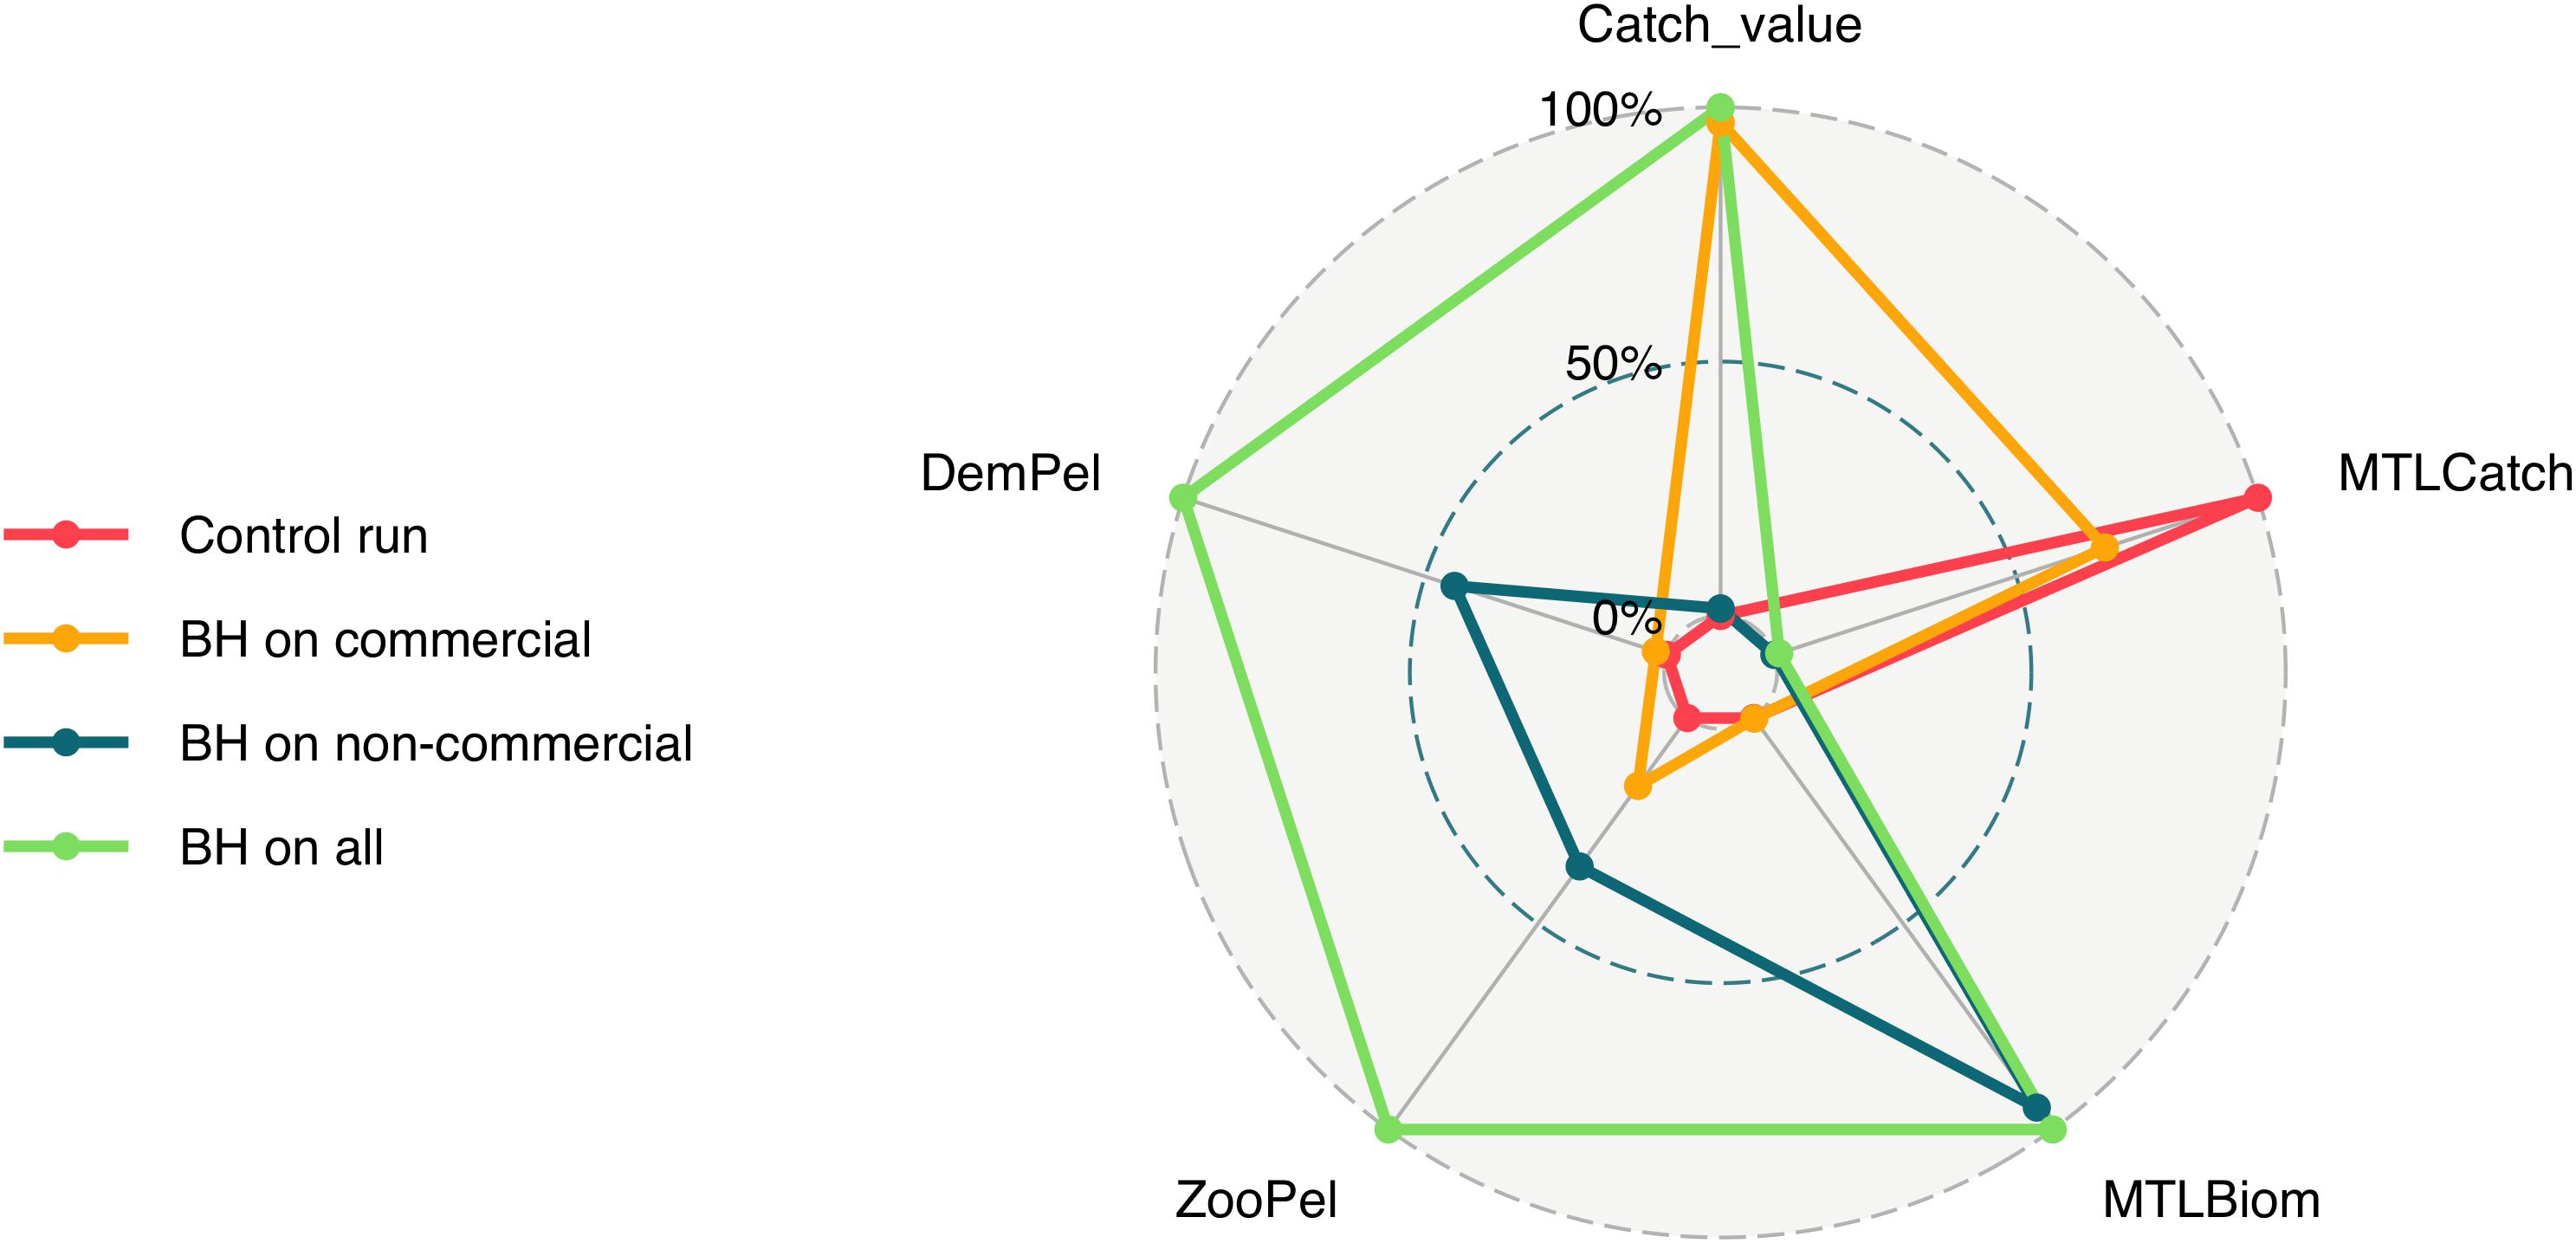
Figure 10. Five indicators are represented in this figure including (i) the mean trophic level of the catch (MTLCatch); (ii) the mean trophic level of the biomass (MTLBiom); (iii) the relationship between zooplankton and pelagic fish (ZooPel); (iv) the relationship between pelagic fish and demersal fish (DemPel); and (v) the value of the commercial catch only, by the three combined scenarios as well as the control run.
Discussion
The first attempt of testing the BH regime within the Nordic and Barents Sea system was performed by applying a NoBa Atlantis model. The results were studied through changes in biomass, levels of spawning stock biomass, catch estimates and some indicators considering value and trophic structure.
BH Effects on Individual Species
When making wide-ranging changes to the fishery across the ecosystem, it is not easy to distinguish between direct and indirect effects. In specifying fishing according to productivity BH effectively proposes changes to both the selectivity for each species and to the relative fishing pressure between species. Given that these changes could be implemented separately it is of benefit to investigate how much of any change comes from the changes to the fishery on a given species, and how much comes from the indirect ecosystem effects of changing the between species balance in fishing pressure.
The results of the BH on individual species are presented in the Supplementary Material, and a few key findings are highlighted here.
Nearly all commercial species are presently fished close to their respective estimated MSY, with the exception of Greenland halibut, golden redfish and capelin (ICES, 2018b, c). For Greenland halibut, the current assessment model is tuned only to length data, and estimates of FMSY are uncertain (ICES, 2015b). It is therefore difficult to make a direct comparison. The long term catches predicted from the BH run were slightly lower than under the historical fishing scenario, and with a much lower stock biomass. Golden redfish is presently overfished (ICES, 2018b), and the BH fishing pressure was much lower than the historical fishing levels. Applying this reduced fishing pressure led to stock recovery and eventually higher catches. For cod, applying BH to cod alone resulted in lower long term catches than under historical fishing. However, applying BH to all components of the ecosystem increased the cod catch to only slightly below that under historical fishing in the long term. Modeled BH on capelin suggested a higher fishing mortality (Table 4) resulting in up to 3 million tons extra yield. However, the capelin fishery within Atlantis is modeled as a constant fishing mortality which is known to be a poor fishing strategy for short-lived stocks with large fluctuations in biomass, such as capelin. This does not match the actual management of this stock as the HCR of capelin is a so-called escapement strategy, in which a certain amount is allowed to spawn and only the surplus may be caught, which allows for large interannual fluctuations in yield. This dynamic fishing regime is not well-replicated in the current Atlantis model, and therefore comparisons to the actual fishery are problematic for this stock.
These four stocks highlight several points of caution with the modeling conducted here, as well as the importance of considering the dynamics of the individual species. Firstly, where the stock status and reference points are unclear, the modeling and comparisons become uncertain. Secondly, where a stock is currently overfished (such as the golden redfish), then any reduction in fishing pressure is likely to be beneficial. In this case BH would aid stock recovery, but reductions in fishing pressure could equally be achieved without employing BH. In general, this is an indication that simulation testing of the merits of BH compared against good practice traditional management should compare to well-managed fisheries rather than to a current depleted stock status. For a predator such as cod, examining the differences between changing the fishing only on cod and on the whole ecosystem highlights the possibility for ecosystem level effects to partially compensate (or potentially exacerbate) for the expected catch losses. Finally, capelin represents an example where the fisheries management is not well-captured in the Atlantis model and where the results should therefore be treated with caution. Furthermore, capelin represents an example of highly variable short-lived species where a fixed fishing pressure is a poor fishing strategy, and therefore an example where a BH strategy would need to be extended to encompass these dynamics, such as the density-dependent BH1 (Eq. 1), which has not been studied in this analysis.
More single species details are presented in the Supplementary Material, but this overview serves to highlight that individual species dynamics are critical to the outcome of applying BH to an ecosystem as a whole, and that it is important to use modeling tools which are capable of resolving such detail.
BH Effects on Total Catch
When comparing the control run with combined runs of BH on multiple species, the results indicated that more species being subjected to BH resulted in overall higher catches. However, the main increase among the commercial species came from capelin and prawns, which are two species that should be treated with caution. Modeling prawns in Atlantis models appears to be a well-known problem (B. Fulton, personal communication), and even in the stock assessments there are great uncertainties around biomass estimates (ICES, 2013). As mentioned, there are also difficulties in modeling the capelin fishery in the NoBa model, which cannot accommodate an escapement rule strategy. Capelin also has a complicated life-history strategy with a very high post-spawning mortality, which requires carefulness in the interpretation of the results.
When mesozooplankton was included in the combined balanced harvest regime, it completely dominated the potential total catch (Figure 6A) with nearly 80 million tons per year, which is 20 times more than the current total Norwegian catch (Fiskeridirektoratet, 2016). The fishing pressure on mesozooplankton was set to 25% of productivity, which resulted in a 50% decrease of the biomass (Figure 4), but this huge extraction of mesozooplankton had surprisingly small effects on other species. A harvest of nearly 80 million tons would not be feasible in the real world, but considering that the current quota is set to 165,000 tons (Fiskeridirektoratet, 2016) of a stock with a standing biomass of 30 million tons with an estimated annual production of 290 million tons, then an increased quota would likely have negligible direct effects. This study sets fishing pressure directly on each modeled species and does not account for bycatch of other species resulting from any changes in catches. We therefore do not account for any potential effects of increased bycatch of eggs and larvae on other species that could be expected from such a large increase in mesozooplankton catches.
Another interesting result was that most of the commercial species had less variable catches from year to year under a BH regime compared to the traditional fishing regime, suggesting that BH would produce steadier yields. This reflected the variations in fishing mortality, as the FBH were more stable compared to FHisto in the control run.
The simulations suggest that the gains from BH in the well-managed Barents and Norwegian Sea on already commercially exploited stocks are rather limited according to the current model. Although the higher fishing levels proposed by the BH regime produced higher catches for many species, it came at the cost of significantly reducing the standing biomass (Figure 2) and subsequent decreasing catch per unit effort, and increasing risks of recruitment overfishing (4), with a few exceptions (e.g., beaked redfish).
However, this does not necessarily imply that BH is a bad idea. Howell et al. (2016) investigated the relationship between yield and production of 28 harvested species in the Norwegian and Barents sea based on an Ecopath model from Skaret and Pitcher (2016). They concluded that the current harvesting regime of the Norwegian and Barents Seas is already reasonably balanced, and more than most other marine systems (Kolding et al., 2016). This supports the finding that any extra yields would be expected to come largely from currently unexploited or underexploited species.
BH Effects on Ecosystem Structure and Value of Catch
When considering the total value of the catch, the “BH on all” and “BH on commercial” scenarios gave the highest value. This came mainly from prawns, which were high in value and catches, in addition to capelin and beaked redfish. Beaked redfish is a relatively high-value species, so the increase in catches by almost three times made a significant impact on the total value of the catch. Capelin, on the other hand, had a lower value compared to the other species but the catches in the BH runs were more than 10 times higher under the BH-scenarios, which increased the total value. However, the results from prawns and capelin should as mentioned be treated with caution. The potential economic benefits of the harvest of the non-commercial species should also be kept in mind, although such estimations were not performed here, as the prices and markets are unknown.
The trophic level of the catches was lowest under all the BH regimes, as would be expected since one of the main ideas behind BH is to increase harvest at lower trophic levels. However, this could be problematic as today’s market generally value higher trophic level species. The size-specific selectivity applied to each species in proportion to productivity, generally suggest a stronger fishing pressure on younger fish compared to a conventional fishing regime. Obviously, catch of smaller fish in the NoBa area would also fetch lower prices in the current market, adding an economic cost (that we have not considered in this study). Ecologically, the increased F on young fish is just an adjustment of the selectivity curve to be better aligned with natural mortality (and productivity), than the current traditional gear selectivity curves, and therefore we would expect a reduced effect in terms of potential fisheries induced evolution (Law and Plank, 2018). The mean trophic level in the total biomass was correspondingly much higher under the BH regimes, which included harvest of non-commercial species, due to the increased removal of low trophic species, such as mesozooplankton from the system.
The ratios of ZooPel and DemPel were chosen to study how the structure of the ecosystem might change under BH scenarios. The relative amount of zooplankton to pelagic fish was biggest in the “BH on all” scenario. This was a bit surprising as this run included an enormous harvest of mesozooplankton. However, when looking at Figure 9, the removal of mesozooplankton was partly compensated for by an increase of other zooplankton species, mainly small zooplankton, which might have kept the overall zooplankton biomass stable while pelagic fish were harvested more intensely. The DemPel ratio was also greatest for the full BH scenario, and also here was this mainly caused by the decrease in pelagic fish rather than an increase of demersals. For both of these indicators the ratios doubled in the “BH on all” scenario compared to the control run, indicating that the amount of pelagic fish was halved compared to zooplankton and demersal fish. Removing such a large part of the “middle” trophic level could change the structure of the ecosystem over time with unknown consequences that should be considered. The results therefore indicate that implementing a full BH regime in the Norwegian and Barents Seas with an exploitation level of 25% of total production could cause more changes to the already exploited species in the form of reduced biomass, than would be gained in total yields. On the other hand, expanding the fisheries to target species that are not commercially exploited today, especially on lower trophic levels, could provide considerable extra yields, and in particular from mesozooplankton. Yet, lower trophic level species tend to be less economically beneficial, and large removal of certain trophic levels could pose unknown structural changes to the ecosystem which needs to be considered.
Uncertainties and Future Studies
The results must be evaluated in terms of the assumptions and limitations of the applied model. Even though the Atlantis model is able to capture a wide range of the variability inherent in the ecosystems, increased uncertainty follows such increased complexity (Howell et al., 2016). Several assumptions and “guesstimates” had to be made to accommodate the lack of knowledge about processes and the absence of relevant data (Fulton, 2010; Hansen et al., 2016). Generality, precision and realism are three desired features in a model, but unfortunately highly complex models, with a multitude of parameters and high resolution, are generally not able to attain all three, and has a tendency to de-emphasizes one quality to optimize the other two (Olsen et al., 2016). Being an end-to-end model, Atlantis is designed to provide an overall context, but clearly some weaknesses and inexplicabilities have been discovered in this study.
One weakness is that the non-commercial functional groups are more uncertain during the parameterization and tuning of the model, both because the focus is on the “important” commercial species, and because there is less information on the non-commercial groups (Cecilie Hansen, personal communication). The first step in improving these results would be to do a comprehensive re-tuning of the non-commercial species to allow for a constant BH fishing mortality across all groups without the need for ad hoc adjustments as in this study (Table 2). The chosen constant exploitation level of 25% of estimated productivity is considered cautious and conservative since a level of up to 40% is usually considered sustainable even for forage species (Patterson, 1992; Pikitch et al., 2012). Thus, the need to reduce the exploitation level to 12.5% for most non-commercial species to avoid collapse in the present model would indicate that the parameterization and model tuning of these species may not be as accurate and robust as for the commercial species.
The method for calculating production and productivity levels for invertebrates should also be reviewed, as this resulted in very high FBH for both prawns and mesozooplankton. The production calculations for invertebrates was done differently than for vertebrates, as invertebrates are gathered into biomass pools with a given productivity, that was extrapolated by the total area.
As well as expanding this study on other ecosystems, the investigation should also be expanded to include various types of BH. As indicated, there are 2 types of BH suggested (Eqs 1 and 2), and it would be interesting to compare in a model like Atlantis how a BH based on production (BH1) would compare to a BH based on productivity (BH2), to see whether the assumed BH1 protection of species from extinction would be validated.
Summary
Through scenarios with varying fishing pressure and balanced fishing patterns in proportion to calculated productivities, we investigated the interaction effects of harvesting different components in the ecosystem. The conclusions from these simulations were that:
– Model results indicate that a BH regime in the current Norwegian and Barents Seas would result in higher total yields, mainly coming from lower trophic level species.
– The Norwegian fisheries are well-monitored and managed, and already score relatively high in terms of a balanced fishing pattern, with fishing levels on most species close to their respective MSYs, which suggests that there are only limited gains for implementing a BH regime on the current commercial stocks.
– However, the results confirmed that there is room for expanding fisheries to species that are not commercially harvested today, although it should be stressed that this could be achieved without full implementation of BH, assuming commercial markets could be found.
We should acknowledge that the appropriate fishing levels and model parametrization for non-commercial species need further validation as these species in the current model were surprisingly much more vulnerable to collapse than the commercial, which does not make logical sense. Several other weaknesses and somewhat inexplicable results were identified in the current model, which illustrates the enormous amount of synoptic data needed in order to build robust end-to-end models. In addition, biological production figures are not presently an output in Atlantis, and the methods used in this study to estimate productivity levels have not been previously tried or tested.
This is the first time a balanced fishing simulation on most living components of an aquatic ecosystem has been done using an Atlantis model, and all results should be considered tentative only. As usual, when endeavoring into uncharted and untested territory, we end up with more questions than answers. However, the broad outlines of the results are probably both robust and generic. Our findings indicate that while comparing BH with an overfished ecosystem may indicate that there are gains to be made, comparing BH with a relatively well-managed ecosystem gives a much more nuanced view. On currently exploited species, there were minimal economic gains in a BH pattern over the existing relatively well-managed fisheries regime, although the adverse biological side effects of a highly selective fishery may benefit more from a BH regime. Most of the gains identified, were a result of reducing fishing pressure on overfished species and by extending exploitation to currently un- or lightly fished species.
While BH calls for harvesting “across the widest possible range of species, stocks, and sizes of an ecosystem” (Garcia et al., 2012), attention should be drawn to word “possible.” There is no inherent requirement for BH to be applied to absolutely every component in an ecosystem. For example, it may be that, even under BH, societies might choose to exclude charismatic megafauna from the harvest. Or that certain species and size categories may be uneconomic to harvest. In examining the possible impacts of BH it is therefore important to employ models with a sufficient level of detail (such as Atlantis) in order to examine the detailed outcomes of different potential implementations of BH. We hope that this paper has demonstrated that this level of analysis is now achievable.
We would conclude by noting that with a rapidly growing human population, likely approaching 9 billion by 2050 (United Nations, 2019), the need for healthy food is one of our world’s great challenges. The United Nations Sustainable Development Goals (SDGs) addresses in SDG2 the zero-hunger goal, in SDG3 good health, and in SDG14 conserving and sustainable use of life below water, as three of the 17 most important issues in the world (United Nations, 2015). The demand for nutritious and healthy food has never been more important, and there is an urgent need for developing new sustainable harvesting strategies that ensure increased food production without depleting the ecosystem. Today only 3% of the food is harvested from the oceans (Field et al., 1998) which suggest an untapped potential. This study demonstrates the potential of expanding our harvest pattern to unexploited species without dramatic disruption of the system, which is one of the primary objectives of BH.
Data Availability Statement
The datasets analyzed in this article are not publicly available. Requests to access the datasets should be directed to IN.
Author Contributions
This article is based on the Master thesis of IN (Nilsen, 2018), jointly supervised by JK, CH, and DH. In the following preparation for the manuscript, IN was the lead author, while JK, CH, and DH contributed by editing and revision.
Conflict of Interest
The authors declare that the research was conducted in the absence of any commercial or financial relationships that could be construed as a potential conflict of interest.
Funding
This work was carried out as part and funded by the Institute of Marine Research (IMR) Strategic Project 445 ‘Reduced Uncertainty in Stock Assessment’ (2016–2020), project number 3680_14809. It was also funded by the Research Council of Norway through the project The Nansen Legacy (project number 276730) which is a contribution to the Barents Sea Ecosystem Program at IMR. In addition, we are grateful to Isaac Kaplan, Gavin Fay, and Kelli Johnson for providing R-scripts to produce Figure 9.
Supplementary Material
The Supplementary Material for this article can be found online at: https://www.frontiersin.org/articles/10.3389/fmars.2020.00070/full#supplementary-material
References
Beddington, J. R., and Cooke, J. G. (1983). “The potential yield of fish stocks,” in Fao Fisheries Technical Paper 242, (London: International Institute for Environment and Development).
Black, R. (2006). BBC NEWS | Science/Nature | “Only 50 Years Left” For Sea Fish. Avaliable at: http://news.bbc.co.uk/2/hi/science/nature/6108414.stm (accessed March.21.17).
Bundy, A., Fanning, P., and Zwanenburg, K. C. F. T. (2005). Balancing exploitation and conservation of the eastern Scotian Shelf ecosystem: application of a 4D ecosystem exploitation index. ICES J. Mar. Sci. 62, 503–510. doi: 10.1016/j.icesjms.2004.12.008
Burgess, M. G., Diekert, F. K., Jacobsen, N. S., Andersen, K. H., and Gaines, S. D. (2016). Remaining questions in the case for balanced harvesting. Fish Fish. 17, 1216–1226. doi: 10.1111/faf.12123
Calanus (2018). Calanus. Avaliable at: https://www.calanus.no/ (accessed January.29.18).
CBD (1992). Convention on Biological Diversity, Rio de Janeiro. Avaliable at: http://www.cbd.int/rio/ (accessed February.6.18).
Christensen, V., Coll, M., Piroddi, C., Steenbeek, J., Buszowski, J., and Pauly, D. (2014). A century of fish biomass decline in the ocean. Mar. Ecol. Prog. Ser. 512, 155–166. doi: 10.3354/meps10946
Coll, M., Shannon, L. J., Kleisner, K. M., Juan-Jordá, M. J., Bundy, A., Akoglu, A. G., et al. (2016). Ecological indicators to capture the effects of fishing on biodiversity and conservation status of marine ecosystems. Ecol. Indic. 60, 947–962. doi: 10.1016/j.ecolind.2015.08.048
Costello, C., Ovando, D., Hilborn, R., Gaines, S. D., Deschenes, O., and Lester, S. E. (2012). Status and solutions for the world’s unassessed fisheries. Science 338, 517–520. doi: 10.1126/science.1223389
FAO (2016). “The state of world fisheries and aquaculture 2016,” in Contributing to Food Security and Nutrition for All, (Rome: FAO).
FAO (2018). “Fisheries and aquaculture topics,” in The State of World Fisheries and Aquaculture (SOFIA). Topics Fact Sheets, (Rome: FAO).
Fay, G., DePiper, G., Steinback, S., Gamble, R. J., and Link, J. S. (2019). Economic and ECOSYSTEM EFFECTS OF FISHINg on the Northeast US Shelf. Front. Mar. Sci. 6:133. doi: 10.3389/fmars.2019.00133
Field, C. B., Behrenfeld, M. J., Randerson, J. T., and Falkowski, P. (1998). Primary production of the biosphere: integrating terrestrial and oceanic components. Science 281, 237–240. doi: 10.1126/science.281.5374.237
Fiskeridirektoratet (2016). Forvaltningsplan for Raudåte. Avaliable at: https://www.fiskeridir.no/Yrkesfiske/Dokumenter/Rapporter/2016/Forvaltningsplan-for-raudaate (accessed June.6.18).
Froese, R., Walters, C., Pauly, D., Winker, H., Weyl, O. L. F., Demirel, N., et al. (2016). A critique of the balanced harvesting approach to fishing. ICES J. Mar. Sci. 73, 1640–1650. doi: 10.1093/icesjms/fsv122
Fulton, E. A. (2010). Approaches to end-to-end ecosystem models. J. Mar. Syst. 81, 171–183. doi: 10.1016/j.jmarsys.2009.12.012
Fulton, E. A., Link, J. S., Kaplan, I. C., Savina-Rolland, M., Johnson, P., Ainsworth, C., et al. (2011). Lessons in modelling and management of marine ecosystems: the Atlantis experience. Fish Fish 12, 171–188. doi: 10.1111/j.1467-2979.2011.00412.x
Garcia, S., Sparre, P., and Csirke, J. (1989). Estimating surplus production and maximum sustainable yield from biomass data when catch and effort time series are not available. Fish. Res. 8, 13–23. doi: 10.1016/0165-7836(89)90037-4
Garcia, S. M., Kolding, J., Rice, J., Rochet, M. J., Zhou, S., Arimoto, T., et al. (2012). Reconsidering the consequences of selective fisheries. Science 335, 1045–1047. doi: 10.1126/science.1214594
Garcia, S. M., Rice, J., and Charles, A. (2015). Balanced harvesting in fisheries: a preliminary analysis of management implications. ICES J. Mar. Sci. J. Cons 73, 1668–1678. doi: 10.1093/icesjms/fsv156
Gullestad, P., Aglen, A., Bjordal, Å, Blom, G., Johansen, S., Krog, J., et al. (2014). Changing attitudes 1970–2012: evolution of the Norwegian management framework to prevent overfishing and to secure long-term sustainability. ICES J. Mar. Sci. 71, 173–182. doi: 10.1093/icesjms/fst094
Hansen, C., Drinkwater, K. F., Jähkel, A., Fulton, E. A., Gorton, R., and Skern-Mauritzen, M. (2019). Sensitivity of the Norwegian and Barents Sea Atlantis end-to-end ecosystem model to parameter perturbations of key species. PLoS One 14:e0210419. doi: 10.1371/journal.pone.0210419
Hansen, C., Skern-Mauritzen, M., van der Meeren, G., Jähkel, A., and Drinkwater, K. (2016). Set-up of the Nordic and Barents Seas (NoBa) Atlantis Model. Technical Report Number: 2-2016. Bergen: Norwegian Institute of Marine Research.
Heath, M. R., Richard, L., Kate, S., Cook, R., Speirs, D., Daunt, F., et al. (2017). “Scoping the background information for an ecosystem approach to fisheries in scottish waters: review of predator-prey interactions with fisheries, and balanced harvesting,” in Project report Fisheries Innovation Scotland: Contract FIS013, (Inverness: University of the Highlands and Islands).
Heino, M., and Godø, O. R. (2002). Fisheries-induced selection pressures in the context of sustainable fisheries. Bull. Mar. Sci. 70, 639–656.
Hile, R. (1936). Age and Growth of the Cisco, Leucichthys Artedi (Le Sueur), in the Lakes of the Northeastern Highlands. Wisconsin: US Government Printing Office.
Howell, D., Hansen, C., Bogstad, B., and Skern-Mauritzen, M. (2016). Balanced harvesting in a variable and uncertain world: a case study from the Barents Sea. ICES J. Mar. Sci. 73, 1623–1631. doi: 10.1093/icesjms/fsw034
Hsieh, C., Yamauchi, A., Nakazawa, T., and Wang, W.-F. (2010). Fishing effects on age and spatial structures undermine population stability of fishes. Aquat. Sci. 72, 165–178. doi: 10.1007/s00027-009-0122-2
ICES (2013). Report of the Inter-Benchmark Protocol on Pandalus in Skagerrak and the Norwegian Deep (IBPPand) (No. 71). Dartmouth, NS: ICES.
ICES (2015a). Report of the arctic fisheries working group (AFWG), 23–29 April 2015. Hambg. Ger.590. Copenhagen: ICES.
ICES (2015b). “Report of the inter benchmark process on greenland halibut in ICES areas I and II (IBPHALI),” in Corresp. 44, (Copenhagen: ICES).
ICES (2016). Advice on Fishing Opportunities, Catch, and Effort Barents Sea and Norwegian Sea Ecoregions. Copenhagen: ICES.
ICES (2017). Report of the Workshop to review the ICES advisory Framework for Short Lived Species, Including Detailed Exploration of the use of Escapement Strategies and Forecast Methods (WKMSYREF5). Copenhagen: ICES.
ICES (2018a). “ICES advise basis, in: report of the ices advisory committee,” in ICES Advice 2018, (Copenhagen: ICES).
ICES (2018b). “Report of the ARCTIC FISHERIES WORKING GROUP (AFWG),” in Ispra Italy, ICES CM 2018/ACOM 859, (Copenhagen: ICES).
ICES (2018c). “Report of the working group on widely distributed stocks (WGWIDE),” in Torshavn Faroe Isl. 488, (Copenhagen: ICES).
ICES (2018d). “Arctic fisheries working group (AFWG),” in Haddock (Melanogrammus aeglefinus) in Subareas 1 and 2 (Northeast Arctic) Rep. ICES Advis. Comm, (Copenhagen: ICES).
ICES (2018e). “Arctic fisheries working group (AFWG),” in Golden Redfish (Sebastes Norvegicus) in subareas 1 and 2 (Northeast Arctic) Rep. ICES Advis. Comm, (Copenhagen: ICES).
ICES (2018f). “Arctic fisheries working group (AFWG),” in Beaked Redfish (Sebastes mentella) in subareas 1 and 2 (Northeast Arctic) Rep. ICES Advis. Comm, (Copenhagen: ICES).
ICES (2018g). “Joint NAFO/ICES pandalus assessment working group (NIPAG),” in Northern Shrimp (Pandalus Borealis) in Subareas 1 and 2 (Northeast Arctic) Rep. ICES Advis. Comm., (Copenhagen: ICES).
ICES (2018h). “Working group on widely distributed stocks (WGWIDE),” in Blue Whiting (Micromesistius Poutassou) in Subareas 1–9, 12, and 14 (Northeast Atlantic and adjacent waters) Rep. ICES Advis. Comm, (Copenhagen: ICES).
ICES (2019a). “Arctic fisheries working group (AFWG),” in Capelin (Mallotus villosus) in subareas 1 and 2 (Northeast Arctic), excluding Division 2.a west of 5°W (Barents Sea capelin) Rep. ICES Advis. Comm, (Copenhagen: ICES).
ICES (2019c). “Arctic fisheries working group (AFWG),” in Saithe (Pollachius virens) in Subareas 1 and 2 (Northeast Arctic) Rep. ICES Advis. Comm, (Copenhagen: ICES).
ICES (2019d). “Arctic fisheries working group (AFWG),” in Greenland Halibut (Reinhardtius Hippoglossoides) in Subareas 5, 6, 12, and 14 (Iceland and Faroes grounds, West of Scotland, North of Azores, East of Greenland) Rep. ICES Advis. Comm, (Copenhagen: ICES).
ICES (2019e). “Working group on widely distributed stocks (WGWIDE),” in Norway special request for revised 2019 advice on mackerel (Scomber scombrus) in subareas 1–8 and 14, and in Division 9.a (the Northeast Atlantic and adjacent waters) Rep. ICES Advis. Comm, (Copenhagen: ICES).
ICES (2019f). “Working group on widely distributed stocks (WGWIDE),” in Herring (Clupea harengus) in Subareas 1, 2, and 5, and in divisions 4.a and 14.a, Norwegian Spring-Spawning Herring (the Northeast Atlantic and Arctic Ocean) Rep. ICES Advis. Comm, (Copenhagen: ICES).
Jacobsen, N. S., Gislason, H., and Andersen, K. H. (2014). The consequences of balanced harvesting of fish communities. Proc. R. Soc. Lond. B Biol. Sci. 281, 20132701. doi: 10.1098/rspb.2013.2701
Kolding, J. (1993). “Trophic interrelationships and community structure at two different periods of Lake Turkana, Kenya: a comparison using the ECOPATH II box model,” in Trophic Models of Aquatic Ecosystems. ICLARM Conference Proceedings, eds V. Christensen and D. Pauly, (Manila: International Center for Living Aquatic Resources Management), 116–123.
Kolding, J., Bundy, A., van Zwieten, P. A. M., and Plank, M. J. (2016). Fisheries, the inverted food pyramid. ICES J. Mar. Sci. 73, 1697–1713. doi: 10.1093/icesjms/fsv225
Kolding, J., Jacobsen, N. S., Andersen, K. H., and van Zwieten, P. A. M. (2015). Maximizing fisheries yields while maintaining community structure. Can. J. Fish. Aquat. Sci. 73, 644–655. doi: 10.1139/cjfas-2015-0098
Kolding, J., and van Zwieten, P. A. M. (2011). The tragedy of our legacy: how do global management discourses affect small scale fisheries in the south? Forum Dev. Stud. 38, 267–297. doi: 10.1080/08039410.2011.577798
Kolding, J., and van Zwieten, P. A. M. (2014). Sustainable fishing of inland waters. J. limnol. 73, 132–148. doi: 10.4081/jlimnol.2014.818
Law, R. (2007). Fisheries-induced evolution: present status and future directions. Mar. Ecol. Prog. Ser. 335, 271–278. doi: 10.3354/meps335271
Law, R., Kolding, J., and Plank, M. J. (2013). Squaring the circle: reconciling fishing and conservation of aquatic ecosystems. Fish Fish. 16, 160–174. doi: 10.1111/faf.12056
Law, R., and Plank, M. (2018). Balanced harvesting could reduce fisheries-induced evolution. Fish Fish. 19, 1–14. doi: 10.1111/faf.12313
Martin, W. R. (1947). The determination of the age and growth of the perch (Perca fluviatilis) from the opercular bone. J. Anim. Ecol. 16, 188–204.
Miljøverndepartementet (2006). St.meld. nr. 8 (2005-2006) Helhetlig forvaltning av det Marine miljø i Barentshavet og Havområdene Utenfor Lofoten (forvaltningsplan). Ministry of Environment, Oslo (available in English From the Norwegian Ministry of Environment. Avaliable at: https://www.regjeringen.no/no/dokumenter/stmeld-nr-8-2005-2006-/id199809/ (accessed April.12.18).
Miljøverndepartementet (2009). St.meld. nr. 37 (2008-2009) Helhetlig Forvaltning av Det Marine Miljø i Norskehavet (Forvaltningsplan). Avaliable at: https://www.regjeringen.no/no/dokumenter/stmeld-nr-37-2008-2009-/id560159/ (accessed April.12.18).
Miljøverndepartementet (2011). St.meld. nr. 10 (2010–2011) Oppdatering av Forvaltningsplanen for det Marine MILJØ i Barentshavet og Havområdene Utenfor Lofoten. Avaliable at: https://www.regjeringen.no/no/dokumenter/horing—oppdatering-av-forvaltningsplan/id601947/ (accessed April.12.18).
Nilsen, I. (2018). Exploring Balanced Harvesting by Using an Atlantis Ecosystem Model for the Nordic and Barents Seas. M.Sc. thesis, University of Bergen, Norway, 78.
Norges Sildesalgslag (2019). Omsetning - Norges Sildesalgslag. Avaliable at: https://www.sildelaget.no/no/kvoter-og-fangst/statistikk/omsetning/ (accessed October.31.19).
Norsk Råfisklag (2019). Norges Råfisklag - Pris og Statistikk. Avaliable at: https://www.rafisklaget.no/portal/page/portal/NR/PrisogStatistikk (accessed October.31.19).
Olsen, E., Fay, G., Gaichas, S., Gamble, R., Lucey, S., and Link, J. S. (2016). ecosystem model skill assessment. yes we can! PLoS One 11:e0146467. doi: 10.1371/journal.pone.0146467
Olsen, E., Gjøsæter, H., Røttingen, I., Dommasnes, A., Fossum, P., and Sandberg, P. (2007). The norwegian ecosystem-based management plan for the barents Sea. ICES J. Mar. Sci. 64, 599–602. doi: 10.1093/icesjms/fsm005
Patterson, K. (1992). Fisheries for small pelagic species: an empirical approach to management targets. Rev. Fish Biol. Fish. 2, 321–338. doi: 10.1007/BF00043521
Pauly, D. (1984). Fish population dynamics in tropical waters: a manual for use with programmable calculators. ICLARM Stud. Rev. ICLARM, Manila. Philippines 8, 325.
Pauly, D., Froese, R., and Holt, S. J. (2016). Balanced harvesting: The institutional incompatibilities. Mar. Policy 69, 121–123. doi: 10.1016/j.marpol.2016.04.001
Peters, R. H. (1986). The ecological Implications of Body size. Cambridge: Cambridge University Press.
Pikitch, E. K., Rountos, K. J., Essington, T. E., Santora, C., Pauly, D., Watson, R., et al. (2012). The global contribution of forage fish to marine fisheries and ecosystems. Fish Fish. 15, 43–64. doi: 10.1111/faf.12004
Pitcher, T. J., Kalikoski, D., Short, K., Varkey, D., and Pramod, G. (2009). An evaluation of progress in implementing ecosystem-based management of fisheries in 33 countries. Mar. Policy 33, 223–232. doi: 10.1016/j.marpol.2008.06.002
Plagányi, ÉE. (2007). “Models for an Ecosystem Approach to Fisheries,” in FAO Fish. Technical Papers, (Rome: FAO), 108.
Reid, D. G., Graham, N., Suuronen, P., He, P., and Pol, M. (2016). Implementing balanced harvesting: practical challenges and other implications. ICES J. Mar. Sci. 73, 1690–1696. doi: 10.1093/icesjms/fsv253
RStudio Team (2015). RStudio: Integrated Development for R. RStudio, Inc. Avaliable at: http://www.rstudio.com/ (accessed May.1.18).
Sakshaug, E., Johnsen, G. H., and Kovacs, K. M. (2009). Ecosystem Barents Sea. Tapir. Academic Press.
Shchepetkin, A. F., and McWilliams, J. C. (2005). The regional oceanic modeling system (ROMS): a split-explicit, free-surface, topography-following-coordinate oceanic model. Ocean Model. 9, 347–404. doi: 10.1016/j.ocemod.2004.08.002
Shepherd, J. G. (1982). A family of general production curves for exploited populations. Math. Biosci. 59, 77–93. doi: 10.1016/0025-5564(82)90110-9
Skaret, G., and Pitcher, T. J. (2016). An Ecopath With Ecosim Model of the Norwegian Sea and Barents Sea Validated Against Time Series of Abundance. 33 S. Bergen: Norwegian Institute of Marine Research.
Skogen, M. D., Budgell, W. P., and Rey, F. (2007). Interannual variability in Nordic seas primary production. ICES J. Mar. Sci. 64, 889–898. doi: 10.1093/icesjms/fsm063
Sparre, P., and Venema, S. C. (1998). “Introduction to tropical fish stock assessment,” in FAO Fisheries Technical Paper, (FAO: Rome).
Sumaila, U. R., Cheung, W., Dyck, A., Gueye, K., Huang, L., Lam, V., et al. (2012). Benefits of rebuilding global marine fisheries outweigh costs. PLoS One 7:e40542. doi: 10.1371/journal.pone.0040542
UNCLOS (1982). United Nations Convention on the Law of the Sea (UNCLOS) of 10 December 1982. Avaliable at: http://www.un.org/depts/los/ convention_agreements/convention_overview_convention.htm (accessed February.6.18).
UNEP/CBD (1998). Report of the Workshop on the Ecosystem Approach. 26-28 January 1998, Lilongwe, Malawi. UNEP Nairobi. Doc. UNEP/CBD/COP/4/Inf. 9. Avaliable at: https://www.cbd.int/ecosystem/principles.shtml (accessed January.31.18).
United Nations (2015). Sustainable development goals - United Nations. Avaliable at: https://sustainabledevelopment.un.org (accessed January 31, 2018).
United Nations (2019). Department of Economic and Social Affairs. World Population Prospects 2019. Avaliable at: https://esa.un.org/unpd/wpp/Download/Standard/Population/ (accessed 1.29.18).
Keywords: balanced harvesting, Atlantis, end-to-end modeling, management strategy evaluation, Ecosystem Approach to Fisheries
Citation: Nilsen I, Kolding J, Hansen C and Howell D (2020) Exploring Balanced Harvesting by Using an Atlantis Ecosystem Model for the Nordic and Barents Seas. Front. Mar. Sci. 7:70. doi: 10.3389/fmars.2020.00070
Received: 31 May 2019; Accepted: 30 January 2020;
Published: 05 March 2020.
Edited by:
Jacob Carstensen, Aarhus University, DenmarkReviewed by:
Marie Maar, Aarhus University, DenmarkJason Link, National Oceanic and Atmospheric Administration (NOAA), United States
Copyright © 2020 Nilsen, Kolding, Hansen and Howell. This is an open-access article distributed under the terms of the Creative Commons Attribution License (CC BY). The use, distribution or reproduction in other forums is permitted, provided the original author(s) and the copyright owner(s) are credited and that the original publication in this journal is cited, in accordance with accepted academic practice. No use, distribution or reproduction is permitted which does not comply with these terms.
*Correspondence: Ina Nilsen, aW5hLm5pbHNlbkBoaS5ubw==