 Ramis Rafay
 Joao M. Uratani
 Hector H. Hernandez
 Jorge Rodríguez
- 1Department of Chemical Engineering, Khalifa University, Abu Dhabi, United Arab Emirates
- 2Research and Innovation Center on CO2 and H2 (RICH), Khalifa University, Abu Dhabi, United Arab Emirates
- 3Department of Biomedical Engineering, Khalifa University, Abu Dhabi, United Arab Emirates
- 4Center for Membranes and Advanced Water Technology, Khalifa University, Abu Dhabi, United Arab Emirates
This study aims to determine the maximum specific biomass growth rates of Nannochloropsis gaditana and Tetraselmis chuii grown in sequential batch reactors. The maximum specific growth rates of N. gaditana and T. chuii were found to be 0.23 ± 0.04 gVSS/gVSS⋅d and 0.22 ± 0.05 gVSS/gVSS⋅d respectively. Optical density measured at 550 nm (OD550) accurately predict volatile suspended solids (VSS) concentration in N. gaditana growth media but not in T. chuii growth media. We observed decoupling of nitrate uptake from cell growth for both microalgae as growth continued well beyond the point where concentrations of nitrate in the growth media fell below the detection limit. This nitrate decoupling highlights the challenges in current microalgae growth models as growth was independent of the extracellular dissolved nitrogen in the system.
Introduction
Biomass derived from marine microalgae are a potential substitute for feed filler in animal feed and for human consumption. Marine microalgae present an attractive substitute over that of traditional agricultural cash crops as marine microalgae can be grown in seawater, do not use arable land and have higher biomass productivities (Wijffels et al., 2010; Vanthoor-Koopmans et al., 2013). Microalgae-based biomass may also be a suitable replacement for commodities such as soybeans, meats, rice, and eggs (Borowitzka, 1997; Brown et al., 1997) due to their comparable nutritional values (Table 1).
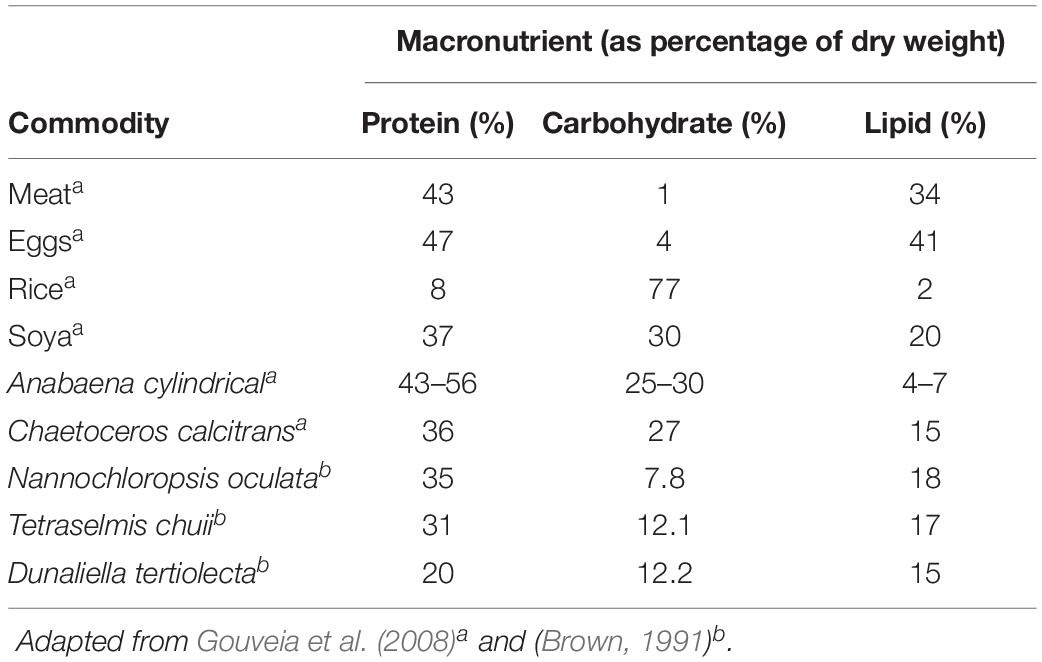
Table 1. Comparing protein, carbohydrate and lipid contents between conventional food commodities and marine microalgae (on a dry weight basis).
In arid/semi-arid water stressed regions such as Central Asia, Middle East, and North Africa, the use of halotolerant/halophilic plants holds potential for sustainable agriculture, biofuel production, and biotechnology (Luo et al., 2015; Brown et al., 2018). In particular, microalgae represent an opportunity to replace conventional water intensive protein sources. For example, according to the methodology used by York (2011), the water footprint of 1 kg of beef meat is 15,500 liters of fresh water. Today, a plethora of marine microalgae species are used as a food source for farmed juvenile molluscs, crustaceans, rotifers and aquaculture marine fish (Borowitzka, 1997; Brown et al., 1997). Some microalgae are also used as feed to supplement the diets of ruminants such as sheep and cattle in place of conventional protein sources such as soybean meal (Becker, 2007). Two such interesting marine microalgae species, Nannochloropsis gaditana and Tetraselmis chuii, were explored in this study due to their nutritional properties for food and feed, and distinct metabolic capabilities.
Cells of N. gaditana are unicellular and have an ellipsoidal shape with a diameter of 2–8 μm (Lubián, 1982). N. gaditana has been documented to grow well in both indoor and outdoor conditions and has been studied for the optimization of lipid accumulation and pigment production. Under nitrogen starvation conditions, N. gaditana is known to accumulate lipids in the order of 40–60% (w/w) (Fabregas et al., 2002; Rocha et al., 2003; Benito et al., 2015; Fernandes et al., 2016) in the form of triacylglycerol and polyunsaturated fatty acids (PUFA) (Ma et al., 2016). The current market-relevant production of Nannochloropsis strains is mainly as food supplements for Eicosapentaenoic Acid (EPA), as aquaculture feed in the form of concentrates and pastes, and in skin care products (Enzing et al., 2014; Riveros et al., 2018). Reported growth rate values for N. gaditana are outlined (Table 2).
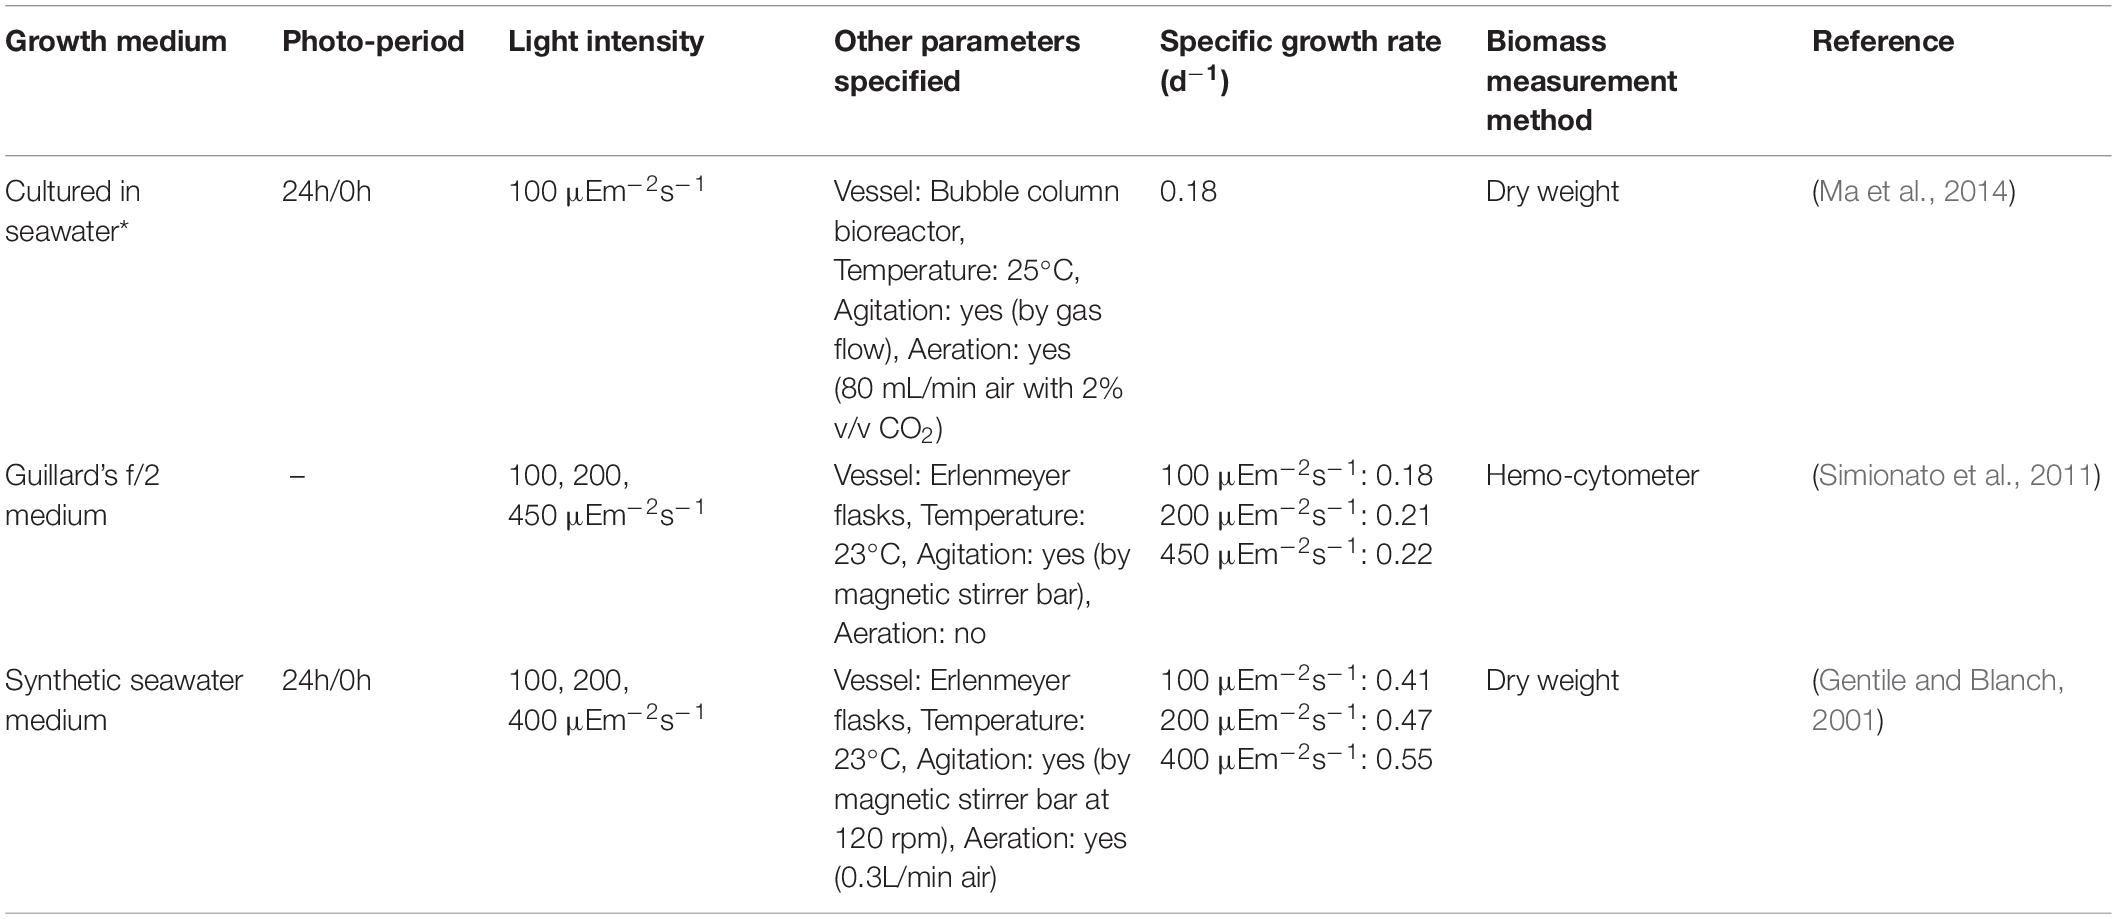
Table 2. Growth rates of N. gaditana observed in literature under various conditions (∗ no other information was given).
Tetraselmis chuii cells are characteristically slightly compressed with an oval shape, and typical cell dimensions range from 10–25 μm in length, 7–20 μm in breadth and 6.5–18 μm in thickness. These cells undergo a minimum of 3 phases in their life-cycle: a flagellate phase, a non-motile vegetative phase in which cells settle, and a third phase in which the cells become aflagellate cysts (Norris et al., 1980; Arora et al., 2013). Adhesion to bioreactor walls and settling by Tetraselmis cells were observed in previous experiments (Grone and Kirst, 1992; Borowitzka, 1999; Fon-Sing and Borowitzka, 2016) where even though shaking caused the cells to dislodge, they would quick re-attach themselves to the walls of the vessel, whether it is made of metal or glass. T. chuii is a popular choice for prawn larvae and oyster feed as a source of amino acids. In particular as T. chuii has a high arginine amino acid content. However, they are deficient in essential PUFAs such as omega-3 FAs such as 20:5ω3 and are usually fed with microalgae that do produce these PUFAs (Borowitzka, 1997; Brown et al., 1997; Pulz and Gross, 2004; Enzing et al., 2014). Reported growth rate values for T. chuii are outlined (Table 3).
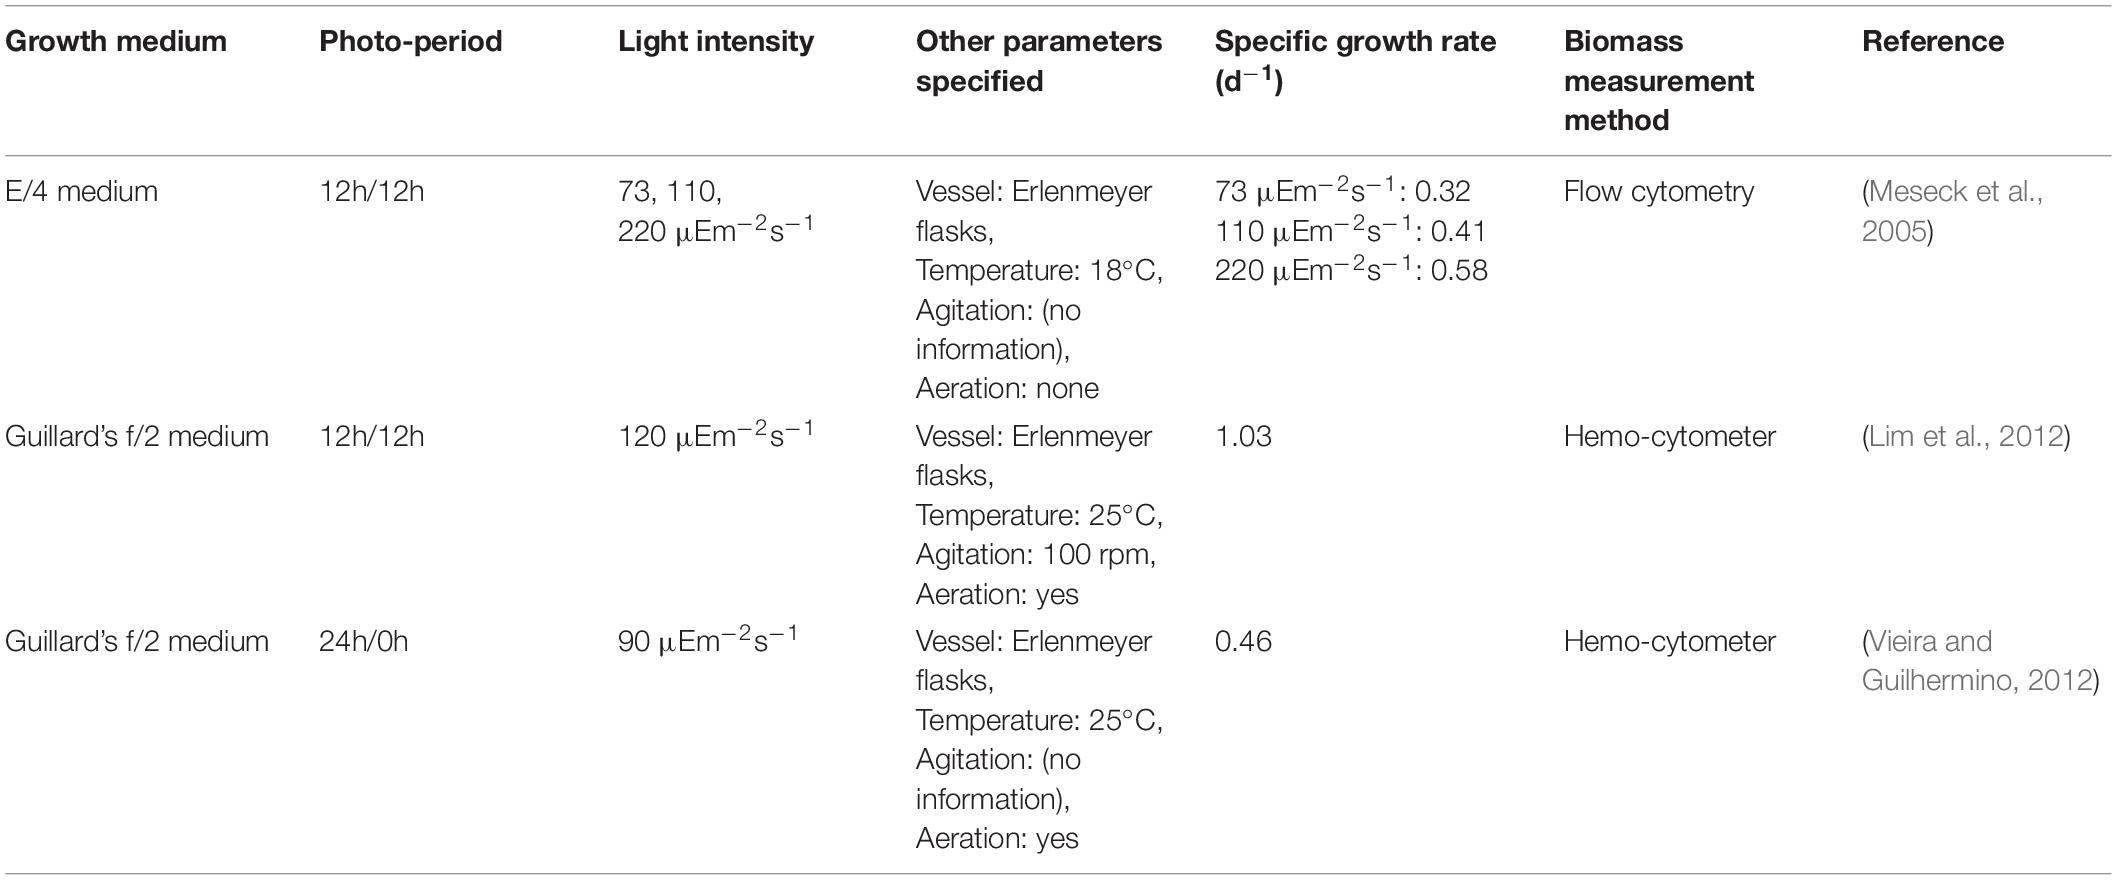
Table 3. Growth rates of T. chuii observed in literature under various conditions.
Biokinetic modeling is a powerful tool used to evaluate different bioreactor operation scenarios, to determine their effects on the system, and ultimately to optimize for a given metabolic objective (Muñoz-Tamayo et al., 2014). Process models often map growth equations to observed empirical data from measurable process variables in order to estimate the growth of microalgae. Two key parameters in biokinetic models of substrate-dependent biomass growth (Eq. 1) (Monod, 1949) are the maximum specific growth rate (μmax) and the limiting substrate half-saturation constant (KS). These parameters need to be estimated for modeling and optimization.
Although prior research has investigated the growth rates of both N. gaditana and T. chuii under various growth conditions, few have determined the long-term stability of these microalgae growth rates. Particularly, in the case of T. chuii, there is high variability in values reported in the literature. We used sequential batch experiments to determine these key growth parameters with high accuracy.
Materials and Methods
Bench-Scale Bioreactor Setup
Nannochloropsis gaditana and T. chuii were grown as pure cultures in two separate photobioreactors (PBRs) operated in a Sequential Batch Reactor (SBR) mode. SBR operating mode allows for a separation between hydraulic and biomass retention times in the system. The semi-batch operation of SBR allows for intervals of high nutrient concentrations at the start of each cycle that leads to maximum rates of microalgae growth. Alternative continuous chemostat operation modes would require high dilution rates, nearing biomass washout, in order to reach maximum growth rates. Also, continuous steady state cannot be reached due to the intermittent light and dark periods in the PBRs.
The PBRs are cylindrical and made of bacteriological grade clear glass (Vessel 200 Series, Electrolab) with a capacity of 2 L working volume. The light source was provided by 3 warm white lightbulbs delivering a total average light intensity of 395 μmol/m⋅s. The working volume in all experiments was 1.5 L. Aeration was provided via compressed air at a rate of 1 L/min. Temperature was maintained at 24.3°C using a cooling loop controlled by a control tower (FERMAC 360, Electrolab). The pH was allowed to naturally fluctuate; values ranged between 8.1 at the end of the dark period and 10.2 by the end of the light period. Both microalgae species are able to grow in this pH range (Khatoon et al., 2014). Additional details regarding PBR operation, growth medium preparation, and sampling can be found in the Supplementary Material.
Volatile Suspended Solids (VSS)
The mass quantity of volatile solids as a measurement of biomass was determined from a given volume of microalgae culture. Solids analysis was conducted using a modification of the standard method 2540D and 2540E (APHA/AWWA/WEF, 2012). Glass-fiber filters [WhatmanTM GF/F filters (Ø 47 mm, pore size: 0.7 μm)] were placed in a Buchner filtration system connected to a vacuum pump (KNK Minilab Pump N816 3KN) and washed with three times with 20 mL of de-ionized water. Vacuum was applied to remove excess water. Filters containing the filtered biomass were placed on an aluminum weighing dish and dried at 105°C until constant weight, and then cooled in a desiccator after which the mass is measured. The filters were then ignited in a furnace at 550°C until constant weight, and then cooled in a desiccator after which the mass is again measured. Volatile suspended solids (VSS) were determined as the difference between the mass after drying in the oven and mass after ignition in the furnace. Fixed suspended solids (FSS) were determined as the difference between the dry mass of the filter after ignition and the dry mass of the prepared filter. Determination of VSS and FSS were performed in triplicate from sample aliquots taken from the PBRs.
Spectroscopic Growth Measurements
A 1 mL sample aliquot of culture was measured using a UV-Vis Spectrophotometer to determine growth rates (GENESYSTM 10S, Thermo Fisher Scientific, United States). The OD550 was used for linear calibration with VSS as this absorbance corresponds to cellular biomass and thus was used as an alternative method for rapid biomass quantification. Linear calibrations between OD and VSS are presented in the Supplementary Materials section.
Ion Chromatography
Growth medium ion concentrations were measured using a Dionex ICS-5000 (Thermo Fisher Scientific, United States) ion-exchange chromatography system equipped with IonPac CS16 and IonPac AS17-C columns. High concentrations of chloride ions are known to interfere with ion chromatographic systems, overloading the detectors. This overload causes peak distortions and poor component separation (Wahab et al., 2014). One solution to this problem is to dilute samples to mitigate concentration overload. A dilution factor of 10 was applied to all samples in order to obtain clear peak separations. This method, however, raises the detection limit of nitrate to 5.7 ppm (at “true” concentration, i.e., undiluted).
Calculations of Rates
The maximum growth rates were calculated from tabulated data using the exponential growth equation (Eq. 2) (Lim et al., 2012).
Where X represents biomass concentration calculated by VSS or VSS analysis from OD550 measurements and t represents the time in days since the start of each batch. The maximum growth rate was determined from the two consecutive readings that yielded the maximum slope on the VSS-time plot. Confidence intervals were calculated for VSS measurements from their triplicate measurements assuming normal population distributions of the means. Uncertainties in the calculations of the maximum specific growth rates and specific uptake rates were propagated forward from the uncertainties in measurements of VSS across each batch cycle.
Results and Discussion
Growth Rates of N. gaditana
Nannochloropsis gaditana was subjected to consecutive growth cycles in f/2 medium in a SBR with periodic VSS analysis and measurements of OD550. These data are presented in Figure 1. These two methods of biomass quantification (OD550 and VSS) were used to calculate the maximum growth rate of each batch cycle and presented in Figure 2. The initial nitrate concentrations are also shown in order to determine cycles with comparable nutrient content.
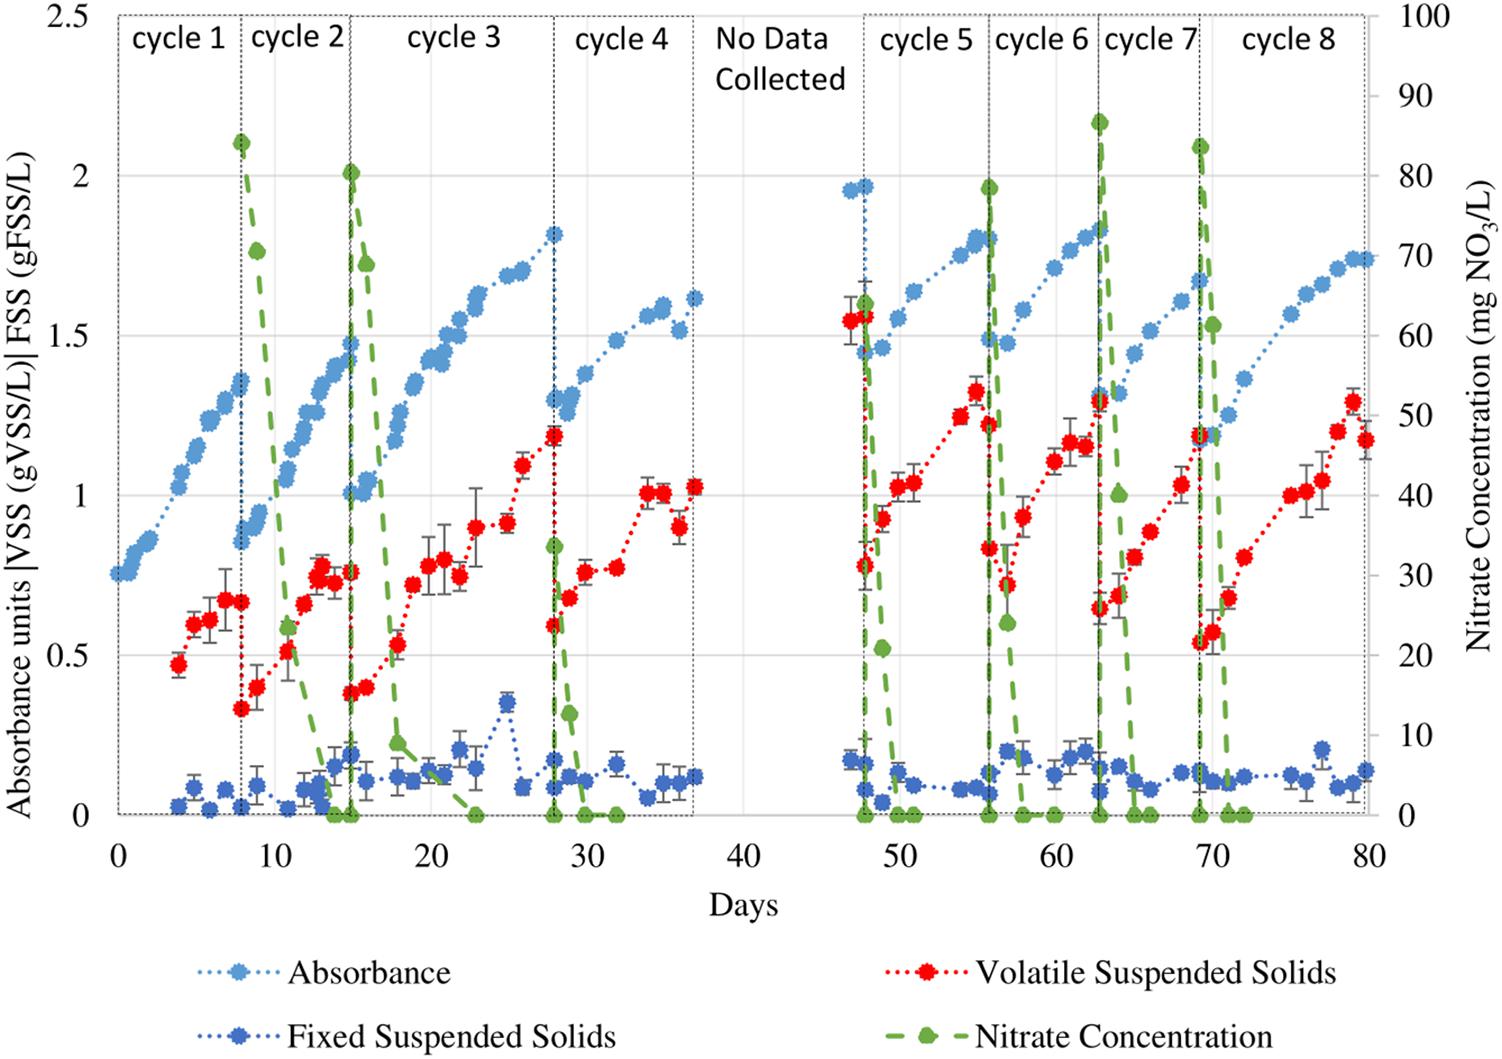
Figure 1. VSS, FSS, and OD550 readings of N. gaditana under 12h/12h light/dark sequential batch cycles. During the period when data collection was not possible the PBR operation was maintained. Error bars indicate the 95% confidence interval of the solids analyses measurements (obtained from triplicate readings).
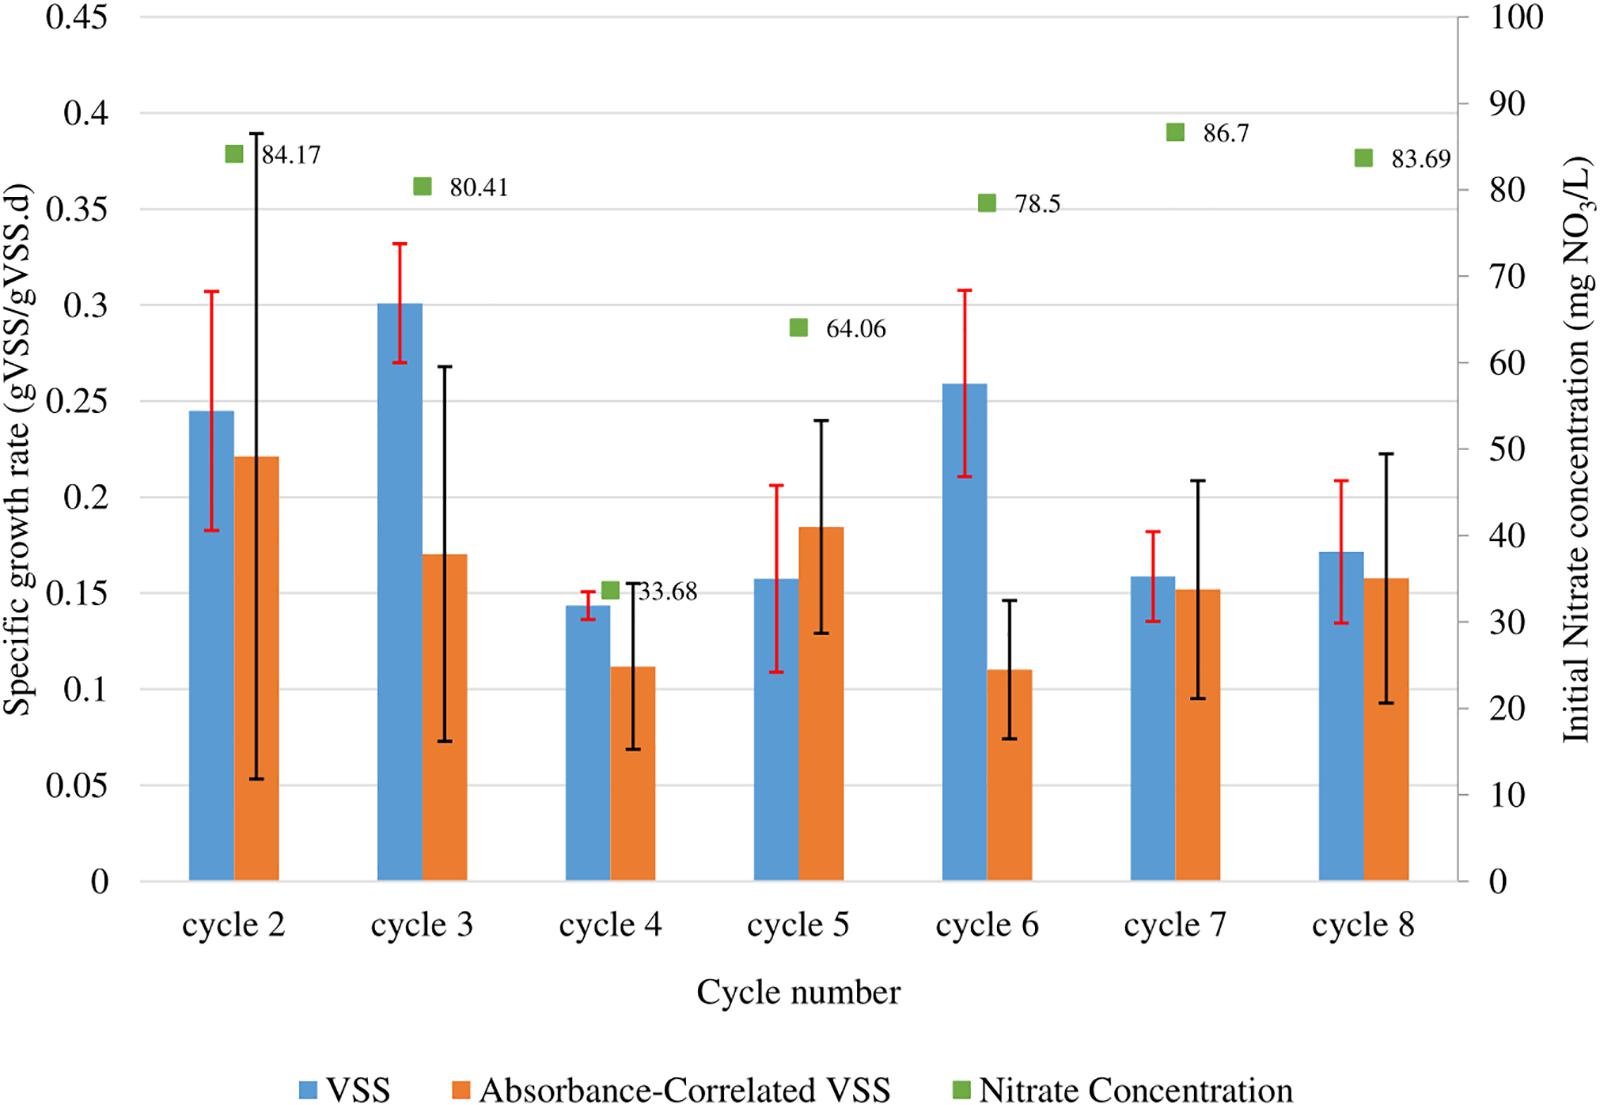
Figure 2. Observed maximum growth rates of N. gaditana calculated from fitted growth curves for each batch cycle run. These growth rates were calculated from the change of mass (gVSS/L) (blue), as well as by absorbance using the correlations obtained for OD550 (orange). Red and black error bars correspond to the 95% confidence interval of the calculation for the VSS and absorbance correlated VSS biomass quantification methods respectively. The starting NO3 concentrations for each batch are also shown above each bar (green).
The growth curves presented in Figure 1 were used to determine the maximum growth rates during each cycle using the batch growth rate equation. Data for cycle 1 was not presented because growth was not tracked throughout the cycle. The data from cycles 2, 3, 6, 7, and 8 were used to calculate the average maximum growth rates because of similar nitrate concentrations (ranging from 78.5–84.2 mg NO3/L). The average maximum calculated using VSS was 0.23 ± 0.04 gVSS/gVSS⋅d while using the VSS-OD550 correlation was 0.16 ± 0.08 gVSS/gVSS⋅d.
The data presented using the two measurement methods (within their confidence intervals) agree with one another in the range 0.19–0.26 gVSS/gVSS⋅d, though the correlation has a wider confidence interval (0.08 vs. 0.04 gVSS/gVSS⋅d) due to the propagation of uncertainty in the VSS measurements as well as that in the regression analysis itself. Previous studies have also reported similar maximum growth rates (0.18–0.22 d–1) under similar conditions (Gentile and Blanch, 2001; Simionato et al., 2011; Ma et al., 2014) (refer to Table 2).
Growth Rates of T. chuii
Tetraselmis chuii was subjected to consecutive growth cycles in a SBR operation in f/2 medium with periodic VSS analysis and measurements of OD550 as described above. These data are presented in Figure 3. Note that the two PBRs were not started at the same time. The trends shown by the direct mass-based measurement do not always reflect in the trends in absorbance (particularly in cycles 1 and 4) unlike those in N. gaditana. The maximum growth rates calculated by both methods are displayed in Figure 4.
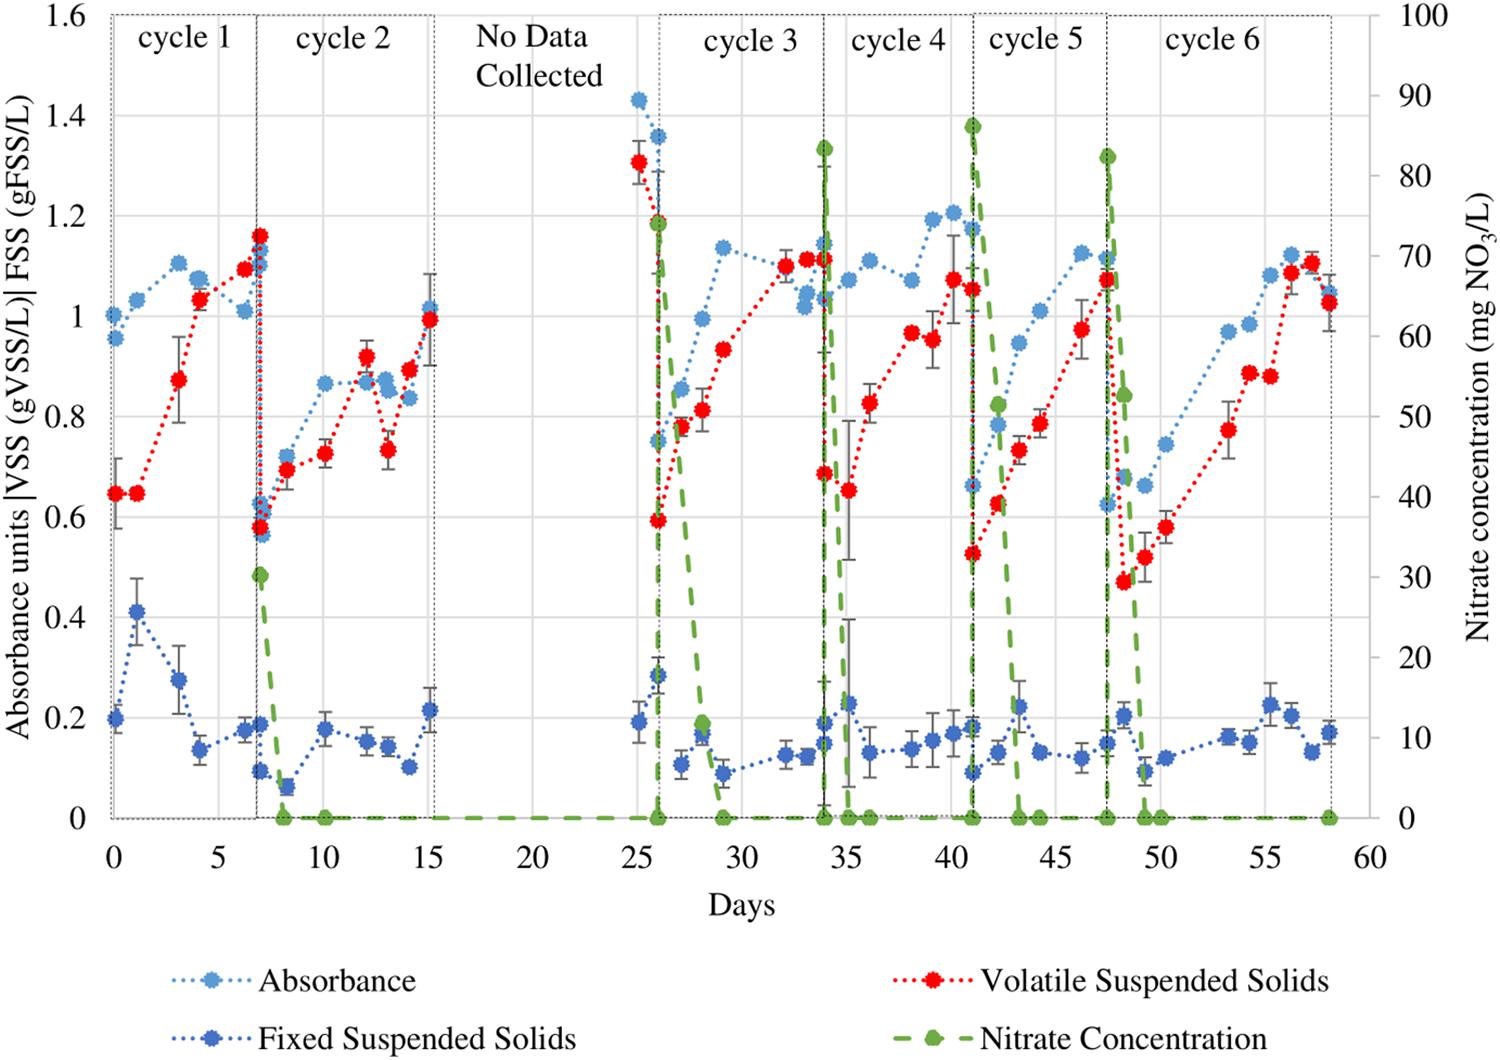
Figure 3. VSS, FSS, and OD550 readings of T. chuii culture under eight 12h/12h light/dark sequential batch cycles. During the period when data collection was not possible the PBR operation was maintained. Error bars indicate the 95% confidence interval of the solids analyses measurements (obtained from triplicate readings).
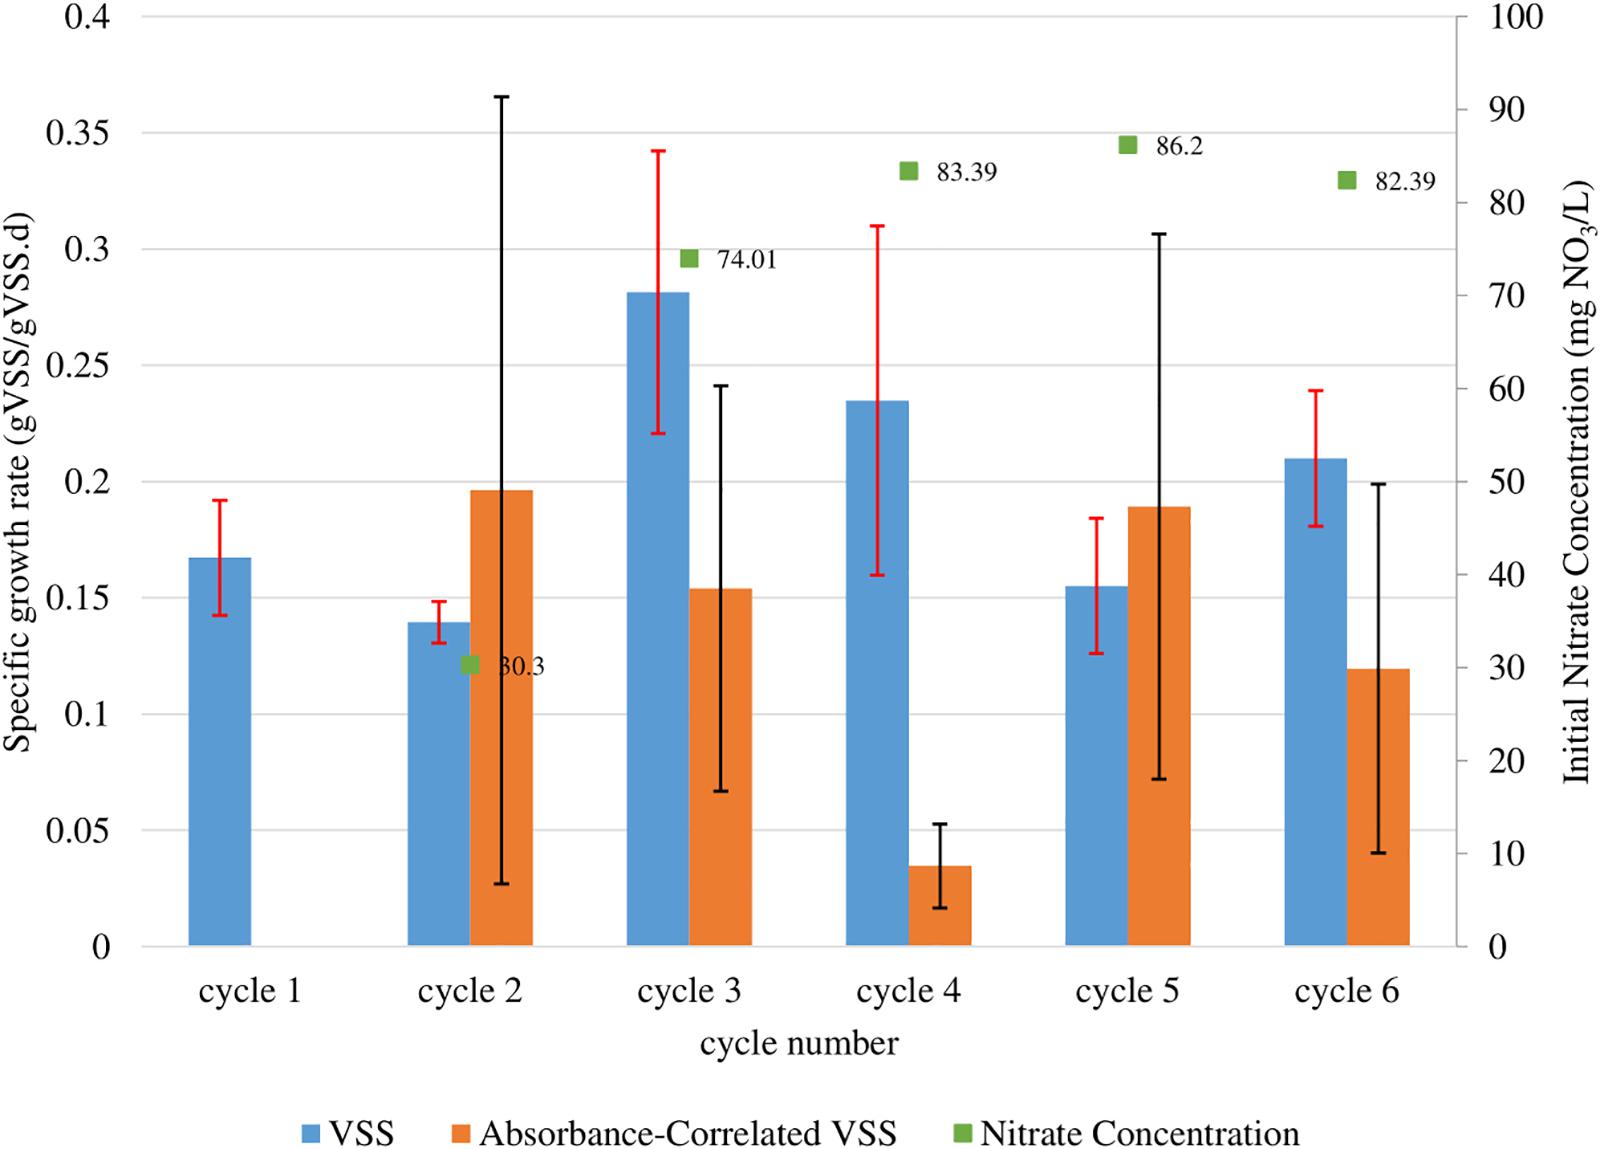
Figure 4. Observed maximum growth rates of T. chuii calculated from fitted growth curves for each batch cycle run. These growth rates were calculated from the change of mass (gVSS/L) (blue), as well as by absorbance using the correlations obtained for OD550 (orange). Red and black error bars correspond to the 95% confidence interval of the calculation for the VSS and absorbance correlated VSS biomass quantification methods respectively. The starting NO3 concentrations for each batch are also shown above each bar (green).
The T. chuii growth curves presented in Figure 3 were used to determine the maximum growth rates during each growth cycle using the batch growth rate equation. The initial nitrate concentrations are also shown in order to determine cycles with comparable nutrient content. Data for cycle 1 was not presented because growth was not tracked throughout the cycle. The data from cycles 3, 4, 5, and 6 were used to calculate the average maximum growth rates because of similar nitrate concentrations (ranging from 74.0–82.4 mg NO3/L). The average maximum calculated using VSS was 0.22 ± 0.05 gVSS/gVSS⋅d while using the VSS-OD550 correlation was 0.12 ± 0.08 gVSS/gVSS⋅d.
The values presented using the two measurement methods (within their confidence intervals) agree with one another in the range 0.17–0.20 gVSS/gVSS⋅d. These values are different from values reported in previous works (ranging from 0.32–1.03 d–1) (Meseck et al., 2005; Lim et al., 2012; Vieira and Guilhermino, 2012) (refer to Table 3). However, the differences in the values observed in literature and the differences in the average maximum calculated by the two methods suggests an issue in sampling of T. chuii in a homogenous manner. T. chuii cells become non-motile and form aggregates in the late stage of their life cycle (Grone and Kirst, 1992; Borowitzka, 1999; Fon-Sing and Borowitzka, 2016). At this stage, cells adhere to the walls of containers and settle out from solution rapidly.
Nitrate Uptake in N. gaditana and T. chuii
Three additional sets of batch growth cycles were conducted for the two algal cultures. We performed a higher sampling frequency for nitrate content in the culture broth to determine the relationship between the nitrate concentration and growth rate. The culture medium had been designed such that the nitrate would be the sole limiting nutrient. All other PBR operation procedures remained the same as for the previous sequential batch culture cycles. Figures 5, 6 show the growth curves for N. gaditana and T. chuii respectively. Table 4 highlights the rates of growth, nitrate uptake, as well as the times in each cycle at which nitrate was depleted and when the maximum growth rate was observed.
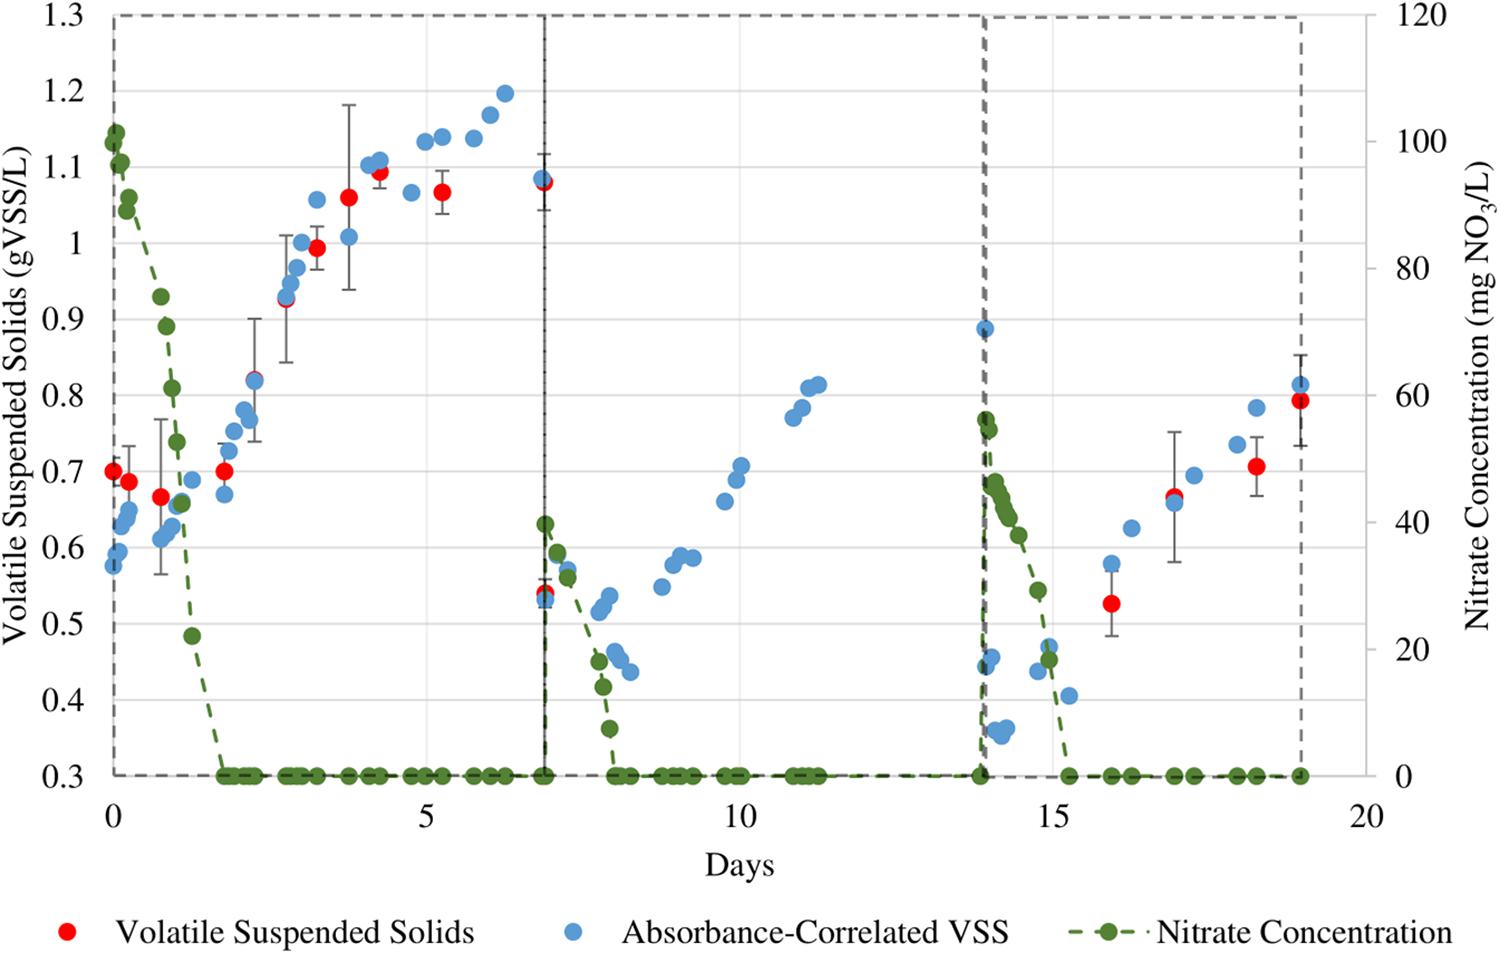
Figure 5. Sequential growth batches of N. gaditana in which nitrate levels were more closely monitored. The initial NO3 concentrations for the three cycles are 100, 40, and 56 mg/L respectively.
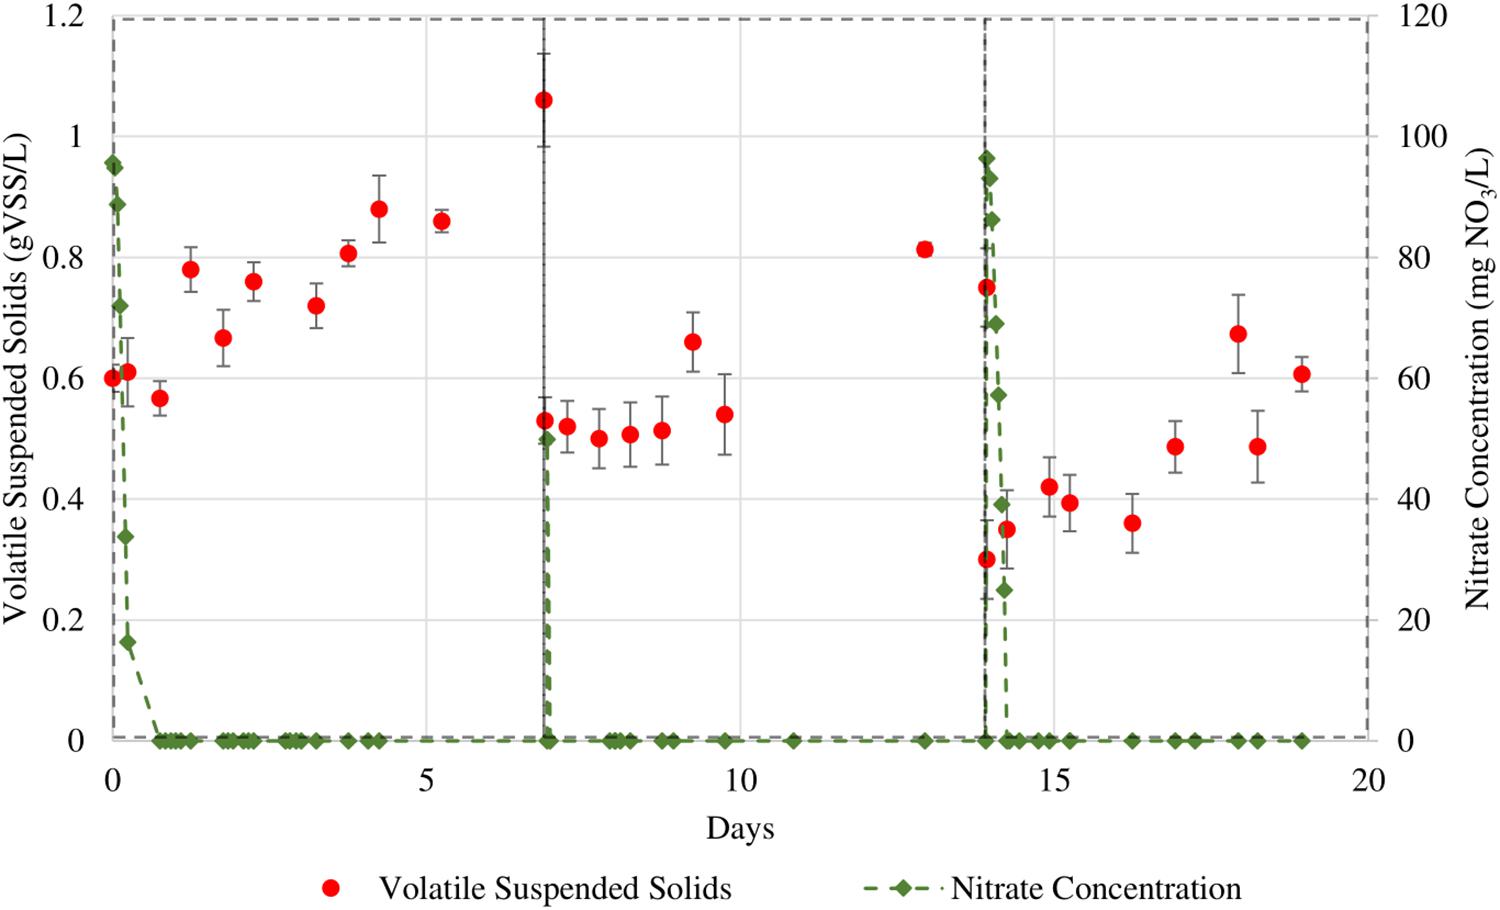
Figure 6. Sequential batches of T. chuii in which nitrate levels were more closely monitored. The initial NO3 concentrations for the 3 cycles are 95, 50, and 96 mg/L respectively.
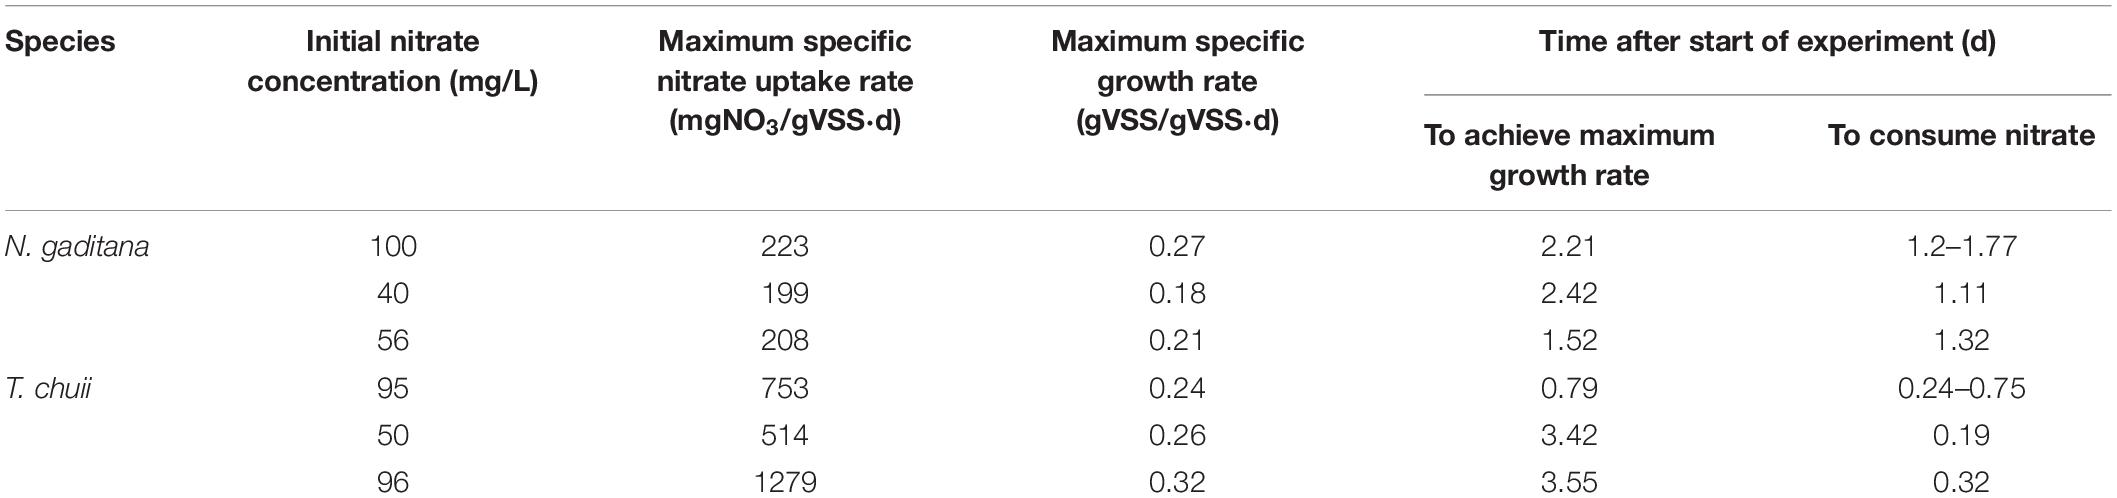
Table 4. Summary of results obtained from the nitrate uptake experiments by N. gaditana and T. chuii.
The maximum specific nitrate uptake rate of N. gaditana is 210 ± 11.2 mg NO3/gVSS⋅d. The maximum specific nitrate uptake rate of T. chuii, however, exhibits larger variance with a calculated average of 849 ± 361 mg NO3/gVSS⋅d.
For both species studied, the growth of the biomass continued for the rest of the cycle even after dissolved nitrate was consumed. The observed separation between a fast nitrate uptake event and the start of biomass growth in this study could be evidence for intracellular storage of nitrogen in microalgal cells. As the cultures are not being continuously supplied nitrate due to the nature of sequential batch culture operation, this behavior can be seen as a type of survival adaptation by these microalgae. Adaptations such as these can be linked as a survival response to the intermittent availability of nutrients in marine ecosystems, thus causing certain microalgae to be able to uptake nitrate beyond their daily requirements of assimilation in anticipation of upcoming nitrate depleted periods (Dortch, 1982).
Indeed, evidence for the accumulation of intracellular inorganic nitrogen pools has been observed for both marine and freshwater microalgae acclimated to batch cultures, showing that microalgae are capable of “luxury uptake” in the presence of excess amounts of nitrogen or phosphate, using these reserves to sustain growth when no external supply of nutrient is available (Lavín and Lourenço, 2005; Khalid et al., 2019). Luxury uptake has been observed before in studies of microalgae by Droop (1973, 1983) and Lange and Oyarzun (1992), and Laws et al. (2013) for nutrients such as phosphate and vitamin B12. The Droop kinetic model (Eq. 3) accounts for this luxury uptake behavior by defining the notion of an intracellular pool of nutrients and a “quota” (q) for each nutrient as well as a “minimum subsistence quota” (q0) which is the minimum nutrient concentration required for maintenance.
Conclusion
We used both spectroscopic and mass based measurement methods to gain a better understanding of the observable growth rates of microalgae, as the direct and indirect measurement methods do not completely agree with one another at all times.
Regarding the relationship between nitrate and growth in sequential batch cultures, it was observed that the individual growths of N. gaditana and T. chuii were decoupled from nitrate uptake, indicating non-Monod kinetics of growth and luxury uptake. In such cases, we recommend that the Droop kinetics (Eq. 3) be used as it assumes the growth of microalgae is based on the concentrations of intracellular nitrogen pools rather than the extracellular dissolved nitrogen in the medium. These results are of particular relevance when modeling microalgae growth that are subjected to sequential batch cultures, oscillating between periods of nutrient excess and deficit.
Data Availability Statement
The datasets generated for this study are available on request to the corresponding author.
Author Contributions
RR conducted the experiments, gathered and analyzed the data and wrote the first draft of the manuscript. JU provided experimental support, contributed to the data interpretation and gathering and revised the manuscript. HH analyzed the data, contributed experimental advice and revised the manuscript. JR designed the work, analyzed the data and revised the final manuscript. All authors contributed to the manuscript revision, read and approved the submitted version.
Funding
This publication is based upon work supported by Khalifa University’s student research support funds and by the Sustainable Bioenergy Research Consortium under the Award No. 8434000305/EX2019-003.
Conflict of Interest
The authors declare that the research was conducted in the absence of any commercial or financial relationships that could be construed as a potential conflict of interest.
Supplementary Material
The Supplementary Material for this article can be found online at: https://www.frontiersin.org/articles/10.3389/fmars.2020.00077/full#supplementary-material
References
APHA/AWWA/WEF, (2012). Standard Methods for the Examination of Water and Wastewater, Standard Methods. Washington, D.C: APHA-AWWA-WEF.
Arora, M., Anil, A. C., Leliaert, F., Delany, J., and Mesbahi, E. (2013). Tetraselmis indica (Chlorodendrophyceae, Chlorophyta), a new species isolated from salt pans in Goa, India. Eur. J. Phycol. 48, 61–78. doi: 10.1080/09670262.2013.768357
Becker, E. W. (2007). Micro-algae as a source of protein. Biotechnol. Adv. 25, 207–210. doi: 10.1016/j.biotechadv.2006.11.002
Benito, V., Goñi-de-Cerio, F., and Brettes, P. (2015). BODIPY vital staining as a tool for flow cytometric monitoring of intracellular lipid accumulation in Nannochloropsis gaditana. J. Appl. Phycol. 27, 233–241. doi: 10.1007/s10811-014-0310-x
Borowitzka, M. A. (1997). Microalgae for aquaculture: opportunities and constraints. J. Appl. Phycol. 9, 393–401. doi: 10.1023/A:1007921728300
Borowitzka, M. A. (1999). Part 1: Algae Culture, in Production of Microalgal Concentrates. Murdoch, W. A: Murdoch University and Fisheries Research and Development Corporation, 23.
Brown, M. R. (1991). The amino-acid and sugar composition of 16 species of microalgae used in mariculture. J. Exp. Mar. Biol. Ecol. 145, 79–99. doi: 10.1016/0022-0981(91)90007-J
Brown, J. J., Das, P., and Al-saidi, M. (2018). Sustainable agriculture in the arabian / persian gulf region utilizing marginal water resources: making the best of a bad situation. Sustainability 10:1364. doi: 10.3390/su10051364
Brown, M. R., Jeffrey, S. W., Volkman, J. K., and Dunstan, J. K. (1997). Nutritional properties of microalgae for mariculture. Aquaculture 151, 315–331. doi: 10.1016/S0044-8486(96)01501-1503
Dortch, Q. (1982). Effect of growth conditions on accumulation of internal nitrate, ammonium, amino acids, and protein in three marine diatoms. J. Exp. Mar. Biol. Ecol. 61, 243–264. doi: 10.1016/0022-0981(82)90072-7
Droop, M. R. (1973). Some thoughts on nutrient limitation in algae. J. Phycol. 9, 264–272. doi: 10.1111/j.1529-8817.1973.tb04092.x
Droop, M. R. (1983). 25 Years of algal growth kinetics: a personal view. Botan. Mar. 26, 99–112. doi: 10.1515/botm.1983.26.3.99
Enzing, C., Ploeg, M., Barbosa, M. J., and Sijtsma, L. (2014). Microalgae-Based Products for the Food and Feed Sector: An Outlook for Europe. JRC Scientific and Policy Report No. JRC 85709. Luxembourg: Publications Office of the European Union.
Fabregas, J., Maseda, A., Dominguez, A., and Ferreira, M. (2002). Changes in the cell composition of the marine microalga, Nannochloropsis gaditana, during a light:dark cycle. Biotechnol. Lett. 24, 1699–1703. doi: 10.1023/A:1020661719272
Fernandes, T., Fernandes, I., Andrade, C. A. P., and Cordeiro, N. (2016). Marine microalgae growth and carbon partitioning as a function of nutrient availability. Bioresour. Technol. 214, 541–547. doi: 10.1016/j.biortech.2016.05.001
Fon-Sing, S., and Borowitzka, M. A. (2016). Isolation and screening of euryhaline Tetraselmis spp. suitable for large-scale outdoor culture in hypersaline media for biofuels. J. Appl. Phycol. 28, 1–14. doi: 10.1007/s10811-015-0560-562
Gentile, M. P., and Blanch, H. W. (2001). Physiology and xanthophyll cycle activity of Nannochloropsis gaditana. Biotechnol. Bioeng. 75, 1–12. doi: 10.1002/bit.1158
Grone, T., and Kirst, G. O. (1992). The effect of nitrogen deficiency, methionine and inhibitors of methionine metabolism on the DMSP contents of Tetraselmis subcordiformis (Stein). Mar. Biol. 112, 497–503. doi: 10.1007/bf00356296
Gouveia, L., Batista, A. P., Sousa, I., Raymundo, A., and Bandarra, N. M. (2008). “Microalgae in novel food product,” in Food Chemistry Research Developments, eds N. Konstantinos and P. P. Papadopoulos (New York, NY: Nova Science Publishers).
Khalid, A. A. H., Yaakob, Z., Abdullah, S. R. S., and Takriff, M. S. (2019). Analysis of the elemental composition and uptake mechanism of Chlorella sorokiniana for nutrient removal in agricultural wastewater under optimized response surface methodology (RSM) conditions. J. Clean. Product. 210, 673–686. doi: 10.1016/j.jclepro.2018.11.095
Khatoon, H., Rahman, N. A., Banerjee, S., and Harun, N. (2014). Effects of different salinities and pH on the growth and proximate composition of Nannochloropsis sp. and Tetraselmis sp. isolated from South China Sea cultured under control and natural condition. Int. Biodeterior. Biodegradation 95, 11–18. doi: 10.1016/j.ibiod.2014.06.022
Lange, K., and Oyarzun, F. J. (1992). The attractiveness of the droop equations. Math. Biosci. 111, 261–278. doi: 10.1016/0025-5564(92)90074-90077
Lavín, P. L., and Lourenço, S. O. (2005). An evaluation of the accumulation of intracellular inorganic nitrogen pools by marine microalgae in batch cultures. Braz. J. Oceanogr. 53, 55–68. doi: 10.1590/s1679-87592005000100006
Laws, E. A., Pei, S., and Bienfang, P. (2013). Phosphate-limited growth of the marine diatom thalassiosira weissflogii (Bacillariophyceae): evidence of non-monod growth kinetics. J. Phycol. 49, 241–247. doi: 10.1111/jpy.12047
Lim, D. K. Y., Garg, S., Timmins, M., Zhang, E. S., Thomas-Hall, S. R., Schuhmann, H., et al. (2012). Isolation and evaluation of oil-producing microalgae from subtropical coastal and Brackish waters. PLoS One 7:e40751. doi: 10.1371/journal.pone.0040751
Lubián, L. (1982). Nannochloropsis gaditana sp. nov., una nueva eustigmatophyceae marina. Lazaroa 293, 287–294. doi: 10.5209/LAZAROA.12040
Luo, T., Young, R., and Reig, P. (2015). Aqueduct Projected Water Stress Country Rankings, World Resources Institute. Available at: www.wri.org/publication/aqueduct-projected-water-stress-country-rankings (accessed October 18, 2019).
Ma, X. N., Wang, Z., Yu, C., Yin, Y., and Zhou, G. (2016). Lipid production from Nannochloropsis. Mar. Drug. 14, E61. doi: 10.3390/md14040061
Ma, Y., Wang, Z., Yu, C., Yin, Y., and Zhou, G. (2014). Evaluation of the potential of 9 Nannochloropsis strains for biodiesel production. Bioresour. Technol. 167, 503–509. doi: 10.1016/j.biortech.2014.06.047
Meseck, S. L., Alix, J. H., and Wikfors, G. H. (2005). Photoperiod and light intensity effects on growth and utilization of nutrients by the aquaculture feed microalga, Tetraselmis chui (LY429). Aquaculture 246, 393–404. doi: 10.1016/j.aquaculture.2005.02.034
Monod, J. (1949). The growth of bacterial cultures. Ann. Rev. Microbiol. 3, 371–394. doi: 10.1146/annurev.mi.03.100149.002103
Muñoz-Tamayo, R., Pierre, M., Gaël, B., Francis, M., and Olivier, B. (2014). Getting the most out of it: optimal experiments for parameter estimation of microalgae growth models. J. Proc. Cont. 24, 991–1001. doi: 10.1016/j.jprocont.2014.04.021
Norris, R. E., Hori, T., and Chihara, M. (1980). Revision of the genus Tetraselmis (Class Prasinophyceae). Botan. Magaz. Tokyo 93, 317–339. doi: 10.1007/BF02488737
Pulz, O., and Gross, W. (2004). Valuable products from biotechnology of microalgae. Appl. Microbiol. Biotechnol. 65, 635–648. doi: 10.1007/s00253-004-1647-x
Riveros, K., Claudia, S., Jazmín, B., Paola, M., Carlos, R., Gabriel, A., et al. (2018). Overall development of a bioprocess for the outdoor production of Nannochloropsis gaditana for aquaculture. Aquacul. Res. 49, 165–176. doi: 10.1111/are.13445
Rocha, J. M. S., Garcia, J. E. C., and Henriques, M. H. F. (2003). Growth aspects of the marine microalga Nannochloropsis gaditana. Biomol. Eng. 20, 237–242. doi: 10.1016/S1389-0344(03)00061-63
Simionato, D., Sforza, E., Corteggiani Carpinelli, E., Bertucco, A., Giacometti, G. M., Morosinotto, T., et al. (2011). Acclimation of Nannochloropsis gaditana to different illumination regimes: effects on lipids accumulation. Bioresour. Technol. 102, 6026–6032. doi: 10.1016/j.biortech.2011.02.100
Vanthoor-Koopmans, M., Wijffels, R. H., Barbosa, M. J., and Eppink, M. H. (2013). Biorefinery of microalgae for food and fuel. Bioresour. Technol. 135, 142–149. doi: 10.1016/j.biortech.2012.10.135
Vieira, L. R., and Guilhermino, L. (2012). Multiple stress effects on marine planktonic organisms: influence of temperature on the toxicity of polycyclic aromatic hydrocarbons to Tetraselmis chuii. J. Sea Res. 72, 94–98. doi: 10.1016/j.seares.2012.02.004
Wahab, M. F., Anderson, J. K., Abdelrady, M., and Lucy, C. A. (2014). Peak distortion effects in analytical ion chromatography. Anal. Chem. 86, 559–566. doi: 10.1021/ac402624a
Wijffels, R. H., Barbosa, M. J., and Eppink, M. H. M. (2010). Microalgae for the production of bulk chemicals and biofuels. Biof., Bioprod. Bioref. 4, 287–295. doi: 10.1002/bbb.215
Keywords: Nannochloropsis, Tetraselmis, marine microalgae, sequential batch reactor, growth rate, nitrate uptake
Citation: Rafay R, Uratani JM, Hernandez HH and Rodríguez J (2020) Growth and Nitrate Uptake in Nannochloropsis gaditana and Tetraselmis chuii Cultures Grown in Sequential Batch Reactors. Front. Mar. Sci. 7:77. doi: 10.3389/fmars.2020.00077
Received: 14 October 2019; Accepted: 31 January 2020;
Published: 19 February 2020.
Edited by:
Weiqi Fu, New York University Abu Dhabi, United Arab EmiratesReviewed by:
Zhi-Gang Zhou, Shanghai Ocean University, ChinaHongli Cui, Shanxi Agricultural University, China
Copyright © 2020 Rafay, Uratani, Hernandez and Rodríguez. This is an open-access article distributed under the terms of the Creative Commons Attribution License (CC BY). The use, distribution or reproduction in other forums is permitted, provided the original author(s) and the copyright owner(s) are credited and that the original publication in this journal is cited, in accordance with accepted academic practice. No use, distribution or reproduction is permitted which does not comply with these terms.
*Correspondence: Jorge Rodríguez, am9yZ2Uucm9kcmlndWV6QGt1LmFjLmFl