 Lijuan Wang
 Zhihao Wu
 Yingjun Wang
 Mengxia Liu3
 Feng You
- 1Key Laboratory of Experimental Marine Biology, Center for Ocean Mega-Science, Institute of Oceanology, Chinese Academy of Sciences, Qingdao, China
- 2Laboratory for Marine Biology and Biotechnology, Pilot National Laboratory for Marine Science and Technology (Qingdao), Qingdao, China
- 3Marine Biology Institute of Shandong Province, Qingdao, China
The black rockfish Sebastes schlegelii is a commercially important fish species for marine fishery stock enhancement in Asia. This work aimed to evaluate the potential genetic impacts of releasing hatchery-reared juvenile black rockfish on wild stock in Lidao Bay, China. A partial sequence of the mitochondrial DNA (mtDNA) control region and 38 microsatellite DNA loci were used to assess the genetic impact. The haplotype diversity parameter (h) and nucleotide diversity parameter (π) in hatchery-released stock were 0.902 and 0.00483, respectively. The h values in wild stock before stock enhancement and the mixed stock after enhancement were 0.970 and 0.939 (p = 0.025), respectively, and the π values were 0.00581 and 0.00526 (p = 0.150), respectively. The mean effective number of alleles (Ae) in hatchery-released stock was 4.76, the mean polymorphism information content (PIC) was 0.674, the observed heterozygosity (Ho) was 0.668, and the expected heterozygosity (He) was 0.697. In wild stock before stock enhancement and the mixed stock after enhancement, the Ae, PIC, Ho, and He values were 6.01 and 5.82, 0.698 and 0.716, 0.709 and 0.741, and 0.735 and 0.754, respectively. These results indicated no marked decrease in the hatchery-released stock, although it displayed slightly lower levels of genetic diversity and heterozygosity than the wild stock. And the mixed stock after release exhibited similar genetic diversity to that of the wild stock before release. Accordingly, we propose that stock enhancement may not cause genetic diversity reduction on wild S. schlegelii stock in Lidao Bay over the short term. Whereas, discriminant analysis of principal components (DAPC) analysis identified three major clusters. The fixation index (FST) and analysis of molecular variance (AMOVA) also clearly showed low level but significant differentiations between the hatchery-released and wild stocks, and the wild stock before enhancement and the mixed stock after enhancement. Consequently, long-term genetic evaluation might be required.
Introduction
Over the past few decades, many natural systems have been negatively affected by anthropogenic stresses, such as overfishing and habitat degradation, and as a result, capture fisheries can no longer meet the demand for seafood (Garibaldi, 2012). Therefore, hatchery-reared organisms are often released into the wild to increase abundance and fishery yields (Leber, 2013). These restoration practices are applied for three main purposes: restocking, stock enhancement, and sea ranching (Bell et al., 2008). The mass release of juvenile hatchery-produced individuals into the wild has increased sharply in recent years worldwide, and more than 180 species were released in 20 countries from 2011 to 2016 (Kitada, 2018). In China, fisheries enhancements are practiced by both the country and the provinces along the country’s vast acreage of coastal regions, and 94.543 billion marine fish, shrimp, and scallops were released during 2004–2013 (Luo and Zhang, 2014).
Although stock enhancement programs can be demographically beneficial, they also raise numerous questions related to their eventual ecological and genetic impacts on the recipient stock (Kitada, 2018). Compared with the ecological impacts, the genetic impacts of enhanced production on wild populations are more difficult to be assessed, because such effects may not be as apparent as short-term shifts in abundance (Grant et al., 2017). Domesticated strains of a species are usually produced from a small broodstock that harbors only a small portion of the total genetic diversity within a species. Therefore, they often differ genetically from their wild counterparts by showing lower genetic diversity, particularly when they have been systematically selected for multiple generations (Champagnon et al., 2012; Lorenzen et al., 2012). As stock enhancement aims to enhance both intra- and inter-generational stocking (Kitada, 2018), there may be both short-term and long-term genetic effects. The long-term effects are mainly caused by gene flow. Hybridization between hatchery and wild individuals has the potential to reduce fitness and genetic variation and change the genetic composition and population structure of the wild population (Laikre et al., 2010). The negative genetic impacts of stock enhancement have been documented in a wide range of fish species (Laikre et al., 2010), such as red drum (Sciaenops ocellatus), red sea bream (Pagrus major), and steelhead trout (Oncorhynchus mykiss) (Araki et al., 2007; Gold et al., 2008; Hamasaki et al., 2010). Moreover, even stock enhancement that does not result in gene flow can still destroy the gene pool by decreasing the size of the wild population through competition or disease transmission in the short term. In addition, the effective population size (Ne) of the wild population may be reduced due to increasing mortality. The Ne of cultured stocks is typically much lower than that of wild stocks, potentially leading to a depletion of genetic diversity through increased random drift. Consequently, enhancing wild populations with hatchery individuals can reduce the Ne of the entire mixed population (Ryman and Laikre, 1991; Ryman et al., 1995). Thus, evaluation of the genetic variability of released stock and recipient stock in such enchainment activities can yield valuable insights and ensure a responsible stock enhancement program (Romo et al., 2006; Ward, 2006).
Black rockfish (Sebastes schlegelii) is an important commercial fish inhabiting the coasts of China, Japan, and Korea. It has strong site fidelity and limited capacity for movement (Kang and Shin, 2006; Zhang et al., 2015). Therefore, black rockfish is considered to be an ideal candidate fish species for stock enhancement. The catch per unit of effort (CPUE) and individual weight of S. schlegelii have declined since the 1980s (Xu and Jin, 2005), and stock enhancement programs were initiated in these three countries to recover overexploited stocks. In China, enhancement programs for S. schlegelii began in 1995, and this species has gradually become one of the most popular fish species for release. Millions of juveniles are released in the northern coastal region of China every year (Lü et al., 2014). However, scant information on the genetic effects of release is available, barring a few reports on enhancement technology (Nihira and Takashima, 1999), growth and movement (Nakagawa, 2008), rates of return and economic return (Nakagawa et al., 2007; Noda et al., 2012), and release habitat (Chin et al., 2013). Although a few studies have dealt with the genetic diversity and differentiation of different geographical populations (Yoshida et al., 2005; Ding et al., 2014; Zhang et al., 2016), no study has focused on the genetic variability of the released rockfish and recipient stocks. A S. schlegelii stock enhancement activity was implemented in Lidao Bay in 2013. The present study was aimed to examine the genetic variability of the hatchery-released stock, wild stock before stock enhancement and the mixed stock after enhancement of black rockfish in Lidao Bay as well as the divergence among them. The results will provide basic data to ensure a healthy and sustainable restoration grant for S. schlegelii.
Materials and Methods
Sample Collection and DNA Extraction
The black rockfish specimens evaluated in this study comprised a total of 288 fish from three different stocks. The first stock included 96 wild individuals [average total length (TL) = 12.74 ± 5.27 cm] in Lidao Bay sampled using a cage net in May, August, and November, 2013 (before release). The second sample group included 96 individual specimens (average TL = 9.48 ± 1.12 cm) sampled from the approximately 13,000 hatchery-reared S. schlegelii individuals released into Lidao Bay in November 2013. Finally, 96 samples from the mixed stock after release (average TL = 13.52 ± 4.68 cm) were collected in December 2013, and May, August and November 2014. As S. schlegelii has a short-distance seasonal movement, in order to obtain more representative samples, fishes before and after release were collected in different seasons. The sampling locations (122°34′30″–122°36′00″E, 37°14′00″–37°16′00″N) are shown in Figure 1. This study followed the guidelines for the experimental use of animals of the Institute of Oceanology, Chinese Academy of Sciences. The study was approved by the ethics committee of Institute of Oceanology, Chinese Academy of Sciences. All applicable international, national, and/or institutional guidelines for the care and use of animals were followed by the authors.
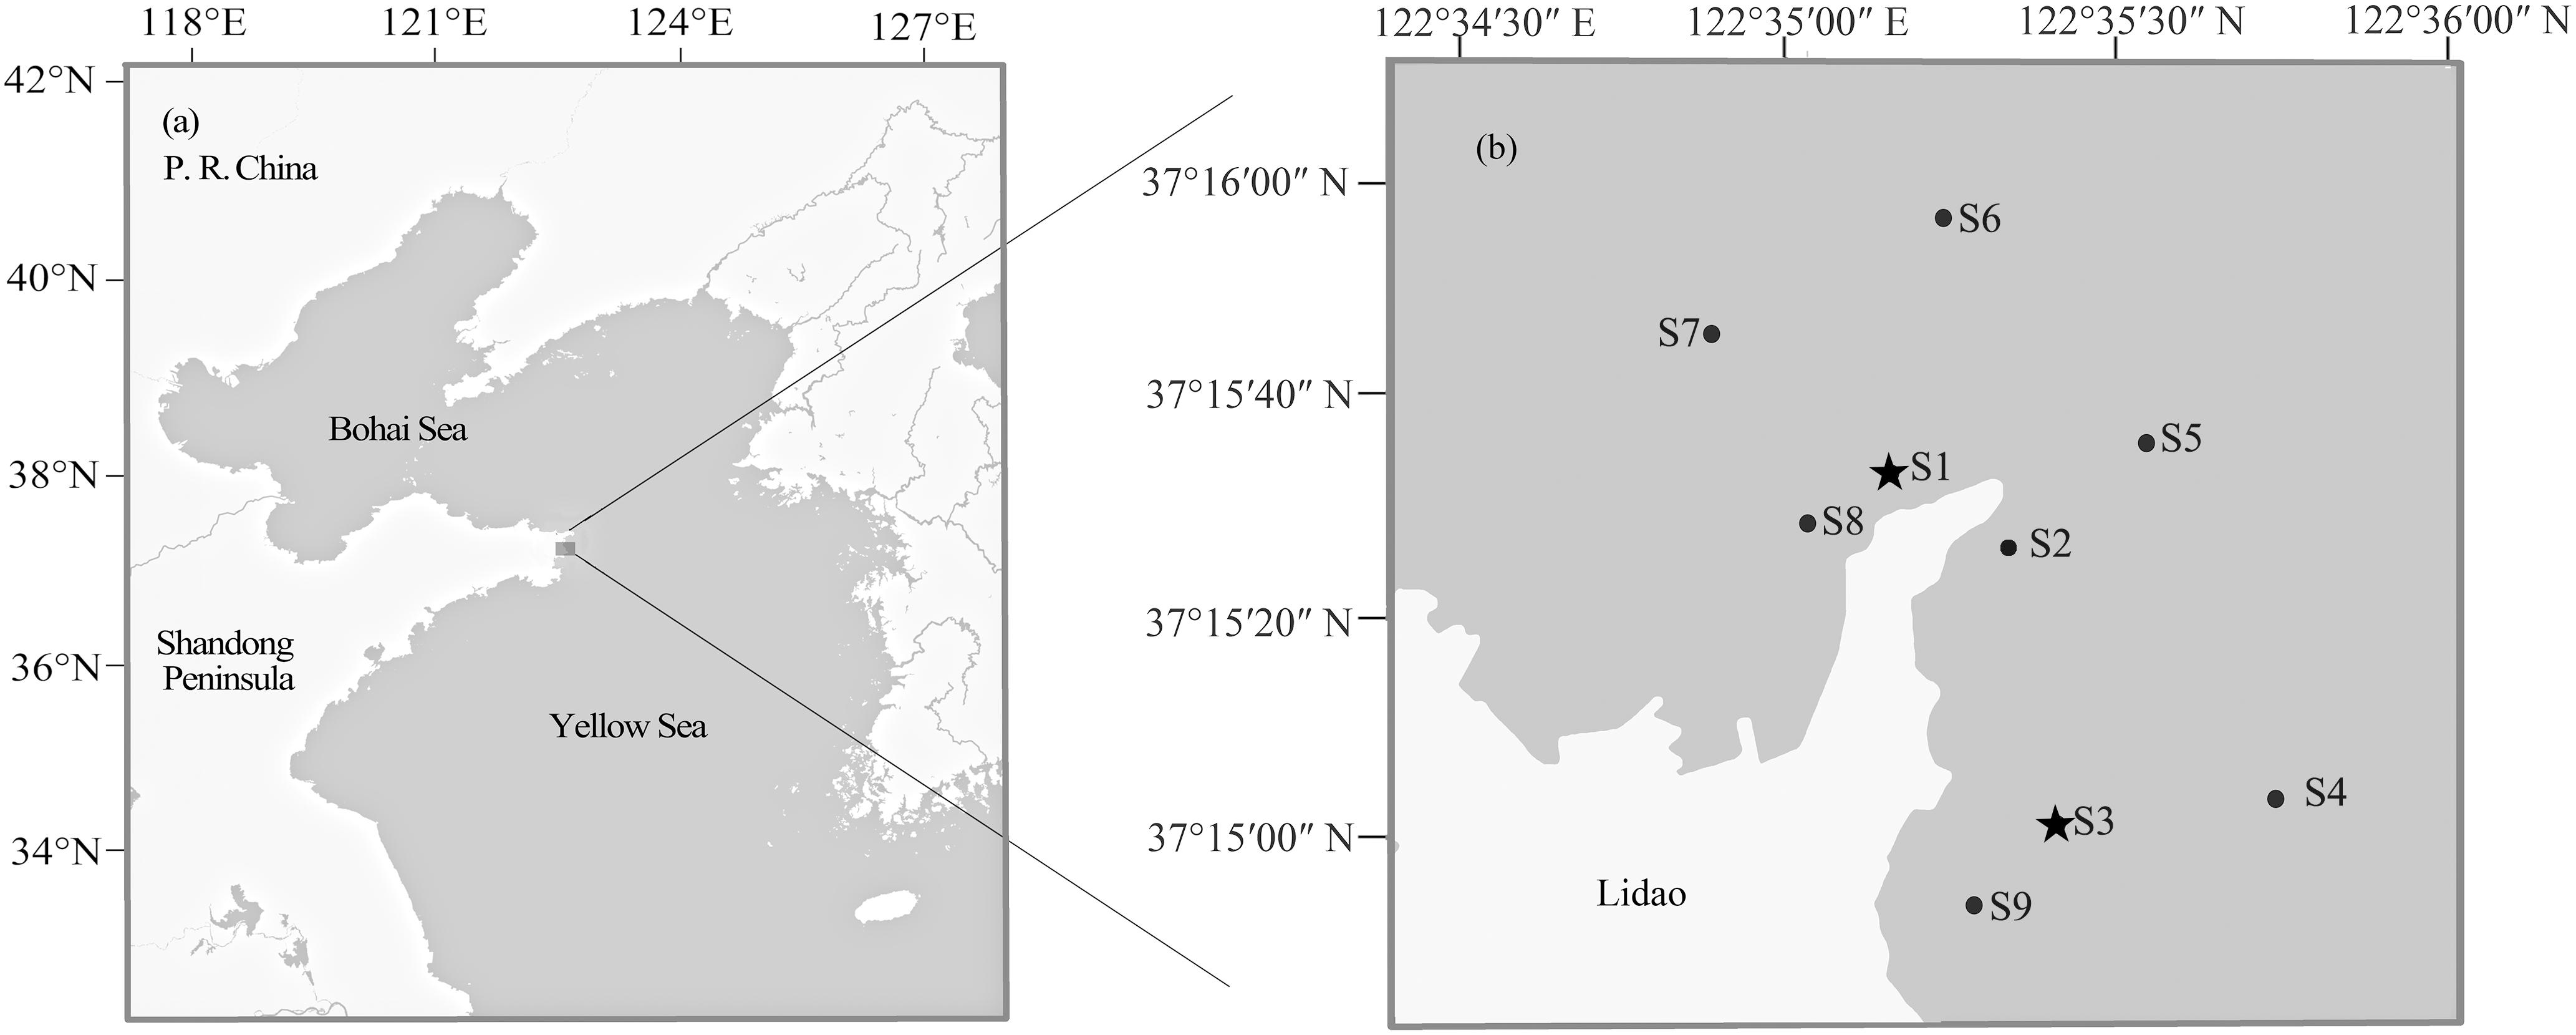
Figure 1. Map of Lidao Bay showing sampling sites. Locations of Lidao Bay (a) and sampling sites (b). S1–S9 indicating the sampling sites before and after release; S1 and S3 (asterisks) indicating the releasing sites.
Muscle sample from the dorsal region was excised from each fish specimen and immediately stored at −20°C. Total genomic DNA was extracted from 30 mg of muscle sample using the TIANamp Marine Animals DNA Kit (Tiangen Biotech Co., Ltd., Beijing, China). The concentration and purity of the extracted DNA were measured by using 1.0% agarose gel electrophoresis and a NanoDrop 2000 spectrophotometer (Thermo Scientific, Wilmington, DE, United States), and then stored at −20°C.
mtDNA Sequencing
A pair of primers (SS-CR-F1: 5′-TAGTAGCTCAGCGTCAG AGCC-3′ and SS-CR-R1: 5′-GGGCCCATCTTAACATCTTCA-3′) designed according to the previously published S. schlegelii mitogenome (GenBank accession no. AY491978.1) was used for PCR amplification of the whole mtDNA control region. As there was an approximately 289 base pair (bp) tandem repeat situated within the 3′ end of the control region, one more pair of primers were designed (SS-CR-F2: 5′-CGTCAGAGCCCTGGTCTTGTA-3′ and SS-CR-R2: 5′-AAGCCAAAGGGGGTAATATAGA-3′) and used to obtain an approximately 800 bp fragment from the 5′ region of the mitochondrial control region.
The PCR amplification was performed in a 50 μL reaction containing 50–100 ng of genomic DNA as a template, 1 μL of KOD FX neo polymerase (Toyobo, Osaka, Japan), 25 μL of 2× PCR Buffer, 10 μL of dNTP mix (2 mM each), 2 μL (10 μM) of each primer, and ultrapure water to 50 μL. The cycling conditions consisted of an initial denaturation step at 94°C for 2 min, followed by 35 cycles of 98°C for 10 s, 55°C for 30 s, and 68°C for 1 min, with a final extension at 68°C for 7 min. The PCR products were purified with the EZNATM gel extraction kit (Omega Bio-Tek, Norcross, GA, United States), and the purified PCR products were bidirectionally sequenced by Shanghai Sunny Biotechnology Co., Ltd. (Shanghai, China) using an ABI 3730 capillary sequencer.
Microsatellite Genotyping
A total of 38 previously published S. schlegelii microsatellite loci were chosen for the analysis (Table 1). Primers were synthesized by Life Technology Co., Ltd. (Shanghai, China), and the forward primers were labeled with the fluorescent dyes FAM, HEX, and TAMRA. The PCR amplification was performed as described in the references by Yoshida et al. (2005), An et al. (2009), Bai et al. (2011), Yasuike et al. (2013), and Jia (2014). Amplified fragments were electrophoresed using an ABI 3130xl capillary DNA sequencer (Applied Biosystems, Inc., CA, United States). The ROX-500 size standard was used, and GENEMARKER software was used for scoring.
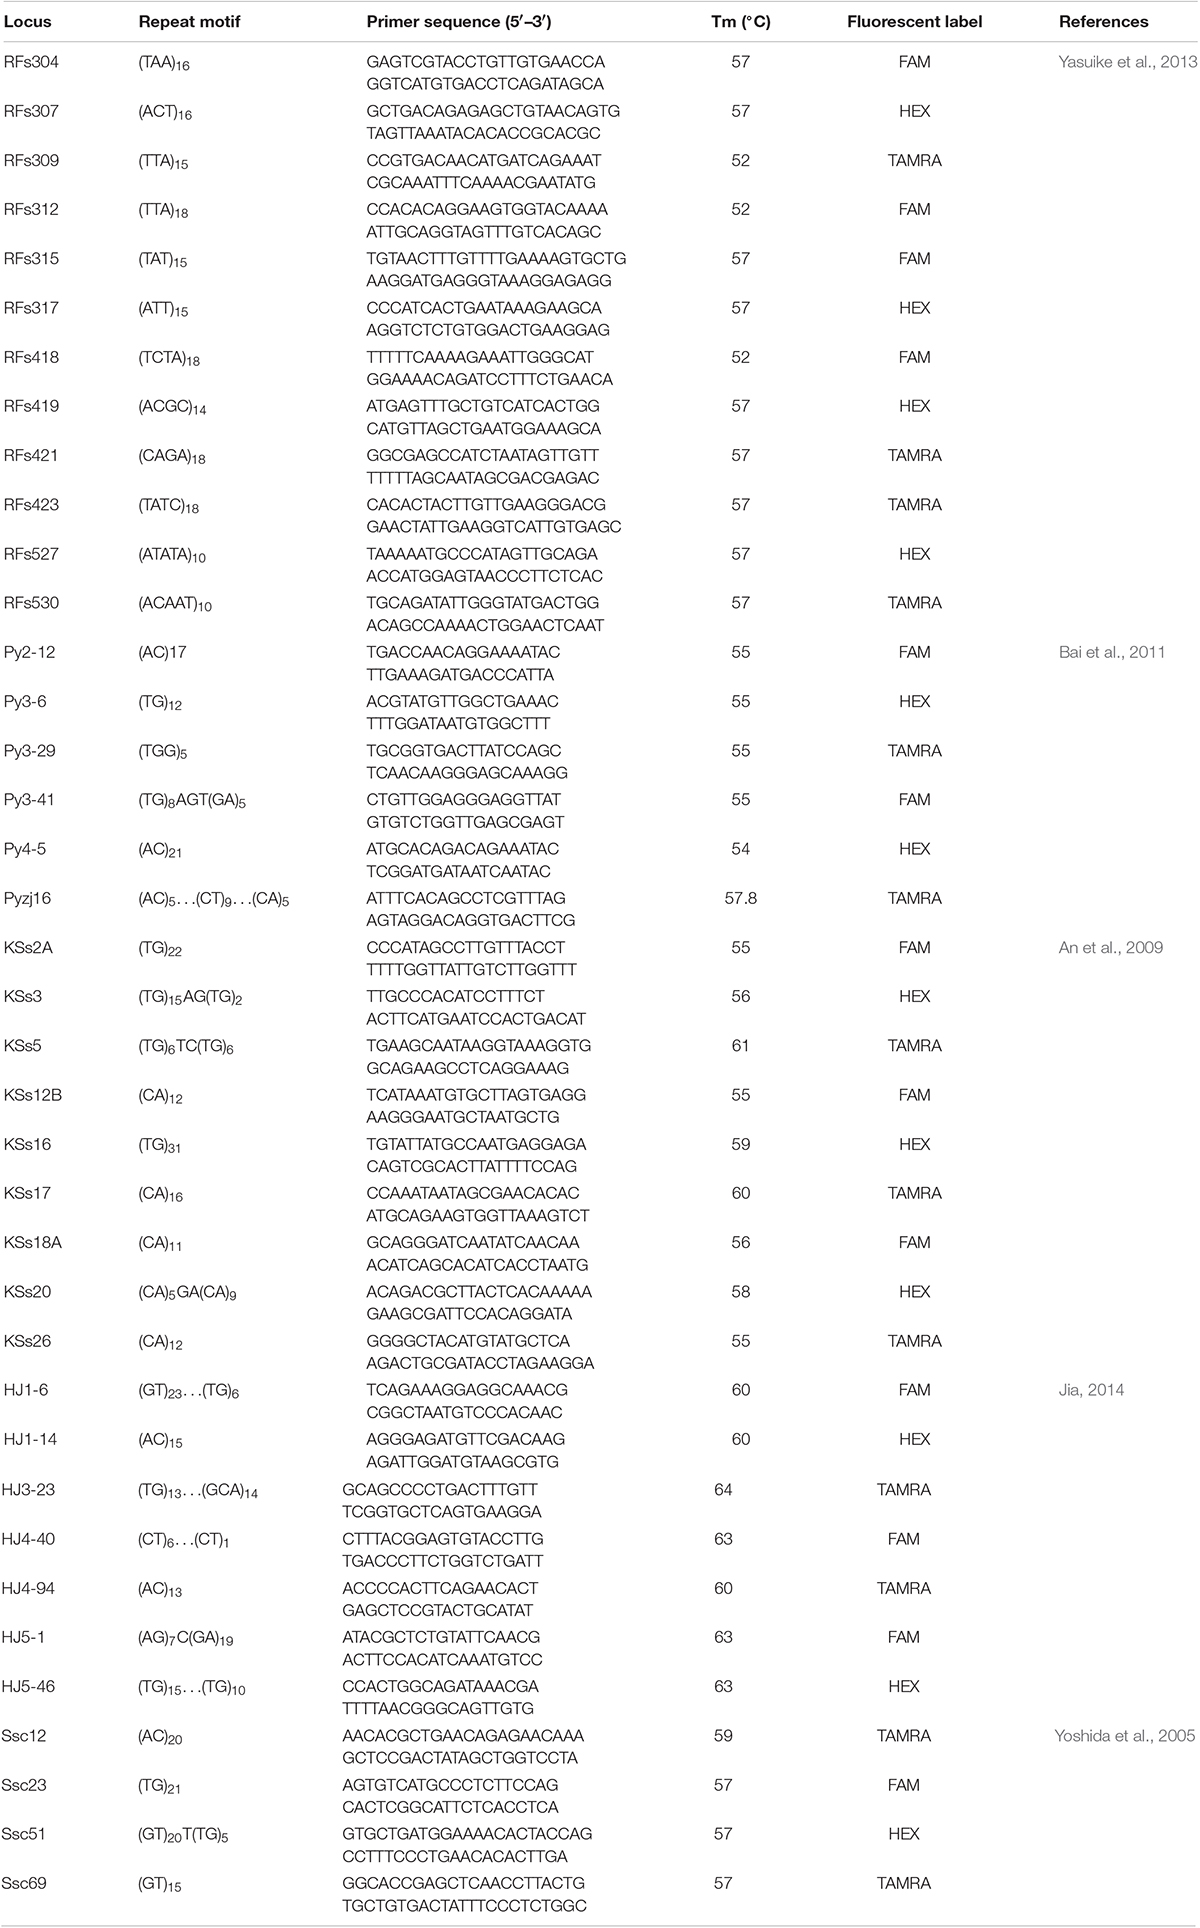
Table 1. Information for microsatellite loci and primers used in this study.
Genetic Diversity Estimation
Sequences in the mtDNA control region were assembled and edited using Bioedit software (Hall, 1999), and aligned using ClustalX2.1 (Larkin et al., 2007). The haplotype diversity (h) and nucleotide diversity (π) indices and other genetic indices, such as polymorphic site and the number of haplotypes, were calculated with DnaSP 5.10 software (Rozas et al., 2003). Haplotype networks were constructed based on statistical parsimony using TCS 1.21 (Clement et al., 2000).
The standard genetic diversity parameters of microsatellite markers, including the number of alleles (A), effective number of alleles (Ae), observed heterozygosity (Ho), and expected heterozygosity (He) were calculated by using GENALEX v.6 (Peakall and Smouse, 2012). Allelic richness (Ar) was calculated by using FSTAT v.2.9.3 (Goudet, 2001). Micro-Checker software (Van Oosterhout et al., 2004) was used to search for null alleles at the loci. Deviations from linkage disequilibrium and Hardy–Weinberg equilibrium (HWE) for each microsatellite locus were tested by using the GENEPOP v.4.0 package (Saitoh and Rousset, 2008), and the significance was adjusted by applying sequential Bonferroni correction. The mean polymorphism information content (PIC) was calculated according to Botstein et al. (1980) by using PIC_Calc 0.6. ADZE v.1.0 (Szpiech et al., 2008), which was used to determine the number of private alleles with standardized sample sizes.
Genetic Differentiation
To estimate the genetic subdivision, analysis of molecular variance (AMOVA) and the fixation index (FST) for both the mtDNA and microsatellite markers between each pair of sampling stocks were assessed using Arlequin 3.5.2 (Excoffier and Lischer, 2010). Neutrality tests (Tajima’s D and Fu’s Fs) were also performed using Arlequin 3.5. Pairwise genetic distances were calculated using the Kimura 2-parameter (K2P) distance model. Neighbor-joining (NJ) trees of K2P distances with 1000 bootstrap replications (Saitou and Nei, 1987) were generated to provide a graphic representation of the divergence among individuals. The K2P distance and NJ tree were calculated and generated using MEGA version 5 (Tamura et al., 2011).
Estimation of Nei’s unbiased genetic distance and genetic identity of S. schlegelii samples was performed by using GENALEX v.6. The discriminant analysis of principal components (DAPC) was used to cluster genotypes independently of a priori haplotype designation using the R package adegenet v. 1.4.2 (Jombart, 2008). An optimum number of cluster was defined by the K-averaging algorithm that made use of the Bayesian information criterion.
Bottleneck 1.2 software (Cornuet and Luikart, 1996) was used to detect the existence of bottlenecks with the infinite allele model (IAM), stepwise-mutation model (SMM), and two-phased model of mutation (TPM) (Luikart and Cornuet, 1998). Significant heterozygosity excess was assessed with the Wilcoxon signed-rank test.
Effective Population Size and Relatedness
Estimations of Ne in S. schlegelii stocks were performed with NeEstimator v.1.3 by using the linkage disequilibrium and heterozygote excess methods. Ne was also calculated by the sibship method (Wang, 2009) using COLONY (Jones and Wang, 2010). The relatedness of each stock was calculated with COANCESTRY v.1.0 (Wang, 2011) using the triadic likelihood method described by Wang (2007).
Results
Genetic Diversity
A 678 bp fragment of the black rockfish mtDNA control region was amplified from all 288 individuals and sequenced. There were 59 polymorphic sites, and a total of 78 haplotypes were identified in the dataset. The genetic diversity indices are presented in Table 2. The values of h and π in the hatchery-released stock were 0.902 and 0.00483, respectively; whereas the h values in the wild stock before stock enhancement and the mixed stock after enhancement were 0.970 and 0.939 (p = 0.025), and the π values were 0.00581 and 0.00526 (p = 0.150), respectively. These results showed that the hatchery stock displayed slightly lower genetic diversity than the wild stock; however, there was almost no difference between the wild stock before release and the mixed stock after release. Among the 78 haplotypes, 8 were shared among all 3 stocks, and 7 haplotypes were only detected in the hatchery-released stock (Supplementary Table S1). Hap2 was shared among all stocks, accounted for 14.58% of all specimens. Tajima’s D and Fu’s Fs were significantly different from zero in the wild stock before enhancement (D = −1.55, p = 0.77 and Fs = −25.82, p = 0.25) and in the hatchery-released stock (D = −0.19, p = 0.19 and Fs = −6.25, p = 0.14).
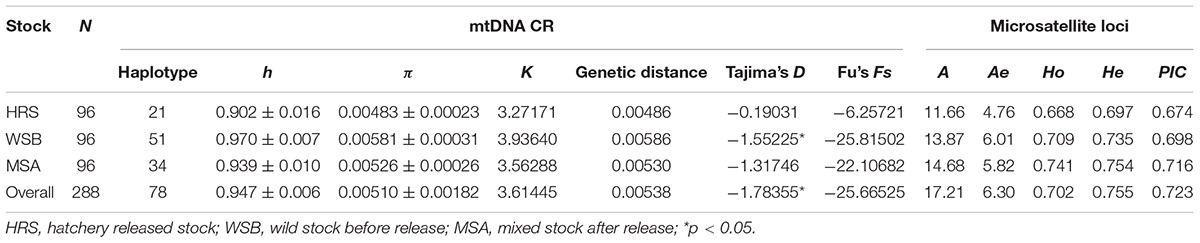
Table 2. Genetic diversity parameters of S. schlegelii stocks based on mtDNA control region sequences and 38 microsatellite loci.
For the 38 microsatellite loci, no evidence for scoring error caused by stuttering or large allele dropout was observed. A total of 654 alleles were found among the 288 individuals (Supplementary Table S2). The measures of genetic diversity for each stock, as calculated from the observed allele distribution, are presented in Table 2. The lowest polymorphism was observed at locus Kss18, which had four alleles, while the highest polymorphism was observed at locus HJ4-49, which had 47 alleles. For most loci in all stocks, the hypothesis of linkage equilibrium was not rejected. Departures from HWE by exact test (Bonferroni correction applies) were observed at nine loci in the wild stock (Py2-12, Py4-5, Kss2, Kss3, Kss18, HJ1-14, HJ4-94, RFs315, and RFs423), and at eight loci in the hatchery stock (Py2-12, Kss16, Kss17, Kss18, HJ4-94, RFs304, RFs315, and RFs418) (Supplementary Table S3). The average A and Ae per stock per locus varied from 11.66 to 14.68 and 4.76 to 6.01, respectively. For most loci (30 out of 38), the Ho values were lower than the He values, which indicated heterozygote deficiency. The mean Ae in the hatchery-released stock was 4.76, the mean PIC was 0.674, and the Ho and He were 0.668 and 0.697, respectively. The Ae, PIC, Ho, and He values were 6.01, 0.698, 0.709, and 0.735 in the wild stock before stock enhancement and 5.82, 0.716, 0.741, and 0.754 in the mixed stock after enhancement, respectively. Consistent with the results from mtDNA, the analysis of microsatellite markers also showed that the level of genetic diversity in the wild stock was higher than that in the hatchery-released stock, and the level of genetic diversity in the mixed stock after enhancement was not significantly different from that in the wild stock before stock enhancement. The number of private alleles per stock, with a standardized sample size, is shown in Figure 2, and the value in the hatchery-released stock was the highest. There were 141 private alleles in the studied stocks. Among them, 38 were in the wild stock before release, 27 were in the hatchery-released stock, and 76 were in the mixed stock after release.
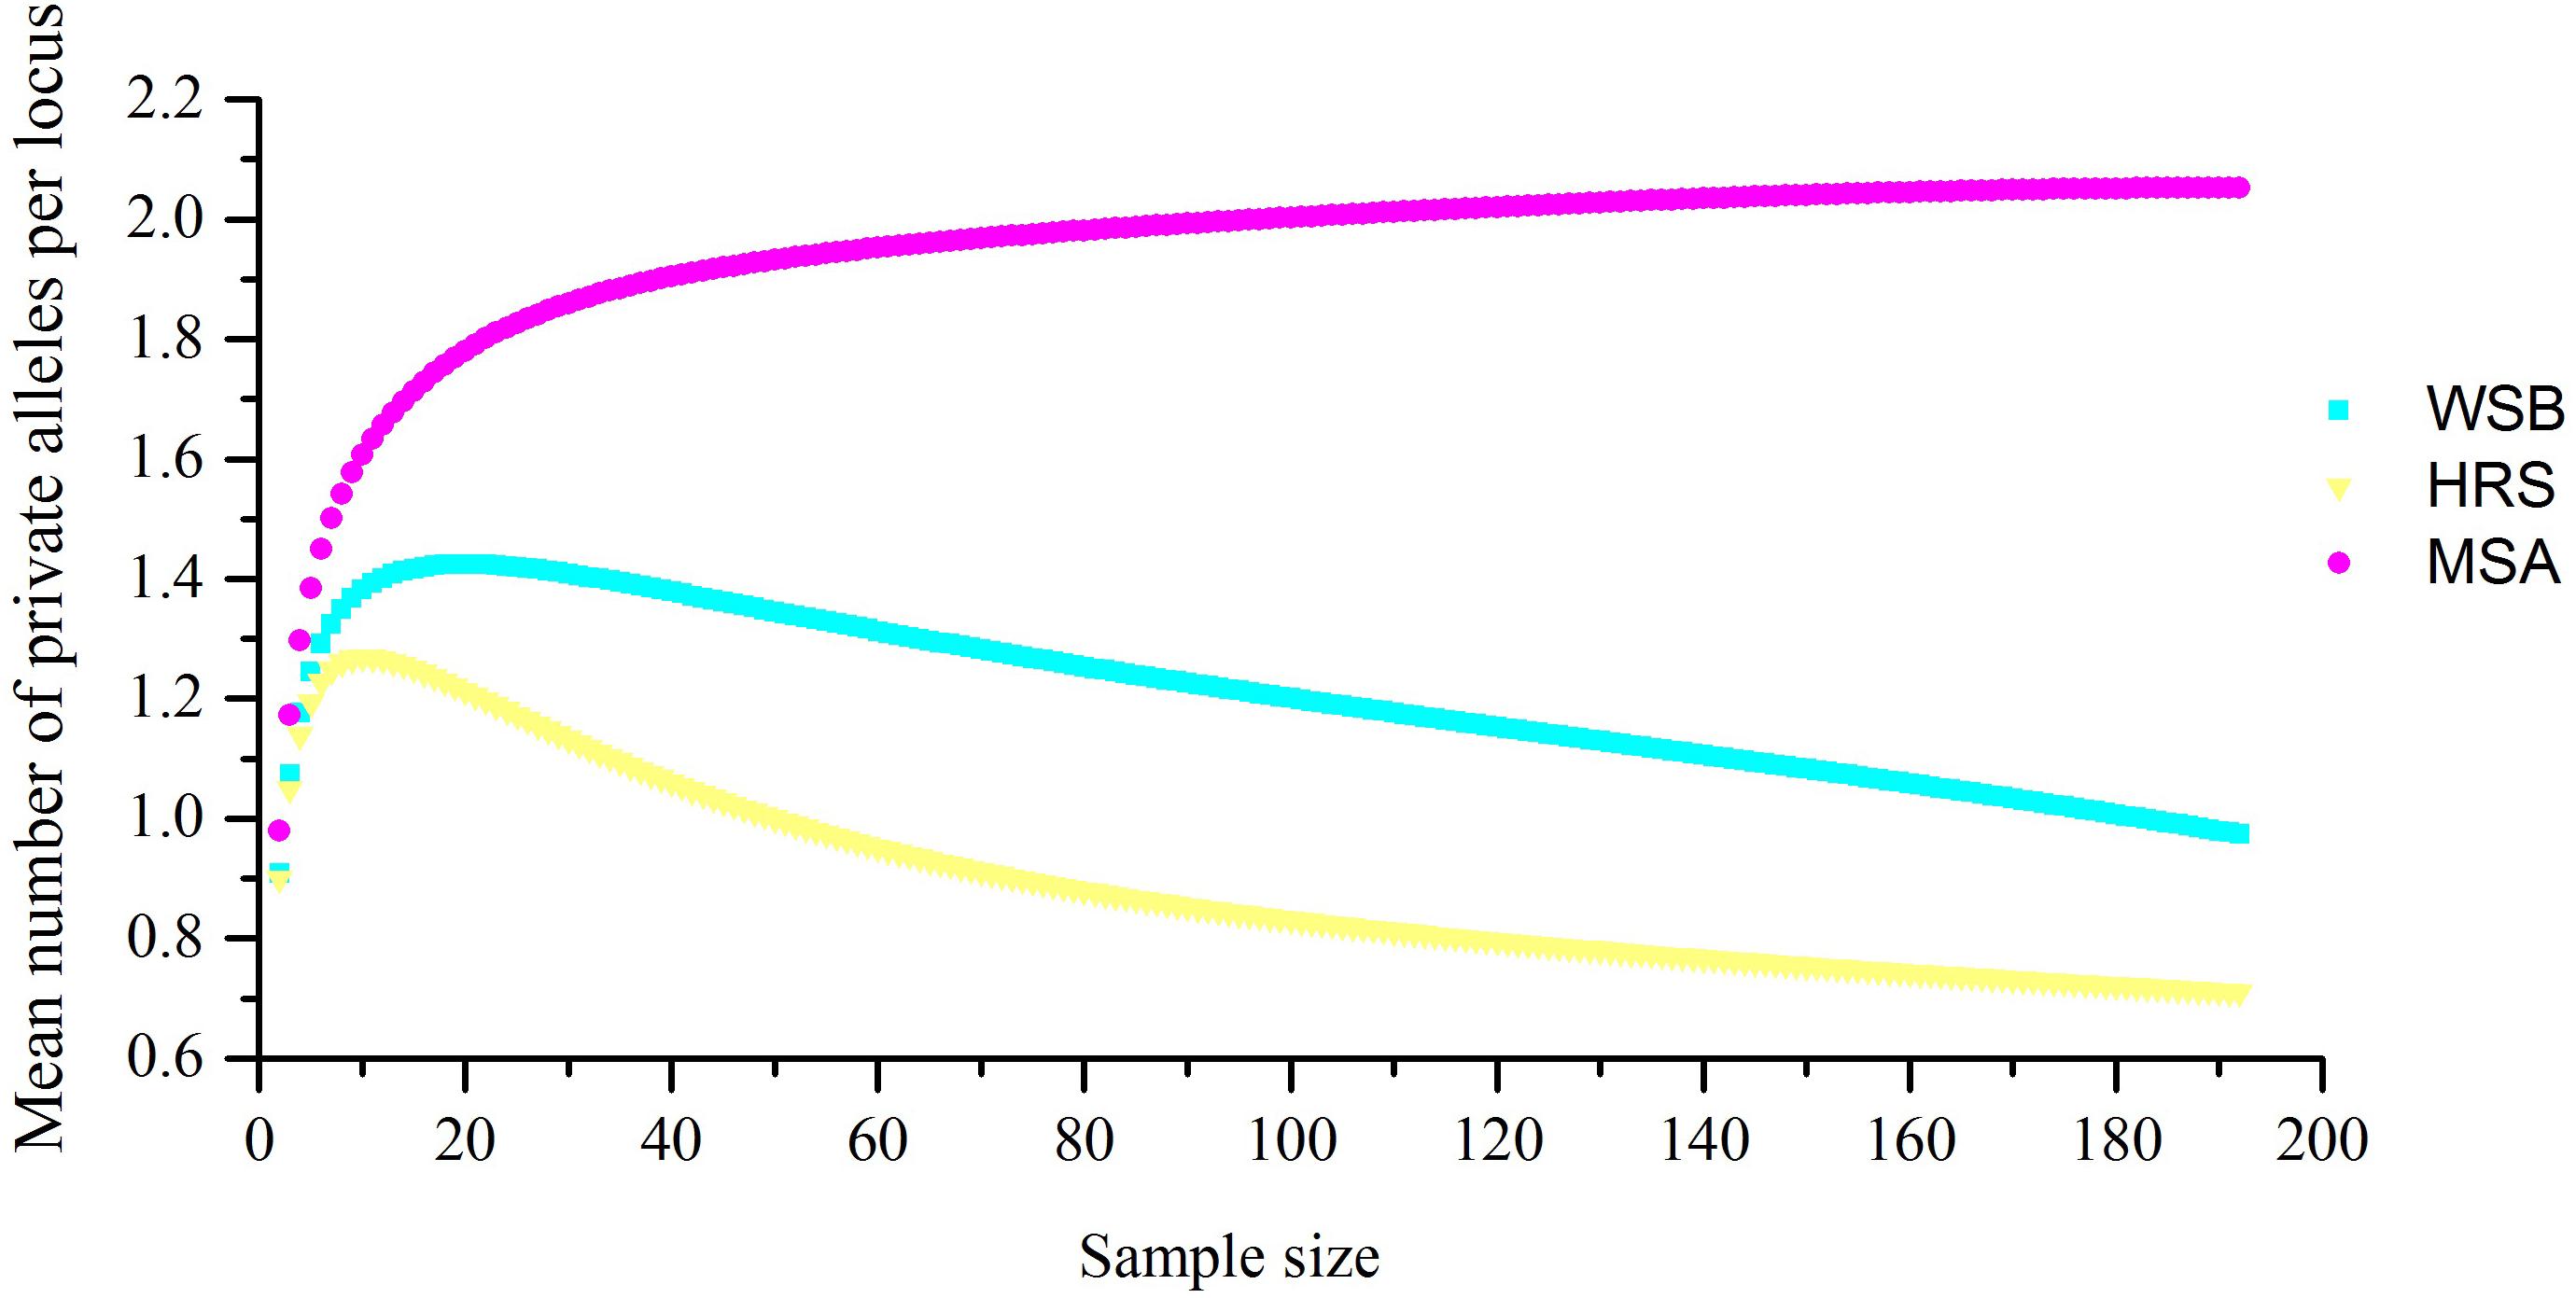
Figure 2. The number of S. schlegelii private alleles present per locality when sample size was standardized.
Population Genetic Differentiation
The scatter plots from the DAPC and three-dimensional factorial correspondence analysis (3D-FCA) (Figure 3) clearly showed three major clusters (i.e., hatchery-released stock, before impact wild stock, and after impact stock). The genetic differences between the clusters identified by DAPC were evaluated by FST values (Table 3). Pairwise FST value between the wild stock before stock enhancement in Lidao Bay and the hatchery-released stock calculated from mtDNA was 0.01488 (p = 0.072) (Table 3). While for the microsatellite markers, the FST was 0.040 (p < 0.001), which evidenced weak genetic differentiation between these two stocks. The pairwise FST value obtained from mtDNA between the before- and after-impact stocks was small (−0.004), and the p value of the exact test not significant (p = 0.694; Table 3). However, the estimated FST from microsatellite DNA was 0.034 (p < 0.001; Table 3), which was larger than that from the mtDNA, and showed low but significant difference between the wild stock before stock enhancement and the mixed stock after release. The hierarchical analysis of AMOVA based on the mtDNA and microsatellite markers (Table 4) also showed that only 1.00% and 4.69% (FST = 0.019, p < 0.001) of the genetic variation, respectively, were attributed to differences among the stocks, although the variance was significant.
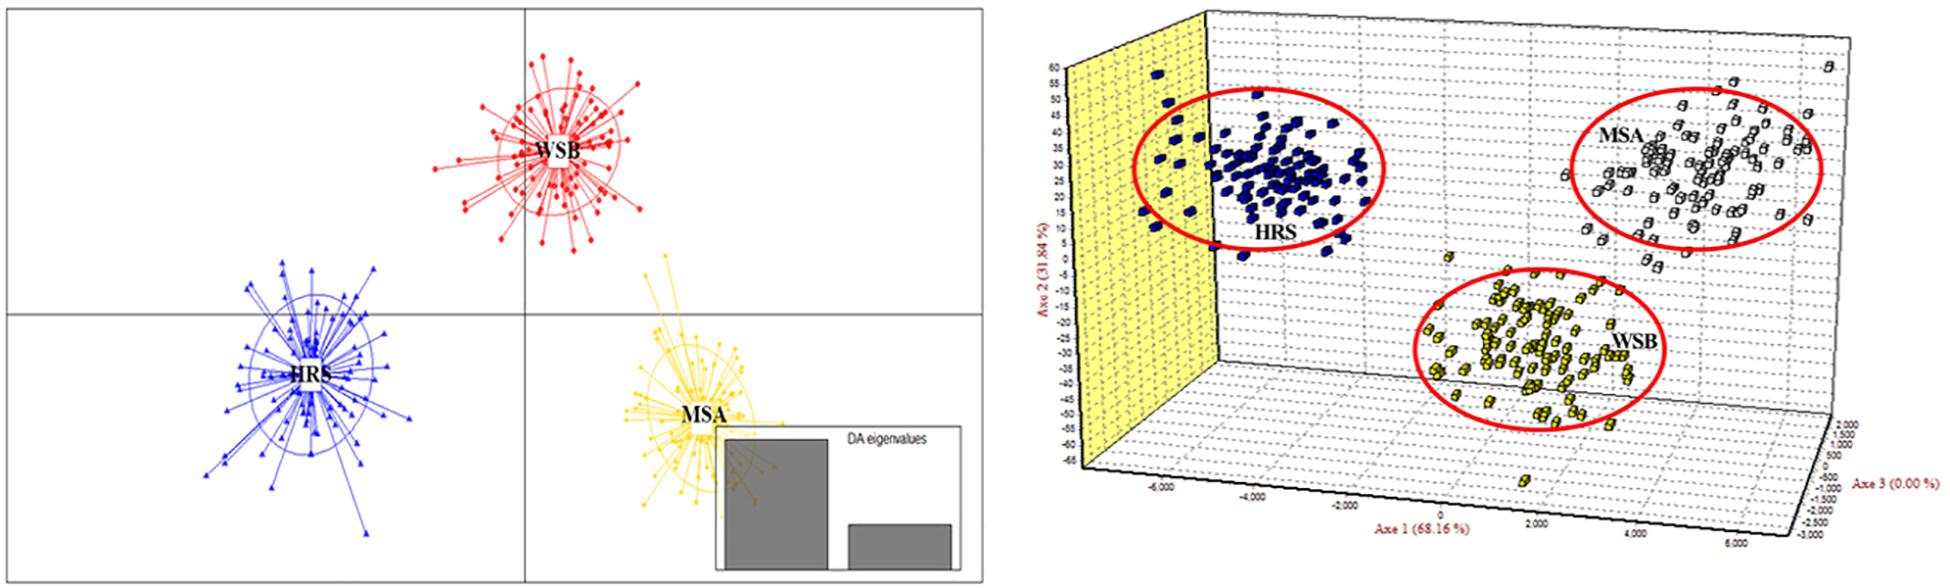
Figure 3. Discriminant analysis of principal components (DAPC) and three-dimensional factorial correspondence analysis (3D-FCA) showing the relationships among S. schlegelii individuals of three populations based on 38 microsatellite markers.
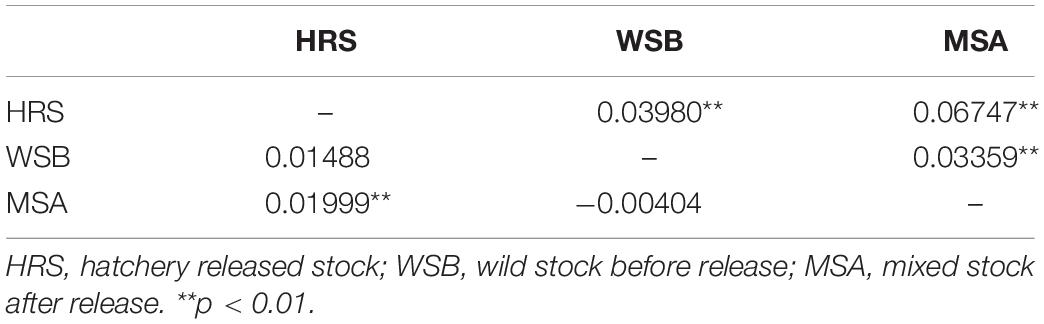
Table 3. Estimation of FST of S. schlegeli stocks indicated from the mtDNA (below the diagonal) and microsatellite markers (above the diagonal).
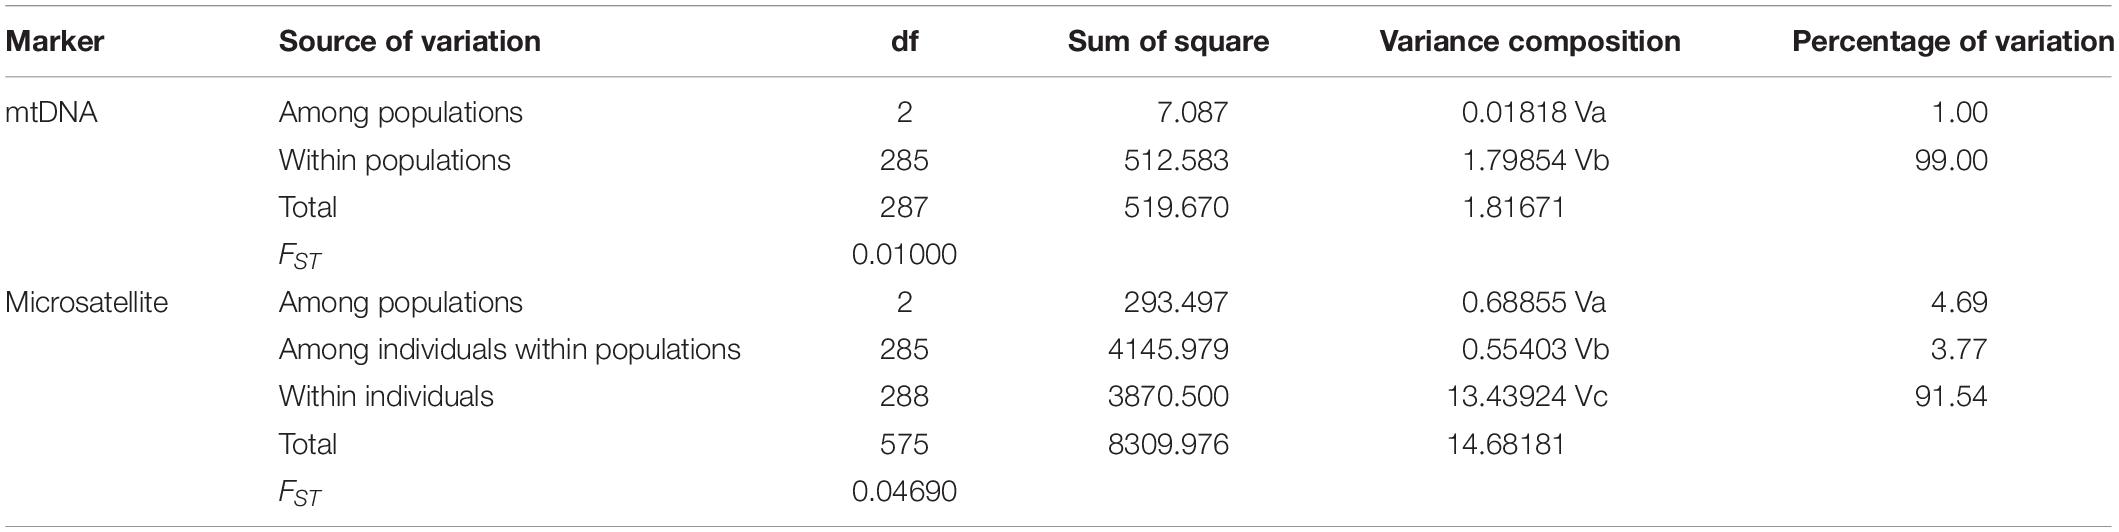
Table 4. The AMOVA analysis of S. schlegelii based on mtDNA and microsatellite markers.
The topology of the NJ tree showed no significant branch or cluster corresponding to the stocks (Supplementary Figure S1). The shallow phylogeny is consistent with demographic expansion after a bottleneck (Slatkin and Hudson, 1991). The network diagram of the haplotypes was simple, and no clustering that corresponded to sampling site was detected (Figure 4).
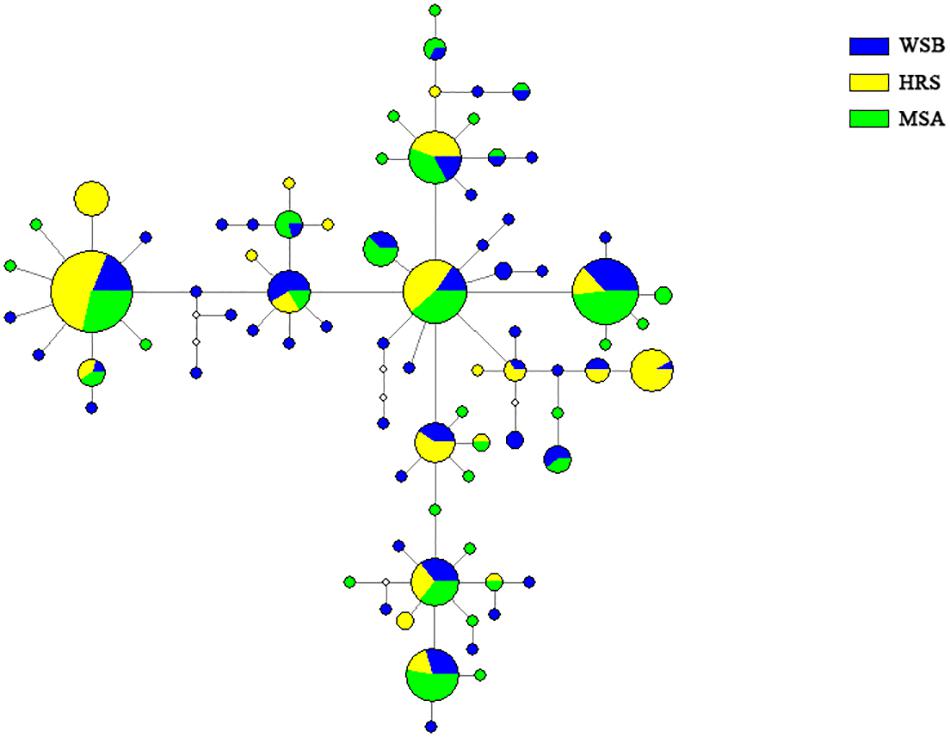
Figure 4. Median-Network showing phylogenetic relationship among mtDNA control region haplotypes in S. schlegelii stocks of Lidao Bay.
The IAM, TPM, and SMM models were used to test for population bottlenecks, and the results were shown in Supplementary Table S4. All stocks showed significant heterozygosity excess in the IAM model (p < 0.05), while in the TPM and SMM models, no significant population bottleneck was detected in any stock. Furthermore, a mode shift was detected in the frequency distribution of alleles, which resulted in a normal L-shaped curve.
Effective Population Sizes and Relatedness
The Ne of each stock was reported in Table 5. The Ne estimates generated by different methods lacked consistency. When calculated by the linkage disequilibrium method, the Ne values of the hatchery-released, before-release wild, and after-release mixed stocks were 662.5, 1043.7, and 602.0, respectively. With the heterozygote excess method, the estimations for all stocks were infinite. Ne estimated based on the sibship method for the hatchery-released stock and mixed stock after release were 1013 and 2280, respectively, whereas the estimate for the wild stock before release was infinite. Although the Ne values largely varied among the methods, the results in the wild population were systematically higher than those in the hatchery-released population. The Ne of the mixed stock was lower than that of the wild stock before enhancement. Relatedness within the hatchery stock was globally higher than that within the wild stock, and value of the mixed stock after release was a little higher than that of the wild stock before stock enhancement (Figure 5).
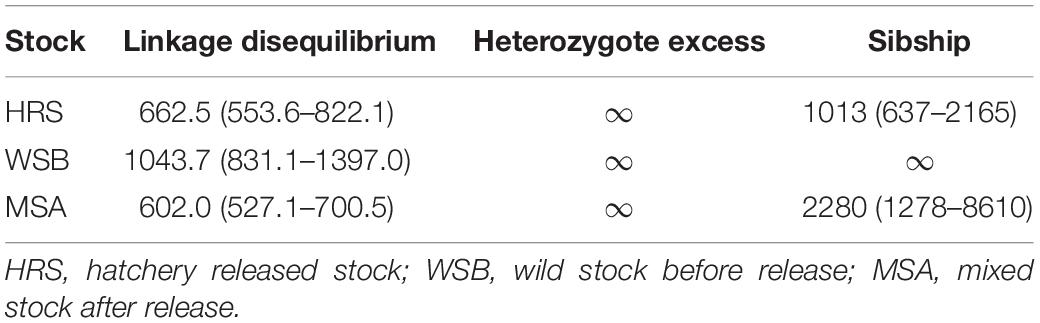
Table 5. Results of effective population sizes (Ne) for each stock.
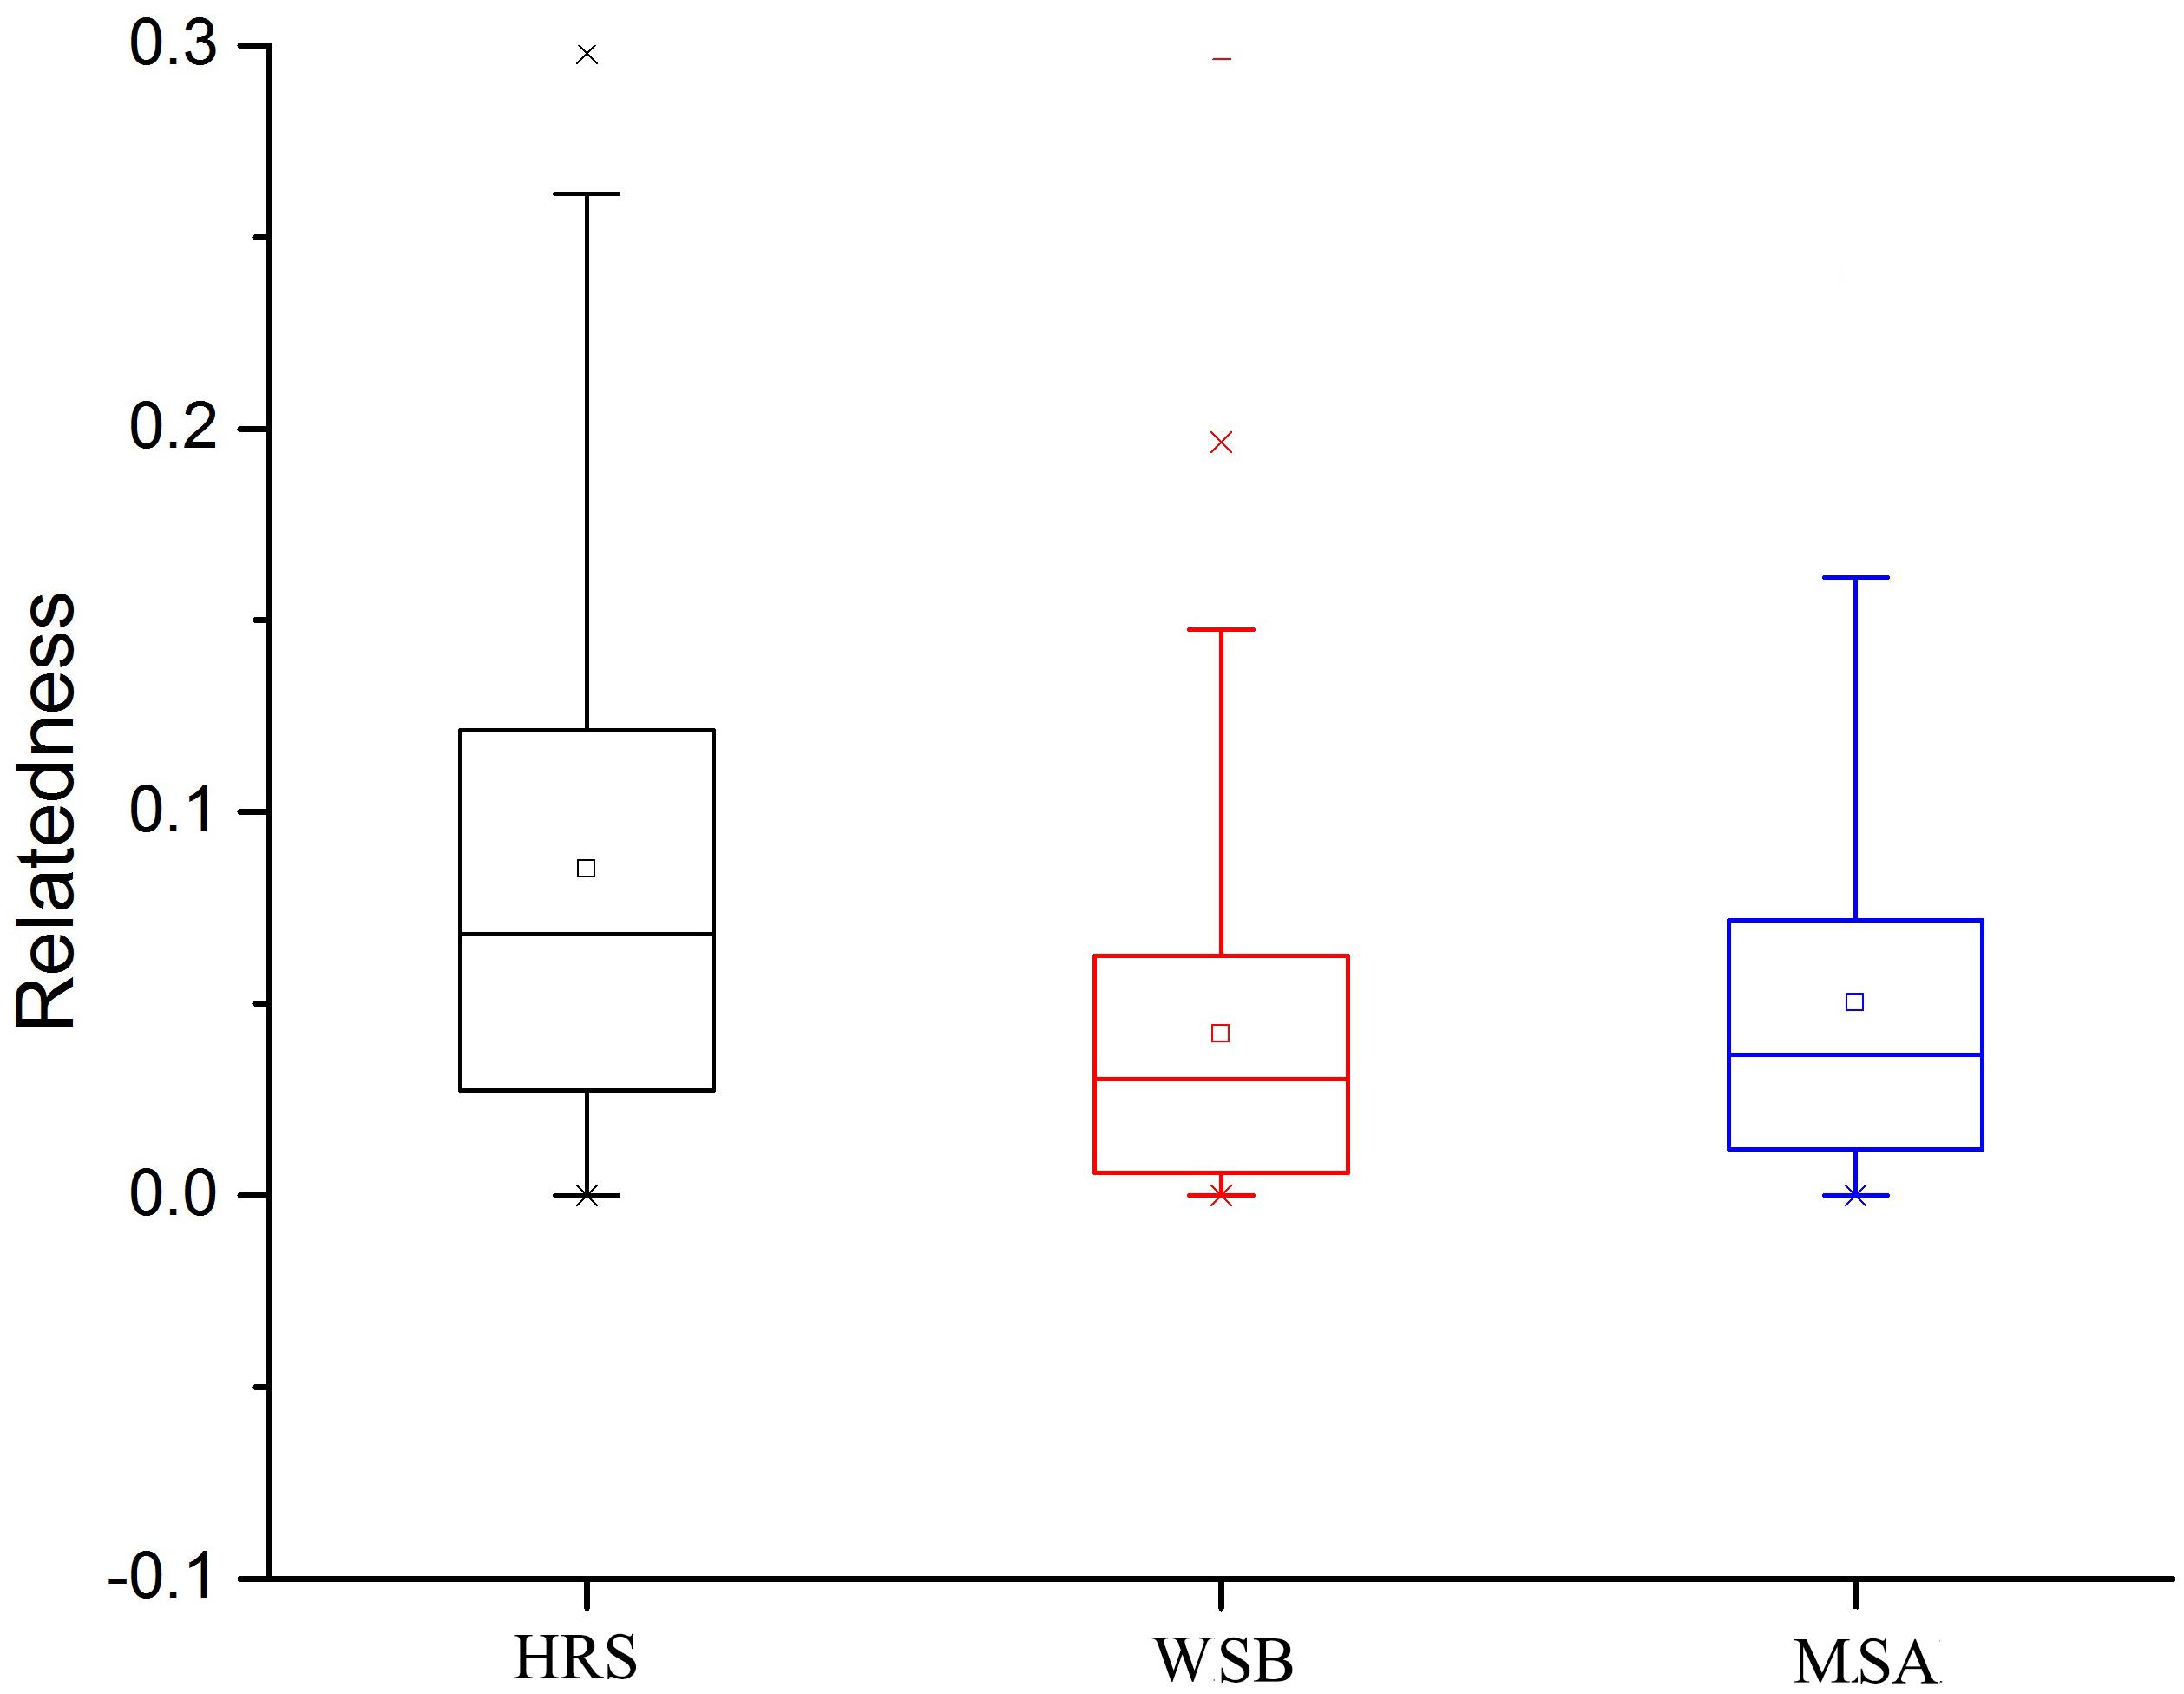
Figure 5. Relatedness in the hatchery stock and wild stocks before and after release.
Discussion
The release of hatchery-reared juveniles could augment the marine fishery biomass. It could help fish stocks recover, and has been conducted in many countries. However, numerous studies have shown that the large-scale release of hatchery individuals into the wild can cause negative effects on the genetic diversity of wild populations (Laikre et al., 2010). Stock enhancement programs for black rockfish have been conducted in Asia for more than 30 years; however, scant information is available on its genetics. Therefore, more detailed genetic analyses elucidating the genetics of stock enhancement in this species were required. We conducted S. schlegelii stock enhancement analysis in 2013 at an embayment, namely Lidao Bay. Lidao bay is located in the east cost of Shandong Peninsula, China and open to the Yellow Sea. The surface seawater temperature ranged from −1 to 26°C, salinity ranged from 30.2 to 32.6‰, dissolved oxygen ranged from 7.10 to 11.36 mL/L, and pH ranged from 7.20 to 8.38 during our sampling period. This bay has some artificial reefs that may limit the dispersal of released S. schlegelii and may render small local native populations more vulnerable than those in the open sea. Thus, the possibility of genetic impact may be higher, which would offer a good opportunity for studying the genetic impacts of the black rockfish restoration. Moreover, in the present study, both mitochondrial and microsatellite makers were used to investigate the genetic effects.
Significant deviations from HWE were observed in all analyzed S. schlegelii stocks in the present study, even after sequential Bonferroni’s correction. This may be caused by heterozygote deficits, and there was heterozygote deficiency in 30 of the studied loci. Although null allele is also an important contributor for the heterozygote deviation in marine fish (Dick et al., 2014), it is unlikely that null allele is the main cause of the deviations observed in this study, because only a few loci had a high frequency of null alleles (e.g., RFs315, Kss18).
The overall genetic diversity in S. schlegelii in this study was comparable to that previously reported using mtDNA and microsatellite markers (Zhang et al., 2016; Gao et al., 2018). Zhang et al. (2016) used the mitochondrial control region marker to investigate 221 S. schlegelii individuals collected from 13 localities across its entire range in China, Japan, and Korea, and the results revealed similar genetic variability at the haplotype and nucleotide levels (overall average h = 0.91 ± 0.01 and π = 0.0063 ± 0.0092). In the present study, the genetic diversity indices of the control region in all three stocks were similar to those measured in previous studies. The 38 microsatellite loci used in this study showed slightly lower levels of polymorphism compared to other black rockfish stocks (An et al., 2012; Gao et al., 2018). Many hatchery fishes show lower numbers of alleles and less genetic variability, resulting from the limited numbers of broodstock used as founders in the hatchery stock for juvenile production (Araki and Schmid, 2010; Champagnon et al., 2012; Lorenzen et al., 2012). In this study, although some of the genetic diversity indices for both mtDNA and msDNA were lower in the hatchery-reared fish than in the wild-born fish, most of the differences were slight and not supported statistically. Therefore, no large decrease of genetic diversity was observed between the hatchery stock and the recipient wild stock, consistent with what was observed in other studies of this fish (Han et al., 2016). However, even though the hatchery stock had high gene diversity, these fish had considerably lower allelic richness relative to the wild stock. According to Araki and Schmid (2010), losses of allelic richness are more common than losses of heterozygosity in the early generations of hatchery-reared populations. As the negative genetic impacts caused by stock enhancement have been documented in several fish species (Laikre et al., 2010), the change in the genetic variability of a mixed stock of S. schlegelii after release was also examined in this study. The results of both mtDNA and msDNA analyses showed that the mixed stock exhibited nearly similar average genetic diversity, albeit slightly lower, than that of the natural stock before release. It is important to note that even if the reductions in allelic diversity and heterozygosity are limited, such reductions could gradually erode the genetic variability of the wild stock by accumulating over generations.
Three clusters were identified by DAPC in this study. Low genetic differentiation level (FST < 0.05) was detected between the hatchery-released stock and the wild stock. The FST and AMOVA results demonstrated that the wild stock before release and the mixed stock after release showed low but statistically significant levels of genetic differentiation. One possible reason for the low differentiation is that S. schlegelii in China has a relatively short domestication history, and it has not been selected in breeding programs over multiple generations. Indeed, most genitors used in artificial selective breeding were captured from natural waters and are only used once. Moreover, the black rockfish is a viviparous species, and the broodstock used to produce hatchery fish is renewed each year by sampling new genitors from the wild, such that a large number of genitors are used in a single year. These breeding practices may result in a high level of genetic diversity in the hatchery stock and low differentiation when compared with the wild stock. Another reason for the observed limited differentiation may be the absence of significant differentiation among different wild populations of this species. Black rock fish is a species that aggregates around drifting seaweed during their early development, and the both mtDNA and microsatellite marker analyses indicated no genetic divergence among different geographical populations and the existence of high gene flow (Wang et al., 2012; Zhang et al., 2016; Gao et al., 2018). The S. schlegelii adults spawn during May to July, and the larvae have a flexible feeding stage for 2–3 months (Nagasawa and Domon, 1997). Larvae of S. schlegelii might be transported by the China Coast Current. Therefore, although the swimming ability of adult S. schlegelii is limited, larval dispersal via drifting seaweed and oceanic circulation could promote genetic homogeneity (Gao et al., 2018). The lack of genetic differentiation in this species may reduce the genetic effects of stock enhancement using hatchery fish from different geographical stocks.
Estimates of Ne lack consistency and vary widely among estimation methods (Table 5). Although Ne is a key parameter for fecundity and supplementation of a population, exact estimation of the Ne based on genetic markers remains a challenge. Most methods for estimating the Ne were developed based on a hypothetical “ideal” population of constant size, with non-overlapping generations, an equal sex ratio, random mating and random variation in reproductive success (Waples and Do, 2010). These conditions may be not satisfied by black rockfish, which display complex life-history traits. Regardless, we observed that the Ne values obtained by using different estimators were systematically higher in the wild stock than in the hatchery-released stock and mixed stock after release.
There was no obvious reduction in genetic diversity in the hatchery-released stock compared with that of the wild stock, and no significant change in genetic diversity indices was detected in the local stock after enhancement in short term. Thus, our study demonstrated that black rockfish is an ideal candidate fish for releasing into the wild with an aim to increase fishery yields. However, although the observed reduction in genetic parameters, such as allelic diversity, heterozygosity and Ne, did not reach significance, a slight reduction could gradually affect the genetic diversity of the wild stock through accumulation over generations. Despite subtle genetic divergence was detected, our results also suggested that the stocks before and after release did not harbor the coincident genetic pool. Thus, the released individuals are likely to erode long-term genetic diversity of the wild stock through mating with wild individuals, and may have a lasting impact on population genetic structuring as time goes on. In this study, we only collected samples within the first year after release, and the released fishes did not reach sexual maturity. Therefore, more detailed surveys are required to elucidate the long-term genetic effects of S. schlegelii stock enhancement. Moreover, individuals sharing the same genetic architecture with the recipient population were recommended to use in subsequent enhancement activities to avoid adverse effects on the local gene pool.
Data Availability Statement
The mitochondrial dataset generated for this study can be found in the NCBI GenBank (https://www.ncbi.nlm.nih.gov/) with access numbers MN952238–MN952525. The microsatellite dataset analyzed in this study is included in the Supplementary Data Sheet S1.
Author Contributions
FY, HL, and LW conceived and designed the experiments. LW, ZW, and FY performed the experiments, analyzed the data, prepared the figures and tables, and wrote the draft of the manuscript. LW, YW, ML, and AS carried out the sampling work in the field. All authors revised the manuscript and approved the final version.
Funding
This research was funded by the Major Agricultural Application Technology and Innovation Projects of Shandong Province (2017–2020), Special Program for Basic Research of the Ministry of Science and Technology of China (No. 2014FY110500), and the National Infrastructure of Fishery Germplasm Resource (No. 2017DKA30470).
Conflict of Interest
The authors declare that the research was conducted in the absence of any commercial or financial relationships that could be construed as a potential conflict of interest.
Supplementary Material
The Supplementary Material for this article can be found online at: https://www.frontiersin.org/articles/10.3389/fmars.2020.00094/full#supplementary-material
References
An, H., Kim, M. J., Park, K., Cho, K., Bae, B., Kim, J., et al. (2012). Genetic diversity and population structure in the heavily exploited korean rockfish, Sebastes schlegelii, in Korea. J. World Aquac. Soc. 43, 73–83. doi: 10.1111/j.1749-7345.2011.00544.x
An, H. S., Park, J. Y., and Kim, M. J. (2009). Isolation and characterization of microsatellite markers for the heavily exploited rockfish Sebastes schlegelii, and cross-species amplification in four related Sebastes spp. Conserv. Genet. 10, 1969–1972. doi: 10.1007/s10592-009-9870-8
Araki, H., and Schmid, C. (2010). Is hatchery stocking a help or harm?: evidence, limitations and future directions in ecological and genetic surveys. Aquaculture 308, S2–S11. doi: 10.1016/j.aquaculture.2010.05.036
Araki, H., Waples, R. S., Ardren, W. R., Cooper, B., and Blouin, M. S. (2007). Effective population size of steelhead trout: influence of variance in reproductive success, hatchery programs, and genetic compensation between life-history forms. Mol. Ecol. 16, 953–966. doi: 10.1111/j.1365-294X.2006.03206.x
Bai, C. C., Liu, S. F., Zhuang, Z. M., Lin, L., Wang, H., and Chang, Y. Q. (2011). Isolation and characterization of microsatellite markers for the Korean rockfish, Sebastes schlegelii. Genet. Mol. Res. 10, 2065–2068. doi: 10.4238/vol10-3gmr1522
Bell, J. D., Leber, K. M., Blankenship, H. L., Loneragan, N. R., and Masudar, R. (2008). A new era for restocking, stock enhancement and sea ranching of coastal fisheries resources. Rev. Fish. Sci. 16, 1–9. doi: 10.1080/10641260701776951
Botstein, D., White, R. L., Skolnick, M., and Davis, R. W. (1980). Construction of a genetic linkage map in man using restriction fragment length polymorphisms. Am. J. Hum. Genet. 32, 314–331.
Champagnon, J., Elmberg, J., Guillemain, M., Gauthier-Clerc, M., and Lebreton, J. D. (2012). Conspecifics can be aliens too: a review of effects of restocking practices in vertebrates. J. Nat. Conserv. 20, 231–241. doi: 10.1016/j.jnc.2012.02.002
Chin, B. S., Nakagawa, M., Noda, T., Wada, T., and Yamashita, Y. (2013). Determining optimal release habitat for black rockfish, Sebastes schlegelii: examining growth rate, feeding condition, and return rate. Rev. Fish. Sci. 21, 286–298. doi: 10.1080/10641262.2013.837364
Clement, M., Posada, D. C. K. A., and Crandall, K. A. (2000). TCS: a computer program to estimate gene genealogies. Mol. Ecol. 9, 1657–1659. doi: 10.1046/j.1365-294x.2000.01020.x
Cornuet, J. M., and Luikart, G. (1996). Description and power analysis of two tests for detecting recent population bottlenecks from allele frequency data. Genetics 144, 2001–2014.
Dick, S., Shurin, J. B., and Taylor, E. B. (2014). Replicate divergence between and within sounds in a marine fish: the copper rockfish (Sebastes caurinus). Mol. Ecol. 23, 575–590. doi: 10.1111/mec.12630
Ding, K., Zhang, H., Zhang, X. M., Song, N., and Gao, T. X. (2014). Comparative analysis of genetic variation in cultured and wild populations of black rockfish (Sebastes schlegelii) based on mitochondrial DNA control region. J. Fish. China 38, 769–777.
Excoffier, L., and Lischer, H. E. (2010). Arlequin suite ver 3.5: a new series of programs to perform population genetics analyses under Linux and Windows. Mol. Ecol. Resour. 10, 564–567. doi: 10.1111/j.1755-0998.2010.02847.x
Gao, T., Ding, K., Song, N., Zhang, X., and Han, Z. (2018). Comparative analysis of multiple paternity in different populations of viviparous black rockfish, Sebastes schlegelii, a fish with long-term female sperm storage. Mar. Biodivers. 48, 2017–2024. doi: 10.1007/s12526-017-0713-4
Garibaldi, L. (2012). The FAO global capture production database: a six-decade effort to catch the trend. Mar. Policy 36, 760–768. doi: 10.1016/j.marpol.2011.10.024
Gold, J. R., Ma, L., Saillant, E., Silva, P. S., and Vega, R. R. (2008). Genetic effective size in populations of hatchery-raised red drum released for stock enhancement. Trans. Am. Fish. Soc. 137, 1327–1334. doi: 10.1577/t07-192.1
Goudet, J. (2001). FSTAT, a Program To Estimate and Test Gene Diversities and Fixation Indices (Version 2.9. 3). Lausanne: Lausanne University.
Grant, W. S., Jasper, J., Bekkevold, D., and Adkison, M. (2017). Responsible genetic approach to stock restoration, sea ranching and stock enhancement of marine fishes and invertebrates. Rev. Fish Biol. Fish. 27, 615–649. doi: 10.1007/s11160-017-9489-7
Hall, T. A. (1999). BioEdit: a user-friendly biological sequence alignment editor and analysisprogram for Windows 95/98/NT. Nucleic Acids Symp. Ser. 41, 95–98.
Hamasaki, K., Toriya, S., Shishidou, H., Sugaya, T., and Kitada, S. (2010). Genetic effects of hatchery fish on wild populations in red sea bream Pagrus major (Perciformes, Sparidae) inferred from a partial sequence of mitochondrial DNA. J. Fish Biol. 77, 2123–2136. doi: 10.1111/j.1095-8649.2010.02826.x
Han, C. H., Ma, H. T., Jiang, H. B., Liu, Y., Han, H. Z., and Wang, F. (2016). Isolation of microsatellite markers for black rockfish Sebastes schlegelii and genetic diversity of wild and cultured populations. Oceanol. Limnol. Sin. 47, 213–220.
Jia, C. F. (2014). Development of Microsatellite DNA Markers and Population Genetics Assessment for the Black Rockfish, Sebastes schlegelii. Shanghai: Shanghai Ocean University.
Jombart, T. (2008). Adegenet: a R package for the multivariate analysis of genetic markers. Bioinformatics 24, 1403–1405. doi: 10.1093/bioinformatics/btn129
Jones, O. R., and Wang, J. (2010). COLONY: a program for parentage and sibship inference from multilocus genotype data. Mol. Ecol. Resour. 10, 551–555. doi: 10.1111/j.1755-0998.2009.02787.x
Kang, K. M., and Shin, H. O. (2006). Movement ranges and routes of black rockfish Sebastes schlegelii in summer and autumn from acoustic telemetry. Fish. Aquat. Sci. 9, 91–96. doi: 10.5657/fas.2006.9.2.091
Kitada, S. (2018). Economic, ecological and genetic impacts of marine stock enhancement and sea ranching: a systematic review. Fish Fish. 19, 511–532. doi: 10.1111/faf.12271
Laikre, L., Schwartz, M. K., and Waples, R. S. (2010). Compromising genetic diversity in the wild: unmonitored large-scale release of plants and animals. Trends Ecol. Evol. 25, 520–529. doi: 10.1016/j.tree.2010.06.013
Larkin, M. A., Blackshields, G., Brown, N. P., Chenna, R., McGettigan, P. A., McWilliam, H., et al. (2007). Clustal W and clustal X version 2.0. Bioinformatics 23, 2947–2948. doi: 10.1093/bioinformatics/btm404
Leber, K. M. (2013). “Marine fisheries enhancement, coming of age in the new millennium,” in Sustainable Food Production, eds. P. Christou, R. Savin, B. A. Costa-Pierce, I. Misztal, and C. B. A. Whitelaw (New York, NY: Springer Science), 1139–1157.
Lorenzen, K., Beveridge, M., and Mangel, M. (2012). Cultured fish: integrative biology and management of domestication and interactions with wild fish. Biol. Rev. 87, 639–660. doi: 10.1111/j.1469-185x.2011.00215.x
Lü, H., Zhang, X., Xi, D., and Gao, T. (2014). Use of calcein and alizarin red S for immersion marking of black rockfish Sebastes schlegelii juveniles. Chin. J. Oceanol. Limnol. 32, 88–98. doi: 10.1007/s00343-014-3022-9
Luikart, G., and Cornuet, J. M. (1998). Empirical evaluation of a test for identifying recently bottlenecked populations from allele frequency data. Conserv. Biol. 12, 228–237. doi: 10.2307/2387479
Luo, G., and Zhang, Z. D. (2014). Current situation of the development in stock enhancement of China. China Fish. 12, 37–39.
Nagasawa, T., and Domon, K. (1997). The early life history of kurosoi, Sebastes schlegelii (Scorpaenidae), in the sea of Japan. Ichthyol. Res. 44, 237–248. doi: 10.1007/bf02678703
Nakagawa, M. (2008). Studies on the stock enhancement technology of the black rockfish Sebastes schlegelii. Bull. Fish. Res. Agency 25, 223–287.
Nakagawa, M., Okouchi, H., Adachi, J., Hattori, K., and Yamashita, Y. (2007). Effectiveness of stock enhancement of hatchery-released black rockfish Sebastes schlegelii in Yamada Bay-evaluation by a fish market survey. Aquaculture 263, 295–302. doi: 10.1016/j.aquaculture.2006.10.02
Nihira, A., and Takashima, Y. (1999). Growth and movement of the rockfish, Sebastes schlegelii, released in the coastal waters of Kashimanada. Bull. Ibaraki. Pref. Fish. Exp. Stn. 37, 1–8. doi: 10.1016/j.jhazmat.2019.120861
Noda, T., Nakagawa, M., Nagakura, Y., and Okouchi, H. (2012). Migration of released black rockfish Sebastes schlegelii in the Miyako Bay analyzed using fish market survey data. Aquac. Sci. 60, 65–71.
Peakall, R., and Smouse, P. (2012). GenAlEx 6.5: genetic analysis in Excel. Population genetic software for teaching and research-an update. Bioinformatics 28, 2537–2539. doi: 10.1093/bioinformatics/bts460
Romo, M. D. M. O.-V., Aritaki, M., and Taniguchi, N. (2006). Pedigree analysis of recaptured fish in the stock enhancement program of spotted halibut Verasper variegates. Fisheries Science 72, 48–52. doi: 10.1111/j.1444-2906.2006.01115.x
Rozas, J., Sánchez-DelBarrio, J. C., Messeguer, X., and Rozas, R. (2003). DnaSP, DNA polymorphism analyses by the coalescent and other methods. Bioinformatics 19, 2496–2497. doi: 10.1093/bioinformatics/btg359
Ryman, N., Jorde, P. E., and Laikre, L. (1995). Supportive breeding and variance effective population size. Conserv. Biol. 9, 1619–1628. doi: 10.1046/j.1523-1739.1995.09061619.x
Ryman, N., and Laikre, L. (1991). Effects of supportive breeding on the genetically effective population size. Conserv. Biol. 5, 325–329. doi: 10.1016/0006-3207(92)90802-t
Saitoh, K., and Rousset, F. (2008). Genepop: a complete re-implementation of the genepop software for Windows and Linux. Mol. Ecol. Resour. 8, 103–106. doi: 10.1111/j.1471-8286.2007.01931.x
Saitou, N., and Nei, M. (1987). The neighbour-joining method: a new method for reconstructing evolutionary trees. Mol. Biol. Evol. 4, 406–425. doi: 10.1093/oxfordjournals.molbev.a040454
Slatkin, M., and Hudson, R. R. (1991). Pairwise comparisons of mitochondrial DNA sequences in stable and exponentially growing populations. Genetics 129, 555–562.
Szpiech, Z. A., Jakobsson, M., and Rosenberg, N. A. (2008). ADZE: a rarefaction approach for counting alleles private to combinations of populations. Bioinformatics 24, 2498–2504. doi: 10.1093/bioinformatics/btn478
Tamura, K., Peterson, D., Peterson, N., Stecher, G., Nei, M., and Kumar, S. (2011). MEGA5: molecular evolutionary genetics analysis using maximum likelihood, evolutionary distance, and maximum parsimony methods. Mol. Biol. Evol. 28, 2731–2739. doi: 10.1093/molbev/msr121
Van Oosterhout, C., Hutchinson, W. F., Wills, D. P. M., and Shipley, P. (2004). MICRO-CHECKER: software for identifying and correcting genotyping errors in microsatellite data. Mol. Ecol. Notes 4, 535–538. doi: 10.1111/j.1471-8286.2004.00684.x
Wang, J. (2007). Triadic IBD coefficients and applications to estimating pairwise relatedness. Genet. Res. 89, 135–153. doi: 10.1017/S0016672307008798
Wang, J. (2009). A new method for estimating effective population sizes from a single sample of multilocus genotypes. Mol. Ecol. 18, 2148–2164. doi: 10.1111/j.1365-294x.2009.04175.x
Wang, J. (2011). COANCESTRY: a program for simulating, estimating and analyzing relatedness and inbreeding coefficients. Mol. Ecol. Res. 11, 141–145. doi: 10.1111/j.1755-0998.2010.02885.x
Wang, W. Q., Zhang, Y., Liu, M. X., Wu, Z. H., Wang, L. J., Zi, J., et al. (2012). Microsatellite analysis of genetic diversity in four wild stocks of black rockfish Sebastes schlegelii. Mar. Sci. 36, 10–16.
Waples, R. S., and Do, C. (2010). Linkage disequilibrium estimates of contemporary Ne using highly variable genetic markers: a largely untapped resource for applied conservation and evolution. Evol. Appl. 3, 244–262. doi: 10.1111/j.1752-4571.2009.00104.x
Ward, R. D. (2006). The importance of identifying spatial population structure in restocking and stock enhancement programmes. Fish. Res. 80, 9–18. doi: 10.1016/j.fishres.2006.03.009
Xu, B. D., and Jin, X. S. (2005). Variations in fish community structure during winter in the southern Yellow Sea over the period 1985-2002. Fish. Res. 71, 79–91. doi: 10.1016/j.fishres.2004.07.011
Yasuike, M., Noda, T., Fujinami, Y., and Sekino, M. (2013). Tri-, tetra-and pentanucleotide-repeat microsatellite markers for the Schlegel’s black rockfish Sebastes schlegelii: the potential for reconstructing parentages. Conserv. Genet. Resour. 5, 577–581. doi: 10.1007/s12686-012-9856-6
Yoshida, K., Nakagawa, M., and Wada, S. (2005). Multiplex PCR system applied for analysing microsatellite loci of Schlegel’s black rockfish, Sebastes schlegelii. Mol. Ecol. Note 5, 416–418. doi: 10.1111/j.1471-8286.2005.00945.x
Zhang, H., Yanagimoto, T., Zhang, X., Song, N., and Gao, T. (2016). Lack of population genetic differentiation of a marine ovoviviparous fish Sebastes schlegelii in Northwestern Pacific. Mitochondrial DNA 27, 1748–1754. doi: 10.3109/19401736.2014.963797
Keywords: Sebastes schlegelii, mitochondrial DNA, microsatellite DNA, genetic variation, stock enhancement, Lidao Bay
Citation: Wang L, Wu Z, Wang Y, Liu M, Song A, Liu H and You F (2020) Genetic Assessment of a Black Rockfish, Sebastes schlegelii, Stock Enhancement Program in Lidao Bay, China Based on Mitochondrial and Nuclear DNA Analysis. Front. Mar. Sci. 7:94. doi: 10.3389/fmars.2020.00094
Received: 07 October 2019; Accepted: 04 February 2020;
Published: 27 February 2020.
Edited by:
Dongdong Xu, Marine Fisheries Research Institute of Zhejiang, ChinaCopyright © 2020 Wang, Wu, Wang, Liu, Song, Liu and You. This is an open-access article distributed under the terms of the Creative Commons Attribution License (CC BY). The use, distribution or reproduction in other forums is permitted, provided the original author(s) and the copyright owner(s) are credited and that the original publication in this journal is cited, in accordance with accepted academic practice. No use, distribution or reproduction is permitted which does not comply with these terms.
*Correspondence: Feng You, eW91ZmVuZ0BxZGlvLmFjLmNu