 Erinn M. Muller
 Constance Sartor
 Nicholas I. Alcaraz
 Robert van Woesik
- 1Coral Health and Disease Program, Mote Marine Laboratory, Sarasota, FL, United States
- 2Coral Genetics Program, University of Guam Marine Laboratory, Mangilao, GU, United States
- 3Florida Fish and Wildlife Research Institute, St. Petersburg, FL, United States
- 4Institute for Global Ecology, Florida Institute of Technology, Melbourne, FL, United States
The stony-coral-tissue-loss disease (SCTLD) has recently caused widespread loss of coral along the Florida reef tract. Yet little is known about where, when, and why this coral disease outbreak occurred. In the absence of a definitive pathogen, it is essential to characterize the ecology of the disease and document the spatio-temporal dynamics of the outbreak. Here, we investigate the epizootiology of the SCTLD at multiple spatial and temporal scales along the Florida reef tract from May 2014 to December 2017. We used spatial interpolation to characterize the disease hotspots, Ripley’s K analysis to examine contagion, a spatio-temporal model to assess rates of spread, and a Bayesian model to examine ecological and environmental covariates that may have influenced the occurrence and severity of the outbreak. Our results show that the disease affected reefs at the scale of hundreds of kilometers, with significant clusters of up to 140 km. The epizootic clearly followed a contagion model, suggesting that the disease was highly contagious. The rate of spread of the epizootic was linear and moved slightly faster to the north (∼100 m d–1) than to the south (∼92 m d–1). The difference in rate of spread between the north and south direction may indicate currents facilitated transmission. The analyzed dataset showed that the epizootic affected at least 19 coral species and that deep and diverse sites were at greater risk of the disease than shallow and low diversity sites.
Introduction
Over the last four decades, diseases have caused considerable declines in coral populations in the Caribbean. Indeed, Florida’s coral reefs have recently experienced a multi-year disease-related mortality event that has resulted in massive die-offs of several reef-building coral species (Precht et al., 2016; Walton et al., 2018). Termed the stony-coral-tissue-loss disease (SCTLD), this disease affects at least 24 species of scleractinian coral, including major reef-building coral species and species listed as endangered by the International Union for Conservation of Nature Red List (NOAA, 2018), such as pillar corals (Chan et al., 2019). Yet, little is known about the epizootiology of the SCTLD, including the spatial extent and rate of spread of the disease and the environmental and ecological conditions that are associated with disease outbreaks.
The disease often results in whole colony mortality (Precht et al., 2016; Walton et al., 2018; Rippe et al., 2019). Although a pathogen has not been identified, Meyer et al. (2019) showed several bacteria, within the order Flavobacteriales, were more enriched within SCTLD-diseased coral tissue than within apparently healthy coral tissue. Additionally, a case definition of the disease has been compiled to describe the visual appearance and ecology of SCTLD (NOAA, 2018). Briefly, the gross morphology of SCTLD is described as focal or multifocal, with locally extensive to diffuse areas of acute to subacute tissue loss distributed basally, peripherally, or both. In some cases, tissues bordering areas of chronic tissue loss show indistinct bands (1–5 cm) of pallor, progressing to normal pigmentation away from the denuded skeleton. There is also a range in coral susceptibility to SCTLD, categorized as highly susceptible species (e.g., Dendrogyra cylindrus, Dichocoenia stokesii, Meandrina meandrites), moderately susceptible species (e.g., Orbicella spp., Montastraea cavernosa, Siderastrea siderea, Stephanocoenia intersepta), and tolerant species (e.g., Porites spp., Acropora spp.). Because of the limitations in identifying primary pathogens that cause coral diseases (Ritchie, 2006), understanding the basic ecology of such coral disease outbreaks requires a multi-faceted approach.
Spatial epidemiology can provide insight into disease ecology by assessing the spatial extent of a disease outbreak to determine whether a contagious agent causes a disease such as SCTLD. Clustered diseased colonies, or clustered diseased sites, suggest a contagious mode of disease transmission. Alternatively, a spatially random distribution of disease infection suggests that other ecological characteristics, such as genetic susceptibility influences disease dynamics (Muller and van Woesik, 2014). Examining disease clustering can be particularly helpful when putative pathogens are unknown, which is the case for most coral diseases. For example, Lentz et al. (2011) suggested that white-band disease on Acropora palmata at Buck Island Reef National Monument, in Saint Croix, was likely contagious based on the clustered spatial patterns of diseased corals recorded in the field. These types of data can provide managers with the information needed to potentially limit the spread of an outbreak, especially when it occurs within a marine protected area. Assessing temporal dynamics and the rate of spread of a disease can further provide insight into the potential mode of disease transmission and potential disease agents. For example, Zvuloni et al. (2009) used spatio-temporal modeling to show that black-band disease within the Gulf of Eilat was likely transmitted as flocculent from one colony to the next through the water column.
Yet interactions among the hosts, pathogens, and the environment all influence disease dynamics. Compromised coral hosts are often associated with disease outbreaks (Lafferty and Holt, 2003; Lesser et al., 2007; Muller et al., 2008; Miller et al., 2009; Muller and van Woesik, 2012; Brandt et al., 2013). For example, bleached corals showed a positive association with disease occurrence and severity (Muller et al., 2008) and disease outbreaks often follow bleaching events in the Caribbean (Brandt and Mcmanus, 2009; Miller et al., 2009; Brandt et al., 2013). The occurrence and severity of several coral diseases are positively associated with environmental conditions such as water temperatures and nutrient concentrations, and therefore these diseases are most likely the result of interactions between the environment and the pathogenic agents. Black-band disease occurs most often when water temperatures are above 25°C in the Florida Keys (Kuta and Richardson, 1996) and above 27°C in the US Virgin Islands, after which prevalence increases exponentially (Muller and van Woesik, 2011). High nutrients are also associated with an increase in occurrence and severity of several different coral diseases (Kuta and Richardson, 2002; Kaczmarsky et al., 2005; Kaczmarsky and Richardson, 2011; Redding et al., 2013; Vega Thurber et al., 2014).
Ecological factors such as the density and diversity of hosts can also influence disease dynamics. For example, Bruno et al. (2007) showed that the prevalence of white syndrome on the Great Barrier Reef, Australia, was associated with thermal stress and high densities of coral colonies. Similarly, the diversity-disease hypothesis suggests that some corals with specialist pathogens suffer elevated severity when the diversity of the host is low (Ward et al., 2006; Aeby et al., 2011). The generalist nature of the SCTLD, however, suggests that this disease outbreak does not follow the characteristics of the diversity-disease hypothesis.
The present study used spatial epidemiology models and analytical tools to examine the progression of SCTLD throughout the Florida reef tract, from 2014 to 2017. We used multiple data sources and focused on large scale (tens of kilometers) spatial dynamics to characterize the: (i) spatial extent of the outbreak throughout the entire Florida reef tract, (ii) spatial pattern of diseased sites, (iii) rate of spread of the disease, and (iv) potential ecological and environmental covariates that influenced the occurrence and severity of SCTLD. The results are relevant to an on-going coral-disease-response effort, which seeks to improve understanding of the scale and severity of the outbreak of SCTLD in the Caribbean in general and in Florida in particular.
Materials and Methods
Coral Disease Data
A total of seven different field-collected datasets were used in this study, including the: (i) Coral Reef Evaluation and Monitoring Project (CREMP; 2014–2017), (ii) CREMP Presence/Absence Data (CREMP P_A; 2016–2017), (iii) Southeast Florida Coral Reef Evaluation and Monitoring Project (SECREMP; 2014–2017), (iv) Florida Reef Resilience Program Disturbance Response Monitoring (FRRP; 2014–2017), (v) Hurricane Irma Rapid Reef Assessment (IRMA; 2017, Viehman et al., 20181), (vi) the Southeast Florida Action Network citizen science program (SEAFAN; 2014–2017), and (vii) the Southern Coral Disease Margin field effort (2017; Neely, 2018). The data included documented coral diseases, coral community metrics [i.e., coral colony density (colonies m–2) and coral species diversity (number of species per survey)], and depth (meters). Most of the datasets provided these metrics, although they were collected at different temporal and spatial scales. Every dataset provided at least data on the presence or absence of SCTLD within each survey, or provided detailed disease metrics such as the species affected and the disease prevalence, which was subsequently compiled into presence/absence data. See Supplementary Document #1 for the metadata and the methodologies and metrics of each dataset. The CREMP, CREMP P_A, SECREMP, FRRP, IRMA, SEAFAN, and the Southern Coral Disease Margin databases were used to create spatial epidemiological maps (Supplementary Figures 1–4). These data were also used to determine the disease front, or the northern and southern leading edges of the outbreak, and were used for the Ripley’s K analyses. The CREMP, SECREMP, and FRRP data were used to analyze the association between the SCTLD data and potential ecological and environmental covariates. Only data that documented disease signs specific to the outbreak of SCTLD in Florida (outlined above) were included in the analysis. Documentation of coral diseases that did not meet the case definition of SCTLD (e.g., black-band disease and dark-spot disease) were removed from the analyses. Additionally, the term, “stony-coral-tissue-loss” disease was not established until the case definition was produced in 2018. Therefore, “white-plague” disease was recorded in the datasets prior to 2018 as a general term used to describe signs of tissue loss on scleractinian corals in Florida.
Spatial Epidemiological Maps
Data were georeferenced and plotted on basemaps within the ArcView GIS® software package. Data on the presence and absence of the SCTLD were linked to the georeferenced dataset to create a suite of spatially interpolated maps of disease probability throughout the Florida reef tract for each year of study, from May 2014 to December 2017. Spatial interpolation, a method used to predict disease prevalence in unsampled localities, was achieved using indicator kriging. A Gaussian semivariogram was used to optimize the range and sill of the model, with a standard neighborhood search. The kriging output was then exported as a raster file and clipped to the extent of the Florida reef tract. These maps identified spatio-temporal disease hotspots for each year, throughout the Florida reef tract. Here we characterize a ‘hotspot’ as a locality that showed higher than 0.5 probability of disease occurrence. Initially, the spatial maps were created using 3-month time intervals, but the data were sparse and the standard errors were high, which resulted in low confidence in the predictions. To overcome these issues, data were amalgamated to examine annual responses, which resulted in reduced standard errors and increased confidence of the interpolation maps.
Testing for Contagion
We tested whether the disease outbreak followed a predictable contagion model, which would indicate that the outbreak was contagious. To do this, we used a modified Ripley’s K analyses for spatial clustering using presence/absence disease data, similar to the analysis in Muller and van Woesik (2012). The spatial distribution of sites with disease were analyzed using the adjusted Ripley’s function, K(r), which was defined as the expected number of sites within a distance (r) from an arbitrary site (Ripley, 1981). The function was normalized by dividing by the mean number of sites per unit area. Therefore, Ripley’s K was calculated as:
where A was the total area of the location, n was the number of diseased sites, and dij was the distance between any two diseased sites i and j. Ir(dij) indicated whether or not there was a diseased site within distance r from site i. Therefore, Ir(dij) had a value of 1 if dij < r, and 0 otherwise. Because the study area was finite, wij represents the portion of the circumference of each circle that falls outside of the previously defined location area (Diggle, 1983).
Ripley’s K analyses identified areas of disease clusters by comparing the spatial distribution of diseased sites against the distribution of all surveyed sites. The Ripley’s K statistic was used to quantify non-random clustering patterns of diseased sites within an area in terms of the degree and spatial scale of each aggregation. The Ripley’s K statistic, however, was standardized to account for the spatial aggregation of susceptible individuals within the study area (see Zvuloni et al., 2009). Using a null model, a randomization technique was applied to determine whether the n diseased sites, found within the sample period, were significantly spatially aggregated, when compared with the aggregation found in the population of all sites. The transformation, referred to as Besag’s L function, was applied to the data, which was calculated as:
With this scaling, sites that had a Poisson spatial distribution would result in the expected value of L(r) = 0. A null distribution for L(r) was generated from a group of n sites and repeated 1,000 times so that L(r) was calculated for each group of n sites for any value of r. These results created a 95% confidence interval (CI) for L(r). L(r) was then calculated using only diseased sites to produce a new value, LD(r), which was then compared with the L(r) null envelope. Any value that fell outside of the envelope indicated that either spatial clumping [above the L(r)] or over-dispersion [below the L(r)] of diseased sites were apparent. These analyses tested for significant spatial clustering compared with all sites surveyed, but also determined the radius of the clusters. All data were analyzed in the program R (R Development Core Team, 2019) using the ‘spatstat’ package (Baddeley and Turner, 2005).
Spatio-Temporal Model
To determine the spatial and temporal patterns of the SCTLD, the northern and southern leading edges of the disease were determined every 3 months, from September 2014 to June 2018. Although the databases identified above only recorded data until December of 2017, the Mote Marine Laboratory field team was particularly active in 2018 and provided information on the location of the disease front for the two additional time quarters in 2018. We utilized this information to expand our spatial-temporal model to encompass the first half of 2018. Unfortunately, the quarterly data on the northern boundary was sparse and therefore only annually-identified-disease front data were used for the northern analysis of disease spread.
Geographical coordinates were used to define the leading edge of the disease using the ‘sp’ package (Pebesma and Bivand, 2005) in R (R Development Core Team, 2019). We calculated the Euclidean distances between each quarterly- or annually-identified disease front using the package ‘geosphere’ in R (Hijmans, 2017). We characterized the relationship between the time interval between recordings as the predictor variable and the distance (km) the disease had potentially traveled as the response variable. We tested whether the relationship followed either a non-linear function, similar to that reported at the onset of the outbreak in Precht et al. (2016), or a linear function. We used the package ‘nls2’ in R (Grothendieck, 2013) to find the coefficients (a and z) for the non-linear model: Distance the disease had traveled (km) = a ∗ Timez. We used the linear model to identify the coefficients (a and b) for the linear equation: Distance the disease had traveled (km) = a + b∗Time.
Environmental and Ecological Covariates
The average water temperature, chlorophyll-a concentrations (used as a proxy for nutrients), depth, coral colony density, and coral species diversity at each site were used to determine associations between environmental and ecologically relevant covariates and disease occurrence and severity (i.e., number of diseased corals). The average monthly sea-surface temperatures and chlorophyll-a concentrations were obtained from the Moderate Resolution Imaging Spectroradiometer (MODIS-Aqua) satellite sensor. Products were gridded at 1-km resolution to an equidistant cylindrical projection. Daily Level-2 overpass files from the MODIS-Aqua satellite sensor covering the study area were obtained from National Aeronautics and Space Administration’s Ocean Biology Processing Group and subsequently gridded to an equidistant cylindrical projection and binned to monthly intervals at the University of South Florida. Prior to binning, masks were applied to remove suspect pixels based on cloud cover, stray light, and high-sun glint. Monthly mean raster files were created using the mosaic operator of the Graph Processing Tool contained in the SNAP software package2. These monthly raster files were imported into ArcMap 10.4.1 and using the Focal Statistics tool (Spatial Analyst), cells were averaged within a rectangular neighborhood, ignoring ‘NA’ land values. The chlorophyll-a concentrations and sea-surface temperature values were extracted from the output raster files for each field-collection site using the Extract Values to Points tool. The monthly chlorophyll-a concentrations and sea-surface temperature values were then paired with each coral-disease survey site and amalgamated into a single dataset. Some sea-surface temperature and chlorophyll-a data were absent nearshore. Additionally, the chlorophyll-a product was contaminated by bottom reflectance in shallow areas of the Florida Keys. To account for these potential issues, the data were visually assessed, and obvious outliers were removed. The site depth, the density of coral colonies, and the diversity of coral species were obtained from the various field-collected datasets identified above.
We applied a negative binomial generalized linear mixed effects model within a Bayesian framework in ‘rjags’ (Plummer, 2019) to determine whether there were particular environmental variables or ecological factors that influenced the likelihood of SCTLD. We ran an additional model using the density of diseased colonies as the response variable using a Poisson distribution in a similar Bayesian framework.
Results
Coral Disease Data
The two datasets that recorded the number of diseased colonies for each coral species (CREMP and FRRP) indicated that at least 19 coral species showed signs of tissue loss that were consistent with SCTLD during the study period (Figure 1A). The highest frequency of disease occurred on Montastraea cavernosa, Siderastrea siderea, Orbicella faveolata, Stephanocoenia intersepta, Agaricia agaricites, and O. franksi (Figure 1A). The species with the highest average prevalence per survey included M. cavernosa, Dichocoenia stokesii, Pseudodiploria strigosa, O. faveolata, and Meadrina meandrites (Figure 1B).
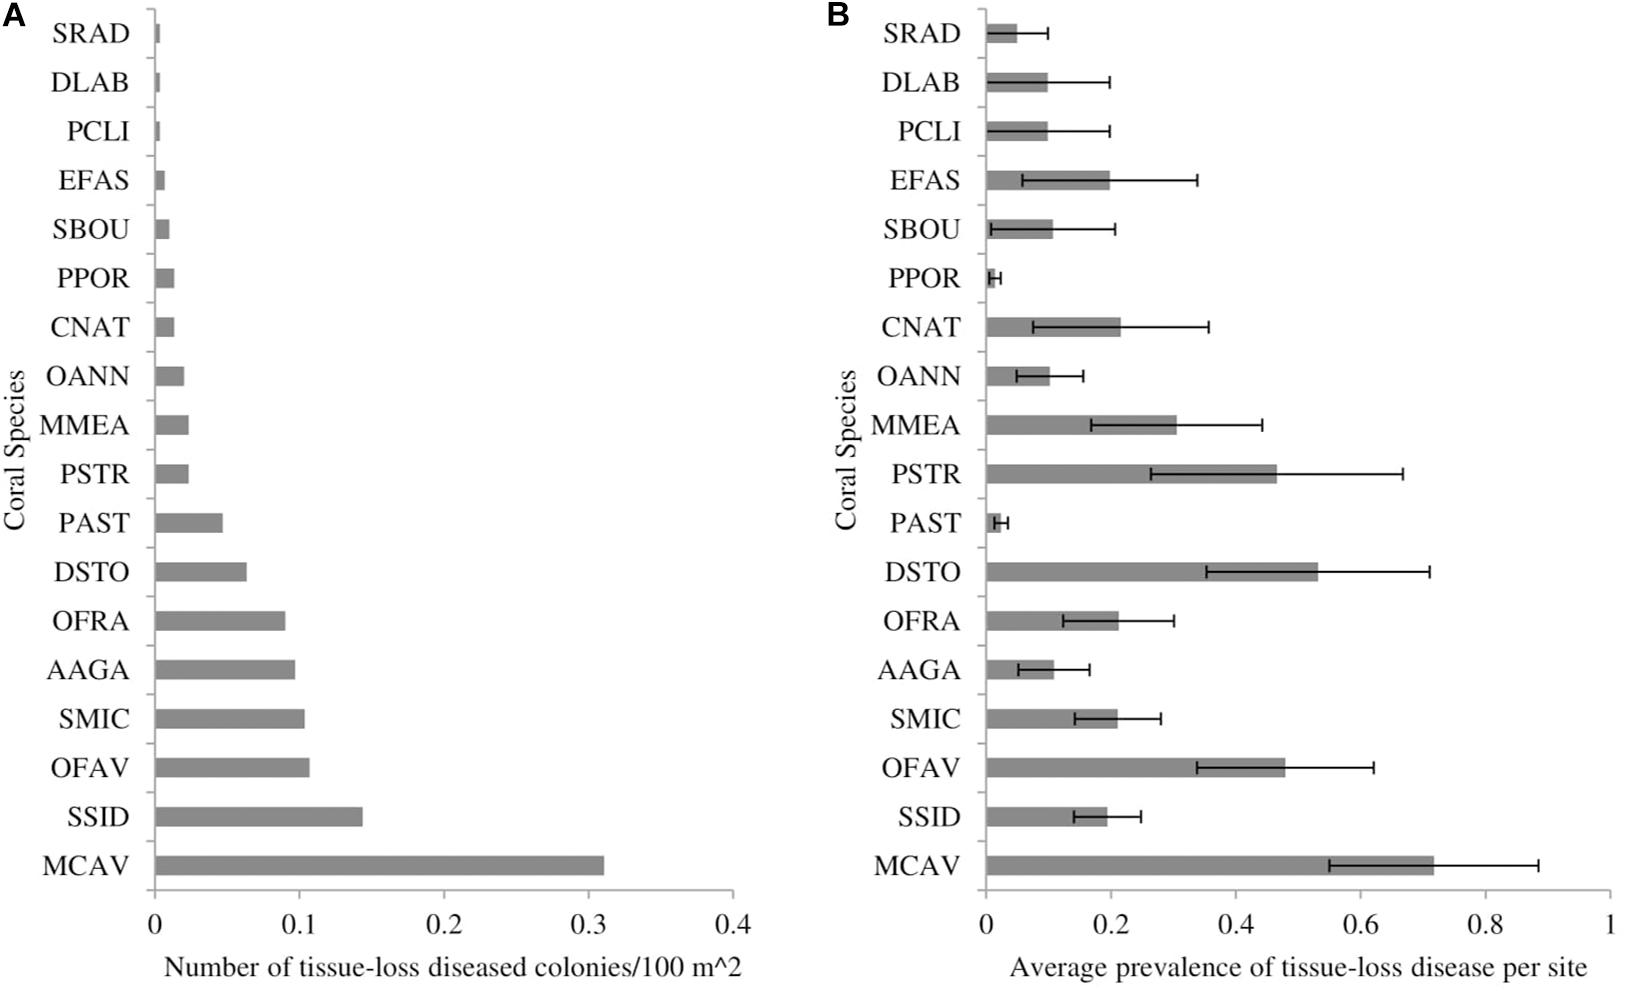
Figure 1. The (A) number of coral colonies showing signs of stony-coral-tissue-loss disease per 100 m2 of surveyed area and (B) average prevalence of stony-coral-tissue-loss disease from May 2014 to December 2017 throughout the Florida reef tract, separated by coral species. Prevalence was calculated as the number of diseased colonies per species divided by the total number of colonies per species. Error bars represent the standard error of the mean. SRAD: Siderastrea radians, DLAB: Diploria labyrinthiformes, PCLI: Pseudodiploria clivosa, EFAS: Eusmilia fastigiata, SBOU: Solenastrea bournoni, PPOR: Porites porites, CNAT: Colpophyllia natans, OANN: Orbicella annularis, MMEA: Meandrina meandrites, PSTR: Pseudodiploria strigosa, PAST: Porites astreoides, DSTO: Dichocoenia stokesii, OFRA: Orbicella franksi, AAGA: Agaricia agaricites, SMIC: Stephanocoenia michelini/intersepta, OFAV: Orbicella faveolata, SSID: Siderastrea siderea, MCAV: Montastraea cavernosa.
Spatial Epidemiological Maps
The 2014 map showed high spatial variability of diseased sites throughout the Florida reef tract (Supplementary Figure 1). There was a hotspot within the northern part of Broward County, which was a consequence of four sites with high disease prevalence that clustered (Figure 2A). The 2014 map also indicated that there was some disease activity in the Florida Keys and in the Dry Tortugas, but these disease events were most likely background levels, unrelated to the SCTLD epizootic (see Supplementary Figure 1 for large, detailed maps). The 2015 map indicated a strong presence of the disease outbreak offshore of Broward County, along the southeast coast of the Florida mainland (Figure 2B). There was also a hotspot of disease activity offshore of Biscayne Bay in 2015 that ranged from Key Biscayne to Elliott Key (Figures 2B, SB). There was a strong disease hotspot in 2016 along the northern boundary of Broward County, extending up to the northern parts of Palm Beach County (Figure 2C). There was also a hotspot within the upper Florida Keys, most likely related to the outbreak of SCTLD (Supplementary Figure 3). A disease hotspot also appeared in the Dry Tortugas, but again was likely not related to the present epizootic event, as local scientists documented the ephemeral nature of these geographically isolated outbreaks (Supplementary Figure 3). In 2017, the disease front progressed south into the middle Florida Keys, creating a relatively continuous hotspot of activity (Figure 2D). Reports collected in 2017 indicated that the disease had reached some of the western-most reefs of the middle Florida Keys by the end of the year. Anecdotally, the disease reached the northern-most section of the Florida reef tract during 2017, although there was limited data from that region in 2017 (see Supplementary Document #2 and Supplementary Figures 1–4 for detailed maps of South Florida, the Florida Keys region, and the entire Florida reef tract from 2014 to 2017).
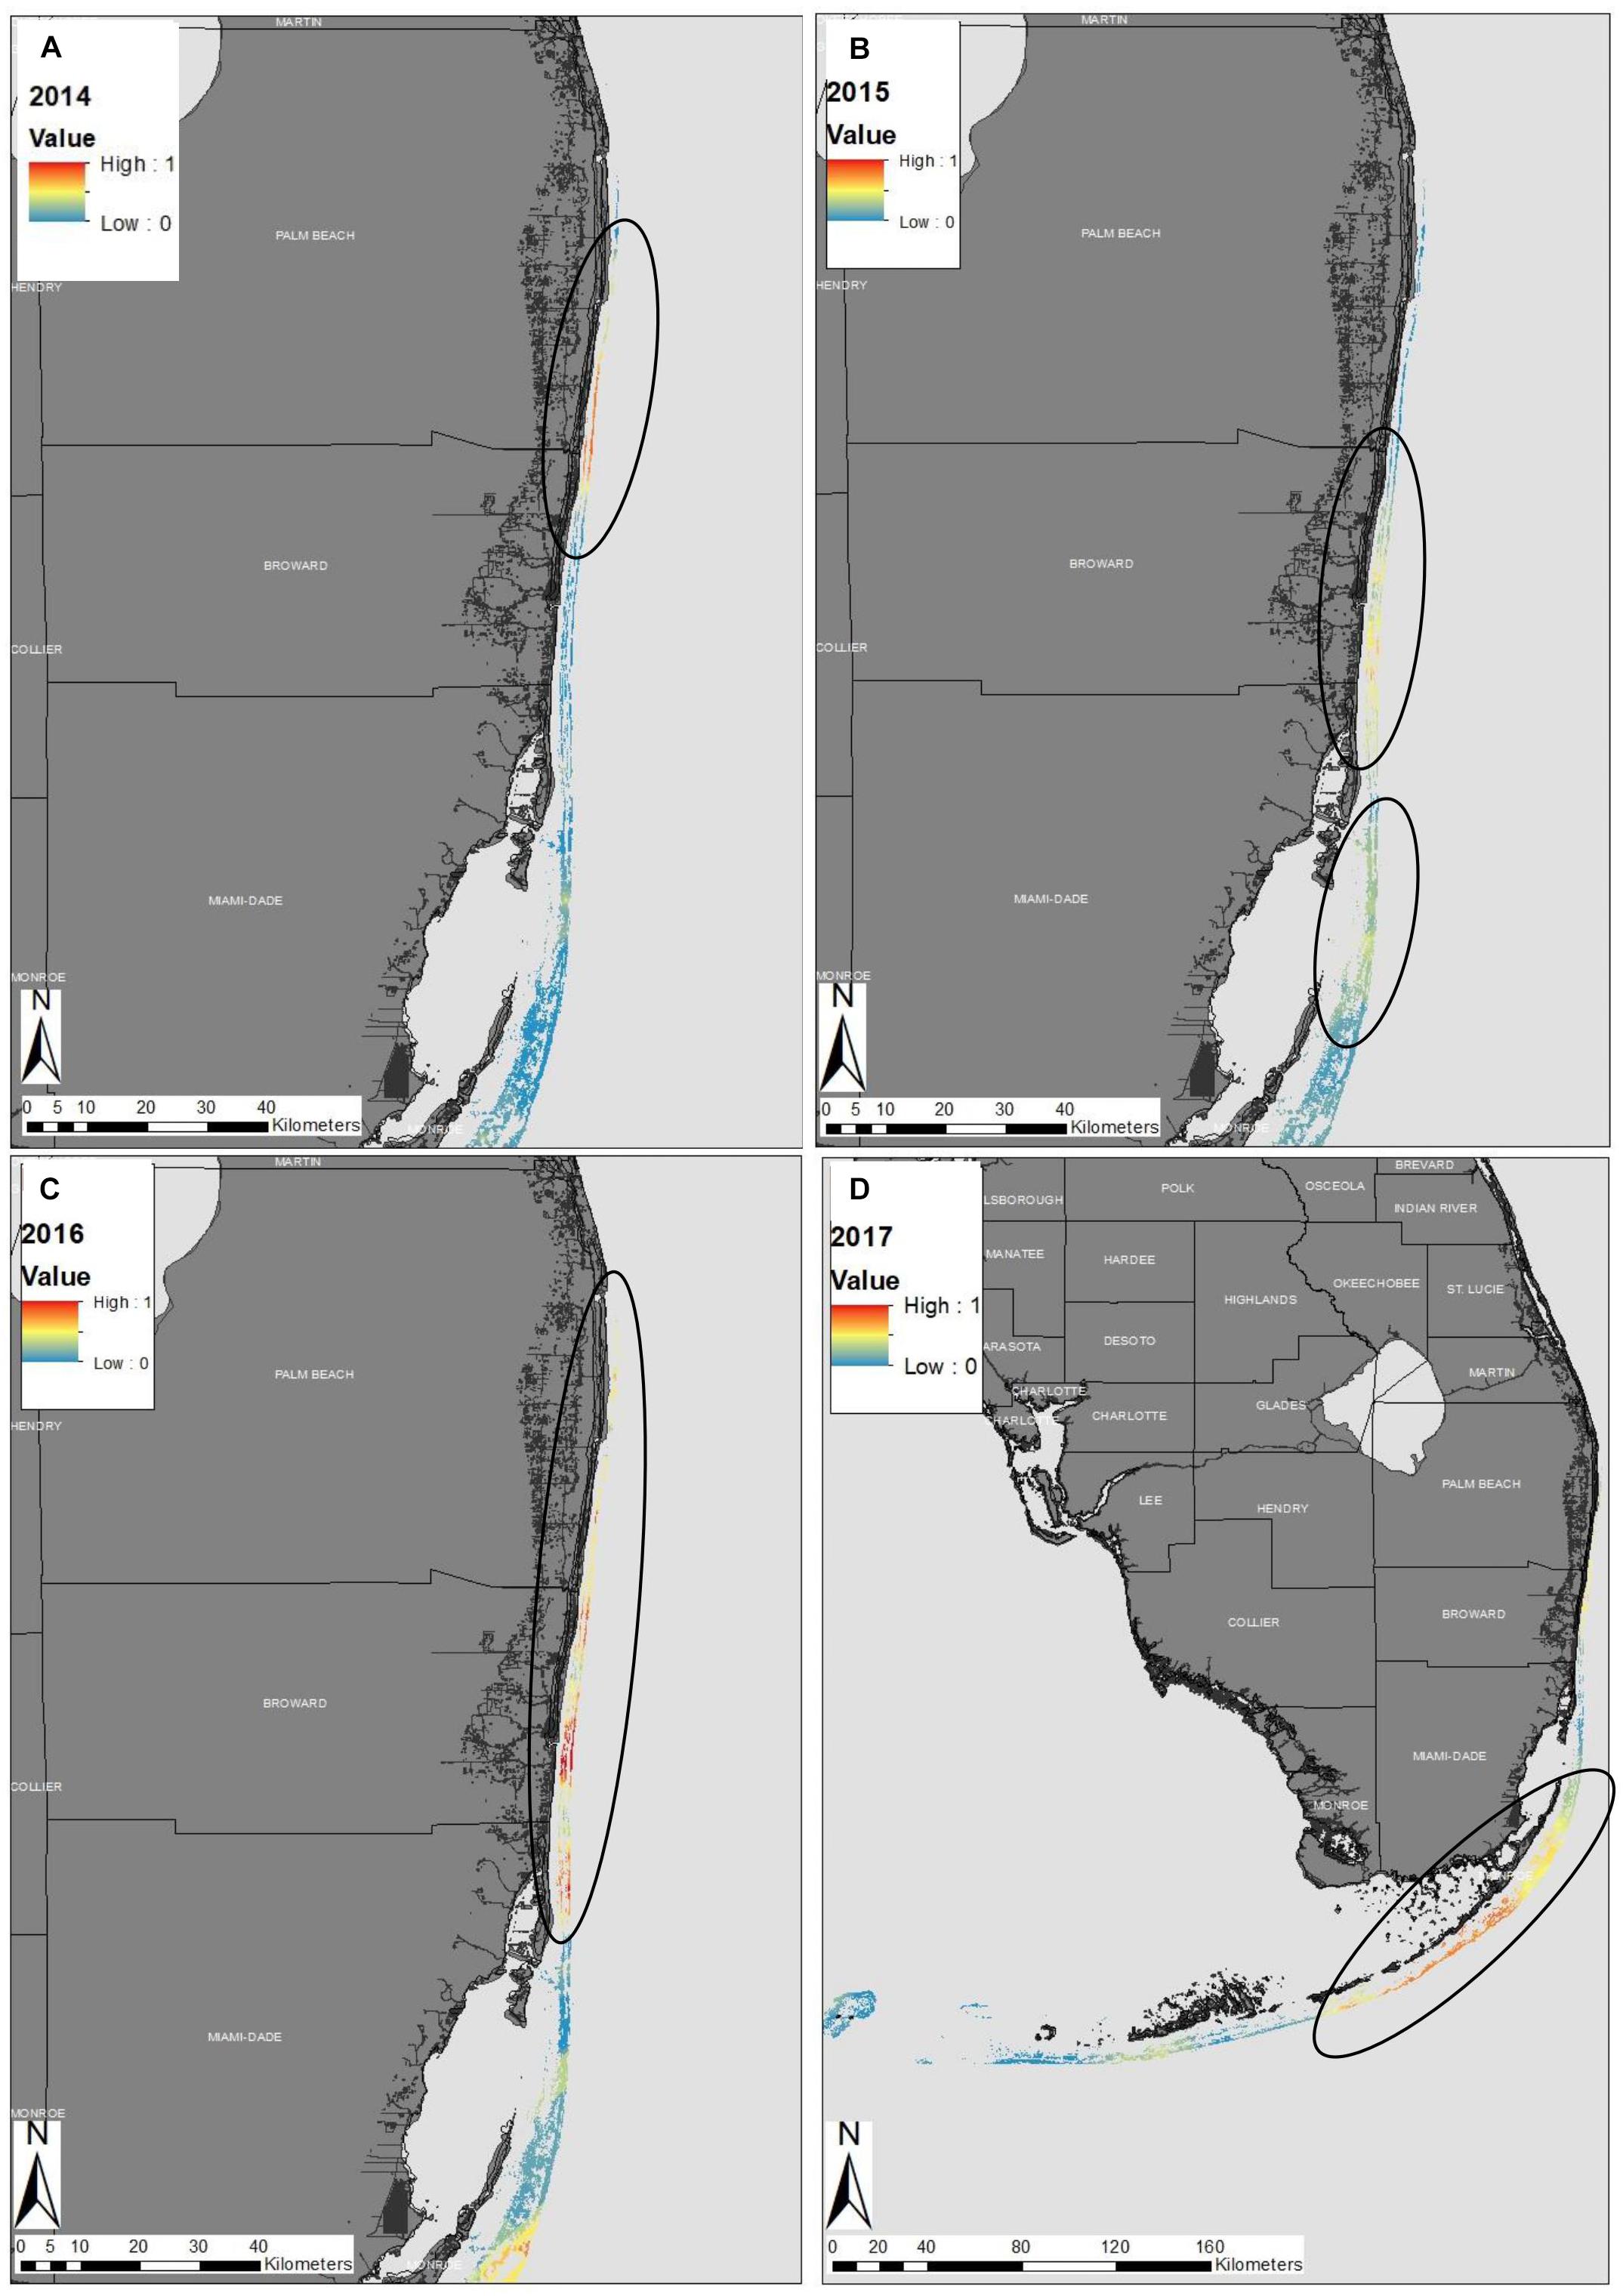
Figure 2. Epidemiological probability maps of the stony-coral-tissue-loss disease outbreak in southeastern Florida in (A) 2014, (B) 2015, (C) 2016, and (D) throughout the entire Florida reef tract in 2017. Colors along the reef denote the probability of disease presence within the Florida reef tract. Warm colors represent high probability of the stony-coral-tissue loss-disease and cool colors represent low disease probability. Black circles represent ‘hotspots’ within the reef discussed within the text. The disease probability map was created using indicator kriging in ArcGIS software.
Testing for Contagion
The Ripley’s K cluster analyses showed significant clustering of diseased sites, although the radius of the cluster varied considerably through time (Figure 3). Results from the 2014 data showed a small cluster, with a radius of ∼21 km. These results suggest an approximate 42 km diameter-wide cluster of disease activity during 2014. In 2015 and 2016, however, significant clustering was detected throughout the range of the study area. The Besag’s L values exceeded the null distribution from a radius of approximately 1 km to a radius of ∼75 km, although peak clustering occurred at 35 km in 2015 and at 40 km in 2016. In 2017, the disease clustering was more focused and less widespread than in 2015 and in 2016. In 2017, the radius of the significant cluster ranged from 1 to 20 km. These results reflect the widespread nature of the disease outbreak during 2015 and 2016, as the disease impacted reefs over 140 linear km, from southern Florida into the northern Florida Keys. In 2017, the more focused disease clusters revealed that the disease outbreak had already passed through the northern reefs and through the upper Florida Keys, and was mainly affecting the middle Florida Keys region.
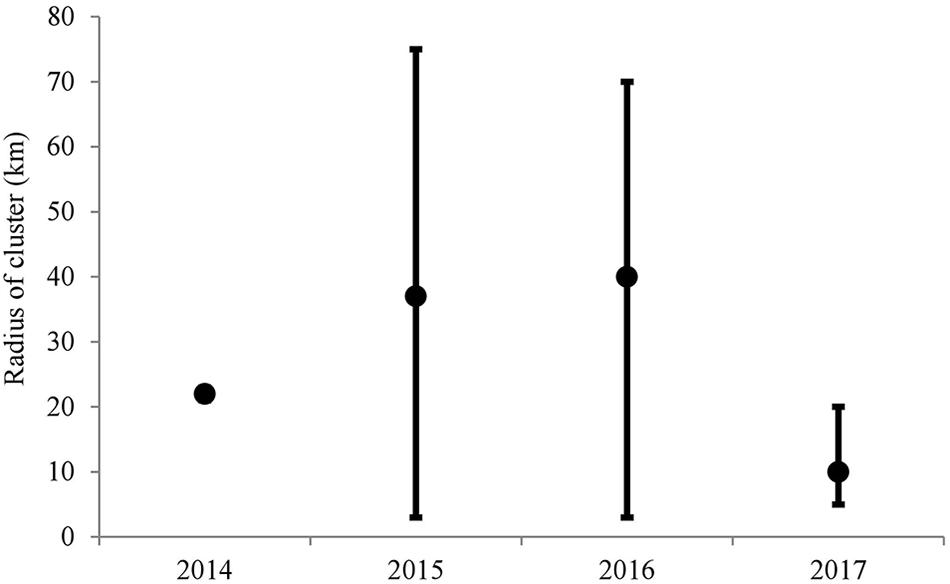
Figure 3. Results of the Ripley’s K analyses of sites surveyed throughout the Florida reef tract from May 2014 to December 2017. The black dots represent the highest Besag’s L value found above the null distribution. The error bars represent the range of values of Besag’s L located above the null distribution.
Spatio-Temporal Model
There was a significant linear relationship between the distance that the disease front traveled and time, for both the northern and southern disease fronts (north: R2 = 0.91, p = 0.031; south: R2 = 0.80, p = 0.003; Figures 4A,B). The rate of spread was slightly faster along the northern reefs than along the southern and western reefs of the Florida Keys. The rate of disease progression determined from the equation of the linear models, indicates that the disease spread at ∼100 m per day northward and ∼92 m per day southward. The test to determine whether the rate of spread followed an exponential relationship was not significant, for either the northern or southern directional spread (north: p = 0.064; south: p = 0.108).
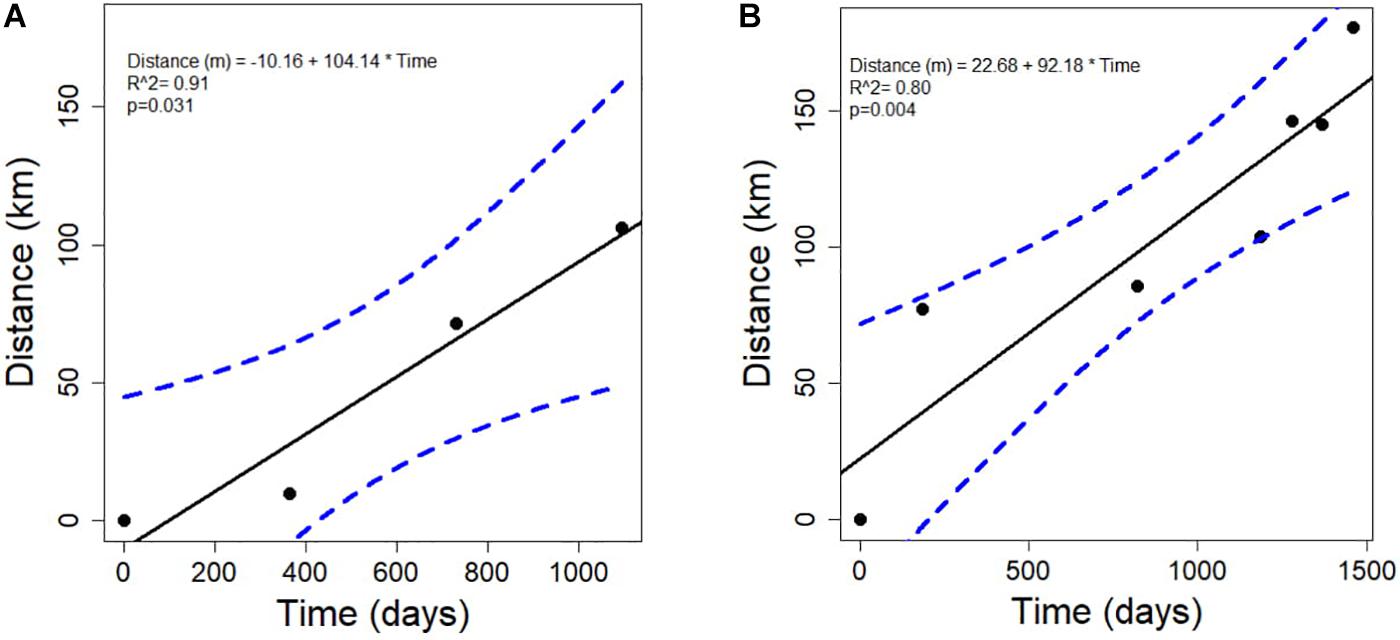
Figure 4. The relationship between the time in days and the distance in kilometers that the stony-coral-tissue-loss disease progressed along the (A) north (annual points) and the (B) south (quarterly points) after the initial outbreak occurred in 2014 until June 2018.
Environmental and Ecological Covariates
During the 2014–2017 time period, the sea-surface temperatures throughout the Florida reef tract ranged from 22.4°C (in 2015) to 32.5°C (also in 2015), with an average of 29.30°C (±0.04°C SE). In addition, the chlorophyll-a concentrations ranged from 0.12 to 9.59 mg/l with an average of 1.40 (±0.02 mg/l SE). Depth of sites ranged from 0.9 to 26.1 m with an average depth of 8.5 m (±0.15 m). There were, on average, 10 species of corals (±0.14 SE) within the sites surveyed from 2014 to 2017. The surveys also showed that the average number of colonies were approximately 3.97 (±0.11 per m2) and the average percentage cover of stony corals, according to the CREMP dataset, was 6.0 ± 0.1%.
Of the variables tested, two showed a significant association with the presence or absence of disease (Figure 5A). Sites with disease had higher coral diversity and had greater depth than sites without disease. The same two variables also were significantly related to the density of colonies with disease (Figure 5B). The total densities of coral colonies were not significantly related to the presence of SCTLD nor related to the density of diseased colonies. The average monthly sea-surface temperature and chlorophyll-a concentrations, collected from the MODIS dataset were not significantly related to the presence of the disease (Figure 5A), nor significantly related to the densities of colonies with the disease (Figure 5B).
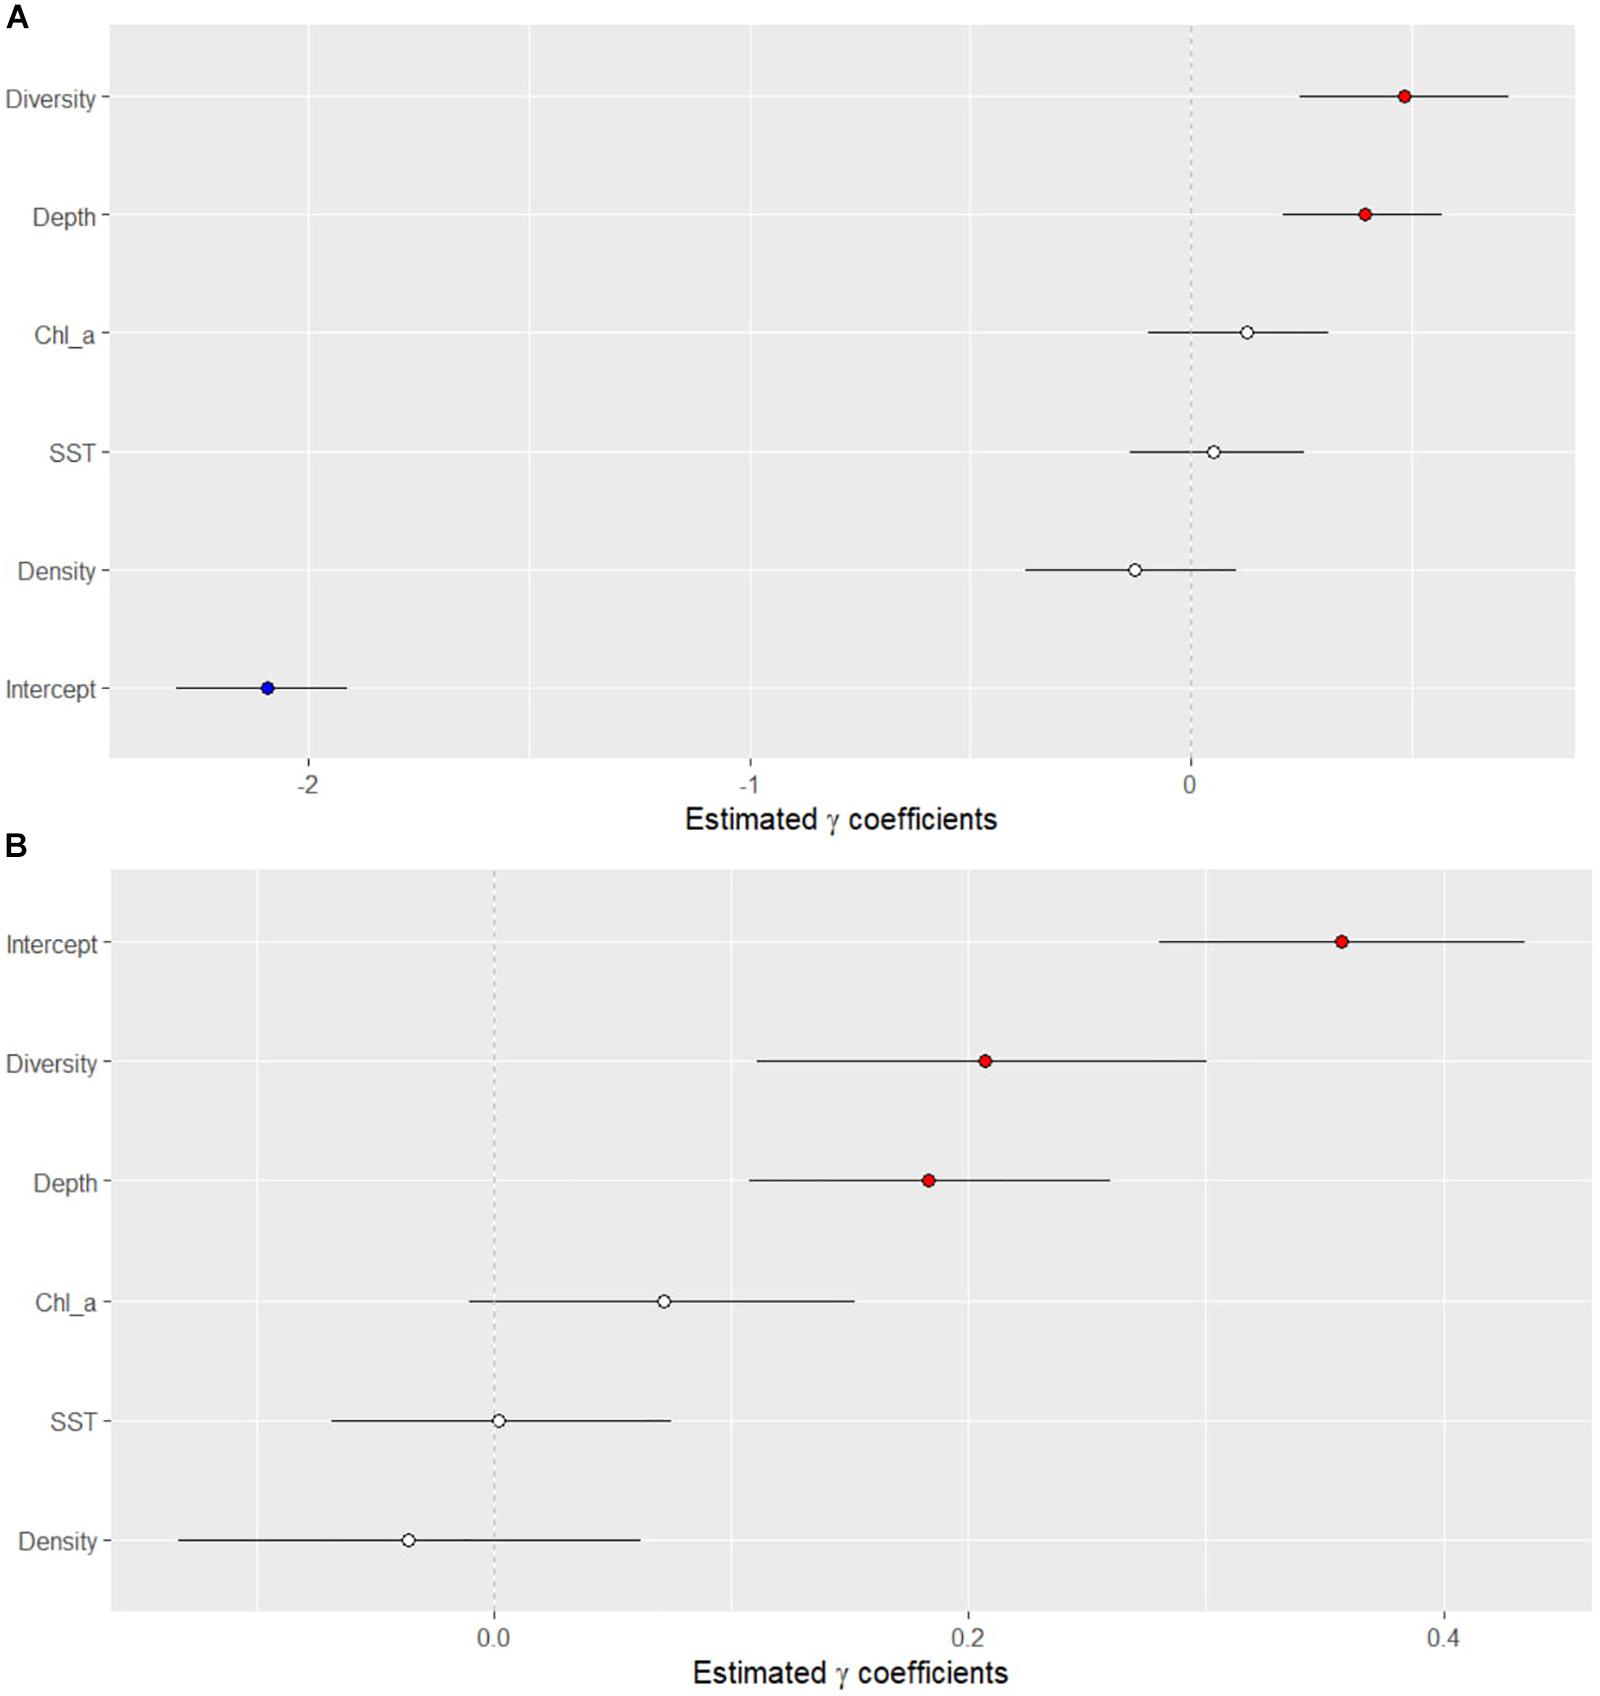
Figure 5. Results of the Bayesian negative binomial generalized linear mixed effects model that tested the association of several ecological and environmental parameters on the (A) presence/absence of the stony-coral-tissue-loss disease and (B) density of diseased corals along the Florida reef tract from 2014 to 2017. Horizontal black lines indicate 95% credible intervals of the posterior distributions of each variable. Values above zero indicate a significant association between the variable and the presence/absence of disease.
Discussion
Previously published literature indicates that the outbreak of SCTLD began off Virginia Key in September 2014 (Precht et al., 2016). According to Precht et al. (2016), the disease outbreak was initially slow to spread from Virginia Key into other regions. However, our data did not pick up a hotspot off Miami-Dade County in 2014. Much of the 2014 data were collected between June to October, and therefore may not have overlapped with the initial disease outbreak. Our 2014 dataset did however show a small disease hotspot offshore of Broward and Palm Beach Counties. Two of these sites had several colonies with tissue loss (i.e., 4 and 8 diseased corals recorded) on colonies of Dichocoenia stokesii, Meandrina meandrites, and Siderastrea siderea, which are some of the most susceptible coral species and are often indicators of SCTLD. However, whether these two sites with disease in 2014 were indicative of an initial outbreak is difficult to determine, especially retrospectively.
For 2015 and 2016, the spread of the disease outbreak showed hotspots expanding along much of south Florida, before a noticeable location of disease activity occurred within the Biscayne/upper Florida Keys region. A very large disease hotspot was identified in 2017 within the upper to middle Florida Keys. The interpolation maps also showed some noticeable disease activity in the Florida Keys and in the Dry Tortugas in 2014 and 2016, but because of their isolated occurrence and ephemeral nature, these occurrences were likely background diseases, unrelated to the epizootic of SCTLD.
The Ripley’s K analyses clearly showed that the epizootic was consistent with a contagious disease. Additionally, the Ripley’s K analyses suggested significant spatial clustering each year, with varying sized clusters appearing through time. The disease was difficult to differentiate in 2014 with the data used in the present study, although significant clustering was evident within a 20-km radius, which reflected the cluster of disease recorded off Broward County. The presence of the outbreak became more obvious and widespread in 2015 and 2016, with clusters up to 140 km in diameter (70-km radius). In 2017, the disease outbreak was more spatially focused, with a 20-km maximum radius. During this time, the disease had already affected the northern extent of the Florida reef tract and was active within the middle Florida Keys. The Ripley’s-K analysis showed a peak level of clustering at ∼10-km radius in 2017. Overall, these results suggest that in order to characterize transmission rates and patterns of spread, research on the SCTLD should focus on scales of tens of kilometers, rather than of a scale of tens of meters, within a reef. The widespread and large-scale impact of this coral disease is unusual and emphasizes the large-range transmission capabilities of SCTLD.
The results of the spatio-temporal model suggest that the disease was moving at a linear rate both north along the southeastern part of the mainland of Florida, and south into the Biscayne Bay and Florida Keys region. Interestingly, we estimated rates of disease spread, both to the north and south, which were slower than previously predicted by Precht et al. (2016). The rates may differ between the studies because the present data encompassed a larger area and studied the disease for a longer period than Precht et al. (2016). The results may also differ because there are different habitat types and more discontinuous reef structure outside of the outbreak area that was reported by Precht et al. (2016). In the present study, the northern path along the coast of Florida (i.e., northward movement) was also slightly faster than the southern path into the Florida Keys. The Florida Current, which flows from south to north along the southeastern coast of Florida, would indeed elicit a more direct and faster mode for transmission than the southern current, characterized by eddy formations that move water south into and along the nearshore environment of the Florida Keys (Kourafalou and Kang, 2012). The Florida Current, on average has a current velocity of ∼6.4 km/hour (i.e., 1–2 m/s; Kourafalou and Kang, 2012), although that velocity varies considerably. Our spatio-temporal model showed that the spread of the SCTLD was approximately 0.1 km per day, which is decoupled from the velocity of the surface currents. Bottom currents, which interact directly with the sediment and benthic habitat, often have a lower speed than surface currents, following a logarithmic vertical velocity profile that reaches nearly 0 m s–1 close to the benthic community (Davis and Monismith, 2011). Bottom currents are also directly associated with sediment movement (Trowbridge and Lentz, 2018). If water currents are the primary vector that spreads the SCTLD, as indicated by recent laboratory experiments (Aeby et al., 2019), then transmission may be associated with the slow-moving bottom currents and the accompanying sediment particles. Indeed, sediments and turbidity associated with dredging have been linked to increases in coral diseases, particularly tissue-loss diseases (Brandt et al., 2013; Pollock et al., 2014; but see Stoddart et al., 2019). Whether sediments influence the transmission of SCTLD has not been tested directly, however, the present study’s results suggest that further research into this potential vector is warranted.
The Bayesian models showed that the diversity of coral species and depth were positively associated with disease presence, suggesting that corals at high diversity reefs and at deep reefs were at greater risk of contracting SCTLD than corals at low diversity reefs and at shallow reefs. Offshore reefs, however, are generally deeper and more diverse than nearshore reefs (Lirman et al., 2003; Wagner et al., 2010). The offshore reefs also support more susceptible coral species, such as Dichocoenia stokesii, Meandrina meadrites, and Dendrogyra cylindrica. Rippe et al. (2019) also found that corals on offshore reefs, in the upper Florida Keys, suffered more mortality from the SCTLD than corals on nearshore reefs. Rippe et al. (2019) suggested that exposure to more extreme environmental ranges nearshore may have increased the resilience of corals to disease. Although offshore reefs have a relatively lower range of daily temperature, a lower range of chlorophyll-a concentrations, and generally have lower turbidity than nearshore reefs (Lirman and Fong, 2007; Soto et al., 2011; Rippe et al., 2019). Our results showed no relationship between water temperature and chlorophyll-a concentrations and SCTLD.
Interestingly, the Bayesian analysis showed that sea surface temperature and chlorophyll-a concentrations were not useful predictors of SCTLD occurrence or SCTLD severity. Previous studies have indicated that anomalously high water temperatures coincided with the onset of the SCTLD outbreak (Precht et al., 2016; Walton et al., 2018). Although the disease onset may have co-occurred with high water temperatures, the long-term data covering large geographic ranges suggest that the occurrence and severity of SCTLD within a site are not influenced by the ambient water temperatures or the concentration of chlorophyll-a in the water. Additionally, the spread of the SCTLD away from the origin of the outbreak followed a linear model, even when quarterly points were used, suggesting that there was little seasonal difference in the rate of transmission among reefs. These results are in contrast with previously studied coral diseases that show strong seasonal variations positively associated with water temperatures (Muller et al., 2008; Rogers and Muller, 2012) and nutrients (Kaczmarsky et al., 2005; Voss and Richardson, 2006; Vega Thurber et al., 2014), emphasizing the unprecedented nature of the SCTLD outbreak. Indeed, many previous disease outbreaks are often attributed to compromised coral-hosts (Lesser et al., 2007; Muller et al., 2008; Muller and van Woesik, 2012). The lack of correlation between the dynamics of SCTLD and water temperature and chlorophyll suggests that this coral disease may be the result of a novel pathogen within the ocean taking advantage of naïve hosts.
The outbreak of the SCTLD significantly reduced coral cover of the already depauperate Florida reef tract (Ruzicka et al., 2013; Walton et al., 2018). Even though the outbreak lasted for several years, much of the disease etiology is still unknown. Our spatial epidemiological approach documents the large-scale effects of this unprecedented outbreak and maps the extent of spatial hotspots through time in the Florida reef tract. The spatial pattern of the diseased reefs suggests that this outbreak is caused by a contagious agent, with disease clusters on the scale of tens of kilometers. The spatio-temporal model indicates that water currents may be a vector of transmission, with bottom advection influencing transmission rates. Our results indicate that diverse and deep reefs are at greater risk to SCTLD than less diverse, shallow reefs. An increase in multi-species, contagious marine diseases is forcing diverse, complex systems toward more homogenous and simple systems (Burman et al., 2012), and efforts are needed to ensure that human activities are neither causing nor exacerbating diseases on coral reefs.
Data Availability Statement
The datasets generated for this study are available on request to the corresponding author.
Author Contributions
EM, RW, and NA obtained funding. NA acquired and QA/QC’ed the data. EM, CS, and RW conducted data analyses. All authors contributed to the writing and editing of the manuscript.
Funding
Funding for this project was provided by the State of Florida, as administered by the Florida Department of Environmental Protection, Florida Coastal Office, Southeast Region under award #202327.
Conflict of Interest
The authors declare that the research was conducted in the absence of any commercial or financial relationships that could be construed as a potential conflict of interest.
Acknowledgments
We would like to acknowledge all of the contributors to the data sets used within the present study. Specifically, monthly means of chlorophyll-a concentration and sea-surface temperature were processed by Dr. Daniel Otis at the Institute for Marine Remote Sensing, University of South Florida, College of Marine Science. Processing of satellite imagery for this paper is the result of research funded by NASA grant NNX14AP62A ‘National Marine Sanctuaries as Sentinel Sites for a Demonstration Marine Biodiversity Observation Network (MBON)’ funded under the National Ocean Partnership Program (NOPP RFP NOAA-NOS-IOOS-2014-2003803 in partnership between NOAA, BOEM, and NASA). See additional acknowledgements for each dataset within the Supplementary Document #1 meta data file.
Supplementary Material
The Supplementary Material for this article can be found online at: https://www.frontiersin.org/articles/10.3389/fmars.2020.00163/full#supplementary-material
Footnotes
- ^ http://frrp.org/wp-content/uploads/2018/01/2017-Summer-DRM-Quick-Look-Report.pdf
- ^ http://step.esa.int/main/toolboxes/snap/
References
Aeby, G. S., Ushijima, B., Campbell, J. E., Jones, S., Williams, G., Meyer, J. L., et al. (2019). Pathogenesis of a tissue loss disease affecting multiple species of corals along the florida reef tract. Front. Mar. Sci. 6:00678. doi: 10.3389/fmars.2019.00678
Aeby, G. S., Work, T. M., Bourne, D. G., and Wilson, B. (2011). Coral diversity and the severity of disease outbreaks: a cross-regional comparison of acropora white syndrome in a species-rich region (American Samoa) with a species-poor region (Northwestern Hawaiian Islands). J. Mar. Biol. 2011, 1–8. doi: 10.1155/2011/490198
Baddeley, A., and Turner, R. (2005). spatstat: an r package for analyzing spatial point patterns. J. Stat. Softw. 12, 1–42. doi: 10.18637/jss.v012.i06
Brandt, M. E., and Mcmanus, J. W. (2009). Disease incidence is related to bleaching extent in reef-building corals. Ecology 90, 2859–2867. doi: 10.1890/08-0445.1
Brandt, M. E., Smith, T. B., Correa, A. M. S., and Vega-Thurber, R. (2013). Disturbance driven colony fragmentation as a driver of a coral disease outbreak. PLoS One 8:e57164. doi: 10.1371/journal.pone.0057164
Bruno, J. F., Selig, E. R., Casey, K. S., Page, C. A., Willis, B. L., Harvell, C. D., et al. (2007). Thermal stress and coral cover as drivers of coral disease outbreaks. PLoS Biol. 5:e124. doi: 10.1371/journal.pbio.0050124
Burman, S. G., Aronson, R. B., and van Woesik, R. (2012). Biotic homogenization of coral assemblages along the Florida reef tract. Mar. Ecol. Prog. Ser. 467, 89–96. doi: 10.3354/meps09950
Chan, A. N., Lewis, C. L., Neely, K. L., and Baums, I. B. (2019). Fallen pillars: the past, present, and future population dynamics of a rare, specialist coral-algal symbiosis. Front. Mar. Sci. 6:218. doi: 10.3389/fmars.2019.00218
Davis, K. A., and Monismith, S. G. (2011). The modification of bottom boundary layer turbulence and mixing by internal waves shoaling on a barrier reef. J. Phys. Oceanogr. 41, 2223–2241. doi: 10.1175/2011JPO4344.1
Grothendieck, G. (2013). nls2: Non-Linear Regression With Brute Force. Available online at: https://cran.r-project.org/package=nls2 (accessed March 8, 2013).
Kaczmarsky, L., and Richardson, L. L. (2011). Do elevated nutrients and organic carbon on Philippine reefs increase the prevalence of coral disease? Coral Reefs 30, 253–257. doi: 10.1007/s00338-010-0686-2
Kaczmarsky, L. T., Draud, M., and Williams, E. H. (2005). Is there a relationship between proximity to sewage effluent and the prevalence of coral disease? Caribb. J. Sci. 41, 124–137.
Kourafalou, V. H., and Kang, H. (2012). Florida Current meandering and evolution of cyclonic eddies along the Florida keys reef tract: are they interconnected? J. Geophys. Res. Ocean. 117, 1–25. doi: 10.1029/2011JC007383
Kuta, K. G., and Richardson, L. L. (1996). Abundance and distribution of black band disease on coral reefs in the northern Florida Keys. Coral Reefs 15, 219–223. doi: 10.1007/bf01787455
Kuta, K. G., and Richardson, L. L. (2002). Ecological aspects of black band disease of corals: relationships between disease incidence and environmental factors. Coral Reefs 21, 393–398. doi: 10.1007/s00338-002-0261-6
Lafferty, K. D., and Holt, R. D. (2003). How should environmental stress affect the population dynamics of disease? Ecol. Lett. 6, 654–664. doi: 10.1046/j.1461-0248.2003.00480.x
Lentz, J. A., Blackburn, J. K., and Curtis, A. J. (2011). Evaluating patterns of a white-band disease (WBD) outbreak in acropora palmata using spatial analysis: a comparison of transect and colony clustering. PLoS One 6:e21830. doi: 10.1371/journal.pone.0021830
Lesser, M. P., Bythell, J. C., Gates, R. D., Johnstone, R. W., and Hoegh-Guldberg, O. (2007). Are infectious diseases really killing corals? Alternative interpretations of the experimental and ecological data. J. Exp. Mar. Bio. Ecol. 346, 36–44. doi: 10.1016/j.jembe.2007.02.015
Lirman, D., and Fong, P. (2007). Is proximity to land-based sources of coral stressors an appropriate measure of risk to coral reefs? An example from the Florida reef tract. Mar. Pollut. Bull. 54, 779–791. doi: 10.1016/j.marpolbul.2006.12.014
Lirman, D., Orlando, B., Maciá, S., Manzello, D., Kaufman, L., Biber, P., et al. (2003). Coral communities of Biscayne Bay, Florida and adjacent offshore areas: diversity, abundance, distribution, and environmental correlates. Aquat. Conserv. Mar. Freshw. Ecosyst. 13, 121–135. doi: 10.1002/aqc.552
Meyer, J. L., Castellanos-Gell, J., Aeby, G. S., Häse, C. C., Ushijima, B., and Paul, V. J. (2019). Microbial community shifts associated with the ongoing stony coral tissue loss disease outbreak on the Florida reef tract. Front. Microbiol. 10:2244. doi: 10.3389/fmicb.2019.02244
Miller, J., Muller, E., Rogers, C., Waara, R., Atkinson, A., Whelan, K. R. T., et al. (2009). Coral disease following massive bleaching in 2005 causes 60% decline in coral cover on reefs in the US Virgin Islands. Coral Reefs 28, 925–937. doi: 10.1007/s00338-009-0531-7
Muller, E. M., Rogers, C. S., Spitzack, A. S., and Van Woesik, R. (2008). Bleaching increases likelihood of disease on Acropora palmata (Lamarck) in Hawksnest Bay, St John, US Virgin Islands. Coral Reefs 27, 191–195. doi: 10.1007/s00338-007-0310-2
Muller, E. M., and van Woesik, R. (2011). Black-band disease dynamics: Prevalence, incidence, and acclimatization to light. J. Exp. Mar. Bio. Ecol. 397, 52–57. doi: 10.1016/j.jembe.2010.11.002
Muller, E. M., and van Woesik, R. (2012). Caribbean coral diseases: primary transmission or secondary infection? Glob. Chang. Biol. 18, 3529–3535. doi: 10.1111/gcb.12019
Muller, E. M., and van Woesik, R. (2014). Genetic susceptibility, colony size, and water temperature drive white-pox disease on the coral Acropora palmata. PLoS One 9:e110759. doi: 10.1371/journal.pone.0110759
Neely, K. (2018). Surveying the Florida Keys Southern Coral Disease Boundary. Miami, FL: Florida DEP.
NOAA (2018). Stony Coral Tissue Loss Disease Case Definition. Available online at: https://nmsfloridakeys.blob.core.windows.net/floridakeys-prod/media/docs/20181002-stony-coral-tissue-loss-disease-case-definition.pdf (accessed October 2, 2018).
Pebesma, E. J., and Bivand, R. S. (2005). Classes and methods for spatial data in {R}. R News 5, 9–13.
Plummer, M. (2019). rjags: Bayesian Graphical Models using MCMC. Available online at: https://cran.r-project.org/package=rjags (accessed November 6, 2019).
Pollock, F. J., Lamb, J. B., Field, S. N., Heron, S. F., Schaffelke, B., Shedrawi, G., et al. (2014). Sediment and turbidity associated with offshore dredging increase coral disease prevalence on nearby reefs. PLoS One 9:e102498. doi: 10.1371/journal.pone.0102498
Precht, W. F., Gintert, B. E., Robbart, M. L., Fura, R., and van Woesik, R. (2016). Unprecedented disease-related coral mortality in Southeastern Florida. Sci. Rep. 6:31374. doi: 10.1038/srep31374
R Development Core Team, (2019). R: A Language and Environment for Statistical Computing. Vienna: R Foundation for Statistical Computing.
Redding, J. E., Myers-Miller, R. L., Baker, D. M., Fogel, M., Raymundo, L. J., and Kim, K. (2013). Link between sewage-derived nitrogen pollution and coral disease severity in Guam. Mar. Pollut. Bull. 73, 57–63. doi: 10.1016/j.marpolbul.2013.06.002
Rippe, J. P., Kriefall, N. G., Davies, S. W., and Castillo, K. D. (2019). Differential disease incidence and mortality of inner and outer reef corals of the upper Florida Keys in association with a white syndrome outbreak. Bull. Mar. Sci. 95, 305–316. doi: 10.5343/bms.2018.0034
Ritchie, K. B. (2006). Regulation of microbial populations by coral surface mucus and mucus-associated bacteria. Mar. Ecol. Prog. Ser. 322, 1–14. doi: 10.3354/meps322001
Rogers, C. S., and Muller, E. M. (2012). Bleaching, disease and recovery in the threatened scleractinian coral Acropora palmata in St. John, US Virgin Islands: 2003-2010. Coral Reefs 31, 807–819. doi: 10.1007/s00338-012-0898-8
Ruzicka, R. R., Colella, M. A., Porter, J. W., Morrison, J. M., Kidney, J. A., Brinkhuis, V., et al. (2013). Temporal changes in benthic assemblages on Florida keys reefs 11 years after the 1997/1998 El Niño. Mar. Ecol. Prog. Ser. 489, 125–141. doi: 10.3354/meps10427
Soto, I. M., Muller, K. F. E., Hallock, P., and Hu, C. (2011). Sea surface temperature variability in the Florida keys and its relationship to coral cover. J. Mar. Biol. 2011, 1–10. doi: 10.1155/2011/981723
Stoddart, J., Jones, R., Page, C., Marnane, M., De Lestang, P., and Elsdon, T. (2019). No effect of dredging on the prevalence of coral disease detected during a large dredging program. Mar. Pollut. Bull. 140, 353–363. doi: 10.1016/j.marpolbul.2019.01.047
Trowbridge, J. H., and Lentz, S. J. (2018). The bottom boundary layer. Ann. Rev. Mar. Sci. 10, 397–420. doi: 10.1146/annurev-marine-121916-063351
Vega Thurber, R. L., Burkepile, D. E., Fuchs, C., Shantz, A. A., Mcminds, R., and Zaneveld, J. R. (2014). Chronic nutrient enrichment increases prevalence and severity of coral disease and bleaching. Glob. Chang. Biol. 20, 544–554. doi: 10.1111/gcb.12450
Viehman, S., Gittings, S., Groves, S., Moore, J., Moore, T., and Stein, J. (2018). NCCOS Assessment: Coral Disturbance Response Monitoring (DRM) Along the Florida Reef Tract Following Hurricane Irma From 2017-10-09 to 2017-10-18 (NCEI Accession 0179071). NOAA National Centers for Environmental Information. Silver Spring, MD: National Centers for Coastal Ocean Science. Available online at: https://doi.org/10.25921/sscd-6h41
Voss, J. D., and Richardson, L. L. (2006). Nutrient enrichment enhances black band disease progression in corals. Coral Reefs 25, 569–576. doi: 10.1007/s00338-006-0131-8
Wagner, D. E., Kramer, P., and van Woesik, R. (2010). Species composition, habitat, and water quality influence coral bleaching in southern Florida. Mar. Ecol. Prog. Ser. 408, 65–78. doi: 10.3354/meps08584
Walton, C. J., Hayes, N. K., and Gilliam, D. S. (2018). Impacts of a regional, multi-year, multi-species coral disease outbreak in Southeast Florida. Front. Mar. Sci. 5:323. doi: 10.3389/fmars.2018.00323
Ward, J. R., Rypien, K. L., Bruno, J. F., Harvell, C. D., Jordán-Dahlgren, E., Mullen, K. M., et al. (2006). Coral diversity and disease in Mexico. Dis. Aquat. Organ. 69, 23–31. doi: 10.3354/dao069023
Keywords: stony-coral-tissue-loss disease, spatial epidemiology, Florida reef tract, disease etiology, Caribbean
Citation: Muller EM, Sartor C, Alcaraz NI and van Woesik R (2020) Spatial Epidemiology of the Stony-Coral-Tissue-Loss Disease in Florida. Front. Mar. Sci. 7:163. doi: 10.3389/fmars.2020.00163
Received: 22 November 2019; Accepted: 02 March 2020;
Published: 19 March 2020.
Edited by:
Michael Sweet, University of Derby, United KingdomReviewed by:
Claudia Pogoreutz, University of Konstanz, GermanyEslam O. Osman, Pennsylvania State University (PSU), United States
Raechel Littman, University of California, Irvine, United States
Copyright © 2020 Muller, Sartor, Alcaraz and van Woesik. This is an open-access article distributed under the terms of the Creative Commons Attribution License (CC BY). The use, distribution or reproduction in other forums is permitted, provided the original author(s) and the copyright owner(s) are credited and that the original publication in this journal is cited, in accordance with accepted academic practice. No use, distribution or reproduction is permitted which does not comply with these terms.
*Correspondence: Erinn M. Muller, ZW11bGxlckBtb3RlLm9yZw==