 Bianca T. P. Liguori
 Claudia Ehlert
 Katharina Pahnke
- Marine Isotope Geochemistry, Institute for Chemistry and Biology of the Marine Environment (ICBM), University of Oldenburg, Oldenburg, Germany
The use of the silicon isotope composition of dissolved silicon (δ30Si-DSi) to understand the marine silicon cycle has been increasing in recent years. Here we present δ30Si-DSi and δ30Si of biogenic silica (δ30Si-bSiO2) in the intermediate to deep waters of the Central Arctic Ocean (AO) aiming at investigating in more detail the relative influence of water mass mixing and particle flux on the Si cycle in the AO. Comparing the δ30Si-DSi with the water mass composition derived from Optimum Multiparameter (OMP) analysis, we were able to test the influence of the water masses in the δ30Si-DSi distribution. We were able to show the dominant Atlantic Water (AW) influence at the stations close to the Fram Strait (station 32 and 40, δ30Si-DSi = 1.51 ± 0.11‰, 2SEM, n = 3) and the only small δ30Si-DSi modification when compared to the endmember value from a previous study (δ30Si-DSi = 1.55‰). The Dense Arctic Atlantic Water, dominating from 200 to 500 m water depth (except for stations 32 and 40, where it was present only at 500 m), was marked by heavier δ30Si-DSi of 1.62 ± 0.06‰ (2SEM, n = 21). This is probably due to the influence of entraining equally dense water from the shelves. Due to productivity and Si utilization on the shelves, both water and bSiO2, that were transported laterally into the Central AO, were characterized by higher δ30Si, with δ30Si-bSiO2 of 1.64 ± 0.13‰ (2SEM, n = 7). Particle dissolution at greater depths did not play a major role in the δ30Si-DSi of deep waters due to the low bSiO2 concentrations at these greater depths. Outflowing water masses from the AO present different δ30Si-DSi, with lower values around 1.46‰ originating from the Central AO influencing predominantly DSOW and ISOW, and higher values around 2‰ originating from the Canadian AO influencing predominantly LSW. Those signatures correspond with the δ30Si-DSi found in the North Atlantic. Consequently, the AO potentially presents several isotopically different endmembers that contribute to the deep water formed in the North Atlantic.
Introduction
Silicic acid (here referred to as dissolved silicon – DSi) is a vital nutrient for diatoms. Diatoms are siliceous microplankton dominant in marine water (under silicon (Si) availability) and contribute to the carbon pump, being responsible for ∼40% of the global marine primary productivity (Nelson et al., 1995). Diatoms can play a major role in the carbon cycle and control the marine Si cycle due to their uptake of Si to build up their frustules (made of biogenic silica – bSiO2), its subsequent dissolution or export to the ocean floor. Thus, the marine Si and carbon cycles are linked. The export and preservation of Si from diatom frustules is more efficient than that of carbon because carbon is remineralized more quickly. Therefore, studying the Si cycle can provide useful information about primary production in the present (Sarmiento et al., 2004) and past ocean (De La Rocha et al., 1998).
The Si isotopes in silicic acid (δ30Si-DSi) and in biogenic silica (δ30Si-bSiO2) have emerged as a powerful tool to understand the Si cycle. They can help us to understand the DSi uptake in surface waters (De La Rocha et al., 1997, 2000), the vertical Si supply (Fripiat et al., 2011) and the water mass circulation and mixing (de Souza et al., 2012; Brzezinski and Jones, 2015). Therefore, the dominant pathways and processes of the Si cycle in the oceans can be revealed (de Souza et al., 2012). During DSi utilization, diatoms fractionate toward the lighter Si isotopes leaving the surrounding water enriched in heavier isotopes, with an enrichment factor (30ε, ∼Δ30Si = δ30Si-bSiO2 −δ30Si-DSi) around −1.1‰ (Sutton et al., 2018a). Thus, a typical vertical seawater profile shows elevated δ30Si-DSi and depleted [DSi] at the surface and decreasing δ30Si-DSi and increasing [DSi] with depths. This led to the conclusion that biogenic uptake and opal dissolution dominate the Si distribution in the water column (De La Rocha et al., 2000). However, recent studies indicate that the dissolution of sinking particles does not play a major role in controlling the δ30Si-DSi of deep waters in the North Atlantic Ocean. Instead, water mass mixing and circulation seem to dominate the distribution of δ30Si-DSi in the deep North Atlantic (de Souza et al., 2012; Brzezinski and Jones, 2015).
The Si uptake and later dissolution, along with water mass circulation and mixing in deeper waters, create seawater δ30Si-DSi signatures distinguishable in the different ocean basins and water masses (Reynolds, 2009; de Souza et al., 2012). This can be seen along the global overturning circulation, where the [DSi] from the Atlantic Ocean toward the Pacific Ocean increases due to continuous accumulation of DSi due to diatom dissolution in deep waters along the flow path. The North Pacific Ocean has a stronger remineralization signal (de Souza et al., 2012) due to its relatively sluggish deep circulation and high water residence times, resulting in the lightest deep water δ30Si-DSi of ∼0.5‰ (Reynolds et al., 2006). In contrast, enhanced water mass advection in the deep Atlantic Ocean is clearly seen in the distribution of δ30Si-DSi making Si isotopes a tracer for water mass mixing in the Atlantic Ocean (de Souza et al., 2012; Brzezinski and Jones, 2015; Sutton et al., 2018b). Specifically, the waters from the Southern Ocean have lighter δ30Si-DSi values due to upwelling of light δ30Si-DSi and incomplete DSi consumption in the Southern Ocean south of the Polar Frontal Zone, maintaining the light isotope signature in Antarctic Bottom Water formed in the Southern Ocean (∼1.2‰, Cardinal et al., 2005; de Souza et al., 2012). Recent work identified relatively heavy δ30Si-DSi values (>1.7‰) in the deep North Atlantic Ocean in water that has Arctic Ocean (AO)/Nordic Seas water as precursor for its formation (de Souza et al., 2012; Brzezinski and Jones, 2015; Sutton et al., 2018b). It was hypothesized that the AO plays an important role in contributing these heavy signatures to North Atlantic Deep Water (NADW) through the contribution of shallow AO water to the formation of Iceland Scotland Overflow Water (ISOW), Denmark Strait Overflow Water (DSOW) and Labrador Sea Water (LSW) (Brzezinski and Jones, 2015). However, little is known about the Si cycle within the AO itself and hence about the processes setting the heavy δ30Si-DSi that is exported to the North Atlantic.
The AO presents unique features that allow for the study of the role of water mass mixing and particle dissolution in the Si isotope distribution especially well. The low biological production in the central AO leads to low particle fluxes (Fahl and Nöthig, 2007), which would cause particularly low interference from the expected diatom remineralization signal at greater depths on the δ30Si-DSi of water masses. Therefore, it has been suggested that the dominant process controlling the δ30Si-DSi of intermediate and deep waters in the AO is water mass mixing, whereas the in situ and terrestrial influence of primary productivity and particle dissolution is considered low (Brzezinski and Jones, 2015; Varela et al., 2016). In contrast, another study suggested that the dissolved aluminum (Al) distribution in intermediate and deep waters of the AO is influenced by biological activity through a tight coupling of the Al and Si cycles, thereby implying that DSi in the AO is largely controlled by biological cycling (Middag et al., 2009). The terrestrial influence on the Si cycle is due to the large runoff (the AO receives ∼10% of the global river runoff) and the extensive shallow shelves (Codispoti et al., 1991). It has been shown that the lateral supply of particles is important in the AO (Fahl and Nöthig, 2007; Lalande et al., 2016). The use of Si isotopes can help us to disentangle the effects of water mass mixing and in situ particle production and later dissolution and their relative importance for the Si cycle in the AO.
Here, we present the first study using δ30Si-DSi and the δ30Si-bSiO2 in the intermediate to deep waters of the Central AO to unravel the relative influence of water mass mixing and vertical particle flux on the Si cycle in the AO. We hypothesize that water mass mixing plays a major role on the δ30Si-DSi in the water column, and that particle export to deeper waters plays a minor role in the AO. In order to test this hypothesis, we used samples from 200 m water depth to the bottom from the GEOTRACES cruise GN04 in the Central AO (R/V Polarstern cruise PS94) (Figure 1) and combined measurements of δ30Si-DSi and δ30Si-bSiO2 to help us disentangle the diatom influence on DSi. The use of samples from ≥200 m water depth is justified because above 200 m the isotopic composition of both dissolved and particulate samples will be strongly influenced by primary production and transport of surface waters from the shelves.
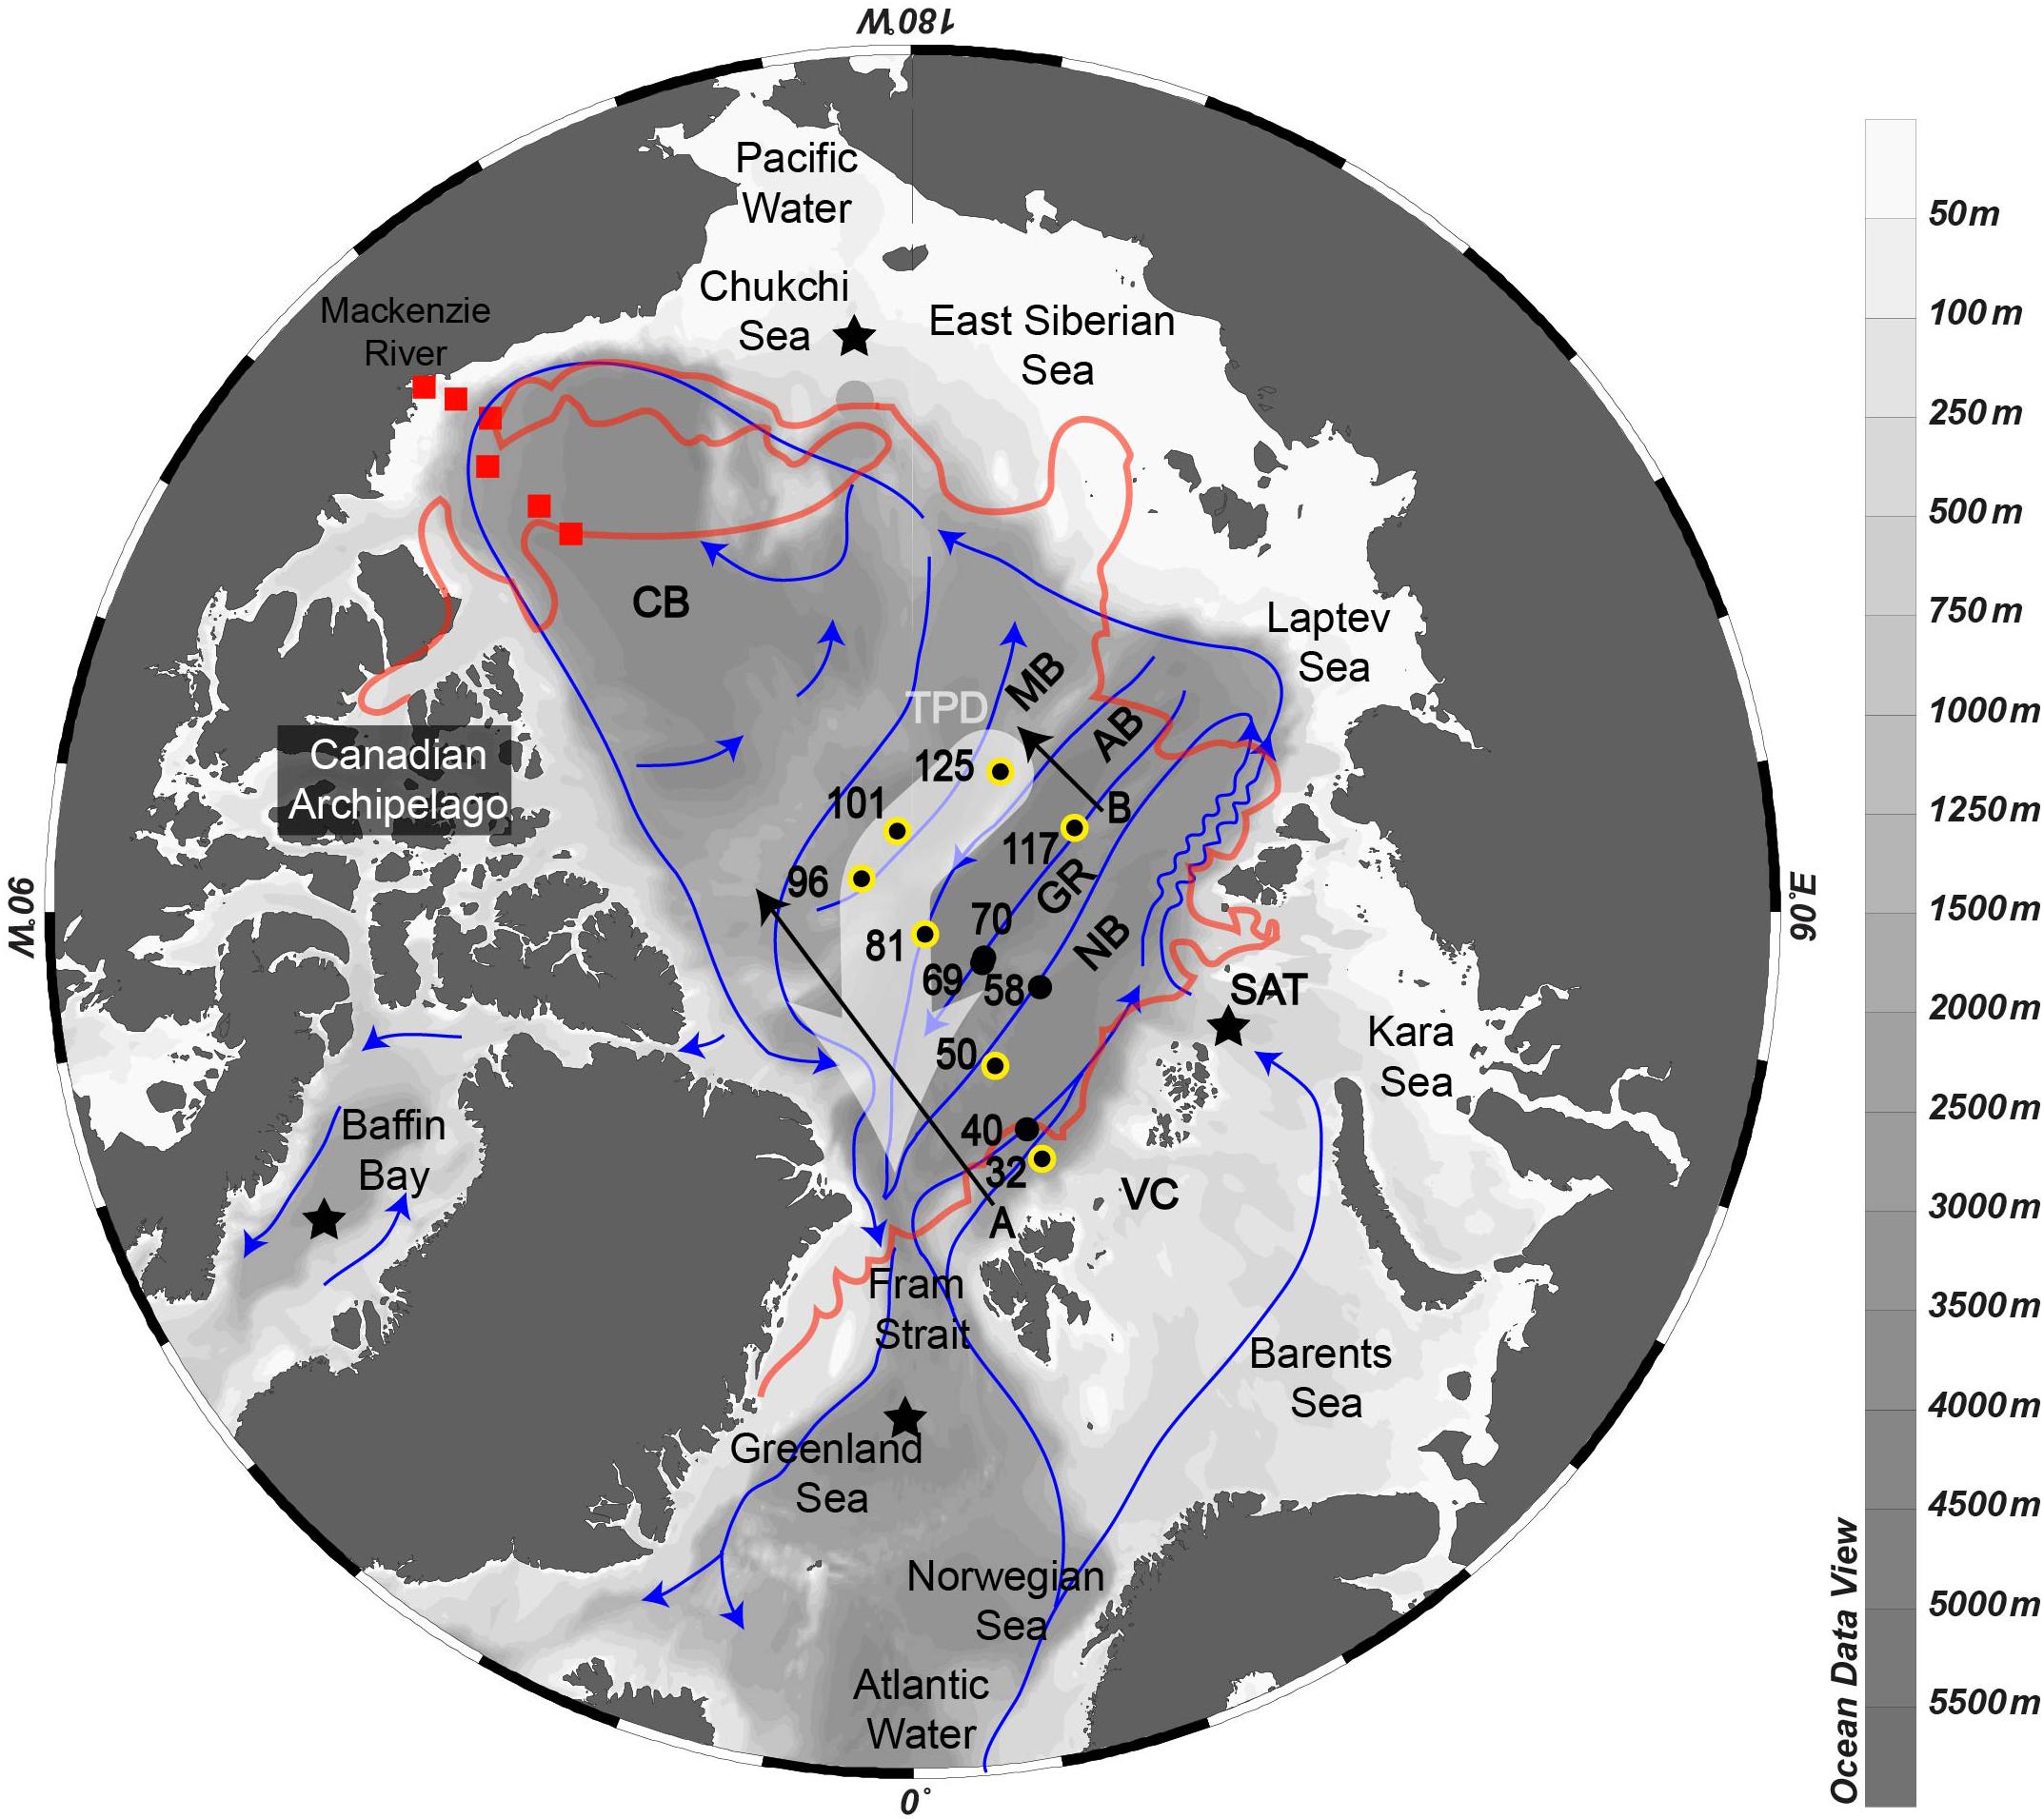
Figure 1. Map of the Arctic Ocean with schematic intermediate and deep circulation (Jones, 2001). Stations from the present study are numbered and colored: black dots represent samples for δ30Si-DSi; yellow-black dots represent samples for δ30Si-DSi and δ30Si-bSiO2. Transect A and B marked for further reference. The Transpolar Drift surface current is highlighted with a wide white arrow. The sea ice extension is represented by the red line around the basins. In the Canadian Basin, the stations of Varela et al. (2016) are shown by red squares. The stars provide the approximate main locations of deep water formation areas on the Kara Sea shelf, in the Chukchi Sea, in the Greenland Sea and in the Labrador Sea. NB, Nansen Basin; GR, Gakkel Ridge; AM, Amundsen Basin; MB, Makarov Basin; CB, Canadian Basin; VC, Victoria Channel; SAT, Santa Anna Trough. Map and all following section plots were generated using Ocean Data View (Schlitzer, 2018).
In addition, we evaluate the influence of hydrothermal sources on the deep water as our study transect intersects the ultra-slow spreading Gakkel Ridge. Despite a ∼10% contribution of hydrothermal sources to the DSi of the global ocean (Tréguer and De La Rocha, 2013), very little is known about its influence on δ30Si-DSi. To the best of our knowledge, only two studies have tried to investigate the influence of hydrothermal activity on Si isotopes (De La Rocha et al., 2000; Brzezinski and Jones, 2015). De La Rocha et al. (2000) found low δ30Si-DSi (∼−0.3‰) and high [DSi] in hydrothermal fluids from the East Pacific Rise, which was suggested to cause a shift of the δ30Si-DSi of the surrounding water toward lower values as the average value for sea water δ30Si-DSi is 1.2–1.5‰ and an increase in [DSi]. Such a shift toward lighter δ30Si-DSi was found by Brzezinski and Jones (2015) in a hydrothermal plume over the mid-Atlantic ridge (TAG hydrothermal vent field), although the values were within uncertainty of non-hydrothermal seawater samples and no increase in [DSi] was found.
Study Area
The AO is surrounded by extensive shallow shelves and divided by the Lomonosov Ridge into two basins, the Eurasian and Canadian Basins. The Eurasian Basin is further divided by the Gakkel Ridge into two basins, the Nansen and Amundsen Basins. The main sources of the AO Si budget are inflow from the adjacent Pacific Ocean, Atlantic Ocean, riverine, sedimentary benthic fluxes and potentially hydrothermal input (see Figure 1 for reference). Pacific and Atlantic inflow contribute ∼1880 Gmol Si yr–1 (Torres-Valdés et al., 2013), river input is estimates around 400 Gmol Si yr–1 (Holmes et al., 2012) and benthic diffusive fluxes from shelf and basin sediment deliver at least 350 Gmol Si yr–1 (März et al., 2015).
The inflowing water from the Pacific Ocean enters the AO through the Bering Strait, which is only 50 m deep and allows only for limited water exchange. The Pacific water flows into the Chukchi Sea and leaves the AO through the Canadian Arctic Archipelago and Fram Strait (Rudels, 2012). The Atlantic Water (AW) flows into the AO through the Fram Strait and the Barents Sea (Rudels et al., 1994). Upon entering the AO, the AW subducts below relatively fresh AO surface water, and is restricted to a depth below 200 m due to the strong halocline that is maintained by the high continental runoff and the annual cycle in the sea ice freezing/melting (Rudels et al., 2015). The AW entering the Barents Sea experiences strong cooling over the shelves creating cold and dense waters (Årthun et al., 2011; Smedsrud et al., 2013). Dense waters forming through brine rejection on the shelves surrounding the AO feed deep waters in the Central AO (Jones et al., 1995). Brine rejected waters formed in the Barents Sea, enter the Central AO through the Victoria Channel and St. Anna Trough (Schauer et al., 1997) thus ventilating the deep water column of the AO (Schauer et al., 2002). Intermediate and deep waters are fed by the process mentioned above due to brine rejection on the shelves, but also from waters from the Nordic Seas flowing to the AO through the Fram Strait (Jones et al., 1995). One important feature within the AO that restricts and governs the intermediate and deep water circulation is the topography with the continental slope and ridges present. The intermediate and deep waters generally follow similar trajectories in an anti-clockwise direction (Carmack et al., 2015). The Lomonosov Ridge separates deep water below 2000 m water depth from the Eurasian and Canadian Basins. However, some incursions from the Makarov Basin into the Eurasian Basin were reported due to a shallower (∼1500 m) sill from the Lomonosov Ridge that allows the flow of deep waters (Björk et al., 2010). Intermediate and deep waters can exit the AO only through the Fram Strait. To the South, the exchange with the Atlantic Ocean is restricted to depths above 600–800 m by the Greenland-Scotland Ridge (GSR).
We defined water masses for this study following Rudels et al. (2012) using density, salinity and temperature (Figure 2 and Table 1) and quantified the relative contributions of each water mass using Optimum Multiparameter (OMP) analysis (Figure 3, see section Optimum Multiparameter Analysis and Supplementary Material for further details). This study focuses on the deeper water column, i.e., waters shallower than 200 m, which are characterized by strong variations in e.g., salinity, nutrient concentrations and primary production, are not further discussed. The dominant water mass at intermediate depths is AW (27.7 < σθ ≤ 27.97) with a core depth between 200 and 370 m. Along its flow path inside the AO, the AW is modified toward lower temperatures, thus deepening along its flow path and is defined as Arctic Atlantic Water (AAW). Below ∼500 m water depth, intermediate waters with densities of σθ > 27.97 and σ0.5 ≤ 30.444 can be subdivided into Dense Arctic Atlantic Water (DAAW) with θ > 0 and Upper Polar Deep Water (uPDW) with θ ≤ 0. The deep waters (σ0.5 > 30.444) are dominated by two water masses, the Eurasian Basin Deep Water (EBDW) and Canadian Basin Deep Water (CBDW). Both water masses are formed from Nordic Sea Deep Water and AW inflow paired with shelf-derived brine waters in the Eurasian and Canadian Basins that are separated by the Lomonosov Ridge (Rudels and Quadfasel, 1991). The CBDW is characterized by a higher temperature and salinity than EBDW, which in turn experiences a stronger influence of the colder waters from the Nordic Seas (Rudels et al., 2009).
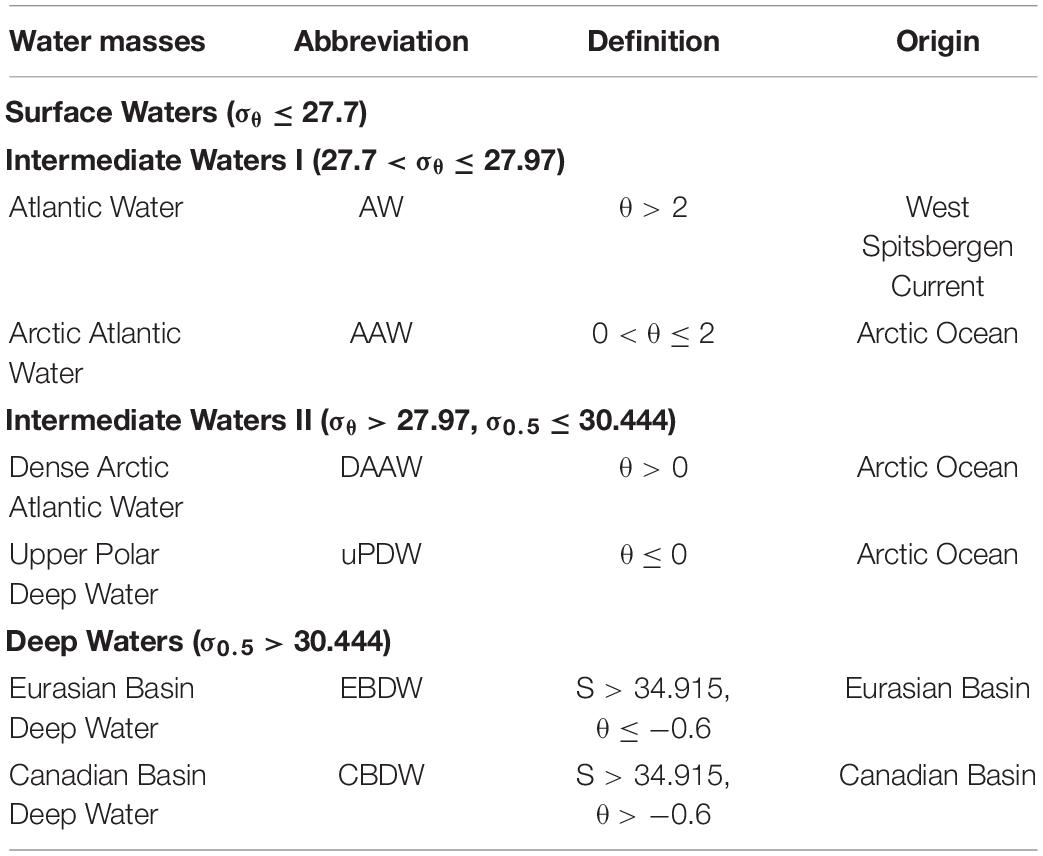
Table 1. Water mass definitions in the study area based on Rudels et al., 2012.
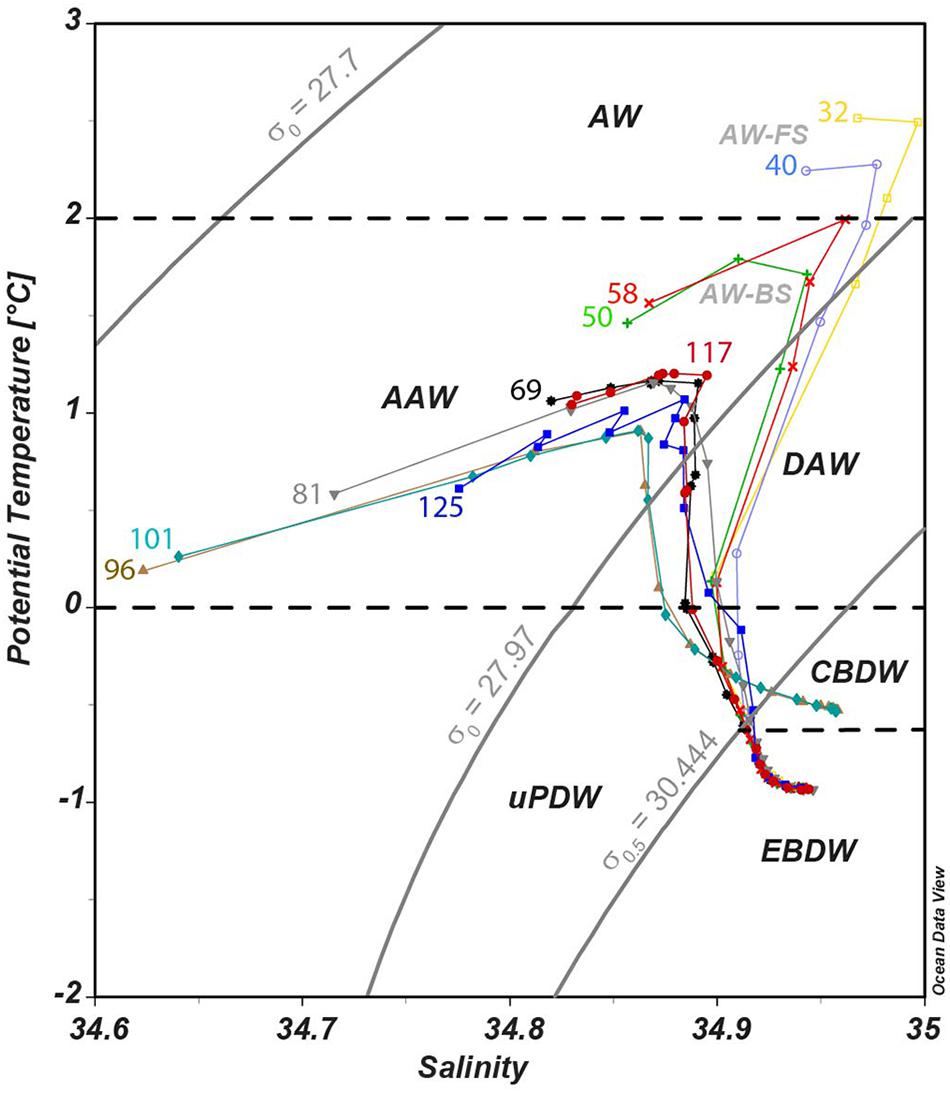
Figure 2. Potential temperature – salinity diagram for all stations from 200 m to the bottom. Solid gray lines are potential density σ0 and σ0.5 at reference pressure 0 and 500 m, respectively. Black dashed lines represent the water mass definitions based on potential temperature. Water masses are labeled as follows: AW, Atlantic Water; AAW, Arctic Atlantic Water; DAAW, Dense Arctic Atlantic Water; uPDW, Upper Polar Deep Water; EBDW, Eurasian Basin Deep Water; CBDW, Canadian Basin Deep Water.
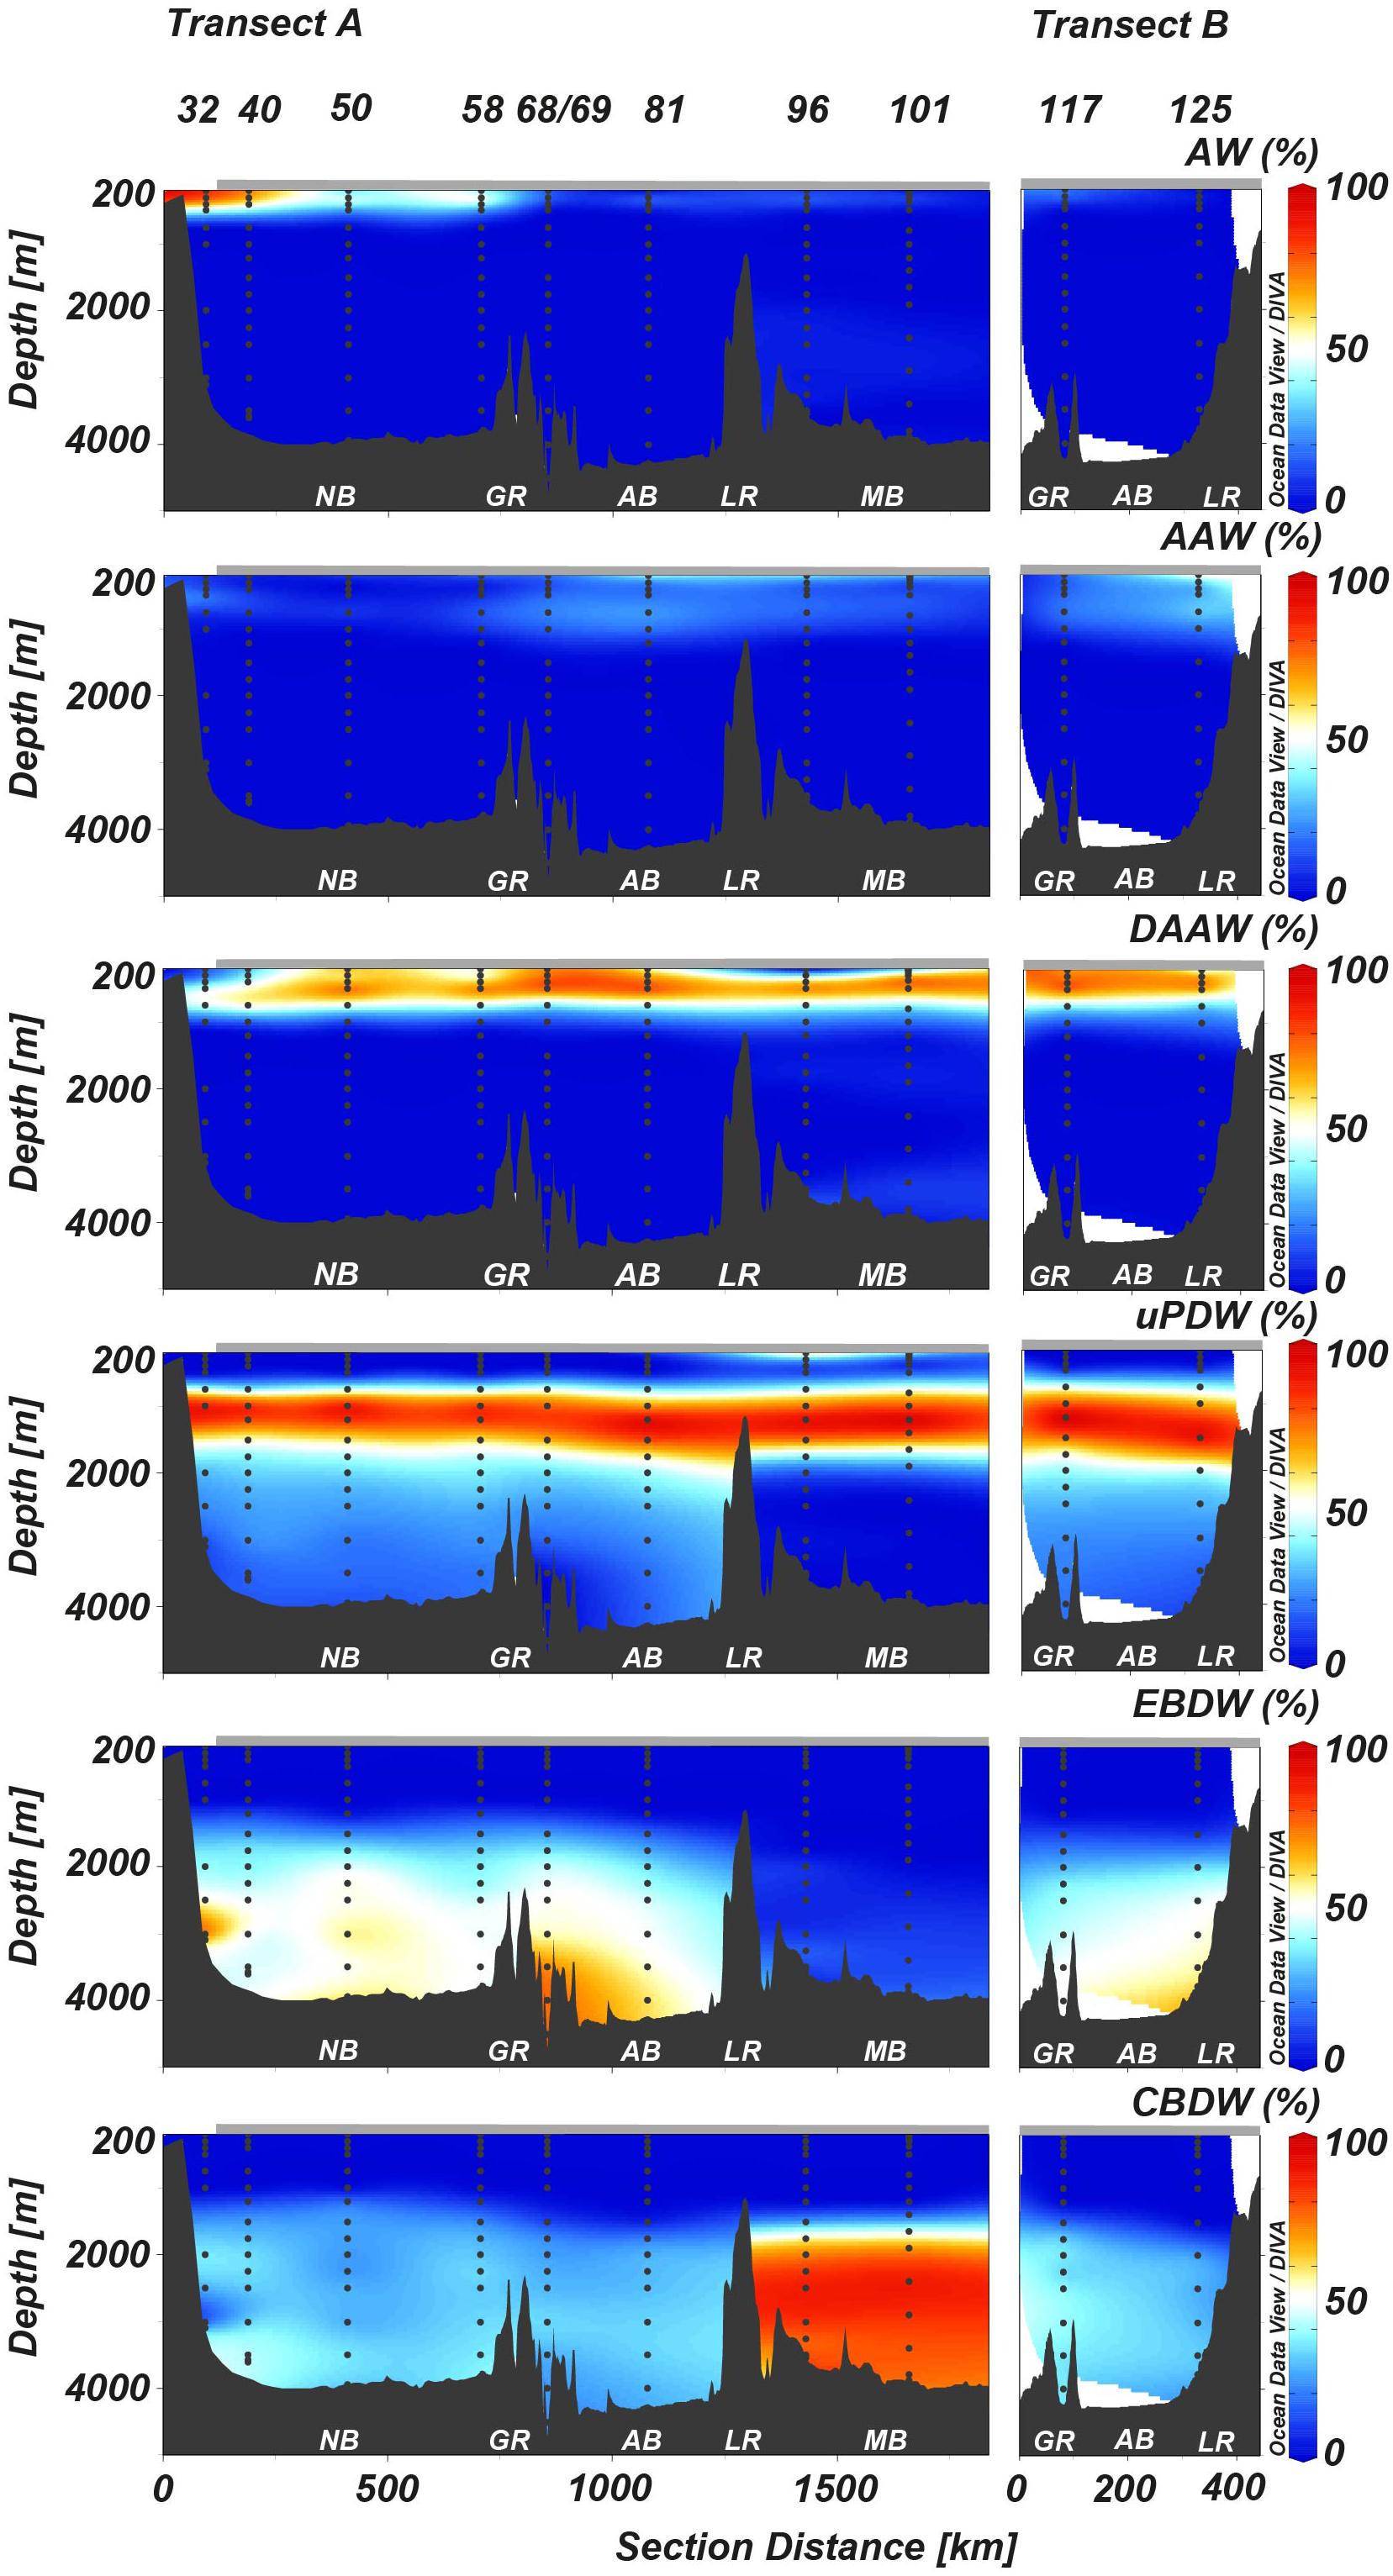
Figure 3. Distribution of water masses based on OMP analysis within the studied section. (A) Longer transect and (B) shorter transect (see Figure 1 for reference). Arrow on map figure defines the direction of the sections shown here. Gray bar on top of the sections represents sea ice extent. See Figure 2 for water masses abbreviations. See Figure 1 for basins abbreviations. LR, Lomonosov Ridge.
Materials and Methods
Sampling
Seawater and particle sampling were conducted during the TransArc II expedition to the AO with the German R/V Polarstern (PS94, ARK-XXIX/3, Tromsø-Tromsø) from 17 August to 15 October 2015 in the framework of the international GEOTRACES program (GEOTRACES transect GN04). The cruise track followed a transect from the Barents Sea shelf northeast of Svalbard to the Makarov Basin and back to the Barents Sea crossing again the Amundsen Basin (Figure 1). For this study, we sampled 10 stations in the Central AO covering the Nansen Basin (stations 32, 40, 50 and 58), the Gakkel Ridge (stations 69, 70, and 117), the Amundsen Basin (stations 81 and 125) and the Makarov Basin (stations 96 and 101) (Figure 1 and Table 2).
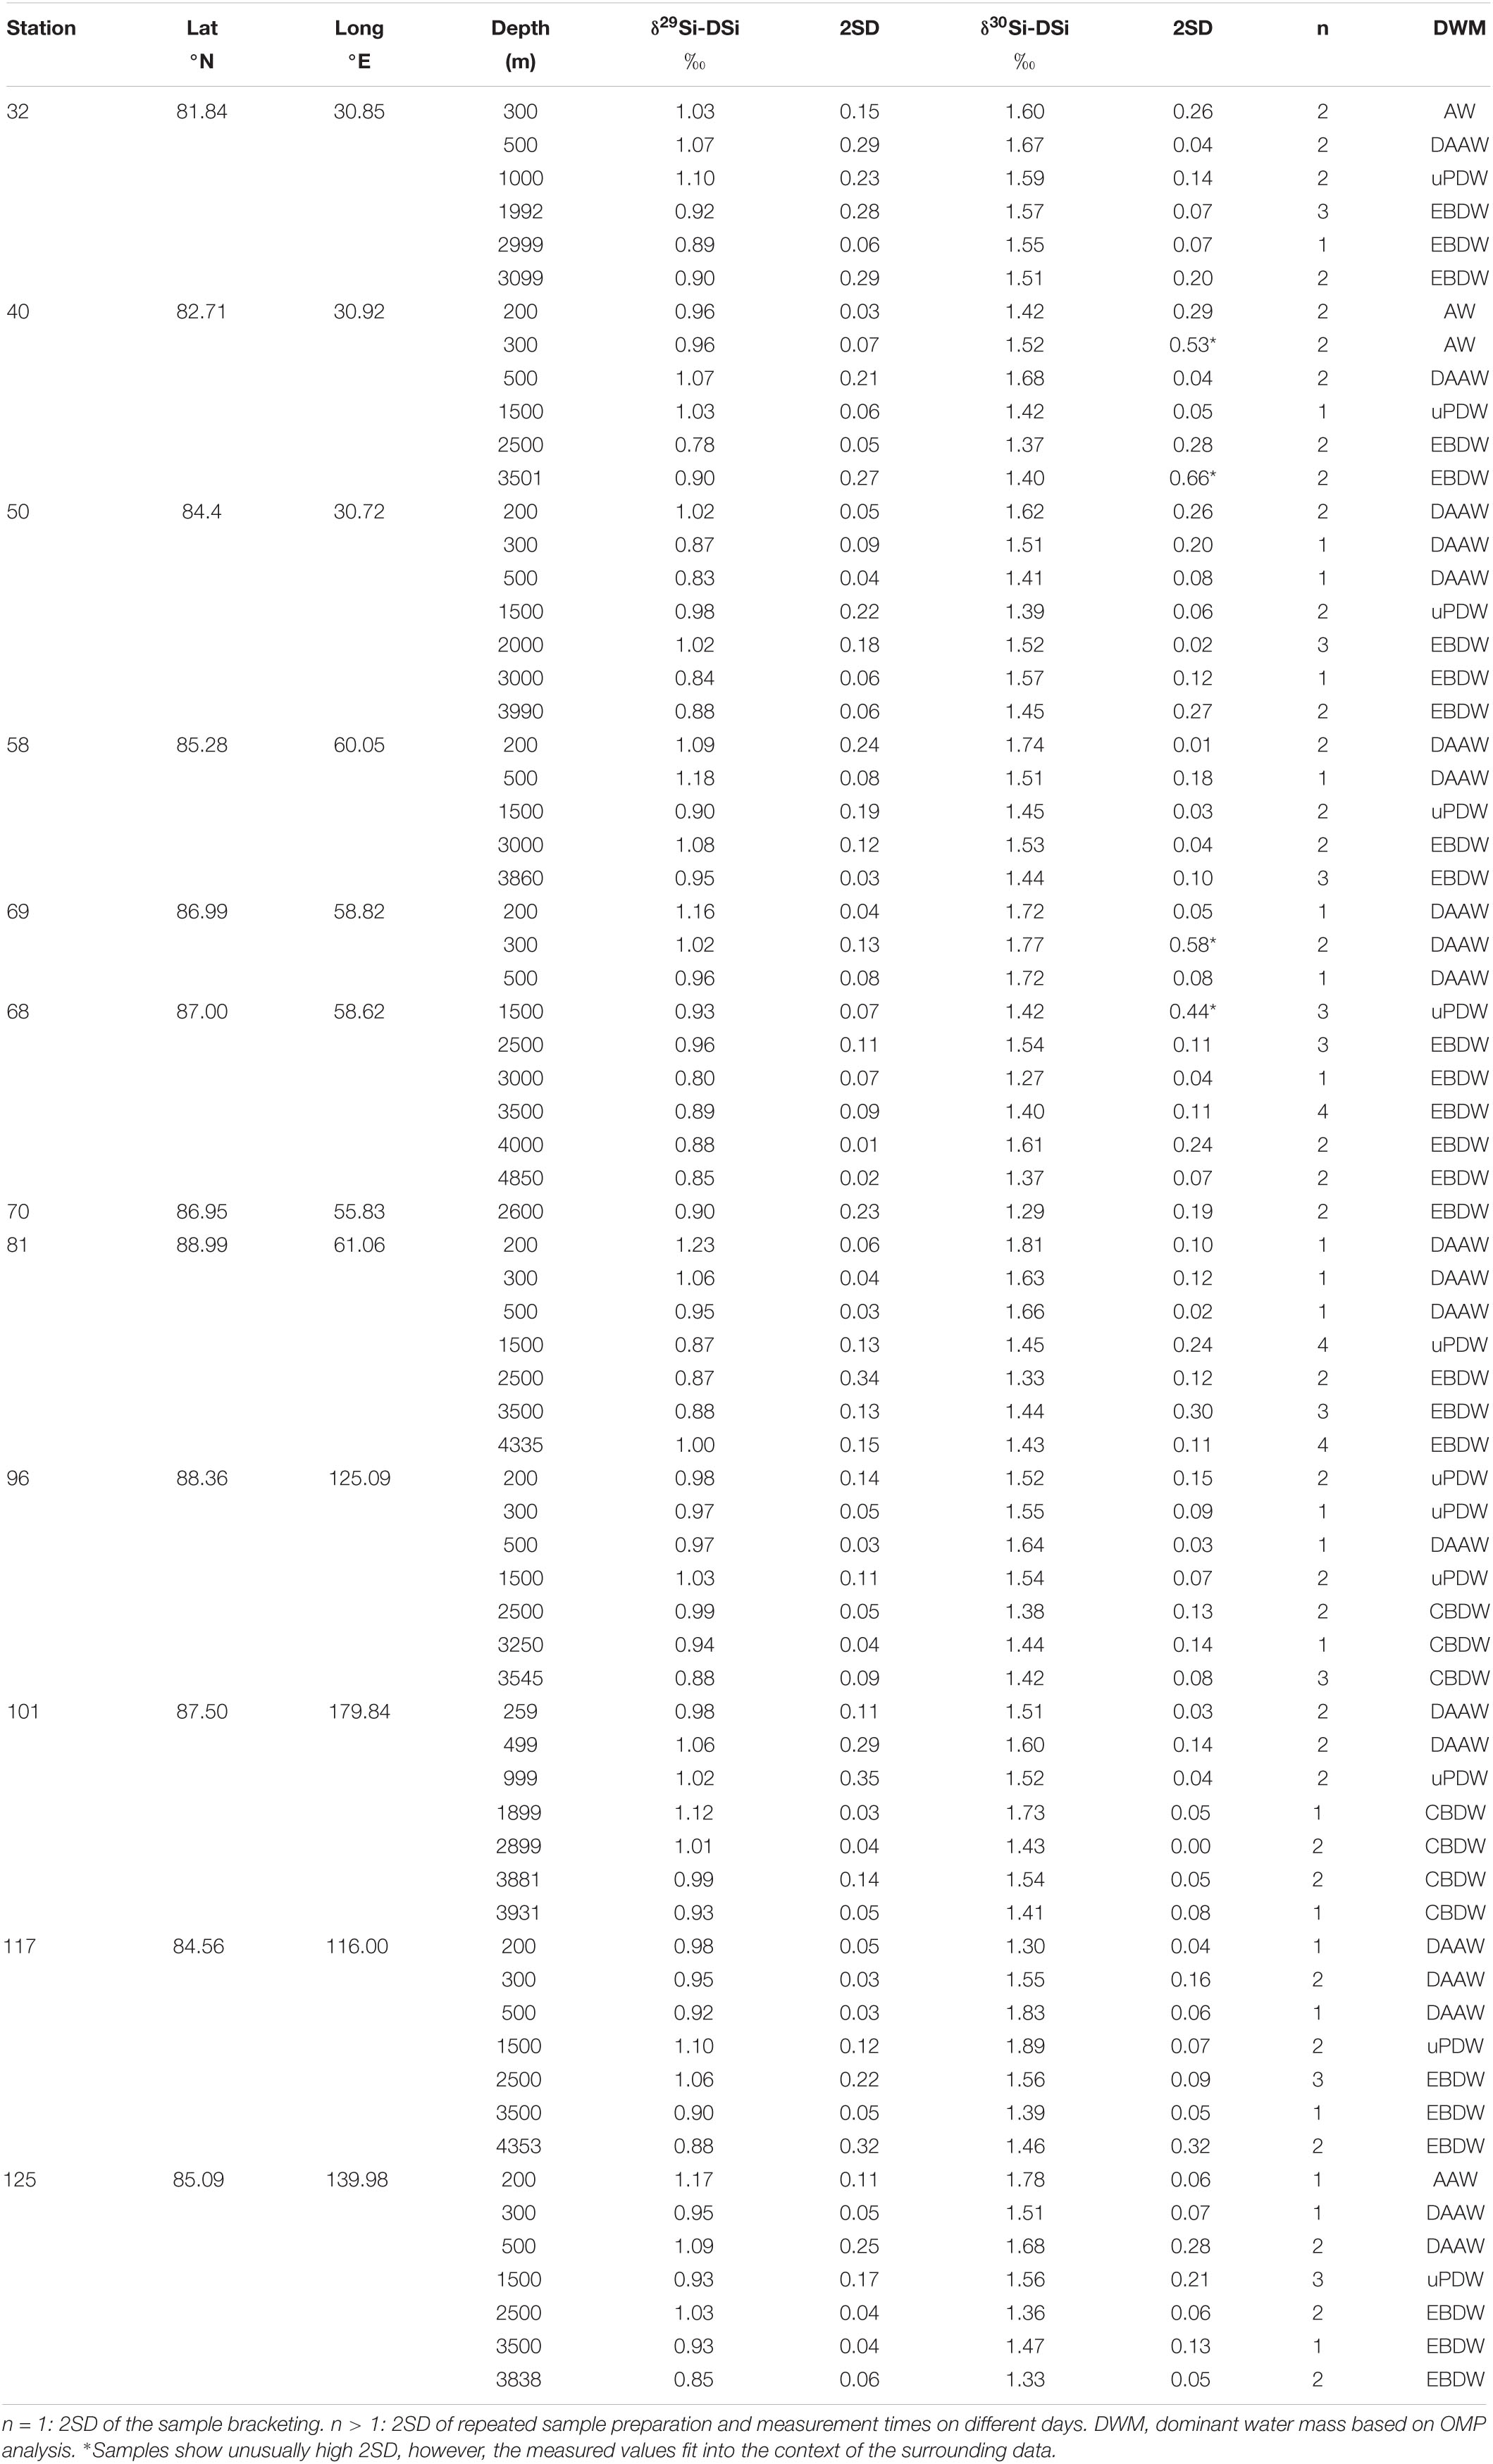
Table 2. Sample locations from the RV Polarstern cruise PS94, collected between August and October 2015 along with δ29Si-DSi δ30Si-DSi.
The samples for seawater δ30Si-DSi analyses were taken from 200 to 4850 m water depth using a standard rosette with 24 × 12 L Niskin bottles. The rosette was equipped with a SeaBird CTD (conductivity, temperature, and depth/pressure) system and an oxygen sensor. The water samples were filtered directly from the Niskin bottles through AcroPak500 filter cartridges (0.8/0.45 μm pore size, Supor pleated membrane) into acid cleaned (with 0.5 N ultra-clean HCl and Milli-Q water) Low Density PolyEthylene (LDPE) containers for further processing in the home laboratory.
Suspended particles were sampled at 7 stations (32, 50, 81, 96, 101, 117, and 125) in the Central AO for analysis of particulate δ30Si-bSiO2 (Figure 1 and Table 3). Samples were taken from 200 to 4161 m water depth using in situ pumps (Mc-Lane and Challenger) equipped with pre-cleaned (1 N HCl and Milli-Q water) Supor filters (0.8 μm pore size, 142 mm diameter). Up to 934 L were pumped through each filter. The filters were cut onboard under a laminar flow hood and a 23 mm diameter piece (equivalent to ∼15 L of pumped seawater) was retrieved, which was stored in plastic bags in the fridge for particulate δ30Si-bSiO2 analysis in the home laboratory.
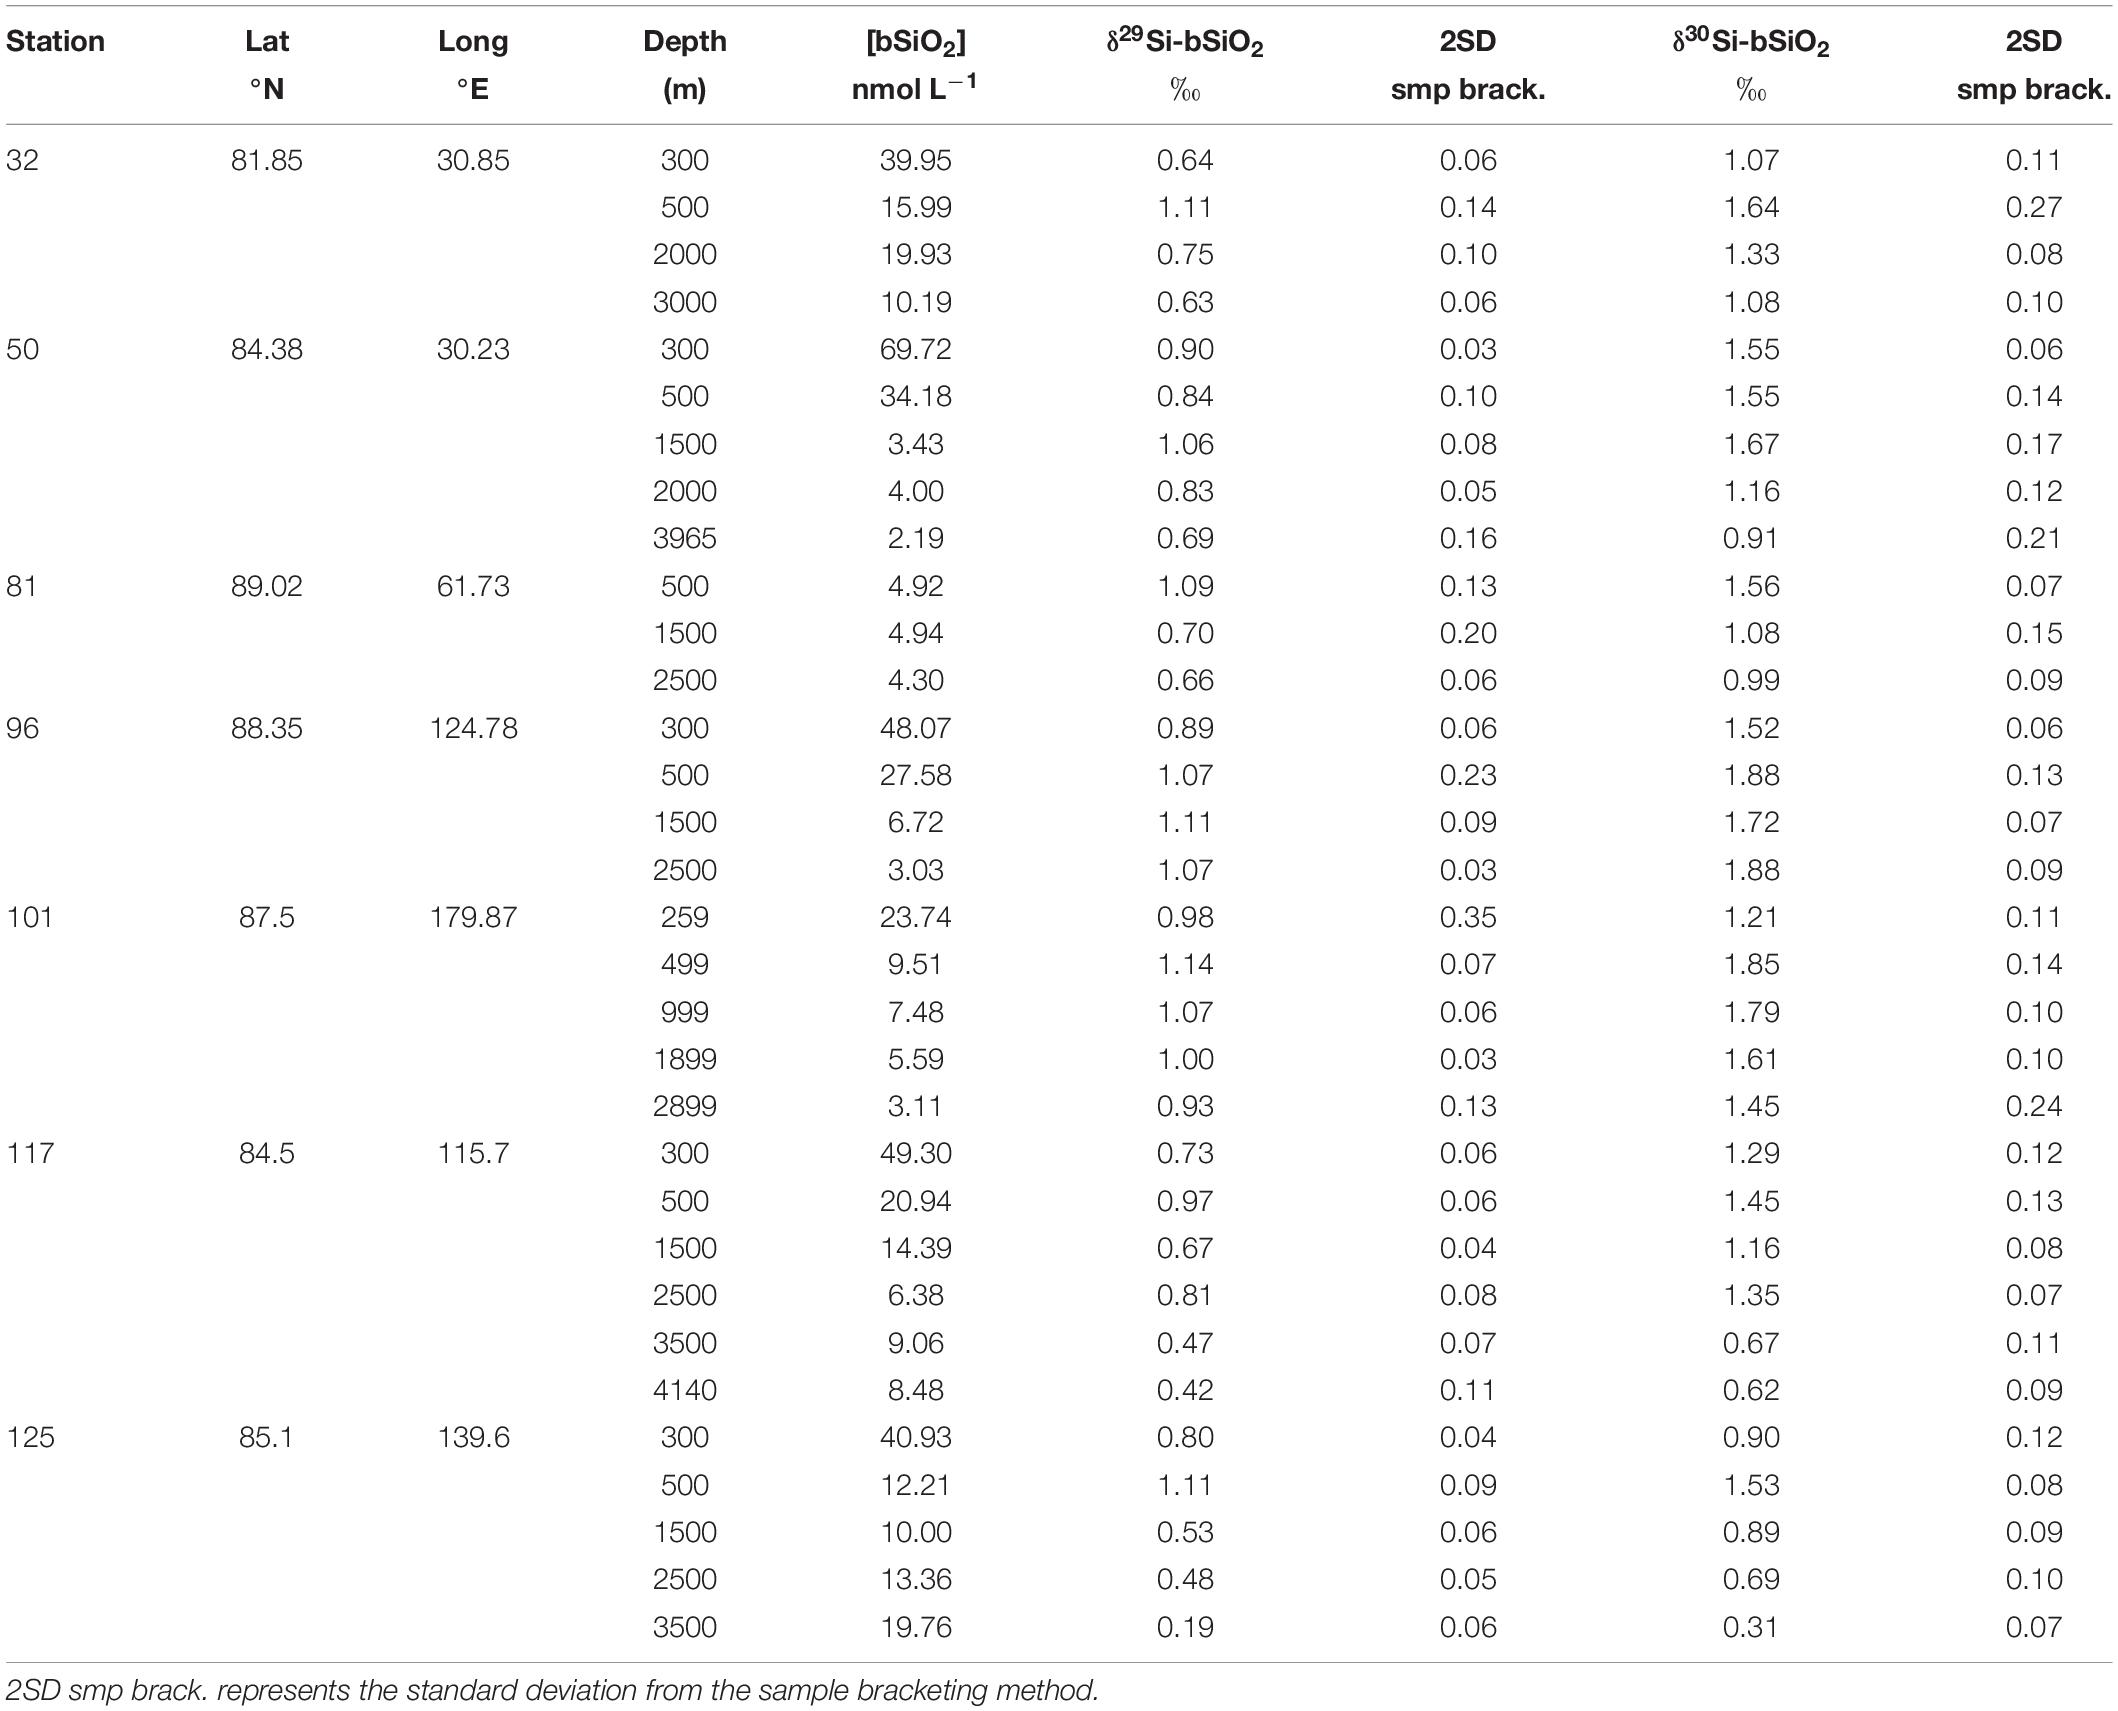
Table 3. Biogenic Silica concentrations and δ30Si-bSiO2.
Silicon Concentration and Sample Preparation for Silicon Isotope Analyses
Onboard [DSi] analysis data and other nutrient data used here are from van Ooijen et al. (2016) and are available on PANGAEA1. These data are presented in Figure 4. Purification and preconcentration of DSi from seawater samples for δ30Si-DSi analyses (from ∼60 mL each) was achieved applying a double two-step magnesium hydroxide [Mg(OH)2] co-precipitation method (“MAGIC” method, following Karl and Tien, 1992, modified by Reynolds et al., 2006; de Souza et al., 2012). Sample preparation was done in the clean laboratory of the Institute for Chemistry and Biology of the Marine Environment (ICBM) of the University of Oldenburg. The published method by Reynolds et al. (2006) and de Souza et al. (2012) used 24 h for settling of the precipitate. However, the very low [DSi] in AO seawater required a longer settling time of at least 48 h to achieve a quasi-quantitative Si yield of >97% in the precipitate thus avoiding relevant isotope fractionation resulting from incomplete coprecipitation with Mg(OH)2. The yield was monitored through colorimetric analyses of the [DSi] in the supernatant following Hansen and Koroleff (1999).
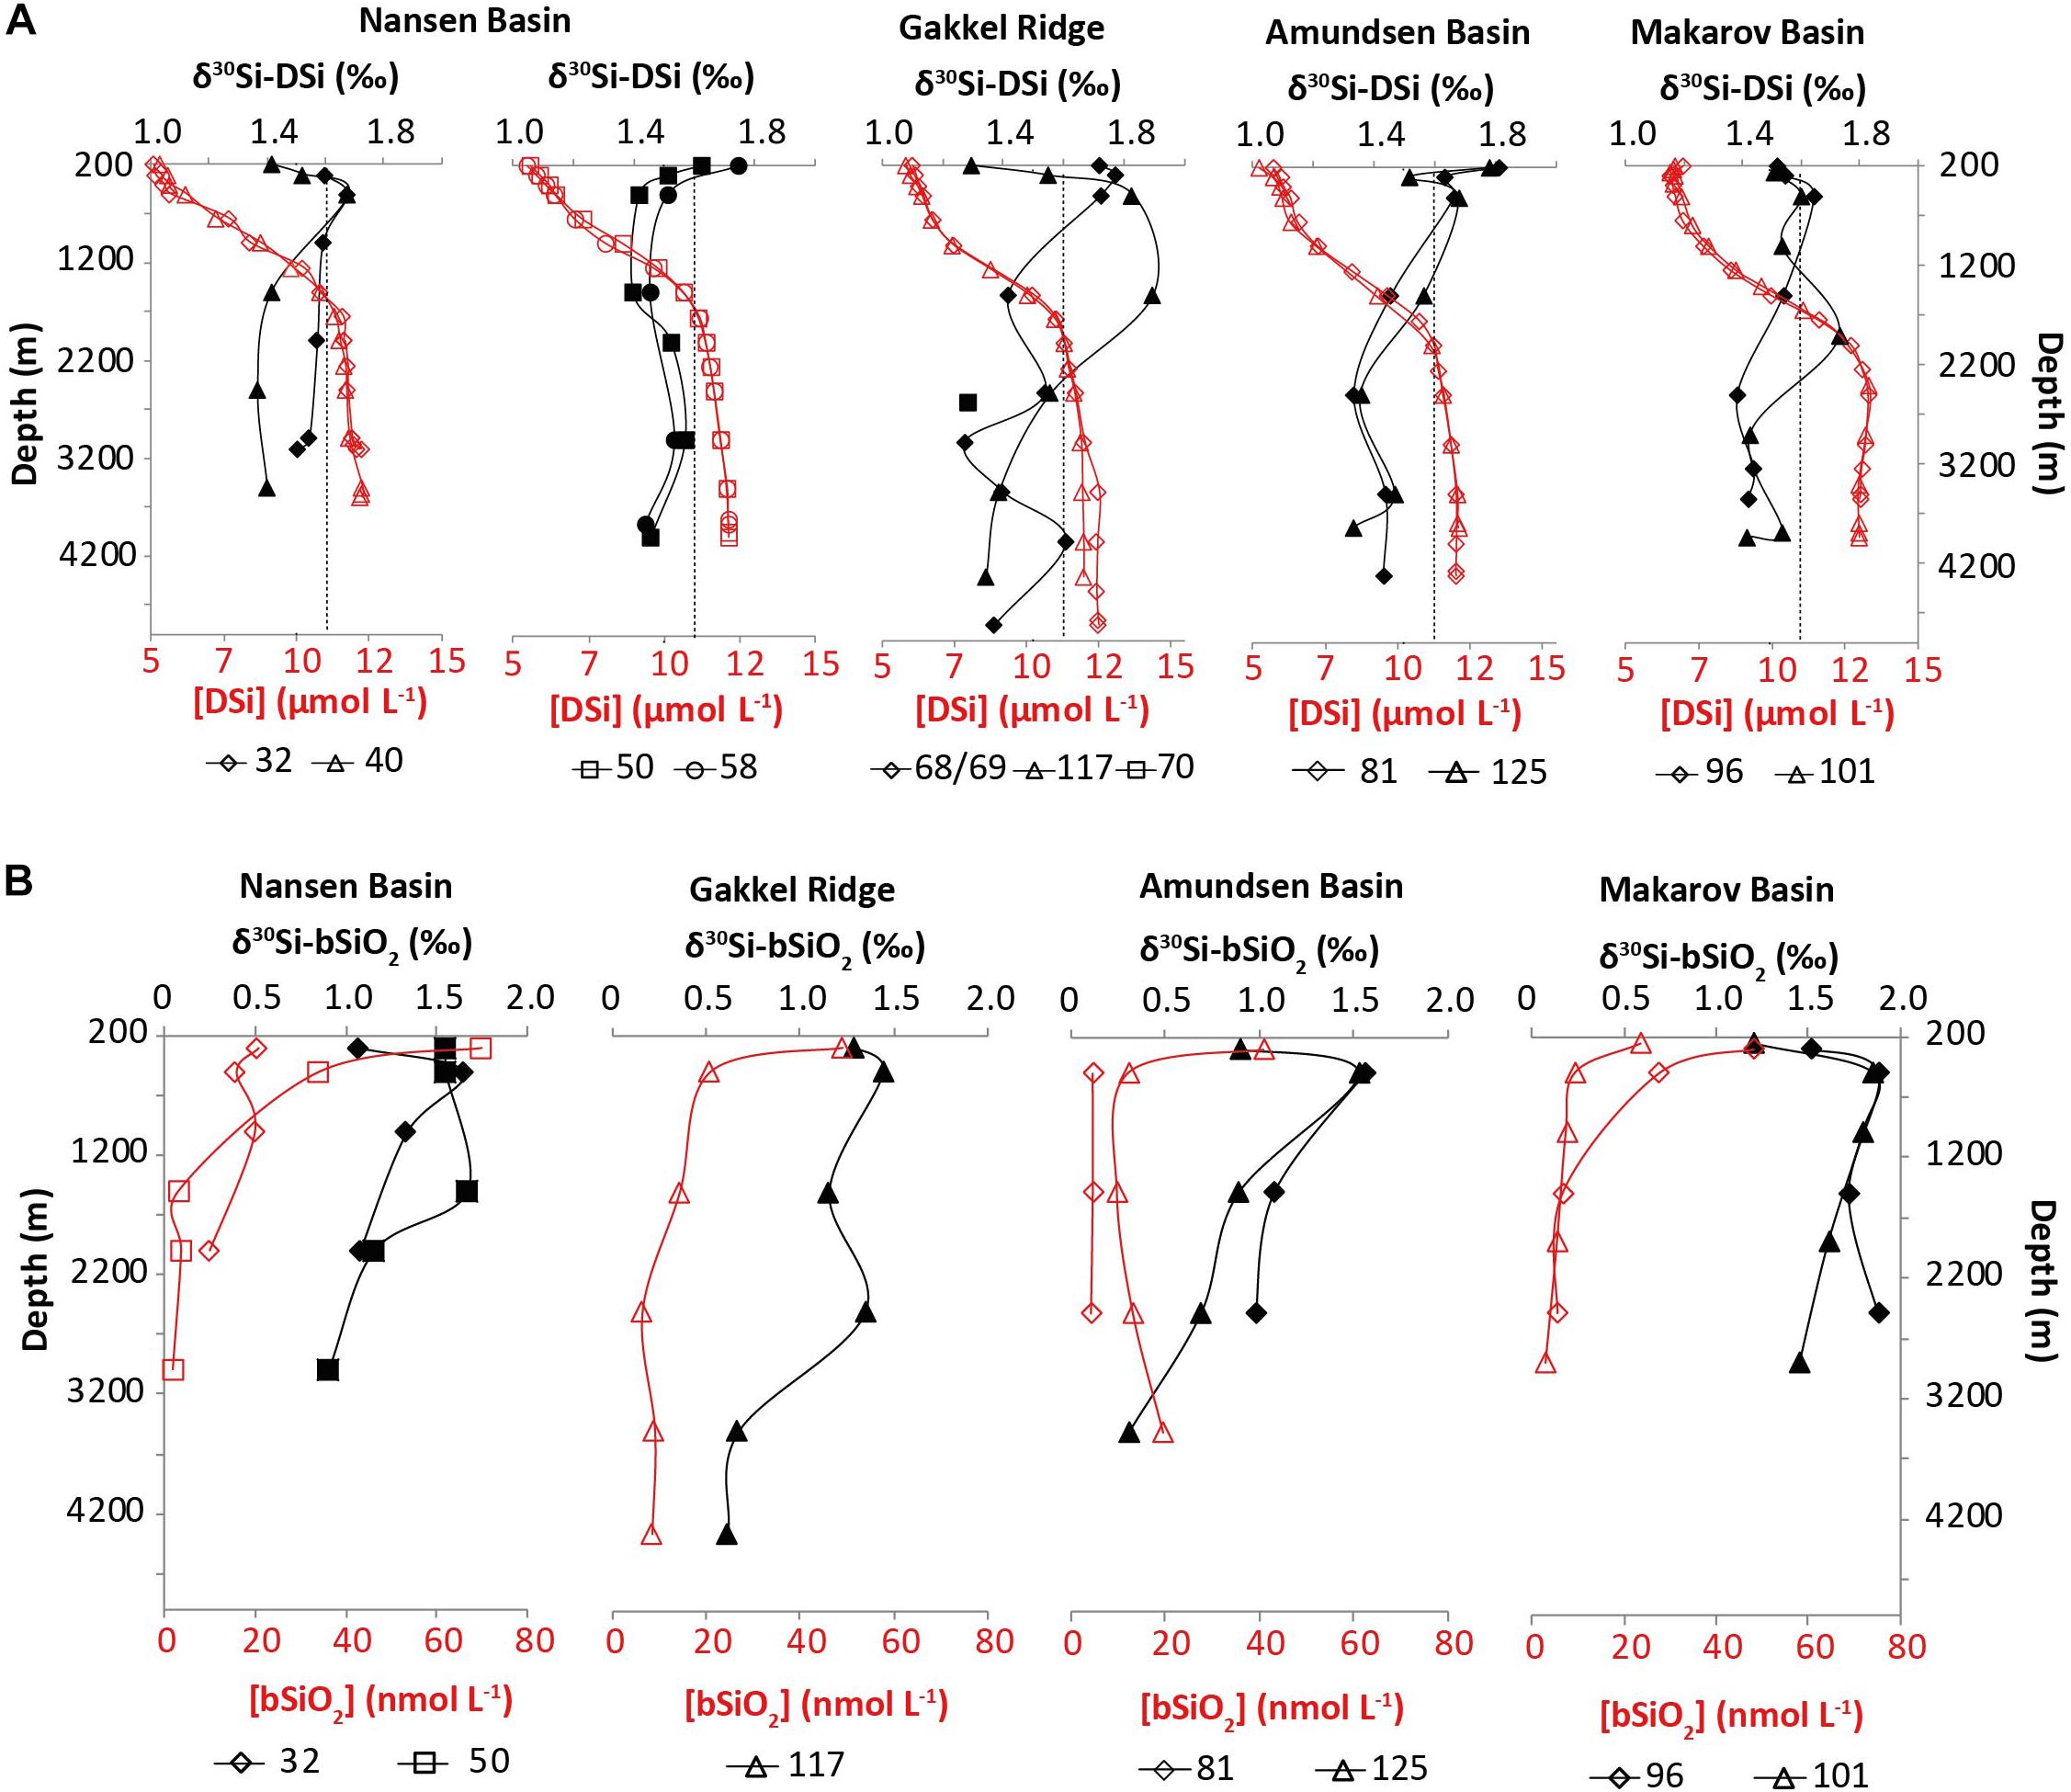
Figure 4. (A) Water column profiles of δ30Si-DSi (black filled symbols) and [DSi] (red open symbols) for all stations separated by basin Nansen (32, 40, 50, and 58), Amundsen (81 and 125), and Makarov Basins (96 and 101) plus the stations above the Gakkel Ridge (69 and 117). The deep sample of station 70 is located at the depth of the hydrothermal plume. The dotted line represents the Atlantic Water endmember δ30Si-DSi of 1.6‰ determined in this study. (B) Water column profiles of δ30Si-bSiO2 (black filled symbols) and [bSiO2] (red open symbols) for all stations separated by basin Nansen (32 and 50), Amundsen (81 and 125), and Makarov Basins (96 and 101) plus the station above the Gakkel Ridge (117).
Biogenic Silica Concentrations
The particulate biogenic silica concentration ([bSiO2]) was determined using the sodium hydroxide digestion (Ragueneau et al., 2005). The particulate samples were exposed to 0.2 N sodium hydroxide for 40 min. The exposure time of 40 min allowed full dissolution of all bSiO2 and minimizing the dissolution of lithogenic material. Selected ICP-MS measurements of Al concentrations in sample aliquots were all below the detection limit, which indicates very low potential for lithogenic contamination. Similarly, Varela et al. (2016) estimated only 1–3% lithogenic contamination during the digestion for similar samples from the Canadian Basin. Due to the low Al concentration, no correction of the δ30Si-bSiO2 values was done. The [DSi] of the leachates was determined colorimetrically after Hansen and Koroleff (1999).
Silicon Isotope Analyses
Every sample was purified using ion exchange chromatography following the method by Georg et al. (2006). δ30Si was determined in wet plasma mode on a Neptune Plus Multi Collector Inductively Coupled Plasma Mass Spectrometer (MC-ICPMS) (Thermo Fisher Scientific, Germany) at the ICBM, University of Oldenburg. The measurements were carried out with the standard-sample bracketing method with external normalization by magnesium doping used for correction of the mass bias (Cardinal et al., 2003; Oelze et al., 2016). Isobaric interferences of e.g., nitrogen (14N2) and nitric oxide (14N16O) were avoided by medium resolution mode focusing on the left side of the peak shoulder. The samples were prepared for the Neptune Plus MC-ICPMS determinations with Si concentrations as follow: for seawater samples, Si concentrations were ∼0.8 ppm and ∼0.5 ppm Mg (6–7 V intensity for 28Si and 24Mg, respectively), and for particle samples the Si concentrations were ∼0.5 ppm and ∼0.45 ppm Mg (4–5 V intensity for 28Si and 24Mg, respectively). Isotope ratios are expressed relative to the NBS28 quartz sand reference material using the delta notation (‰):
where xSi is 29Si or 30Si.
Reproducibility is given as “2SD repeated” if the sample was precipitated and measured repeatedly on different days, or as “2SD smp brack” if the sample was precipitated and measured only once (standard deviation resulted from the standard-sample bracketing method) (Tables 2, 3). Most of the errors are ≤0.2‰, with the exception of 4 samples yielding significantly higher 2SD between 0.44–0.66‰. However, their average δ30Si-DSi values fall into the range of the other samples so that we decided to include them in the discussion.
Reproducibility of Standards and Intercalibration Samples
During the time of this study, measurements of the reference materials Big Batch (a fractionated SiO2 material prepared at the University of California Santa Barbara) and Diatomite (marine biogenic opal) gave average δ29Si values of -5.47 ± 0.16‰ and δ30Si values of −10.72 ± 0.30‰ (2SD; n = 58) and δ29Si values of 0.59 ± 0.31‰ and δ30Si values of 1.16 ± 0.53h (2SD; n = 36), respectively, well within the range of the intercalibrated values, which are δ30Si −10.48 ± 0.54 ‰ (2SD) and δ30Si 1.26% ± 0.2 ‰ (2SD), respectively (Reynolds et al., 2007; Grasse et al., 2017). In addition, samples from the international GEOTRACES intercalibration study ALOHA300 gave average δ29Si and δ30Si values of 0.81 ± 0.13‰ and 1.27 ± 0.13‰ (2SD, n = 5), respectively, and ALOHA1000 gave average δ29Si and δ30Si values of 0.62 ± 0.22‰ and 1.17 ± 0.46‰ (2SD, n = 5), respectively. These values are within the range of published results of ALOHA300 δ30Si-DSi = 1.68 ± 0.35‰ (∼9 μmol L–1 Si) and ALOHA1000 δ30Si-DSi = 1.24 ± 0.20‰ (∼113 μmol L–1 Si) (Grasse et al., 2017). A three-isotope plot for δ29Si vs. δ30Si for all samples, standards Big Batch, Diatomite and intercalibration samples ALOHA300 and ALOHA1000 show a linear regression line slope of 0.515 (R2 = 0.997, n = 187) (Supplementary Figure S3), in agreement with mass-dependent isotope fractionation (Reynolds et al., 2007).
Optimum Multiparameter Analysis
We performed an Optimum Multiparameter (OMP) analysis (Karstensen and Tomczak, 1999) to investigate water mass mixing and its role on the distribution of DSi and Si isotopes along the studied transect (Table 1). This approach has been used successfully with Si isotopes in the Atlantic Ocean (Brzezinski and Jones, 2015; Sutton et al., 2018b) and in the Canadian Basin of the AO (Varela et al., 2016). However, a limiting factor to perform OMP analysis in the AO is the lack of well-defined endmembers in the literature. We adopted the water mass criteria of Rudels et al. (2012) to characterize the different water masses in our samples and defined endmember values for salinity, potential temperature, oxygen, silicate, nitrate and phosphate using the WOA13 dataset (for detailed information see the Supplementary Figure S1).
Results
Dissolved Si Concentrations and Isotope Composition
The [DSi] and δ30Si-DSi are presented in Figure 4 and Table 2 along with the dominant water mass identified for each sample based on the relative contribution of each water mass obtained from OMP analysis (Figure 3). The [DSi] range from 4.71 to 12.81 μmol L–1 and seawater δ30Si-DSi vary from 1.27 to 1.89‰ between 200 m water depth and the seafloor along our Central AO transect. The vertical [DSi] distribution is characterized by low concentrations at the surface and a downward increase. In general, the variation in δ30Si-DSi is small (1.27–1.89‰), but higher values are found at 200 m at stations 81 and 125 and 500 m at all stations (except for stations 50–58). In general, the δ30Si-DSi mirrors the [DSi] very well and decreases with depth. The lowest δ30Si-DSi is found at station 69 and 70 at depths of 3000 and 2600 m, respectively (1.27 and 1.29‰, respectively), which are the depths influenced by the Gakkel Ridge hydrothermal plume detected by temperature anomalies (Schauer, 2016).
Particulate Si Concentrations and Isotope Composition
The [bSiO2] and δ30Si-bSiO2 are presented in Figure 4 and Table 3. The [bSiO2] show a characteristic vertical distribution with high [bSiO2] up to 69.72 nmol L–1 at shallow depths and a downward decrease to [bSiO2] as low as 2.19 nmol L–1. One exception is station 81 where [bSiO2] of ∼4.72 nmol L–1 are found throughout the whole water column. Maximum δ30Si-bSiO2 of up to 1.88‰ are usually found at 500 m water depth, except for station 50, where maximum δ30Si-bSiO2 are associated with deep waters at 1500 m.
Discussion
Relationship Between δ30Si-DSi and Water Mass Distributions
The transect studied here crosses three AO basins covering multiple inflows and water masses. In order to investigate the relationship between δ30Si-DSi distribution and water mass composition, we compare the δ30Si-DSi with the results from the OMP analysis. We will focus initially on discussing the shallower depths followed by the discussion of greater depths.
Intermediate Water
The water column from 200 to 300 m at stations 32 and 40 is dominated by inflowing AW (Figure 3) and shows δ30Si-DSi of 1.51 ± 0.11‰ (2SEM, n = 3) and [DSi] of 4.87 ± 0.11 μmol L–1 (1SEM, n = 3) (Figure 4 or Table 2). These values are in agreement with the [DSi] determined for the AW source in the Nansen Basin by Roeske et al. (2012). It is much lower than the North Atlantic [DSi] of ∼11 μmol L–1 presented by de Souza et al. (2012) and used by Varela et al. (2016) in a study in the Canadian Basin on the continental shelf in front of the Mackenzie river. However, de Souza et al. (2012) defined their proposed endmember value using a station located in the North Atlantic and hence much further south than the actual inflow of AW into the AO and the stations from the present study. In contrast, the δ30Si-DSi at our two stations 32 and 40 near the Fram Strait AW inflow, where the highest relative contribution of AW is seen based on OMP analysis (85 and 70%, respectively), are similar to the endmember value of 1.55‰ determined by de Souza et al. (2012). At station 32, the δ30Si-DSi average from the entire water column falls on the AW endmember value (average δ30Si-DSi value from all depths of station 32 = 1.58 ± 0.05‰, 2SEM, n = 6). At station 40, the δ30Si-DSi of the AW is only seen at 200–300 m water depth, where the temperature is >2°C and the AW contribution is ∼70%. The δ30Si-DSi and [DSi] value of 300 m with highest AW contribution at station 32 will now be considered as the endmember value for the inflowing AW into the AO (δ30Si-DSi = 1.60‰ and [DSi] = 4.63 μmol L–1).
Despite the shift toward lower salinity and temperature at some stations, AAW was not dominant at any of the stations studied here based on OMP analysis (Figure 3), except for station 125 at 200 m depth (54% AAW). However, the latter value is questionable due to its depth that is untypical for AAW. In general, the relative contribution of AAW in this study was always below 40%.
The water from 200 to 500 m water depth at stations other than, 32 and 40, is dominated by DAAW (47–82%) (Figure 3). At stations 32 and 40 this water mass is restricted to 500 m water depth, but at stations other than 32 and 40 this water mass dominates from 200 to 500 m (∼70–80%) (Figure 3). The DAAW is characterized by δ30Si-DSi of 1.62 ± 0.06‰ (2SEM, n = 21) and [DSi] of 5.61 ± 0.09 μmol L–1 (1SEM, n = 21) (Figure 4 or Table 2). These values deviate from the AW endmember toward higher values (Figure 4 and Table 2). Laterally, the contribution of DAAW increases from the Nansen Basin toward the inner AO. This is consistent with earlier studies suggesting that the Barents Sea branch influence of the AW is greater toward the Amundsen Basin (Schauer et al., 2002; Rudels et al., 2004).
The Barents Sea branch of AW experiences substantial heat loss on the Barents Sea shelf, which in combination with brine rejection during sea-ice formation, leads to the formation of waters dense enough to ventilate the deeper water column in the Central AO (Schauer et al., 2002). This dense water formation on the shelves can have an influence on the δ30Si-DSi and [DSi] (Fripiat et al., 2007). During sea ice formation, the nutrients are expelled from the sea ice similar to major ions (Vancoppenolle et al., 2010). The small pockets formed by the salt create favorable environments for small phytoplankton, where the Si uptake would decrease the [DSi] and increase the δ30Si-DSi of the water. When the sea ice melts, these nutrient-depleted and isotope-enriched waters are released to the water column below along with sea ice diatoms.
The δ30Si-bSiO2 at 500 m has an average value of 1.64 ± 0.13‰ (2SEM, n = 7), agreeing with previous findings that sea-ice diatoms and fluids from sea ice are significantly enriched in heavy Si isotopes relative to the surrounding seawater (Fripiat et al., 2007). In addition, Varela et al. (2016) reported heavy δ30Si-bSiO2 for sea-ice diatoms in the Canadian Basin of the AO leading to very heavy δ30Si-DSi. Besides the brine formation and sea ice melt on the shelves, productivity in the water column on the shelves has a major influence on δ30Si-DSi and [DSi] of these waters during spring and summer, especially in the southern area of the Barents Sea which is kept permanently ice free due to the inflow of relatively warm AW (Sakshaug, 1997). Thus, the growth of diatoms can drive the shelf water δ30Si-DSi toward heavier values due to their preferential uptake of lighter silicon isotopes (De La Rocha et al., 1997). Consequently, such heavy δ30Si-DSi signal can be transferred to the deeper water column of the AO with the dense shelf water or to shallower depths depending on the intensity of ice formation on the shelves (Schauer et al., 2002). Alternatively, the particles could originate from vertical supply of these isotopically heavy biogenic particles from the overlying sea ice area (Varela et al., 2016). The elevated δ30Si-DSi around 500 m water depth (compared to the layer above) corroborates the hypothesis of the lateral transport of waters from the shelves enriched in heavy δ30Si-DSi and δ30Si-bSiO2.
The water column from ∼700 to 1500 m depth is dominated by uPDW (Figure 3) and shows δ30Si-DSi of 1.53 ± 0.09‰ (2SEM, n = 10) paired with [DSi] of 9.26 ± 0.31 μmol L–1 (1SEM, n = 10) (Figure 4 and Table 2). This layer is not restricted by the Lomonosov Ridge and follows therefore the intermediate water circulation pattern (Figure 1). Our OMP analysis shows that the core of uPDW (>90% uPDW) is evident between ∼1000 and 1200 m water depth. The average values determined show a very similar δ30Si-DSi to the AW.
Deep Waters
The waters below ∼1700 m comprise EBDW and CBDW (Figure 3) and show δ30Si-DSi of 1.46 ± 0.04‰ (2SEM, n = 23) and δ30Si-DSi of 1.48 ± 0.09‰ (2SEM, n = 7), respectively, paired with maximum [DSi] of 11.48 ± 0.06 μmol L–1 (1SEM, n = 23) and [DSi] of 12.49 ± 0.12 μmol L–1 (1SEM, n = 7), respectively (Figure 4 and Table 2). The average δ30Si-DSi values determined for EBDW and CBDW are slightly lower than the AW δ30Si-DSi endmember of 1.60‰. This can be due to interaction of deep water with (1) the shelf sediments and/or (2) sinking particles (laterally or in situ transported).
Interaction with shelf sediments can lead to a negative shift in δ30Si-DSi due to the low isotope composition of lithogenic particles of -0.1 to -0.3‰ (Georg et al., 2009) and flux of isotopically light pore water from the sediments (Ehlert et al., 2016). The interaction with sediments from the shelves could decrease the δ30Si-DSi due to input of terrigenous material, which contributes up to 65% of the particles transported to the deep central AO (Fahl and Nöthig, 2007). Every station shows a vertical pattern for δ30Si-DSi of low values at around 200 m with increasing values toward 500 m (exception 50, 58, 81, and 125) and a decrease again below 500 m depth with constant values from ∼1500 m to the bottom. The lack of increase in [DSi] at the very bottom samples agrees with the generally relatively low benthic fluxes from the sediments to the overlying water in the study area (März et al., 2015), which would be consistent with the small/absent shift in the bottom water δ30Si-DSi.
The observed vertical pattern is not expected from vertical supply of particles, either biogenic or lithogenic, as their dissolution would increase the [DSi] and decrease the δ30Si-DSi with depth. Our data show a trend of decreasing δ30Si-bSiO2 with depth, similar to previous work from the Canadian Basin (Varela et al., 2016). This was attributed to a contribution of sea-ice diatoms. Sea ice diatoms utilize DSi strongly in a (semi-)closed environment, thus acquiring heavy δ30Si-bSiO2 (Varela et al., 2016). This is in agreement with Fripiat et al. (2007) who found Southern Ocean sea ice diatom δ30Si-bSiO2 enriched by ∼0.5‰ compared to planktonic diatoms. A recent release of sea ice diatoms and their higher contribution in shallower depths could explain the trend with heavier δ30Si-bSiO2 with shallower water depth. Additionally, efficient aggregation, sinking (Riebesell et al., 1991) and subsequent dissolution of the isotopically heavier sea-ice diatoms likely contributes to the heaviest ever found deep δ30Si-DSi (∼1.88‰) in the Canadian sector of the AO (Varela et al., 2016). Varela et al. (2016) argued that most likely different siliceous particles have different rates of dissolution and some particles can sink relatively intact. This could be true for these fast sinking aggregates of sea ice diatoms that would contribute more in regions where there is a higher sea ice cover. Although showing the same vertical trend for δ30Si-bSiO2 as in the Canadian Basin, we do not observe the same high δ30Si-DSi of 1.88‰ found there (Varela et al., 2016). These authors suggested that deep water in the AO shows the highest δ30Si-DSi due to the restricted deep-water exchange with the world ocean. The shallow sills in the Bering Strait (∼50 m water depth) and the Greenland-Scotland Ridge (∼600–800 m water depth) imply that the inflows from adjacent ocean basins into the AO are limited to surface to intermediate waters with low [DSi] and high δ30Si-DSi. In the AO, the high pre-formed δ30Si-DSi would be further increased through Si uptake and fractionation by diatoms during the growth season (De La Rocha et al., 1997; Fripiat et al., 2007).
A comparison of our new δ30Si-DSi data from waters >1000 m in the Eurasian Basin with the Canadian Basin (Varela et al., 2016) shows a very similar relationship between [DSi] and δ30Si-DSi in deep waters. However, the two datasets show an offset of 0.43‰ with lower values in the Eurasian Basin (Supplementary Figure S2). This can be due to methodological discrepancies and/or different natural processes in the different basins. Offsets between different laboratories analyzing similar samples have been reported before for water samples from the North Atlantic (Brzezinski and Jones, 2015; Sutton et al., 2018b). Both, our laboratory and that of M. Brzezinski (who measured the data presented in Varela et al., 2016) participated in the intercalibration of δ30Si-DSi in seawater (Grasse et al., 2017). Direct comparison between the two laboratories reveals an offset of 0.2‰ for the ALOHA1000 and 0.16‰ for the ALOHA300 sample, with consistently lighter values measured by our lab. Thus, we can consider that ∼0.2‰ of the overall 0.43‰ offset originates from inter-laboratory methodological differences (see also Supplementary Material for further discussion), so that ∼0.23‰ could be related to processes within the different basins that might affect the deep water δ30Si-DSi.
The two basins are known for their difference in deep water mass composition. Specifically, the Eurasian Basin is dominated by AW and brines from the Barents, Kara, and Laptev shelves (Rudels and Quadfasel, 1991), whereas the Canadian Basin has influence by brines from the East Siberian, Chukchi and Beaufort shelves (Jones et al., 1995). We propose that processes along the shelves, within sea-ice and during brine formation control the δ30Si-DSi characteristics in the Eurasian and Canadian Basins. As mentioned before, the intermediate and deep-water formation causes an increase in the δ30Si-DSi at intermediate depths due to enriched δ30Si-DSi waters from the shelves that sinks down to layers of equal densities in the Eurasian Basin. Along with the interaction with isotopically heavy bSiO2, the deep waters in the Eurasian basin show a higher δ30Si-DSi compared to deep waters from other oceans. With the circulation of intermediate waters and advection of deep waters as boundary currents in some areas from the Eurasian Basin to the Canadian Basin, an increase in δ30Si-DSi could be caused by continuous interaction with/dissolution of isotopically heavy bSiO2. Varela et al. (2016) found constantly high δ30Si-DSi values of 2.04 ± 0.11‰ below the halocline that they attributed to the presence of AW. However, this value is very different from the endmember determined for the AW that we find at stations 32 and 40 (1.51 ± 0.11‰, 2SEM, n = 3) and the value determined by de Souza et al. (2012) of ∼1.55‰. This supports our suggestion of modification of AW by waters added from the shelves along the AW circulation pathway to the study site of Varela et al. (2016) near the Mackenzie river inflow. Additionally, the Canadian Basin has more ice cover than the Eurasian Basin (National Snow and Ice Data Center, NSIDC)2, which could contribute to high δ30Si-DSi values found in the Canadian Basin. The influence of heavier δ30Si-bSiO2 from sea-ice diatoms that fractionate stronger than pelagic diatoms (Fripiat et al., 2007), i.e., are characterized by heavier δ30Si-bSiO2, and might form fast sinking aggregates could increase the δ30Si-DSi in the deep Canadian Basin. Furthermore, the Chukchi Shelf is marked by high primary production (Arrigo et al., 2012), likely adding enriched δ30Si-DSi to the CBDW in the Canadian Basin.
In summary, the intermediate and deep water δ30Si-DSi can largely be explained by water mass mixing with strong modifications of deep water δ30Si-DSi during sea ice formation on the shelves. The OMP analysis helped us to identify contributions of the different water masses at our stations. In combination with δ30Si-DSi we could show the influence of shelf-derived waters increasing the intermediate water δ30Si-DSi. In addition, the lateral supply of bSiO2 from sea ice diatoms from the shelves can play a role in modifying the δ30Si-bSiO2 and δ30Si-DSi as these diatoms efficiently fractionate dissolved seawater Si during uptake. Yet, this heavy δ30Si-bSiO2 may not be dissolved uniformly in the water column due to effective aggregation and rapid sinking, and due to its low concentration, do not increase significantly the deep water [DSi] in the Eurasian Basin or modify the δ30Si-DSi.
The Arctic Ocean in the Context of the Global Meridional Overturning Circulation
Previous studies in the Atlantic Ocean have concluded that δ30Si-DSi and [DSi] behave quasi-conservatively and are controlled by mixing between Southern Ocean and North Atlantic water masses (de Souza et al., 2012; Brzezinski and Jones, 2015; Sutton et al., 2018b). However, lack of understanding of the AO influence prevented the characterization of the precursor water masses for the North Atlantic. It was assumed previously that North Atlantic Deep Water (NADW) would have heavy δ30Si-DSi of 1.70–1.85‰ due to the influence of its precursor waters (de Souza et al., 2012; Brzezinski and Jones, 2015; Sutton et al., 2018b). The AO plays an important role for deep water formation in the North Atlantic Ocean, because water leaving the AO and flowing into the Labrador and Nordic Seas is involved in the formation of Denmark Strait Overflow (DSOW), Iceland Scotland Overflow (ISOW), and Labrador Sea Water (LSW), which are precursors of NADW (Dickson and Brown, 1994). In the study of Brzezinski and Jones (2015), a very heavy δ30Si-DSi was assumed for waters coming from the AO, based on the results from Varela et al. (2016) from the Canadian Basin.
The deep-water masses in the AO and Nordic Seas exchange through the ∼2600 m deep Fram Strait. To the South, the shallow sills between Greenland, Iceland and Scotland restrict the deep-water exchange with the North Atlantic. Thus, at intermediate depths, both DSOW and ISOW are fed by water from the AO and Nordic Seas, whereby the DSOW has a higher contribution of surface polar waters from the AO than the ISOW (Hansen and Østerhus, 2000). According to Laukert et al. (2017), based on neodymium isotopes, the DAAW that leaves the AO is the precursor of DSOW. Based on our data, the DAAW has the highest average δ30Si-DSi found in the Central AO with an average δ30Si-DSi of 1.62 ± 0.06‰ (2SEM, n = 21). This value is slightly lower than the value determined by de Souza et al. (2012) in the Irminger Basin of ∼1.8‰ and must indicate modification of the DAAW along its flow path in the Nordic Seas. At the Nordic Seas, cold and dense waters lose their buoyancy and sink to greater depths (Hansen and Østerhus, 2000). Therefore, waters with heavier δ30Si-DSi and low [DSi] from shallower depths will be transferred to the NADW precursors.
The ISOW, that is fed by waters from the Greenland Sea, Norwegian Sea and deep waters from the AO (Hansen and Østerhus, 2000), mixes with water from the North Atlantic after crossing the Iceland-Scotland ridge. The AW influence on the deep waters from the AO and the Nordic Seas (Hansen and Østerhus, 2000; Talley, 2011) and later recirculating AW mixture might explain the similar δ30Si-DSi of 1.45‰ found by Sutton et al. (2018b) for the ISOW in the North Atlantic and the deep waters from the AO (δ30Si-DSi of 1.46‰) (Figure 5).
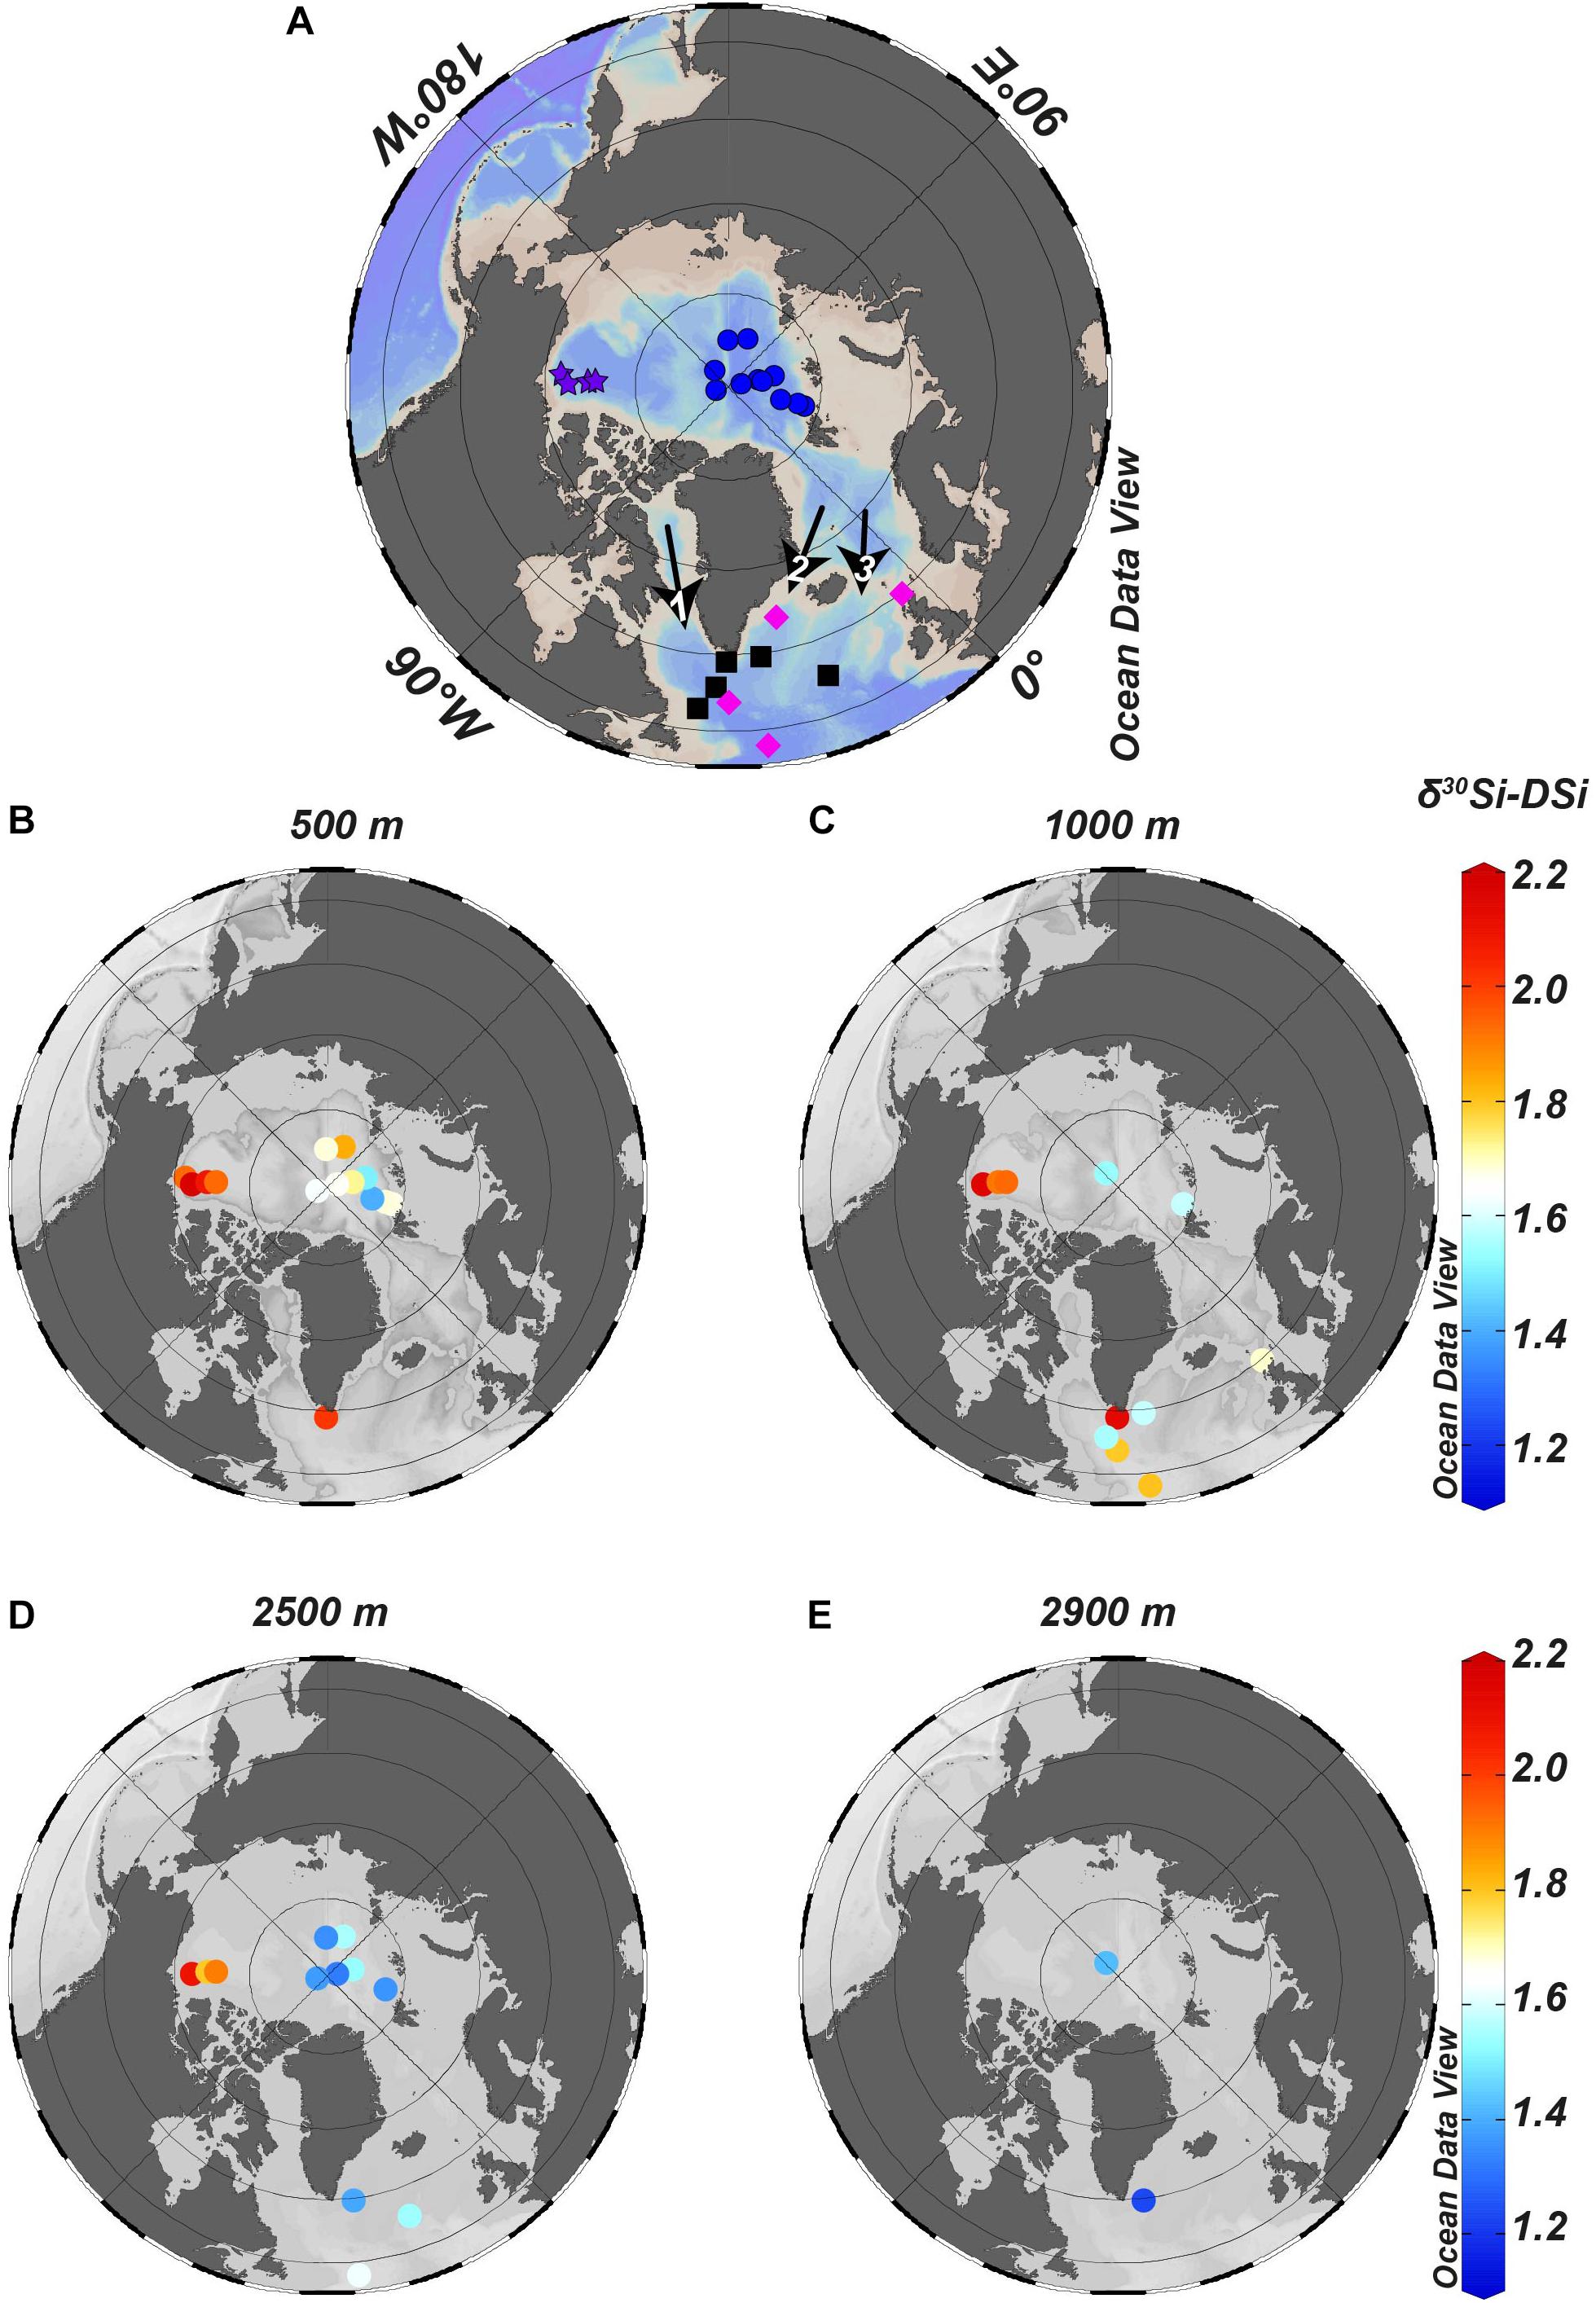
Figure 5. Isosurface plots for δ30Si-DSi for different water depths. (A) Map with blue dots represents the stations of the present study, purple stars represent stations of Varela et al. (2016), pink diamonds represent stations of de Souza et al. (2012) and black squares represent stations of Sutton et al. (2018b). Black arrows mark the outflowing waters: 1 = LSW, 2 = DSOW, and 3 = ISOW. (B) δ30Si-DSi at 500 m and (C) δ30Si-DSi at 1000 m, where Sutton et al. (2018b) determined ∼100% LSW contribution. (D) δ30Si-DSi at 2500 m, where Sutton et al. (2018b) determined 68% NEADW (precursor of ISOW) contribution. (E) δ30Si-DSi at 2900 m, where Sutton et al. (2018b) determined 85% DSOW contribution.
The outflow from the AO through the shallow Canadian Archipelago (maximum 250 m water depth in Kane Basin) toward Baffin Bay and into the Labrador Sea are partly sourced from the Pacific (Jones et al., 2003) and only waters above 1200 m will flow out of Baffin Bay into the southern part of the Labrador Sea (Stordal and Wasserburg, 1986). Consequently, shallow AO waters, with a greater influence from the Canadian than the Eurasian Basin, can be incorporated into LSW. The LSW δ30Si-DSi determined by Sutton et al. (2018b) is the heaviest (∼2‰) of the NADW precursor water masses. According to Sutton et al. (2018b), such heavy δ30Si-DSi that is found at LSW depth (∼1000 m, Figure 5) in the Labrador Sea and Irminger Sea is indicative of transport of Canadian Basin surface waters into the Labrador Sea and incorporation into LSW during its formation. The Pacific influence on Canadian Basin surface water suggested by Jones et al. (2003), may explain the heavy δ30Si-DSi. According to Varela et al. (2016), the modified Pacific Water has a very high δ30Si-DSi of ∼2.0‰, most likely due to modifications that these waters experience when crossing the Chukchi Sea and its high productivity area.
The AO is characterized by several isotopically slightly different endmember values that contribute to NADW (Figure 5). From our observations in the Eurasian Basin, the deep waters in the Central AO are isotopically heavy, but lighter than in the Canadian Basin (Varela et al., 2016). The high δ30Si-DSi endmember composition proposed previously for the whole AO that has been related to the deep convection of surface waters enriched in heavier isotopes (de Souza et al., 2012; Brzezinski and Jones, 2015), is therefore confirmed. Due to the contribution of the isotopically heavy water from the Canadian Basin to the Labrador Sea and the highest contribution of LSW to NADW (Swift, 1984), the heavy isotope signal prevails and contributes to the isotope composition of NADW precursors of 1.70–1.85‰. However, DSOW and ISOW that carry a lighter isotope signal due to the stronger contribution of Central AO sources, add an isotopically lighter signal to NADW. However, further studies within the Nordic and Laptev Seas are required in order to better understand the processes controlling the distribution of Si isotopes in these areas and how they are modified along this flow path. Our data therefore demonstrate the characteristic δ30Si signals of NADW precursor water masses that can support quantifications of the relative precursor contributions to NADW and potential future changes arising from continued Arctic warming.
The Gakkel Ridge Hydrothermal Influence on the Si Cycle in the Arctic Ocean
The ultra-slow spreading Gakkel Ridge is a key bathymetric feature in the central Eurasian Basin, with an extent of 1800 km and multiple active hydrothermal vents (Edmonds et al., 2003). The uniformity in hydrography in the AO below ∼1000 m in each basin is caused by the restriction of circulation to individual basins by the topography (Aagaard et al., 1985). This allows the hydrothermal plumes to be detected relatively far away (up to ∼180 km) from their sources (Edmonds et al., 2003; Baker et al., 2004).
In general, hydrothermal fluids are characterized by very low δ30Si-DSi of about -0.3‰ (De La Rocha et al., 2000) and high [DSi] accounting for 10% of the global input of Si to the oceans (Tréguer and De La Rocha, 2013). Such high contribution of low δ30Si-DSi could potentially lower the seawater δ30Si-DSi (average value of 1.2–1.5‰) and increase the [DSi] of the surrounding waters. So far, hydrothermal plume δ30Si-DSi has been reported only by Brzezinski and Jones (2015) in the North Atlantic over the Trans-Atlantic Geotraverse (TAG) hydrothermal plume. These authors found minimum δ30Si-DSi of seawater under the influence of hydrothermal plume. Yet, the isotopic shift relative to adjacent water masses was within the uncertainty of the method and no increase in [DSi] was observed (Brzezinski and Jones, 2015), suggesting that any hydrothermal DSi input would be masked by already high [DSi] (∼36 μmol kg–1) of the surrounding deep water. Thus, a greater influence from the hydrothermal plume would be necessary to allow its detection based on [DSi] and δ30Si-DSi. The low [DSi] found throughout the whole water column in the AO could increase the chances of detecting a hydrothermal signal.
During cruise PS94, it was possible to detect a hydrothermal plume based on a positive temperature anomaly (Rabe et al., 2016; Schauer, 2016), elevated dissolved iron concentrations (Rijkenberg et al., 2018), and a deficit of 230Th (Valk et al., 2018). Its influence is found at station 69 and more strongly at station 70 at water depths between 2000 and 3000 m. At station 69, we sampled a full high-resolution profile, but at station 70 we only have a sample from one depth within the plume (2600 m). Both stations show a minimum in δ30Si-DSi at 3000 m (station 69) and 2600 m (station 70) (Figure 4 and Table 2). The δ30Si-DSi of 1.28 ± 0.02‰ (2SD, n = 2) (Table 2) indicates a depletion of ∼0.2‰ compared to the surrounding deep water (2500 and 3500 m at station 69). At station 70, the δ30Si-DSi depletion is accompanied by elevated [DSi] by ∼2 μM compared to surrounding waters (Figure 4 and Table 2; van Ooijen et al., 2016), which was not evident at station 69. Based on thorium isotopes, Valk et al. (2018) proposed that PS94 stations 50 and 58 were also influenced by the hydrothermal plume due to (re)circulation in the Nansen Basin. However, this is not reflected in our Si isotope data. Pairing the thorium isotope data (Valk et al., 2018) with dissolved iron concentrations from the cruise of this study (2015) and a cruise in 2007 (Klunder et al., 2012) indicates interannual variability in hydrothermal activity (Rijkenberg et al., 2018; Valk et al., 2018). Despite the analytical uncertainty, a depletion on δ30Si-DSi and increase in [DSi] at depths of plume detection is consistent with a hydrothermal influence. Possibly, the weak depletion on δ30Si-DSi and increase in [DSi] is due to the ultra-low spreading ridge. Samples taken directly in the plume would give more information on the hydrothermal impact on the AO Si cycle.
Conclusion
In this study we analyzed the dissolved and particulate Si isotope composition (δ30Si-DSi and δ30Si-bSiO2, respectively) of samples from 200 m water depth in the Central AO to investigate the relative influence of water mass mixing and particle dissolution on the Si cycle. Based on OMP Analysis we could identify the different contributions of the water masses in the Eurasian Basin and their relation to the δ30Si-DSi determined in our samples. Waters between 200 and 300 m at stations 32 and 40 reflect the strong influence of the inflowing AW. We showed that DAAW (200–500 m) is marked by the highest δ30Si-DSi, which indicates a strong lateral influence of waters from the shelves, especially the Barents Sea shelf, due to high productivity. Additionally, the δ30Si-bSiO2 was also highest around ∼500 m water depth, which may indicate lateral transport of heavy δ30Si-bSiO2 from e.g., sea ice diatoms from the shelves to the Central AO. There is, however, no indication for a modification of the deep water δ30Si-DSi by the dissolution of this sinking bSiO2, probably due to the low concentration of bSiO2.
In comparison with data from a previous study in the Canadian Basin, the Eurasian Basin has slightly lower δ30Si-DSi and δ30Si-bSiO2. This may be due to the upstream location of the Eurasian Basin and continuous modification through fractionation by sea ice diatoms along the flow path and the vertical and/or lateral supply of the signal to the deep waters, which would be in accordance with the higher abundance of sea ice and higher primary production on the shelves in the Canadian Basin. A difference of the δ30Si-DSi in the two basins is potentially reflected in the outflowing waters from the AO that contribute to the different NADW precursor water masses. It has previously been suggested that the AO has the highest δ30Si-DSi of all oceans and imprints this heavy δ30Si-DSi on NADW. However, a lower average δ30Si-DSi from the intermediate and deep Eurasian Basin has a stronger influence on the overflow waters from the Denmark Strait and the Iceland-Scotland Ridge (DSOW, ISOW), whereas a higher average δ30Si-DSi from the shallower Canadian Basin mainly contributes to the Labrador Sea Water. Consequently, the AO potentially presents several isotopically different endmembers that contribute to NADW and modification in the Nordic Seas is required to explain the heavy δ30Si of NADW.
Another unique condition in the AO is the low [DSi] in deep waters when compared to other oceans creating a good condition to study the influence of hydrothermal input on the Si cycle. In our study, we found a shift of the δ30Si-DSi toward lighter values and a slight increase in [DSi], consistent with previous findings, and suggesting that observations closer to the vent fields might be warranted.
Data Availability Statement
All datasets generated for this study are included in the article/Supplementary Material.
Author Contributions
BL processed and analyzed all seawater and particle samples for δ30Si-DSi and δ30Si-bSiO2 at the University of Oldenburg, conducted all the calculations and the optimum multiparameter analysis using an openly available MATLAB code. CE and KP wrote the funding proposal. BL wrote the manuscript with contributions from CE and KP.
Funding
This work was funded by the Deutsche Forschungsgemeinschaft (DFG, German Research Foundation) grant EH 484/2-1, project number 399076022. Conselho Nacional de Desenvolvimento Científico e Tecnológico (CNPq – Brazil) financially supported BL as part of the Science without Borders Program with a PhD scholarship (Grant 205644/2014-7).
Conflict of Interest
The authors declare that the research was conducted in the absence of any commercial or financial relationships that could be construed as a potential conflict of interest.
Acknowledgments
We thank the Captain and crew of R/V Polarstern expedition PS94. Martina Schulz and Phillip Böning are thanked for invaluable technical support and help in the laboratory. We would like to thank Ronja Paffrath and Ole Valk for sampling. Ursula Schauer and Michiel Rutgers van der Loeff are thanked for acting as chief scientist and as GEOTRACES main PI (coordinator of the GEOTRACES part of the cruise), respectively.
Supplementary Material
The Supplementary Material for this article can be found online at: https://www.frontiersin.org/articles/10.3389/fmars.2020.00202/full#supplementary-material
Footnotes
References
Aagaard, K., Swift, J. H., and Carmack, E. C. (1985). Thermohaline circulation in the Arctic Mediterranean seas. J. Geophys. Res. Oceans 90, 4833–4846.
Arrigo, K. R., Perovich, D. K., Pickart, R. S., Brown, Z. W., Van Dijken, G. L., Lowry, K. E., et al. (2012). Massive phytoplankton blooms under Arctic sea ice. Science 336, 1408–1408. doi: 10.1126/science.1215065
Årthun, M., Ingvaldsen, R. B., Smedsrud, L. H., and Schrum, C. (2011). Dense water formation and circulation in the Barents Sea. Deep Sea Res. I Oceanogr. Res. Pap. 58, 801–817. doi: 10.1016/j.dsr.2011.06.001
Baker, E. T., Edmonds, H. N., Michael, P. J., Bach, W., Dick, H. J., Snow, J. E., et al. (2004). Hydrothermal venting in magma deserts: the ultraslow-spreading Gakkel and Southwest Indian ridges. Geochem. Geophys. Geosyst. 5:Q08002. doi: 10.1029/2004GC000712
Björk, G., Anderson, L. G., Jakobsson, M., Antony, D., Eriksson, B., Eriksson, P. B., et al. (2010). Flow of Canadian basin deep water in the Western eurasian basin of the Arctic Ocean. Deep Sea Res. I Oceanogr. Res. Pap. 57, 577–586. doi: 10.1016/j.dsr.2010.01.006
Brzezinski, M. A., and Jones, J. L. (2015). Coupling of the distribution of silicon isotopes to the meridional overturning circulation of the North Atlantic Ocean. Deep Sea Res. II Top. Stud. Oceanogr. 116, 79–88. doi: 10.1016/j.dsr2.2014.11.015
Cardinal, D., Alleman, L. Y., De Jong, J., Ziegler, K., and André, L. (2003). Isotopic composition of silicon measured by multicollector plasma source mass spectrometry in dry plasma mode. J. Anal. Atom. Spectrom. 18, 213–218. doi: 10.1039/b210109b
Cardinal, D., Alleman, L. Y., Dehairs, F., Savoye, N., Trull, T. W., and André, L. (2005). Relevance of silicon isotopes to Si-nutrient utilization and Si-source assessment in Antarctic waters. Glob. Biogeochem. Cycles 19:GB2007. doi: 10.1029/2004GB002364
Carmack, E., Polyakov, I., Padman, L., Fer, I., Hunke, E., Hutchings, J., et al. (2015). Toward quantifying the increasing role of oceanic heat in sea ice loss in the new Arctic. Bull. Am. Meteorol. Soc. 96, 2079–2105. doi: 10.1175/bams-d-13-00177.1
Codispoti, L. A., Friederich, G. E., Sakamoto, C. M., and Gordon, L. I. (1991). Nutrient cycling and primary production in the marine systems of the Arctic and Antarctic. J. Mar. Syst. 2, 359–384. doi: 10.1016/0924-7963(91)90042-s
De La Rocha, C., Brzezinski, M. A., and DeNiro, M. J. (1997). Fractionation of silicon isotopes by marine diatoms during biogenic silica formation. Geochim. Cosmochim. Acta 61, 5051–5056. doi: 10.1016/s0016-7037(97)00300-1
De La Rocha, C., Brzezinski, M. A., and DeNiro, M. J. (2000). A first look at the distribution of the stable isotopes of silicon in natural waters. Geochim. Cosmochim. Acta 64, 2467–2477. doi: 10.1016/s0016-7037(00)00373-2
De La Rocha, C., Brzezinski, M. A., DeNiro, M. J., and Shemesh, A. (1998). Silicon-isotope composition of diatoms as an indicator of past oceanic change. Nature 395, 680–683. doi: 10.1038/27174
de Souza, G. F., Reynolds, B. C., Rickli, J., Frank, M., Saito, M. A., Gerringa, L. J., et al. (2012). Southern Ocean control of silicon stable isotope distribution in the deep Atlantic Ocean. Glob. Biogeochem. Cycles 26:GB2035.
Dickson, R. R., and Brown, J. (1994). The production of North Atlantic Deep Water: sources, rates, and pathways. J. Geophys. Res. Oceans 99, 12319–12341.
Edmonds, H. N., Michael, P. J., Baker, E. T., Connelly, D. P., Snow, J. E., Langmuir, C. H., et al. (2003). Discovery of abundant hydrothermal venting on the ultraslow-spreading Gakkel ridge in the Arctic Ocean. Nature 421:252. doi: 10.1038/nature01351
Ehlert, C., Reckhardt, A., Greskowiak, J., Liguori, B. T., Böning, P., Paffrath, R., et al. (2016). Transformation of silicon in a sandy beach ecosystem: insights from stable silicon isotopes from fresh and saline groundwaters. Chem. Geol. 440, 207–218. doi: 10.1016/j.chemgeo.2016.07.015
Fahl, K., and Nöthig, E. M. (2007). Lithogenic and biogenic particle fluxes on the Lomonosov Ridge (central Arctic Ocean) and their relevance for sediment accumulation: vertical vs. lateral transport. Deep Sea Res. I Oceanogr. Res. Pap. 54, 1256–1272. doi: 10.1016/j.dsr.2007.04.014
Fripiat, F., Cardinal, D., Tison, J. L., Worby, A., and André, L. (2007). Diatom-induced silicon isotopic fractionation in Antarctic sea ice. J. Geophys. Res. Biogeosci. 112:G02001. doi: 10.1029/2006JG000244
Fripiat, F., Cavagna, A. J., Savoye, N., Dehairs, F., André, L., and Cardinal, D. (2011). Isotopic constraints on the Si-biogeochemical cycle of the Antarctic Zone in the Kerguelen area (KEOPS). Mar. Chem. 123, 11–22. doi: 10.1016/j.marchem.2010.08.005
Georg, R. B., Reynolds, B. C., Frank, M., and Halliday, A. N. (2006). New sample preparation techniques for the determination of Si isotopic compositions using MC-ICPMS. Chem. Geol. 235, 95–104. doi: 10.1016/j.chemgeo.2006.06.006
Georg, R. B., West, A. J., Basu, A. R., and Halliday, A. N. (2009). Silicon fluxes and isotope composition of direct groundwater discharge into the Bay of Bengal and the effect on the global ocean silicon isotope budget. Earth Planet. Sci. Lett. 283, 67–74. doi: 10.1016/j.epsl.2009.03.041
Grasse, P., Brzezinski, M. A., Cardinal, D., De Souza, G. F., Andersson, P., Closset, I., et al. (2017). GEOTRACES inter-calibration of the stable silicon isotope composition of dissolved silicic acid in seawater. J. Anal. Atom. Spectrom. 32, 562–578. doi: 10.1039/c6ja00302h
Hansen, B., and Østerhus, S. (2000). North atlantic–nordic seas exchanges. Prog. Oceanogr. 45, 109–208. doi: 10.1016/s0079-6611(99)00052-x
Hansen, H. P., and Koroleff, E. (1999). “Determination of nutrients,” in Methods of Seawater Analysis, eds K. Grasshoff, K. Kremling, and M. Ehrhardt, (Hoboken, NJ: Wiley Publishing company).
Holmes, R. M., McClelland, J. W., Peterson, B. J., Tank, S. E., Bulygina, E., Eglinton, T. I., et al. (2012). Seasonal and annual fluxes of nutrients and organic matter from large rivers to the Arctic Ocean and surrounding seas. Estuaries Coast. 35, 369–382. doi: 10.1007/s12237-011-9386-6
Jones, E. P., Rudels, B., and Anderson, L. G. (1995). Deep waters of the Arctic Ocean: origins and circulation. Deep Sea Res. I Oceanogr. Res. Pap. 42, 737–760. doi: 10.1016/0967-0637(95)00013-v
Jones, E. P., Swift, J. H., Anderson, L. G., Lipizer, M., Civitarese, G., Falkner, K. K., et al. (2003). Tracing Pacific water in the North Atlantic ocean. J. Geophys. Res. Oceans 108, 13–14.
Karl, D. M., and Tien, G. (1992). MAGIC: a sensitive and precise method for measuring dissolved phosphorus in aquatic environments. Limnol. Oceanogr. 37, 105–116. doi: 10.4319/lo.1992.37.1.0105
Klunder, M. B., Bauch, D., Laan, P., De Baar, H. J., Van Heuven, S., and Ober, S. (2012). Dissolved iron in the Arctic shelf seas and surface waters of the central Arctic Ocean: impact of Arctic river water and ice-melt. J. Geophys. Res. Oceans 117:01027.
Lalande, C., Nöthig, E. M., Bauerfeind, E., Hardge, K., Beszczynska-Möller, A., and Fahl, K. (2016). Lateral supply and downward export of particulate matter from upper waters to the seafloor in the deep eastern Fram Strait. Deep Sea Res. I Oceanogr. Res. Pap. 114, 78–89. doi: 10.1016/j.dsr.2016.04.014
Laukert, G., Frank, M., Bauch, D., Hathorne, E. C., Rabe, B., von Appen, W. J., et al. (2017). Ocean circulation and freshwater pathways in the Arctic Mediterranean based on a combined Nd isotope. REE and oxygen isotope section across Fram Strait. Geochim. Cosmochim. Acta 202, 285–309. doi: 10.1016/j.gca.2016.12.028
März, C., Meinhardt, A. K., Schnetger, B., and Brumsack, H. J. (2015). Silica diagenesis and benthic fluxes in the Arctic Ocean. Mar. Chem. 171, 1–9. doi: 10.1016/j.marchem.2015.02.003
Middag, R., De Baar, H. J. W., Laan, P., and Bakker, K. (2009). Dissolved aluminium and the silicon cycle in the Arctic Ocean. Mar. Chem. 115, 176–195. doi: 10.1016/j.marchem.2009.08.002
Nelson, D. M., Tréguer, P., Brzezinski, M. A., Leynaert, A., and Quéguiner, B. (1995). Production and dissolution of biogenic silica in the ocean: revised global estimates, comparison with regional data and relationship to biogenic sedimentation. Glob. Biogeochem. Cycles 9, 359–372.
Oelze, M., Schuessler, J. A., and von Blanckenburg, F. (2016). Mass bias stabilization by Mg doping for Si stable isotope analysis by MC-ICP-MS. J. Anal. Atom. Spectrom. 31, 2094–2100. doi: 10.1039/c6ja00218h
Rabe, B., Schauer, U., Ober, S., Horn, M., Hoppmann, M., Korhonen, M., et al. (2016). Physical Oceanography Measured on Water Bottle Samples During POLARSTERN Cruise PS94 (ARK-XXIX/3). Bremerhaven: Alfred Wegener Institute, Helmholtz Centre for Polar and Marine Research.
Ragueneau, O., Savoye, N., Del Amo, Y., Cotten, J., Tardiveau, B., and Leynaert, A. (2005). A new method for the measurement of biogenic silica in suspended matter of coastal waters: using Si: Al ratios to correct for the mineral interference. Continent. Shelf Res. 25, 697–710. doi: 10.1016/j.csr.2004.09.017
Reynolds, B. C. (2009). Modeling the modern marine δ30Si distribution. Glob. Biogeochem. Cycles 23:GB2015.
Reynolds, B. C., Aggarwal, J., Andre, L., Baxter, D., Beucher, C., Brzezinski, M. A., et al. (2007). An inter-laboratory comparison of Si isotope reference materials. J. Anal. Atom. Spectrom. 22, 561–568. doi: 10.1007/s11356-016-7262-4
Reynolds, B. C., Frank, M., and Halliday, A. N. (2006). Silicon isotope fractionation during nutrient utilization in the North Pacific. Earth Planet. Sci. Lett. 244, 431–443. doi: 10.1016/j.epsl.2006.02.002
Riebesell, U., Schloss, I., and Smetacek, V. (1991). Aggregation of algae released from melting sea ice: implications for seeding and sedimentation. Polar Biol. 11, 239–248.
Rijkenberg, M. J., Slagter, H. A., Rutgers van der Loeff, M., van Ooijen, J., and Gerringa, L. J. (2018). Dissolved Fe in the deep and upper Arctic Ocean with a focus on Fe limitation in the Nansen Basin. Front. Mar. Sci. 5:88. doi: 10.3389/fmars.2018.00088
Roeske, T., Bauch, D., Loeff, M. R. V., and Rabe, B. (2012). Utility of dissolved barium in distinguishing North American from Eurasian runoff in the Arctic Ocean. Mar. Chem. 132, 1–14. doi: 10.1016/j.marchem.2012.01.007
Rudels, B. (2012). Arctic Ocean circulation and variability-advection and external forcing encounter constraints and local processes. Ocean Sci. 8, 261–286. doi: 10.5194/os-8-261-2012
Rudels, B., Anderson, L., Eriksson, P., Fahrbach, E., Jakobsson, M., Jones, E. P., et al. (2012). Observations in the ocean. In Arctic Climate Change. Dordrecht: Springer, 117–198.
Rudels, B., Jones, E. P., Anderson, L. G., and Kattner, G. (1994). On the intermediate depth waters of the Arctic Ocean. Polar Oceans Role Shap. Glob. Environ. 85, 33–46. doi: 10.1029/gm085p0033
Rudels, B., Jones, E. P., Schauer, U., and Eriksson, P. (2004). Atlantic sources of the Arctic Ocean surface and halocline waters. Polar Res. 23, 181–208. doi: 10.1021/acs.est.7b00788
Rudels, B., Korhonen, M., Schauer, U., Pisarev, S., Rabe, B., and Wisotzki, A. (2015). Circulation and transformation of Atlantic water in the Eurasian Basin and the contribution of the Fram Strait inflow branch to the Arctic Ocean heat budget. Prog. Oceanogr. 132, 128–152. doi: 10.1016/j.pocean.2014.04.003
Rudels, B., Kuzmina, N., Schauer, U., Stipa, T., and Zhurbas, V. (2009). Double-diffusive convection and interleaving in the arctic ocean–distribution and importance. Geophysica 45, 199–213.
Rudels, B., and Quadfasel, D. (1991). Convection and deep water formation in the Arctic Ocean-Greenland Sea system. J.o Mar. Syst. 2, 435–450. doi: 10.1016/0924-7963(91)90045-v
Sakshaug, E. (1997). Biomass and productivity distributions and their variability in the Barents Sea. ICES J. Mar. Sci. 54, 341–350. doi: 10.1006/jmsc.1996.0170
Sarmiento, J. L., Gruber, N., Brzezinski, M. A., and Dunne, J. P. (2004). High-latitude controls of thermocline nutrients and low latitude biological productivity. Nature 427:56. doi: 10.1038/nature02127
Schauer, U. (2016). The Expedition PS94 of the Research Vessel POLARSTERN to the central Arctic Ocean in 2015. Rep. Polar Mar. Res. 703:170.
Schauer, U., Loeng, H., Rudels, B., Ozhigin, V. K., and Dieck, W. (2002). Atlantic water flow through the Barents and Kara Seas. Deep Sea Res. I Oceanogr. Res. Pap. 49, 2281–2298. doi: 10.1016/s0967-0637(02)00125-5
Schauer, U., Muench, R. D., Rudels, B., and Timokhov, L. (1997). Impact of eastern Arctic shelf waters on the Nansen Basin intermediate layers. J. Geophys. Res. Oceans 102, 3371–3382. doi: 10.1029/96jc03366
Schlitzer, R. (2018). Ocean Data View. Available online at: https://odv.awi.de
Smedsrud, L. H., Esau, I., Ingvaldsen, R. B., Eldevik, T., Haugan, P. M., Li, C., et al. (2013). The role of the Barents Sea in the Arctic climate system. Rev. Geophys. 51, 415–449. doi: 10.1002/rog.20017
Stordal, M. C., and Wasserburg, G. J. (1986). Neodymium isotopic study of Baffin Bay water: sources of REE from very old terranes. Earth Planet. Sci. Lett. 77, 259–272. doi: 10.1016/0012-821x(86)90138-x
Sutton, J. N., André, L., Cardinal, D., Conley, D. J., De Souza, G. F., Dean, J., et al. (2018a). A review of the stable isotope bio-geochemistry of the global silicon cycle and its associated trace elements. Front. Earth Sci. 5:112. doi: 10.3389/feart.2017.00112
Sutton, J. N., Souza, G. F. D., Garcia-Ibiliez, M. I., and De La Rocha, C. L. (2018b). The silicon stable isotope distribution along the GEOVIDE section (GEOTRACES GA-01) of the North Atlantic Ocean. Biogeosciences 15, 5663–5676. doi: 10.5194/bg-15-5663-2018
Swift, J. H. (1984). The circulation of the Denmark Strait and Iceland-Scotland overflow waters in the North Atlantic. Deep Sea Res. A Oceanogr. Res. Pap. 31, 1339–1355. doi: 10.1016/0198-0149(84)90005-0
Talley, L. D. (2011). Descriptive Physical Oceanography: An Introduction. Cambridge, MA: Academic press.
Torres-Valdés, S., Tsubouchi, T., Bacon, S., Naveira-Garabato, A. C., Sanders, R., McLaughlin, F. A., et al. (2013). Export of nutrients from the Arctic Ocean. J. Geophys. Res. Oceans 118, 1625–1644. doi: 10.1002/jgrc.20063
Tréguer, P. J., and De La Rocha, C. L. (2013). The world ocean silica cycle. Annu. Rev. Mar. Sci. 5, 477–501. doi: 10.1146/annurev-marine-121211-172346
Valk, O., Rutgers van der Loeff, M. M., Geibert, W., Gdaniec, S., Rijkenberg, M. J., Moran, S. B., et al. (2018). Importance of hydrothermal vents in scavenging removal of 230Th in the Nansen Basin. Geophys. Res. Lett. 45, 10–539.
van Ooijen, J. C., Rijkenberg, M. J. A., Gerringa, L. J. A., Rabe, B., and Rutgers van der Loeff, M. M. (2016). Inorganic Nutrients Measured on Water Bottle Samples During POLARSTERN Cruise PS94 (ARK-XXIX/3). Texel: Royal Netherlands Institute for Sea Research.
Vancoppenolle, M., Goosse, H., De Montety, A., Fichefet, T., Tremblay, B., and Tison, J. L. (2010). Modeling brine and nutrient dynamics in Antarctic sea ice: the case of dissolved silica. J. Geophys. Res. Oceans 115:C02005. doi: 10.1029/2009JC005369
Varela, D. E., Brzezinski, M. A., Beucher, C. P., Jones, J. L., Giesbrecht, K. E., Lansard, B., et al. (2016). Heavy silicon isotopic composition of silicic acid and biogenic silica in Arctic waters over the Beaufort shelf and the Canada Basin. Glob. Biogeochem. Cycles 30, 804–824. doi: 10.1002/2015gb005277
Keywords: silicon isotopes, dissolved silicon, biogenic silica, Eurasian Basin, shelf input, optimum multiparameter analysis, GEOTRACES
Citation: Liguori BTP, Ehlert C and Pahnke K (2020) The Influence of Water Mass Mixing and Particle Dissolution on the Silicon Cycle in the Central Arctic Ocean. Front. Mar. Sci. 7:202. doi: 10.3389/fmars.2020.00202
Received: 30 August 2019; Accepted: 16 March 2020;
Published: 07 April 2020.
Edited by:
Jianfang Chen, Second Institute of Oceanography, Ministry of Natural Resources, ChinaReviewed by:
Robert Newton, Columbia University, United StatesChenhua Han, Lab of Biology and Environment, SIO, MENR, China
Copyright © 2020 Liguori, Ehlert and Pahnke. This is an open-access article distributed under the terms of the Creative Commons Attribution License (CC BY). The use, distribution or reproduction in other forums is permitted, provided the original author(s) and the copyright owner(s) are credited and that the original publication in this journal is cited, in accordance with accepted academic practice. No use, distribution or reproduction is permitted which does not comply with these terms.
*Correspondence: Bianca T. P. Liguori, YmlhbmNhLmxpZ3VvcmlAdW5pLW9sZGVuYnVyZy5kZQ==