 Autumn R. Iverson
 Allison M. Benscoter
 Ikuko Fujisaki3
 Margaret M. Lamont
 Kristen M. Hart
- 1Cherokee Nation Technologies, Contracted to Wetland and Aquatic Research Center, U.S. Geological Survey, Davie, FL, United States
- 2Wetland and Aquatic Research Center, U.S. Geological Survey, Davie, FL, United States
- 3Fort Lauderdale Research and Education Center, University of Florida, Davie, FL, United States
- 4Wetland and Aquatic Research Center, U.S. Geological Survey, Gainesville, FL, United States
Along migration corridors, animals can face natural and anthropogenic threats that differ from those in breeding and non-breeding residence areas. Satellite telemetry can aid in describing the timing and location of these migrations. We use this tool with switching state-space modeling and line kernel density estimates to identify migration corridors of post-nesting adult female loggerhead sea turtles (Caretta caretta, n = 89 tracks) that nested at five beaches in the Gulf of Mexico. Turtles migrated in both neritic and oceanic areas of the Gulf of Mexico with some exiting the Gulf. High-use migration corridors were found in neritic areas to the west of Florida and also in the Florida Straits. Repeat tracking of post-nesting migrations for eight turtles showed variability in track overlap, ranging from ∼13 to 82% of tracks within 10 km of each other. Migration primarily occurred in July and August. We document the longest known post-nesting migration to-date of a wild adult female loggerhead of >4,300 km, along with an apparent stopover of about 1 month. Migration corridors overlaid on three spatially explicit anthropogenic threats (shipping density, commercial line fishing, and shrimp trawling) showed hotspots in the Florida Straits, off the northwest Florida coast and off the coast of Tampa Bay. Identifying where and at what intensity multiple human activities and natural processes most likely occur is a key goal of Cumulative Effects Assessments. Our results provide the scientific information needed for designing management strategies for this threatened species. Information about this loggerhead migration corridor can also be used to inform adaptive management as threats shift over time.
Introduction
Within migrating species there exists a large variety of migratory behavior. This can include nomadic migration where species move long distances to take advantage of irregular or ephemeral resources (e.g., banded stilt, Cladorhynchus leucocephalus; Pedler et al., 2014), one-way migration in which there is no return to the starting point (e.g., European corn borer moth on pre-reproductive migration, Ostrinea nubilalis; Dingle, 2014) and multi-generational migration where the migratory path takes multiple generations to complete (e.g., monarch butterfly, Danaus plexippus; Dingle, 2014). Perhaps the most well-known type of migration is seasonal migration, in which species travel seasonally between spatially separate breeding and non-breeding grounds. Seasonal migration is thought to increase fitness through the escape of deteriorating environmental conditions such as temperature extremes or predators, and/or a gain in energy or reproductive success (Alerstam et al., 2003; Dingle, 2014).
Migration corridors are the predictable routes on which seasonally migrating animals travel. Migratory corridors have been delineated for various species, both terrestrial and marine, around the world (e.g., Berger et al., 2006; Howard and Davis, 2009; Block et al., 2011). Determining migratory corridors for marine species presents unique challenges as animals may move across remote ocean basins for extended periods. However, electronic tools such as GPS and satellite tags have aided in research efforts to uncover these movements (e.g., Block et al., 2011).
While for many species seasonal migration occurs annually, for adult sea turtles migration occurs on average every 2–4 years (Southwood and Avens, 2010). Sea turtles are not the only reptile that migrates, but they are unique in the group as their migration distances are larger than other reptile species by at least an order of magnitude (Southwood and Avens, 2010). They likely navigate these long distances using magnetic and solar cues, as well as local cues, such as odor (Southwood and Avens, 2010). For the Chelonian sea turtles that make round-trip breeding migrations, these involve swimming both with and against currents (Luschi et al., 2003).
During long-distance migration, species can face increased metabolic and physiological challenges (Jenni-Eiermann and Jenni, 2000; Southwood and Avens, 2010). They can also experience a shifting predator assemblage and encounter storms or other unsuitable climate conditions. Beyond this, they may become exposed to potentially dangerous anthropogenic activities such as energy development (Henkel et al., 2014; Vander Zanden et al., 2016), direct or accidental harvesting (i.e., as bycatch, Hays et al., 2003), pollution (Henkel et al., 2012; Keller, 2013), and ship strikes (Casale et al., 2010). Similar to foraging and breeding habitats, migratory corridors represent an important habitat for migrating species. Defining the location and timing of these migratory corridors is a first step in understanding where and how migrating populations may be limited across space and time, and it offers an opportunity for targeted conservation efforts.
Loggerhead sea turtles (Caretta caretta) typically migrate from foraging areas to nesting beaches every 2–4 years (National Marine Fisheries Service [NMFS] and United States Fish and Wildlife Service [USFWS], 2008) sometimes moving thousands of kilometers (Hays and Scott, 2013). Loggerheads in the Gulf of Mexico (GoM) are part of the Northwest Atlantic population, which is listed as threatened (NMFS and USFWS, 2008). Knowledge of the conditions and possible threats along migration routes is important for conservation of the species, and the Loggerhead Recovery Plan lists determining the migratory pathways and management of these habitats as Recovery Objectives/Actions (NMFS and USFWS, 2008). Previous studies have identified migratory pathways for post-nesting loggerheads in the GoM for 28 turtles that nested on the southwest Florida coast (Girard et al., 2009) and 27 turtles from three Florida nesting sites (Foley et al., 2013). These studies have added important knowledge to our understanding of GoM loggerhead migration. However, it is possible that loggerheads nesting on other GoM beaches may use different migratory pathways, so expanding our understanding of loggerhead migration across spatially disparate beaches is important. Also, identifying anthropogenic threats to migratory corridors is key to conservation efforts for loggerheads and has yet to be assessed for their migration corridors in the GoM. Further, no migratory corridor has yet been designated in the GoM for loggerhead critical habitat (NMFS and NOAA, 2014).
Here, we combine 48 previously published migration tracks for post-nesting GoM loggerheads (Hart et al., 2012, 2014, 2015) with another 41 tracks, including some tagged at a new study site at a nesting beach in Everglades National Park, to discover high-use migration corridors in the GoM. We use switching state-space modeling (SSM) to identify these 89 migration routes from five nesting beaches across 8 years (2008–2015) in the GoM, including nesting beaches in both Florida and Alabama. We identify corridors, summarize the peaks in migration timing, display repeat migration patterns for individuals tracked more than once from nesting grounds, and overlay anthropogenic threats during those times onto the migration corridors to determine a migration threat index.
Materials and Methods
Turtle Capture and SSM
Turtle tagging occurred at five study sites in the GoM including at Gulf Shores, Alabama, and four sites in Florida: Eglin Air Force Base on Santa Rosa Island in northwest Florida, St. Joseph Peninsula, Everglades National Park, and Dry Tortugas National Park which included the nesting beaches of Loggerhead Key and East Key (Table 1 and Figure 1).
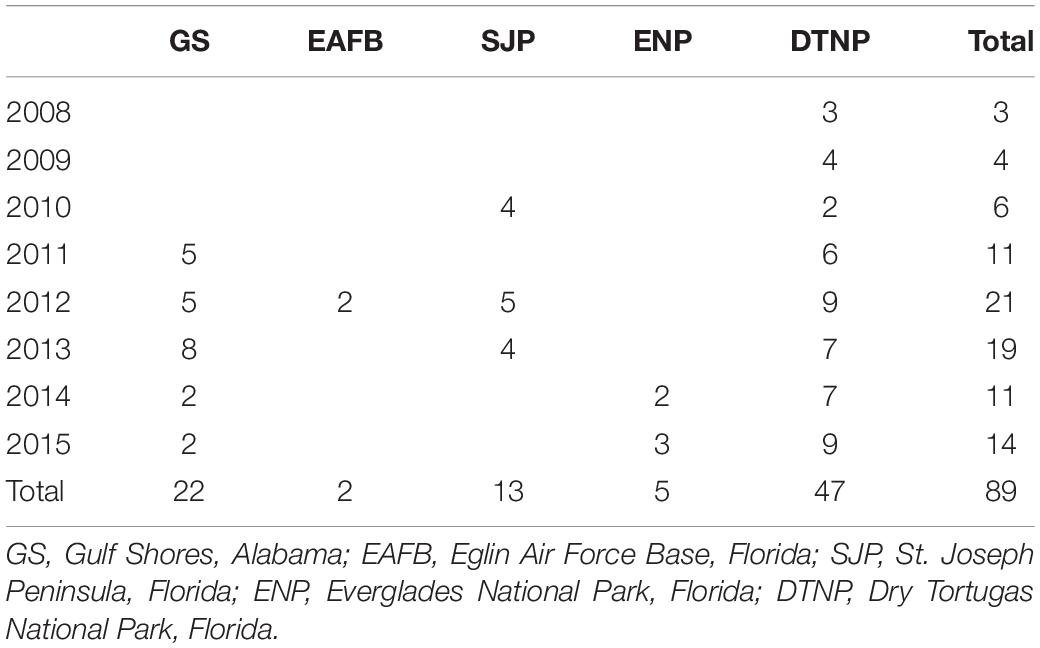
Table 1 Number of loggerhead sea turtle (Caretta caretta) tracks during migration in the Gulf of Mexico after being tagged at various nesting beaches.
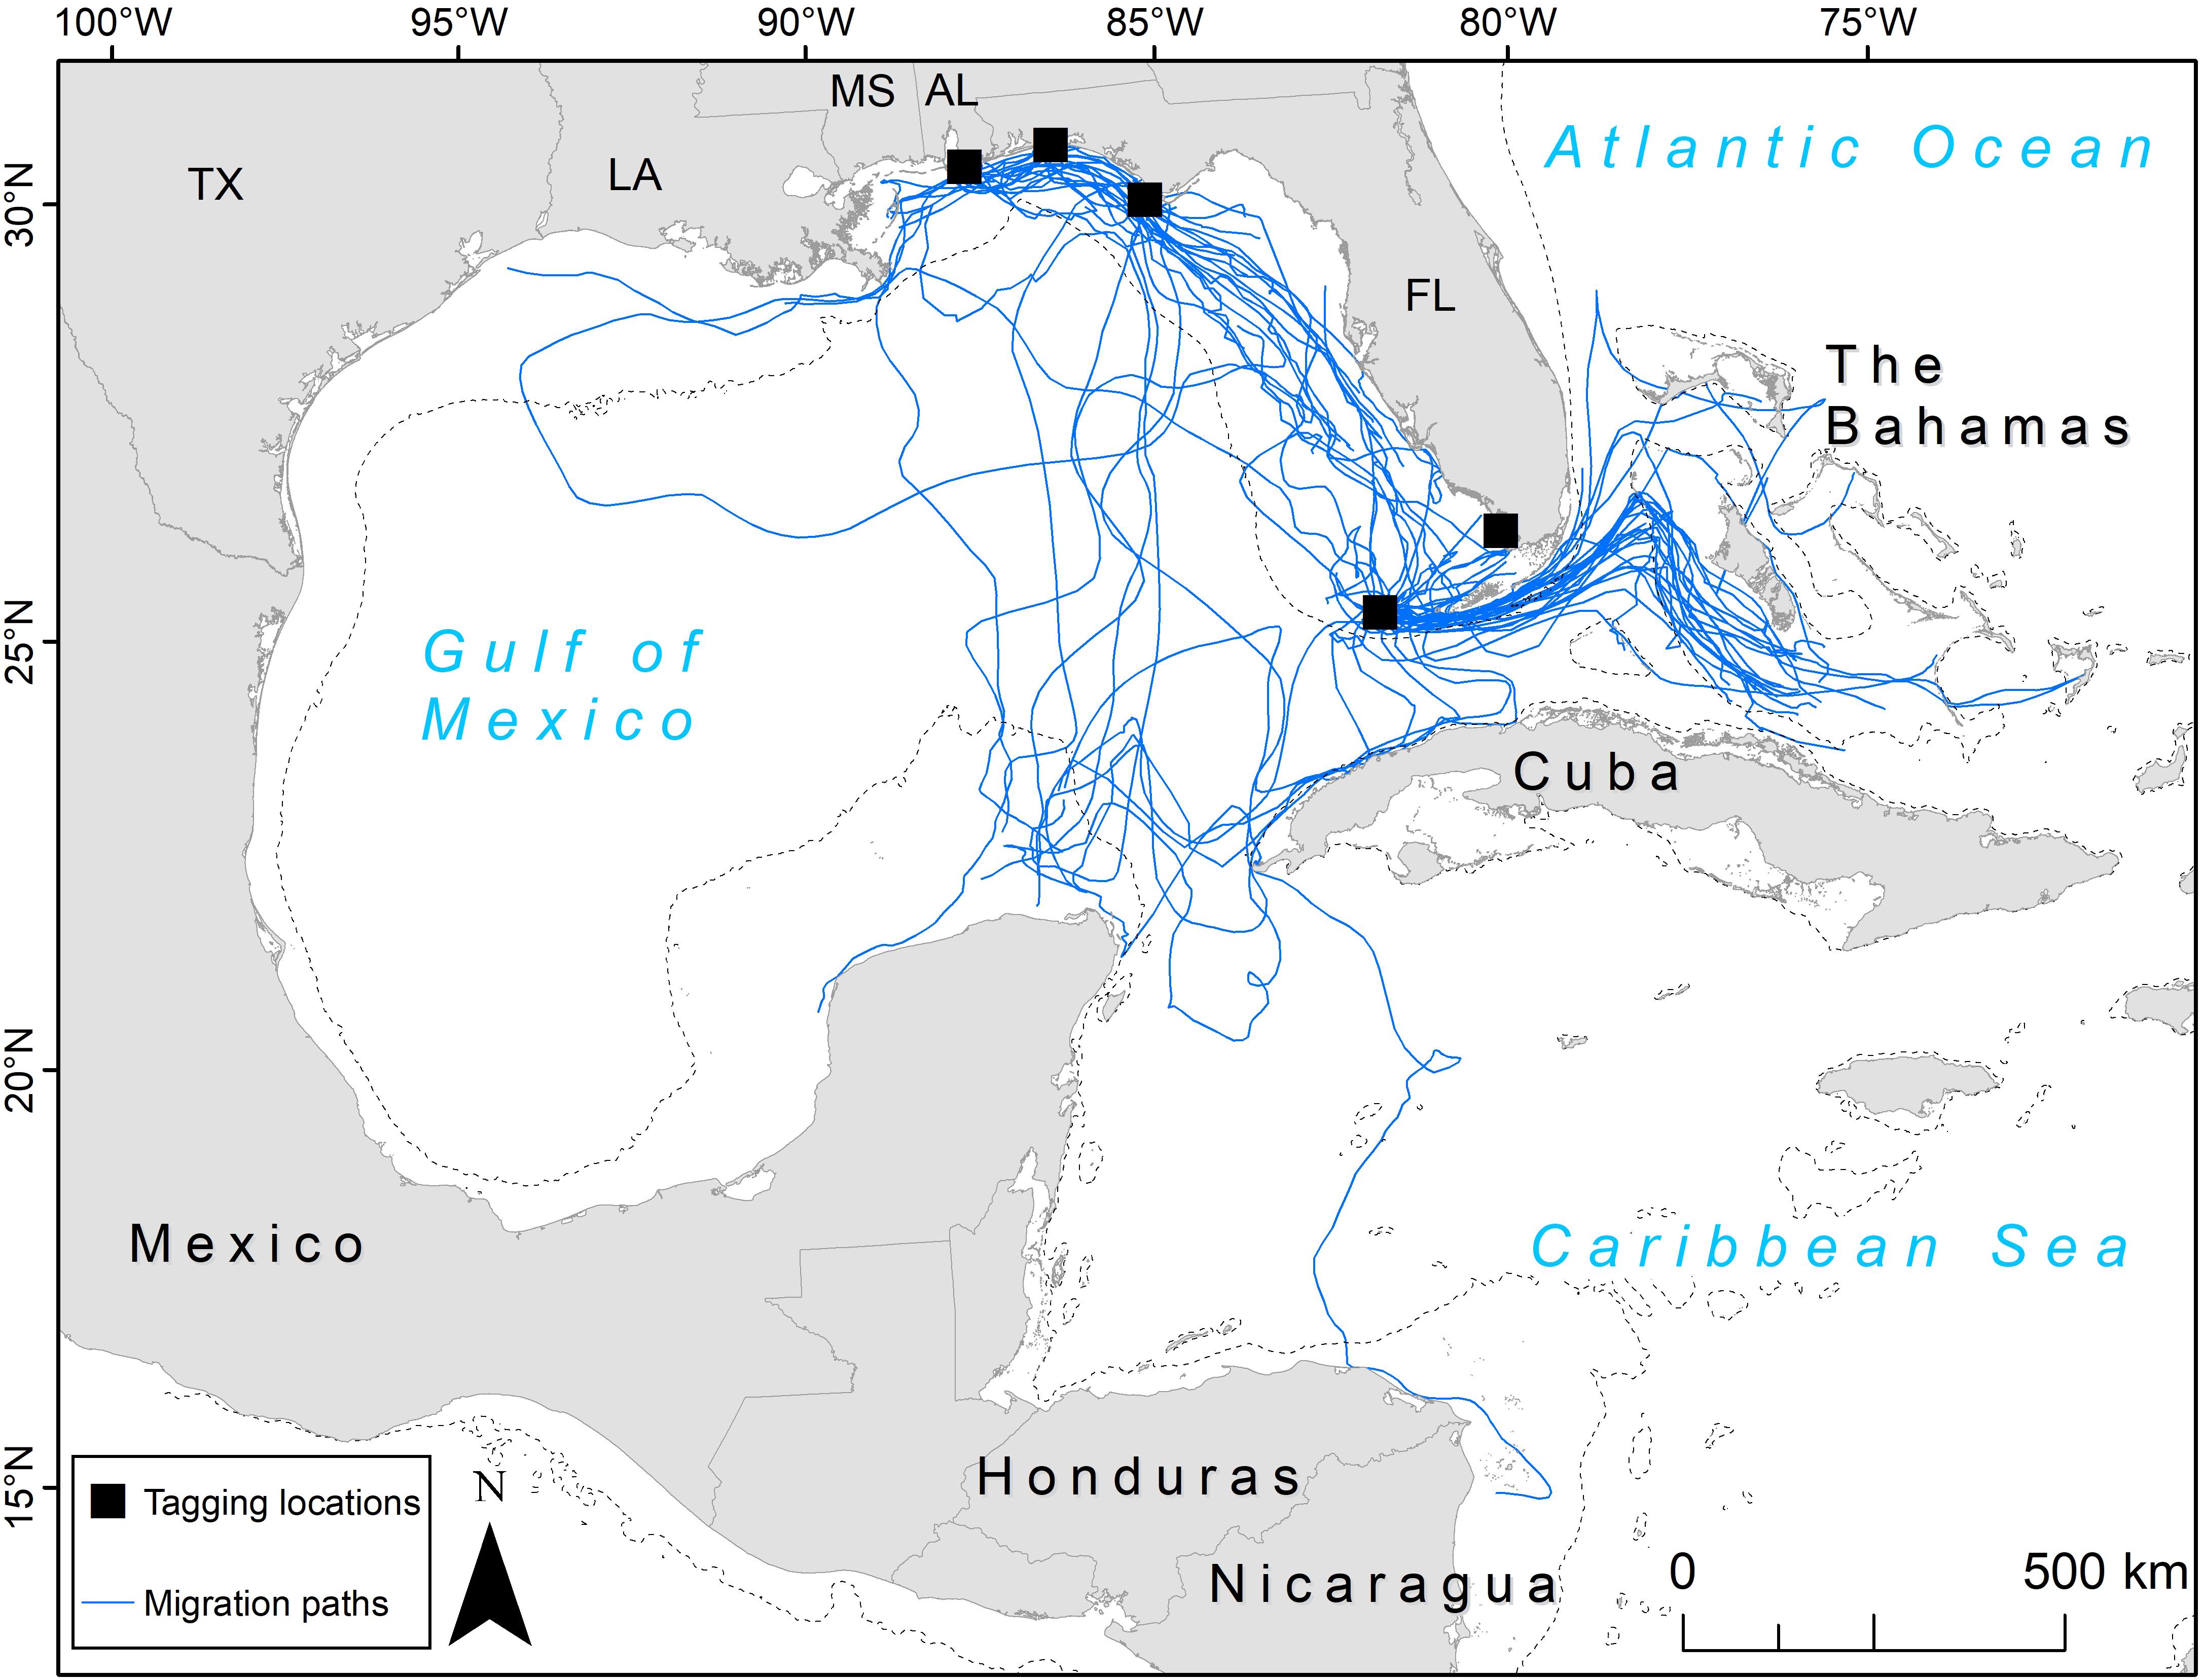
Figure 1. Migration paths (blue lines) taken by 81 adult female loggerhead sea turtles (Caretta caretta; 89 tracks) after being tagged at nesting beaches throughout the Gulf of Mexico. Tagging locations (black squares) from top left moving clockwise: Gulf Shores, Eglin Air Force Base, St. Joseph Peninsula, Everglades National Park, Dry Tortugas National Park. U.S. states are abbreviated: TX, Texas; LA, Louisiana; MS, Mississippi; AL, Alabama; FL, Florida. The 200 m bathymetric contour is shown as a dashed line.
We tagged and outfitted 81 loggerhead females (eight of these were tagged twice for 89 tracks) with satellite transmitters after they nested. All tagging followed established protocols (National Marine Fisheries Service [NMFS]-Southeast Fisheries Science Center [SEFSC], 2008) and methods in Hart et al. (2014). These methods were approved by the United States Geological Survey-Southeast Ecological Science Center-Institutional Animal Care and Use Committee Protocol #2011-05. We fitted a platform terminal transmitter to each turtle (SPOT5 or SPLASH10, Wildlife Computers, Redmond, WA, United States). All tagged turtles were released within 2 h at their capture location.
Satellite data were available for download on the Wildlife Computers Portal.1 We used a hierarchical SSM (Jonsen et al., 2003; Patterson et al., 2008) to characterize the movements of all turtles, following our previous studies where we determined foraging and inter-nesting periods for some of these same turtles ([citeskum]BR17,BR19,BR18,BR20,BR15,BR16[citeekum]Hart et al., 2012, 2013, 2014, 2015, 2018a,b). Specifically, we applied a model used by Breed et al. (2009) that estimates model parameters by Markov Chain Monte Carlo (MCMC) using WinBUGS via the software program R. As input into the model, we used all tracking data except for locations defined as Location Class Z, which are considered invalid locations (CLS, 2011). We fit the model to tracks of each individual turtle to estimate location and behavioral mode every 6 or 8 h from two independent and parallel chains of MCMC. Our samples from the posterior distribution were based on 10,000 iterations after a burn-in of 7,000 and were thinned by five. We defined binary turtle behavioral modes based on SSM output as either “area-restricted searching” or “transiting” as in earlier applications (Jonsen et al., 2007).
After plotting the transiting locations, we further filtered them to remove transit locations that represented movement within inter-nesting or foraging periods. In this way, we included only the turtle’s migration away from nesting beaches. The transit locations constituting the migration were determined by graphing the cumulative distance from the nesting beach, which was defined as the graph’s rise after the last visit to the nesting beach to the beginning of the asymptote signifying the arrival at foraging grounds. Additionally, if a nesting event (ground-truthed) fell within the migration period, we classified the locations before the nest as “transit within the inter-nesting period.”
If the input locations to SSM have large temporal data gaps or are highly imprecise, it can create SSM paths that deviate from the true path (Jonsen et al., 2013). We inspected SSM main migration output paths for 122 tracks as part of a larger project. The turtles considered here (n = 89) remain after filtering out SSM outputs that crossed large areas of land (n = 16), had no clear migration away from nesting grounds (n = 7), had three or less input locations during migration and/or had temporal gaps of a week or greater during migration (n = 10). This ensured that the SSM paths modeled the input locations as accurately as possible.
Migration Corridors
We visually identified two main migration corridors. To spatially delineate the extent of each migration corridor, we determined the line kernel density estimates (KDEs; Steiniger and Hunter, 2013) for each using the SSM migration lines in each corridor (n = 37 tracks for the GoM, n = 27 tracks for the Florida Straits). We used open source GIS software OpenJUMP (Steiniger and Hay, 2009), with the OpenJUMPHoRAE toolbox (Steiniger and Hunter, 2012) to calculate line KDEs and the 25, 50, and 75% probability contours for each migration corridor KDE. The probability contours are calculated from the KDEs, whereby a density value represents a given probability that the animal may be found in that cell, and polygons representing probability of use can then be derived from the resulting contours. The maximum percentage of 75% for the KDE distribution was applied and represents a conservative estimate of the migration corridor appropriate for assessing broad movement patterns (Pendoley et al., 2014), which aids in accounting for tracking bias (e.g., individuals tracked from the same nesting site; Almpanidou et al., 2019). We determined the line KDEs using a bandwidth of 42 km, the average distance traveled per day for the turtles in the two identified migration corridors (n = 64 tracks; Steiniger and Hunter, 2013) and implemented a raster cell size of 10 km (in agreement with other data layers). We chose 10 × 10 km grid cells to balance the spatial error of most satellite locations received (>1.5 km; CLS, 2011), the average daily distance the turtles moved (42 km), and a reasonably precise area for planning management actions.
Timing and Repeatability of Migration Paths
To determine the timing of migration, we obtained the dates (month and day, ignoring year) that each turtle migrated. We then separately graphed the number of turtles migrating on any given month/day for those that stayed within the GoM or went to the Bahamas or Caribbean. To describe how similar paths were for individual turtles tracked twice, we created 10 km buffers around the first path for each turtle and then determined the proportion of the second path that fell within the buffer. To compare the median threat level between migration paths for each turtle tracked twice, we extracted grid-cell threat values (see below) along each path and ran Wilcoxon rank sum tests in base R (R Core Team, 2020) for each individual.
Anthropogenic Threats
Previous work identified where foraging grounds for loggerheads and Kemp’s ridleys (Lepidochelys kempii) in the GoM overlapped with eight spatially explicit anthropogenic threats and found that threats for turtles using the southwest coast of Florida included commercial line fishing and harmful algal blooms (HABs; Hart et al., 2018a). However, when we included only threats during the peak migration time of July and August, HABs – which occur usually between August and February2 – were only present in a single year and in a relatively small spatial location and so we did not include HABs in our analysis. For turtles migrating through the Florida Straits, shipping lanes are a concern (Hart et al., 2018a). Additionally, while shrimp trawling effort is more concentrated in the northern GoM, trawls can present a significant threat to turtles if exclusion devices are not used and trawls are longer than 10 min (Sasso and Epperly, 2006). Therefore, we overlay these three threats on the migration corridors: commercial line fishing, shipping density, and shrimp trawling.
For commercial line fishing we used data provided by the National Oceanic and Atmospheric Administration (NOAA; Wrege, pers. comm.) that displayed the number of fisher trips that used line fishing in 2014 across the U.S. GoM. These trips were reported by fishers using a 1-degree latitude-longitude grid. For shipping density, we used Automatic Identification System data that is collected by the U.S. Coast Guard and provided for use by NOAA and the Bureau of Ocean Energy Management.3 These data provide the locations of large vessels [≥65 ft (20 m) in length or ≥26 ft (8 m) in length for towing vessels] in monthly summaries. We downloaded the shipping density for July and August for the latest year of tracking (2015). Files were transformed into File Geodatabases using the Track Builder 3.1 tool on their website. Once points were obtained, we created lines using the ArcMap 10.4 (ESRI, 2016). Points to Line tool with separate lines for each vessel ordered by date and time. We summed the number of lines in 10 km grid cells for the 2 months to show densities across peak migration time. Shrimp trawling effort is reported by NOAA statistical zone, both of which we obtained from NOAA (Nance et al., pers. comm.). We mapped the effort as number of days fished during the summer, defined and summarized by NOAA as May to August, for years 2008 through 2015. We then averaged the effort across these years.
The threats had different units and varying degrees of intensity, so we standardized units while retaining weighted values that represented relative levels, by dividing each threat value by the maximum to get a proportion of threat level in each grid cell. Only values that intersected the final grid area in the eastern GoM were considered for obtaining the maximum value. These proportions were added together to get a total threat level value per grid cell. Any total threat level value >0 was added to one to ensure that multiplication of the threat to the turtle KDE value remained positive. In so doing, threats were spatially weighted in relation to themselves but not weighted across threats based on danger level to turtles (i.e., all threat types were considered of equal danger). Once all threats were compiled, we multiplied the threat values in each grid cell by 1 – the line KDE contour value, which gave heavier weight to core areas of the line KDEs. This provided a metric to identify potential hotspots where differing levels of both migration and threats occur.
Results
Turtles and SSM
We identified migration paths for 81 adult female loggerheads (89 tracks) tagged after nesting in the GoM from 2008 to 2015 (Figure 1). Migration tracks ranged from 1 to 115 days for a total of 1,341 days (mean ± SD: 15.1 ± 14.1 days). Most turtles were tracked for more than a week after migration ended, but five turtles stopped transmitting either during migration, or 1 day after SSM indicated that migration ended. SSM input locations during this time accounted for a total of 11,110 locations and SSM output totaled 4,008 locations. The total distance moved (successive distances between SSM locations per turtle) ranged from 23 to 4,388 km (661.8 ± 595.1 km) for a total of 58,896 km across all tracks (Table 2).
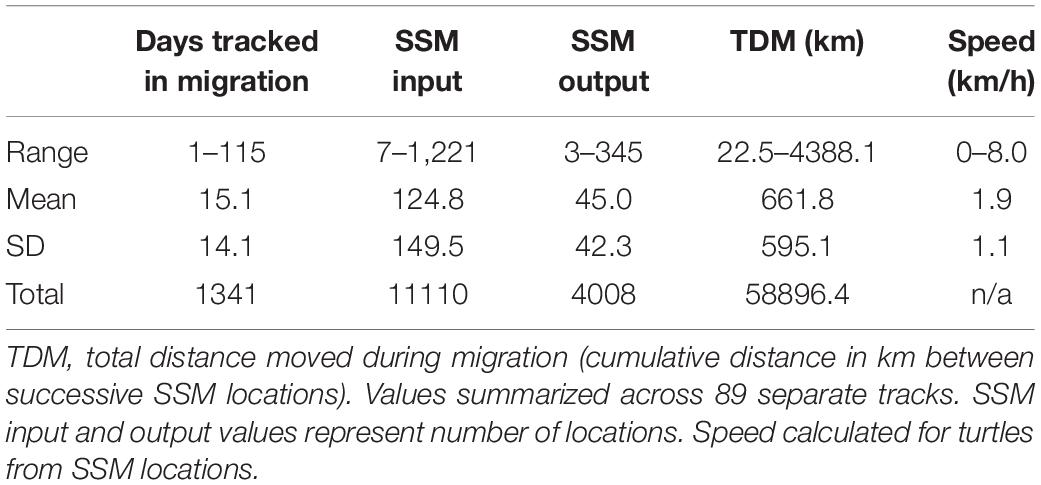
Table 2 Tracking and switching state-space model (SSM) details for 81 loggerheads (Caretta caretta; 89 tracks).
Migration Corridors
We identified two migration corridors for post-nesting adult female loggerheads containing 72% of satellite tracks in this study. One occurred in the eastern half of the GoM and the other was through the Florida Straits out into the Bahamas (Figure 1). There were a few exceptions: one turtle that nested in Dry Tortugas National Park headed south across the Caribbean Sea to waters off Nicaragua, a Gulf Shores-nesting turtle headed west to Texas, and another turtle that nested at Gulf Shores headed west toward Texas but then made a large loop back east and south, swimming through both oceanic and neritic areas eventually reaching Cuba. Oceanic areas (i.e., outside neritic areas) generally had a lower number of paths, with the middle of the GoM primarily having single, unique paths with a low degree of clustering along specific routes. However, south of mainland Florida, many tracks clustered through oceanic areas when turtles crossed the Florida Current before reaching the neritic waters of the Bahamas (Figure 1).
The line KDE contours represent the probability that a migrating turtle would be found in that area. The line KDE created in the eastern GoM had an overlap of the 25 and 50% contours, with a probability of a given turtle being found there at 62% (Figure 2). The 62 and 75% contours for this corridor were relatively close in size and primarily covered neritic areas from south of Alabama to the southern tip of western Florida. The 25 and 50% contours remained separate for the corridor extending from the Florida Straits to the Bahamas, showing the core area of migration lines in a funnel shape with the tip of the funnel in the Florida Straits and the funnel opening around Andros Island, the largest Bahamian island (Figure 2).
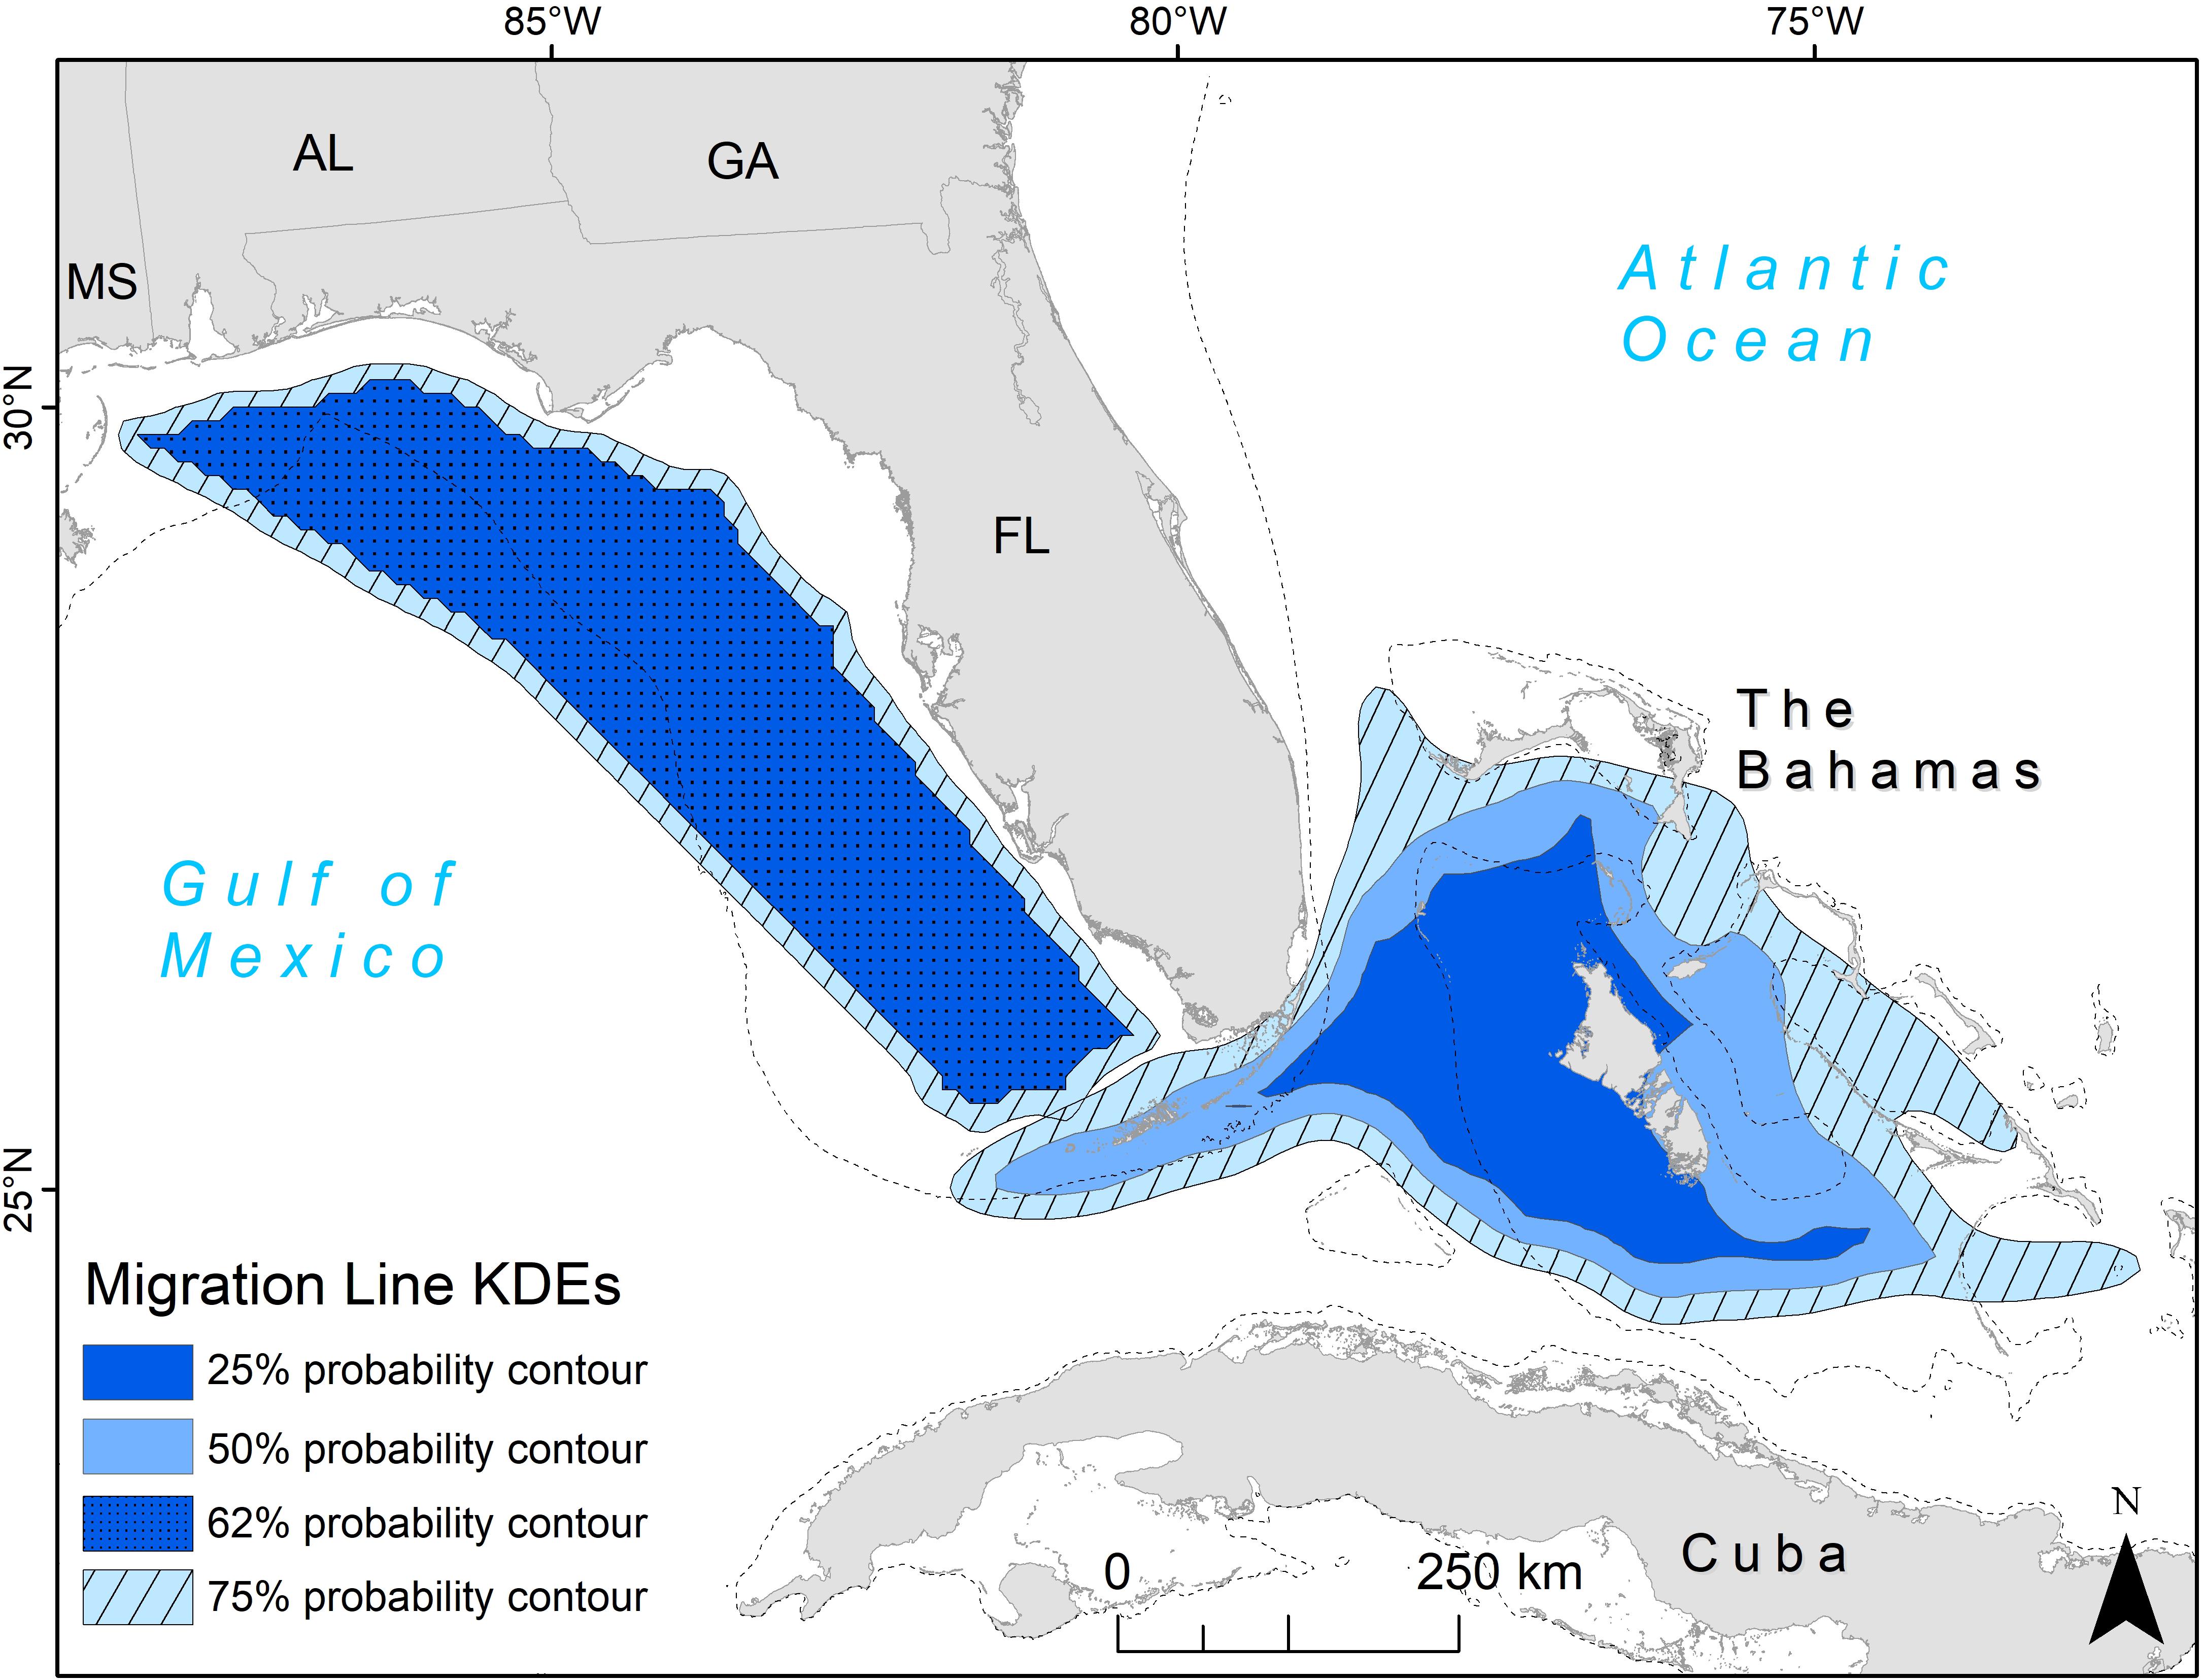
Figure 2. Migration line kernel density estimates (KDEs) for adult female loggerhead sea turtles (Caretta caretta; 64 tracks). Two migration corridors were identified: in the eastern Gulf of Mexico and the Florida (FL) Straits into the Bahamas. The KDEs were based on multiple tracks in the Gulf of Mexico (n = 37) and FL Straits (n = 27). Values represent probability that a migrating animal will be found in each contour. U.S. states are abbreviated: MS, Mississippi; AL, Alabama; GA, Georgia; FL, Florida. The 200 m bathymetric contour is shown as a dashed line.
Timing and the Repeatability of Migration Paths
Turtles migrated as early as 7 June and as late as 10 November (for the turtle that headed to Nicaragua). However, the majority of migration across all turtles occurred during July and August. This peak was the same regardless of whether migration began in the northern GoM or at the more southerly Dry Tortugas National Park (Figure 3).
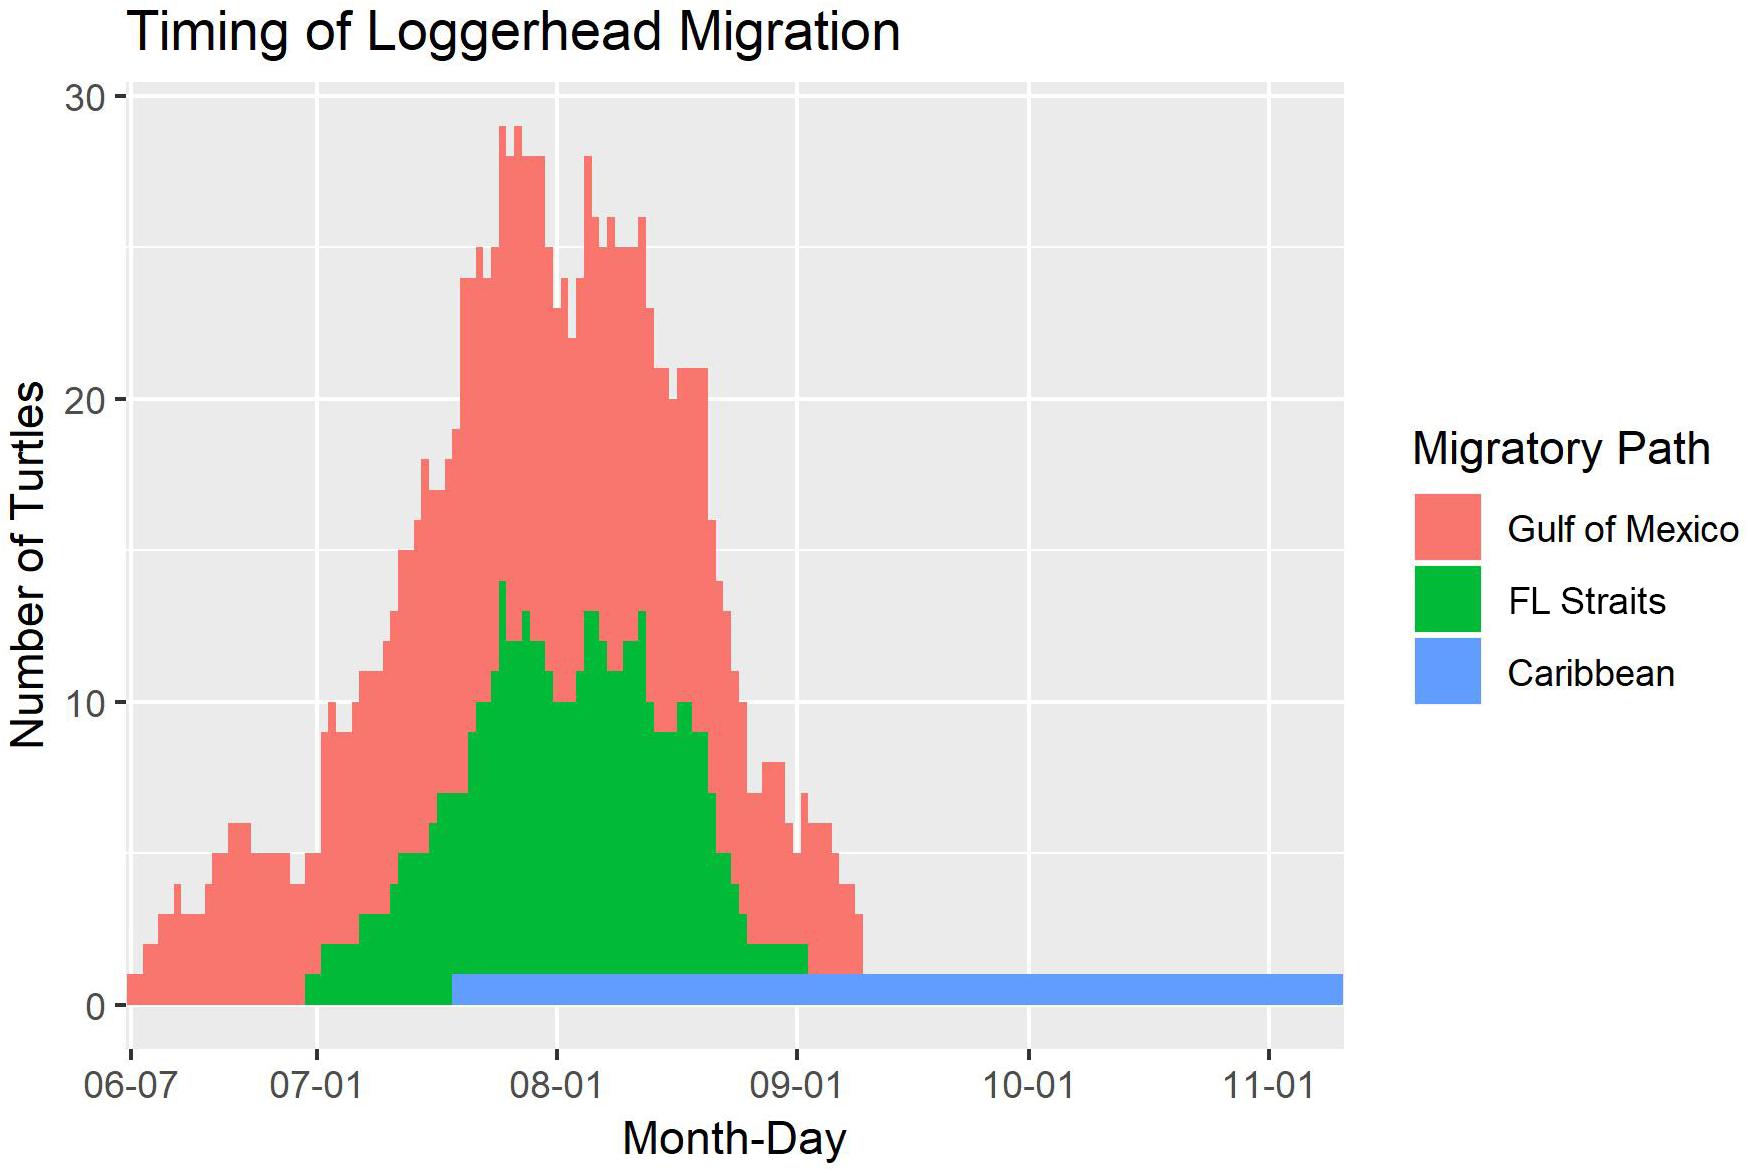
Figure 3. The timing of migration paths taken by 81 adult female loggerhead sea turtles (Caretta caretta; 89 tracks) after being tagged at nesting beaches throughout the Gulf of Mexico. The migrations are split by which area the turtle traveled through on migration: the Gulf of Mexico, the Florida (FL) Straits, or the Caribbean. The long tail after September 6 is from the turtle that traveled to Nicaragua.
We tracked eight turtles twice during migration to their foraging grounds (Table 3). One turtle was tagged in Gulf Shores, Alabama and the other seven were tagged in Dry Tortugas National Park, Florida. Paths taken by turtles were similar across years (Figure 4). The percent of the second path that fell within the 10 km buffer of the first path ranged from 13.5 to 82.1%, with a grand mean of 36.1% (±21.5%). Threat levels along paths were similar for turtles tracked twice; only one turtle (Turtle 8 in Table 3) showed a significant difference in threat levels, with the second track moving through higher threats [median threat level for track 1 = 1.23, median for track 2 = 1.36; Mann-Whitney U = 329.00, n1 = 22, n2 = 43 P = 0.047; we did not include Turtle 5 (Table 3) in these comparisons because >80% of the track was outside the threats grid]. This turtle migrated in the northern GoM, and its second track took it close to the Chandeleur Islands where threat levels were higher than off the coast of Alabama and northern Florida.
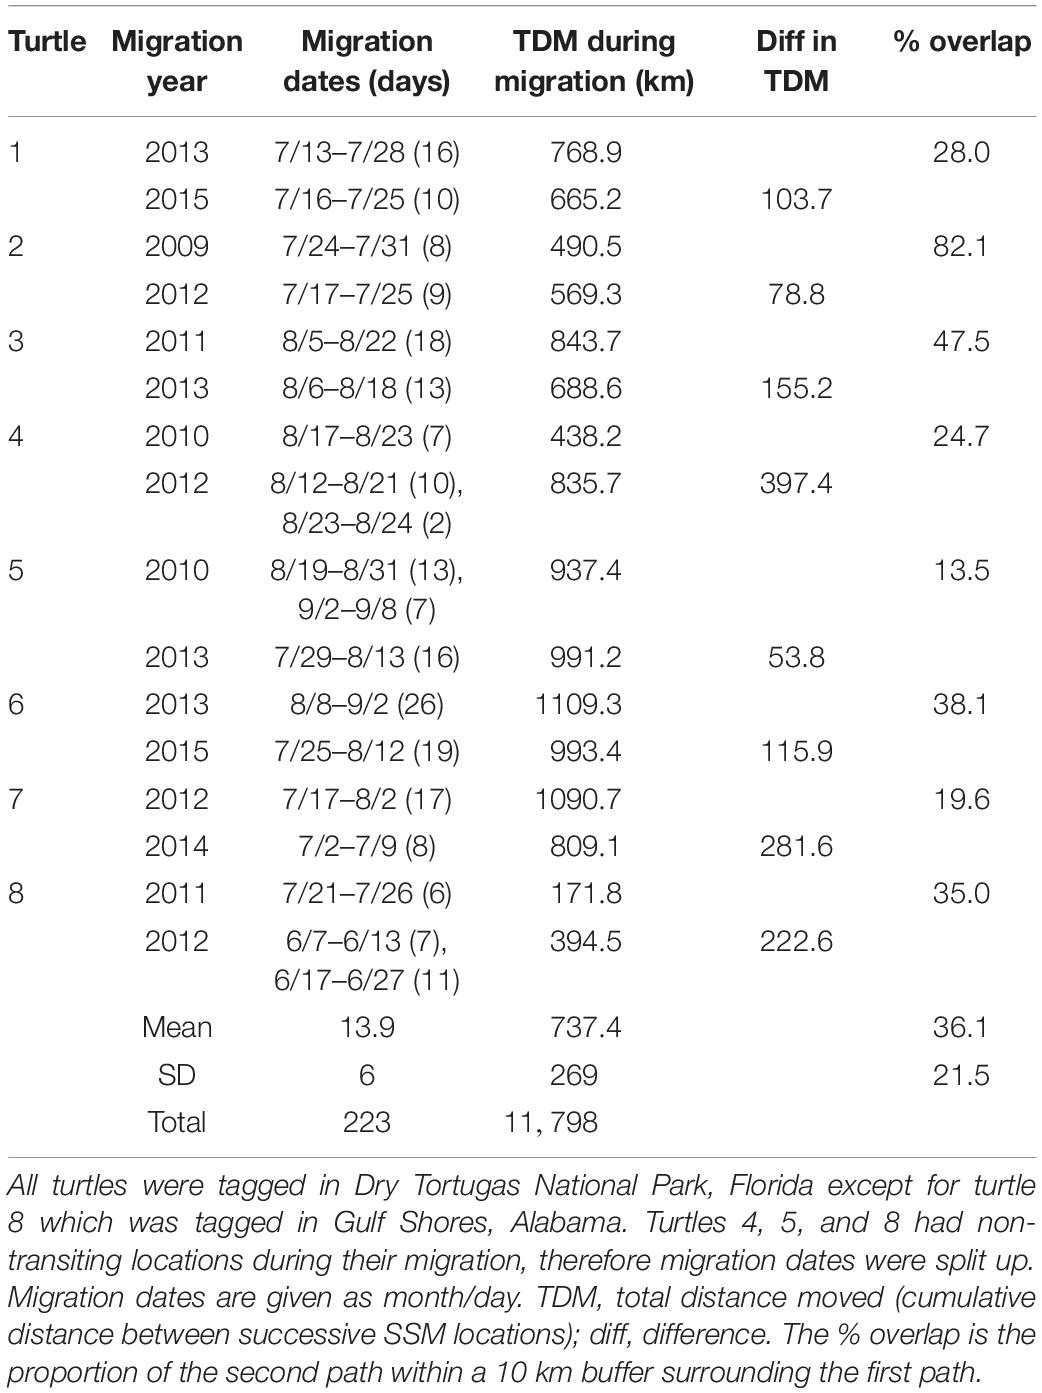
Table 3 Migration details for loggerhead sea turtles (Caretta caretta) tracked from nesting grounds twice.
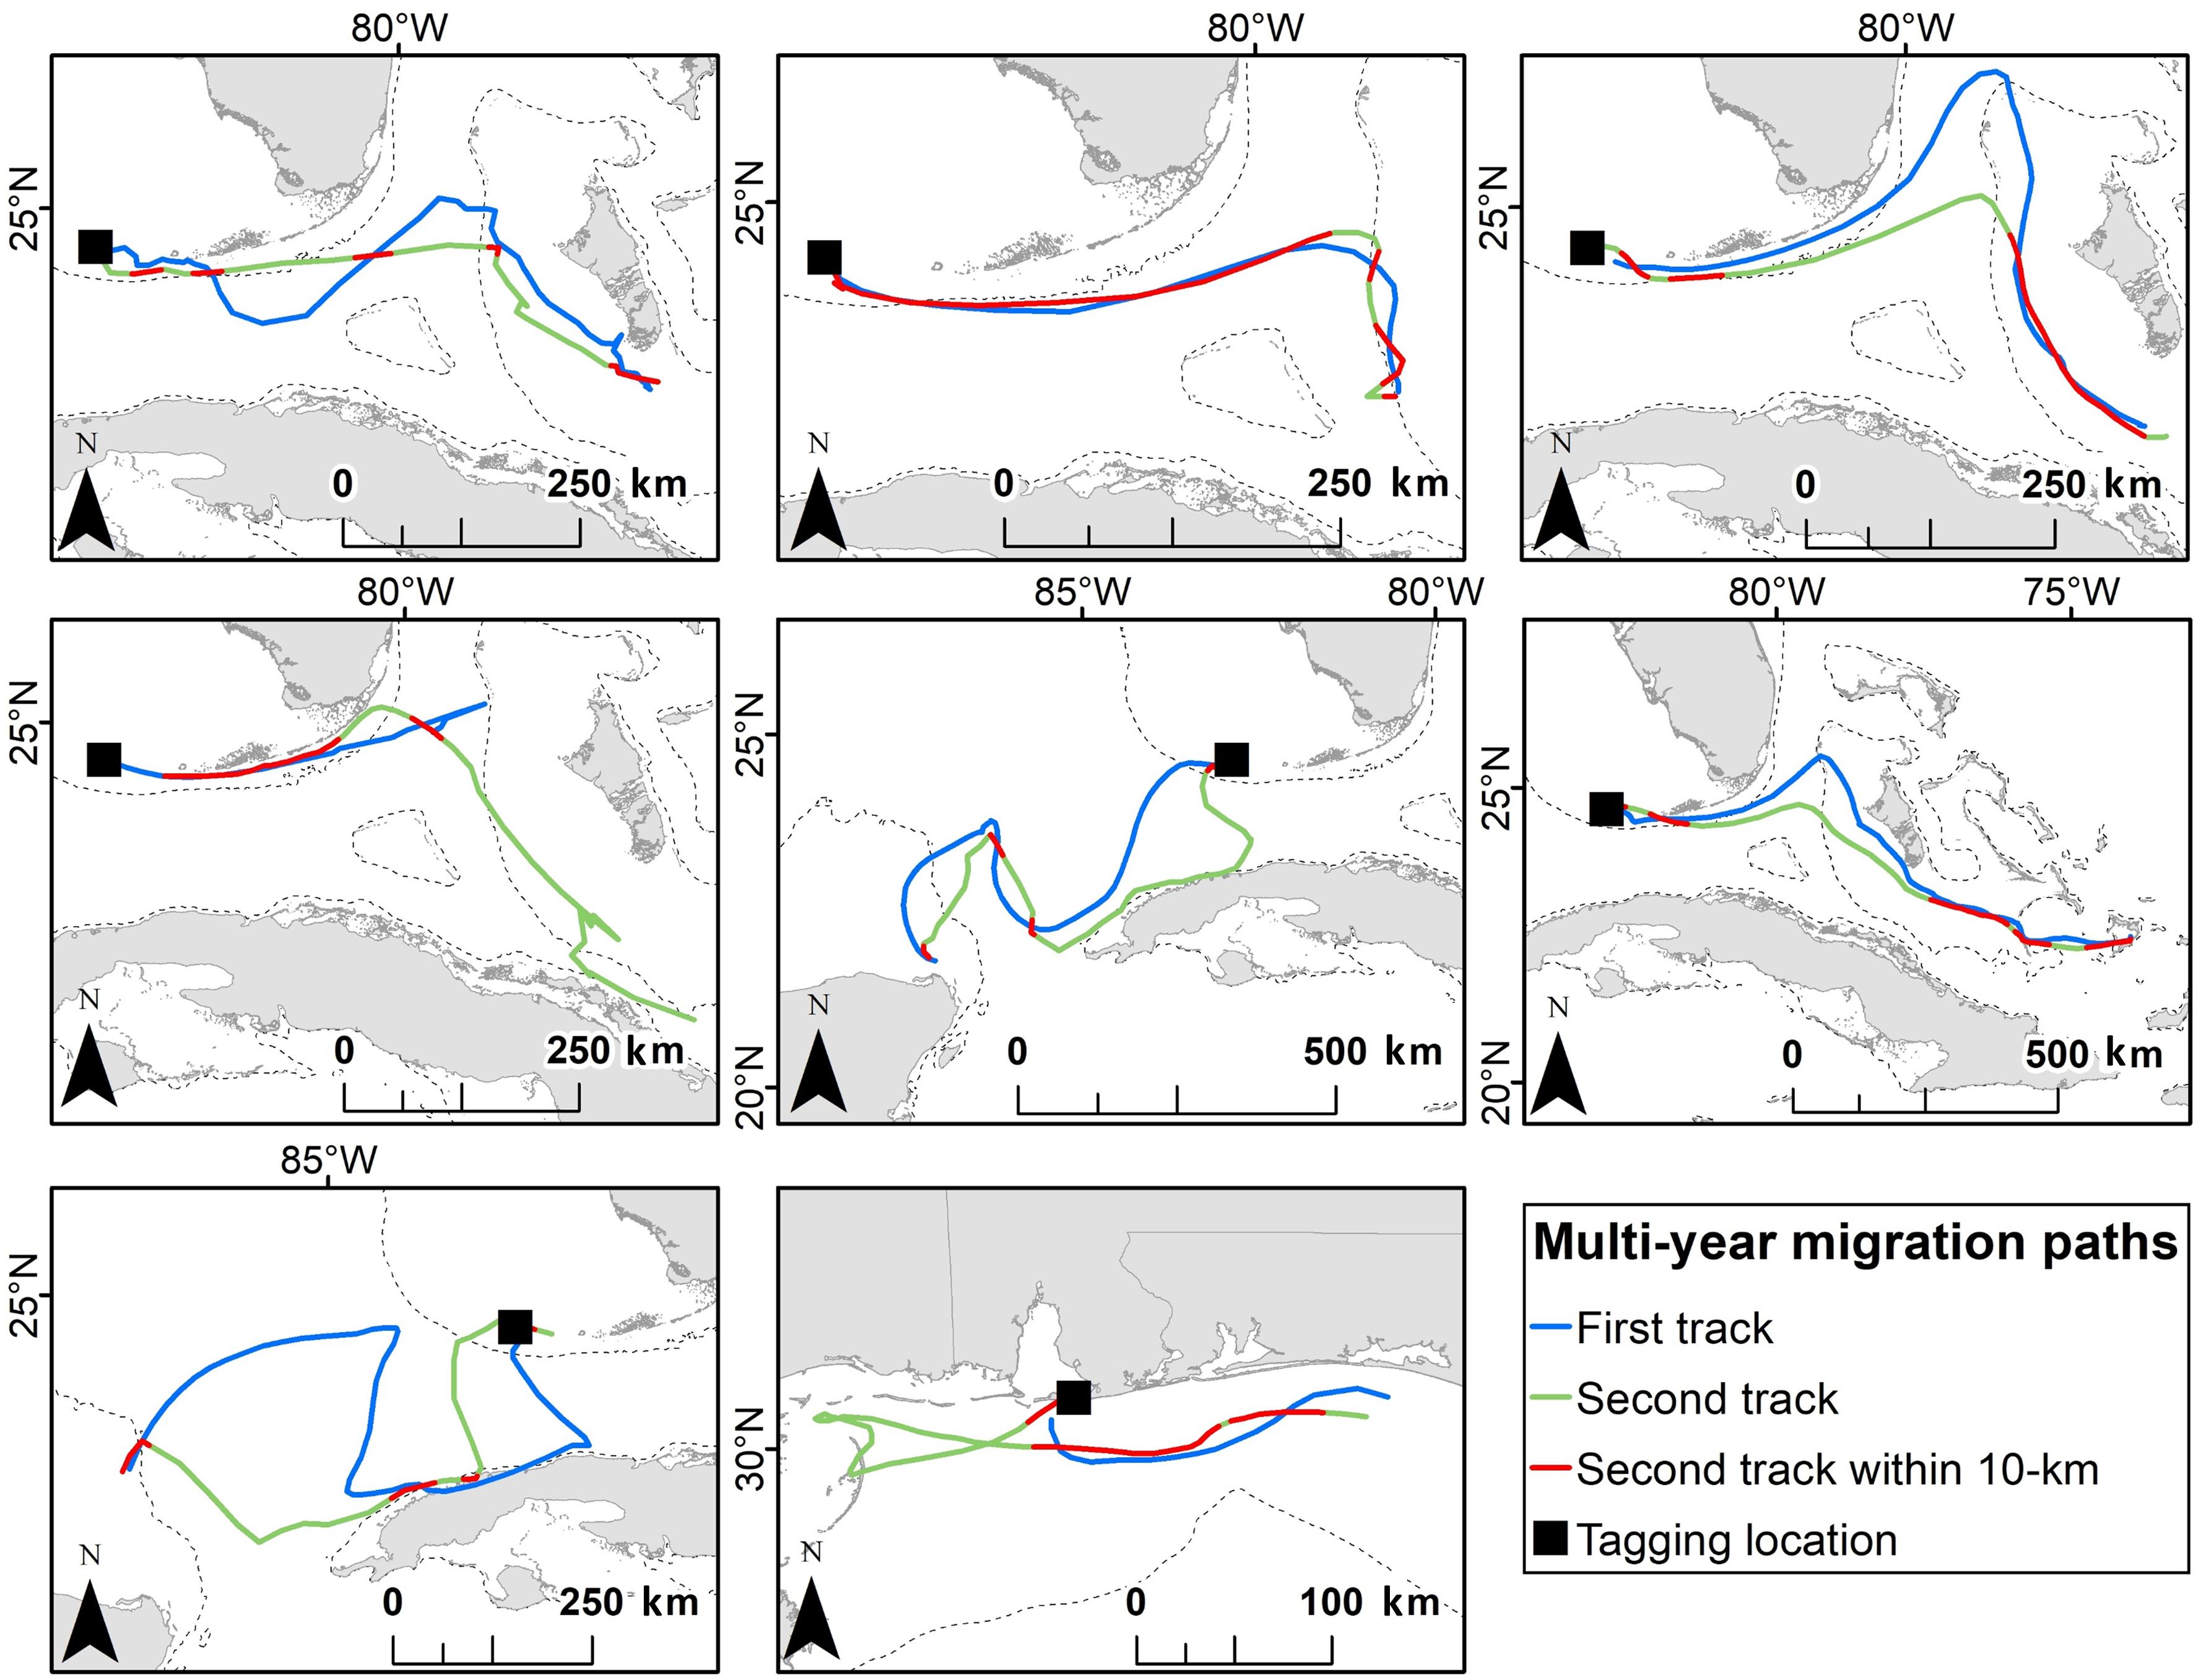
Figure 4. The repeatability of migration paths taken by eight adult female loggerhead sea turtles (Caretta caretta) after being tagged at Dry Tortugas National Park, Florida (first seven panels) and Gulf Shores, Alabama (last panel). Parts of the track where the second post-nesting migration was within 10 km of the first post-nesting migration are indicated in red. The 200 m bathymetric contour is shown as a dashed line.
Anthropogenic Threats
When threats were multiplied by the probability of turtle presence as given by line KDE values, hotspots of high values occurred around the northwest Florida coast, off of Tampa Bay, and in the Florida Straits (Figure 5). Commercial line fishing was present to some degree across the entire eastern GoM, with the number of trips generally highest west and south of Florida, up to a maximum of 5,462 trips per 1-degree latitude/longitude grid cell (Supplementary Figure 1). Shipping density was highest in a somewhat circular path from Louisiana to the Florida Straits, where the number of vessels during the summer months reached as high as 1,500 for a 10 km grid cell (Supplementary Figure 1). Shrimp trawling was lower along the west coast of Florida than in the water south of Louisiana, however over 2,000 effort hours of shrimping during the summer months of 2011 (with an average of ∼1,300 h across years) was reported for waters ∼18–55 m deep in this area (Supplementary Figure 1).
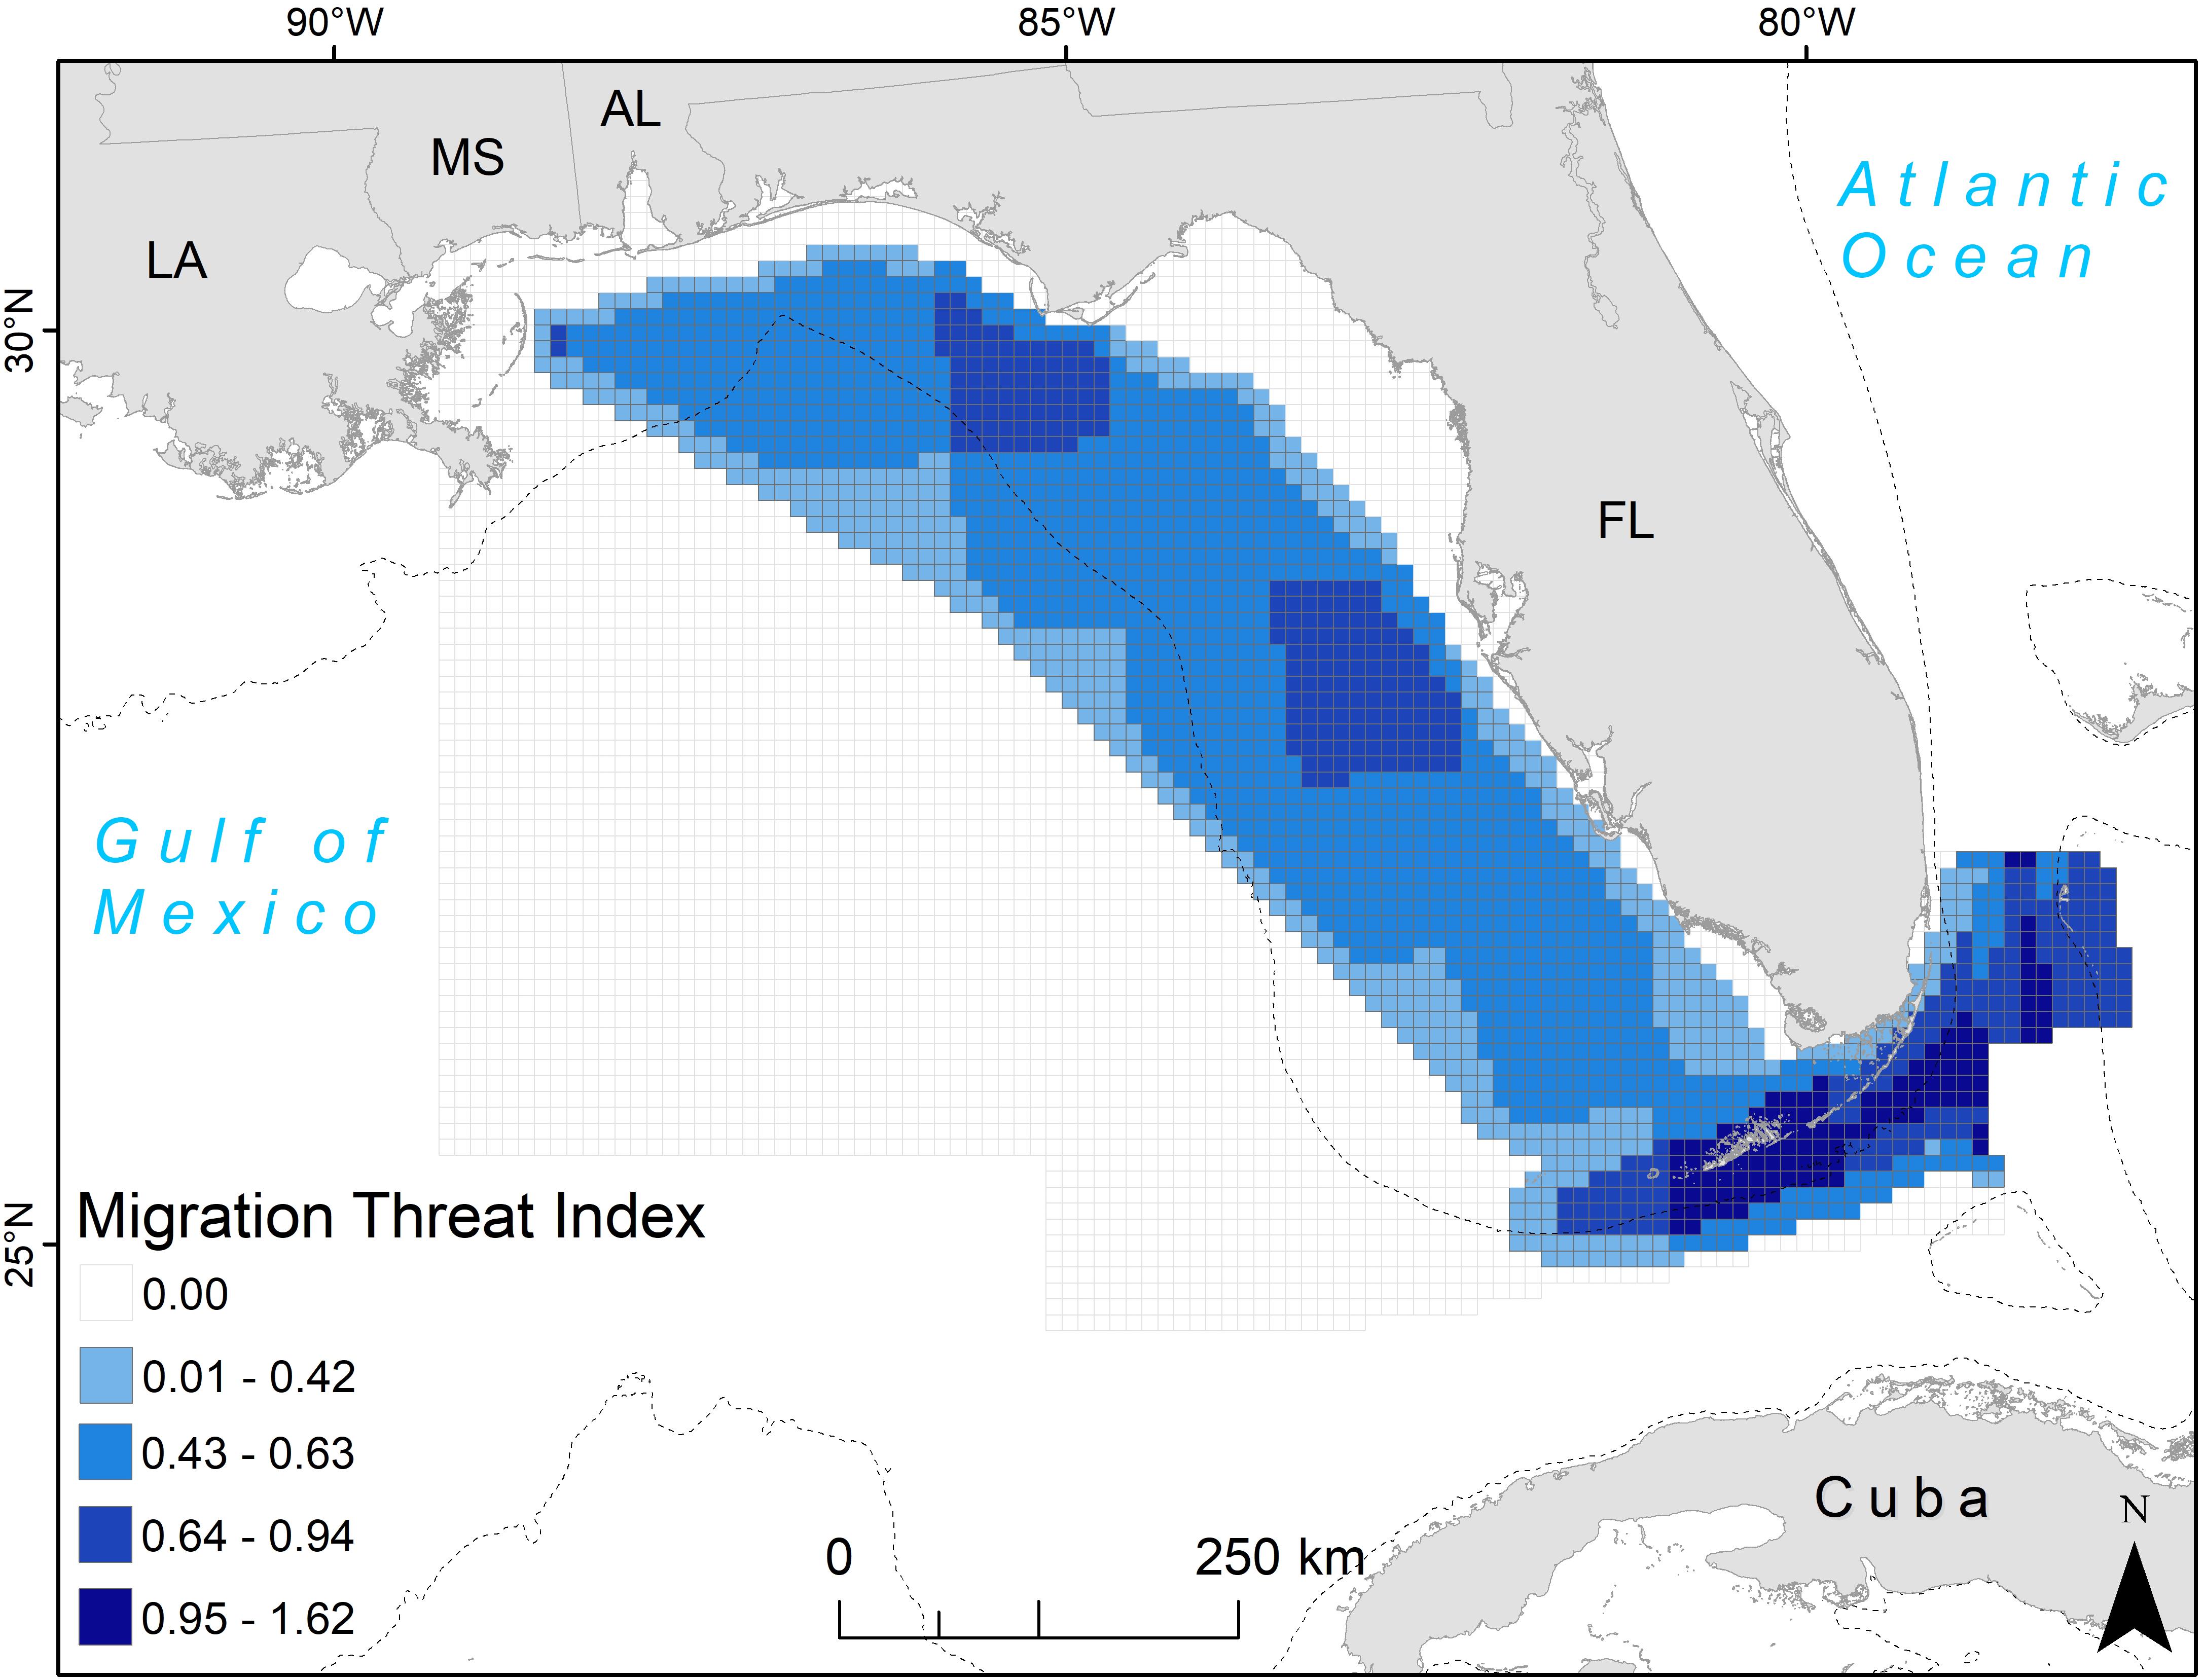
Figure 5. Migration threat index for adult female loggerhead sea turtles (Caretta caretta; 64 tracks) after being tagged at nesting beaches throughout the Gulf of Mexico. The 10 km grid cells are color-coded by the threat index value, which accounts for the line KDE contour value in the cell and the value of three possible threats: commercial line fishing, shipping density, and shrimp trawling (see section Materials and Methods for more details). U.S. states are abbreviated: LA, Louisiana; MS, Mississippi; AL, Alabama; FL, Florida. The 200 m bathymetric contour is shown as a dashed line.
Discussion
We spatially defined areas where high-use loggerhead migration paths overlap with sea turtle-specific anthropogenic threats in the Gulf of Mexico. This is important as loggerheads are a threatened species and the GoM has a high level of disturbance and pollution. The GoM also has one of the highest levels of species per unit area in the world, yet its biodiversity is considered “most threatened” (Costello et al., 2010). Specifically, we use 89 loggerhead migration tracks to identify high-use corridors including turtles from Baldwin County, Alabama, and Okaloosa, Gulf and Monroe Counties in Florida. This includes turtles tracked from a nesting beach in Everglades National Park not included in previous summaries. Based on previous work, loggerheads have been shown to use neritic waters west of Florida, as well as oceanic waters in the middle of the GoM for their migration. The corridors identified in this study align closely with many of the previously published tracks (Girard et al., 2009; Foley et al., 2013), indicating that these pathways are consistently important for loggerheads nesting through the GoM. For example, Foley et al. (2013) showed northern GoM turtles migrating in similar areas: along western Florida, loggerheads were located between 20 and 50 m bathymetry, and our core migration KDE areas overlapped these depths. In the Florida Straits, Girard et al. (2009) showed tracks in similar areas for turtles moving from western Florida to the Bahamas and Foley et al. (2013) showed many tracks along the same route but moving in the opposite direction for turtles migrating from eastern Florida into the GoM. Combined, these studies support the importance of the areas identified in this study as migratory corridors for loggerheads across years and for traveling to and from nesting beaches. Identifying corridors helps determine where management actions have potential to benefit more migrating loggerheads.
Although turtles in this study used neritic and oceanic areas, we found corridors were primarily located in neritic areas close to the coast. In the mid-GoM oceanic areas, individual tracks showed low degrees of overlap, consistent with other studies tracking loggerheads through this area (Girard et al., 2009; Foley et al., 2013). This may be attributed to changing currents and eddies that make each path unique. Specifically, turtles migrating in oceanic GoM waters may be influenced by eddies of the Loop Current (Foley et al., 2013).
Of eight turtles tracked for two post-nesting migrations, we found a relatively high degree of spatial similarity on their paths across years. Given that sea turtles follow magnetic maps (Southwood and Avens, 2010) and generally travel between the same nesting beaches and foraging grounds across years, this is expected. The repeat SSM paths were not exact replicates for turtles, however, and this may be due in part to the limits of location accuracy with satellite tags and/or variable model inputs into the SSM (such as number of and location of input points) that caused slightly different outputs. It is also possible that shifting currents and/or shifting of local cues such as wind-borne odor (Endres et al., 2016) could influence migration paths such that we would not expect an exact overlap in space and time across years. Theoretically, changes in course across years could also be due to avoidance of the threats identified in this study, however, we did not find evidence for this.
Despite the somewhat lower location accuracy of satellite tags as compared to GPS tags, their battery longevity allows for much longer tracking periods. As the tag technology improves, researchers will be able to determine spatial consistency in migration paths for a greater sample size of turtles, and during remigration. One previously tracked loggerhead followed the same migration path post-nesting and during its remigration back to nesting grounds (Foley et al., 2013). Therefore, the corridors we identified may also be important during remigration to nesting grounds, which would occur at a different time of year when threat levels may be different. Tracking turtles from foraging grounds to their nesting beaches would help determine how consistently they use corridors for both directions of migration. The cues that drive the phenology of migration for sea turtles are not well understood, and more research on the timing of migration from foraging grounds and associated environmental conditions could help with understanding what drives this behavior for individuals in some years and not others.
One turtle migrated out of the GoM south to Nicaragua, for a total distance moved of 4,388 km. In 2017, a rehabilitated loggerhead was released from South Africa and traveled for 2 years before reaching Australia, >10,000 km from its release site.4 For non-rehabilitated, wild turtles, the travel to Nicaragua from the GoM represents the longest reported post-nesting loggerhead migration to our knowledge. The next longest migration in this study was 2,751 km, a difference of around 1,600 km. The upper distance limit for adult Cheloniid sea turtles undertaking breeding migrations is thought to be around 3,000 km, because of limits on available fat stores (Hays and Scott, 2013). Interestingly, the turtle migrating to Nicaragua paused along the coast of Cuba from late August until early October after traveling for about 1,500 km. After this pause, the turtle resumed migrating, and then when it had traveled ∼3,400 km from nesting grounds it seemingly paused migration again to make a circular loop about 50 km in diameter for 8 days in October. While the SSM identified this time as migration, it is possible that this represents a type of stopover, where the turtle may have been seeking resources for refueling. These potential stopovers occurred in the neritic waters of Cuba and then directly south of Cuba in water >3,000 m deep.
There are anthropogenic threats to sea turtles which we were not able to quantify and thus did not include in our analysis, such as plastic pollution, effects from climate change, and direct harvest. Plastic pollution presents a serious threat to sea turtles, with over half of sea turtles in the world predicted to have ingested plastic debris and a relatively high-risk of ingestion predicted specifically in the GoM for hard-shelled sea turtles (Schuyler et al., 2016), however, the spatial extent of plastic available to turtles in the GoM is not well-studied. Additionally, changes to ocean currents and sea surface temperatures due to climate change were not considered. Theoretically, sea turtles could be affected by these changes during migration, as changing temperatures and currents could alter the energetic costs of migration, however, how these changes would affect sea turtle migration is not well understood (Southwood and Avens, 2010). Direct harvest is considered the third highest threat to sea turtles based on expert opinion (Donlan et al., 2010), yet we did not include this threat because of a lack of spatial information on where direct harvest in the GoM may occur. Lastly, based on the small percentage of HABs we found occurring during the migration period, these blooms are likely of higher concern for loggerheads on foraging grounds than those migrating in the summer. However, these blooms can be variable as demonstrated by the massive bloom that started in the fall of 2017 and lasted long enough to affect over 200 km of Florida’s west coast in the summer of 2018,5 killing hundreds of sea turtles. Therefore, while this may not be a primary, consistent threat to migrating sea turtles of those we examined, it can still have important impacts in some years.
For commercial line fishing, the data represents a minimum estimate of possible impacts. This is because we included only reported line fishing trips with known gear. We also did not include trips where the gear was simply reported as combined (multiple gear types). Commercial line fishing is known to have cumulatively high sea turtle bycatch, but other forms of fishing with nets may also have impacts (Lewison and Crowder, 2007). Not all trips will have the same impact, as that depends on the effort of each trip. Here we use only the number of trips as a metric, assuming that more trips mean more impact. Even with the threat from line fishing possibly being underestimated, the potential threat to sea turtles appears relatively high across most of the GoM, as many thousands of trips were reported for just one summer.
Shipping density is most problematic for migrating loggerheads that are traveling through the Florida Straits, and a lower level of this threat occurs across all other areas considered. We mapped this layer to demonstrate areas with more potential for ship strikes, which have been shown as a common cause of sea turtle mortality in the Mediterranean (Casale et al., 2010). Lastly, shrimp trawling effort is not as high across most of the western Florida shelf as in waters surrounding Louisiana, however, this threat is persistent across neritic areas of the GoM.
Here we show that shipping density, commercial line fishing, and shrimp trawling can affect the mortality of loggerhead sea turtles in the GoM. However, we did not weigh these threats in relation to each other and were unable to consider all possible threats, therefore we consider our threats index to be a minimum estimate. Importantly, our identified corridor in the GoM overlaps with migration areas for other species of concern. Kemp’s ridleys migrate slightly earlier in the year, with a peak in June, however they migrate through August (Shaver et al., 2016), so for any traveling through these same areas, they would be subject to these same threats. This corridor also overlaps with Biologically Important Areas identified for the resident population of Bryde’s whale (Baleanoptera edeni), which are extremely rare, and represent the only year-round baleen whale population in the northern GoM (LaBrecque et al., 2015; Soldevilla et al., 2017). This whale occurs primarily between depths of 100–300 m and is listed as endangered (NMFS and NOAA, 2019).
Cumulative Effects Assessments (CEAs), sometimes referred to as Cumulative Impact Assessments, are procedures that identify and evaluate the collective impact of multiple human activities and natural processes on the environment (Jones, 2016). CEAs are considered critically important for informing effective marine policy, however, the use of CEAs in real-world management processes remains a challenge largely due to the wide variation in approaches. CEAs are complex and have been criticized for a lack of measurable and clearly defined sustainability goals, being poorly aligned with institutional frameworks, and a lack of objective criteria (Jones, 2016). Nevertheless, attempts have been made to improve on CEAs by re-evaluating the structure and intent, reducing ambiguity, and orienting toward a common objective across regions (Willsteed et al., 2018). By incorporating CEAs within a risk-based framework that includes identification, analysis and evaluation, it may be possible to simplify and streamline CEAs while being transparent about uncertainty (Stelzenmüller et al., 2018). Ideally, CEAs show where cumulative effects most likely occur and at what intensity (Stelzenmüller et al., 2018). As we did not weight threats with additional quantitative data on mortalities and injuries caused, our analysis may be considered a Cumulative Pressure Assessment (CPA), and a step toward a fully parameterized CEA.
By overlaying anthropogenic threats onto the migration corridors, we were able to identify that hotspots of high values occurred around the northwest Florida coast, off of Tampa Bay, and in the Florida Straits. In our study, our conservation target is clear: the survival of migrating adult female loggerheads. In the Loggerhead Recovery Plan, managing migratory pathways and minimizing vessel strike mortality are listed as Recovery Objectives (NMFS and USFWS, 2008), and therefore our results directly provide scientific information needed for designing management strategies for this threatened species. In a risk-based framework, management activities are monitored and evaluated, which may lead to an understanding of thresholds for the cumulative effects (Stelzenmüller et al., 2018). In order to inform what threshold is acceptable for each threat, a future CEA would benefit from an understanding of what mortality level during migration is deemed sustainable for population recovery. As new information becomes available on the spatial intensity of threats, this estimated corridor can be used to inform adaptive management of threats during the migratory period. Overall, it is imperative to understand migration patterns and threats for these highly mobile species, and our conservative estimate of threats provides valuable information for the management and recovery of loggerhead sea turtles.
Data Availability Statement
The datasets generated for this study will not be made publicly available. Restrictions apply to the datasets. Raw data is exempt from publication due to the sensitivity of endangered species location information. Requests to access the datasets should be directed to the corresponding author. All other data used for analyses are presented in the manuscript.
Ethics Statement
The animal study was reviewed and approved by the United States Geological Survey-Southeast Ecological Science Center-Institutional Animal Care and Use Committee Protocol #2011-05.
Author Contributions
AI and KH contributed to the conception and design of the study. KH acquired funding. KH and ML managed tag deployment and data collection. AI, AB, and IF organized the database and performed analyses. AI wrote the first draft of the manuscript. All authors contributed to manuscript revision, read and approved the submitted version.
Funding
This work was supported by the Natural Resource Damage Assessment (NRDA) to KH; and the U.S. Geological Survey Priority Ecosystem Science Program (PES) to KH.
Conflict of Interest
AI was employed by the company Cherokee Nation Technologies.
The remaining authors declare that the research was conducted in the absence of any commercial or financial relationships that could be construed as a potential conflict of interest.
Acknowledgments
We acknowledge assistance from D. Ingram, J. Isaacs, A. Lauritsen, S. MacPherson, and J. Phillips from the U.S. Fish and Wildlife Service (USFWS). We are grateful to many “Share the Beach” volunteers and M. Reynolds for field assistance in Alabama. We also thank many U.S. Geological Survey volunteers and employees for assistance in the field. We thank the USFWS interns from Bon Secour National Wildlife Refuge (NWR). Research activities were permitted under Bon Secour NWR Special Use Permit 12-006S (issued to KH), USFWS Permit TE206903-1 (issued to J. Phillips), and the State of Florida Marine Turtle Permits 094, 118 and 176. We acknowledge the use of the satellite-tracking and analysis tool (STAT) and telemetry data generated as part of the Deepwater Horizon Natural Resource Damage Assessment (publicly available from www.seaturtle.org). Any use of trade, product, or firm names is for descriptive purposes only and does not imply endorsement by the U.S. Government.
Supplementary Material
The Supplementary Material for this article can be found online at: https://www.frontiersin.org/articles/10.3389/fmars.2020.00208/full#supplementary-material
Footnotes
- ^ www.wildlifecomputers.com
- ^ https://tidesandcurrents.noaa.gov
- ^ https://marinecadastre.gov/ais
- ^ www.aquarium.co.za
- ^ https://coastalscience.noaa.gov
References
Alerstam, T., Hedenström, A., and Susanne, A. (2003). Long-distance migration: evolution and determinants. Oikos 2, 247–260. doi: 10.1034/j.1600-0706.2003.12559.x
Almpanidou, V., Markantonatou, V., and Mazaris, A. D. (2019). Thermal heterogeneity along the migration corridors of sea turtles: implications for climate change ecology. J. Exp. Marine Biol. Ecol. 520:151223. doi: 10.1016/j.jembe.2019.151223
Berger, J., Cain, S. L., and Berger, K. M. (2006). Connecting the dots: an invariant migration corridor links the Holocene to the present. Biol. Lett. 2, 528–531. doi: 10.1098/rsbl.2006.0508
Block, B. A., Jonsen, I. D., Jorgensen, S. J., Winship, A. J., Shaffer, S. A., Bograd, S. J., et al. (2011). Tracking apex marine predator movements in a dynamic ocean. Nature 475, 86–90. doi: 10.1038/nature10082
Breed, G. A., Jonsen, I. D., Myers, R. A., Bowen, W. D., and Leonard, M. L. (2009). Sex-specific, seasonal foraging tactics of adult grey seals (Halichoerus grypus) revealed bystate-space analysis. Ecology 90, 3209–3221. doi: 10.1890/07-1483.1
Casale, P., Affronte, M., Insacco, G., Freggi, D., Vallini, C., Pino, D., et al. (2010). Sea turtle strandings reveal high anthropogenic mortality in Italian waters. Aquat. Conserv. Mar. Freshw. Ecosyst. 20, 611–620. doi: 10.1002/aqc.1133
CLS (2011). Argos User’s Manual: Worldwide Tracking and Environmental Monitoring by Satellite. New York, NY: CLS.
Costello, M. J., Coll, M., Danovaro, R., Halpin, P., Ojaveer, H., and Miloslavich, P. (2010). A census of marine biodiversity knowledge, resources, and future challenges. PLoS One 5:e12110. doi: 10.1371/journal.pone.0012110
Dingle, H. (2014). Migration: The Biology of Life on the Move, 2nd Edn. Oxford: Oxford University Press.
Donlan, C. J., Wingfield, D. K., Crowder, L. B., and Wilcox, C. (2010). Using expert opinion surveys to rank threats to endangered species: a case study with sea turtles. Conserv. Biol. 24, 1586–1595. doi: 10.1111/j.1523-1739.2010.01541.x
Endres, C. S., Putman, N. F., Ernst, D. A., Kurth, J. A., Lohmann, C. M. F., and Lohmann, K. J. (2016). Multi-modal homing in sea turtles: modeling dual use of geomagnetic and chemical cues in island-finding. Front. Behav. Neurosci. 10:19. doi: 10.3389/fnbeh.2016.00019
ESRI (2016). ArcGIS Desktop: Release 10.4.1. Redlands, CA: Environmental Systems Research Institute.
Foley, A., Schroeder, B., Hardy, R., MacPherson, S., Nicholas, M., and Coyne, M. (2013). Postnesting migratory behavior of loggerhead sea turtles Caretta caretta from three Florida rookeries. Endanger. Species Res. 21, 129–142. doi: 10.3354/esr00512
Girard, C., Tucker, A. D., and Calmettes, B. (2009). Post-nesting migrations of loggerhead sea turtles in the Gulf of Mexico: dispersal in highly dynamic conditions. Mar. Biol. 156, 1827–1839. doi: 10.1007/s00227-009-1216-z
Hart, K. M., Iverson, A. R., Fujisaki, I., Lamont, M. M., Bucklin, D., and Shaver, D. J. (2018a). Marine threats overlap key foraging habitat for two imperiled sea turtle species in the Gulf of Mexico. Front. Mar. Sci. 5:336. doi: 10.3389/fmars.2018.00336
Hart, K. M., Iverson, A. R., Fujisaki, I., Lamont, M. M., Bucklin, D., and Shaver, D. J. (2018b). Sympatry or syntopy? Investigating drivers of distribution and co-occurrence for two imperiled sea turtle species in Gulf of Mexico neritic waters. Ecol. Evol. 8, 12656–12669. doi: 10.1002/ece3.4691
Hart, K. M., Lamont, M. M., Fujisaki, I., Tucker, A. D., and Carthy, R. R. (2012). Common coastal foraging areas for loggerheads in the Gulf of Mexico: opportunities for marine conservation. Biol. Conserv. 145, 185–194. doi: 10.1016/j.biocon.2011.10.030
Hart, K. M., Lamont, M. M., Sartain, A. R., and Fujisaki, I. (2014). Migration, foraging, and residency patterns for northern gulf loggerheads: implications of local threats and international movements. PLoS One 9:e103453. doi: 10.1371/journal.pone.0103453
Hart, K. M., Lamont, M. M., Sartain, A. R., Fujisaki, I., and Stephens, B. S. (2013). Movements and habitat-use of loggerhead sea turtles in the northern Gulf of Mexico during the reproductive period. PLoS One 8:e0066921. doi: 10.1371/journal.pone.0066921
Hart, K. M., Sartain, A. R., and Fujisaki, I. (2015). Bahamas connection: residence areas selected by breeding female loggerheads tagged in Dry Tortugas National Park, USA. Anim. Biotelemetry 3, 1–17. doi: 10.1186/s40317-014-0019-2
Hays, G. C., Broderick, A. C., Godley, B. J., Luschi, P., and Nichols, W. J. (2003). Satellite telemetry suggests high levels of fishing-induced mortality in marine turtles. Mar. Ecol. Prog. Ser. 262, 305–309. doi: 10.3354/meps262305
Hays, G. C., and Scott, R. (2013). Global patterns for upper ceilings on migration distance in sea turtles and comparisons with fish, birds and mammals. Funct. Ecol. 27, 748–756. doi: 10.1111/1365-2435.12073
Henkel, J. R., Sigel, B. J., Taylor, C. M., Horizon, D., and Horizon, D. (2012). Oil spill: can local disturbance affect distant ecosystems through migratory shorebirds? Bioscience 62, 676–685. doi: 10.1525/bio.2012.62.7.10
Henkel, S., Suryan, R., and Lagerquist, B. (2014). “Marine renewable energy and environmental interactions: baseline assessments of seabirds, marine mammals, sea turtles, and benthic communities on the Oregon shelf,” in Marine Renewable Energy Technology and Environmental Interactions, eds M. Shields and A. Payne (Dordrecht: Springer), 93–110. doi: 10.1007/978-94-017-8002-5_8
Howard, E., and Davis, A. K. (2009). The fall migration flyways of monarch butterflies in eastern North America revealed by citizen scientists. J. Insect Conserv. 13, 279–286. doi: 10.1007/s10841-008-9169-y
Jenni-Eiermann, S., and Jenni, L. (2000). Fuel supply and metabolic constraints in migrating birds. Comp. Biochem. Physiol. B Biochem. Mol. Biol. 126:S52. doi: 10.1016/S0305-0491(00)80104-2
Jones, F. C. (2016). Cumulative effects assessment: theoretical underpinnings and big problems. Environ. Rev. 24, 187–204. doi: 10.1139/er-2015-0073
Jonsen, I. D., Basson, M., Bestley, S., Bravington, M. V., Patterson, T. A., Pederson, M. W., et al. (2013). State space models for bio-loggers: a methodological road map. Deep Sea Res. 8, 34–46. doi: 10.1016/j.dsr2.2012.07.008
Jonsen, I. D., Myers, R. A., and Flemmings, J. M. (2003). Meta-analysis of animal movement using state-space models. Ecology 84, 3055–3063. doi: 10.1890/02-0670
Jonsen, I. D., Myers, R. A., and James, M. C. (2007). Identifying leatherback turtle foraging behaviour from satellite telemetry using a switching state-space model. Mar. Ecol. Prog. Ser. 337, 255–264. doi: 10.3354/meps337255
Keller, J. M. (2013). “Exposure to and effects of persistent organic pollutants,” in The Biology of Sea Turtles, Vol. III, eds J. Wyneken, K. J. Lohmann, and J. A. Musick (Boca Raton: CRC Press), 285–328. doi: 10.1201/b13895-12
LaBrecque, E., Curtice, C., Harrison, J., Van Parijs, S. M., and Halpin, P. N. (2015). Biologically important areas for cetaceans within U.S. waters – Gulf of Mexico region. Aquat. Mamm. 41, 30–38. doi: 10.1578/am.41.1.2015.30
Lewison, R. L., and Crowder, L. B. (2007). Putting longline bycatch of sea turtles into perspective. Conserv. Biol. 21, 79–86. doi: 10.1111/j.1523-1739.2006.00592.x
Luschi, P., Hays, G. C., and Papi, F. (2003). A review of long-distance movements by marine turtles, and the possible role of ocean currents. Oikos 103, 293–302. doi: 10.1034/j.1600-0706.2003.12123.x
National Marine Fisheries Service [NMFS] and National Oceanic and Atmospheric Administration [NOAA] (2014). Endangered and Threatened Species: Critical Habitat for the Northwest Atlantic Ocean Loggerhead Sea Turtle Distinct Population Segment (DPS) and Determination Regarding Critical Habitat for the North Pacific Ocean Loggerhead DPS. Silver Spring, MD: NOAA.
National Marine Fisheries Service [NMFS] and National Oceanic and Atmospheric Administration [NOAA] (2019). Endangered Status of the Gulf of Mexico Bryde’s Whale. Silver Spring, MD: NOAA.
National Marine Fisheries Service [NMFS] and United States Fish and Wildlife Service [USFWS] (2008). Recovery Plan for the Northwest Atlantic Population of the Loggerhead Sea Turtle (Caretta caretta), Second Revision. Silver Spring, MD: National Marine Fisheries Service.
National Marine Fisheries Service [NMFS]-Southeast Fisheries Science Center [SEFSC] (2008). Sea Turtle Research Techniques Manual. Silver Spring, MD: NOAA.
Patterson, T. A., Thomas, L., Wilcox, C., Ovaskainen, O., and Matthiopoulos, J. (2008). State-space models of individual animal movement. Trends Ecol. Evol. 23, 87–94. doi: 10.1016/j.tree.2007.10.009
Pedler, R. D., Ribot, R. F. H., and Bennett, A. T. D. (2014). Extreme nomadism in desert waterbirds: flights of the banded stilt. Biol. Lett. 10:20140547. doi: 10.1098/rsbl.2014.0547
Pendoley, K. L., Schofield, G., Whittock, P. A., Ierodiaconou, D., and Hays, G. C. (2014). Protected species use of a coastal marine migratory corridor connecting marine protected areas. Mar. Biol. 161, 1455–1466. doi: 10.1007/s00227-014-2433-7
R Core Team (2020). R: A Language and Environment for Statistical Computing. Vienna, Austria: R Foundation for Statistical Computing. Available at: https://www.R-project.org/
Sasso, C. R., and Epperly, S. P. (2006). Seasonal sea turtle mortality risk from forced submergence in bottom trawls. Fish. Res. 81, 86–88. doi: 10.1016/j.fishres.2006.05.016
Schuyler, Q. A., Wilcox, C., Townsend, K. A., Wedemeyer-Strombel, K. R., Balazs, G., van Sebille, E., et al. (2016). Risk analysis reveals global hotspots for marine debris ingestion by sea turtles. Glob. Chang. Biol. 22, 567–576. doi: 10.1111/gcb.13078
Shaver, D. J., Hart, K. M., Fujisaki, I., Rubio, C., Sartain-Iverson, A. R., Peña, J., et al. (2016). Migratory corridors of adult female Kemp’s ridley turtles in the Gulf of Mexico. Biol. Conserv. 194, 158–167. doi: 10.1016/j.biocon.2015.12.014
Soldevilla, M. S., Hildebrand, J. A., Frasier, K. E., Aichinger Dias, L., Martinez, A., Mullin, K. D., et al. (2017). Spatial distribution and dive behavior of Gulf of Mexico Bryde’s whales: potential risk of vessel strikes and fisheries interactions. Endanger. Species Res. 32, 533–550. doi: 10.1038/srep22615
Southwood, A., and Avens, L. (2010). Physiological, behavioral, and ecological aspects of migration in reptiles. J. Comp. Physiol. B Biochem. Syst. Environ. Physiol. 180, 1–23. doi: 10.1007/s00360-009-0415-8
Steiniger, S., and Hay, G. J. (2009). Free and open source geographic information tools for landscape ecology. Ecol. Inform. 4, 183–195. doi: 10.1016/j.ecoinf.2009.07.004
Steiniger, S., and Hunter, A. J. S. (2012). OpenJUMP HoRAE – a free GIS and toolbox for home range analysis. Wildl. Soc. Bull. 36, 600–608. doi: 10.1002/wsb.168
Steiniger, S., and Hunter, A. J. S. (2013). A scaled line-based kernel density estimator for the retrieval of utilization distributions and home ranges from GPS movement tracks. Ecol. Inform. 13, 1–8. doi: 10.1016/j.ecoinf.2012.10.002
Stelzenmüller, V., Coll, M., Mazaris, A. D., Giakoumi, S., Katsanevakis, S., Portman, M. E., et al. (2018). A risk-based approach to cumulative effect assessments for marine management. Sci. Total Environ. 612, 1132–1140. doi: 10.1016/j.scitotenv.2017.08.289
Vander Zanden, H. B., Bolten, A. B., Tucker, A. D., Hart, K. M., Lamont, M. M., Fujisaki, I., et al. (2016). Biomarkers reveal sea turtles remained in oiled areas following the Deepwater Horizon oil spill. Ecol. Appl. 26, 2145–2155. doi: 10.1002/eap.1366
Keywords: anthropogenic threats, Caretta caretta, Gulf of Mexico, loggerhead, migration corridors, satellite tracking, sea turtle, switching state-space modeling
Citation: Iverson AR, Benscoter AM, Fujisaki I, Lamont MM and Hart KM (2020) Migration Corridors and Threats in the Gulf of Mexico and Florida Straits for Loggerhead Sea Turtles. Front. Mar. Sci. 7:208. doi: 10.3389/fmars.2020.00208
Received: 22 November 2019; Accepted: 17 March 2020;
Published: 09 April 2020.
Edited by:
Michael Paul Jensen, Southwest Fisheries Science Center (NOAA), United StatesReviewed by:
Mariana M. P. B. Fuentes, Florida State University, United StatesAntonios D. Mazaris, Aristotle University of Thessaloniki, Greece
Copyright © 2020 Iverson, Benscoter, Fujisaki, Lamont and Hart. This is an open-access article distributed under the terms of the Creative Commons Attribution License (CC BY). The use, distribution or reproduction in other forums is permitted, provided the original author(s) and the copyright owner(s) are credited and that the original publication in this journal is cited, in accordance with accepted academic practice. No use, distribution or reproduction is permitted which does not comply with these terms.
*Correspondence: Autumn R. Iverson, YXJpdmVyc29uQHVjZGF2aXMuZWR1