 Punyasloke Bhadury1,2*
 Tarkeshwar Singh1
- 1Integrative Taxonomy and Microbial Ecology Research Group, Department of Biological Sciences, Indian Institute of Science Education and Research Kolkata, Kolkata, India
- 2Centre for Climate and Environmental Studies, Indian Institute of Science Education and Research Kolkata, Kolkata, India
The ecological significance of marine planktonic cyanobacteria in mangrove ecosystems is not well understood from the context of community structure and functions. In this study, members of the marine planktonic cyanobacterial communities were elucidated based on 16S rRNA sequencing (clone libraries and Illumina sequencing) and microscopic approaches from the Sundarbans Biological Observatory Time Series (SBOTS) stations Stn1 and Stn 3 located in and around Mooriganga estuary, Indian Sundarbans over 6 months representing monsoon and post-monsoon seasons of 2012. In total 222 sequences were marine planktonic cyanobacteria-like and were dominated by three major clades of Synechococcus-like 16S rRNA sequences (160 sequences). There was clear dominance of Synechococcus sp. KORDI-78 like sequences (71 sequences) in both monsoon and post-monsoon seasons from the study area. Although in very low numbers, other cyanobacterial sequences showing taxonomic affiliation with members of Chroococcales, Pleurocapsales, Oscillatoriales, and Stigonematales were also encountered. The presence of some of the representative genera belonging to the above Orders were reconfirmed by bright field microscopy from both stations of SBOTS. Presence of four novel clades of planktonic cyanobacteria were also confirmed from the study area based on molecular phylogeny thereby indicating unexplored cyanobacterial diversity is high in Sundarbans. Illumina sequencing undertaken for both stations of SBOTS in one of the monsoon months of 2014 (July) revealed low abundance of cyanobacteria-like sequences (2349 out of 4,276,863 pair-end reads) and dominance of KORDI-78 like sequences. Principal component analysis (PCA) showed that dissolved nutrients, transparency and salinity influenced the observed marine planktonic cyanobacterial assemblages of Sundarbans. There was overall dominance of Synechococcus-like 16S rRNA sequences confirming the importance of small-sized picocyanobacterial cells and their role in export of carbon in mangrove ecosystems.
Introduction
Cyanobacteria represent a group of prokaryotic photosynthetic autotrophs that colonized diverse habitats on Earth and influenced modern climate (Kopp et al., 2005). In meso and eutrophic coastal ecosystems, cyanobacteria represent dominant group of overall phytoplankton communities (Caroppo, 2015; Albrecht et al., 2017). It has been estimated that long-term carbon burial by mangroves, seagrass meadows and salt marshes is 31–34 teragrams (Tg) C yr−1, 5–87 Tg C yr−1, and 48–112 Tg C yr−1, respectively, compared to tropical forests (78.5 Tg C yr−1) which occupy much larger area (McLeod et al., 2011). Cyanobacterial communities are responsible for significant proportion of export of carbon in coastal ecosystems (Geider et al., 2001; Kirchman, 2012). Picocyanobacteria such as Synechococcus and Prochlorococcus are abundant across coastal environments (Palenik et al., 2006; Flombaum et al., 2013; Pedrotti et al., 2017). In coastal environments such as mangroves, planktonic forms of marine cyanobacteria constitute an important functional component of phytoplankton assemblages (e.g., Hoffman, 1999; Chamberlain et al., 2014). Populations of Prochlorococcus and Synechococcus are key players in these ecosystems (e.g., Richardson and Jackson, 2007; Lomas and Moran, 2011; Chamberlain et al., 2014; Kim et al., 2018). Other cyanobacterial genera such as Cyanothece, Cyanobium, Crocosphaera, and Trichodesmium also constitute part of the marine planktonic cyanobacterial assemblages (Hoffman, 1999; Brauer et al., 2015).
Mangrove ecosystems dominate coastlines across tropical and subtropical regions and can cover from 60 to 75% of the land-ocean boundary regions (Lalli and Parsons, 1997). Phytoplankton forms the basis of food chains in aquatic ecosystems within mangrove and helps sustain rich fisheries (Robertson and Blaber, 1992). It is therefore important to understand the community composition of marine planktonic cyanobacteria in overall phytoplankton assemblages within mangroves which can improve understanding of export of carbon through food web and consequences for coastal carbon cycling. Majority of the studies undertaken on cyanobacteria at the community scale in mangrove ecosystems have mostly focused on epiphytic, epilethic, and benthic forms, in addition to some information for planktonic species. For example, using bright field microscopy and culture-based approaches, 15 marine planktonic cyanobacterial genera belonging to Chroococcales were reported from Red mangroves in Brazil (Nogueira and Ferreira-Correia, 2001); whereas 10 benthic cyanobacterial genera including Lyngbya, Oscillatoria, and Anabaena were reported from mangrove sediments of Zanzibar in Kenya (Kyaruzi et al., 2003). Using the same approach, planktonic cyanobacterial genera belonging to Chroococcales were identified from Pichavaram mangroves in India (Nedumaran et al., 2008). In another study, soils from two Brazilian mangroves were shown to be dominated by populations belonging to Prochlorococcus and Synechococcus using 16S rRNA approach (Rigonato et al., 2013).
The mangroves in the Ganga-Brahmaputra-Meghna (GBM) delta (21°32′ and 22°40′N; 88°05′ and 89°E) shared between India and Bangladesh, popularly known as Sundarbans, represents the largest contiguous mangrove ecosystem globally. This mangrove ecosystem encompasses over 102 islands with a network of innumerable rivers, rivulets, and creeks and covers a total area of approximately 10,000 km2. It is strongly influenced by coastal water entering from the Bay of Bengal on a diurnal basis due to tidal action. There is strong freshwater influence in this ecosystem resulting from GBM riverine flow (∼42,000 m3/s) (Sengupta et al., 2016). This has resulted in wide variability of salinity regimes including typical estuarine conditions along with high suspended particulate matter in different parts of Sundarbans (Mukhopadhyay et al., 2006). Moreover, during monsoon season (July–September) there is heavy seasonal precipitation which brings in increased freshwater flow from the GBM riverine systems along with run offs from land to Sundarbans (Mukhopadhyay et al., 2006; Bhattacharjee et al., 2013). Due to increased freshwater flow the average depth of water in Sundarbans changes along with decrease in photic depth (Choudhury et al., 2015). On the other hand, during post-monsoon season (October–December), after the end of seasonal precipitation, occasional precipitation along with entry of cold nutrient rich water from the Bay of Bengal influences the Sundarbans diurnally. These factors bring in variability of environmental parameters across Sundarbans and strongly influence the structure and functions of resident biological communities.
Given the dynamicity of Sundarban mangroves, improving our understanding of community composition and diversity of cyanobacteria, in particular planktonic form of cyanobacteria (referred as marine planktonic cyanobacteria) is critical toward elucidating their roles in export of carbon and sustenance of trophic food webs (Calbet et al., 2014). Phytoplankton assemblages, in particular chromophytic phytoplankton communities, are relatively well studied in Sundarbans based on bright field microscopy (Biswas et al., 2010; Manna et al., 2010; Choudhury et al., 2015) and to some extent using molecular methods such as genes linked to carbon assimilation (Samanta and Bhadury, 2014, 2018). To the best of our knowledge, only two studies have reported the presence of cyanobacterial taxa such as Oscillatoria, Trichodesmium, and Synechococcus from estuarine water of Sundarbans based exclusively on bright field microscopy, although focus of both of these studies were elucidating mainly eukaryotic phytoplankton assemblages (Manna et al., 2010; Bhattacharjee et al., 2013).
The most commonly used methods for assessment of cyanobacterial diversity include use of microscopy and flow cytometry (Hoffman, 1999; Veldhuis and Kraay, 2000; Palinska and Surosz, 2014). Morphological identification based on taxonomic keys represents only a small fraction of marine cyanobacterial taxa that have been reported from tropical coastal ecosystems. Thus, there is a need to integrate morpho-taxonomy with molecular methods when assessing cyanobacterial diversity from tropical coastal ecosystems (Hoffman, 1999; Komárek et al., 2014). Over the last two decades, molecular tools based on small subunit ribosomal RNA (16S rRNA marker) have been widely used to study biogeographic patterns of cyanobacteria across various types of marine environment (Nübel et al., 1997; Mühling et al., 2008; Bolhuis and Stal, 2011; Engene et al., 2013). The 16S rRNA operons are present in more than one copy per genome of a prokaryote compared to protein coding genes (usually single copy) which increases the possibility to identify rare microbial species such as novel cyanobacteria from environmental DNA (Li, 2015). This molecule is one of the most widely used molecular markers in cyanobacterial diversity assessments (Nübel et al., 1997; Mühling et al., 2008). In clone library based prokaryotic diversity studies biological groups such as cyanobacteria can be studied at microhabitat levels and thus allow greater phylogenetic resolution (Li, 2015). Based on 16S rRNA sequencing approach, some of the studies have also shown the existence of novel lineages of marine planktonic cyanobacteria and thus unexplored planktonic cyanobacterial diversity may be high in mangroves (Geib et al., 2004; Huang et al., 2012; Choi et al., 2015). Microscopy and culture-based approaches may not be able to provide in depth information about unicellular marine planktonic cyanobacteria such as populations of Synechococcus which lack distinct morphological features (e.g., Geib et al., 2004). Other sequencing technologies such as next- generation sequencing allow for increased sequencing depth per sample (e.g., Sogin et al., 2006; Kircher and Kelso, 2010) and thus can be mined to investigate planktonic cyanobacterial diversity in mangroves.
The objective of this study was twofold: (i) investigate community composition and temporal patterns of marine planktonic cyanobacterial assemblages from Mooriganga estuary of Sundarbans in monsoon and post-monsoon seasons to track seasonal variability in link with precipitation and (ii) to document seasonal distribution pattern of Synechococcus sp. KORDI 78-like 16S rRNA sequences from the study area.
Materials and Methods
Study Area
The studied stations are part of the Sundarbans Biological Observatory Time Series (SBOTS) (for details about stations see Bhattacharjee et al., 2013; Samanta and Bhadury, 2014; Choudhury et al., 2015) where monthly samplings are undertaken to date since 2010 (Figure 1). The SBOTS stations although not distant (2 km), reflect variability in hydrology, water chemistry and fluxes over temporal and spatial scales (e.g., Ghosh and Bhadury, 2018; Singh and Bhadury, 2018). The SBOTS stations are situated in Sagar Island, largest island of Sundarbans, which is approximately 6.7 m above sea level and having mean tidal amplitude of 3.5–6.0 m throughout the year. Sagar Island is surrounded by the river Mooriganga in the East, the river Hooghly in the North and West while the southern part faces the Bay of Bengal. This study was undertaken across two predefined stations (named as Stn1 located at 21°40′44.4″, 88°08′49.5″ E and Stn3 located at 21°40′40.6″ N, 88°09′19.2″ E) (Figure 1). Stn1 is located in the Chemaguri creek that transverses the island and is surrounded by planted mangroves on both sides of the creek. The Chemaguri creek is connected to the Mooriganga estuary and influenced by freshwater influx during monsoon season. Stn3 is located in the Mooriganga estuary and is strongly influenced by freshwater discharge as well as from coastal water entering from the Bay of Bengal on a diurnal basis. All these stations represent typical estuarine conditions and variability in these two stations are observed in terms of salinity and other prevailing environmental parameters seasonally and thus were selected for this study. The average salinity of Stn1 is much lower (10 ppt; Bhattacharjee et al., 2013) compared to average salinity of Stn3 (15 ppt).
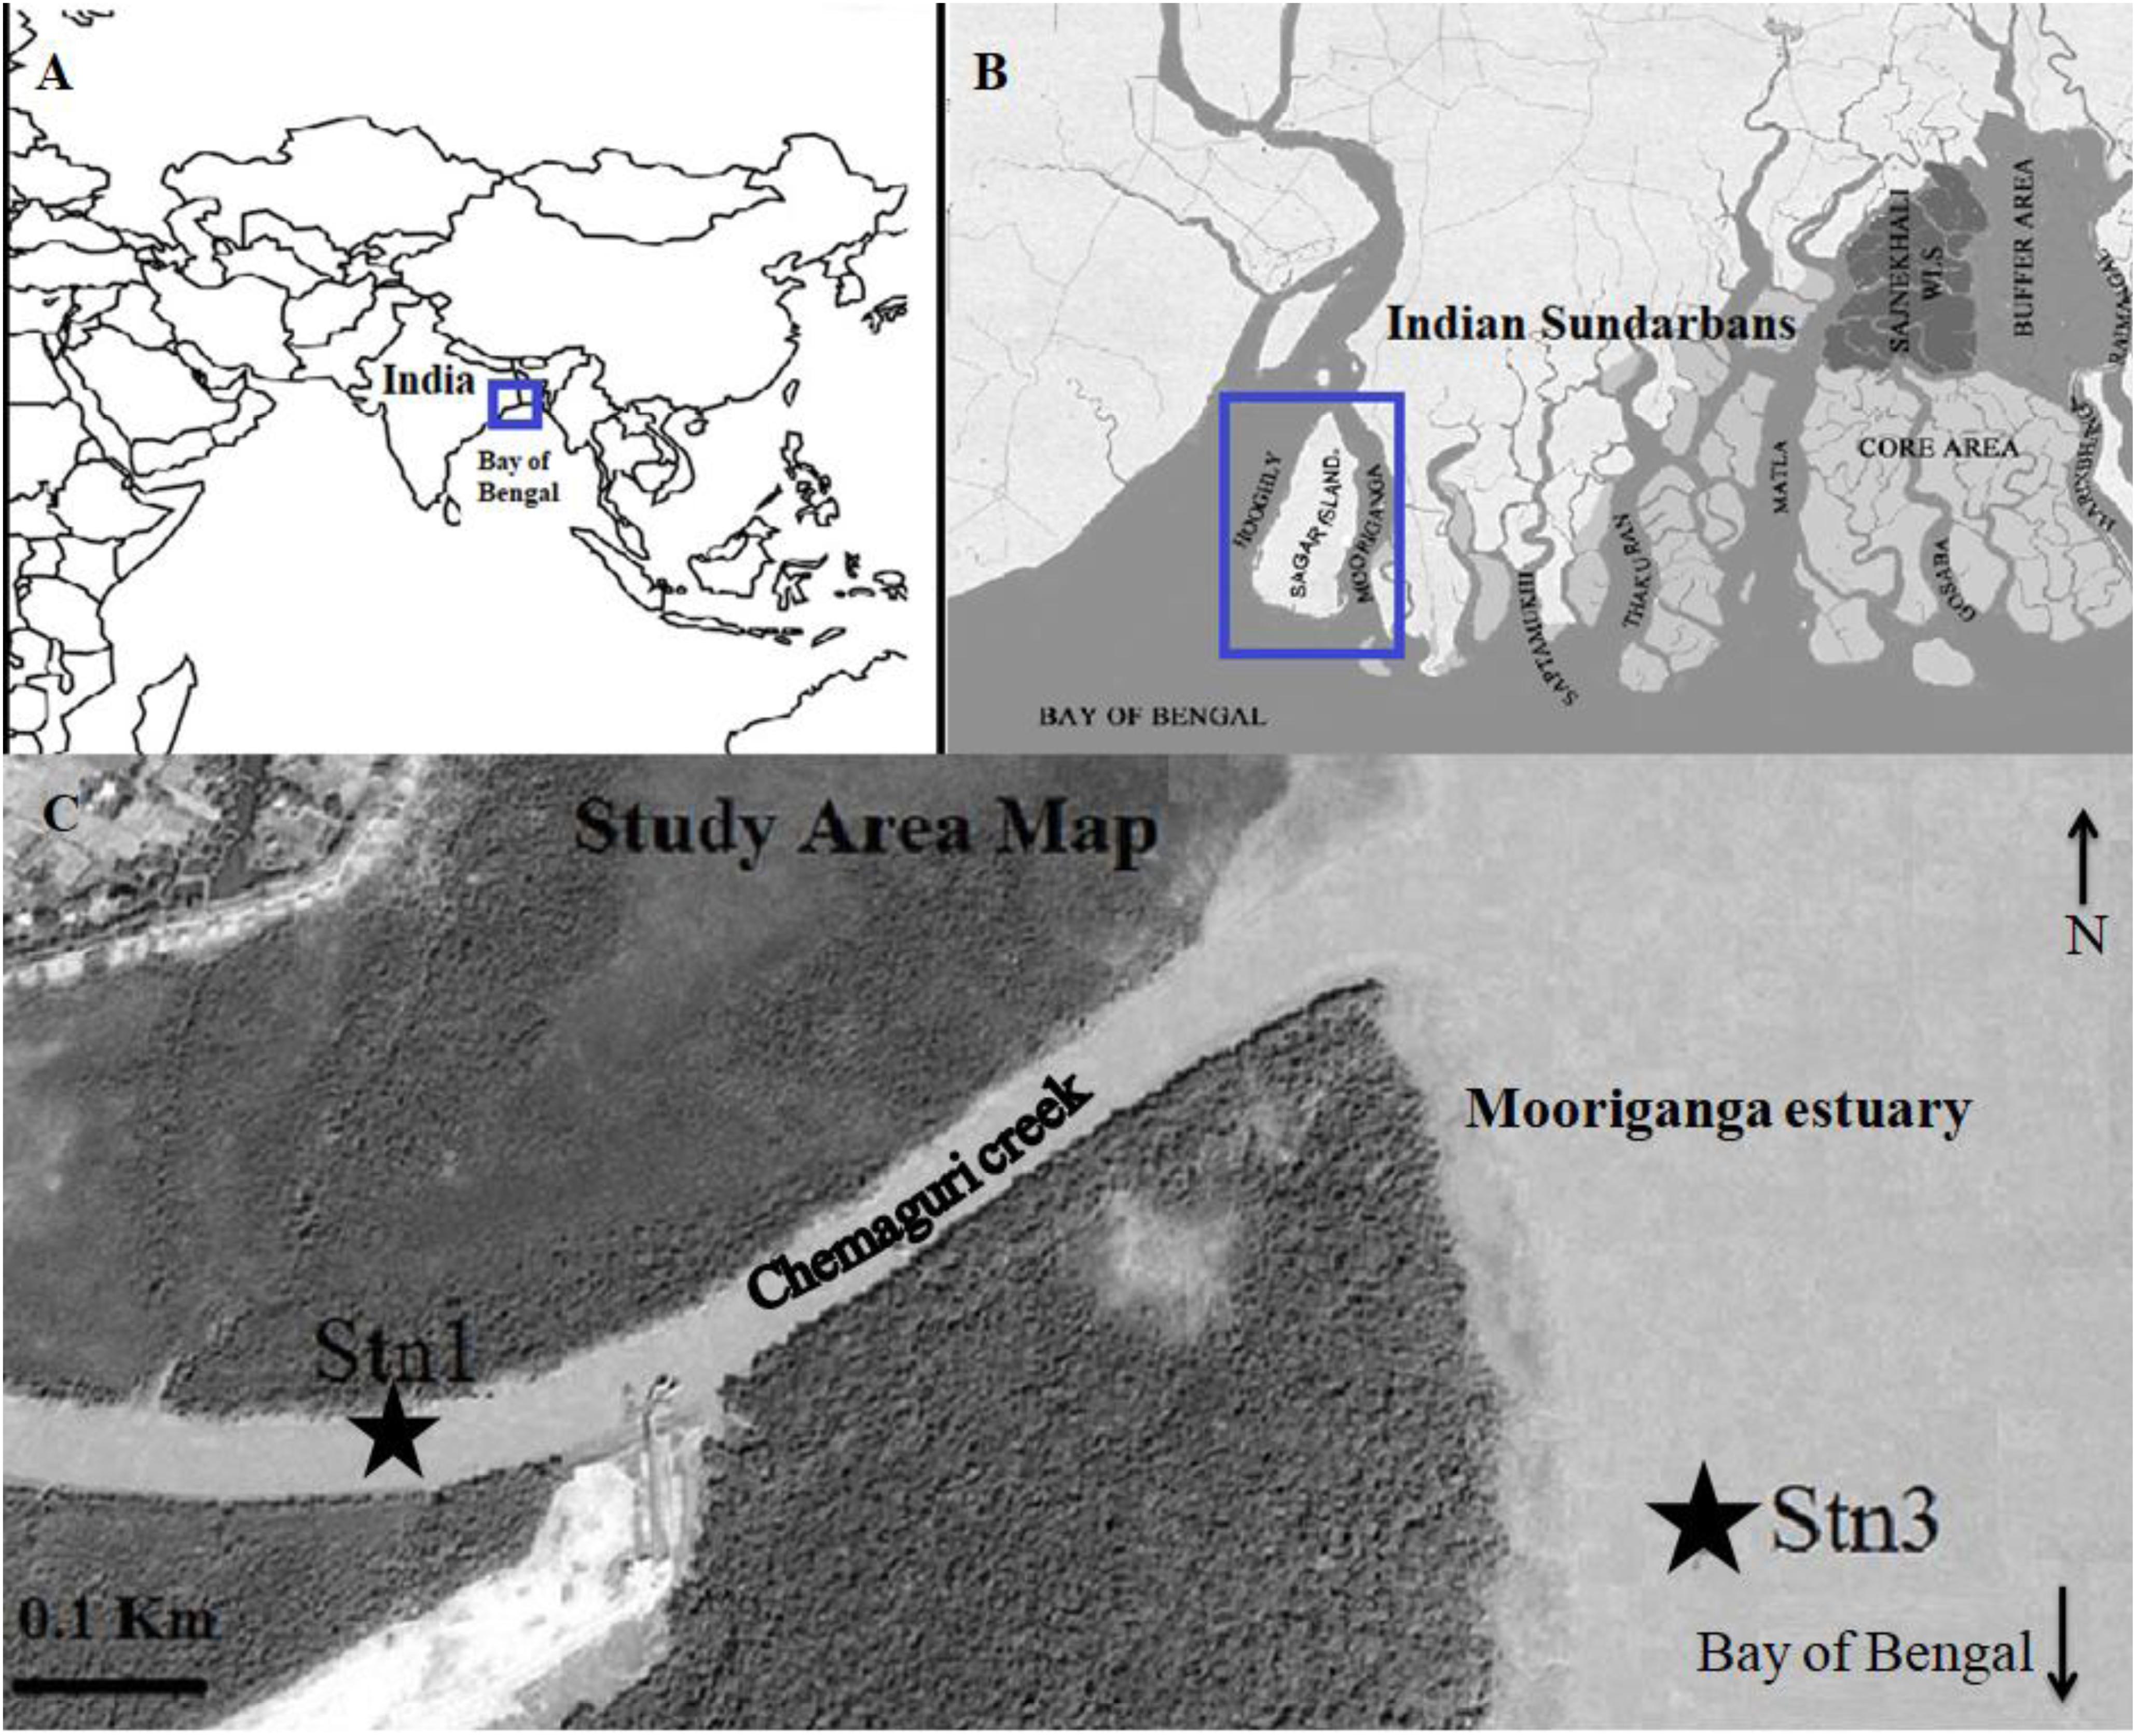
Figure 1. Map showing (A) location of Sundarbans mangrove facing the north-east Bay of Bengal (B) location of Sagar Island and Mooriganga estuary in Indian Sundarbans (C) location of Stn1 (GPS coordinates: 21°40′44.4″N 88°08′49.5″E) and Stn3 (GPS coordinates: 21°40′ 40.6″N 88°09′19.2″E) as part of SBOTS, Indian Sundarbans (Source image modified from Google Earth).
Sample Collection and Treatment
Sampling activities were undertaken 2 h after highest high tide to allow for sufficient mixing of water. Surface water samples were collected from both the stations (Stn1 and Stn3) during monsoon (July, August, and September) and post-monsoon (October, November, and December) seasons of 2012. All the sampling activity was undertaken at the start of second week of each month during 2012. In July, 2014 surface water samples were also collected from the same stations. The water samples were collected as per published protocol developed for time series sampling in SBOTS (Bhattacharjee et al., 2013; Choudhury et al., 2015). Two liters of surface water was collected from each station and subsequently fixed with molecular grade ethanol (Merck, Germany) (final concentration 5%). The water samples were immediately transported to laboratory, filtered through 0.22 μm nitrocellulose filter (Merck Millipore, Germany) for biomass concentration using vacuum pump and stored at −20°C until downstream molecular analyses. In situ measurement of environmental parameters such as surface water temperature (SWT) (digital thermometer, Eurolab ST9269B, Brussels, Belgium), salinity (refractometer, ERMA, Tokyo, Japan), pH (Eco Testr pH2, Eutech Instrument Pte Ltd., Singapore), dissolved oxygen (DO meter, Eutech Instrument Pte Ltd., Singapore) and transparency (Secchi disc, La Motte, France) were undertaken in triplicates in each station at the time of sampling. The probes used in this study were ATC enabled and calibrated in laboratory and also in field with standards as per manufacturers’ instructions prior to undertaking sampling each time during the study period. Moreover, the in situ salinity and dissolved oxygen data were rechecked for some time points in the laboratory using Mohr method and Winkler method, respectively (APHA, 1998) as part of revalidation of time series data of SBOTS. Precipitation data for months representing monsoon and post-monsoon seasons (2012) of South 24 Parganas, West Bengal, India were downloaded from Indian Meteorological Department website (IMD)1. Additionally, surface water was collected from each station following published protocols (Choudhury et al., 2015) for subsequent estimation of dissolved nutrients namely ammonium (Liddicoat et al., 1975), nitrate (Finch et al., 1998), ortho-phosphate (Strickland and Parsons, 1972) and silicate (Turner et al., 1998) in an UV-vis spectrophotometer (U2900, Hitachi, Tokyo, Japan).
Bright Field Microscopy
Morphological enumeration of surface water samples (July–December, 2012) from both the stations were undertaken using a bright field microscope (BX53 Olympus, Japan) attached with CCD camera and images were captured using CellSens software (Olympus, Japan). Morpho-taxonomic assignment of encountered cyanobacterial cell types was undertaken following published literatures (e.g., Komárek and Anagnostidis, 2005, 2007, 2013; Komárek, 2008).
Environmental DNA Extraction and PCR Amplification of 16S rRNA
Total environmental DNA was extracted from nitrocellulose filters using modified protocol of Boström et al. (2004) based on modification of two steps. In one step, 5 μL of proteinase K (10 mg mL−1) (Amresco, United States) was added during lysis and incubated at 55°C for 3 h. In the next step, 10 μL of lysozyme (20 mg mL−1) (SRL, India) was added and incubated at 37°C for 1 h. Rest of the extraction protocol was same as detailed earlier by Boström et al. (2004). The 16S rRNA partial fragments (424 bp) were amplified from environmental DNA for each station using 16S rRNA primers CYA361F and CYA785R (Mühling et al., 2008). This roughly amplifies the V3–V4 region of the 16S rRNA marker. Each PCR reaction comprised of 0.5 μL (∼40 ng μL-1) DNA template, 5.0 μL 10X Taq buffer, 5.0 μL dNTPs (final concentration 0.2 mM), 4.0 μL MgCl2 (final concentration 2.0 mM), 0.5 μL of each primer (final concentration 0.5 μM), 0.5μL BSA (10 mg/mL), 0.5 μL DNA Taq polymerase (5 U μL−1; MP Biomedical Asia, Mumbai, India), and water to make a final volume of 50 μL. PCR conditions were as follows: initial denaturation at 95°C for 5 min, 35 cycles of 95°C for 1 min, 53°C for 50 s, 72°C for 45 s, and final extension at 72°C for 10 min. PCR reactions for each environmental DNA sample were performed in triplicates, pooled together and subsequently purified using Gel Purification Kit (Qiagen, Valencia, CA, United States) as per manufacturer’s instructions.
Clone Library and DNA Sequencing
Purified PCR products were cloned using pGEM-T Easy vector system (Promega, Madison, WI, United States) following manufacturer’s instructions. Plasmid DNA containing inserts was sequenced with SP6 primer in an ABI Prism 3130 Genetic Analyzer (Foster City, California, United States) based on BigDyeTM Terminator chemistry (Foster City, California, United States). For monsoon representing Stn1 and Stn3, the clone libraries abbreviation used are Stn1_Jul12, Stn1_Aug12, Stn1_Sep12, Stn3_Jul12, Stn3_Aug12, Stn3_Sep12 while for post-monsoon the clone libraries abbreviation used are Stn1_Oct12, Stn1_Nov12, Stn1_Dec12, Stn3_Oct12, Stn3_Nov12, and Stn3_Dec12.
Sequence Analysis and Molecular Phylogeny
Sequence chromatograms were checked in BioEdit v7.0 (Hall, 1999) for any ambiguity or error before undertaking further analyses. The generated DNA sequences were compared with published 16S rRNA sequences from nucleotide databases (GenBank/EMBL/DDBJ) using blastn tool2. Uncultured environmental and cultured marine planktonic cyanobacterial 16S rRNA sequences that overlapped with sequences generated in this study based on blastn result were aligned using Clustal Omega (Sievers et al., 2011)3. The alignment consisted of 222 16S rRNA clones generated from this study as well as published cultured marine planktonic cyanobacterial 16S rRNA and uncultured marine planktonic cyanobacterial (22 sequences). The alignment file was manually checked in Seaview v4.0. For phylogenetic analysis the alignment was subsequently subjected to model test to ascertain appropriate model using jModelTest v2.1.2 (Darriba et al., 2012).
An online version of PHYML (Phylogenetic inferences using Maximum Likelihood4; Guindon et al., 2010) was used to construct a Maximum Likelihood (ML) tree by selecting GTR+G+I model based on the alignment. Bootstrap test was conducted to get the best topology from 50% majority rule consensus tree (Felsenstein, 1985). The 16S rRNA sequence of an Archaeaon (Thermococcus gammatolerans, Acc. no. NR074867) was used as an outgroup in this phylogeny. The marine planktonic cyanobacterial sequences, eukaryotic phytoplankton plastids (EPP) like sequences and bacterioplankton sequences generated in this study have been submitted to GenBank and their Acc. no. are from KU964398-KU964619, KX013845-KX014027, and KX013772- KX013844, respectively.
Illumina MiSeq Libraries
To validate the trends obtained from clone library dataset, next generation sequencing using Illumina approach was also adopted. Two Illumina MiSeq libraries were also prepared from water samples collected during July (2014) representing Stn1 and Stn3 of SBOTS. The amplification of partial 16S rRNA fragments was undertaken using barcoded primers Pro340F (5′-CCTACGGGNBGCASCAG-3′) and Pro805R (5′-GACTACNVGGGTATCTAATCC-3′) (Takahashi et al., 2014). Amplicon library preparation was undertaken using NEBNest Ultra Library Preparation Kit (New England Biolabs, United Kingdom). Subsequently, amplicon library was purified by 1X AmpureXP beads and checked using Agilent High Sensitivity (HS) chip on Bioanalyzer 2100 and quantified on fluorometer by Qubit dsDNA HS Array Kit (Thermo Fisher Scientific, United States). Each amplicon library was loaded onto Illumina MiSeq platform having concentration of 10–20 pM. The generated 16S rRNA sequences of both libraries have been deposited at the National Centre for Biotechnology Information (NCBI) under Short Read Archive (SRA) data (BioProject ID PRJNA35180).
Further analyses were undertaken for identifying marine planktonic cyanobacteria-like sequences from generated Illumina reads. The pair-end reads were stitched together by using Fast Length Adjustment of Short reads (FLASH) (Magoè and Salzberg, 2011). From the reads, barcode and primer sequences were removed. Chimera sequences were identified by using default settings of UCHIME in QIIME (Edgar et al., 2011). For each library, sequences were clustered into Operational Taxonomic Units (OTUs) at 97% sequence identity using UCLUST (Edgar, 2010). The OTUs were classified using RDP Classifier 2.2 at a confidence level of 80% (Wang et al., 2007).
Statistical Analyses
For taxonomic analysis and library comparison, marine planktonic 16S rRNA sequences generated in this study were grouped into operational taxonomic units (OTUs, phylotypes) based on 3% cut off at the nucleotide level using program DOTUR (Schloss and Handelsman, 2005). Calculation of Shannon–Wiener diversity (H′) values were undertaken in DOTUR for measurement of biodiversity of the overall pooled 16S rRNA clone library as well as for individual clone libraries. Rarefaction analysis were undertaken to compare the sequencing effort among the 16S rRNA clone libraries. The AMOVA (Analysis of Molecular Variance) and ANOSIM (Analysis Of SIMilarity) analyses were conducted with 1000 permutation using distance metrics generated in MOTHUR v1.35.1 (Schloss et al., 2009) program with respect to seasonal pooled libraries representing each station. HOMOVA (Homogeneity of Molecular Variance) was performed in MOTHUR to check genetic diversity within the seasonal pooled libraries representing each station. The LIBSHUFF analysis was undertaken to test whether two or more libraries have the same structure of marine planktonic cyanobacteria in terms of OTUs distribution using MOTHUR with default settings. Correlation analysis was undertaken to investigate link between observed environmental parameters and encountered OTUs using PAST v3 (Hammer et al., 2001). Principal component analysis (PCA) was performed to evaluate influence of environmental parameters on marine planktonic cyanobacterial communities (at the OTU level) in PRIMER v6.0.2 (Clarke and Gorley, 2006).
Rarefaction curves for NGS data representing both the stations were generated using Visualization and Analysis of Microbial Population Structures (VAMPS) (Huse et al., 2014). Additionally, all the encountered OTUs were subjected to phylogeny based on Maximum Likelihood method and General Time Reversible model. The bootstrap consensus tree inferred from 1000 replicates was taken to represent the evolutionary history of the taxa analyzed. A discrete Gamma distribution was used to model evolutionary rate differences among sites [5 categories (+G, parameter = 0.5083)]. The rate variation model allowed for some sites to be evolutionarily invariable ([+I], 0.00% sites).
Results
Environmental Parameters
Temporal variation in environmental parameters was observed in the studied stations of SBOTS (Table 1). Surface water temperature decreased from monsoon to post-monsoon and ranged from 24.7 to 33°C, while pH did not show marked variability during the study period. Salinity was highest in July, 2012 and lowest during August-October, 2012 in both the stations. Overall during monsoon the salinity ranged from 4 to 15 ppt in Stn1 whereas for Stn3 the range was from 10 to 19 ppt. During post-monsoon, salinity ranged from 11 to 14 ppt in Stn1 while for Stn3 it was from 12 to 19 ppt. The Secchi depth exhibited variability between monsoon and post-monsoon seasons representing both the stations (Table 1). Precipitation was higher in monsoon (average: 307.8 mm) compared to post-monsoon (average: 53.3 mm) (Supplementary Table S1).
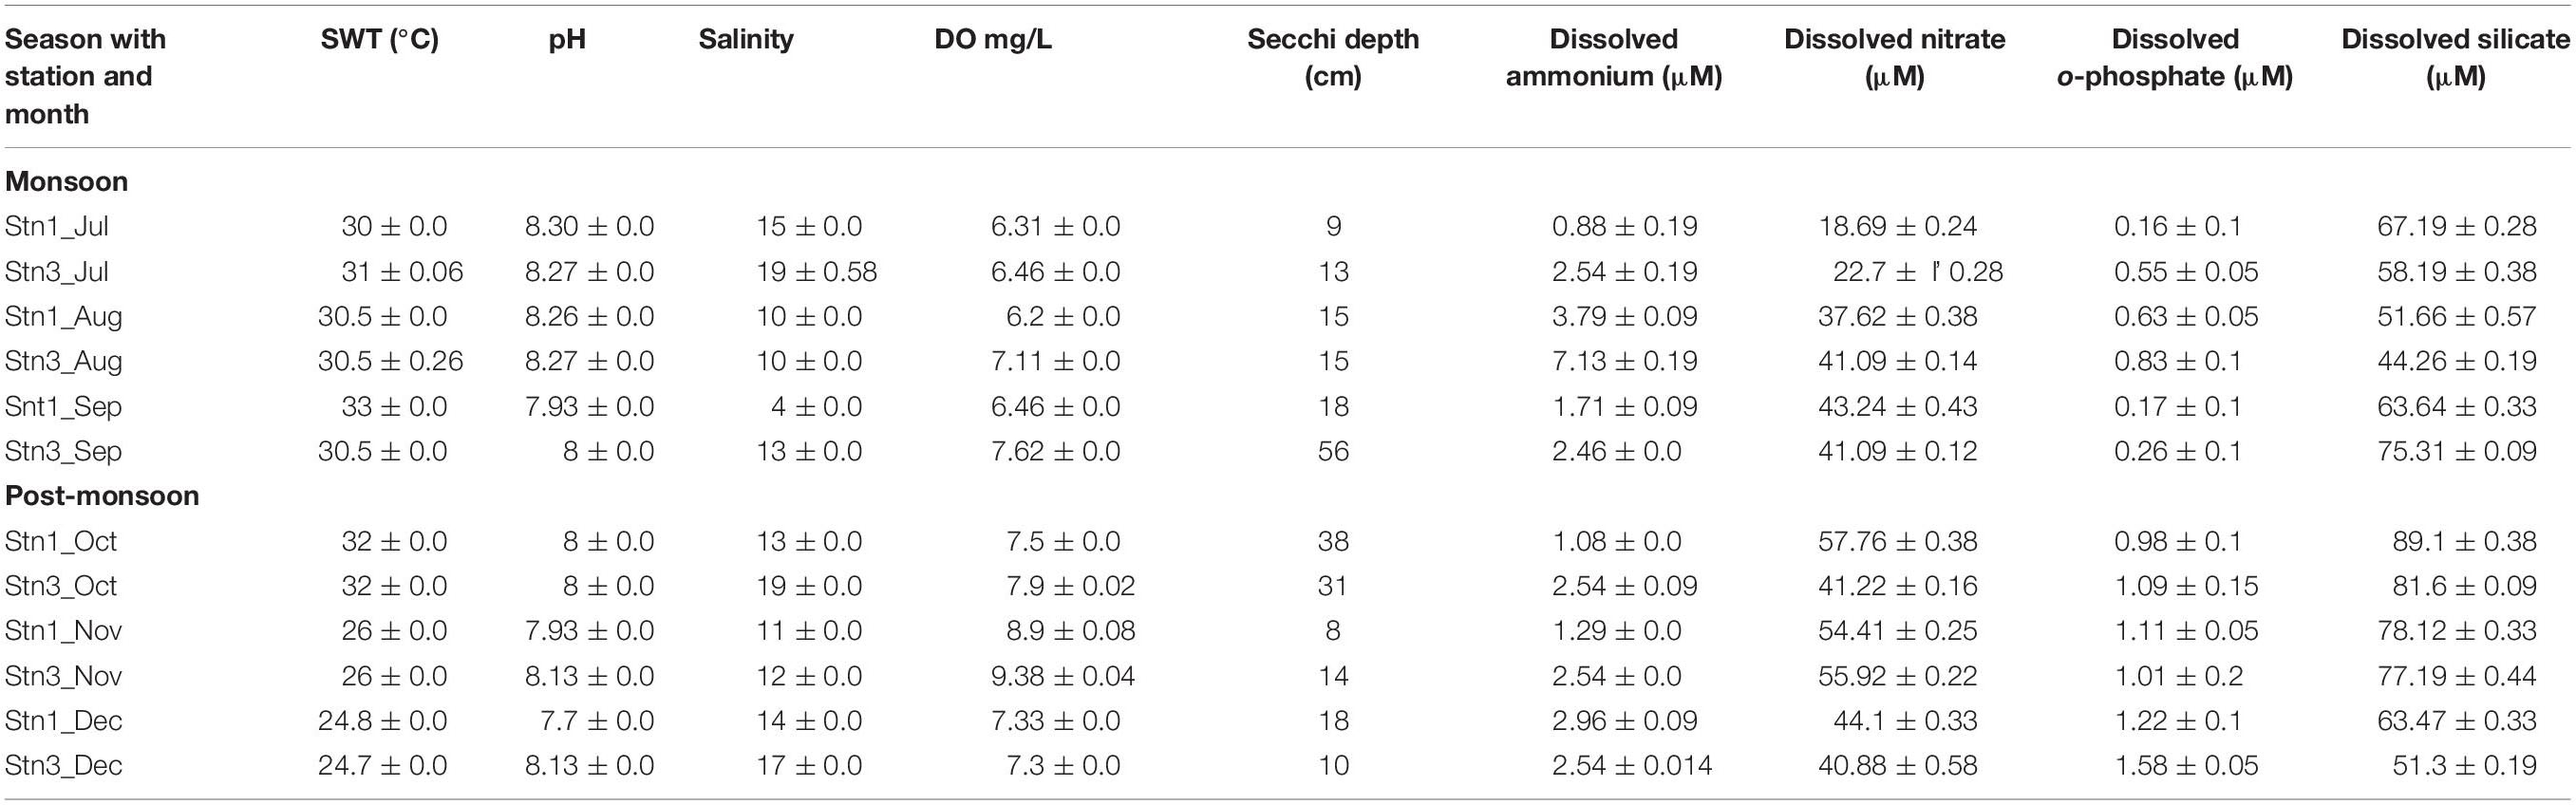
Table 1. Environmental variables for both the stations of SBOTS from July to December (2012); July to September denotes monsoon season while October to December denotes post-monsoon season. The reported values are average of triplicate measurements.
All the other environmental parameters showed seasonal trends during the study period. For example, dissolved ammonium concentration in Stn1 varied from 0.88 to 3.79 μM during monsoon while for Stn3 during the same season the range was from 2.46 to 7.13 μM exhibiting station level variability in monsoon. Interestingly, during post-monsoon in Stn1 dissolved ammonium concentration ranged from 1.08 o 2.96 μM and for Stn3 it was 2.54 μM showing no change across 3 months representing the same season. Thus there was temporal and spatial variability even within a season with respect to dissolved ammonium concentrations in the study area. For dissolved orthophosphate concentrations during monsoon season in Stn1 the range was from 0.16 to 0.63 μM and in Stn3 it was from 0.26 to 0.83 μM exhibiting spatial variability within the study area. For the same nutrient, there was an increase during post-monsoon in Stn 1 (0.98–1.22 μM) and Stn3 (1.09–1.58 μM), respectively. The seasonal trends for other nutrients have been detailed in Table 1.
Bright Field Microscopy
Based on observable morphological features, cyanobacterial taxa namely Synechococcus sp., Chroococcidiopsis sp., Phormidium sp., Trichocoleus sp., and Trichodesmium sp. were encountered using bright field microscopy (Supplementary Figure S1). Cells belonging to the genus Synechococcus sp. were observed in all surface water samples representing all the monsoon and post-monsoon months in both stations while cells of Trichodesmium sp. were encountered only in Stn3 during some months of post-monsoon (October and November). The cells belonging to Chroococcidiopsis sp. were observed in Stn1 only during 1 month of monsoon (July). Moreover, cells of Phormidium sp. and Trichocoleus sp. were observed only in one of the post-monsoon months (November) in both stations.
Marine Planktonic Cyanobacterial Community Composition Based on 16S rRNA Sequences
Twelve 16S rRNA clone libraries were prepared from both Stn1 and Stn3 spanning all the months representing monsoon and post-monsoon seasons of 2012 (July to December). In total, sequences of 478 clones were considered as part of this study. On an average 40 clones from each library were targeted for sequencing. On the basis of blastn result, three major planktonic organismal groups were detected in varying proportion, of which, 222 clones showed identity with published uncultured and cultured marine planktonic cyanobacterial 16S rRNA sequences, 183 clones showed identity with published eukaryotic phytoplankton plastid (EPP)-like sequences and remaining 73 clones exhibited identity with published bacterioplankton-like 16S rRNA sequences. Ranges for lowest and highest identity percentage at the nucleotide level representing all the generated marine planktonic cyanobacterial sequences with published cyanobacterial sequences from nucleotide databases are detailed in Supplementary Table S2.
Based on taxonomic grouping of 222 sequences using blastn and molecular phylogeny approaches, 161 out of 222 16S rRNA sequences were represented by unicellular forms of marine planktonic cyanobacteria, 14 sequences were filamentous and remaining 47 sequences could not be assigned to any distinct morphological form.
Seasonal Variability of Marine Planktonic Cyanobacterial Assemblages
Marine planktonic cyanobacterial assemblages in both stations of SBOTS showed distinct seasonal variability between monsoon and post-monsoon as seen from relative abundance of generated 16S rRNA sequences (Figure 2 and Supplementary Table S2). In monsoon season, 42 (relative abundance-68.8%) out of 61 clone sequences from Stn1 libraries showed significant identity at the nucleotide level (95–100%) with published 16S rRNA sequences of several cultured strains belonging to the genus Synechococcus (Figure 2 and Supplementary Table S2). One sequence (relative abundance ∼1.7%) from Stn1 showed 99% identity with published 16S rRNA sequence belonging to Chroococcidiopsis sp. Remaining 18 sequences (relative abundance 29.5%) from Stn1 of monsoon could not be assigned to any particular cyanobacterial genus, however, these sequences showed identity (77–97%) with published uncultured cyanobacterial 16S rRNA sequences (Figure 2 and Supplementary Table S2). During post-monsoon season for the same station, 27 (relative abundance ∼57.5%) out of 47 sequences showed identity with published 16S rRNA sequences representing several strains of the genus Synechococcus (Figure 2 and Supplementary Table S2). Nine (relative abundance∼19.1%) sequences showed significant identity (99–100%) with published 16S rRNA sequence of Hapalosiphon sp. while four (relative abundance∼8.5%) sequences showed identity (99–100%) with published 16S rRNA sequence of Fischerella sp. (Figure 2 and Supplementary Table S2). Remaining seven (relative abundance ∼14.9%) sequences showed identity with published uncultured cyanobacterial 16S rRNA sequences and thus could not be assigned to any particular cyanobacterial genus.
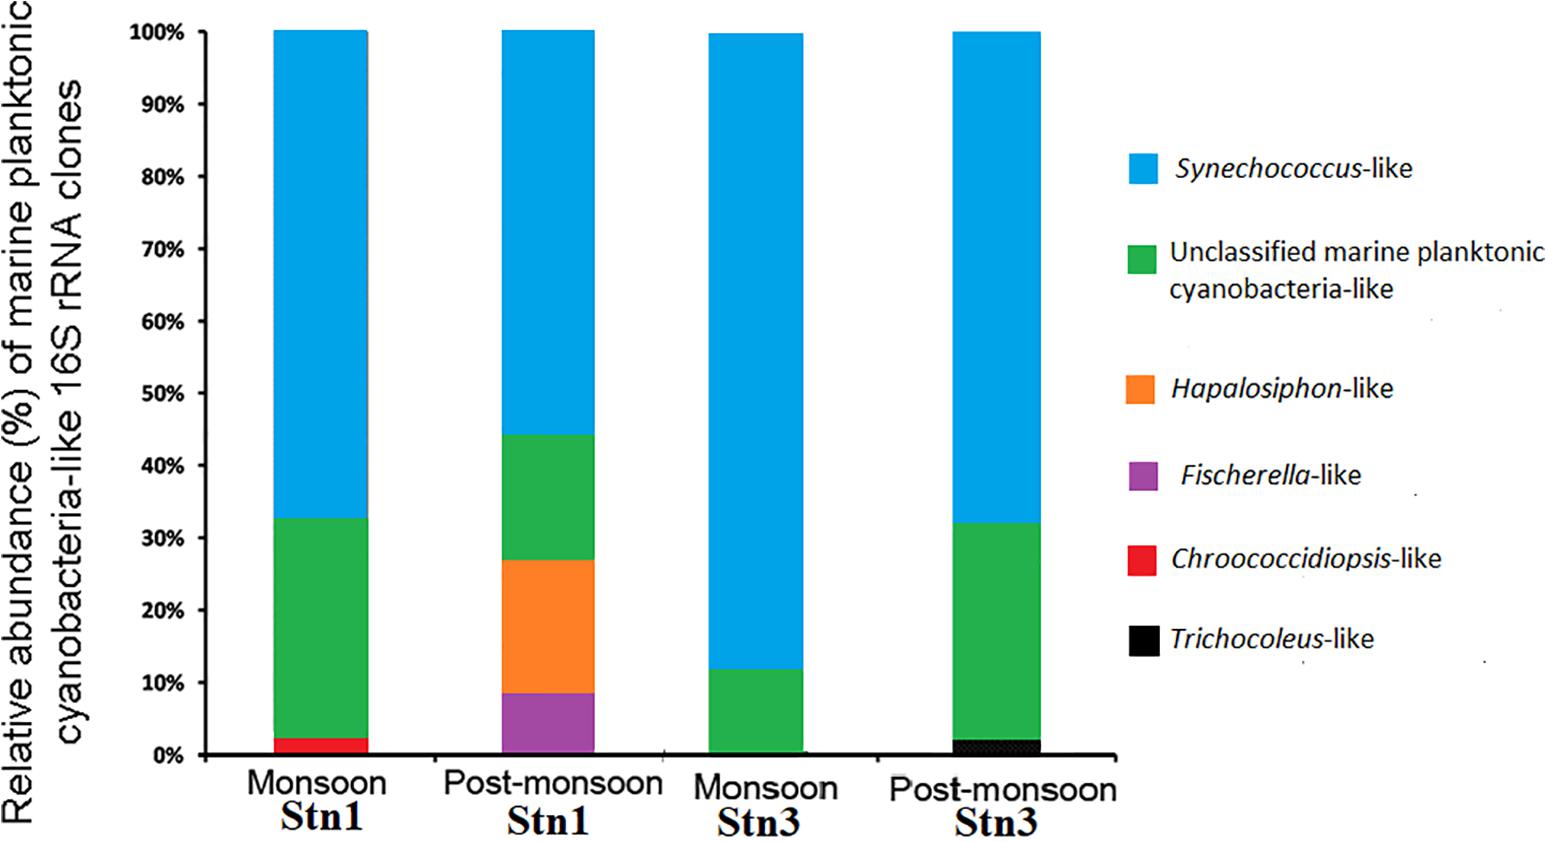
Figure 2. Relative abundance of marine planktonic cyanobacterial sequences encountered during monsoon and post-monsoon seasons in Stn1 and Stn3 clone libraries.
Similarly, in monsoon season, 63 (relative abundance ∼85.1%) out of 74 sequences of Stn3 showed 95–100% identity with published cultured strains representing the genus Synechococcus (Figure 2 and Supplementary Table S2). Remaining eleven (relative abundance∼14.9%) sequences showed identity (83–97%) with published uncultured cyanobacterial 16S rRNA sequences and thus could not be assigned to any particular cyanobacterial genus (Figure 2 and Supplementary Table S2). However, in post-monsoon season for the same station, 28 (relative abundance ∼70%) out of 40 sequences showed identity with published sequences of several strains of Synechococcus while one (relative abundance-2.5%) sequence showed identity (97%) with a cultured representative belonging to Trichocoleus sp. In post-monsoon, 11 (relative abundance-27.5%) sequences of Stn3 showed 83–97% identity at the nucleotide level with several uncultured cyanobacterial 16S rRNA sequences (Figure 2 and Supplementary Table S2). Overall, across both the seasons, Synechococcus-like 16S rRNA sequences showed dominance in both Stn1 and Stn3 clone libraries of SBOTS.
In monsoon season, for Stn1 and Stn3 there was overwhelming dominance of sequences represented by various populations belonging to genus Synechococcus and remaining sequences which were cyanobacteria-like in both stations could not be assigned under known genera. For post-monsoon, the dominance of Synechococcus populations continued in both stations. However, within short geographical distance variability in sequences representing other cyanobacterial taxa were evident between Stn1 and Stn3. In Stn1, Hapalosiphon and Fischerella-like sequences were encountered in considerable numbers but not in Stn3. Interestingly, not a single sequence from the study area showed identity with published Prochlorococcus-like 16S rRNA sequences during the study period.
Seasonal Distribution of Synechococcus With Special Reference to KORDI 78-Like 16S rRNA Sequences
Synechococcus-like sequences represented bulk of the marine planktonic cyanobacterial assemblages in generated 16S rRNA clone library datasets. In total, 160 out of 222 sequences showed identity with published 16S rRNA sequences representing seventeen cultured strains belonging to the genus Synechococcus (Supplementary Table S3).
These sequences showed significant variation between monsoon and post-monsoon seasons in Stn1 and Stn3 (Figure 3). Out of 160 Synechococcus -like sequences, 71 sequences showed 95–100% identity at the nucleotide level with published 16S rRNA sequence of cultured Synechococcus sp. strain KORDI-78 (Acc. no. FJ497748) isolated previously from East China Sea (Supplementary Table S3). In Stn1, 13 (relative abundance-30.9%) out of 42 sequences of monsoon season also showed 99–100% identity with published 16S rRNA sequence of Synechococcus sp. strain KORDI-78 (Figure 3 and Supplementary Table S3). Five (relative abundance-11.9%) sequences showed 95–100% identity with published sequence of Synechococcus sp. strain Suigetsu-CG2 (Acc. no. AB610891) isolated previously from Lake Suigetsu, a saline meromictic lake located in Japan (Figure 3 and Supplementary Table S3). Five (relative abundance-11.9%) sequences showed 95–100% with published sequence of Synechococcus sp. strain CSIRNIO1 (Acc. no. KJ130543) (Figure 3 and Supplementary Table S3). In the monsoon libraries of Stn1, overall 16S rRNA sequences showed identity (95–100%) with sequences of 12 cultured strains belonging to the genus Synechococcus. In post-monsoon for Stn1, eleven (relative abundance-40.7%) out of 27 sequences also showed identity (95–100%) with published 16S rRNA sequence of Synechococcus sp. strain KORDI-78. Besides, five (relative abundance-18.5%) sequences showed 98–99% identity with published sequence of Synechococcus sp. strain UW122 (Acc. no. JQ421035) isolated previously from Sargasso Sea (Figure 3 and Supplementary Table S3). The remaining sequences in post-monsoon libraries of Stn1 showed identity and with other Synechococcus strains (Supplementary Table S3) and their relative abundance has been shown in Figure 3. Overall, sequences showing identity (96–100%) with nine cultured Synechococcus strains have been encountered in this study (Supplementary Table S3).
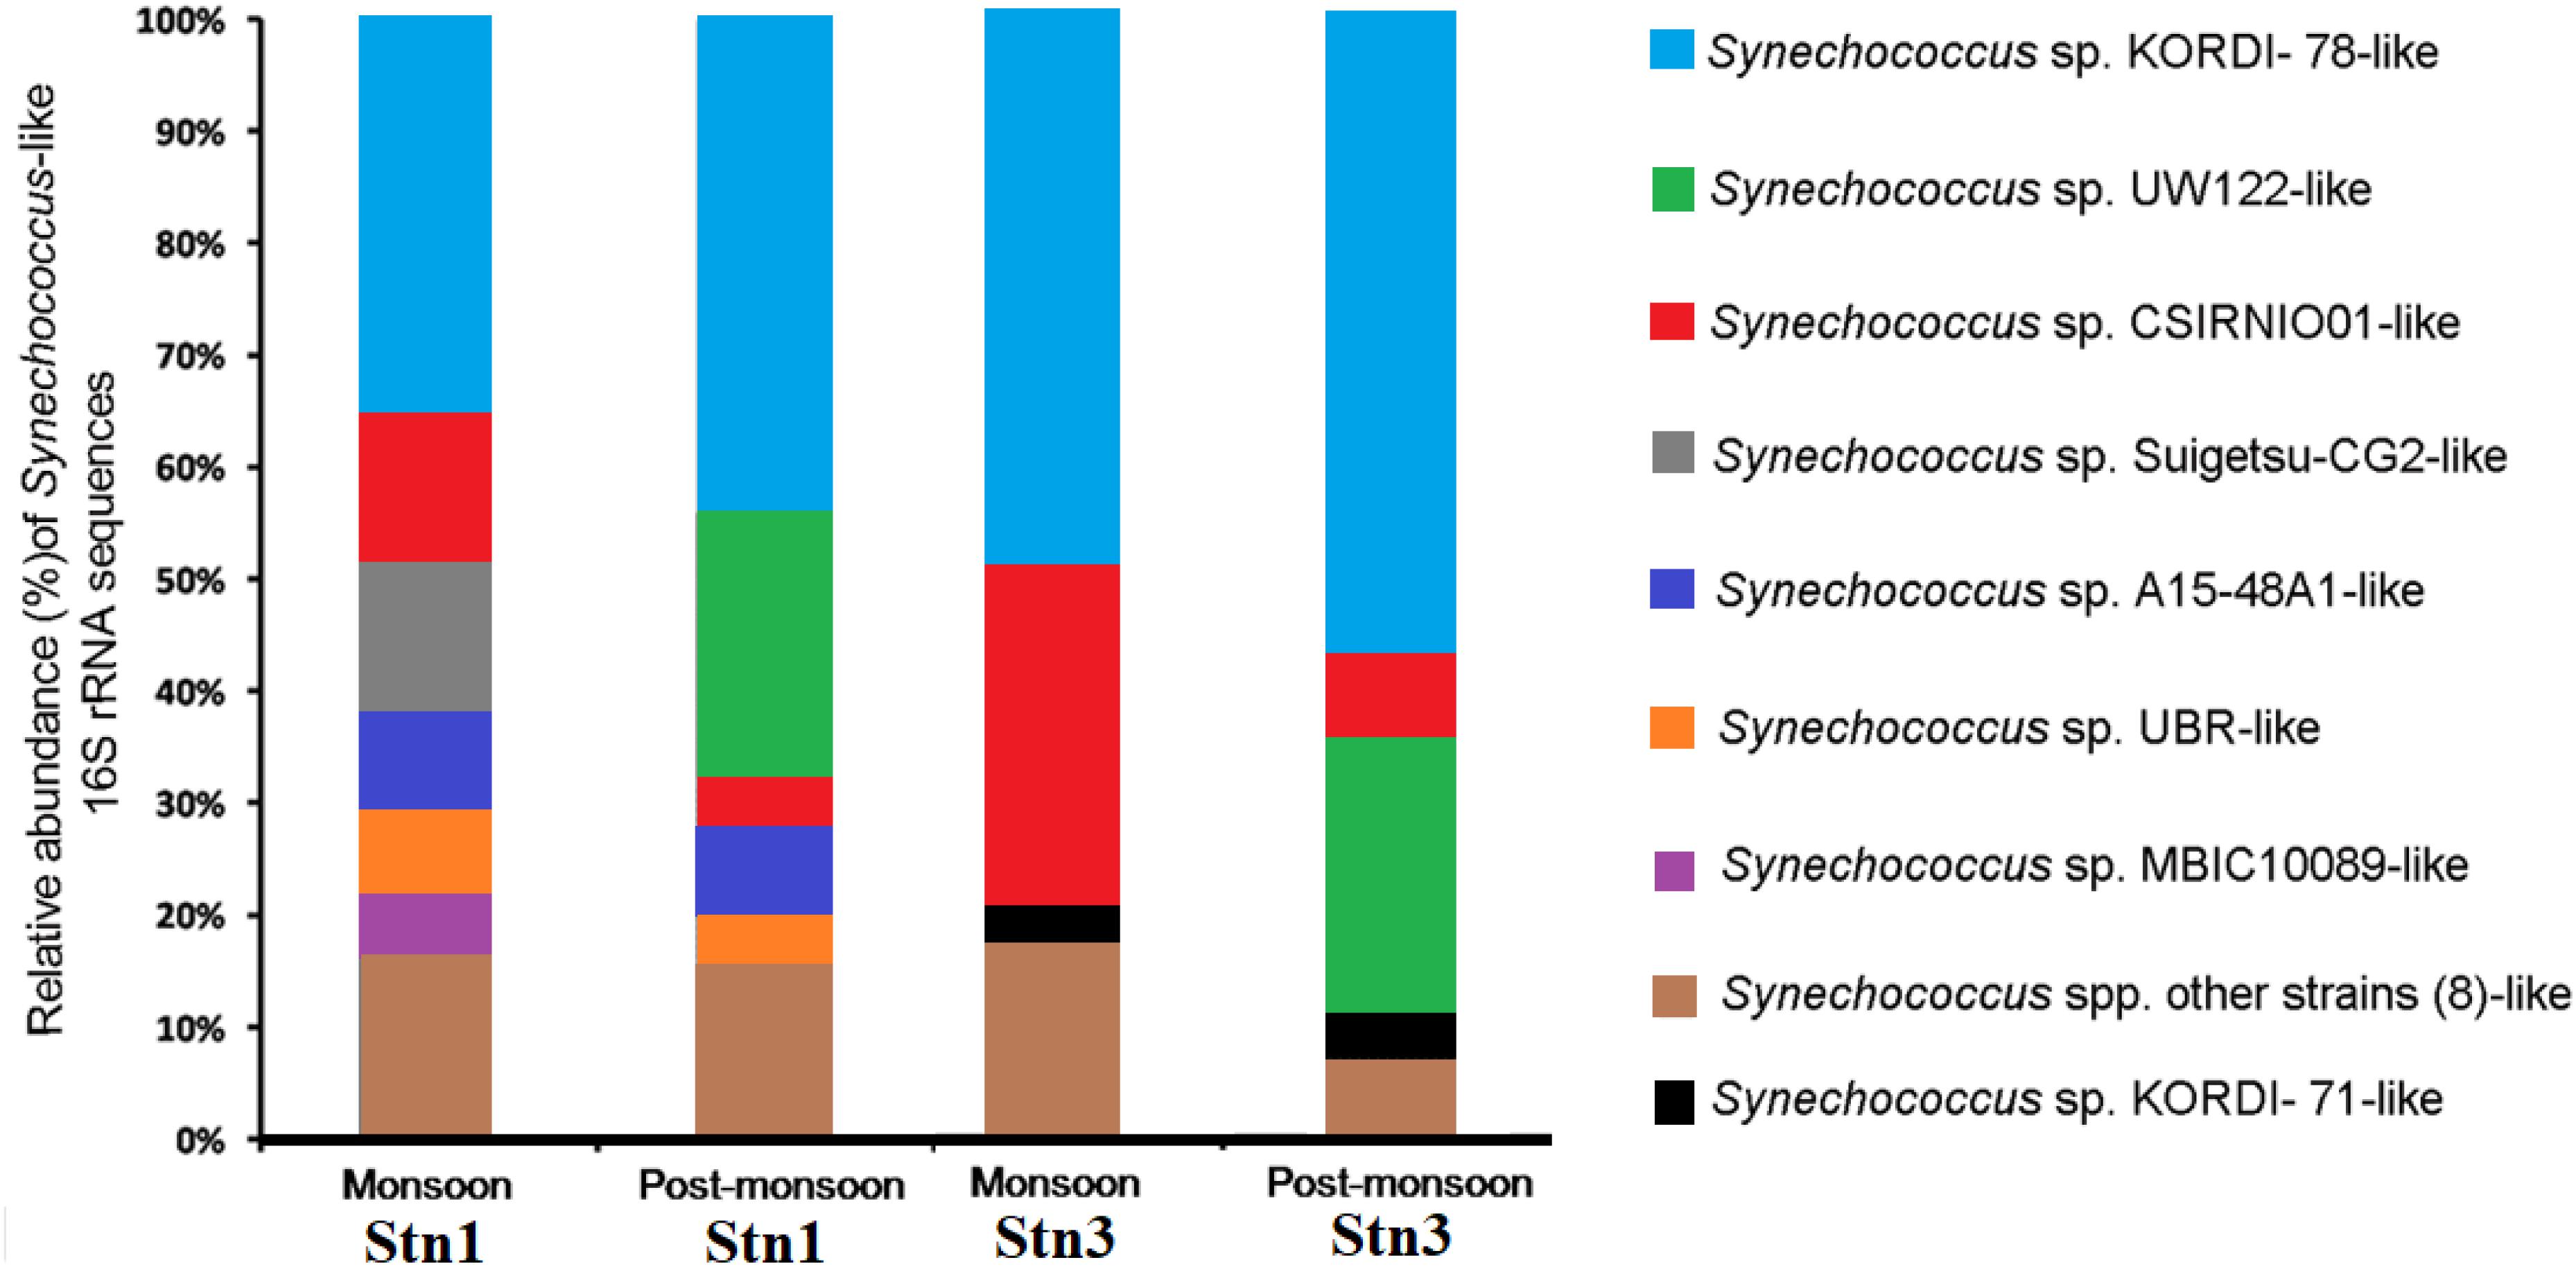
Figure 3. Relative abundance of Synechococcus like 16S rRNA sequences encountered in monsoon and post-monsoon seasons in Stn1 and Stn3 clone libraries.
In Stn3, during monsoon season, 31 (relative abundance -49.2%) out of 63 sequences also showed 99–100% identity with published 16S rRNA sequence of Synechococcus sp. strain KORDI-78 (Figure 3 and Supplementary Table S3). In the same season, 19 (relative abundance-30.1%) sequences showed 95–100% identity with published sequence of Synechococcus sp. strain CSIRNIO1 (Figure 3 and Supplementary Table S3). Besides, remaining sequences showed identity with other strains of Synechococcus (Supplementary Table S3) and their relative abundance has been shown in Figure 3. Overall, sequences from this station showed identity (95–100%) with 11 cultured Synechococcus strains (Supplementary Table S3). During post-monsoon for Stn3, 16 (relative abundance-57.1%) out of 28 sequences showed identity (97–100%) with sequence of Synechococcus sp. strain KORDI-78 (Figure 3 and Supplementary Table S3) while 7 (relative abundance-25%) sequences showed 98–99% identity with published sequence of Synechococcus sp. strain UW122 (Figure 3 and Supplementary Table S3). Overall, sequences from this station showed 95–100% identity with only six strains of Synechococcus.
Phylogeny of Marine Planktonic Cyanobacteria-Like 16S rRNA Sequences
In marine planktonic cyanobacteria-like 16S rRNA phylogeny (ML), several clades and subclades were encountered (Figures 4A,B). The Clade I is represented by 43 sequences from Mooriganga estuary (monsoon- 35 sequences; post-monsoon- 8 sequences), in addition to published sequences representing cultured cyanobacterial strains including Synechococcus. In this clade, sequences from Stn1 and Stn3 clustered with several published cultured strains of Synechococcus. For example, 3 sequences (one sequence each representing August and September for Stn1; one sequence representing September of Stn3) clustered with sequence of Synechococcus sp. strain RCC61 as part of Clade I and exhibited intermediate bootstrap support (Figure 4A). As part of this clade, 5 sequences (2 sequences each from Stn1 and Stn3 representing September; 1 sequence from Stn1 representing October) clustered with the 16S rRNA sequence of an uncultured Chroococcales cyanobacterium PE8F6 (Acc. no. HE805949), although exhibiting low bootstrap support (Figure 4A). Another nine sequences (Stn1- 1 sequence from July; Stn1- 6 sequences from September and Stn3-2 sequences from September) clustered with cultured Synechococcus sp. strain CENA140 (Acc. no. KC695834) previously isolated from mangrove soil of Brazil and with intermediate bootstrap support. In the same Clade I three sequences (1 sequence representing September of Stn1; 2 sequences each representing July and September of Stn3) formed a subcluster with strong support as part of the bigger Synechococcus group but may also represent a new species under this genus.
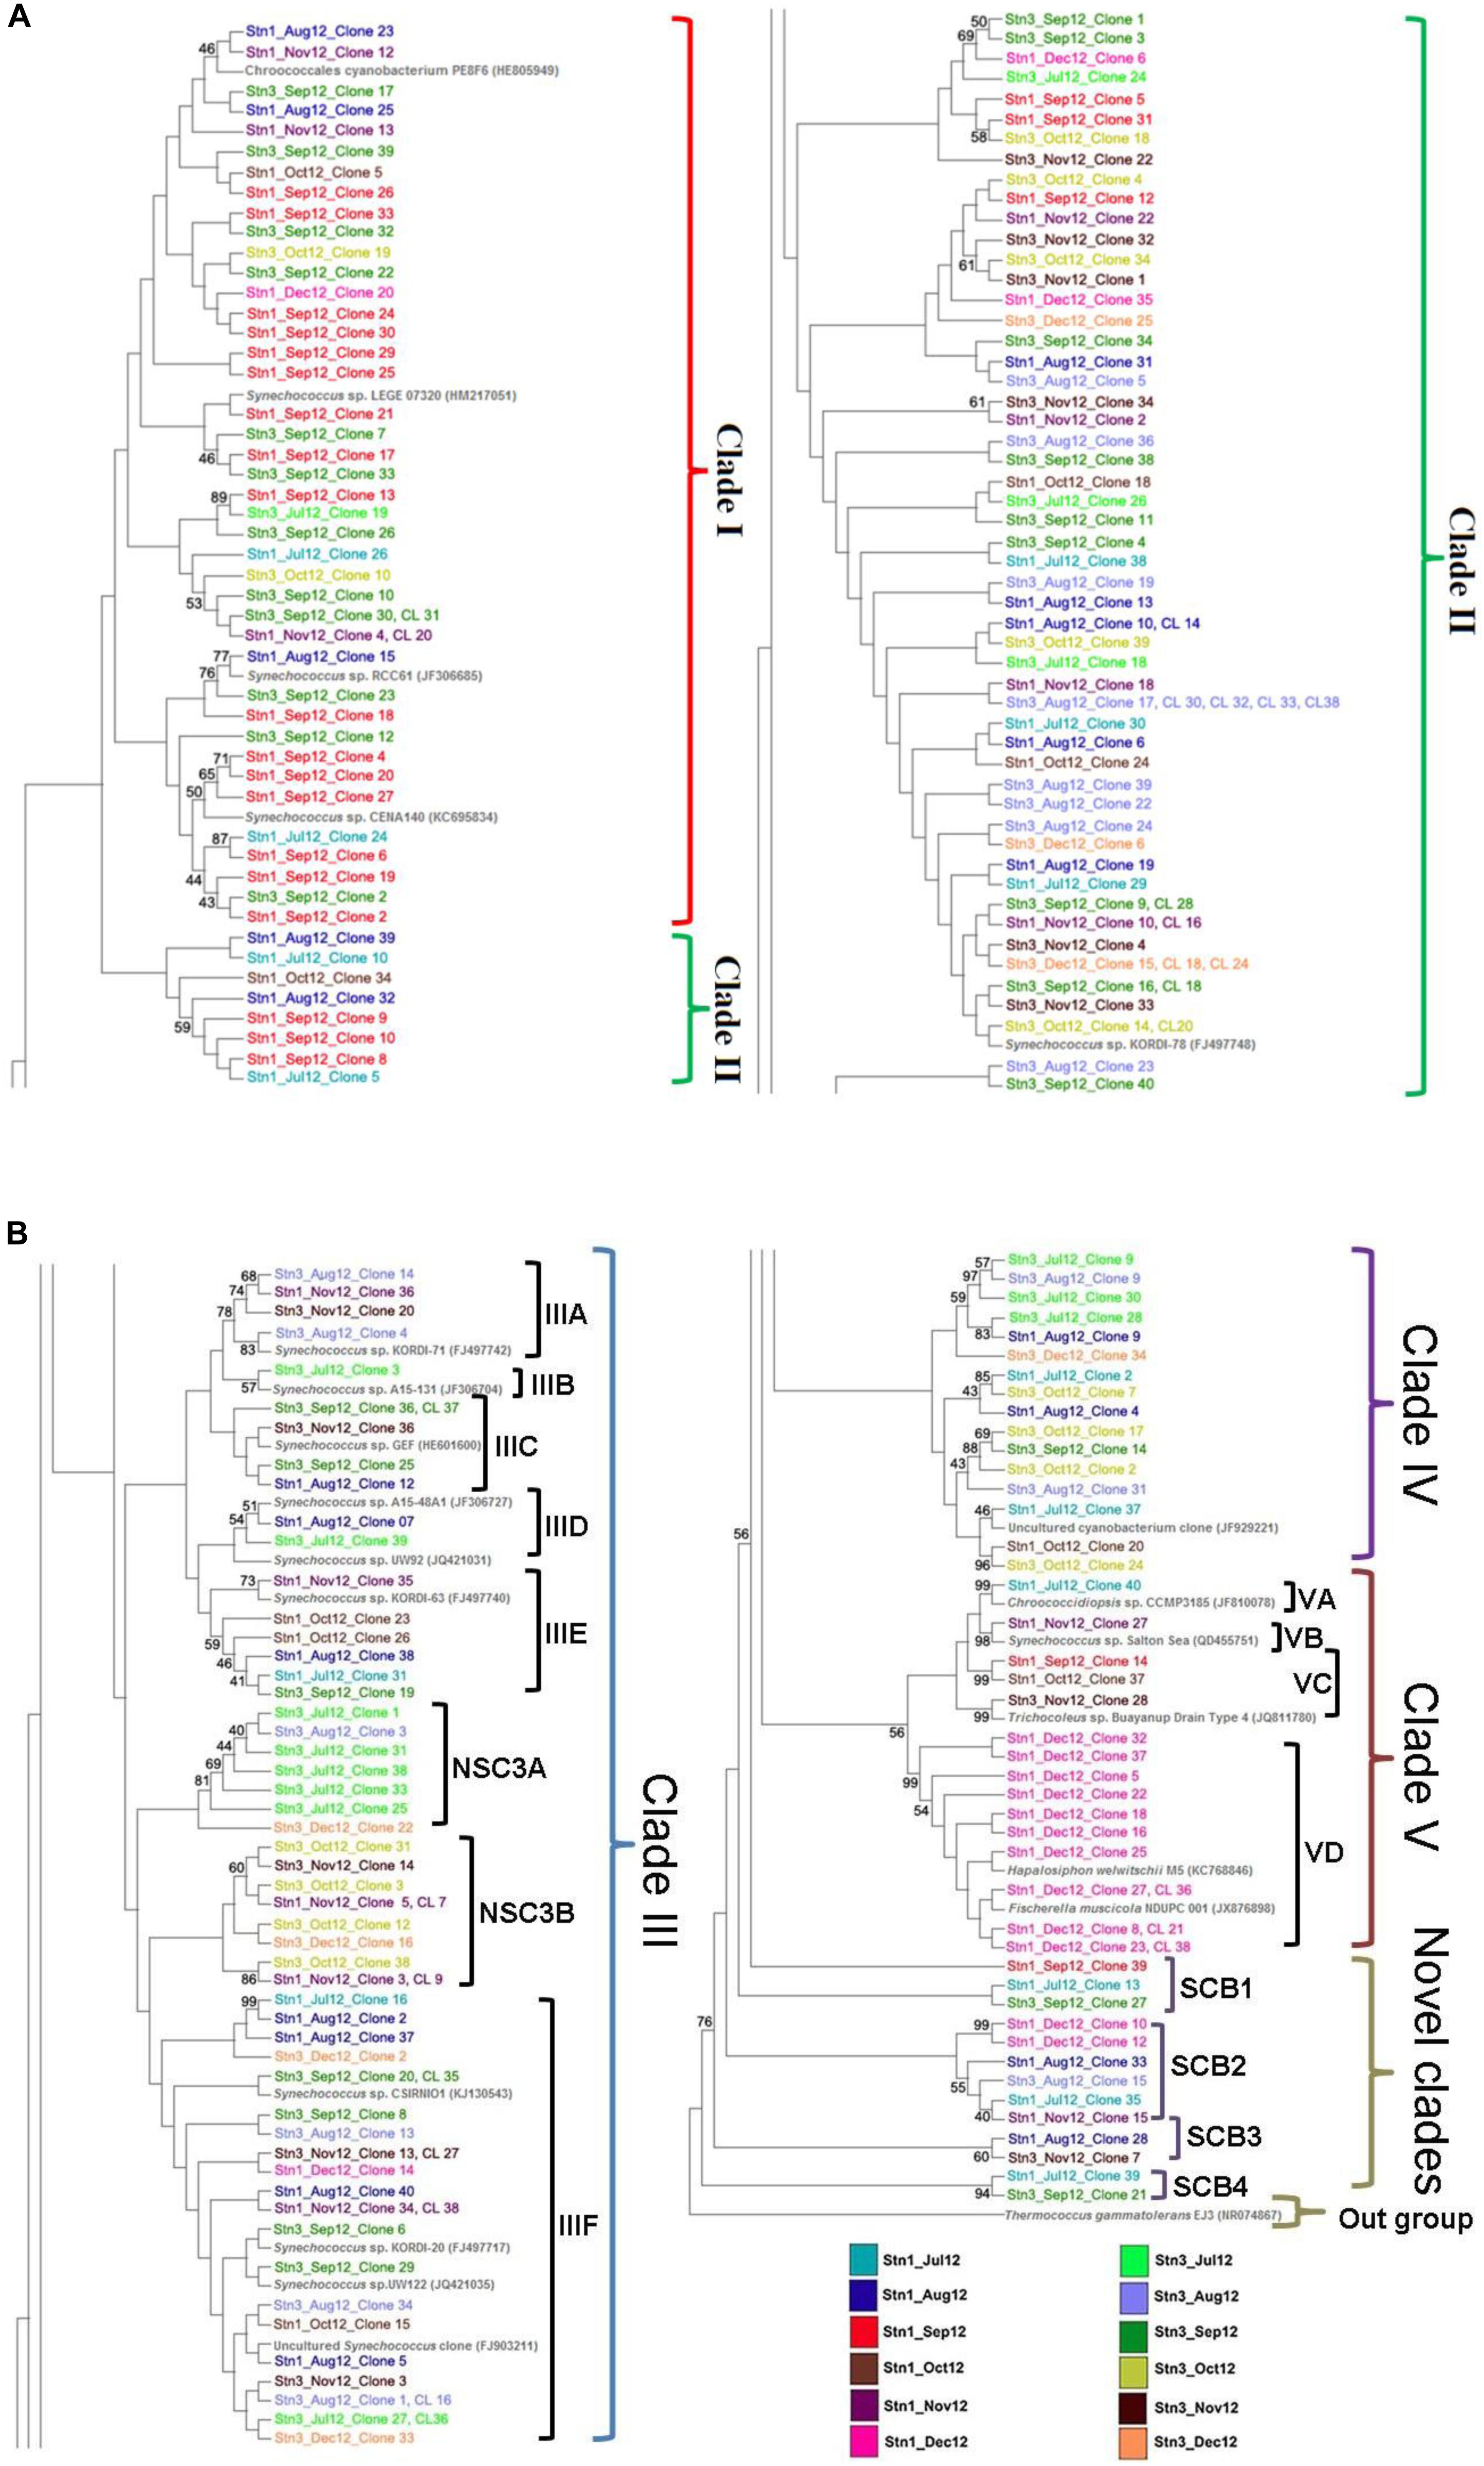
Figure 4. (A,B) Maximum Likelihood (ML) phylogenetic tree for marine planktonic cyanobacterial 16S rRNA sequences using GTR as a substitution model of deduced 422 nucleotide long alignment representing 271 sequences including 222 sequences generated in this study. Bootstrap values for nodes > 50% are shown in the tree. The 16S rRNA sequence of an Archaeaon, Thermococcus gammatolerans was chosen as outgroup.
The Clade II represented the largest clade consisting of 72 sequences from the study area along with published 16S rRNA sequence of Synechococcus sp. strain KORDI-78. In this clade sequences representing all the studied months of both stations of SBOTS (Sundarbans) are represented. Although several subclades were formed (not marked) but bootstrap support was low and majority of the subclades was part of the overall clade represented by the dominant sequence of Synechococcus sp. strain KORDI-78. The third clade- Clade III is represented by 60 sequences from study area and is the second largest clade observed in phylogenetic tree (Figure 4B). This clade consisted of eight subclades namely, IIIA, IIIB, IIIC, IIID, IIIE, IIIF including two novel subclades namely NSC3A and NSC3B (Figure 4B). The subclade-IIIA with bootstrap support consisted of 4 sequences (Stn3-2 sequences from August; Stn1 and Stn3- 1 sequence each from November) along with published 16S rRNA sequence of Synechococcus sp. strain KORDI-71 (Acc. no. FJ497742) isolated from East China Sea.
The subclade-IIIB consisted of one sequence (Stn3, July) and another sequence representing Synechococcus sp. strain A15-131 (Acc. no. JF306704) isolated previously from Atlantic Ocean. In case of subclade-IIIC, 5 sequences (Stn1-1 sequence from August; Stn3-3 sequences from September; Stn3- 1 sequence from November) were encountered along with published 16S rRNA sequence of Synechococcus sp. strain Syn GEF (Acc. no. HE601900) isolated from southwest Atlantic Ocean. Two sequences (Stn3-1 sequence from July; Stn1-1 sequence from August) and the 16S rRNA sequence of Synechococcus sp. strain UW92 (Acc. no. JQ421031), isolated from the Sargasso Sea (5 m depth) constituted the subclade-IIID. On the other hand, subclade IIIE consisted of 6 sequences (Stn1-1 sequence from July; Stn3-1 sequence from August; Stn3-1 sequence from September; Stn1- 2 sequences from October; Stn1- 1 sequence from November) as well as published sequence of Synechococcus sp. strain KORDI-63 (Acc. no. FJ497740) isolated previously from East China Sea. The subclade-IIIF represented the largest subclade and consisted of 25 sequences (Stn1-1 sequence and Stn3-2 sequences from July; Stn1-4 and Stn3-4 sequences from August; Stn3-5 sequences from September; Stn1-1 sequence from October; Stn1-2 and Stn3-3 sequences from November; Stn1-1 sequence and Stn3-2 sequences from December) along with published reference sequences representing different strains of Synechococcus sp. (Acc. no. KJ130543, FJ497717, JQ421035, and FJ903211). This subclade exhibited strong bootstrap support. Apart from these subclades, two novel subclades were also encountered as part of this clade (NSC3A and NSC3B). The novel subclade NSC3A consisted of 7 sequences from clone libraries (Stn3-5 sequences from July; Stn3-1 sequence from August; Stn3-1 sequence from December) while the other novel subclade NSC3B consisted of 10 sequences from clone libraries (Stn3- 4 sequences from October; Stn1-4 sequences and Stn3-1 sequence from November; Stn3-1 sequence from December).
In Clade IV, 16 sequences (Stn1-2 sequences and Stn3-3 sequences from July; Stn1-2 and Stn3-2 sequences from August; Stn3- 1 sequence from September; Stn1-1 and Stn3-4 sequences from October; Stn3-1 sequence from December) clustered with published 16S rRNA sequence of an uncultured cyanobacterium clone CNSG03 (Acc. no. JF929221) targeted previously from a mangrove environment in Brazil. The bootstrap support in some of the subclades of Clade IV was found to be strong (Figure 4B). The clade V consisted of four subclades namely VA, VB, VC, and VD with representation of 13 sequences (monsoon and post-monsoon seasons) generated from the clone libraries as well as published 16S rRNA sequences of heterocystous cyanobacteria such as Fischerella muscicola strain NDUPC001 (Acc. no. JX876898), Hapalosiphon welwitschii strain M5 (Acc. no. KC768846), 16S rRNA sequences of Trichocoleus sp. (Acc. no. JQ811780), Synechococcus sp. strain Salton Sea (Acc. no. DQ455751) and Chroococcidiopsis sp. strain CCMP3185 (Acc. no. JF810078) (Figure 4B).
Four novel marine planktonic cyanobacterial clades namely, SCB1 (Stn1-1 sequence from July; Stn1 and Stn3-1 sequence each from September), SCB2 (Stn1-1 sequence from July; Stn1 and Stn3- 1 sequence each from August; Stn1-1 sequence from November; Stn1-2 sequences from December), SCB3 (Stn1- 1 sequence from August; Stn3-1 sequence from November) and SCB4 (Stn1- 1 sequence from July; Stn3-1 sequence from September) were also encountered in the phylogenetic tree. For SCB2 and SCB4 clades the bootstrap support was strong (Figure 4B).
In addition to marine planktonic cyanobacteria-like sequences, 183 EPP-like 16S rRNA sequences were encountered and broadly represented 37 eukaryotic phytoplankton genera (above 95% identity at nucleotide level) belonging to seven major Classes of eukaryotic chromophytic phytoplankton (>90% identity at the nucleotide level) (Supplementary Table S4). Moreover, 73 bacterioplankton-like sequences were also encountered in clone libraries showing 82–99% identity with published bacterial 16S rRNA sequences of nucleotide databases (GenBank/ENA/DDBJ/RDP).
Moreover, at the OTU level, molecular phylogenetic tree was constructed consisting of 46 cyanobacterial OTUs encountered in this study (Supplementary Figure S3). In total five clades were encountered along with four novel clades namely SCB1, SCB2, SCB3 and SCB4. In Clade-II large number of OTUs clustered with Synechococcus sp. strain KORDI-78 OTU indicating their dominance in the study area. Similarly, a number of OTUs from clone libraries clustered with published sequences of Synechococcus sp. including strains CENA140 and LEGE 07230 as part of Clade IV. The OTUs Clade IV pattern is similar to the Clade I observed in Figure 4A of molecular phylogenetic tree. Overall there was similarity in patterns including the confirmation of unique OTUs that constituted the four novel clades in Supplementary Figure S2 and cladistic of Figure 4B.
Marine Planktonic Cyanobacterial Community Composition Based on the Analysis of NGS Data
Based on Illumina sequencing approach, 1777715 pair-end reads were generated from Stn1 and 2499148 pair- end reads were generated from Stn3 of SBOTS for monsoon month of July, 2014. Interestingly, in Stn1 only 1655 pair-end reads were marine planktonic cyanobacteria-like and for Stn3 only 694 pair- end reads were representative of marine planktonic cyanobacteria. In total, 58 marine planktonic cyanobacteria-like 16S rRNA sequences were detected and all of them showed 95–99% identity with published 16S rRNA sequences of several cultured strains of Synechococcus. Out of these, 37 sequences showed 95–99% identity with Synechococcus sp. strain KORDI-78 like sequences. The encountered marine planktonic cyanobacterial-like 16S rRNA sequences represented 11 OTUs. Moreover, rarefaction curve of NGS data representing Stn1 and Stn3 showed saturation indicating sequencing effort was optimum (Supplementary Figure S3).
Statistical Analyses
Diversity Calculation
The rarefaction curves did not reach asymptote for all four monsoon clone libraries indicating possibility of recovery of rarer members of marine cyanobacterial assemblages upon further sequencing (Figure 5). H′ value calculated for pooled monsoon and post- monsoon clone libraries representing Stn1 and Stn3 as well as total pooled clone libraries (considering only marine planktonic cyanobacterial sequences) are detailed in Table 2. Highest H′ value was observed in Monsoon Stn1 (2.53) while lowest H′ value was found in Post-monsoon Stn3 (1.77) (Table 2).
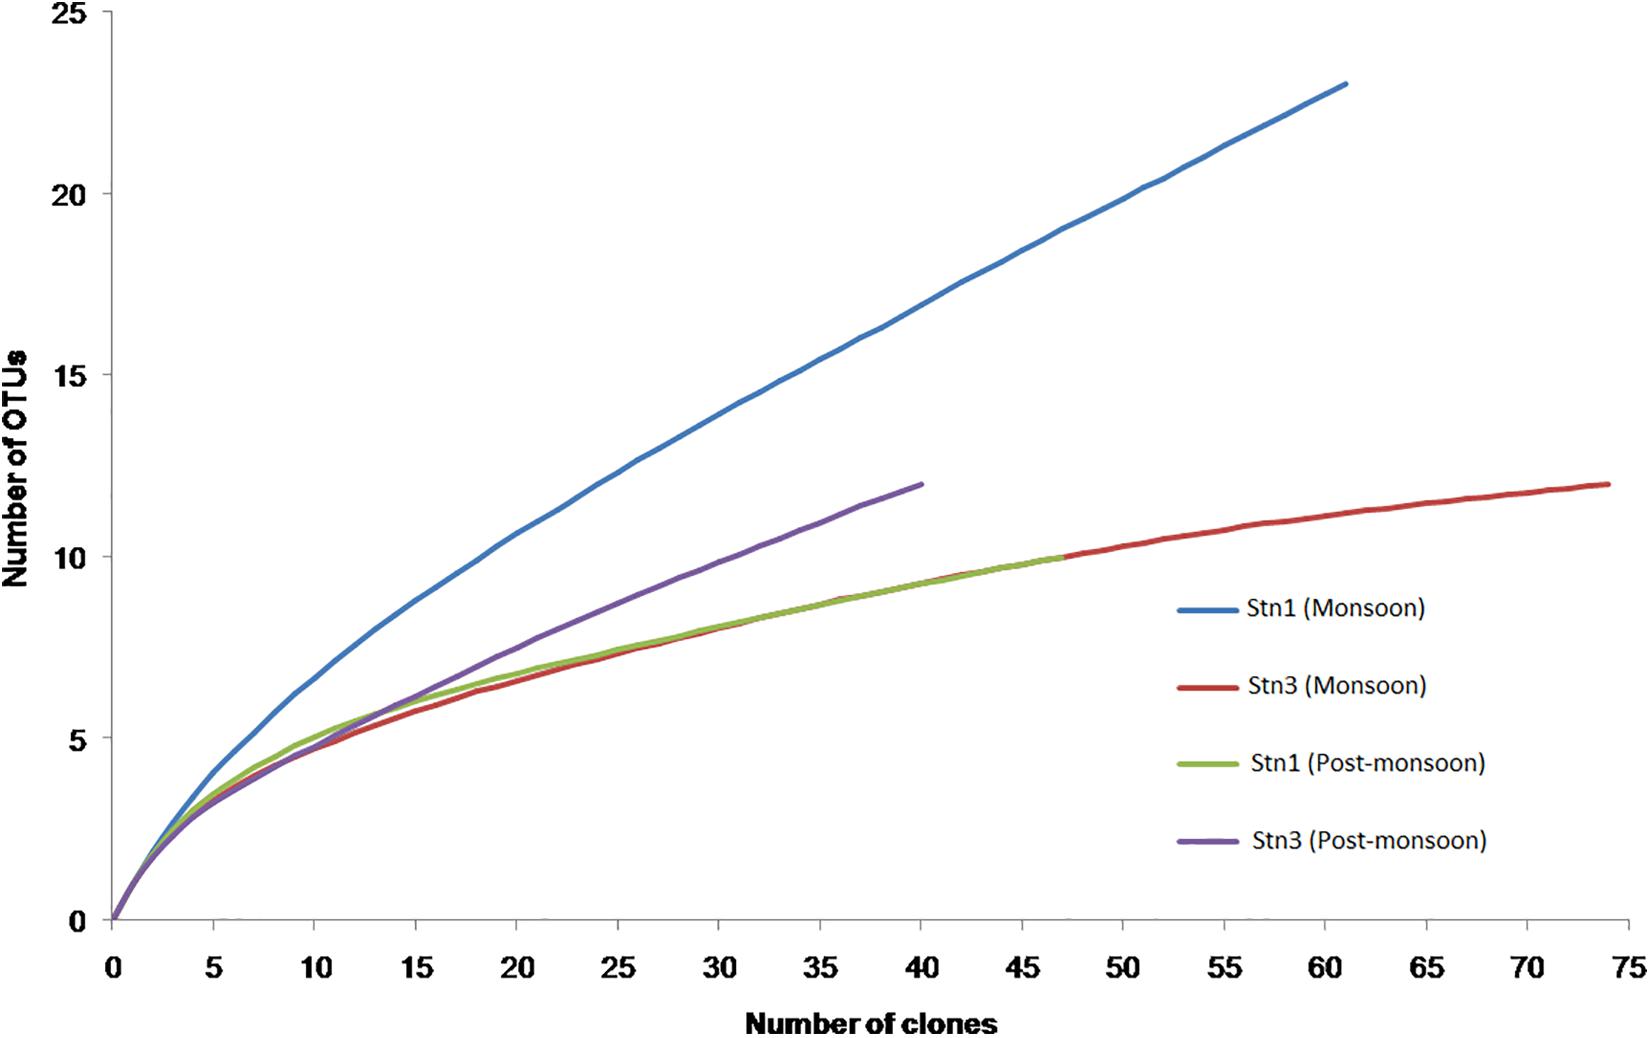
Figure 5. Rarefaction curves for pooled monsoon Snt1 (Stn1_Jul12, Stn1_Aug12, and Stn1_Sep12) and Stn3 (Stn3_Jul12, Stn3_Aug12, and Stn3_Sep12) and pooled post-monsoon Stn1 (Stn1_Oct12, Stn1_Nov12, and Stn1_Dec12) and Stn3 (Stn3_Oct12, Stn3_Nov12, and Stn3_Dec12) libraries.
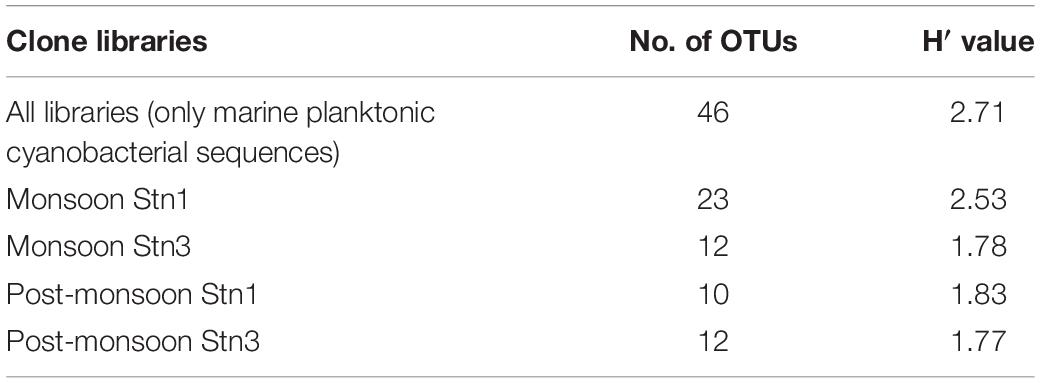
Table 2. Total number of OTUs encountered and H′ values for Stn1 and Stn3 16S rRNA clone libraries including pooled one.
Comparison of Clone Libraries Representing Marine Planktonic Cyanobacteria
The ANOSIM (R > 0.05, P < 0.001) and AMOVA (Fs > 1, P < 0.001) analyses for all marine planktonic cyanobacteria-like 16S rRNA sequences showed significant difference in terms of community structure across all seasonal libraries (M1, M3 for monsoon Stn1 and Stn3 and PM1, PM3 for post-monsoon Stn1 and Stn3). Pair-wise ANOSIM (in all cases R > 0.05 and P ≤ 0.001) and AMOVA (in all cases Fs > 1, P < 0.001) analyses also revealed that marine planktonic cyanobacterial assemblages varied significantly along seasonal and spatial scales, with the exception of an overlap observed between M3-PM3 and M1-PM3 (Supplementary Table S5). On the other hand, HOMOVA results showed that overall molecular diversity of marine planktonic cyanobacterial sequences showed significant variation (B = 29.95, P < 0.002). However, pair- wise HOMOVA results showed that genetic variation within the stations was more significant (B > 9.0, P < 0.06) compared to seasonal variation (M1-PM1 and M3-PM3, genetic variation insignificant) (Supplementary Table S6). The comparison by LIBSHUFF statistics revealed marine planktonic cyanobacterial community composition differed significantly between stations and seasons in the study area (p < 0.07) (Supplementary Table S7).
Principal Component Analysis (PCA)
The cumulative percentage variation of the first two principal components (PC) was 98.1% of the total variation (PC1 93.7% and PC2 4.4%) in case of PCA plot representing the Stn1. The PCA plot showed that dissolved silicate is the major environmental parameter that shaped total cyanobacterial OTUs for component 1, whereas transparency and salinity influenced the observed cyanobacterial OTUs compared to other environmental parameters in component 2 (Figure 6A). In case of Stn3, cumulative percentage variation of the first two principal coordinates (PC) was 97.7% of total variations (PC1 94.4% and PC2 3.3%) observed in case of PCA plot (Figure 6B). In case of PC1 loading, observed variation in cyanobacterial OTUs for Stn3 was also explained mainly by dissolved ortho-phosphate concentration whereas PC2 loading was due to transparency and salinity which controlled observed OTU variation.
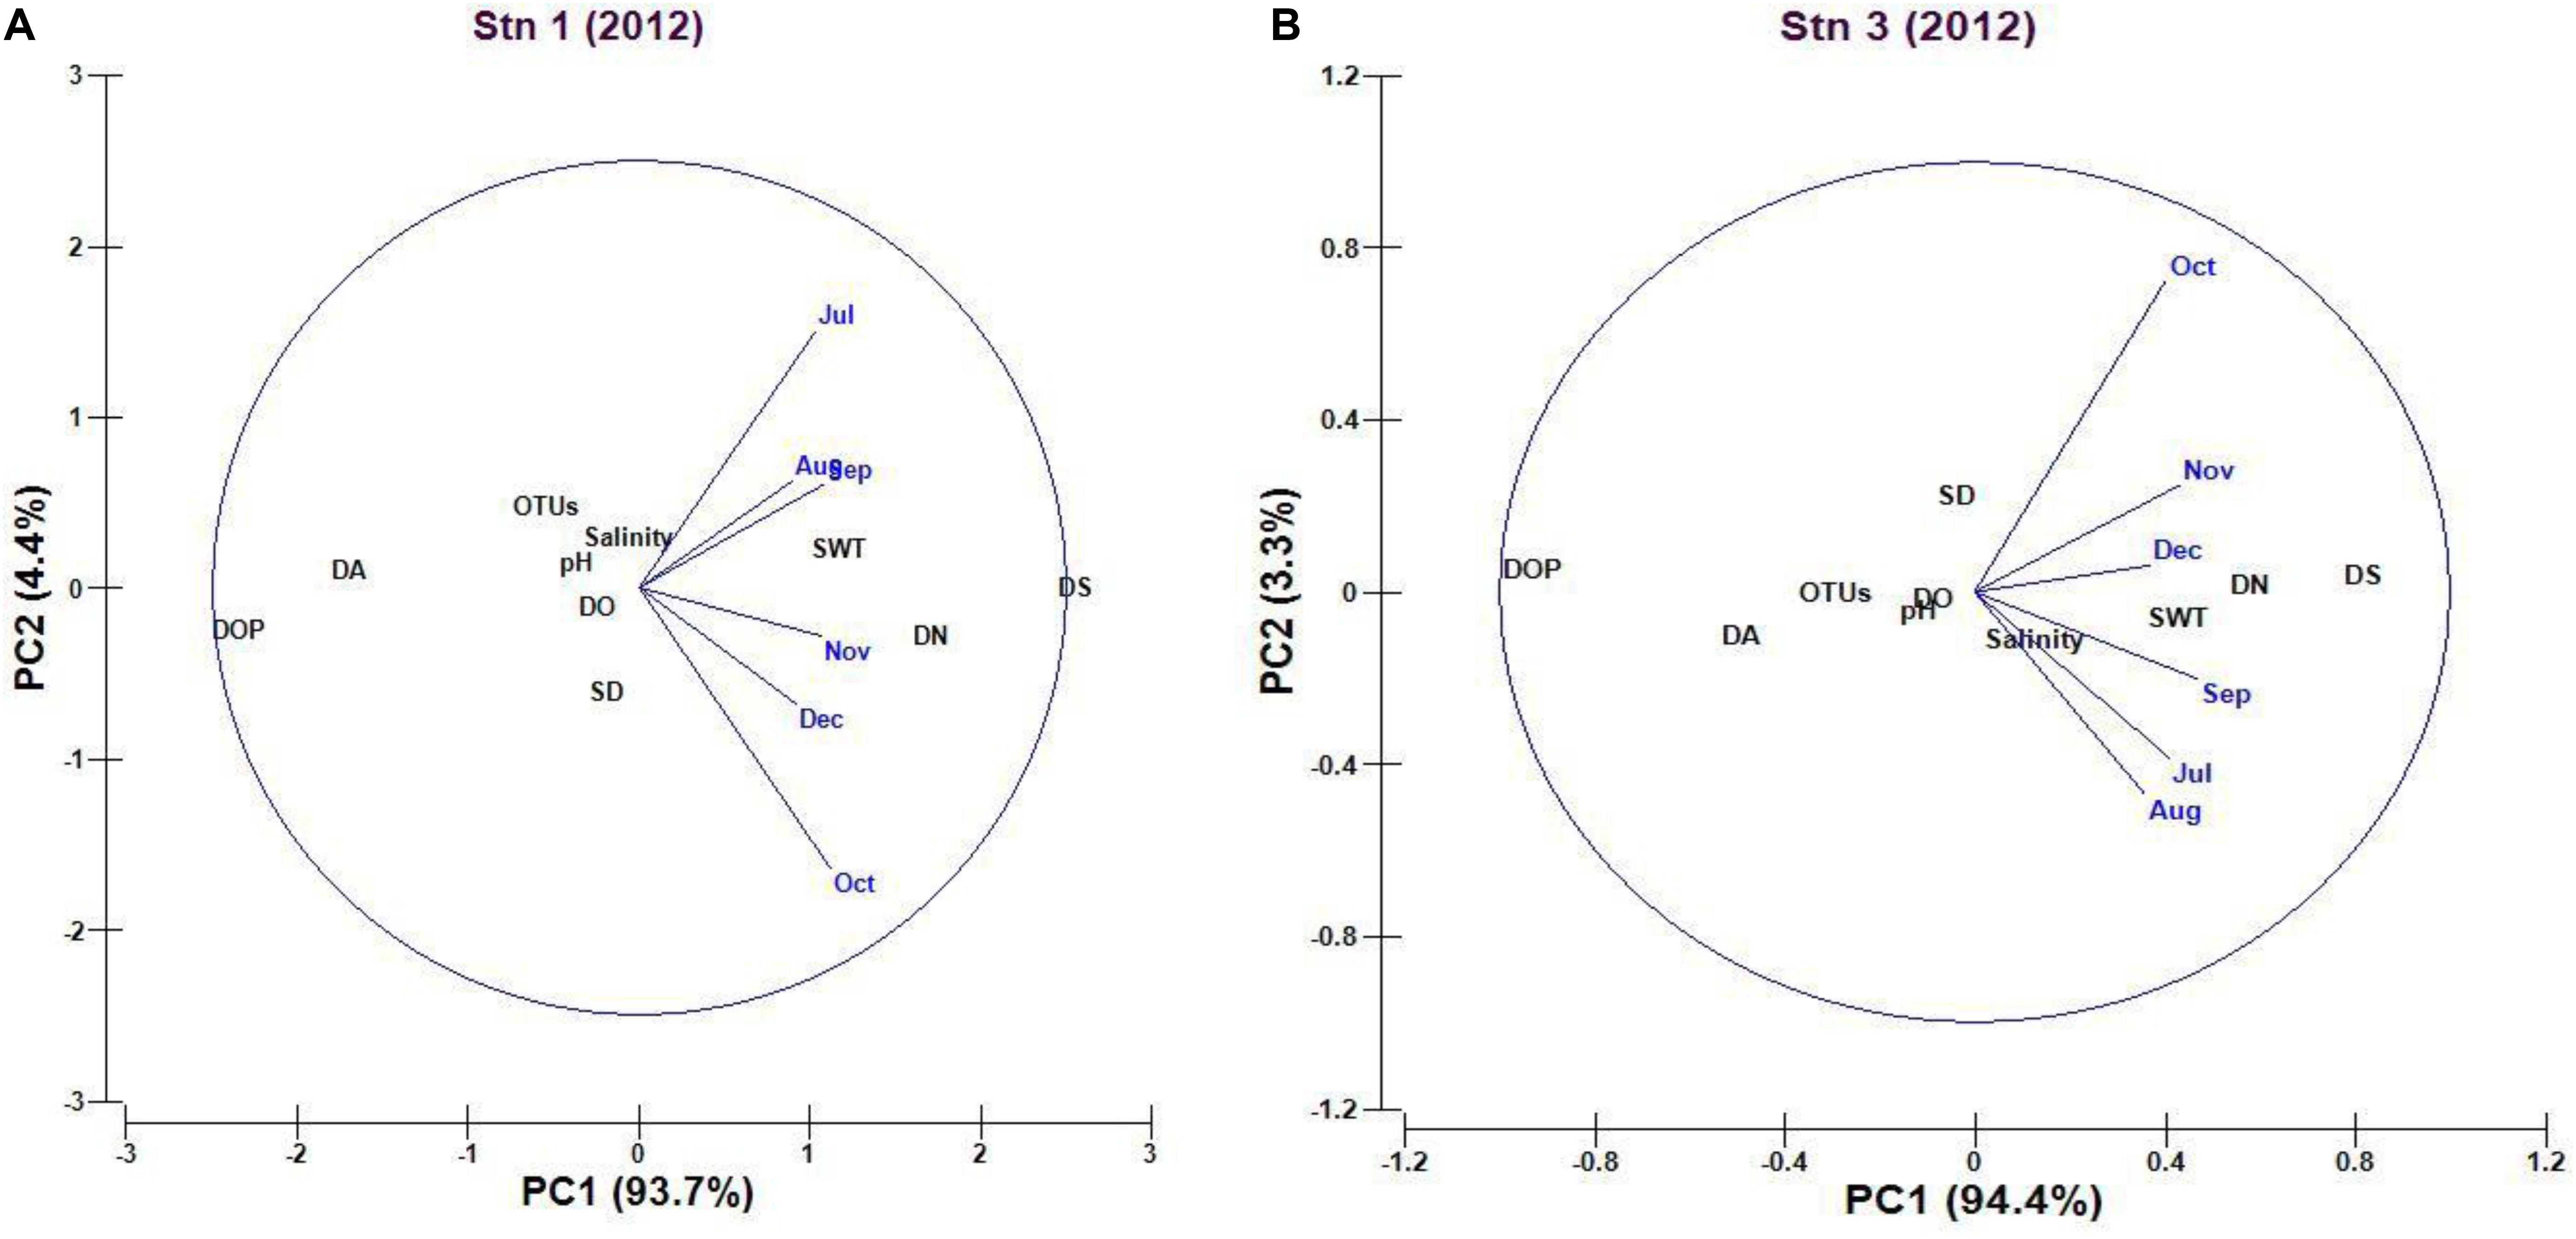
Figure 6. (A,B) Principal component analysis (PCA) plot explaining the potential influence of environmental variables on marine planktonic cyanobacterial assemblages (OTUs) in Stn1 and Stn3 (Abbreviations used here in plot- data: fourth root transformed; SWT, Surface Water Temperature; SD, Secchi Depth; DO, Dissolved Oxygen; DN, Dissolved Nitrate; DA, Dissolved Ammonium; DOP, Dissolved orthophosphate; DS, Dissolved Silicate; OTU, Operational Taxonomic Unit).
Discussion
In this study, sequences representing marine planktonic cyanobacterial communities encountered from the study area (SBOTS representing the Mooriganga estuary and Chemaguri creek) of Sundarbans exhibited spatial as well as temporal variability (seasonal scales). The Synechococcus sp. strain KORDI-78 like sequences constituted more than 40% of the total marine planktonic cyanobacterial sequences encountered both in monsoon and post-monsoon seasons from the study area. In both the stations, detection of this type of sequence was higher in monsoon (44 sequences combined) compared to post-monsoon (27 sequences combined). The dominance of KORDI-78 like populations in the study area is also indicative of their adaptability to fluctuating salinity regime seasonally, in particular during monsoon and post-monsoon seasons. There was decrease in salinity in monsoon season, especially August and September of 2012 which also coincided with heavy precipitation in the study area (SBOTS, Mooriganga estuary). During monsoon of 2012, the precipitation values ranged from 317.5 to 345.4 mm whereas in post-monsoon the range was from 34.2 to 67.3 mm (Supplementary Table S1). Precipitation was highest in July 2012 (345.4 mm) and lowest in December 2012 (34.2 mm). There was corresponding increase in secchi depth during monsoon (9–56 cm) of 2012 in and around Mooriganga estuary. In this period of fluctuating salinity regime and also overall increase in photic depth, KORDI-78 like sequences dominated the study area. Moreover in the eastern side of Sundarbans planktonic cyanobacterial communities during post-monsoon seasons are known to be overwhelmingly represented by Synechococcus sp. strain KORDI-78 sequences (Singh and Bhadury, 2018). The eastern part, like the other part of Sundarbans mangroves exhibit variability in salinity regime due to freshwater influx from major riverine systems, tidal inflow from Bay of Bengal and from heavy seasonal precipitation during monsoon (e.g., Mukhopadhyay et al., 2006; Chaudhuri et al., 2012; Bhattacharjee et al., 2013; Choudhury et al., 2015).
In the molecular phylogenetic tree, Clade I was represented by cyanobacterial sequences generated from this study as well as published sequences which are representatives of brackish water environment. The Clades II and III were represented by marine planktonic cyanobacterial sequences which clustered with cultured Synechococcus sp. strains characteristic of coastal and open ocean marine environments. Such salinity specific Synechococcus clades have been reported from other marine environments (Jing and Liu, 2012; Xia et al., 2015; Kim et al., 2018). It is already well known that many strains of Synechococcus including strain PCC 7002 can exhibit tolerance to salinity fluctuations (Ludwig and Bryant, 2012; Tan et al., 2018). The eurhayline Synechococcus sp. strain PCC 7002 can withstand large fluctuation in salinity and based on transcriptome study it has been shown this strain has genome level capability for long-term high salinity acclimation (Ludwig and Bryant, 2012). Genome level studies have revelaed that serine hydroxymethyltransferase (SMT), a key enzyme that catalyzes the conversion of serine to glycine and provides activated one-carbon units required for synthesis of different biomolecules can play critical role in salt tolerance in the genus Synechococcus (Waditee-Sirisattha et al., 2017). Yannarell et al. (2006) have shown that cyanobacterial communities in hypersaline microbial mats are tolerant to salinity fluctuations including in presence of freshwater influences. Interestingly, in Sundarbans the influence of salinity on shaping structure of microbial communities such as bacterioplankton is also well documented (Ghosh and Bhadury, 2018). Synechococcus populations encountered in and around Mooriganga estuary of SBOTS is represented by populations belonging to KORDI-78 strain as evident from cladistic (Figures 4A,B) and also based on OTU phylogeny (Supplementary Figure S2). This strain is cosmopolitan and previously reported between coastal and open water masses such as in the East China Sea (Choi and Noh, 2009) and thereby reflects its physiological and ecological adaptability across global oceans including Sundarbans mangroves.
In this study, Illumina sequencing was undertaken from the same stations of SBOTS (4276863 pair-end reads) in one of the monsoon months of 2014. From the dataset, only 58 cyanobacterial sequences could be identified, out of which 37 were Synechococcus sp. KORDI-78 like sequences (95–99% identity at the nucleotide level). Thus KORDI-78 like sequences was dominant both in clone library and Illumina datasets from the study area irrespective of the time and year of sampling. There are some studies undertaken to explore cyanobacterial communities in coastal areas using Illumina approach. For example, Affe et al. (2018) studied cyanobacterial assemblages in Brazil coastal water and found overwhelming dominance of Synechococcus populations as also found in our study. Similar trends have been also reported from other coastal ecosystems (Albrecht et al., 2017; Cardoso et al., 2017).
Some sequences encountered in clone libraries showed identity with published 16S rRNA sequences of other cultured Synechococcus strains such as A15-131, BS2, CENA140, GEF, LEGE 07320, MBIC10089, RCC61, Suigetsu CG2 and UW122. These sequences were detected only in monsoon season when salinity was much lower while sequences representing Synechococcus sp. strain Salton Sea was found only in post-monsoon season when salinity was relatively higher in the study area of Sundarbans. However, sequences showing identity with Synechococcus sp. strains A15-48A1, CSIRNIO1, KORDI-63, and KORDI-78 along with KORDI-78, UW92 and UBR were found in both seasons and also reconfirmed using molecular phylogeny based on sequences and OTUs (Figures 4A,B and Supplementary Figure S2). Seasonal variability of some of the encountered sequences was also observed in the study. Twenty seven sequences showed identity with Synechococcus sp. strain CSIRNIO1 and represented the second most abundant set of sequences with distribution both in monsoon and post- monsoon seasons in our study area representing both the stations. The strain CSIRNIO1 has been previously isolated from the Arabian Sea. Therefore the ubiquitous distribution of Chroococcoids as observed in our study has been well reported in published literature (e.g., Johnson and Sieburth, 1979; Mackey et al., 2015, 2017).
Our study has also revealed the presence of four major orders of planktonic cyanobacteria namely, Chroococcales, Pleurocapsales, Oscillatoriales and Stigonematales in Sundarbans. Some of these orders have been also reported from other mangrove ecosystems globally based on cultured approach (e.g., Branco et al., 1997; Nogueira and Ferreira-Correia, 2001; Kyaruzi et al., 2003; Guidi-Rontani et al., 2014). Incidentally, sequences representing the Orders Pleurocapsales, Oscillatoriales and Stigonematales were only found in Stn1 during the months of July and December of 2012. Throughout monsoon and post-monsoon seasons, Stn3 was represented by sequences belonging only to Chroococcales. Moreover, many of these representative sequences belonging to Chroococcidiopsis sp., Trichocoleus sp., Hapalosiphon sp., and Fischerella sp. were encountered in clone libraries but could not be detected in Illumina dataset (Supplementary Table S8). Moreover, bright field microscopy approach undertaken as part of this study confirmed the presence of above cyanobacterial taxa (Supplementary Figure S1) linking congruency between microscopy and molecular approaches. Presence of cyanobacterial genera like Trichocoleus sp. and Chroococcidiopsis sp. were confirmed for the first time in this mangrove using microscopy and also supported by molecular data. Many of these taxa can also form benthic cyanobacterial mats in marine environment (e.g., Brocke et al., 2018) and thus warrants further investigation as part of future studies with respect to their contribution to overall carbon export in Sundarbans.
While salinity appeared to play a major role in controlling marine planktonic cyanobacterial assemblages in Stn3, surface water temperature (SWT), Secchi depth, dissolved nitrate and ortho-phosphate concentrations were significant variables controlling observed cyanobacterial assemblage patterns in Stn1 (Supplementary Tables S9A,B). This was also supported by PCA analyses which showed that dissolved nutrients, transparency and salinity are important factors which ultimately shaped observed seasonal variability in marine planktonic cyanobacterial assemblages in SBOTS of Sundarbans during monsoon and post-monsoon. The dissolved nutrients showed seasonal variability as evident from trends of dissolved ammonium, nitrate, orthophosphate and silicate concentrations. Indeed, seasonal variability, in particular effect of precipitation on dissolved nutrients has been reported from Sundarbans (Mukhopadhyay et al., 2006) and also from other coastal ecosystems globally (Rabalais et al., 2009; Guinder et al., 2015). In monsoon season, dissolved nitrate and ammonium concentrations increased in both stations of SBOTS and this trend corresponded to an increase in cyanobacterial OTUs detected in the same stations. This highlights the importance of precipitation and resulting changes in environmental parameters such as concentration of dissolved nutrients influencing structure of cyanobacteria in Sundarbans. Similar observations have been also reported in other coastal ecosystems globally (e.g., Mackey et al., 2017; Kim et al., 2018). Marine cyanobacterial communities harbor diverse sets of genes linked to nitrogen metabolism including active transport systems (Maeda et al., 2015). For examples, genes such as glutamine synthetase, nitrate and nitrite reductases are known to be present in marine cyanobacterial communities (Moore et al., 2002; Maeda et al., 2015). These genes can play crucial role in uptake of different forms of available nitrogen by cyanobacterial cells from water. Recently, a new species of Synechococcus, S. moorigangaii has been isolated and identified from SBOTS (Sundarbans) and it possess genes linked to nitrogen metabolism while can grow in presence of different forms of nitrogen (Singh and Bhadury, 2019).
Picocyanobacteria such as Prochlorococcus and Synechococcus have been recognized as dominant genera of marine planktonic cyanobacterial assemblages in global oceans (Mazard et al., 2004; Zwirglmaier et al., 2008; Flombaum et al., 2013; Sudek et al., 2015; Kim et al., 2018). However, in this study, only Synechococcus-like assemblages were observed throughout the study period. The absence of Prochlorococcus like sequences was unusual with respect to Sundarbans. In the phylogenetic tree, three out of nine clades were Synechococcus -like also confirming the dominance of this genus in this mangrove ecosystem. Environmental factors such as low photic depth due to high suspended particular matter load in the water column (e.g., Choudhury et al., 2015; Ghosh and Bhadury, 2019) along with relatively higher nutrient concentrations may have resulted in the adaptation and dominance of Synechococcus populations in Sundarbans. Indeed, there are published literatures available which show that Synechococcus has the ability to adapt to environments with different light colors due to the presence of chromophore phycourobilin (Blot et al., 2011; Mahmoud et al., 2017). It has been reported that MpeU gene is important in determining the adaptation of Synechococcus populations to capture light in world’s oceans (Mahmoud et al., 2017). Thus, the dominance of populations representing KORDI-78 like sequences in our study area highlight the presence of phycourobilin and similar genetic pathways which helped them to adjust to prevailing low light conditions in Sundarbans.
One of the most important findings of this study has been the detection of four novel clades namely SCB1, SCB2, SCB3, and SCB4 using molecular phylogeny and also in OTU phylogeny. Although in low abundance, sequences representing these clades were found in both monsoon and post- monsoon seasons in Mooriganga estuary and adjacent Chemaguri creek of Sundarbans. The detection of these novel clades indicate that habitat variability such as salinity gradient can shape structure of marine planktonic cyanobacterial assemblages and ultimately may influence transfer of energy to trophic levels. Also, the findings of these “new clades” clearly highlights that number of undescribed marine planktonic cyanobacterial communities in mangroves such as Sundarbans is still potentially high. Therefore, integrative taxonomic approaches including establishment of clonal cultures can lead to description of new species of Synechococcus and other genera from the study area. One of such novel cyanobacterial species, Synechococcus moorigangaii has been recently isolated and described (Singh and Bhadury, 2019).
Although sequencing effort was not exhaustive as evident from rarefaction curves, nevertheless, 46 marine planktonic cyanobacteria like OTUs were identified as part of this study, out of which 17 OTUs were represented by 160 Synechococcus like sequences. The phylogeny of OTUs also revealed the same cladistic as observed with respect to 222 marine planktonic cyanobacterial 16S rRNA sequences (Supplementary Figure S2). In this study, the sequences from clone library datasets were generated using primers (CYA361F and CYA785R) designed specifically to target cyanobacterial assemblages. This in turn provided in depth information on specific members and aided toward accurate affiliation of generated sequences to known cyanobacterial taxa. The Illumina datasets were generated using universal eubacterial primers to understand the percentage of marine planktonic cyanobacteria within the overall prokaryotic assemblages of SBOTS. It further helped to identity similar members of cyanobacterial communities that were encountered using two different sets of primers. Both sets of primers amplified the V3–V4 region of 16S rRNA and provided similar trends of community composition.
The findings from the study undertaken in Sundarbans mangrove ecosystem provide an overview of the temporal and spatial patterns of marine planktonic cyanobacterial assemblages and role of environmental parameters in shaping such assemblages. The studied assemblages are overwhelmingly dominated by Synechococcus populations and their representation changed between monsoon and post-monsoon seasons clearly indicating the role of precipitation in shaping marine planktonic cyanobacterial communities of Sundarbans. Such temporal variation in Synechococcus assemblages has not been reported from any coastal environment, in particular from the North East Indian Ocean region. There is dominance of particular of Synechococcus sp. strain KORDI-78 like sequences and observed populations are important players of export of carbon in this mangrove ecosystem. The detection of novel clades once again reconfirms that unexplored marine planktonic cyanobacterial diversity is unusually high and mangroves are “hotspot” of cyanobacterial biodiversity. Overall this study provides much needed baseline information for marine planktonic cyanobacterial assemblages that could be crucial for improving the understanding of carbon cycling in coastal ecosystems such as mangroves.
Data Availability Statement
The datasets presented in this study can be found in online repositories. The names of the repository/repositories and accession number(s) can be found in the article/ Supplementary Material.
Author Contributions
PB conceived the idea. PB and TS undertook sampling activities. TS and PB undertook experiments. TS and PB processed the data. PB wrote the manuscript.
Funding
This work was partly supported by grants from Ministry of Earth Sciences, Government of India (MMME of MLRP through CMLRE), WWF-India and ARF from IISER Kolkata awarded to PB. TS was the recipient of Ph.D. UGC Fellowship. PB acknowledges Anwesha Ghosh for helpful discussions including on Illumina dataset.
Conflict of Interest
The authors declare that the research was conducted in the absence of any commercial or financial relationships that could be construed as a potential conflict of interest.
Supplementary Material
The Supplementary Material for this article can be found online at: https://www.frontiersin.org/articles/10.3389/fmars.2020.00222/full#supplementary-material
FIGURE S1 | Light microscopic images of marine planktonic cyanobacteria encountered from the study area: (A) Synechococcus sp., (B) Chroococcidiopsis sp., (C) Phormidium sp., (D) Trichocoleus sp., and (E) Trichodesmium sp.
FIGURE S2 | Maximum Likelihood (ML) phylogenetic tree using GTR model for 46 marine cyanobacterial OTUs encountered in this study and 23 reference sequences. Clade-I of OTU tree correspond to Clade III of previous ML tree (Figure 4), Clade-II, Clade-V, SCB1 SCB2, SCB3, and SCB4 same as Figure 4, Clade-III of OTU tree correspond to Clade IV of Figure 4 and Clade IV of OTU tree correspond to Clade I of Figure 4.
FIGURE S3 | Rarefaction curves for NGS dataset representing Snt1 and Stn3 showing sampling effort.
TABLE S1 | Monthly rainfall data for the months representing monsoon and post-monsoon seasons of 2012; rainfall data obtained from IMD database.
TABLE S2 | Highest and lowest identity score at the nucleotide level for planktonic cyanobacterial like clones observed from July–December 2012 16S rRNA clone libraries.
TABLE S3 | Number of sequences from clone libraries showing identity with published strains of Synechococcus sp. along with their seasonal distribution.
TABLE S4 | Distribution of EPP and bacteria-like 16S rRNA clone sequences according to respective taxonomic groups.
TABLE S5 | Results of The Analysis Of SIMilarity (ANOSIM) and Analysis of Molecular Variance (AMOVA) analyses of marine planktonic cyanobacterial 16S rRNA seasonal libraries for pairwise comparisons. M1, Monsoon Stn1; M3, Monsoon Stn3, PM1, Post-monsoon Stn1; PM3, Post-monsoon Stn3.
TABLE S6 | Homogeneity of Molecular Variance (HOMOVA) results for the seasonal libraries representing marine planktonic cyanobacterial sequences. M1, Monsoon Stn1; M3, Monsoon Stn3; PM1, Post-monsoon Stn1; PM3, Post-monsoon Stn3.
TABLE S7 | LIBSHUFF test for the seasonal libraries representing marine planktonic cyanobacterial sequences. M1, Monsoon Stn1; M3, Monsoon Stn3; PM1, Post-monsoon Stn1; PM3, Post-monsoon Stn3.
TABLE S8 | Comparison of encountered cyanobacterial taxa from the study area based on clone libraries and Illumina dataset.
TABLE S9 | (A) Correlation matrix between biotic and abiotic parameters recorded during the study period in Stn1. Highlighted correlation values is significant at this level (p ≤ 0.05); (B) Correlation matrix between biotic and abiotic parameters recorded during the study period in Stn3. Highlighted correlation values is significant at this level (p ≤ 0.05).
Footnotes
- ^ https://mausam.imd.gov.in/
- ^ https://blast.ncbi.nlm.nih.gov/Blast.cgi
- ^ https://www.ebi.ac.uk/Tools/msa/clustalo/
- ^ www.atgc-montpellier.fr/phyml/
References
Affe, H. M. J., Rigonato, J., Nunes, J. M. C., and Menezes, M. (2018). Metagenomic analysis of Cyanobacteria in an oligotrophic tropical estuary, South Atlantic. Front. Microbiol. 9:1393. doi: 10.3389/fmicb.2018.01393
Albrecht, M., Pröschold, T., and Schumann, R. (2017). Identification of cyanobacteria in a eutrophic coastal lagoon on the Southern Baltic coast. Front. Microbiol. 8:923. doi: 10.3389/fmicb.2017.00923
APHA (1998). Standard Methods for the Examination of Water and Wastewater, 20th Edn. Washington DC: American Public Health Association.
Bhattacharjee, D., Samanta, B., Danda, A. A., and Bhadury, P. (2013). Temporal succession of phytoplankton assemblages in a tidal creek system of the Sundarbans mangroves-an integrated approach. Int. J. Biodiv. 2013, 1–15. doi: 10.1155/2013/824543
Biswas, H., Dey, M., Ganguly, D., De Tk, Ghosh, S., and Jana, T. K. (2010). Comparative analysis of phytoplankton composition and abundance over a two-decade period at the land-ocean boundary of a tropical mangrove ecosystem. Est Coast 33, 384–394. doi: 10.1007/s12237-009-9193-5
Blot, N., Mella-Flores, D., Six, C., Corguillé, G. L., Boutte, C., Peyrat, A., et al. (2011). Light history influences the response of the marine cyanobacterium Synechococcus sp. WH7803 to oxidative stress. Plant Physiol. 156, 1934–1954. doi: 10.1104/pp.111.174714
Bolhuis, H., and Stal, L. J. (2011). Analysis of bacterial and archaeal diversity in coastal microbial mats using massive parallel 16S rRNA gene tag sequencing. ISME J. 5, 1701–1712. doi: 10.1038/ismej.2011.52
Boström, K. H., Simu, K., Hagström, A., and Riemann, L. (2004). Optimization of DNA extraction for quantitative marine bacterioplankton community analysis. Limnol. Oceanogr. Methods 2, 365–373. doi: 10.4319/lom.2004.2.365
Branco, L. H. Z., Célia Leite, S. ’A., Paiva Axevedo, de M.T., and Sormus, L. (1997). Cyanophyte flora from Cardoso Island mangroves, São Paulo State, Brazil. 2. Oscillatoriales. Algol. Stud. 84, 39–52. doi: 10.1127/algol_stud/84/1997/39
Brauer, V. S., Stomp, M., Bouvier, T., Fouilland, E., Leboulanger, C., Confurius-Guns, V., et al. (2015). Competition and facilitation between the marine nitrogen-fixing cyanobacterium Cyanothece and its associated bacterial community. Front. Microbiol. 5:795. doi: 10.3389/fmicb.2014.00795
Brocke, H. J., Piltz, B., Herz, N., Abed, R. M. M., Palinska, K. A., John, U., et al. (2018). Nitrogen fixation and diversity of benthic cyanobacterial mats on coral reefs in Curaçao. Coral Reefs 37, 861–874. doi: 10.1007/s00338-018-1713-y
Calbet, A., Sazhin, A. F., Nejstgaard, J. C., Berger, S. A., Tait, Z. S., Olmos, L., et al. (2014). Future climate scenarios for a coastal productive planktonic food web resulting in microplankton phenology changes and decreased trophic transfer efficiency. PLoS ONE 9:e94388. doi: 10.1371/journal.pone.0094388
Cardoso, D. C., Sandionigi, A., Cretoiu, M. S., Casiraghi, M., Stal, L., and Bolhuis, H. (2017). Comparison of the active and resident community of a coastal microbial mat. Sci. Rep. 7:2969.
Caroppo, C. (2015). Ecology and biodiversity of picoplanktonic cyanobacteria in coastal and brackish environments. Biodivers. Conserv. 24, 949–971. doi: 10.1007/s10531-015-0891-y
Chamberlain, S. D., Kaplan, K. A., Modanu, M., Sirianni, K. M., Annandale, S., and Hewson, I. (2014). Biogeography of planktonic and benthic cyanobacteria in coastal waters of the Big Island, Hawai’i. FEMS Microbiol. Ecol. 89, 80–88. doi: 10.1111/1574-6941.12337
Chaudhuri, K., Manna, S., Sarma, K. S., Naskar, P., Bhattacharyya, S., and Bhattacharyya, M. (2012). Physicochemical and biological factors controlling water column metabolism in Sundarbans estuary, India. Aquat. Biosys. 8, 1–16.
Choi, D. H., and Noh, J. H. (2009). Phylogenetic diversity of Synechococcus strains isolated from the East China Sea and the East Asia. FEMS Microbiol. Ecol. 69, 439–448. doi: 10.1111/j.1574-6941.2009.00729.x
Choi, D. H., Selph, K. E., and Noh, J. H. (2015). Niche partitioning of picocyanobacterial lineages in the oligotrophic northwestern Pacific Ocean. Algae 30, 223–232. doi: 10.4490/algae.2015.30.3.223
Choudhury, A. K., Das, M., Philip, P., and Bhadury, P. (2015). An assessment of the implications of seasonal precipitation and anthropogenic influences on a mangrove ecosystem using phytoplankton as proxies. Est Coast 38, 854–872. doi: 10.1007/s12237-014-9854-x
Darriba, D., Taboada, G. L., Doallo, R., and Posada, D. (2012). jModeltest 2: more models, new heuristics and parallel computing. Nat. Methods 9, 772. doi: 10.1038/nmeth.2109
Edgar, R. C. (2010). Search and clustering orders of magnitude faster than BLAST. Bioinformatics 26, 2460–2461. doi: 10.1093/bioinformatics/btq461
Edgar, R. C., Haas, B. J., Clemente, J. C., Quince, C., and Knight, R. (2011). UCHIME improves sensitivity and speed of chimera detection. Bioinformatics 27, 2194–2200. doi: 10.1093/bioinformatics/btr381
Engene, N., Gunasekara, S. P., Gerwick, W. H., and Paul, V. J. (2013). Phylogenetic inferences reveal a large extent of novel biodiversity in chemically rich tropical marine cyanobacteria. Appl. Environ. Microbiol. 79, 1882–1888. doi: 10.1128/aem.03793-12
Felsenstein, J. (1985). Confidence limits on phylogenies: an approach using the bootstrap. Evolution 39, 783–791. doi: 10.1111/j.1558-5646.1985.tb00420.x
Finch, M. S., Hydes, D. J., Clayson, C. H., Weigl, B., Dakin, J., and Gwilliam, P. (1998). A low power ultra violet spectrophotometer for measurement of nitrate in seawater: introduction, calibration and initial sea trials. Anal. Chim. Acta 377, 167–177. doi: 10.1016/s0003-2670(98)00616-3
Flombaum, P., Gallegos, J. L., Gordillo, R. A., Rincón, J., Zabala, L. L., Jiao, N., et al. (2013). Present and future global distributions of the marine cyanobacteria Prochlorococcus and Synechococcus. Proc. Natl. Acad. Sci. U.S.A. 110, 9824–9829.
Geib, U., Selig, U., Schumann, R., Steinbruch, R., Bastrop, R., Hagemann, M., et al. (2004). Investigations on cyanobacterial diversity in a shallow estuary (Southern Baltic Sea) including genes relevant to salinity resistance and iron starvation acclimation. Environ. Microbiol. 4, 377–387. doi: 10.1111/j.1462-2920.2004.00569.x
Geider, R. J., Delucia, E. H., Falkowski, P. G., Finzi, A. C., Grime, J. P., Todd, J. C., et al. (2001). Primary productivity of planet earth: biological determinants and physical constraints in terrestrial and aquatic habitats. Global Change Biol. 7, 849–882. doi: 10.1046/j.1365-2486.2001.00448.x
Ghosh, A., and Bhadury, P. (2018). Seasonal variability of bacterioplankton communities in a mangrove ecosystem. Environ. Sci. Pollut. Res. 25, 5722–5739. doi: 10.1007/s11356-017-0852-y
Ghosh, A., and Bhadury, P. (2019). Exploring biogeographic patterns of bacterioplankton communities across global estuaries. MicrobiologyOpen 10e:741.
Guidi-Rontani, C., Jean, M. R. N., Gonzalez-Rizzo, S., Bolte-Kluge, S., and Gros, O. (2014). Description of new filamentous toxic Cyanobacteria (Oscillatoriales) colonizing the sulfidic periphyton mat in marine mangroves. FEMS Microbiol. Lett. 359, 173–181. doi: 10.1111/1574-6968.12551
Guinder, V. A., López-Abbate, M. C., Berasategui, A. A., Negrin, V. L., Zapperi, G., Pratolongo, P. D., et al. (2015). Influence of the winter phytoplankton bloom on the settled material in a temperate shallow estuary. Oceanologia 57, 50–60. doi: 10.1016/j.oceano.2014.10.002
Guindon, S., Dufayard, J. F., Fefort, V., Anisimova, M., Hordijik, W., and Gascuel, O. (2010). New algorithims and methods to estimate maximum-likelihood phylogenies: assessing the performance of PhyML 3.0. Syst. Biol. 59, 307–321. doi: 10.1093/sysbio/syq010
Hall, T. A. (1999). BioEdit: a user-friendly biological sequence alignment editor and analysis programme for Windows 95/98/NT. Nucleic Acids Symp. 41, 95–98.
Hammer, Ø., Harper, D. A. T., and Ryan, P. D. (2001). Paleontological statistics software: package for education and data analysis. Palaeontol. Electronica 4, 9–17.
Hoffman, L. (1999). Marine cyanobacteria in tropical regions: diversity and ecology. Eur. J. Phycol. 34, 371–379. doi: 10.1017/s0967026299002310
Huang, S., Wilhelm, S. W., Harvey, H. R., Taylor, K., Jiao, N., and Chen, F. (2012). Novel lineages of Prochlorococcus and Synechococcus in the global oceans. ISME J. 6, 285–297. doi: 10.1038/ismej.2011.106
Huse, S. M., Mark Welch, D. B., Voorhis, A., Shipunova, A., Morrison, H. G., Eren, A. M., et al. (2014). VAMPS: a website for visualization and analysis of microbial population structures. BMC Bioinformatics 15:41. doi: 10.1186/1471-2105-15-41
Jing, H., and Liu, H. (2012). Phylogenetic composition of Prochlorococcus and Synechococcus in cold eddies of the South China Sea. Aquat. Microb. Ecol. 65, 207–219. doi: 10.3354/ame01546
Johnson, P. W., and Sieburth, J. M. (1979). Chroococcoid cyanobacteria in the sea: a ubiquitous and diverse phototrophic biomass. Limnol. Oceanogr. 24, 928–935. doi: 10.4319/lo.1979.24.5.0928
Kim, Y., Jeon, J., Kwak, M. S., Kim, G. H., Koh, I., and Rho, M. (2018). Photosynthetic functions of Synechococcus in the ocean microbiomes of diverse salinity and seasons. PLoS ONE 13:e0190266. doi: 10.1371/journal.pone.0190266
Kircher, M., and Kelso, J. (2010). High-throughput DNA sequencing- concepts and limitations. Methods Models Tech. 32, 524–536. doi: 10.1002/bies.200900181
Komárek, J. (2008). “Cyanoprokaryota. 1. Teil/1st part: Chroococcales,” in Süsswasserflora von Mitteleuropa, Vol. 19/1, eds B. Büdel, G. Gärdner, L. Krienitz, and M. Schagerl (München: Elsevier), 1–548.
Komárek, J., and Anagnostidis, K. (2005). “Cyanoprokaryota. 2. Teil/2nd part: Oscillatoriales,” in Süsswasserflora von Mitteleuropa, Vol. 19/2, eds B. Büdel, G. Gärdner, L. Krienitz, and M. Schagerl (München: Elsevier), 1–759.
Komárek, J., and Anagnostidis, K. (2007). Süßwasserflora von Mitteleuropa, Bd./: Cyanoprokaryota Teil/Part 2: Oscillatoriales, Vol. 19/2. Spektrum: Springer, 1–759.
Komárek, J., and Anagnostidis, K. (2013). “Cyanoprokaryota. 3. Teil/3rd part: Heterocytous Genera,” in Süsswasserflora von Mitteleuropa, Vol. 19/3, eds B. Büdel, G. Gärdner, L. Krienitz, and M. Schagerl (München: Elsevier), 1–1131.
Komárek, J., Kastrovosı, J., Marešl, J., and Johansen, J. R. (2014). Taxonomic classification of cyanoprokaryotes (cyanobacterial genera) 2014, using a polyphasic approach. Preslia 86, 295–335.
Kopp, R. E., Kirschvink, J. L., Hilburn, I. A., and Nash, C. Z. (2005). The Paleoproterozoic snowball Earth: a climate disaster triggered by the evolution of oxygenic photosynthesis. Proc. Natl. Acad. Sci. U.S.A. 102, 11131–11136. doi: 10.1073/pnas.0504878102
Kyaruzi, J. J., Kyewalyanga, M. S., and Muruke, M. H. S. (2003). Cyanobacteria composition and impact of seasonality on their in situ nitrogen fixation rate in a mangrove ecosystem adjacent to Zanzibar Town. WIO J. Mar. Sci. 2, 35–44.
Lalli, C. M., and Parsons, T. R. (1997). Biological Oceanography: An Introduction: The Open University Oceanography Series, 2nd Edn. Oxford: Butterworth-Heinemann.
Liddicoat, M. L., Tibbitts, S., and Butler, E. L. (1975). The determination of ammonia in seawater. Limnol. Oceanogr. 20, 131–132. doi: 10.4319/lo.1975.20.1.0131
Lomas, M. W., and Moran, S. B. (2011). Evidence for aggregation and export of cyanobacteria and nano-eukaryotes from the Sargasso Sea euphotic zone. Biogeosciences 8, 203–216. doi: 10.5194/bg-8-203-2011
Ludwig, M., and Bryant, D. A. (2012). Synechococcus sp. strain PCC 7002 transcriptome: acclimation to temperature, salinity, oxidative stress, and mixotrophic growth conditions. Front. Microbiol. 11:354. doi: 10.3389/fmicb.2012.00354
Mackey, K. R. M., Hunter-Cevera, K., Britten, G. L., Murphy, L. G., Sogin, M. L., and Huber, J. A. (2017). Seasonal succession and spatial patterns of Synechococcus microdiversity in a salt marsh estuary revealed through 16S rRNA gene oligotyping. Front. Microbiol. 8:1496. doi: 10.3389/fmicb.2017.01496
Mackey, K. R. M., Post, A., Mcllvin, M. R., Cutter, G. A., John, S. G., and Saito, M. A. (2015). Divergent responses of Atlantic coastal and oceanic Synechococcus to iron limitation. Proc. Natl. Acad. Sci. U.S.A. 112, 9944–9949. doi: 10.1073/pnas.1509448112
Maeda, S., Murakami, A., Ito, H., Tanaka, and Omata, T. (2015). Functional characterization of the FNT family nitrite transporter of marine picocyanobacteria. Life 5, 432–446. doi: 10.3390/life5010432
Magoè, T., and Salzberg, S. L. (2011). FLASH: fasta length adjustment of short reads to improve genome assemblies Bioinformatics 27, 2957–2963. doi: 10.1093/bioinformatics/btr507
Mahmoud, R. M., Sanfilippo, J. E., Nguyen, A. A., et al. (2017). Adaptation to blue light in marine Synechococcus requires MpeU, an enzyme with similarity to phycoerythrobilin lyase isomerases. Front. Microbiol. 8:243. doi: 10.3389/fmicb.2017.00243
Manna, S., Chaudhuri, K., Bhattacharyya, S., and Bhattacharyya, M. (2010). Dynamics of Sundarban estuarine ecosystem: eutrophication induced threat to mangroves. Saline Syst. 68, 1–16.
Mazard, S. L., Fuller, N. J., Orcutt, K. M., Bridle, O., and Scanlan, D. J. (2004). PCR analysis of the distribution of unicellular cyanobacterial diazotrophs in the Arabian Sea. Appl. Environ. Microbiol. 70, 7355–7364. doi: 10.1128/aem.70.12.7355-7364.2004
McLeod, E., Chmura, G. L., Bouillon, S., Salm, R., Björk, M., Duarte, C. M., et al. (2011). A blueprint for blue carbon: toward an improved understanding of the role of vegetated coastal habitats in sequestering CO2. Front. Ecol. Environ. 9:552–560. doi: 10.1890/110004
Moore, L. R., Post, A. F., Rocap, G., and Chisholm, S. W. (2002). Utilization of different nitrogen sources by the marine cyanobacteria Prochlorococcus and Synechococcus. Limnol. Oceanogr. 47, 989–996.
Mühling, M., Allen, J. W., Murrell, J. C., and Joint, I. (2008). Improved group-specific PCR primers for denaturing gradient gel electrophoresis analysis of the genetic diversity of complex microbial communities. ISME J. 2, 379–392. doi: 10.1038/ismej.2007.97
Mukhopadhyay, S. K., Biswas, H., De Tk, and Jana, T. K. (2006). Fluxes of nutrients from the tropical River Hooghly at the land–ocean boundary of Sundarbans, NE Coast of Bay of Bengal, India. J. Mar. Sys. 62, 9–21. doi: 10.1016/j.jmarsys.2006.03.004
Nedumaran, T., Rajasekar, K. T., and Perumal, P. (2008). Mangrove associated cyanobacteria at Pichavaram, Tamilnadu. Seaweed Res. Utiln. 30, 77–85.
Nogueira, N. M. C., and Ferreira-Correia, M. M. (2001). Cyanophyceae/cyanobacteria in red mangrove forest at mosquitos and coqueiros estuaries, São luís, state of Maranhão, Brazil. Braz. J. Biol. 61, 347–356. doi: 10.1590/s1519-69842001000300002
Nübel, U., Garcia-Pichel, F., and Muyzer, G. (1997). PCR primers to amplify 16S rRNA genes from cyanobacteria. Appl. Environ. Microbiol. 63, 3327–3333.
Palenik, B., Ren, Q., Dupont, C. L., Myers, G. S., Heidelberg, J. F., Badger, J. H., et al. (2006). Genome sequence of Synechococcus CC9311: insights into adaptation to a coastal environment. Proc. Natl. Acad. Sci. U.S.A. 103, 13555–13559. doi: 10.1073/pnas.0602963103
Palinska, K. A., and Surosz, W. (2014). Taxonomy of cyanobacteria: a contribution to consensus approach. Hydrobiology 740, 1–11. doi: 10.1007/s10750-014-1971-9
Pedrotti, M. L., Mousseau, L., Marro, S., Passafiume, O., Gossaert, M., and Labat, J.-P. (2017). Variability of ultraplankton composition and distribution in an oligotrophic coastal ecosystem of the NW Mediterranean Sea derived from a two-year survey at the single cell level. PLoS ONE 12:e0190121. doi: 10.1371/journal.pone.0190121
Rabalais, N. N., Turner, R. E., Díaz, R. J., and Justiæ, D. (2009). Global change and eutrophication of coastal waters. ICES J. Mar. Sci. 66, 1528–1537. doi: 10.1093/icesjms/fsp047
Richardson, T. L., and Jackson, G. A. (2007). Small phytoplankton and carbon export from the surface ocean. Science 315, 838–840. doi: 10.1126/science.1133471
Rigonato, J., Kent, A. D., Alvarenga, D. O., Andreote, F. D., Beirigo, R. M., Vidal-Torrado, P., et al. (2013). Divers of cyanobacterial diversity and community composition in mangrove soil in south-east Brazil. Environ. Microbiol. 15, 1103–1114. doi: 10.1111/j.1462-2920.2012.02830.x
Robertson, A. I., and Blaber, S. (1992). “Plankton, epibenthos and fish communities,” in Tropical mangrove ecosystems, eds A. I. Robertson and D. M. Alongi (Washington, D.C: American Geophysical Union), 173–224. doi: 10.1029/ce041p0173
Samanta, B., and Bhadury, P. (2014). Analysis of diversity of chromophytic phytoplankton in a mangrove ecosystem using rbcL gene sequencing. J. Phycol. 50, 328–340. doi: 10.1111/jpy.12163
Samanta, B., and Bhadury, P. (2018). Study of diatom assemblages in Sundarbans mangrove water based on light microscopy and rbcL gene sequencing. Heliyon 4:e00663. doi: 10.1016/j.heliyon.2018.e00663
Schloss, P. D., and Handelsman, J. (2005). Introducing DOTUR, a computer program for defining operational taxonomic units and estimating species richness. Appl. Environ. Microbiol. 71, 1501–1506. doi: 10.1128/aem.71.3.1501-1506.2005
Schloss, P. D., Westcott, S. L., Ryabin, T., Hall, J. R., Hartmann, M., Hollister, E. B., et al. (2009). Introducing MOTHUR: open-source, platform- independent, community supported software for describing and comparing microbial communities. Appl. Environ. Microbiol. 75, 7537–7541. doi: 10.1128/aem.01541-09
Sengupta, D., Bharath Raj, G. N., Ravichandran, M., Sree Lekha, J., and Papa, F. (2016). Near-surface salinity and stratification in the north Bay of Bengal from moored observations. Geophys. Res. Lett. 43, 4448–4456. doi: 10.1002/2016GL068339
Sievers, F., Wilm, A., Dineen, D., Karplus, K., Li, W., Lopez, R., et al. (2011). Fast, scalable generation of high-quality protein multiple sequence alignments using Clustal Omega. Mol. Syst. Biol. 7, 539–544.
Singh, T., and Bhadury, P. (2018). Distribution patterns of marine planktonic cyanobacterial assemblages in transitional marine habitats using 16S rRNA phylogeny. Phycol. Res. 66, 189–198. doi: 10.1111/pre.12224
Singh, T., and Bhadury, P. (2019). Description of a new marine planktonic cyanobacterial species Synechococcus moorigangaii (Order Chroococcales) from Sundarbans mangrove ecosystem. Phytotaxa 393, 263–267.
Sogin, M. L., Morrison, H. G., Huber, J. A., Mark Welch, D., Huse, S. M., Neal, P. R., et al. (2006). Microbial diversity in the deep sea and the unexplored “rare biosphere”. Proc. Natl. Acad. Sci. U.S.A. 103, 12115–12120.
Strickland, J. D. H., and Parsons, T. R. (1972). A Practical Handbook of Seawater Analysis, 2 Edn. Ottawa, ON: Fisheries Research Biodiversity Canada, 310.
Sudek, S., Everroad, R. C., Gehman, A. L. M., Smith, J. M., Poirier, C. L., Chavez, F. P., et al. (2015). Cyanobacterial distributions along a physico-chemical gradient in the Northeastern Pacific Ocean. Environ. Microbiol. 15, 3692–3707. doi: 10.1111/1462-2920.12742
Takahashi, S., Tomita, J., Nishioka, K., Hisada, T., and Nishijima, M. (2014). Development of a prokaryotic universal primer for simultaneous analysis of Bacteria and Archaea using next-generation sequencing. PLoS ONE 9:e105592. doi: 10.1371/journal.pone.0105592
Tan, X., Hou, S., Song, K., Georg, J., Klähn, S., Lu, X., et al. (2018). The primary transcriptome of the fast-growing cyanobacterium Synechococcus elongatus UTEX 2973. Biotechnol. Biofuels 11:218.
Turner, R. E., Qureshi, N., and Rabalais, N. N. (1998). Fluctuating silicate: nitrate ratios and coastal plankton food webs. Proc. Natl. Acad. Sci. U.S.A. 22, 13048–13051. doi: 10.1073/pnas.95.22.13048
Veldhuis, M. J. W., and Kraay, G. W. (2000). Application of flow cytometry in marine phytoplankton research: current applications and future perspectives. Sci. Mar. 64, 121–134. doi: 10.3989/scimar.2000.64n2121
Waditee-Sirisattha, R., Kageyama, H., Tanaka, Y., Fukaya, M., and Takabe, T. (2017). Overexpression of halophilic serine hydroxymethyltransferase in fresh water cyanobacterium Synechococcus elongatus PCC7942 results in increased enzyme activities of serine biosynthetic pathways and enhanced salinity tolerance. Arch. Microbiol. 199, 29–35. doi: 10.1007/s00203-016-1271-z
Wang, Q., Garrity, G. M., Tiedje, J. M., and Cole, J. R. (2007). Naïve Bayesian classifier for rapid assignment of rRNA sequences into the new bacterial taxonomy. Appl. Environ. Microbiol. 73, 5261–5267. doi: 10.1128/aem.00062-07
Xia, X., Vidyarathna, N. K., Palenik, B., Lee, P., and Liu, H. (2015). Comparison of the seasonal variations of Synechococcus assemblage structures in estuarine waters and coastal waters of Hong Kong. Appl. Environ. Microbiol. 81, 7644–7655. doi: 10.1128/aem.01895-15
Yannarell, A. C., Steppe, T. F., and Paerl, H. W. (2006). Genetic variance in the composition of two functional groups (diazotrophs and cyanobacteria) from a hypersaline microbial mat. Appl. Environ. Microbiol. 72, 1207–1217. doi: 10.1128/aem.72.2.1207-1217.2006
Keywords: 16S rRNA, mangroves, assemblages, marine planktonic cyanobacteria, Synechococcus
Citation: Bhadury P and Singh T (2020) Analysis of Marine Planktonic Cyanobacterial Assemblages From Mooriganga Estuary, Indian Sundarbans Using Molecular Approaches. Front. Mar. Sci. 7:222. doi: 10.3389/fmars.2020.00222
Received: 07 August 2018; Accepted: 23 March 2020;
Published: 26 May 2020.
Edited by:
Katrin Linse, British Antarctic Survey (BAS), United KingdomReviewed by:
Néstor E. Ardila, EcoMar s.a.s, ColombiaRamanathan Alagappan, Jawaharlal Nehru University, India
Copyright © 2020 Bhadury and Singh. This is an open-access article distributed under the terms of the Creative Commons Attribution License (CC BY). The use, distribution or reproduction in other forums is permitted, provided the original author(s) and the copyright owner(s) are credited and that the original publication in this journal is cited, in accordance with accepted academic practice. No use, distribution or reproduction is permitted which does not comply with these terms.
*Correspondence: Punyasloke Bhadury, cGJoYWR1cnlAaWlzZXJrb2wuYWMuaW4=; cGJoYWR1cnlAZ21haWwuY29t