 Nicholas Baetge
 Jason R. Graff
 Michael J. Behrenfeld
 Craig A. Carlson
- 1Department of Ecology, Evolution and Marine Biology, University of California, Santa Barbara, Santa Barbara, CA, United States
- 2Department of Botany and Plant Pathology, Oregon State University, Corvallis, OR, United States
The annual North Atlantic phytoplankton bloom represents a hot spot of biological activity during which a significant fraction of net community production (NCP) can be partitioned into dissolved organic carbon (DOC). The fraction of seasonal NCP that is not respired by the heterotrophic bacterial community and accumulates as seasonal surplus DOC (ΔDOC) in the surface layer represents DOC export potential to the upper mesopelagic zone, and in the North Atlantic this is facilitated by winter convective mixing that can extend to depths > 400 m. However, estimates of ΔDOC and vertical DOC export for the western North Atlantic remain ill-constrained and the influence of phytoplankton community structure on the partitioning of seasonal NCP as ΔDOC is unresolved. Here, we couple hydrographic properties from autonomous in situ sensors (ARGO floats) with biogeochemical data from two meridional transects in the late spring (∼44–56°N along ∼−41°W) and early autumn (∼42–53°N along ∼−41°W) as part of the North Atlantic Aerosols and Marine Ecosystems Study (NAAMES). We estimate that 4–35% of seasonal NCP is partitioned as ΔDOC and that annual vertical DOC export ranges between 0.34 and 1.15 mol C m–2 in the temperate and subpolar western North Atlantic. Two lines of evidence reveal that non-siliceous picophytoplankton, like Prochlorococcus, are indicator species of the conditions that control the accumulation of DOC and the partitioning of NCP as ΔDOC.
Introduction
Phytoplankton blooms spanning the subtropical to the polar latitudes of the North Atlantic occur annually and are central to biogeochemical cycling in the global ocean (Duursma, 1963; Lochte et al., 1993; Sieracki et al., 1993; Carlson et al., 1998; Falkowski, 1998; Behrenfeld, 2010). These blooms are net autotrophic events initiated by an imbalance between phytoplankton division and loss rates, created by favorable abiotic conditions for incident sunlight and subsurface attenuation, surface mixing layer dynamics, nutrients, and temperature (Behrenfeld and Boss, 2018).
When photoautotrophy exceeds net heterotrophic processes within the surface layer, the seasonal net community production (NCP, moles C per unit volume or area per time) can be estimated from the biological production of oxygen (Plant et al., 2016) or the net drawdown of total carbon dioxide or nitrate as it is fixed to organic matter (Codispoti et al., 1986; Hansell et al., 1993; Hansell and Carlson, 1998). Organic matter resulting from NCP has three main fates: (1) accumulation as particulate organic carbon (POC) in the surface layer followed by export via the passive sinking flux (McCave, 1975), (2) export from the surface layer via vertical migrating zooplankton (Steinberg et al., 2000), and (3) accumulation as suspended organic matter [i.e., dissolved organic carbon (DOC) and suspended POC (POCs)] in the surface layer followed by export via physical transport (Carlson et al., 1994; Hansell and Carlson, 1998; Sweeney et al., 2000; Dall’Olmo et al., 2016). The present study examines the third fate, focusing on the accumulation and subsequent vertical export of DOC. We refer to the seasonal accumulation rate of surplus surface layer DOC as ΔDOC (vertically integrated moles C m–2 time period–1 or moles C L–1 time period–1).
ΔDOC has been reported to represent a significant fraction of NCP in a variety of environments and ecological states (Carlson et al., 1998; Hansell and Carlson, 1998; Romera-Castillo et al., 2016; Bif and Hansell, 2019). For example, Hansell and Carlson (1998) reported that as much as 59–70% of NCP was partitioned as ΔDOC shortly following a spring bloom in the Sargasso Sea. More recently, Romera-Castillo et al. (2016) analyzed data from seven US Repeat Hydrography cruises (currently called GO-SHIP) and three Spanish cruises (OVIDE, Good Hope, CAIBOX) and found that ΔDOC:NCP largely ranged between 0.10 and 0.40 throughout the Atlantic basin, with an average ΔDOC:NCP of 0.17 for the basin. The ratio was then applied to climatological nitrate data to model ΔDOC throughout the region. While extensive hydrographic data were used in this analysis, there was a paucity of data from the temperate and subpolar western North Atlantic. Furthermore, the data used did not permit the authors to diagnose seasonal variability in ΔDOC:NCP. Seasonal measures of NCP and ΔDOC for the western North Atlantic may help to constrain estimates of NCP partitioning and consequently, outputs from models seeking to predict changes in ΔDOC. Constraining estimates of ΔDOC is necessary to improve evaluations of vertical DOC export in the western North Atlantic.
A variety of food web processes can lead to the production of DOC, including passive and active dissolved organic matter (DOM) release by phytoplankton, grazer-mediated release and excretion, viral cell lysis, and particle solubilization (see review by Carlson and Hansell, 2015). Controlling factors that result in ΔDOC in the surface layer remain unknown but have been linked to nutrient limitation (Cotner et al., 1997; Thingstad et al., 1997), the direct production of recalcitrant compounds by phytoplankton (Aluwihare et al., 1997; Wear et al., 2015b), the alteration of labile DOM by heterotrophic microbes or phototransformation to recalcitrant compounds (Kieber et al., 1997; Benner and Biddanda, 1998; Ogawa, 2001; Gruber et al., 2006; Jiao et al., 2010), and the composition and metabolic potential of the extant microbial community (Carlson et al., 2004; Morris et al., 2005; DeLong, 2006).
In addition, because different phytoplankton species release different quantities and qualities of DOM, the identity of the dominant phytoplankton in a community may regulate the magnitude of ΔDOC (Conan et al., 2007; Wear et al., 2015b). For example, the dominance of large eukaryotic phytoplankton has been linked to the production of bioavailable DOC that can lead to limited variability in the bulk DOC pool (Carlson et al., 1998; Wear et al., 2015a, b), while the dominance of picophytoplankton in tropical and subtropical systems has been linked to elevated ΔDOC (Hansell and Carlson, 1998; Hansell et al., 2009). Blooms of large eukaryotic phytoplankton relative to picophytoplankton may reflect conditions that favor the production of more bioavailable DOC that has a low potential to accumulate as ΔDOC (Carlson et al., 1998). If distinct phytoplankton species or group can be linked to ΔDOC or ΔDOC:NCP, they may be useful indicators for the conditions that control DOC production and accumulation. Absolute cell abundance data or sequencing data can be used to reveal phytoplankton community structure at the time of sampling; inorganic nutrient drawdown ratios provide information that integrates a previous community’s activity and how that community affects nutrient pools. In the Ross Sea, Sweeney et al. (2000) used ΔSiO4:ΔNO3 ratios to distinguish phytoplankton populations dominated by diatoms from those dominated by non-siliceous species, with greater ratios indicative of a greater relative importance of diatoms. These metrics of phytoplankton community structure can all be used to explore whether distinct species or groups can be used as indicators for the conditions controlling ΔDOC and ΔDOC:NCP. In the North Atlantic where massive spring blooms have been associated with diatoms and the depletion of silicate relative to nitrate (Sieracki et al., 1993), one might expect diatoms to disproportionately contribute to NCP but also produce DOC with high bioavailability, leading to low ΔDOC. Understanding the role of diatoms in the partitioning of NCP may be important in elucidating the mechanisms and conditions that regulate ΔDOC and ΔDOC:NCP.
Regardless of the controls on DOC production and accumulation, ΔDOC in the surface layer has been observed throughout the global ocean (Duursma, 1963; Eberlein et al., 1985; Carlson et al., 1994; Bøsrheim and Myklestad, 1997; Hansell and Carlson, 1998; Halewood et al., 2012). ΔDOC resisting or escaping rapid microbial degradation is available for horizontal or vertical export via physical processes (Hansell et al., 1997). Seasonal deep convective overturn mixes ΔDOC into the ocean’s interior, where it can support net heterotrophic processes (Carlson et al., 1994, 2004). It is estimated that approximately 0.081 Pg C of DOM are exported out of the upper 100 m of the water column annually in the North Atlantic basin, making this region a quantitatively important location for vertical DOC export (Carlson et al., 2010). However, refining estimates of local ΔDOC and vertical DOC export in the western North Atlantic remains difficult because of limited DOC observations under deeply mixed conditions and the necessary assumptions to approximate those conditions (Hansell and Carlson, 1998; Romera-Castillo et al., 2016).
Here we present a seasonal composite of local ΔDOC and NCP based on shipboard and ARGO float data collected in the temperate and subpolar western North Atlantic as a part of the ARGO and NASA North Atlantic Aerosols and Marine Ecosystems Study (NAAMES) programs. The repeated meridional ship transects and the extensive spatiotemporal coverage of the deployed floats provide a unique opportunity to examine DOC dynamics in the context of the annual plankton cycle. We (1) consider the relationship between seasonal NCP and the partitioning of the resulting organic matter into the dissolved pool in the context of both space and time, (2) estimate vertical DOC export, and (3) examine the ΔDOC:NCP as it relates to variability in environmental conditions and phytoplankton community composition.
Materials and Methods
Study Region
The NAAMES program, detailed in Behrenfeld et al. (2019), was designed to resolve the annual dynamics and drivers of the North Atlantic phytoplankton bloom and its subsequent impact on the atmosphere. It was comprised of four field campaigns from 2015 to 2018, each involving coordinated ship, aircraft, remote sensing, and autonomous in situ sensing (ARGO and Biogeochemical-ARGO floats) measurements during transects between 39°N and 56°N latitude and −38 to −47°W longitude (Figure 1). Here, we focus on two NAAMES campaigns at extreme ends of the seasonal cycle, NAAMES 3 in September 2017 (early autumn) and NAAMES 4 in April 2018 (early spring), respectively. The stations occupied during these campaigns were classified into subregions defined by Della Penna and Gaube (2019). The present study represents an ancillary companion project seeking to resolve temporal and spatial DOC dynamics in the western North Atlantic Ocean.
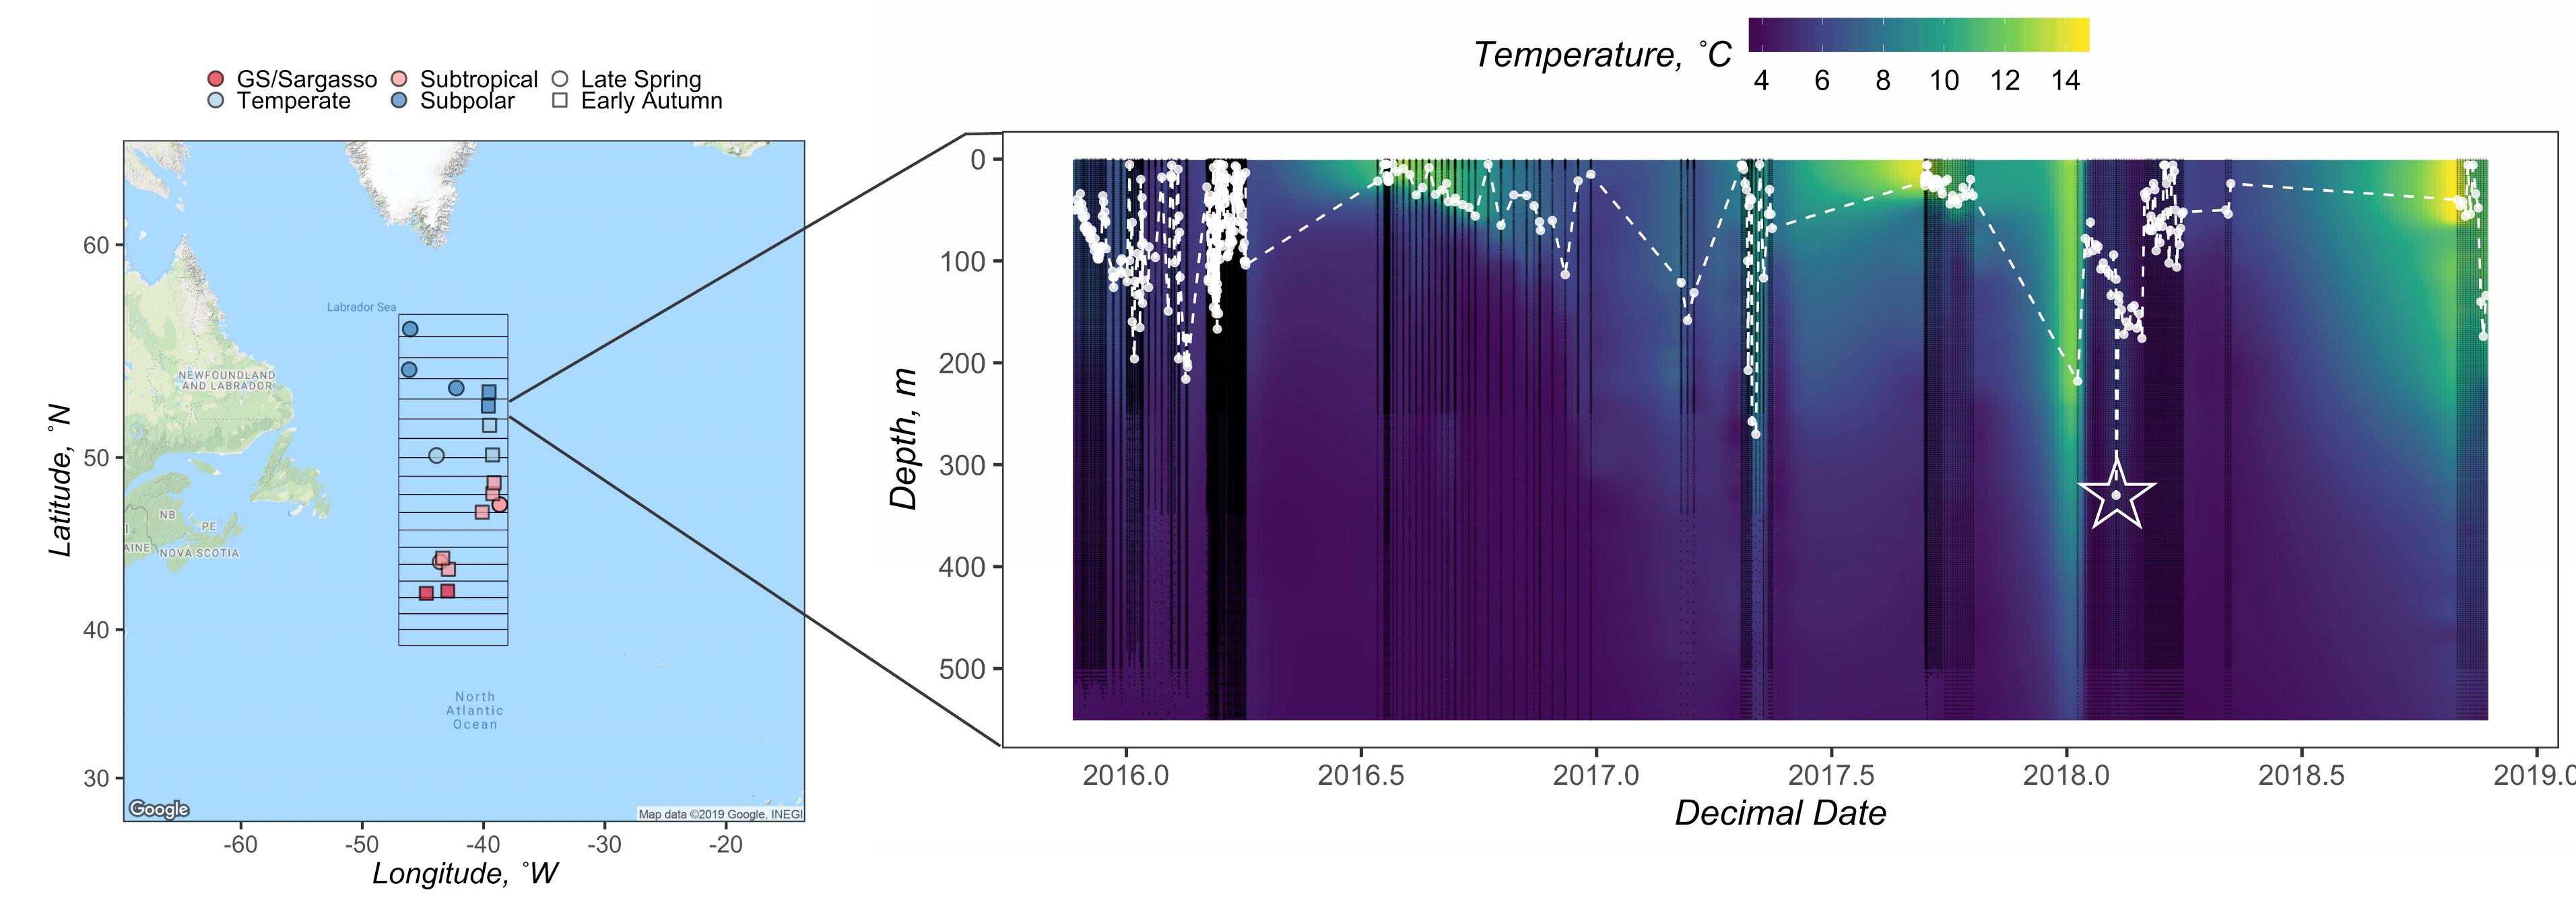
Figure 1. Geographical map of the NAAMES study region (left), with station locations for the late spring and early autumn cruise designated as circles and squares, respectively. Stations are colored by subregional classification based on Della Penna and Gaube (2019). Gridded box displays the bounds of the in 1° latitudinal bins from which float data were available. Displayed on the right is an example composite of float data from the 52° latitudinal bin. Black points denote when water column data were collected by an ARGO float. The white points and dashed line mark the depth of the mixed layer (n = 348). Zmax MLD for this latitudinal bin was recorded as 330 m and is denoted by the star. Interpolated temperature data from the corresponding float profiles are shown in the background.
Environmental Data
NAAMES field campaign data are available through NASA’s Ocean Biology Distributed Active Archive Center (OB.DAAC). Conductivity-temperature-depth (CTD), discrete inorganic nutrient, and flow cytometry data used here were retrieved from the SeaWiFS Bio-optical Archive and Storage System (SeaBASS1). All CTD casts and seawater samples were collected on the R/V Atlantis using a Sea-Bird Scientific SBE-911+ CTD outfitted with a Wet Labs ECO-AFL fluorometer and 24 10-L Niskin bottles in a typical rosette mount. Chlorophyll maxima (CMs) were estimated for each profile using downcast data from the CTD fluorometer.
Inorganic nutrient concentrations (μmol N or Si L–1) were determined for 15 depths over the surface 1500 m at each station (nominally 5, 10, 25, 50, 75, 100, 150, 200, 300, 400, 500, 750, 1000, 1250, and 1500 m). Samples were gravity filtered directly from the Niskin bottles through inline 47 mm PC filtration cartridges loaded with 0.8 μm polycarbonate filters into sterile 50 mL conical centrifuge tubes. Resultant samples were then stored at −20°C for later analysis using the Lachat QuickChem QC8500 automated ion analyzer at the University of Rhode Island Graduate School of Oceanography Marine Science Research Facility (GSO-MSRF). Precision for nitrite + nitrate analyses are ∼0.3 μmol L–1, while precision for silicate analysis is ∼0.1 μmol L–1.
DOC concentrations (μmol C L–1) were determined from replicate samples at the same 15 depths where nutrient samples were collected. Samples were gravity filtered directly from the Niskin bottles into pre-combusted (4 h at 450°C) 40 mL EPA borosilicate glass vials. Filtration was performed using 47 mm PC filtration cartridges loaded with pre-combusted (4 h at 450°C) 0.7 μm GF/F filters. Filters were flushed with ∼100 mL of sample water before collection. Vials were rinsed three times with sample water before being filled. All DOC samples were acidified to a pH of < 3 by adding 50 μL DOC-free 4 N HCl to 35 mL of sample immediately after collection. Samples were stored at ∼14°C in an environmental chamber free of volatile organics until analysis at the University of California, Santa Barbara.
DOC concentrations were measured in batches on Shimadzu TOC-V or TOC-L analyzers using the high-temperature combustion technique (Carlson et al., 2010). Each batch analysis was calibrated using glucose solutions of 25–100 μmol C L–1 in low carbon blank water. Data quality was assessed by measuring surface and deep seawater references (sourced from the Santa Barbara Channel) after every six to eight samples as described in Carlson et al. (2010). Precision for DOC analysis is ∼1 μmol L–1 or a CV of ∼2%. Local seawater reference waters were calibrated with DOC consensus reference material provided by Hansell (2005). All DOC data for the NAAMES project are available in the SeaBASS (see footnote 1).
Phytoplankton concentrations (cells L–1) were determined for six depths over the surface 100 m at each station (nominally 5, 10, 25, 50, 75, and 100 m) within hours of collection. Samples were analyzed using a BD Influx Flow Cytometer to estimate phytoplankton concentrations for four major groups [Prochlorococcus, Synechococcus, picoeukaryotes (<3 μm), and nanoeukaryotes (3 to ∼10 μm) (see methods in Graff and Behrenfeld, 2018)]. The phytoplankton abundance maximum (PAM) for each profile was defined as the depth where the sum concentration of the four major groups was greatest.
Concentrations for nutrients, DOC, and phytoplankton measured at 5 m were assumed to be equivalent to surface concentrations (0 m) as the mixed layer depth was greater than 5 m for all stations and all cruises (Figure 2). All profiles were averaged for each station containing multiple casts (Supplementary Figures S1–S3, S7).
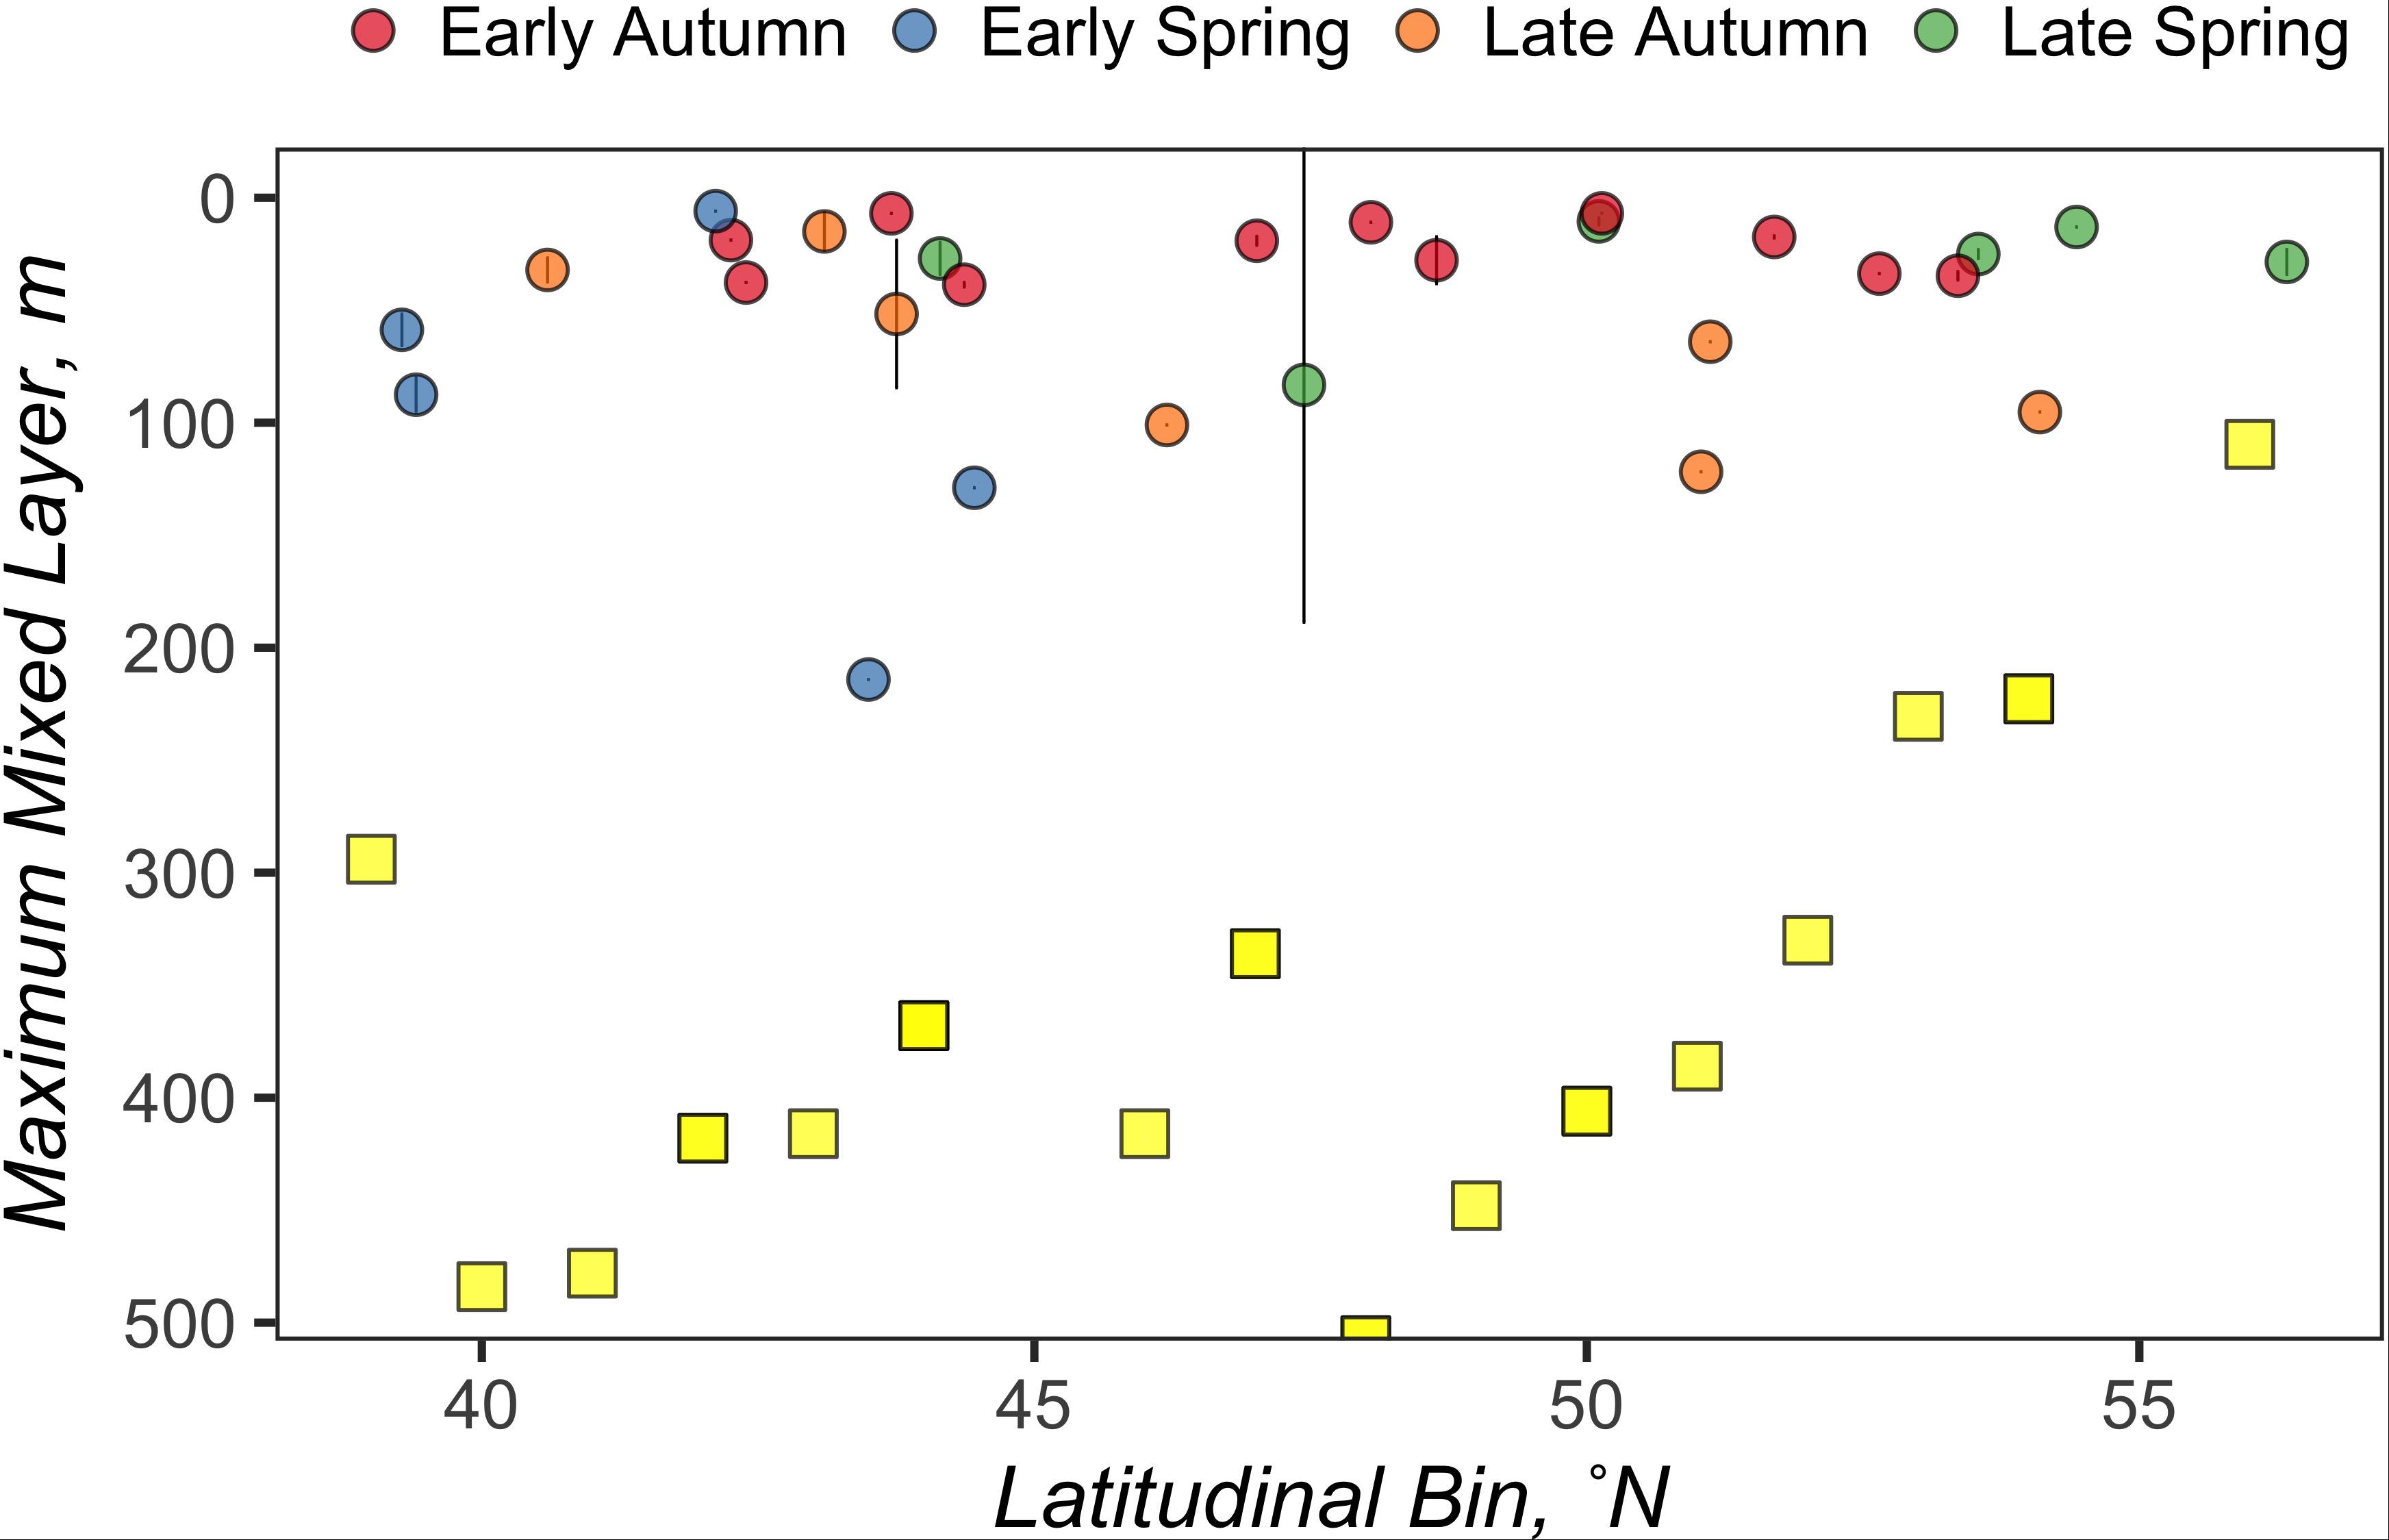
Figure 2. The average mixed layer depth between all CTD casts at a station is represented by an individual circle, the color of which represents the season when that mixed layer depth was observed. Error bars represent standard deviations. Yellow squares represent the maximum mixed layer depths measured by the NAAMES ARGO floats for each latitudinal bin.
Maximum Mixed Layer Depth Calculations From ARGO Floats
We used temperature, salinity, and pressure data provided by Biogeochemical-ARGO and ARGO (hereafter both referred to as ARGO) profiling floats to determine the maximum annual mixed layer depths in the vicinity of stations sampled during the ship campaigns. To match float profiles with station data, the NAAMES region was subdivided into 1° latitudinal bins. Stations and float profiles were binned to the nearest half degree based on their latitudinal coordinates. For example, a station location of 47.49°N and a float location of 46.50°N were both assigned to the 47°N bin (Figure 1 and Table 1).
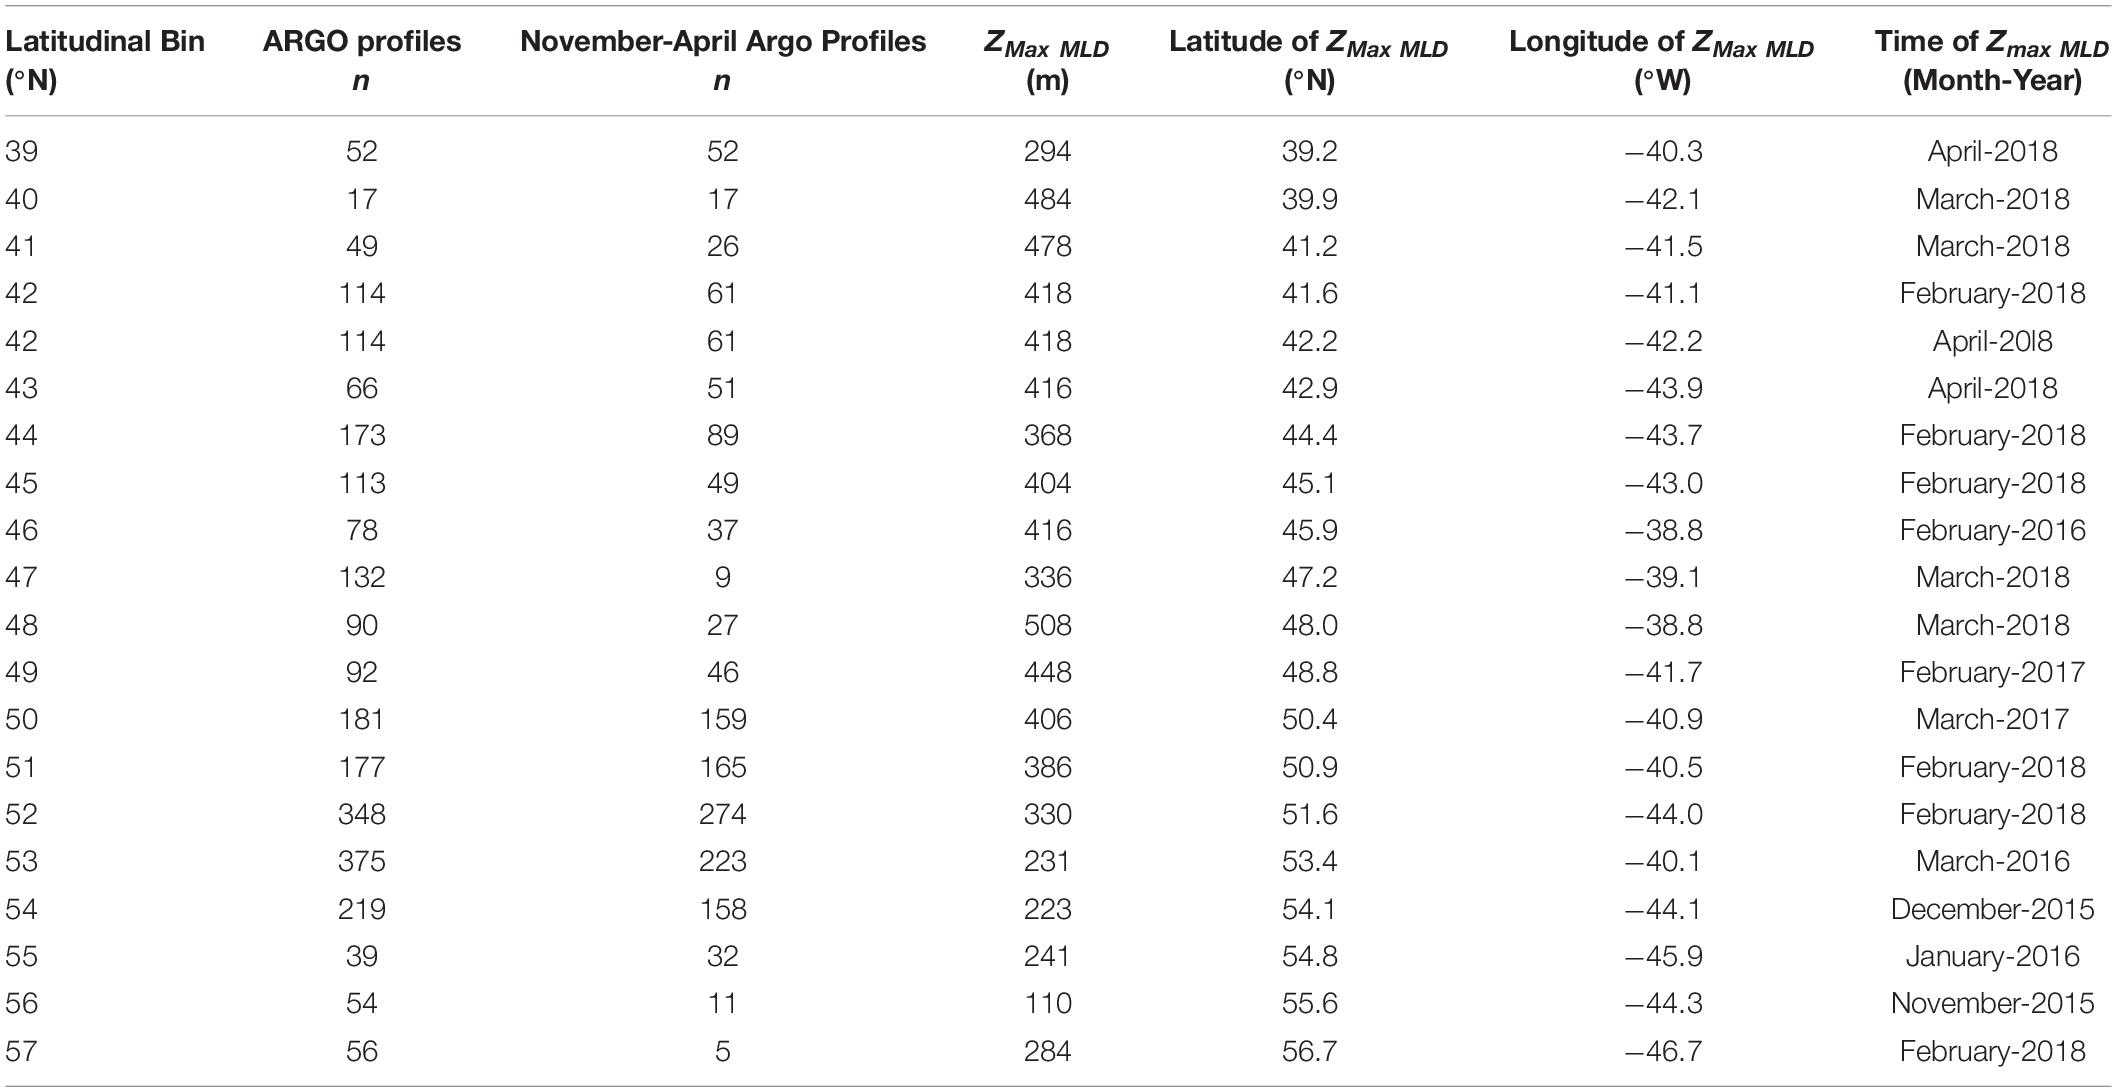
Table 1. Annual maximum mixed layer depths (ZMax MLD), estimated from ARGO profiles.
ARGO float data were retrieved from the NAAMES data page2. All ARGO floats used were located in the area of study and were either deployed during the NAAMES campaigns or previously by the ARGO or the remOcean programs in support of NAAMES (n = 18). Float data spanned from 5 May 2014 to 2 December 2018, and encompassed 2425 unique profiles.
Mixed layer depths (ZMLD) were determined for each float profile using a threshold of the Brunt-Väisälä buoyancy frequency, N2, which was calculated using the function swN2() from the package oce (v 1.0–1) in R. Following Mojica and Gaube (unpublished), ZMLD was defined as the depth below 5 m at which N2 was greater than its standard deviation:
The deepest ZMLD, including its corresponding month and year, recorded for each 1° latitudinal bin throughout the float sampling period was reported as that bin’s annual maximum mixed layer depth, ZMax MLD (Figure 1 and Table 1).
Seasonal Nitrate Drawdown and NCP Calculations
Estimates of surface layer-integrated NO3 drawdown (ΔNO3, mol N m–2 t–1) between deep mixed and bloom or post-bloom stratified conditions have been used to determine seasonal NCP for a variety of ecosystems (Codispoti et al., 1986; Takahashi et al., 1993; Yager et al., 1995; Bates et al., 1998; Hansell and Carlson, 1998; Siegel et al., 1999; Sweeney et al., 2000). The challenge with this approach is capturing the surface layer NO3 distribution during deep winter convective mixing when nutrients from depth are redistributed to the surface. In the absence of direct measurements of NO3 during deep convection, we devised an approach to approximate the NO3 profiles at the time of convection (NO3 Mixed) for each 1° latitudinal bin around each NAAMES station. Specifically, each station’s NO3 profile measured during the post-bloom stratified condition was integrated to the corresponding ZMax MLD of its latitudinal bin. The integrated NO3 stock was then depth-normalized to the ZMax MLD; thus, providing a volumetric estimate of mixed NO3 concentrations for that station (vertical dashed line in Figure 3A). In cases where latitudinal bins contained stations from both the late spring and early autumn campaigns (44, 48, and 50°N), the NO3 Mixed profile generated from the early autumn profiles was applied to the late spring campaign. In cases where latitudinal bins only contained stations from the late spring (54 and 56°N), NO3 Mixed profiles were generated from the late spring profiles. Depth-integrated NO3 drawdown (ΔNO3100 m, mol N m–2 t–1) over the surface 100 m (Figure 3A) from the time of deep convection to the time of observation (t) were calculated for each profile as:
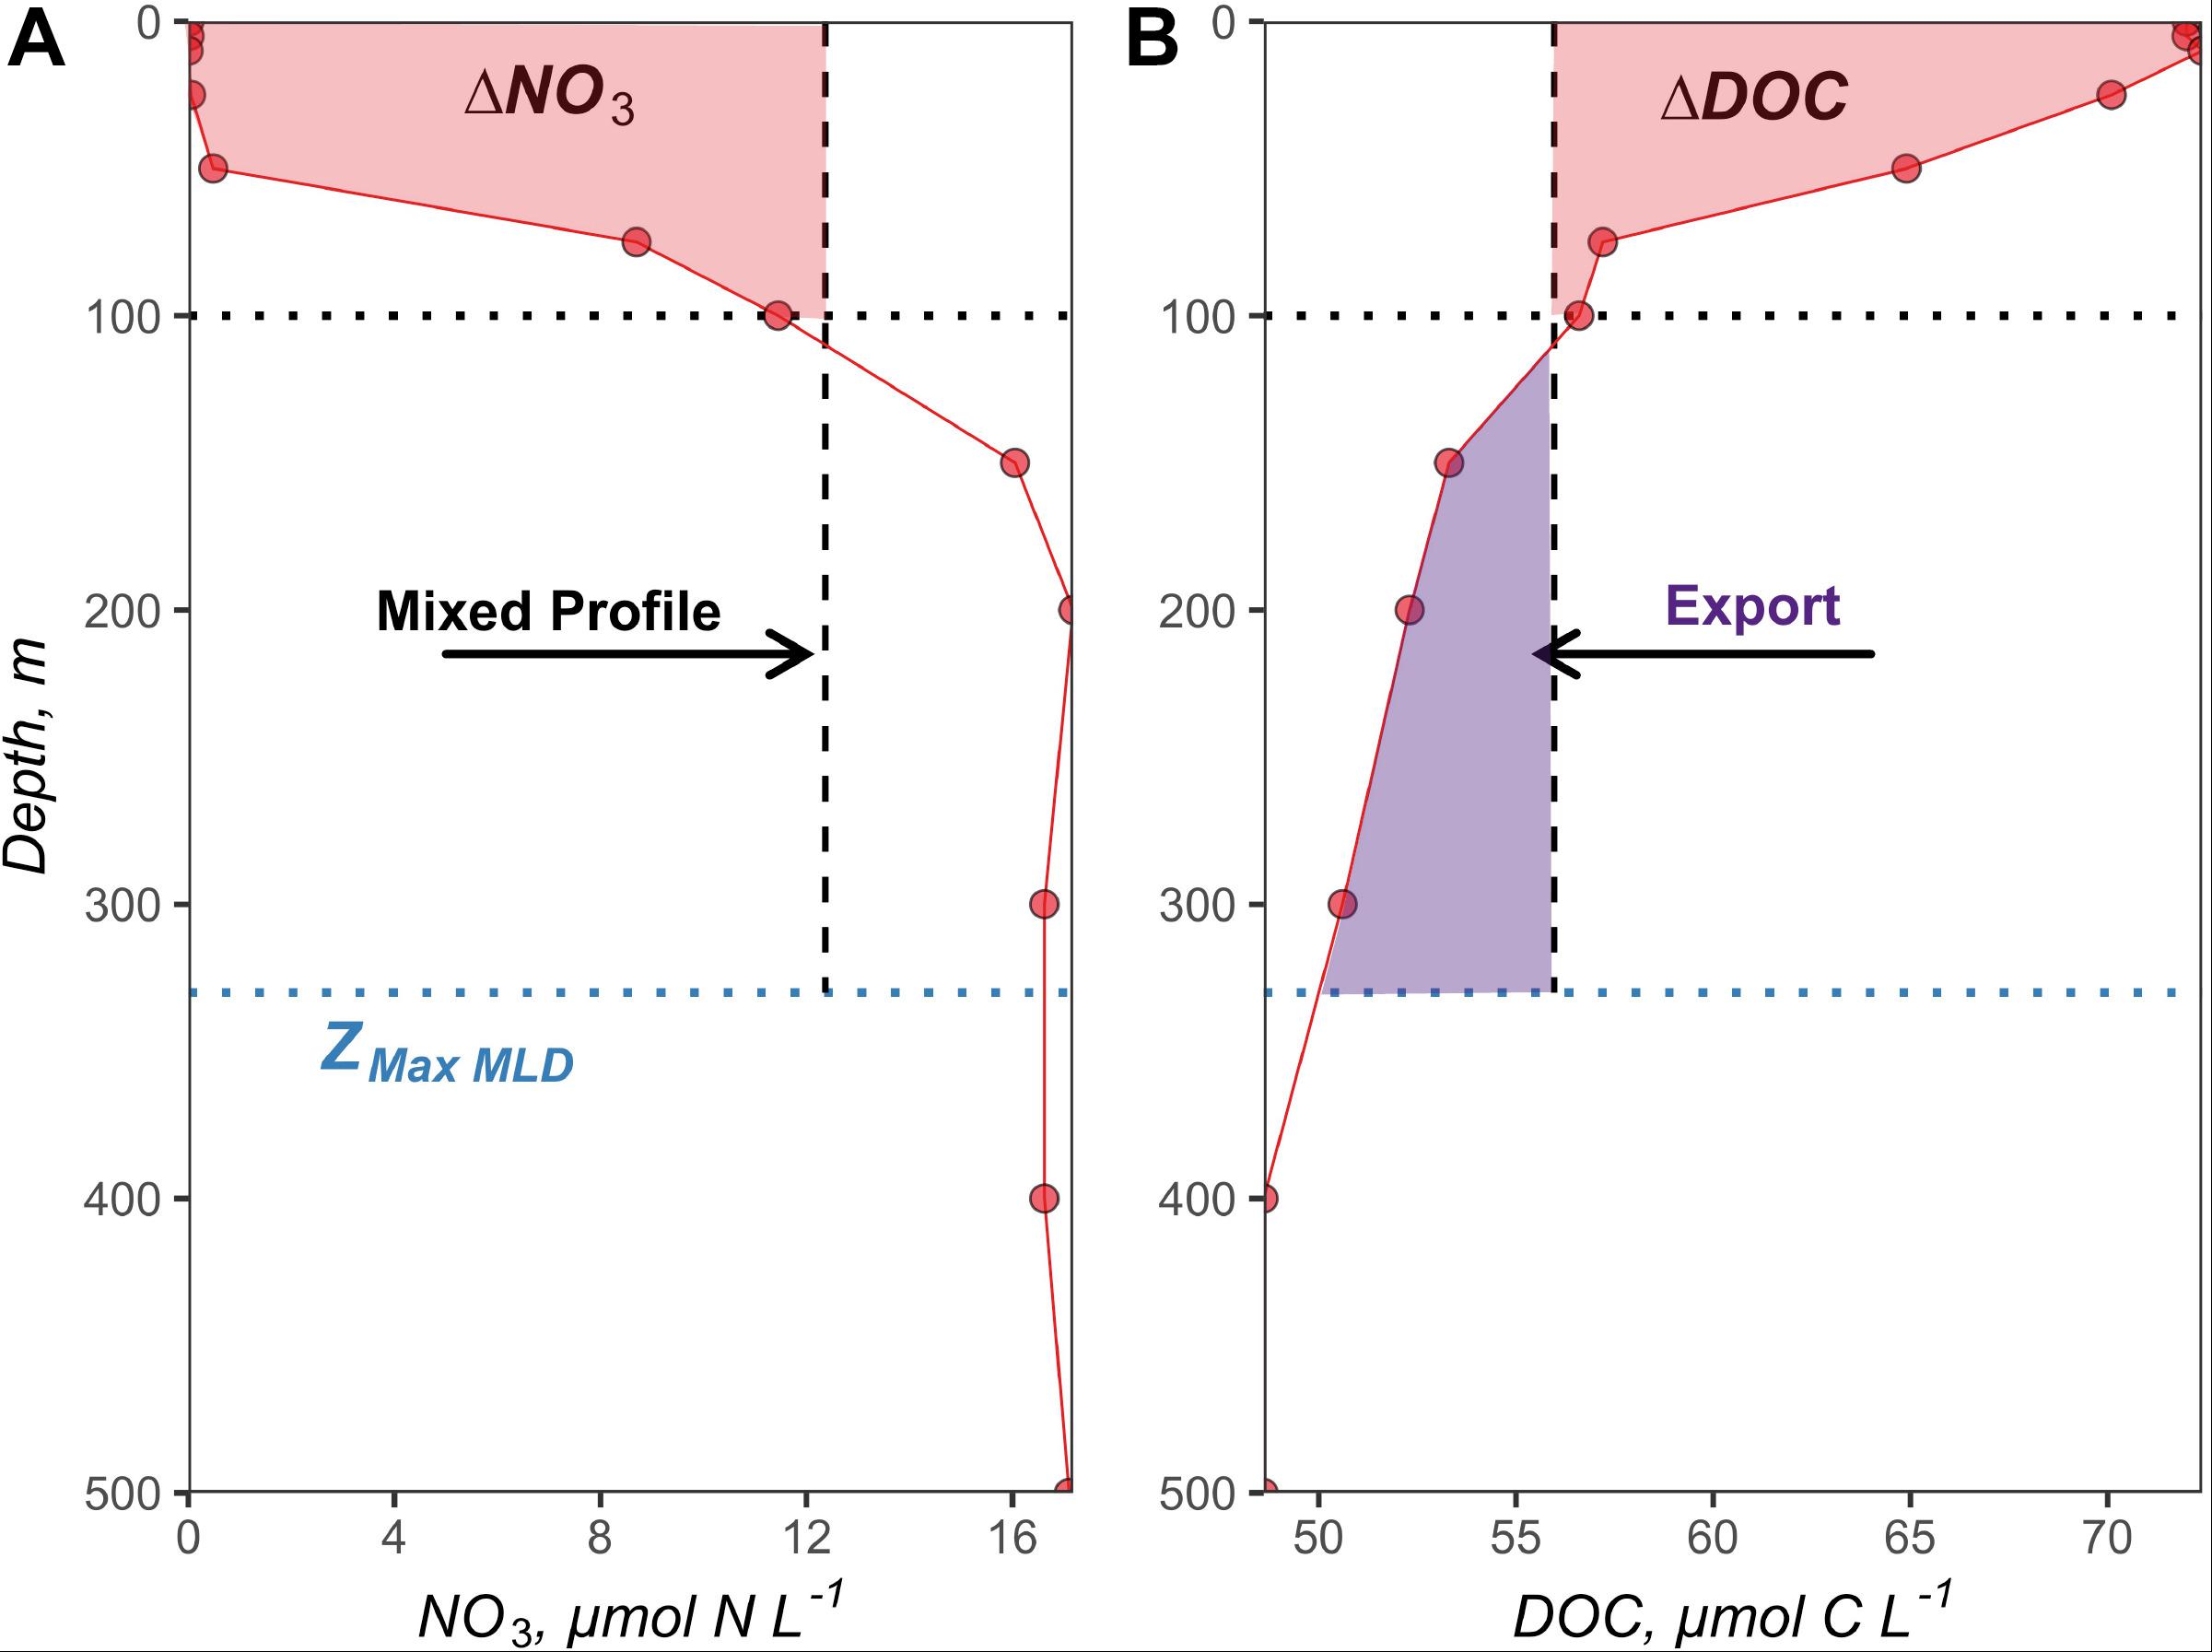
Figure 3. Early autumn nitrate (A) and DOC (B) profiles from station 5 at 51.7°N and −39.5°W. The maximum MLD (ZMax MLD) at the 50° latitudinal bin recorded by ARGO floats was 330 m and is shown as the blue dotted line. The black dotted line indicates the 100 m depth horizon, used as a benchmark for the surface layer as in previous studies. The vertical black dashed line represents the redistribution of the observed profiles to the maximum MLD (integrated and depth-normalized to maximum MLD), simulating the “mixed” condition reflective of winter/spring deep convection. The red shaded areas within the surface 100 m represent (A) the nitrate drawdown and (B) the accumulation of ΔDOC between the time of mixing to the early autumn stratified period in mol N m–2 and mol C m–2, respectively. The purple shaded area below the 100 m depth horizon indicates the magnitude of DOC export in mol C m–2.
The drawdown was then converted to seasonal NCP (NCP100 m, mol C m–2 t–1) by employing the C:N ratio from Redfield (1958) as done by previous studies (Hansell et al., 1993; Yager et al., 1995; Romera-Castillo et al., 2016; Bif and Hansell, 2019).
Seasonal depth-integrated NCP was also calculated for the depth horizons of the CM and the PAM to examine how it changed over various depths within the surface layer.
ΔDOC and Export Calculations
Seasonal depth-integrated ΔDOC (ΔDOC100 m, mol C m–2 t–1) over the surface 100 m from the time of deep convection to the time of observation (t), shown in Figure 3B, was calculated for each profile, as follows:
ΔDOC100 m at each station from the time of deep convection to early autumn stratified period provides an approximation of the magnitude of annual DOC export potential from the surface layer (Carlson et al., 1994; Hansell and Carlson, 2001). Demarcating the surface layer at 100 m is consistent with previous studies that have used the same depth horizon to define DOC export from the surface layer into the mesopelagic (Sweeney et al., 2000; Carlson et al., 2010; Hansell et al., 2012). Thus, annual DOC export out of the surface 100 m (DOCExport 100 m, mol C m–2 t–1) was calculated as the difference in the integrated DOC stocks (100 m to the maximum MLD for each station) between the mixed and the early autumn stratified condition (Figure 3B), as follows:
We acknowledge that ΔDOC is subject to surface circulation and can be advected to a location with enhanced, dampened, or negligible vertical mixing. Because we do not have an explicit means to constrain lateral advection with the available data, the DOC export values reported here assume a static view of the system and represent local vertical export.
The partitioning of seasonal NCP into ΔDOC was calculated as the ratio between ΔDOC and NCP (Figure 4C and Supplementary Figure S6). To examine how ΔDOC and ΔDOC:NCP changed over various depth horizons within the surface layer, they were estimated within the surface 100 m, the CM, and the PAM.
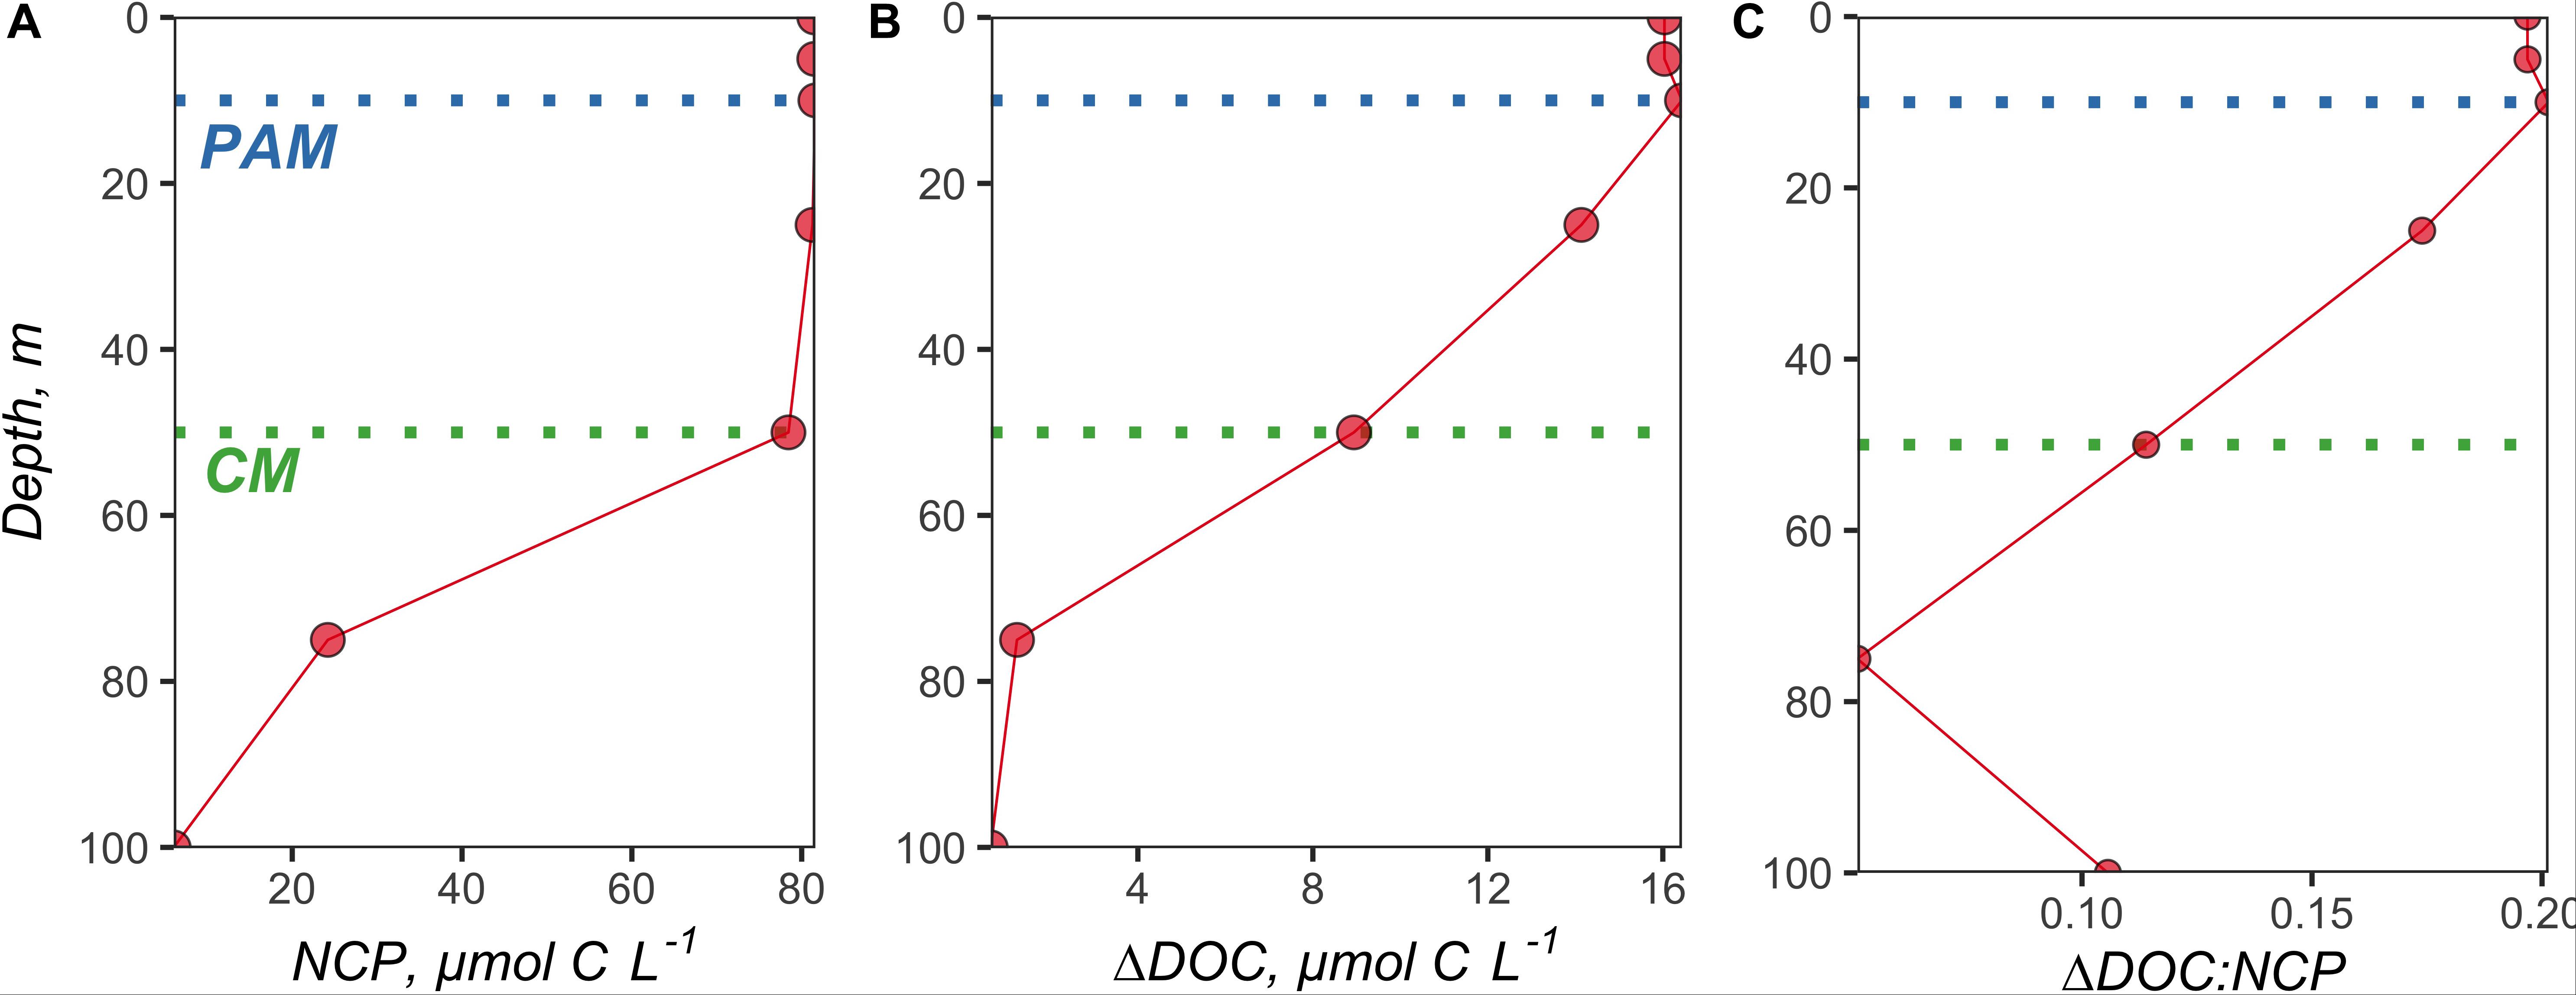
Figure 4. Vertical profiles of volumetrically estimated (A) NCP (difference between NO3 Mixed and NO3 Observed at each depth × 6.6), (B) ΔDOC (difference between DOCObserved and DOCMixed at each depth), and (C) subsequent ΔDOC:NCP. The NO3 and DOC profiles used to make these estimates were taken from station 5 at 51.7°N and −39.5°W. The green dotted line denotes the chlorophyll maximum (CM), and the blue dotted line demarcates the phytoplankton abundance maximum (PAM).
Seasonal Silicate Drawdown Calculations
The depth-integrated seasonal drawdown of SiO4 (ΔSiO4 100 m) relative to ΔNO3 100 m was used as an index of the relative importance of diatoms in NO3 drawdown, as opposed to other phytoplankton groups. Greater ΔSiO4:ΔNO3 ratios indicate the greater relative importance of diatoms or other siliceous phytoplankton in contributing to NCP100 m (Sweeney et al., 2000). ΔSiO4 100 m was calculated following the same approach described above to determine ΔNO3 100 m.
Statistical Analyses
Model I linear regressions were used to assess the comparability of ΔDOC:NCP estimates as well as latitudinal trends in those estimates. Regressions were computed using the function lm() from the package stats (v 3.5.1) in R (v 3.5.1). Model fits with p-values ≤ 0.05 are described herein as “significant,” while those with p-values ≤ 0.01 are described as “highly significant.” T-tests were used to determine if slopes were different from 0, with p-values ≤ 0.05 indicating significant likelihood. The Breusch–Pagan test against heteroskedasticity was performed on each model using the function bptest() from the package lmtest (v 0.9-37) with the argument studentized set to TRUE in R (v 3.5.1). From this test, p-values ≤ 0.05 suggest heteroskedasticity and indicate that the spread of the residuals is not constant with the fitted values. In this case, the regression model’s ability to predict a dependent variable is not consistent across all values of that dependent variable. Standardized (reduced) major axis model II linear regressions were used to explore relationships among deep mixed conditions, NCP, ΔDOC:NCP, ΔDOC, inorganic nutrients, and broad phytoplankton groups. As with the model I linear regressions, model fits with p-values ≤ 0.05 are described as “significant” and those with p-values ≤ 0.01 are described as “highly significant.” A Welch two-sample T-test was performed to compare ΔDOC:NCP between seasons using the function t.test() from the package stats (v 3.5.1) in R (v 3.5.1).
Results
ARGO Float-Based Maximum Mixed Layer Depth Estimates
A total of 2425 profiles were recorded in the NAAMES study region between 5 May 2014 and 2 December 2018. The minimum and maximum number of profiles for each 1° latitudinal bin within the NAAMES study region were n = 17 (40°N) and n = 375 (53°N), respectively, with a mean of n = 127 and the median of n = 92. Figure 1 illustrates the temporal coverage obtained by combining data from the ARGO floats in the vicinity of each station (within 1° latitudinal bin). The maximum MLD (ZMax MLD) determined for each 1° latitudinal bin in the NAAMES region occurred between the months of November and April and ranged from 110 to 508 m. A total of 1491 profiles were recorded during this period, with a minimum, maximum, mean, and median number of profiles for each 1° latitudinal bin at 5 (57°N), 274 (52°N), 78, and 49, respectively (Table 1). The range, mean, and median of ZMax MLD was greater than the mixed layer depths recorded for all cruises within the NAAMES campaign, which ranged between 6 and 214 m (Figure 2), indicating that conditions reflecting deep convection were not captured during the NAAMES occupations.
ZMax MLD determined for each bin was then used to reconstruct mixed nutrient and DOC profiles required to calculate seasonal NCP and ΔDOC.
NCP, ΔDOC, and Vertical DOC Export
Estimates of seasonal NCP from the mixed condition to the early autumn stratified period ranged between 1.67 and 6.70 mol C m–2, with a median of 4.69 and a mean of 4.29 mol C m–2 (Table 2). ΔDOC:NCP over the same period ranged from 0.14 to 0.35, with a median and mean of 0.17 and 0.20, respectively (Table 2).
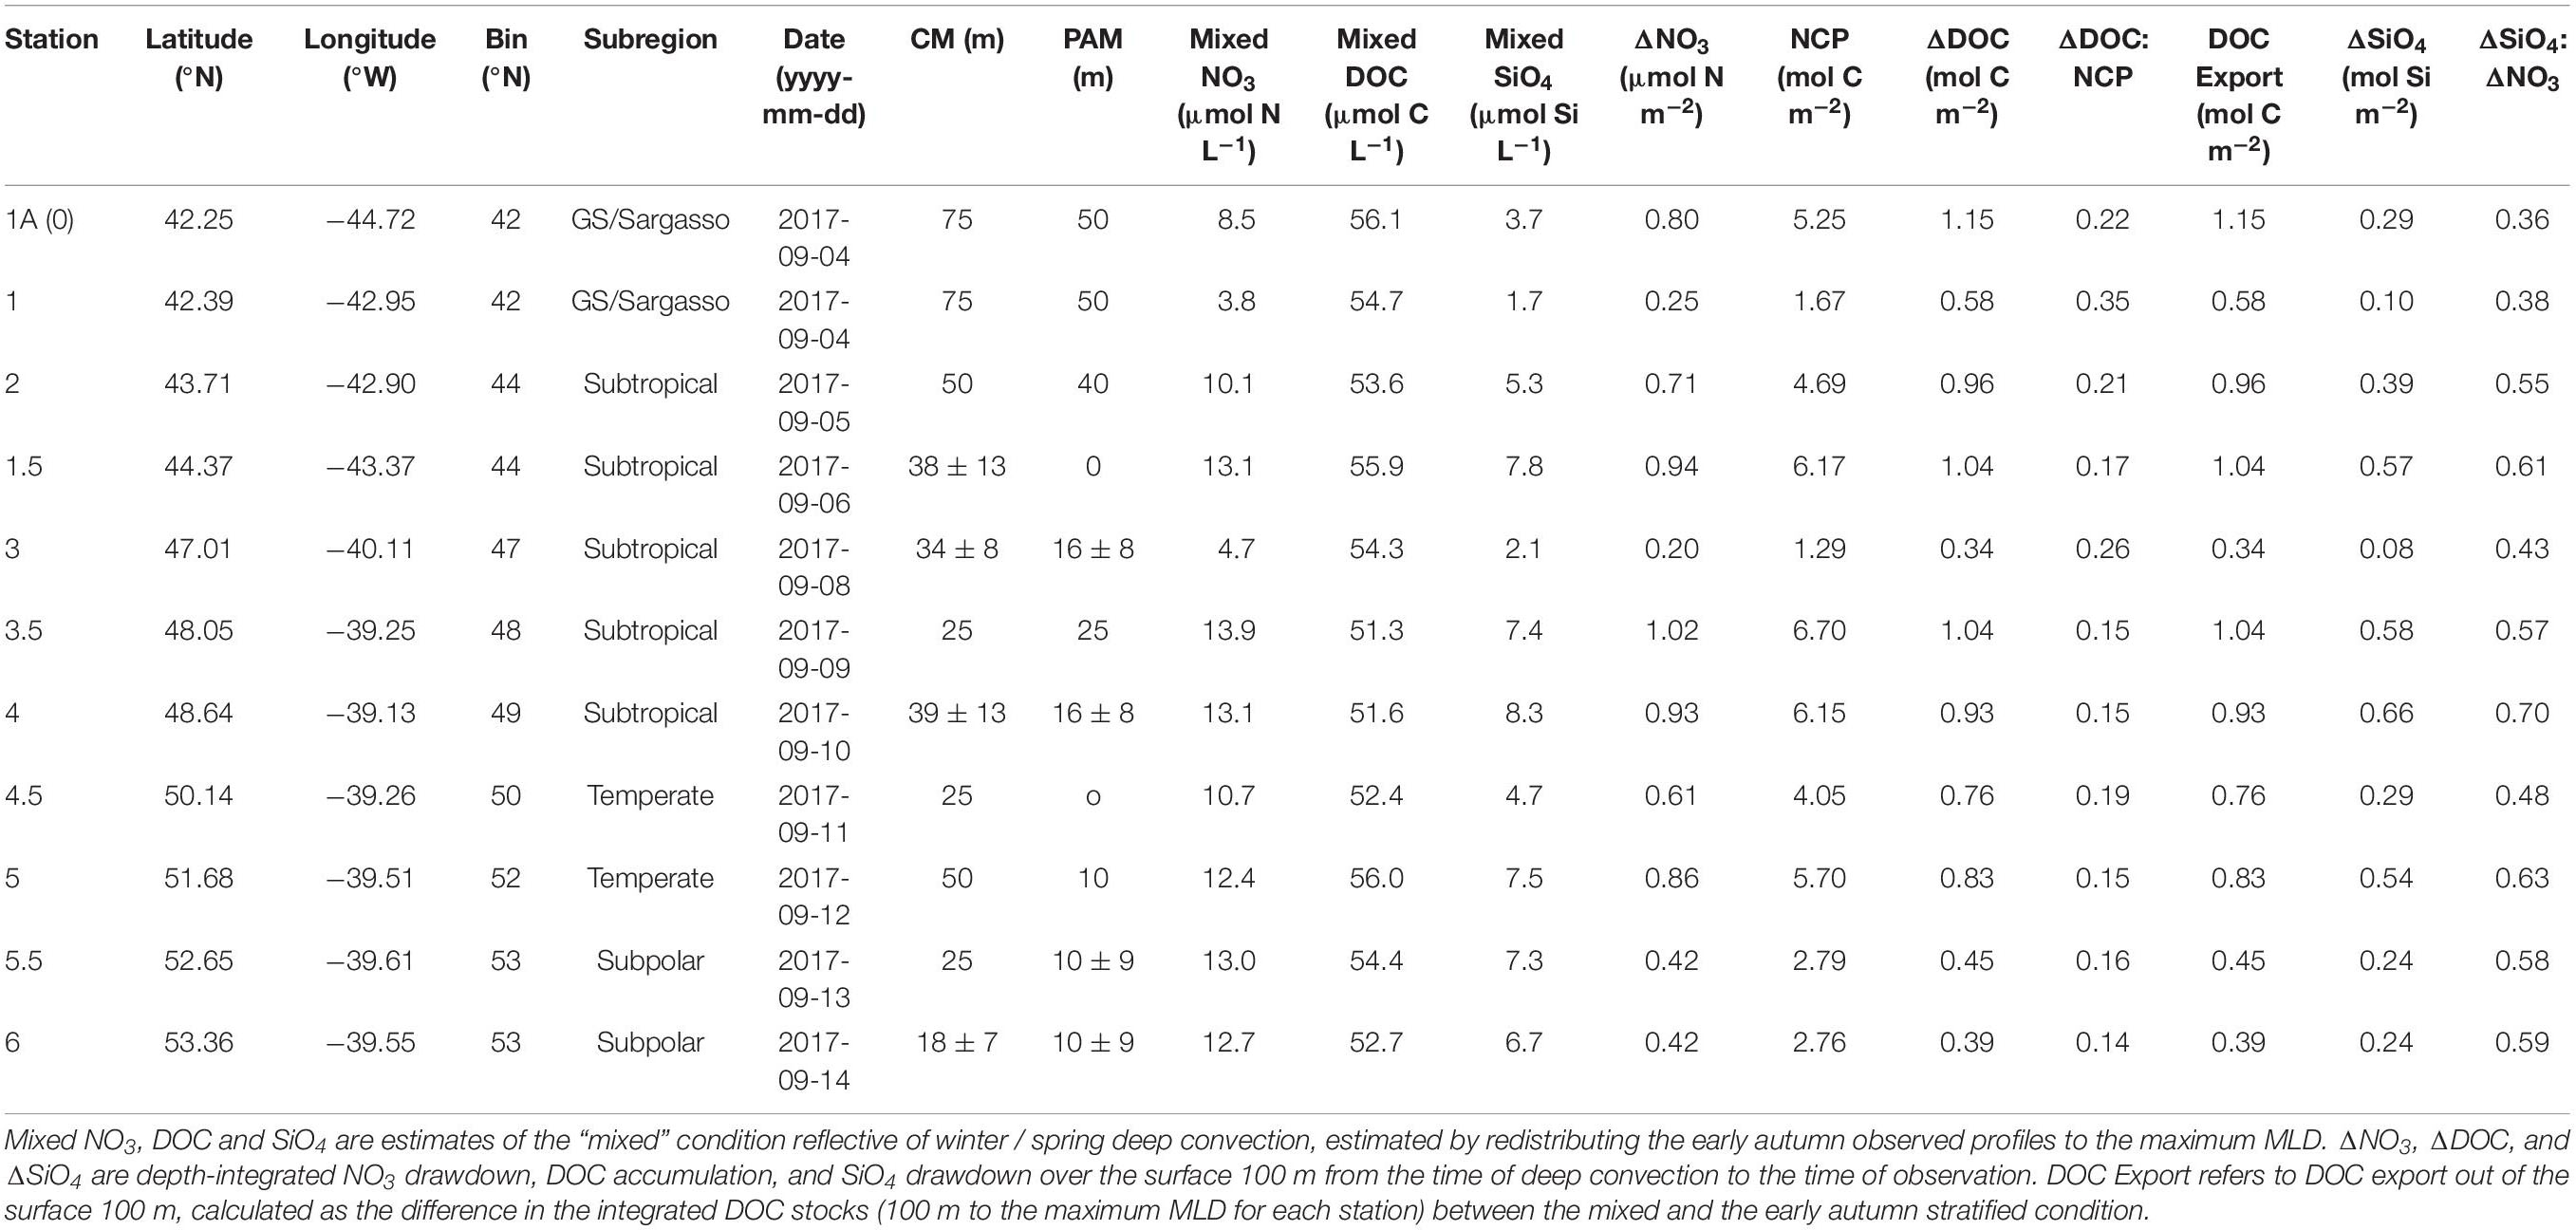
Table 2. Seasonal net community production (NCP) and its partitioning into DOC in the upper 100 m as well as DOC export out of the upper 100 m for the early autumn campaign. CM refers to the chlorophyll maximum and PAM refers to the phytoplankton abundance maximum.
Vertical profiles of volumetrically estimated NCP (difference between NO3 Mixed and NO3 Observed at each depth × 6.6) and ΔDOC (difference between DOCObserved and DOCMixed at each depth) show that NCP and ΔDOC were both most pronounced within the shallowest depth horizons of the surface layer (Figure 4 and Supplementary Figures S4, S5). ΔDOC:NCP estimates were similar whether calculated for the upper 100 m, to the depth of the CM, or the depth of the PAM (Supplementary Table S1).
Using the local ZMax MLD for each station, we estimated annual DOCExport 100 m for each station along the NAAMES meridional transect (42°N–53°N) to range between 0.34 and 1.15 mol C m–2 (Table 2), with a mean of 0.77 mol C m–2. Esimates of DOCExport 100 m are not included in Table 3. This is because it would be inappropriate to calculate DOC export for the late spring, a season far removed from the timing of deep convection. It is the bulk DOC pool during the stratified condition, just before the late autumn/winter, that will be subject to deep convection. Mesopelagic DOC concentrations in the early autumn were observed to be lower than those of the mixed condition (Figure 3 and Supplementary Figure S2), suggesting that after DOC is exported, it is remineralized by the mesopelagic community (Carlson et al., 2004, 2011). ΔDOC:NCP over a range of NCP magnitudes was observed to be significantly greater in the early autumn (mean 0.20 ± 0.06) than the late spring (mean 0.11 ± 0.06) (Tables 2, 3 and Figures 5, 6A). Vertical DOC export was observed to increase in magnitude with increasing NCP (Figure 6B).
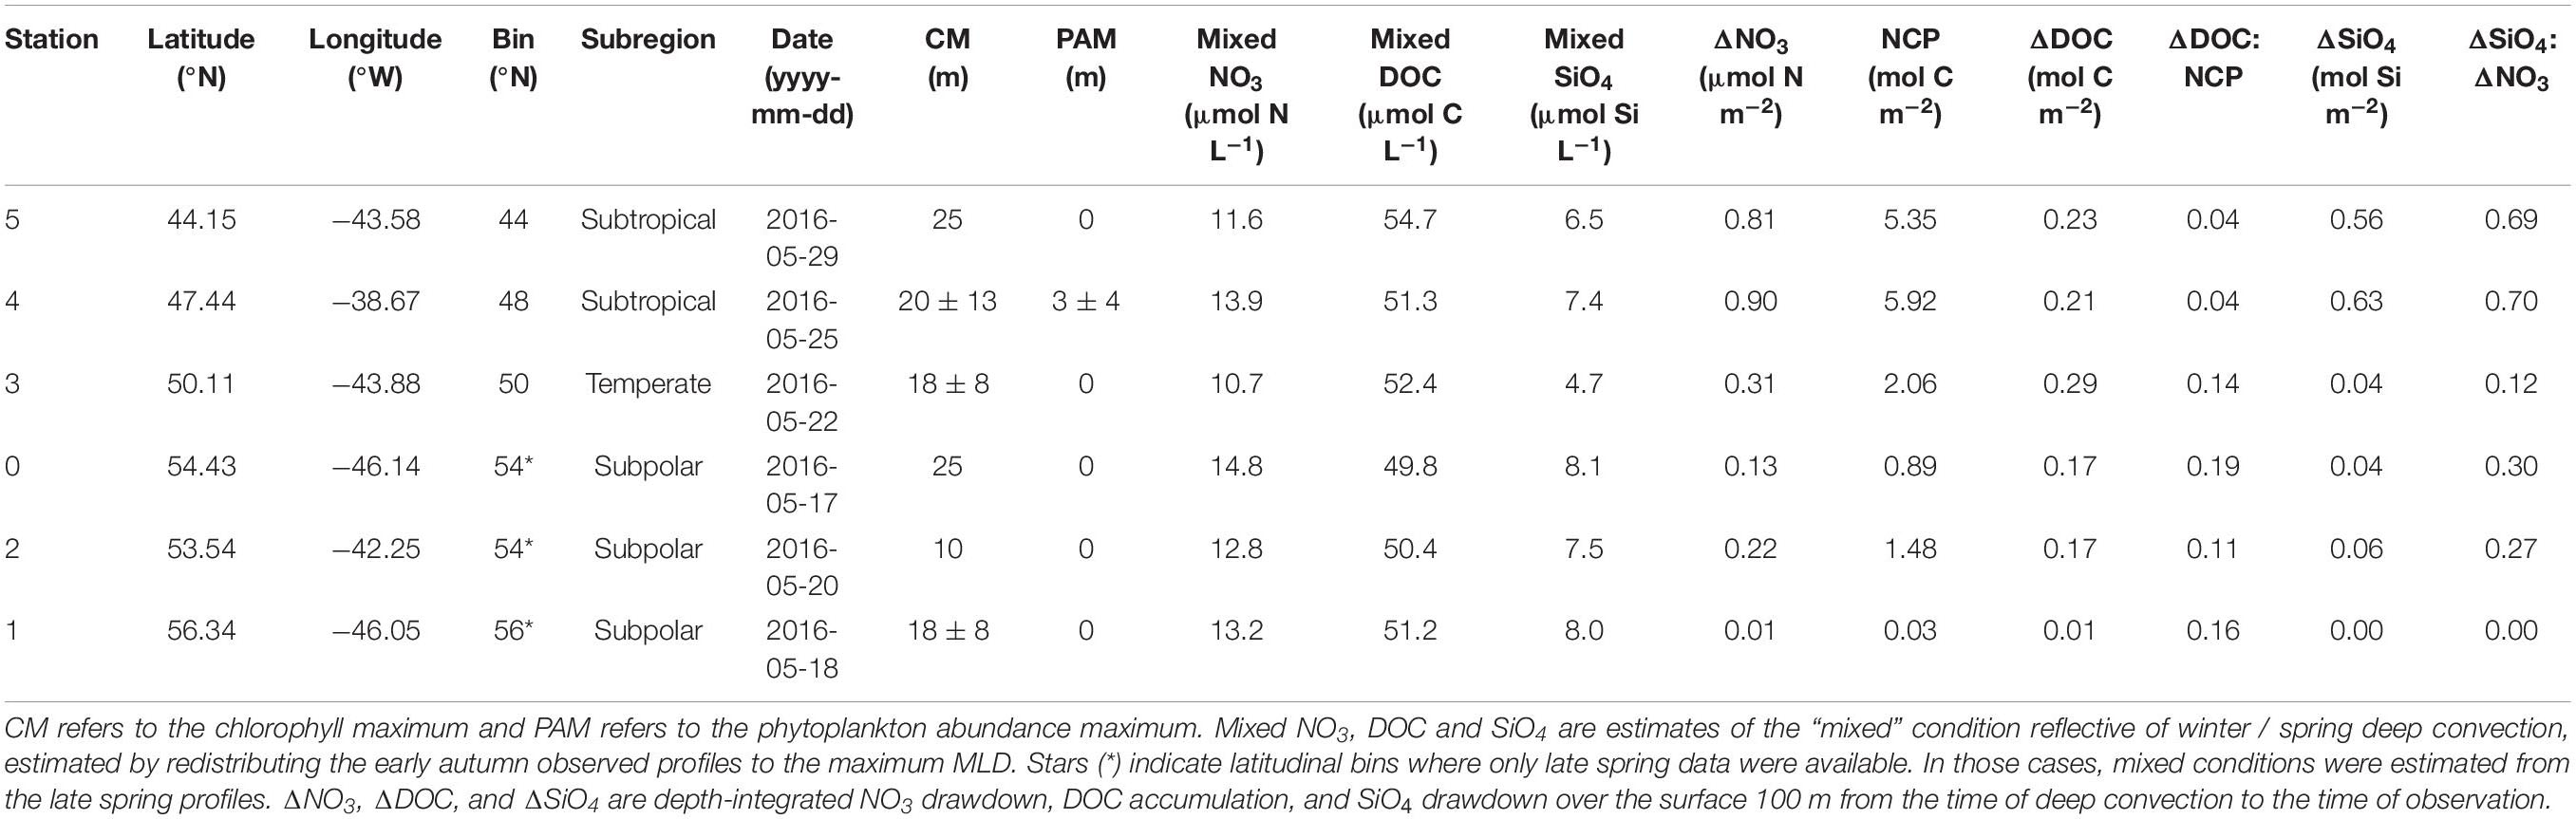
Table 3. Seasonal net community production (NCP) and its partitioning into DOC in the upper 100 m for the late spring campaign.
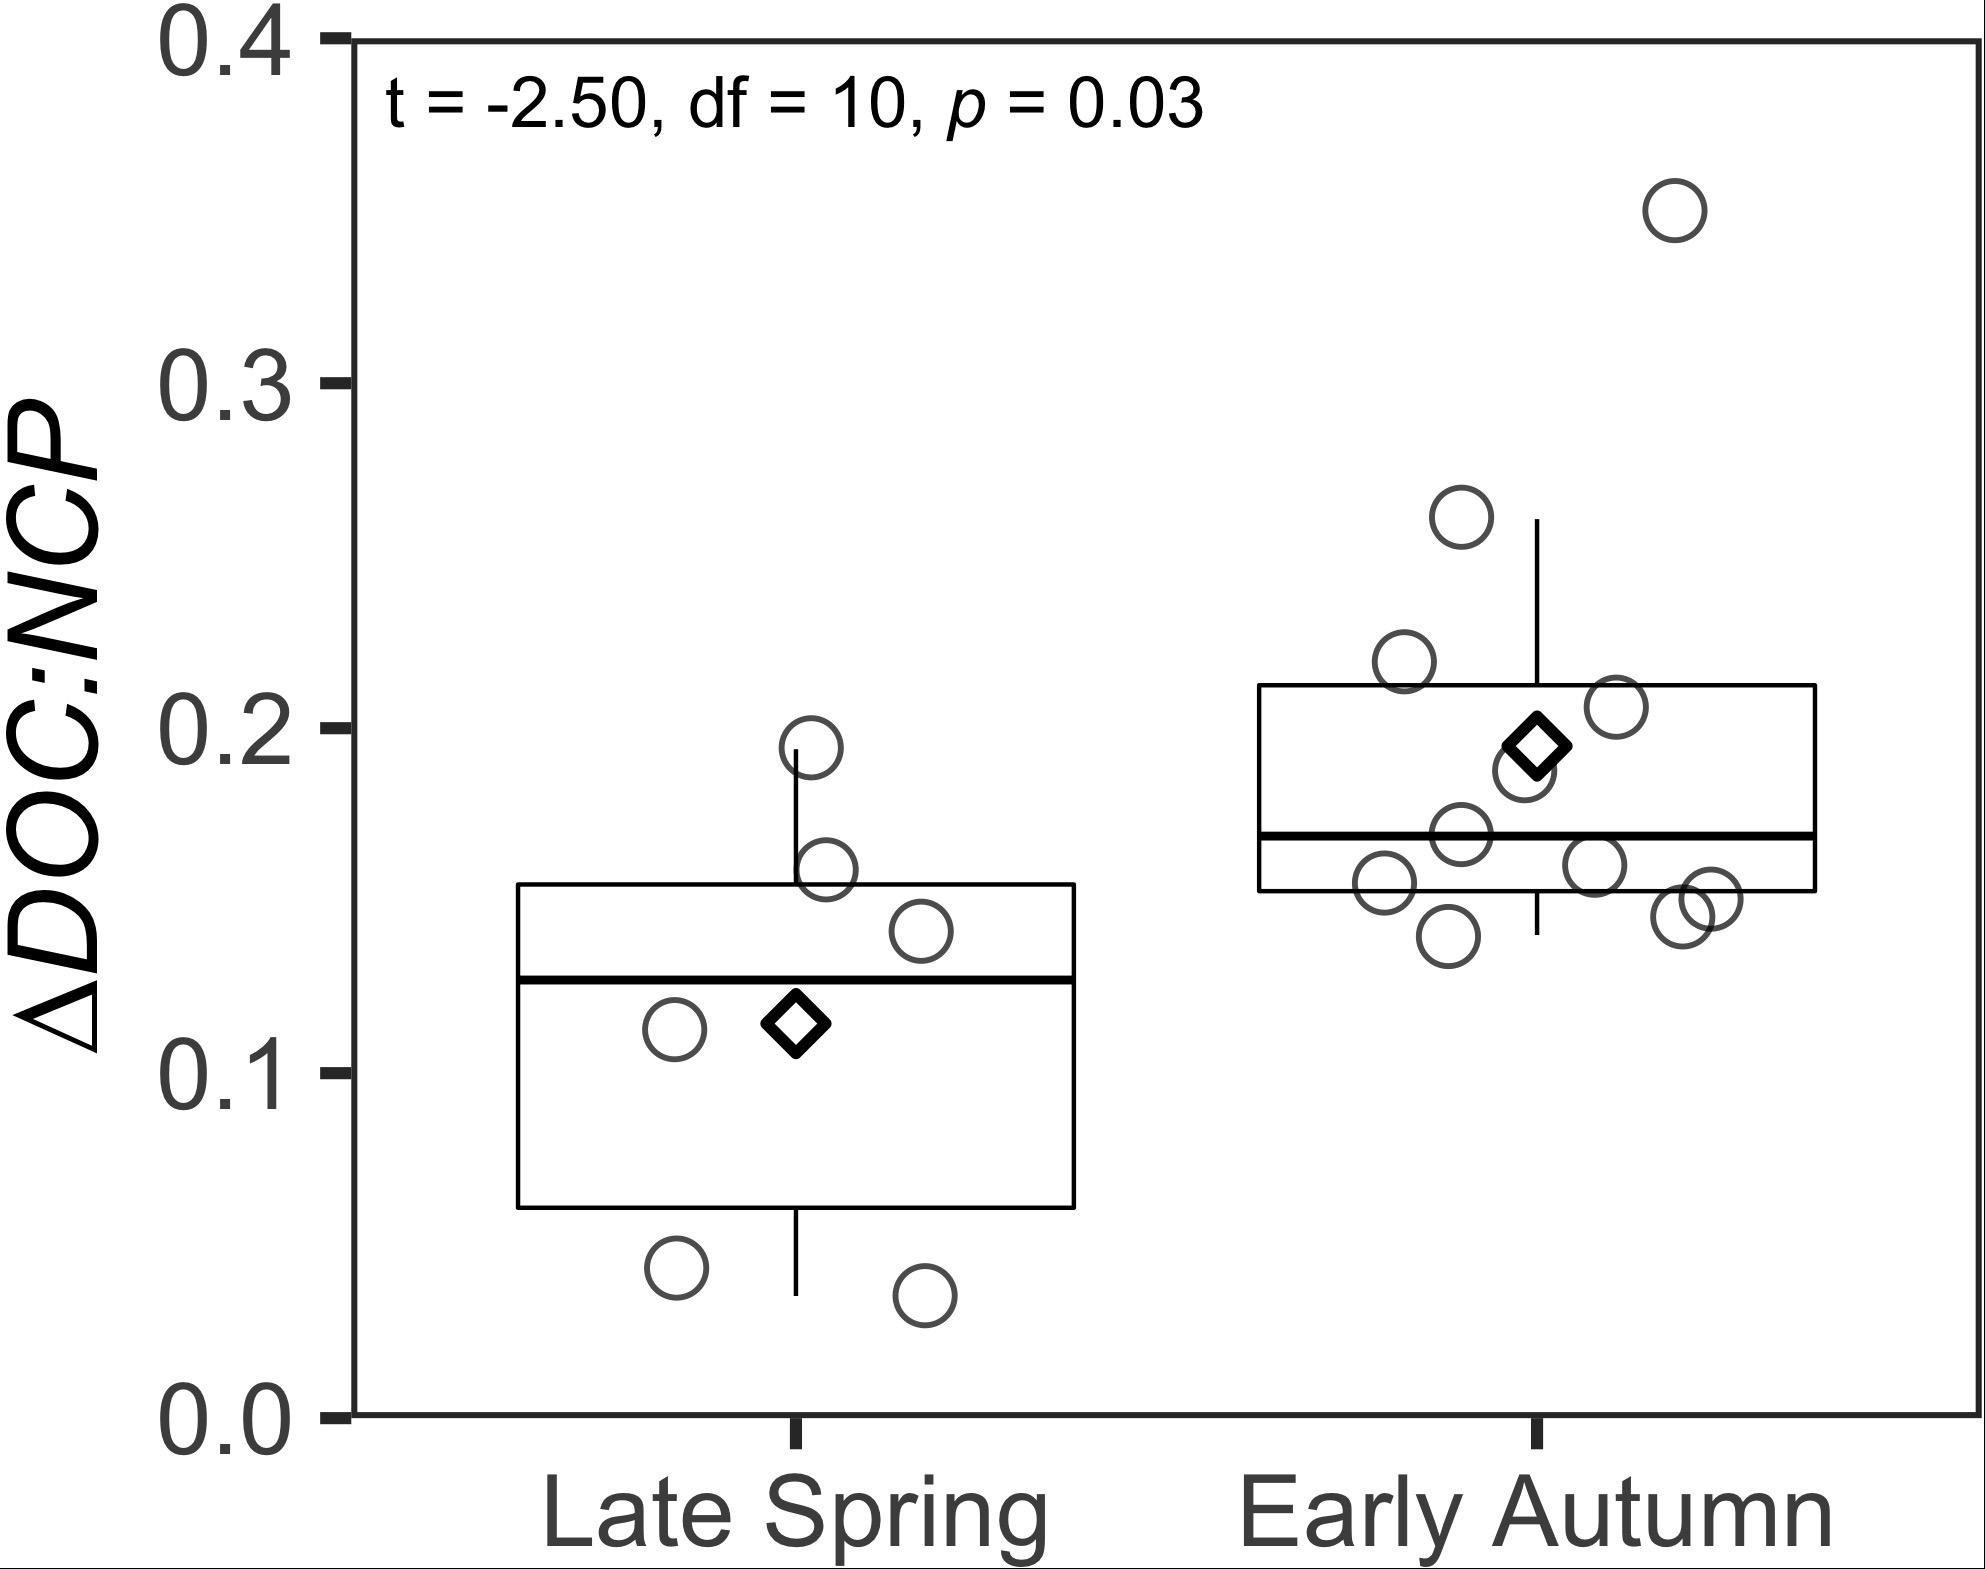
Figure 5. Box and whisker plots comparing ΔDOC:NCP integrated over the surface 100 m between the late spring and early autumn. Boxes represent the median and the first and third quartiles. Whiskers represent the 1.5 interquatile range. Circles indicate data points. Diamonds represent the mean of the data.
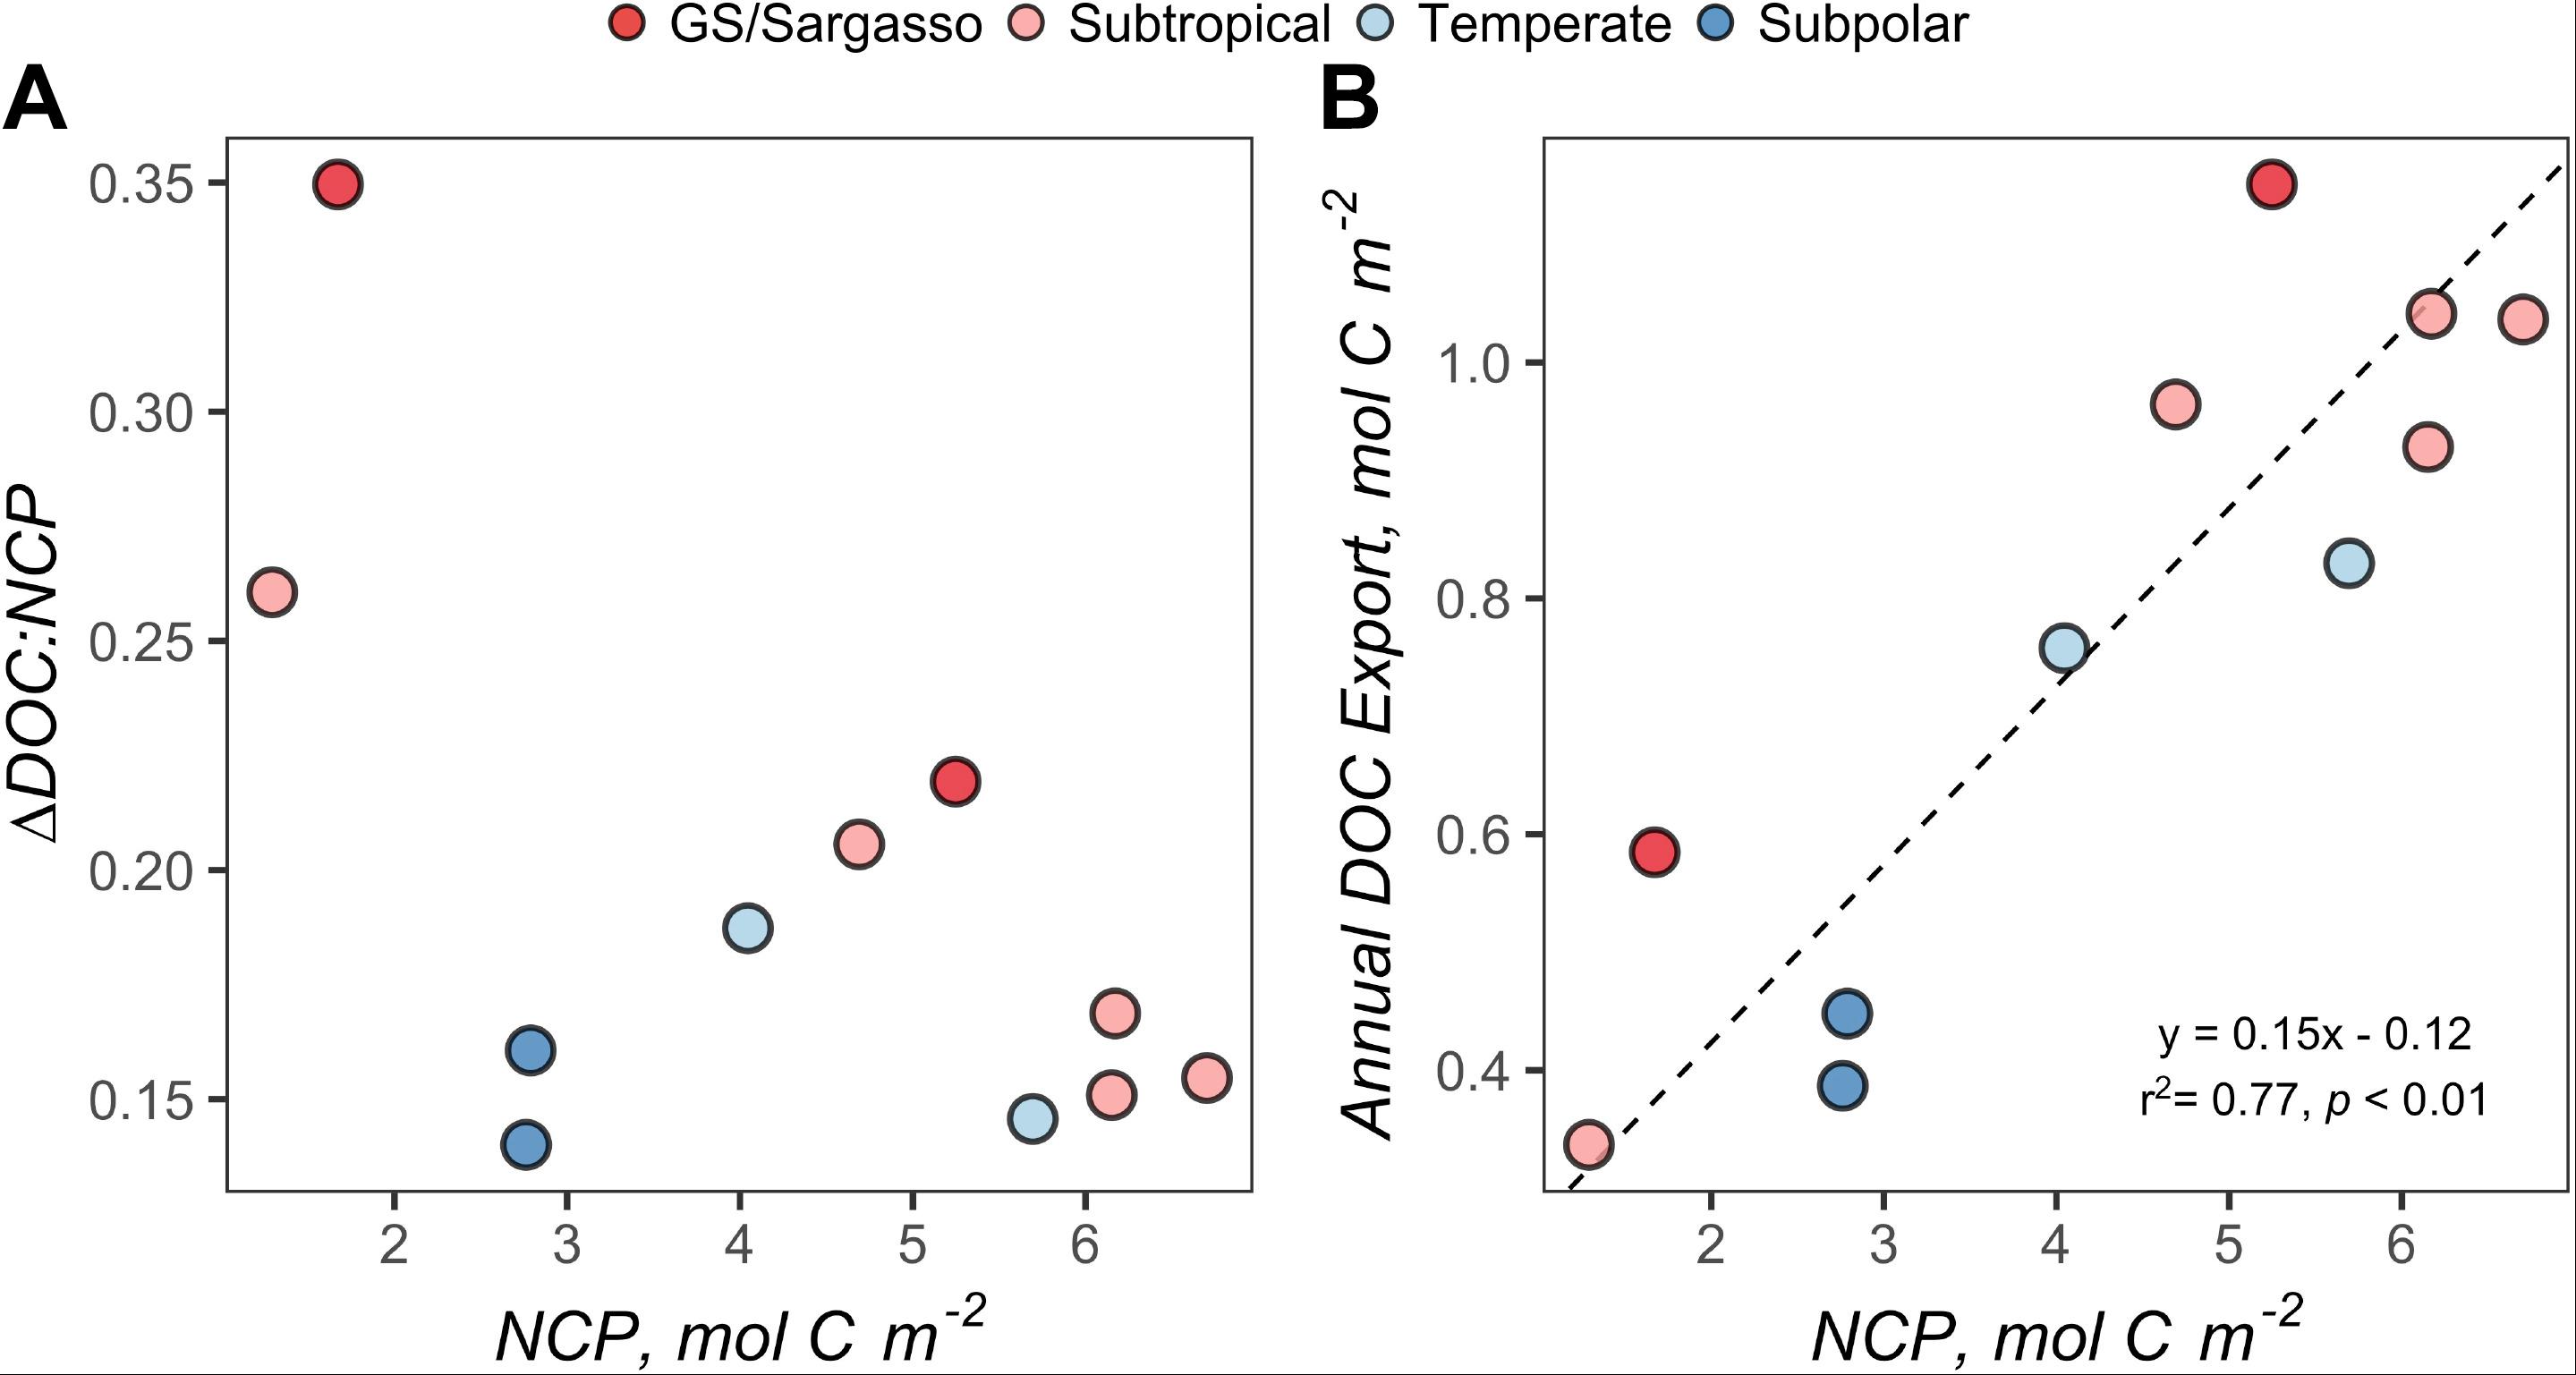
Figure 6. (A) Variability of ΔDOC:NCP over the range of seasonal net community production (NCP). (B) Standard major axis model II regressions for NCP and annual DOC export. Each point represents estimates for a station during the early autumn cruise. Points are filled by the subregional classification of the station as described in Figure 1. NCP and ΔDOC:NCP represent values integrated to 100 m. Annual DOC export represents values integrated from 100 m to the maximum mixed layer depth (see Figure 3B).
Partitioning of NCP
ΔSiO4:ΔNO3 in the early autumn generally increased with increasing latitude and ranged from 0.36 to 0.70, which would suggest that 36–70% of phytoplankton biomass in the region was represented by diatoms or other siliceous phytoplankton like silicoflagellates. ΔDOC:NCP displayed a strong and highly significant negative relationship with ΔSiO4:ΔNO3 (Figure 7). ΔDOC:NCP also showed significant moderate to strong direct relationships with Prochlorococcus abundance within the depth horizons of the CM and PAM (Figure 8). When compared to flow cytometry cell abundance estimates of other broad phytoplankton groups (Synechococcus, picoeukaryotes, and nanoeukaryotes), the ΔDOC:NCP ratio only demonstrated a weak negative relationship with picoeukaryotes over the PAM depth horizon (Supplementary Table S2).
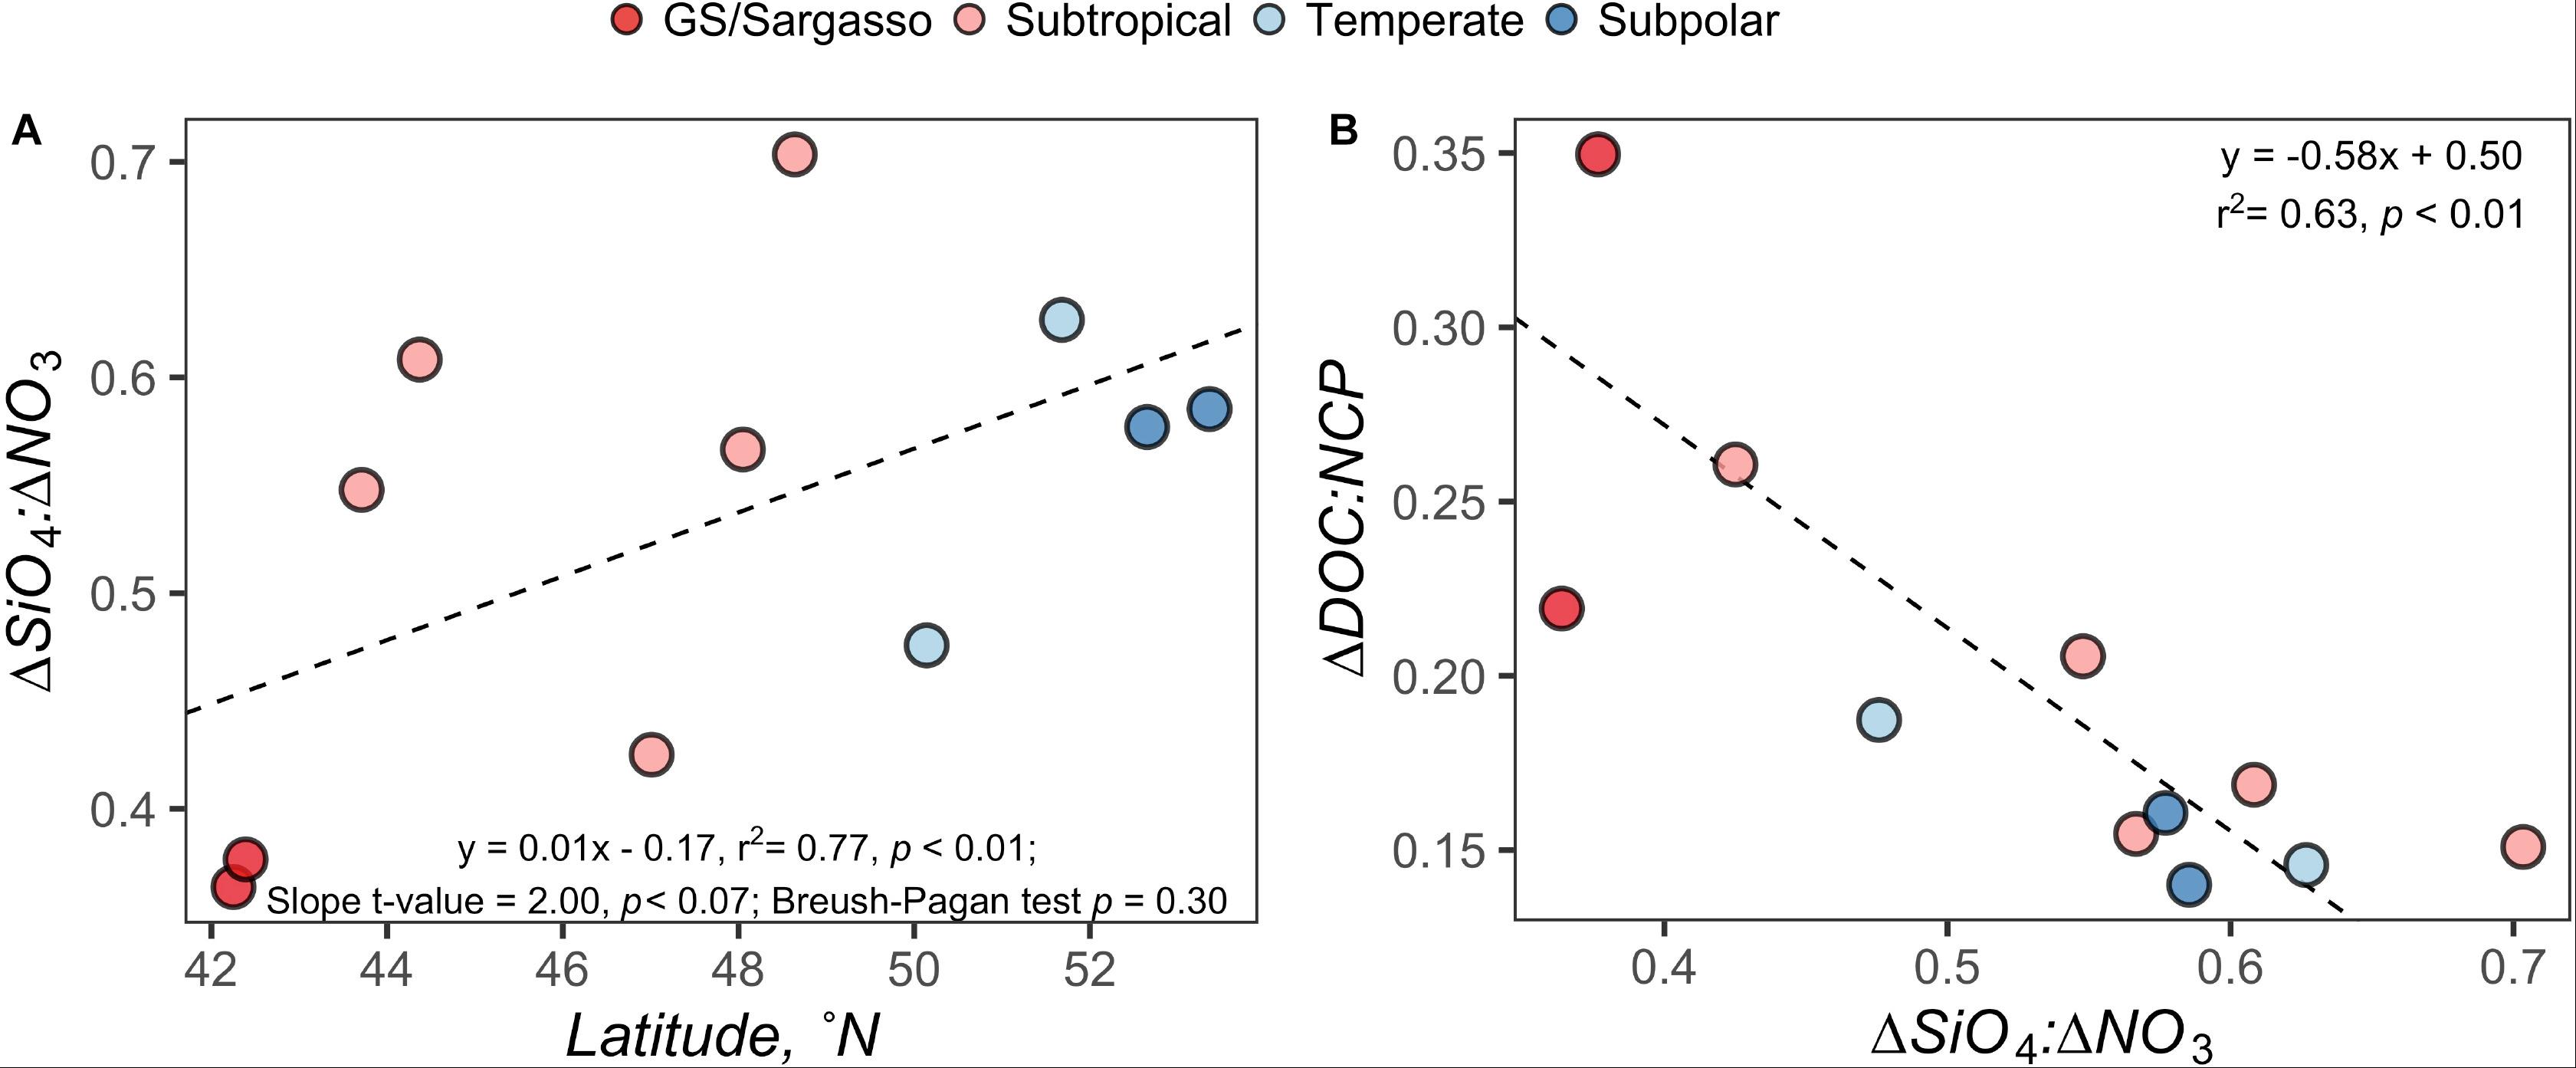
Figure 7. Model regressions comparing the ΔDOC:NCP in the surface 100 m; (A) model regression for the ΔSiO4:ΔNO3 ratio versus latitude and (B) standard major axis model II regression for ΔDOC:NCP versus ΔSiO4:ΔNO3 ratio. Each point represents estimates for a station on the early autumn cruise. Points are filled by the subregional classification of the station as presented in Figure 1.
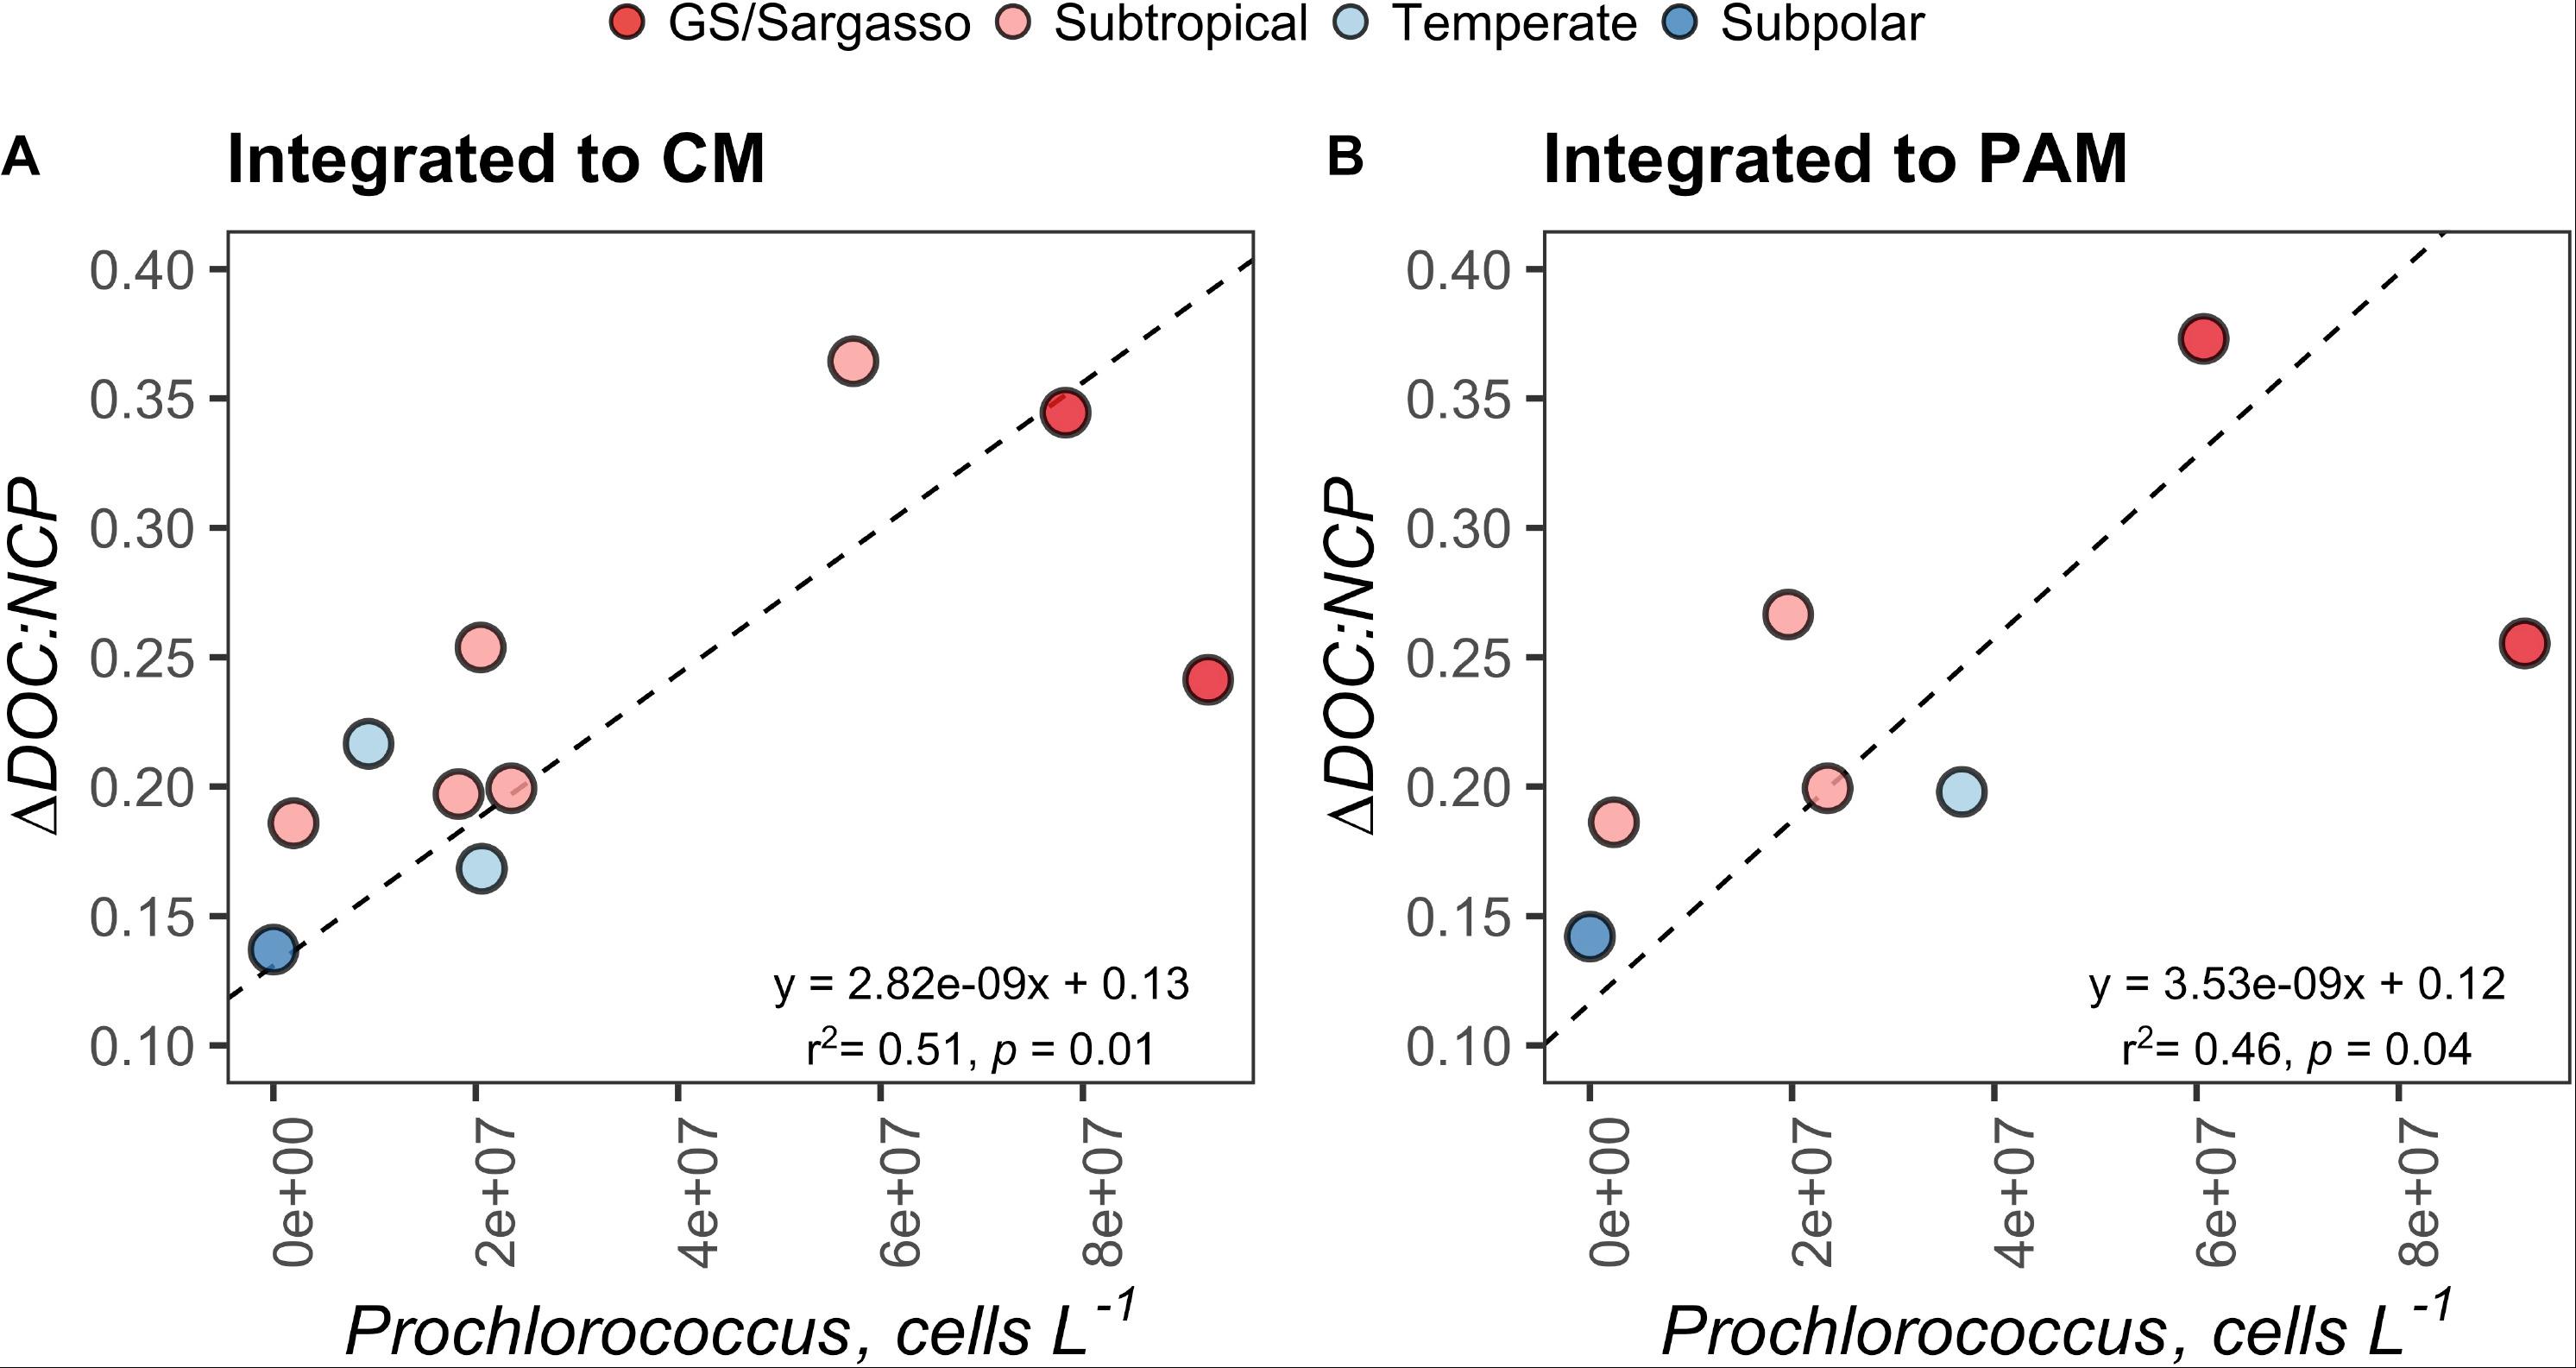
Figure 8. Standard major axis model II regressions comparing the ΔDOC:NCP ratio with the absolute abundance Prochlorococcus, integrated to the chlorophyll maximum (CM) (A) and the phytoplankton abundance maximum (PAM) (B) for each station. Each point represents estimates for a station on the early autumn cruise. Points are filled by the subregional classification of the station as presented in Figure 1.
Discussion
Of the ∼9 Pg C of global annual carbon export to the ocean interior by the biological carbon pump (DeVries and Weber, 2017), approximately 1.27 Pg C are exported in the North Atlantic alone, indicating that the biological carbon pump in the North Atlantic is an important component of the global carbon cycle (Sanders et al., 2014). The biological carbon pump is driven by a complex set of processes, including a passive sinking flux of organic particles (McCave, 1975), an active transport of organic carbon and CO2 by vertically migrating zooplankton (Steinberg et al., 2000), and the physical transport of dissolved and suspended organic matter by subduction and convective mixing (Carlson et al., 1994; Hansell et al., 2009; Dall’Olmo et al., 2016). To predict changes in the North Atlantic biological carbon pump under different climate scenarios, it is necessary to reduce the uncertainties in the magnitude and contribution of these different pathways (Sanders et al., 2014; Siegel et al., 2016).
Although contributions by passive fluxes and vertical migrating organisms to carbon export can be obtained on individual research campaigns, assessing the contribution of the vertical redistribution of POCs and DOC, respectively, to carbon export requires an understanding of the interplay between the seasonal net production of POCs and DOC and the extent of physical convective mixing at any given location. By combining ARGO float data with satellite estimates of POC, one study demonstrated that the seasonal accumulation and physical removal of total POC in the North Atlantic could account for 23 to >100% of the carbon export flux into the mesopelagic (Dall’Olmo et al., 2016). Applying this approach to estimate the contribution of DOC to vertical carbon export would be difficult without a remote-sensing proxy for the bulk DOC pool in the open ocean. Direct measurements of DOC at regular temporal intervals over numerous annual cycles at time-series study sites is arguably the most powerful approach to resolving the contribution of DOC to vertical carbon export (Copin-Montégut and Avril, 1993; Carlson et al., 1994; Bøsrheim and Myklestad, 1997; Hansell and Carlson, 2001). This approach, however, is only feasible at a limited number of locations.
Constraints on Post-convection Conditions Challenges Estimations of ΔDOC and NCP
Studies that make direct DOC measurements at the time of deep convection and during stratified periods (i.e., post-bloom) can provide estimates of seasonal DOC accumulations (ΔDOC). Concomitant measurements of TCO2, inorganic nutrients, or oxygen between those periods permit estimates of NCP (Codispoti et al., 1986; Hansell et al., 1993; Bates et al., 1998; Plant et al., 2016). Combining the corresponding ΔDOC and NCP estimates provides insight into how much of NCP becomes seasonally accumulated DOC (ΔDOC:NCP), thereby providing constraints on estimates of vertical DOC export potential (Hansell and Carlson, 1998; Carlson et al., 2000; Sweeney et al., 2000; Hansell and Carlson, 2001). A major challenge to estimating ΔDOC:NCP is being able to capture direct measures of DOC and inorganic nutrients at the time of deep mixing when their respective concentrations are homogenously distributed throughout the deep mixed layer. Measures of DOC and inorganic nutrient profiles during both seasonally vertically stratified and maximally mixed conditions allow for the calculation of net DOC production from NO3 drawdown (estimates of NCP). However, capturing maximal deep convective mixing events is difficult at best.
In the absence of direct measurements, previous studies have defined criteria to predict pre-bloom nutrient and surface DOC concentrations. In their study of upwelling-driven phytoplankton blooms in the northwestern portion of the Santa Barbara Channel, California, Wear et al. (2015a) used nutrient and salinity fields to characterize recently upwelled water at 5 m and then identified waters meeting those nutrient and salinity conditions as “pre-bloom” source waters, reflective of initial mixed conditions. DOC values in these source waters were used as background concentrations from which ΔDOC values were calculated. In Romera-Castillo et al. (2016), the authors applied a representative ΔDOC:NCP value derived from cruise-based estimates to climatological nitrate data to model ΔDOC throughout the Atlantic. They calculated ΔDOC and NCP as the difference in DOC and nitrate concentrations, respectively, between the surface and underlying source waters, which varied with latitude. In the North Atlantic, mixed condition values for DOC and nitrate concentrations were taken from 200 m with the reasoning that winter vertical mixing commonly reaches that depth. Here, we used ARGO float observations to retrieve the maximum MLDs measured in 1° latitudinal bins in the NAAMES study region (Figure 1 and Table 1). We then redistributed early autumn stratified DOC and NO3 profiles over their corresponding local maximum MLD to estimate DOC Mixed and NO3 Mixed concentrations (Figure 3), allowing estimations of ΔDOC and NCP at occupied stations.
Leveraging ARGO Datasets Empower Analysts to Simulate Pre-bloom Conditions
With a current global fleet of over 3900 autonomous floats, the ARGO program has made great contributions to improving our understanding of physical and biogeochemical variability in the oceans (Riser et al., 2016; Claustre et al., 2020). Probing the rich dataset generated by these floats can provide reasonable estimates of annual maximum MLDs across expansive areas of the ocean at 1° latitudinal resolution (Figure 1 and Table 1). These estimates of annual maximum MLDs can then be used to simulate the redistribution of DOC and nitrate profiles observed during the early autumn stratified periods and allow approximate reconstructions of the mixed profiles for each variable (Figure 3). Combining ARGO data collected in the NAAMES region with profiles collected during the early autumn stratified period, we were able to estimate mixed DOC and nutrient concentrations in the absence of direct measurements.
As these estimates were the foundation for calculating approximate ΔDOC, its contribution to NCP, and potential DOC export flux in western North Atlantic (Tables 2, 3 and Figure 3), we sought to compare them to wintertime (January to March) data from two publicly available data products, the Global Ocean Data Analysis Project version 2 2019 (Gv2_2019) and the World Ocean Atlas 18 (WOA18) (see analyses in Supplementary Material). Unfortunately, these two data products contained limited wintertime data for the NAAMES study region and the available data displayed relatively shallow winter MLDs compared to our maximum MLD estimates. For these reasons, using Gv2_2019 and WOA18 data to constrain the conditions under deep convection for the NAAMES region was problematic and made comparisons with this study’s data equivocal. However, interrogating these publicly available data products did underscore the difficulty in defining the magnitude and conditions of deep mixing for the western North Atlantic, even with extensive, historical datasets. Data from the ARGO program, as used in this study, can help to hone estimates of the maximal extent of deep convective mixing, critical to constraining ΔDOC, its contribution to NCP, and potential DOC export flux. However, this is not an infallible approach either.
Our approach to capturing deep convective mixing over a wide range of latitudes at 1° resolution using ARGO float data can also be limited by sampling resolution (i.e. number of floats, profiling frequency). While the float data for most of the latitudinal bins in the NAAMES region contain mixing estimates deeper than 200 m (Table 1 and Figure 2), it is possible that the ARGO floats missed deeper mixing events at or near our station locations, leading to underestimates of local deep mixing. However, the ARGO-based maximum mixed layer depths presented here are deeper than the winter mixed layer depths from the Gv2_2019 and WOA18 data products, from wintertime ARGO climatological data, as well as those observed on the late autumn NAAMES campaign [i.e., closest campaign to the timing of deep convection (November 2015)] (see analyses in Supplementary Material and Supplementary Figure S13). Regardless, the derived variables (i.e. ΔDOC, NCP, and vertical DOC export) presented here are realistically constrained but should be considered conservative estimates. Other caveats with the approach have been noted in previous studies that have calculated NCP from nutrient deficits and are summarized below.
Caveats Limit Approximations of NCP From Nitrate Drawdown
NCP derived from nitrate drawdown is taken as an approximation of new production, that is, the net production utilizing inorganic nitrogen provided from outside sources such as deep mixing and/or upwelling (Dugdale and Goering, 1967). This approximation ignores the contributions of new nitrogen from atmospheric deposition, river inputs, and nitrogen fixation, which may lead to underestimates of NCP. Recent convergent estimates from an inverse biogeochemical and a prognostic ocean model suggest that the input of newly fixed nitrogen from microbial fixation, atmospheric deposition, and river fluxes can account for up to 10% of carbon export in the NAAMES region (Wang et al., 2019). In addition, nitrification within the surface layer can lead to overestimates of new production (Santoro et al., 2010). Though direct measures of nitrification rates are scarce, previous studies have demonstrated that nitrification can be an insignificant source of nitrate in the surface layer of the subarctic North Atlantic and the Sargasso Sea (Fawcett et al., 2015; Peng et al., 2018). The approach used here does not allow us to constrain the contributions of new nitrogen from the processes described above, thus nitrate drawdown was our best approximation of NCP.
Redfield stoichiometry (C:N = 6.6) is commonly used to convert nitrate drawdown to NCP in carbon units (Hansell et al., 1993; Yager et al., 1995; Romera-Castillo et al., 2016; Bif and Hansell, 2019). We recognize that DOM production and accumulation in the surface layer can be C-rich relative to Redfield stoichiometry, having C:N ratios ranging from 12 to 15 in surface waters (Williams, 1995; Hansell and Carlson, 2001; Hopkinson and Vallino, 2005), and that these values may change over the course of a phytoplankton bloom (Sambrotto et al., 1993; Bury et al., 2001; Körtzinger et al., 2001). Using Redfield stoichiometry to convert NO3 drawdown to NCP may underestimate true NCP if a significant fraction of organic matter production was C-rich relative to Redfield stoichiometry, ultimately leading to slight overestimates of ΔDOC:NCP. While Laws (1991) argues that applying the Redfield ratio to seasonal nitrate drawdown can underestimate NCP by as much as 15–30%, other studies have demonstrated that the seasonal drawdown of TCO2 relative to NO3 drawdown is close to 6.6 in some high latitude systems (Yager et al., 1995; Bates et al., 1998). Thus, employing Redfield stoichiometry is a useful approach when comparing ΔDOC:NCP with previously published studies.
ΔDOC:NCP Linked to Ecosystem State
The range of ΔDOC:NCP reported here is comparable to those previously reported from a variety of locations in the North Atlantic under different ecological states and NCP magnitudes (Hansell and Carlson, 1998; Romera-Castillo et al., 2016 and the references therein). ΔDOC:NCP increased from late spring to early autumn and vertical DOC export increased as seasonal NCP increased into the early autumn (Tables 2, 3 and Figures 5, 6). This may reflect changes in both ecosystem state (i.e., nutrient availability) and plankton community composition (Hansell and Carlson, 1998; Carlson et al., 2000). Differences in predominant phytoplankton community members might lead to differences in the magnitude of DOM accumulation, perhaps due to differences in the quantity and quality of the DOM produced (Conan et al., 2007). We observed a seasonal progression in the partitioning of NCP into ΔDOC, with ΔDOC:NCP increasing between the late spring and early autumn (Figure 5). This finding is consistent with previous bloom observations in the Ross Sea (Carlson and Hansell, 2003). Prior studies have shown phytoplankton bloom progression is coincident with increases in DOC production and accumulation, which could be in part due to nutrient limitation (Duursma, 1963; Ittekkot et al., 1981; Eberlein et al., 1985; Billen and Fontigny, 1987; Carlson et al., 1994; Williams, 1995; Wear et al., 2015a), but these relationships are not universal (Carlson et al., 1998). While some studies have demonstrated increases in DOC concentrations with increases in Phaeocystis primary production and biomass (Eberlein et al., 1985; Billen and Fontigny, 1987), Carlson et al. (1998) observed little change in the bulk DOC pool during the early phase of an Antarctic Phaeocystis bloom. The authors reported low total DOC production (0.44 mol C m–2) in the Antarctic relative to the oligotrophic Sargasso Sea (1.7 mol C m–2). Also, the authors observed that while ∼50% of the newly produced DOC in the Sargasso Sea escaped microbial consumption and instead accumulated as ΔDOC, only ∼28% accumulated as ΔDOC in the Antarctic, indicating that newly produced DOC in the Antarctic was largely bioavailable to the extant heterotrophic microbial community and was largely removed prior to deep convective mixing. These observations led to the hypothesis that the low seasonal production of DOC and its high bioavailability in the Ross Sea may have been tied to the size structure and composition of the phytoplankton community there.
Blooms of large eukaryotic phytoplankton relative to picophytoplankton may reflect conditions that favor the production of more bioavailable DOC that has a low potential to accumulate as ΔDOC (Carlson et al., 1998). Wear et al. (2015a, b) demonstrated in field and experimental work at a coastal upwelling site that, as diatom dominated blooms transitioned from a nutrient-replete to a Si-stressed state, there were corresponding increases in the fraction of bloom-produced DOC that became bioavailable to heterotrophic bacterioplankton. Comparatively in tropical and subtropical systems, the dominance of picophytoplankton appears to lead to greater DOC accumulation (Carlson et al., 1998; Hansell and Carlson, 1998; Hansell et al., 2009). It is important to emphasize, however, that the relative contribution of a phytoplankton size class does not necessarily dictate the magnitude of ΔDOC and the fractionation of NCP into ΔDOC. Rather, their relative abundance may be indicative of the environmental conditions that control the net partitioning of NCP as ΔDOC. For instance, higher ΔDOC:NCP ratios may reflect greater extracellular DOC release from primary production due to differences in cell surface area: volume ratios (Karl et al., 1996). In hydrographically stable conditions, elevated ΔDOC:NCP ratios may reflect the increased transformation of labile DOM to more recalcitrant compounds due to nutrient limitation of heterotrophic bacterioplankton production, physical separation of bacterioplankton assemblages capable of using recalcitrant DOM, or further transformation by phototransformation (Cotner et al., 1997; Kieber et al., 1997; Benner and Biddanda, 1998; Jiao et al., 2010). Conversely, cell physiological stress in response to physical mixing may also lead to the increased production of DOC, resulting in higher ΔDOC:NCP ratios (Hansell and Carlson, 1998).
The contribution of larger phytoplankton, like Phaeocystis and diatoms, may also illuminate what conditions drive NCP partitioning. For example, the larger contribution of Phaeocystis relative to picoeukaryotes observed by Carlson et al. (1998) may reflect conditions that favor the production of more bioavailable DOC that has a low potential to accumulate as ΔDOC. In support of this, the authors noted that the increased production of bioavailable DOC in silicate-limited conditions may be an adaptive strategy by diatoms to promote heterotrophic remineralization of dead diatom frustules to dissolved silicate. Thus, in waters where silicate drawdown exceeded nitrate drawdown, we may infer that they were not only occupied by silicifying phytoplankton like diatoms but also that those phytoplankton may have become Si-limited over time, producing bioavailable DOC inconsequential to carbon accumulation and vertical export. Indeed, the ratios of nutrient deficits, particularly ΔSiO4 and ΔNO3, and NCP have been used to provide a broad signature of the composition of the community that may have been responsible for NCP and ΔDOC (Sweeney et al., 2000; Carlson and Hansell, 2003). With knowledge of either or both phytoplankton community composition and signatures of nutrient limitation, we can glean the environmental conditions that control the partitioning of NCP into ΔDOC.
ΔDOC:NCP and Vertical DOC Export Reflect Conditions Favoring Non-Siliceous Phytoplankton
To determine whether linkages could be made between the observed partitioning of NCP and distinct ecosystem states, we explored the relationships between ΔDOC:NCP, ΔSiO4:ΔNO3, and distinct phytoplankton groups along the NAAMES meridional transect. Because the North Atlantic spring bloom has been associated with diatoms and the depletion of silicate relative to nitrate (Sieracki et al., 1993), we expected elevated ΔSiO4:ΔNO3 ratios where diatom blooms might disproportionately contribute to NCP. However, because DOC produced by diatoms has been shown to be characterized by high bioavailability under Si-stress (Wear et al., 2015b), we also expected that in locations with elevated ΔSiO4:ΔNO3, ΔDOC would be low. We found that ΔSiO4:ΔNO3 increased at the higher latitudes, suggesting a higher frequency or magnitude of blooms by silicifying phytoplankton like diatoms in the northern section of the NAAMES region (Figure 7). However, the model regression between ΔSiO4:ΔNO3 and latitude was heteroskedastic, suggesting that latitude alone is not a good predictor for silicate versus nitrate drawdown. ΔSiO4:ΔNO3 ranged from 0.36 to 0.70, indicating that phytoplankton communities comprised of siliceous phytoplankton like diatoms or other siliceous phytoplankton like silicoflagellates were responsible for 36–70% of SiO4 and NO3 drawdown. The ratio displayed a strong and highly significant inverse relationship with ΔDOC:NCP (Figure 7), consistent with previous field and culture reports (Wear et al., 2015a, b). An alternate interpretation is that the inverse relationship between ΔSiO4:ΔNO3 and ΔDOC:NCP indicates when Si drawdown is low and where the phytoplankton community is dominated by functional groups other than siliceous phytoplankton (e.g., picoeukaryotes and cyanobacteria) there is a larger partitioning of NCP into ΔDOC.
We did not find significant relationships between ΔDOC:NCP and the abundance of Synechococcus or nanoeukaryotes (3 to ∼10 μm) (Supplementary Table S2). However, we did find that the abundance of Prochlorococcus was a moderate to strong indicator of ΔDOC:NCP and DOC accumulation within both the depth horizons of the chlorophyll and PAMs (Figure 8). This relationship, in combination with those of the nutrient deficits aforementioned, is intriguing. Together, they suggest that in stratified waters with a higher presence of Prochlorococcus, DOC accumulation and ΔDOC:NCP are elevated.
It is not clear in our study if elevated Prochlorococcus concentrations lead to the direct production of recalcitrant DOC or if the group simply represents an environmental indicator of other physical and/or food web interactions that result in ΔDOC. It has been proposed that Prochlorococcus may disproportionally contribute to the enhanced concentrations and long-term stability of DOC in the oligotrophic ocean (Braakman et al., 2017). The correlations between elevated Prochlorococcus, reduced ΔSiO4:ΔNO3, increased DOC accumulation, and increased ΔDOC:NCP reported here is consistent with this hypothesis. The linkages made here may be important to understand the specific mechanisms that drive the partitioning of NCP and the accumulation of ΔDOC and would benefit from future experimental work targeting the role of Prochlorococcus in these processes.
DOC Is an Important Vertical Export Term in Temperate and Subtropical Western North Atlantic
In this study, we have estimated that 20 ± 6% NCP accumulated as ΔDOC by early autumn in the western North Atlantic region occupied by NAAMES (Table 2). Applying this estimate to a climatological model like that of Romera-Castillo et al. (2016) may help constrain estimates of ΔDOC throughout the western North Atlantic at a higher resolution. An annual DOC export of 0.34–1.15 mol C m–2 (mean 0.77 mol C m–2) out of the surface 100 m indicates that physical mixing of DOC is an important component of the biological carbon pump for this portion of the North Atlantic. Because the ARGO floats used here may not have captured the deepest local mixing event at any given station location, our estimates of annual ΔDOC are considered conservative. Similar to previous studies, we calculate ΔDOC in the surface 100 m to be equivalent to vertical DOC export (Hansell and Carlson, 2001; Romera-Castillo et al., 2016; Bif and Hansell, 2019). However, a fraction of ΔDOC could be laterally transported and/or remineralized by heterotrophic bacterioplankton, thus becoming unavailable to downward mixing by convective overturn. We may further constrain our estimates of DOC export by distinguishing horizontal from vertical transport and also accounting for the bioavailable fraction of DOC that is rapidly remineralized by microorganisms (Copin-Montégut and Avril, 1993; Carlson et al., 1994; Bøsrheim and Myklestad, 1997). DOC bioavailability and its impact on vertical DOC export for the NAAMES study region will be discussed in a subsequent manuscript. Finally, our data suggest that in conditions resulting in low Si-drawdown, Prochlorococcus or the conditions they reflect may play a significant role in the accumulation of annual ΔDOC and the partitioning of NCP, providing a framework for future investigations of the mechanisms driving these processes.
Data Availability Statement
The shipboard data generated for this study are publicly available in the NASA SeaWiFS Bio-optical Archive and Storage System (SeaBASS, https://seabass.gsfc.nasa.gov/naames). The ARGO float data used for this study are available on the NAAMES data page (https://naames.larc.nasa.gov/data2018.html). All processed data, code, and analyses are available on GitHub (https://github.com/nbaetge/naames_export_ms).
Author Contributions
This manuscript, containing only original data, has not been published elsewhere. NB and CC conceived of the study, experimental design, and collected the samples. NB analyzed the data. All authors assisted with data reduction and contributed to the revision and editing of the final manuscript. All authors are aware of and accept responsibility for this manuscript and have approved the final submitted manuscript.
Funding
This project was supported by the National Science Foundation (Award NSF OCE-157943) and the National Aeronautics and Space Administration (Awards 80NSSC18K0437 and NNX15AAF30G). The overall NAAMES project was funded under the second selection of the NASA Earth Venture Sub-Orbital Program (EVS-2).
Conflict of Interest
The authors declare that the research was conducted in the absence of any commercial or financial relationships that could be construed as a potential conflict of interest.
Acknowledgments
We thank the entire NAAMES team, who have become family, and the Captains, officers, crews, and marine technicians of the R/V Atlantis for their outstanding support. We thank Keri Opalk and Elisa Halewood for DOC sample processing and logistical support. This manuscript was greatly improved with helpful discussions and suggestions by Dave Siegel, Mark Brzezinski, Shuting Liu, Brandon Stephens, Anna James, Jacqui Comstock, Tim DeVries, Dylan Catlett, and the two peer reviewers. This manuscript also benefited from discussions with members of the JETZON (Joint Exploration of the Twilight Zone Ocean Network) community.
Supplementary Material
The Supplementary Material for this article can be found online at: https://www.frontiersin.org/articles/10.3389/fmars.2020.00227/full#supplementary-material
Footnotes
References
Aluwihare, L. I., Repeta, D. J., and Chen, R. F. (1997). A major biopolymeric component to dissolved organic carbon in surface sea water. Nature 387:166. doi: 10.1038/387166a0
Bates, N. R., Hansell, D. A., Carlson, C. A., and Gordon, L. I. (1998). Distribution of CO2 species, estimates of net community production, and air-sea CO2 exchange in the Ross Sea polynya. J. Geophys. Res. Oceans 103, 2883–2896. doi: 10.1029/97JC02473
Behrenfeld, M. J. (2010). Abandoning Sverdrup’s critical depth hypothesis on phytoplankton blooms. Ecology 91, 977–989. doi: 10.1890/09-1207.1
Behrenfeld, M. J., and Boss, E. S. (2018). Student’s tutorial on bloom hypotheses in the context of phytoplankton annual cycles. Glob. Change Biol. 24, 55–77. doi: 10.1111/gcb.13858
Behrenfeld, M. J., Moore, R. H., Hostetler, C. A., Graff, J., Gaube, P., Russell, L. M., et al. (2019). The north atlantic aerosol and marine ecosystem study (NAAMES): science motive and mission overview. Front. Mar. Sci. 6:122. doi: 10.3389/fmars.2019.00122
Benner, R., and Biddanda, B. (1998). Photochemical transformations of surface and deep marine dissolved organic matter: effects on bacterial growth. Limnol. Oceanogr. 43, 1373–1378. doi: 10.4319/lo.1998.43.6.1373
Bif, M. B., and Hansell, D. A. (2019). Seasonality of dissolved organic carbon in the upper northeast pacific ocean. Glob. Biogeochem. Cycles 33, 526–536. doi: 10.1029/2018GB006152
Billen, G., and Fontigny, A. (1987). Dynamics of a phaeocystis-dominated spring bloom in Belgian coastal waters. II. Bacterioplankton dynamics. Mar. Ecol. Prog. Ser. 37, 249–257. doi: 10.3354/meps037249
Bøsrheim, K. Y., and Myklestad, S. M. (1997). Dynamics of DOC in the norwegian Sea inferred from monthly profiles collected during 3 years at 66°N, 2°E. Deep Sea Res. Part I Oceanogr. Res. Pap. 44, 593–601. doi: 10.1016/S0967-0637(96)001069
Braakman, R., Follows, M. J., and Chisholm, S. W. (2017). Metabolic evolution and the self-organization of ecosystems. Proc. Natl. Acad. Sci. U.S.A. 114, E3091–E3100. doi: 10.1073/pnas.1619573114
Bury, S. J., Boyd, P. W., Preston, T., Savidge, G., and Owens, N. J. P. (2001). Size-fractionated primary production and nitrogen uptake during a North Atlantic phytoplankton bloom: implications for carbon export estimates. Deep Sea Res. Part I Oceanogr. Res. Pap. 48, 689–720. doi: 10.1016/S0967-0637(00)00066-2
Carlson, C. A., Ducklow, H. W., Hansell, D. A., and Smith, W. O. (1998). Organic carbon partitioning during spring phytoplankton blooms in the Ross Sea polynya and the Sargasso Sea. Limnol. Oceanogr. 43, 375–386. doi: 10.4319/lo.1998.43.3.0375
Carlson, C. A., Ducklow, H. W., and Michaels, A. F. (1994). Annual flux of dissolved organic carbon from the euphotic zone in the northwestern Sargasso Sea. Nature 371, 405–408. doi: 10.1038/371405a0
Carlson, C. A., Giovannoni, S. J., Hansell, D. A., Goldberg, S. J., Parsons, R., and Vergin, K. (2004). Interactions among dissolved organic carbon, microbial processes, and community structure in the mesopelagic zone of the northwestern Sargasso Sea. Limnol. Oceanogr. 49, 1073–1083. doi: 10.4319/lo.2004.49.4.1073
Carlson, C. A., and Hansell, D. A. (2003). The contribution of dissolved organic carbon and nitrogen to the biogeochemistry of the Ross Sea. Biogeochem. Ross Sea 78, 123–142. doi: 10.1029/078ars08
Carlson, C. A., and Hansell, D. A. (2015). “DOM sources, sinks, reactivity, and budgets,” in Biogeochemistry of Marine Dissolved Organic Matter, 2nd Edn, eds D. A. Hansell and C. A. Carlson (Boston, MA: Academic Press), 65–126. doi: 10.1016/B978-0-12-405940-5.00003-0
Carlson, C. A., Hansell, D. A., Nelson, N. B., Siegel, D. A., Smethie, W. M., Khatiwala, S., et al. (2010). Dissolved organic carbon export and subsequent remineralization in the mesopelagic and bathypelagic realms of the North Atlantic basin. Deep Sea Res. Part II Top. Stud. Oceanogr. 57, 1433–1445. doi: 10.1016/j.dsr2.2010.02.013
Carlson, C. A., Hansell, D. A., Peltzer, E. T., and Smith, W. O. (2000). Stocks and dynamics of dissolved and particulate organic matter in the southern Ross Sea, Antarctica. Deep Sea Res. Part II Top. Stud. Oceanogr. 47, 3201–3225. doi: 10.1016/s0967-0645(00)00065-5
Carlson, C. A., Hansell, D. A., and Tamburini, C. (2011). DOC persistence and its fate after export within the ocean interior. Microb. Carbon Pump in the Ocean 2011, 57–59.
Claustre, H., Johnson, K. S., and Takeshita, Y. (2020). Observing the global ocean with biogeochemical-argo. Annu. Rev. Mar. Sci. 12, 23–48. doi: 10.1146/annurev-marine-010419-010956
Codispoti, L. A., Friederich, G. E., and Hood, D. W. (1986). Variability in the inorganic carbon system over the southeastern Bering Sea shelf during spring 1980 and spring—summer 1981. Cont. Shelf Res. 5, 133–160. doi: 10.1016/0278-4343(86)90013-0
Conan, P., Søndergaard, M., Kragh, T., Thingstad, F., Pujo-Pay, M., Williams, P. J. le B., et al. (2007). Partitioning of organic production in marine plankton communities: the effects of inorganic nutrient ratios and community composition on new dissolved organic matter. Limnol. Oceanogr. 52, 753–765. doi: 10.4319/lo.2007.52.2.0753
Copin-Montégut, G., and Avril, B. (1993). Vertical distribution and temporal variation of dissolved organic carbon in the North-Western Mediterranean Sea. Deep Sea Res. Part Oceanogr. Res. Pap. 40, 1963–1972. doi: 10.1016/0967-0637(93)90041-Z
Cotner, J. B., Ammerman, J. W., Peele, E. R., and Bentzen, E. (1997). Phosphorus-limited bacterioplankton growth in the Sargasso Sea. Aquat. Microb. Ecol. 13, 141–149. doi: 10.3354/ame013141
Dall’Olmo, G., Dingle, J., Polimene, L., Brewin, R. J. W., and Claustre, H. (2016). Substantial energy input to the mesopelagic ecosystem from the seasonal mixed-layer pump. Nat. Geosci. 9, 820–823. doi: 10.1038/ngeo2818
Della Penna, A., and Gaube, P. (2019). Overview of (Sub) mesoscale ocean dynamics for the NAAMES field program. Front. Mar. Sci. 6:384. doi: 10.3389/fmars.2019.00384
DeLong, E. F. (2006). Community genomics among stratified microbial assemblages in the ocean’s interior. Science 311, 496–503. doi: 10.1126/science.1120250
DeVries, T., and Weber, T. (2017). The export and fate of organic matter in the ocean: New constraints from combining satellite and oceanographic tracer observations: EXPORT AND FATE OF MARINE ORGANIC MATTER. Glob. Biogeochem. Cycles 31, 535–555. doi: 10.1002/2016GB005551
Dugdale, R. C., and Goering, J. J. (1967). Uptake of new and regenerated forms of nitrogen in primary productivity1: uptake of nitrogen in primary productivity. Limnol. Oceanogr. 12, 196–206. doi: 10.4319/lo.1967.12.2.0196
Duursma, E. K. (1963). The production of dissolved organic matter in the sea, as related to the primary gross production of organic matter. Neth. J. Sea Res. 2, 85–94. doi: 10.1016/0077-7579(63)90007-3
Eberlein, K., Leal, M. T., Hammer, K. D., and Hickel, W. (1985). Dissolved organic substances during a Phaeocystis pouchetii bloom in the German Bight (North Sea). Mar. Biol. 89, 311–316. doi: 10.1007/BF00393665
Falkowski, P. G. (1998). Biogeochemical controls and feedbacks on ocean primary production. Science 281, 200–206. doi: 10.1126/science.281.5374.200
Fawcett, S. E., Ward, B. B., Lomas, M. W., and Sigman, D. M. (2015). Vertical decoupling of nitrate assimilation and nitrification in the Sargasso Sea. Deep Sea Res. Part Oceanogr. Res. Pap. 103, 64–72. doi: 10.1016/j.dsr.2015.05.004
Graff, J. R., and Behrenfeld, M. J. (2018). Photoacclimation responses in subarctic atlantic phytoplankton following a natural mixing-restratification event. Front. Mar. Sci. 5:209. doi: 10.3389/fmars.2018.00209
Gruber, D. F., Simjouw, J.-P., Seitzinger, S. P., and Taghon, G. L. (2006). Dynamics and characterization of refractory dissolved organic matter produced by a pure bacterial culture in an experimental predator-prey system. Appl. Environ. Microbiol. 72, 4184–4191. doi: 10.1128/aem.02882-05
Halewood, E., Carlson, C., Brzezinski, M., Reed, D., and Goodman, J. (2012). Annual cycle of organic matter partitioning and its availability to bacteria across the Santa Barbara Channel continental shelf. Aquat. Microb. Ecol. 67, 189–209. doi: 10.3354/ame01586
Hansell, D. A. (2005). Dissolved organic carbon reference material program. Eos Trans. Am. Geophys. Union 86:318. doi: 10.1029/2005EO350003
Hansell, D. A., and Carlson, C. A. (1998). Net community production of dissolved organic carbon. Glob. Biogeochem. Cycles 12, 443–453. doi: 10.1029/98GB01928
Hansell, D. A., and Carlson, C. A. (2001). Biogeochemistry of total organic carbon and nitrogen in the Sargasso Sea: control by convective overturn. Deep Sea Res. Part II Top. Stud. Oceanogr. 48, 1649–1667. doi: 10.1016/S0967-0645(00)00153-3
Hansell, D. A., Carlson, C. A., Bates, N. R., and Poisson, A. (1997). Horizontal and vertical removal of organic carbon in the equatorial Pacific Ocean: a mass balance assessment. Deep Sea Res. Part II Top. Stud. Oceanogr. 44, 2115–2130. doi: 10.1016/S0967-0645(97)00021-0
Hansell, D. A., Carlson, C. A., Repeta, D. J., and Schlitzer, R. (2009). Dissolved organic matter in the ocean: a controversy stimulates new insights. Oceanography 22, 202–211. doi: 10.5670/oceanog.2009.109
Hansell, D. A., Carlson, C. A., and Schlitzer, R. (2012). Net removal of major marine dissolved organic carbon fractions in the subsurface ocean: removal of exported doc. Glob. Biogeochem. Cycles 26:GB1016. doi: 10.1029/2011GB004069
Hansell, D. A., Whitledge, T. E., and Goering, J. J. (1993). Patterns of nitrate utilization and new production over the Bering-Chukchi shelf. Cont. Shelf Res. 13, 601–627. doi: 10.1016/0278-4343(93)90096-G
Hopkinson, C. S., and Vallino, J. J. (2005). Efficient export of carbon to the deep ocean through dissolved organic matter. Nature 433, 142–145. doi: 10.1038/nature03191
Ittekkot, V., Brockmann, U., Michaelis, W., and Degens, E. T. (1981). Dissolved free and combined carbohydrates during a phytoplankton bloom in the northern North Sea. Mar. Ecol. Prog. Ser. 4, 299–305. doi: 10.3354/meps004299
Jiao, N., Herndl, G. J., Hansell, D. A., Benner, R., Kattner, G., Wilhelm, S. W., et al. (2010). Microbial production of recalcitrant dissolved organic matter: long-term carbon storage in the global ocean. Nat. Rev. Microbiol. 8, 593–599. doi: 10.1038/nrmicro2386
Karl, D. M., Christian, J. R., Dore, J. E., and Letelier, R. M. (1996). Microbiological oceanography in the region west of the Antarctic Peninsula: microbial dynamics, nitrogen cycle and carbon flux. Antarct. Res. Ser. 70, 303–332. doi: 10.1029/ar070p0303
Kieber, R. J., Hydro, L. H., and Seaton, P. J. (1997). Photooxidation of triglycerides and fatty acids in seawater: Implication toward the formation of marine humic substances. Limnol. Oceanogr. 42, 1454–1462. doi: 10.4319/lo.1997.42.6.1454
Körtzinger, A., Koeve, W., Kähler, P., and Mintrop, L. (2001). C:N ratios in the mixed layer during the productive season in the northeast Atlantic Ocean. Deep Sea Res. Part Oceanogr. Res. Pap. 48, 661–688. doi: 10.1016/S0967-0637(00)00051-0
Laws, E. A. (1991). Photosynthetic quotients, new production and net community production in the open ocean. Deep Sea Res. Part I Oceanogr. Res. Pap. 38, 143–167. doi: 10.1016/0198-0149(91)90059-o
Lochte, K., Ducklow, H. W., Fasham, M. J. R., and Stienen, C. (1993). Plankton succession and carbon cycling at 47 N 20 W during the JGOFS North Atlantic Bloom Experiment. Deep Sea Res. Part II Top. Stud. Oceanogr. 40, 91–114. doi: 10.1016/0967-0645(93)90008-b
McCave, I. N. (1975). Vertical flux of particles in the ocean. Deep Sea Res. Oceanogr. Abstr. 22, 491–502. doi: 10.1016/0011-7471(75)90022-4
Morris, R. M., Vergin, K. L., Cho, J.-C., Rappé, M. S., Carlson, C. A., and Giovannoni, S. J. (2005). Temporal and spatial response of bacterioplankton lineages to annual convective overturn at the Bermuda Atlantic Time-series Study site. Limnol. Oceanogr. 50, 1687–1696. doi: 10.4319/lo.2005.50.5.1687
Ogawa, H. (2001). Production of refractory dissolved organic matter by bacteria. Science 292, 917–920. doi: 10.1126/science.1057627
Peng, X., Fawcett, S. E., van Oostende, N., Wolf, M. J., Marconi, D., Sigman, D. M., et al. (2018). Nitrogen uptake and nitrification in the subarctic North Atlantic Ocean: N uptake and nitrification in subarctic Atlantic. Limnol. Oceanogr. 63, 1462–1487. doi: 10.1002/lno.10784
Plant, J. N., Johnson, K. S., Sakamoto, C. M., Jannasch, H. W., Coletti, L. J., Riser, S. C., et al. (2016). Net community production at Ocean Station Papa observed with nitrate and oxygen sensors on profiling floats: NCP AT OCEAN STATION PAPA. Glob. Biogeochem. Cycles 30, 859–879. doi: 10.1002/2015GB005349
Redfield, A. C. (1958). The biological control of the chemical factors in the environment. Am. Sci. 46, 205–221.
Riser, S. C., Freeland, H. J., Roemmich, D., Wijffels, S., Troisi, A., Belbéoch, M., et al. (2016). Fifteen years of ocean observations with the global Argo array. Nat. Clim. Change 6:145.
Romera-Castillo, C., Letscher, R. T., and Hansell, D. A. (2016). New nutrients exert fundamental control on dissolved organic carbon accumulation in the surface Atlantic Ocean. Proc. Natl. Acad. Sci. U.S.A. 113, 10497–10502. doi: 10.1073/pnas.1605344113
Sambrotto, R. N., Savidge, G., Robinson, C., Boyd, P., Takahashi, T., Karl, D. M., et al. (1993). Elevated consumption of carbon relative to nitrogen in the surface ocean. Nature 363, 248–250. doi: 10.1038/363248a0
Sanders, R., Henson, S. A., Koski, M., De La Rocha, C. L., Painter, S. C., Poulton, A. J., et al. (2014). The biological carbon pump in the north atlantic. Prog. Oceanogr. 129, 200–218. doi: 10.1016/j.pocean.2014.05.005
Santoro, A. E., Casciotti, K. L., and Francis, C. A. (2010). Activity, abundance and diversity of nitrifying archaea and bacteria in the central California Current: Nitrification in the central California Current. Environ. Microbiol. 12, 1989–2006. doi: 10.1111/j.1462-2920.2010.02205.x
Siegel, D. A., Buesseler, K. O., Behrenfeld, M. J., Benitez-Nelson, C. R., Boss, E., Brzezinski, M. A., et al. (2016). Prediction of the export and fate of global ocean net primary production: the EXPORTS science plan. Front. Mar. Sci. 3:22. doi: 10.3389/fmars.2016.00022
Siegel, D. A., McGillicuddy, D. J., and Fields, E. A. (1999). Mesoscale eddies, satellite altimetry, and new production in the Sargasso Sea. J. Geophys. Res. Oceans 104, 13359–13379. doi: 10.1029/1999JC900051
Sieracki, M. E., Verity, P. G., and Stoecker, D. K. (1993). Plankton community response to sequential silicate and nitrate depletion during the 1989 North Atlantic spring bloom. Deep Sea Res. Part II Top. Stud. Oceanogr. 40, 213–225. doi: 10.1016/0967-0645(93)90014-E
Steinberg, D. K., Carlson, C. A., Bates, N. R., Goldthwait, S. A., Madin, L. P., and Michaels, A. F. (2000). Zooplankton vertical migration and the active transport of dissolved organic and inorganic carbon in the Sargasso Sea. Deep Sea Res. Part Oceanogr. Res. Pap. 47, 137–158. doi: 10.1016/s0967-0637(99)00052-7
Sweeney, C., Hansell, D. A., Carlson, C. A., Codispoti, L. A., Gordon, L. I., Marra, J., et al. (2000). Biogeochemical regimes, net community production and carbon export in the Ross Sea, Antarctica. Deep Sea Res. Part II Top. Stud. Oceanogr. 47, 3369–3394. doi: 10.1016/S0967-0645(00)00072-2
Takahashi, T., Olafsson, J., Goddard, J. G., Chipman, D. W., and Sutherland, S. C. (1993). Seasonal variation of CO 2 and nutrients in the high-latitude surface oceans: a comparative study. Glob. Biogeochem. Cycles 7, 843–878. doi: 10.1029/93GB02263
Thingstad, T. F., HagstrÖm, A., and Rassoulzadegan, F. (1997). Accumulation of degradable DOC in surface waters: Is it caused by a malfunctioning microbial loop? Limnol. Oceanogr. 42, 398–404. doi: 10.4319/lo.1997.42.2.0398
Wang, W.-L., Moore, J. K., Martiny, A. C., and Primeau, F. W. (2019). Convergent estimates of marine nitrogen fixation. Nature 566, 205–211. doi: 10.1038/s41586-019-0911-2
Wear, E. K., Carlson, C. A., James, A. K., Brzezinski, M. A., Windecker, L. A., and Nelson, C. E. (2015a). Synchronous shifts in dissolved organic carbon bioavailability and bacterial community responses over the course of an upwelling-driven phytoplankton bloom: bloom-induced shifts in DOC availability. Limnol. Oceanogr. 60, 657–677. doi: 10.1002/lno.10042
Wear, E. K., Carlson, C. A., Windecker, L. A., and Brzezinski, M. A. (2015b). Roles of diatom nutrient stress and species identity in determining the short- and long-term bioavailability of diatom exudates to bacterioplankton. Mar. Chem. 177, 335–348. doi: 10.1016/j.marchem.2015.09.001
Williams, P. J. le B. (1995). Evidence for the seasonal accumulation of carbon-rich dissolved organic material, its scale in comparison with changes in particulate material and the consequential effect on net CN assimilation ratios. Mar. Chem. 51, 17–29. doi: 10.1016/0304-4203(95)00046-T
Keywords: North Atlantic Aerosols and Marine Ecosystems Study, net community production, dissolved organic carbon, ARGO, convective overturn, vertical export, phytoplankton community composition
Citation: Baetge N, Graff JR, Behrenfeld MJ and Carlson CA (2020) Net Community Production, Dissolved Organic Carbon Accumulation, and Vertical Export in the Western North Atlantic. Front. Mar. Sci. 7:227. doi: 10.3389/fmars.2020.00227
Received: 28 November 2019; Accepted: 24 March 2020;
Published: 30 April 2020.
Edited by:
Javier Arístegui, University of Las Palmas de Gran Canaria, SpainReviewed by:
X. Antón Álvarez-Salgado, Spanish National Research Council, SpainChiara Santinelli, Istituto di Biofisica (IBF), Italy
Copyright © 2020 Baetge, Graff, Behrenfeld and Carlson. This is an open-access article distributed under the terms of the Creative Commons Attribution License (CC BY). The use, distribution or reproduction in other forums is permitted, provided the original author(s) and the copyright owner(s) are credited and that the original publication in this journal is cited, in accordance with accepted academic practice. No use, distribution or reproduction is permitted which does not comply with these terms.
*Correspondence: Nicholas Baetge, bmljaG9sYXNiYWV0Z2VAZ21haWwuY29t
†ORCID: Nicholas Baetge, orcid.org/0000-0002-3868-9857; Jason R. Graff, orcid.org/0000-0003-0029-3299; Michael J. Behrenfeld, orcid.org/0000-0003-1330-7098; Craig A. Carlson, orcid.org/0000-0003-2591-5293