 Emma Rocke
 Shunyan Cheung2
 Nicole R. Dames
 Hongbin Liu
 Coleen L. Moloney
- 1Department of Biological Sciences and Marine Research Institute, University of Cape Town, Cape Town, South Africa
- 2Department of Ocean Science, Hong Kong University of Science and Technology, Kowloon, Hong Kong
The microbial communities of the southern Benguela upwelling region were sampled quarterly through 1 year, with sampling for prokaryotes taking place in May, September, November and February, spanning the 2015–2016 upwelling season. Picoeukaryote samples were taken in November and February only. Community dynamics were assessed at stations both inside and outside a typical upwelling site. 16S and 18S rRNA amplicon results, respectively, revealed differences in both bacterioplankton and picoeukaryote communities in both space and time (season). There was a significant difference between sites in picoeukaryote community structure and diversity during the upwelling season in February, but not in November. Prokaryote community structure showed significant changes by water type as well as by sampling time or site. The parasitic dinoflagellate, Syndiniales, dominated February samples, and diatoms (Mediophyceae) mostly occurred in November samples, with nitrate driving community structure. Prokaryote results revealed presence of Nitrosopumillus, an ammonium oxidizer, offshore in February. Nitrospina sp., a nitrite oxidizer, was also present in September in hypoxic and deep water samples. This study reveals significant changes in community variability, leading to shifts within interspecies interactions in this region in response to upwelling events. This has far reaching implications with regard to biogeochemical cycling and ecosystem functioning at the microbial level.
Introduction
The Benguela upwelling is one of four major global eastern boundary upwelling systems (Hutchings et al., 2009). The Southern Benguela is situated on the west coast of South Africa, separated from the Northern Benguela by the powerful Lüderitz upwelling cell at 26°S. The Southern Benguela is characterized by pulsed, seasonal, south-easterly wind-driven coastal upwelling at various coastal points resulting in high primary productivity in coastal waters here. As a result of this high primary productivity, the shelf regions are subject to naturally occurring low-oxygen events inshore (Pitcher et al., 2014). These events are well known for their negative effects on resident fish, crustaceans and benthic invertebrate communities, consequently impacting trophic energy flow (Blamey et al., 2013). Bacteria, however, remain active in low-oxygen water, performing essential functions in the remineralization of organic matter and biogeochemical cycling (Letscher et al., 2015).
Existing research on prokaryotes in upwelling regions has revealed significant links between bacterial production and primary production, emphasizing the important role prokaryotes play in the southern Benguela (Painting et al., 1993), Northwest Indian Ocean (Wiebinga et al., 1997), off Concepcíon in central Chile (Cuevas et al., 2004) and in the Northwest Iberian Peninsula (Prieto et al., 2016). Prieto et al. (2016) in particular revealed how, in the winter months, primary production only responded to nutrient amended waters when heterotrophic bacteria were active. This implies that phytoplankton may rely on some sort of secondary metabolite from bacteria in order to become active.
The pico-sized microbial community (defined in this paper as all prokaryotes and eukaryotes between 0.2 and 3 μm in diameter) can contribute significantly to autotrophic carbon biomass and primary production in the ocean, both from a global perspective (Buitenhuis et al., 2012; Worden et al., 2015) and a more localized one such as the Pacific Ocean (Worden et al., 2004) and the suptropical and tropical NE Atlantic Ocean (Jardillier et al., 2010). High nutrients associated with newly upwelled shelf water typically stimulates high primary production, dominated by diatoms, followed by high bacterial abundance (Montecino et al., 2004; Lamont et al., 2014). An overall reduced biomass tends to be present beyond the shelf edge as upwelled waters age and move offshore. Primary productivity and bacterial abundance decrease in aged upwelled water, due to light and nutrient limitations, and grazing pressure.
Few studies have focused on the microbial composition of plankton communities of the world’s upwelling regions. These include Painting (1989) who also focused on the Southern Benguela, Kerkhof et al. (1999) investigated the North Atlantic just off the New Jersey coast, Suzuki et al. (2001) investigated an upwelling region in Monterey Bay in the NE Pacific and Teira et al. (2009) studied six key bacterial groups in the Northwest Iberian Peninsula coastal upwelling waters. Only a handful of studies have included next generation sequencing techniques, which are capable of describing community diversity and structure in great detail (e.g., Bergen et al., 2015; Aldunate et al., 2018). These studies revealed a high occurrence of Bacteroidetes, Roseobacter, and SAR86 clade of gammaproteobacteria in upwelling waters. Taxonomic data taken from SSU rRNA (small-subunit ribosomal RNA) gene sequences have also revealed patterns in microbial community composition within oxygen deficient environments. Common abundant phyla in low oxygen waters consist of Proteobacteria, Bacteroidetes, Marine group A (previously SAR406 clade), Actinobacteria, and Planctomycetes (Wright et al., 2012). Other taxa accompany these groups, depending on the physical and chemical properties of the site in question. Rather than existing on their own, there is increasing evidence to suggest that groups of microbiota work together within specific niches (Koeppel et al., 2008). More specifically, endemic patterns emerge at the OTU (operational taxonomic unit) level, reinforcing the ecotype model, where genetically interrelated populations demonstrate niche-specific ecological or biogeochemical roles (Koeppel et al., 2008).
The microbial food web in the Southern Benguela is exceptionally variable because of spatial and seasonal variability in the physical environment, which controls nutrient and light availability to surface waters (Boyd and Nelson, 1998; Hutchings et al., 2009). Typically, this coastal upwelling region experiences seasonal upwelling as a consequence of south-easterly winds in spring and summer, with resulting Ekman transport. Plumes of upwelled water move offshore and northwards, eventually mixing with offshore, and aged upwelled waters (Andrews and Hutchings, 1980). Inshore in St Helena Bay, the north flowing Benguela jet current, along with wind stress shear, forms a clockwise circulation. This encourages water retention, and therefore an accumulation of biological material in the bay (Lett et al., 2006).
Previous studies in the Southern Benguela region have measured bacterial biomass during upwelling events. Bacteria and picoeukaryotes tend to peak post upwelling as a result of high dissolved nitrogen and carbon concentrations caused by decaying phytoplankton blooms (Painting, 1989; Moloney et al., 1991; Painting et al., 1993). In St Helena Bay, dinoflagellate blooms typically develop during late summer to early autumn. These blooms accumulate inshore because of down-welling, resulting in episodic hypoxic to anoxic conditions (Pitcher et al., 2014). Such events can have a detrimental effect on commercially important rock lobsters Jasus lalandii, which have been forced out the water and stranded inshore due to low oxygen conditions resulting from these blooms (Cockcroft et al., 2008). An in-depth understanding of the spatio-temporal variability of bacterial and picoplankton composition and distribution would help understanding of biogeochemical processes in this region.
In this study, DNA samples were taken in austral autumn (May), early and late spring (September and November 2015) and summer (February 2016) from surface waters and waters at or near the fluorescence maximum Fmax in coastal, shelf and offshore stations from St Helena Bay. The study aimed to describe the microbial community composition through next generation sequencing of the 16S and 18S rRNA genes, and to assess the degree of variability in community composition in relation to changes in hydrography associated with different upwelling stages. We predict that the microbial communities would vary between the various degrees of upwelling and between inshore vs. offshore waters. This study provides insight into the seasonal and spatial (vertical and horizontal) variability in microbial plankton communities in the St Helena Bay region and reveals how community structure responds to its environment.
Methods
Sample Collection
Seasonal samples were collected during four cruises of the Integrated Ecosystem Program (IEP) of the South African Department of Environmental Affairs (Verheye et al., 2018). Cruises were conducted in austral autumn (May 2015), early and late spring (September and November 2015) and summer (February 2016). All sampled stations were located on the St Helena Bay Monitoring Line: station 3 (32°19′49.1999″S, 18°10′41.9999″E), station 5 (32°24′ 53.9994″S, 17°48′ 29.988″E), station 7 (32°30′9.601″S, 17°25′11.399″E), station 8 (32°34′18.0114″S, 17°11′ 53.9874″E) and station 13 (32°41′3.5999″S, 17°45′58.7999″E) (Figure 1). Stations 3, 5, and 13 were located over the continental shelf (<200 m depth) and stations 7 and 8 were over the continental slope (>200 m depth). Station 3 is assumed to represent inshore waters, stations 5 and 13 shelf waters, and stations 7 and 8 offshore waters.
Figure 1. Map illustrating St Helena Bay and the five stations (3, 5, 7, 8, and 13) that were sampled for the present study.
Triplicate samples for microbial analysis were taken from Niskin bottles that collected water from the surface, the depth of the fluorescence maximum (Fmax) and, in some cases, bottom waters (Table 1). Temperature, salinity and dissolved oxygen were measured using a Sea-Bird CTD. Inorganic nutrient concentrations (NO3–, NO2–, PO43–, and SiO44–) were determined according to Diamond (1994) and Egan (2008). The water types from which each of the samples was taken were classified by stage of upwelling using nitrate and temperature values, following Barlow (Barlow, 1982): Type 1 or newly upwelled water (8–10°C, 15–30 μmol N.L–1); Type 2 or mature upwelled water (10–15°C, 2–15 μmol N.L–1); Type 3 or aged upwelled water (12–16°C, 0–2 μmol N.L–1).
Table 1. Physico-chemical variables measured for each of the microbial samples collected from stations 3, 5, 7, 8 and 13 on the St Helena Bay Monitoring Line in May, September and November 2015 and February 2016.
DNA samples for 16S and 18S sequencing analysis were collected through size-fractionated filtration. A volume of 1 L of water was collected from the Niskin bottles, pre-filtered through a 200 μm mesh, then filtered through a 2 μm filter followed by a 0.2 μm polycarbonate filter. Both filters were immediately flash frozen in liquid nitrogen and stored at –80°C until processing.
Samples for flow cytometry analysis were collected in triplicate from the Niskin bottles in 2 mL cryovials, preserved with 0.25% glutaraldehyde, flash frozen in liquid nitrogen and stored at –80°C until analyzed.
DNA Extraction and Amplification
For logistical and funding reasons, two different methods were used for 16S DNA extraction and amplification. We collaborated in 2015 with the Liu lab, which sequenced our May-September 16S samples using 454 pyrosequencing. For our November and February samples, funding became available to send our samples for Illumina sequencing (16S and 18S). As a result of these logistical issues, it must be noted that no 18S data were sequenced for the May and September 2015 samples.
Method 1: May and September 2015 Samples
DNA was extracted using the DNA blood and cell culture Micro Kit (QIAGEN>) according to their protocol. Extracted DNA was amplified using the general prokaryotic SSU rRNA gene V3-V4 hypervariable region primers, U341F (5′-CC TAC GGG RSG CAG CAG -3′) (Watanabe et al., 2001) and 787R (5′-CTA CNR GGG TAT CTA A-3′) (Anna et al., 2010). In brief, the polymerase chain reaction (PCR) was carried out with a 25 μL Master Mix containing 2.5 μL of 10x buffer (100 mM Tris–HCl, pH 8.3 at 25°C; 500 mM KCl; 15 mM MgCl2; and 0.01% gelatin), 1 μL of MgCl2 (25 mM) and 0.5 dNTPs (10 mM), 1 μL of forward and reverse primers (10 μM), 0.25 μL of Platinum Taq polymerase (Invitrogen), and 1 μL of DNA template. The PCR program consisted of an initial incubation step at 94°C for 4 min, followed by 29 cycles with a denaturation step at 94°C for 30 s, an annealing step at 55°C for 30 s, and an extension step at 72°C for 30 s. These cycles were followed by a final extension step at 72°C for 7 min. Amplifications were verified on a 0.8% agar gel stained with ethidium bromide. MID adaptor linked primers were used for sequencing.
Method 2: November 2015 and February 2016 Samples
DNA was extracted using the DNA blood and cell culture Micro Kit (QIAGEN>) according to their protocol. Gene amplification of 16S rRNA was carried out using the 16S V3-V4 primer set 341F (5′-CCTAYGGGRBGCASCAG-3′) and 787R (5′-CTA CNR GGG TAT CTA A-3′) (Anna et al., 2010). The V4 region of the 18S rRNA gene was amplified using TAREUK454FWD1 (5′-CCAGCASCYGCGGTAATTCC-3′) and TAREUKREV3 (5′-ACTTTCGTTCTTGATYRA-3′) (Stoeck et al., 2010) with the barcode. All PCRs were carried out with Phusion> High-Fidelity PCR Master Mix (New England Biolabs). Amplifications were verified on a 2% agarose gel stained with ethidium bromide. MID adaptor linked primers were used for sequencing.
PCR products were mixed in equidensity ratios. This PCR product mixture was purified with Qiagen Gel Extraction Kit (Qiagen, Germany). The libraries were generated with TruSeq> DNA PCR-Free Sample Preparation Kit and quantified via Qubit and Q-PCR, to be analyzed by the HiSeq Illumina platform.
Bioinformatics
May and September 2015 Samples: 454 Sequencing and Bioinformatic Analysis
All nine samples were sequenced in replicate on a 454 GS Junior system (Roche) according to Daigle et al. (2011). All the resulting sequences were screened by removing the low-quality reads, such as reads shorter than 300 nucleotides, incomplete or inaccurate primer sequences, chimeras, and reads with unidentified nucleotides present. Shhh.seqs (a MOTHUR implementation of Amplicon noise) (Quince et al., 2011) was performed on all sequences prior to analysis. In order to minimize the computational burden of all downstream analyses, all unique sequences were identified using MOTHUR (Schloss et al., 2009) and a taxon was assigned to each sequence. A 97% cutoff was applied to all 16S sequences for subsequent analysis using MOTHUR, and the number of sequences per raw sequence was indicated in the OTU table (Table 2). To test for significant differences in bacterial composition between sites and water type, we used permutational multivariate analysis of variance (PERMANOVA) with the function “adonis” in the “vegan” R package. The microbial community diversity (Table 1) was estimated using the summary single command in MOTHUR. Graphs of species richness, inverse Simpson and constrained ordination plots were generated in R using the packages RAM (McMurdie and Holmes, 2013; Wen Chen and Levesque, 2018), vegan (Jari Oksanen et al., 2017), and ggplot2 (Wickham, 2009). The R scripts are available upon request. Differences between platforms was tested in R using the ADONIS function in vegan.
Table 2. Number of 16S sequences obtained in samples collected from stations 3, 5, 7, 8, and 13 on the St Helena Bay Monitoring Line in May, September and November 2015 and February 2016.
November 2015 and February 2016 Samples: Illumina Sequencing and Bioinformatic Analysis
Paired-end reads were assigned to samples based on their unique barcodes and truncated by cutting off the barcode and primer sequence. Paired-end reads were merged using FLASH (V1.2.7)1 (Magoč and Salzberg, 2011). Quality filtering on the raw tags was performed under specific filtering conditions to obtain the high-quality clean tags (Nicholas et al., 2012) according to the Qiime (V1.7.0)2 (Caporaso et al., 2010) quality control process. Subsequent sequence analysis was performed using MOTHUR version 3.9 (Schloss et al., 2009). All the resulting sequences were further screened by removing the low-quality reads, as above. A 97% cutoff was applied to all sequences for subsequent analysis using MOTHUR, and the number of raw sequences as well as OTU number is indicated in the OTU table (Table 2). Sequences are uploaded on European Nucleotide Archive under accession numbers ERS3233437–ERS3233461.
Once OTU tables were generated, taxonomic affiliations were assigned using SILVA (16S) and PR2 (18S) databases. Heat trees were generated using the R package Metacoder (Foster et al., 2017) and diversity index box plots as well as Figure 4 heatmaps were generated using the Heatplus package (Ploner, 2019). Heatmaps were generated by extracting the top 40 orders from log transformed OTU abundance data. Scripts are available upon request. Bubbleplots (Supplementary Figure S3) were generated using relative abundances.
Figure 4. Similarities among samples from the St Helena Bay Monitoring Line in terms of the abundances of the top OTUs. Heatmaps illustrate log transformed OTU abundance data of the top 40 orders for (A) 16S (May 2015-February 2016), (B) 18S (November 2015-February 2016). Boxes to the right of each heatmap indicate nitrate, silicate and dissolved oxygen (DO) concentrations associated with each sample. The samples are also classed in terms of months sampled through the presence of black boxes. Samples are clustered through the nearest neighbor algorithm.
Ordination
Canonical correspondence analysis (CCA) was used to construct 16S and 18S CCA plots using log transformed abundances [May and September (454 sequencing) and November and February (Illumina) plotted separately]. The CCA plots were constructed using the ggord and vegan packages in R (Jari Oksanen et al., 2017; Beck, 2019). The R scripts are available upon request.
Network Analysis
Spearman rank order correlations were calculated between the log transformed top 37 bacterioplankton and picoeukaryote families from the November and February cruises, as no 18S data are available for the May and September cruises. Both the correlation matrix (R matrix) and significance matrix (P matrix) were calculated using the “Hmisc” package in R (Harrell and Dupont, 2019) by calculating all possible pairwise Spearmans Rank correlations between all families. Only robust (Spearman’s correlation coefficient >0.8) and statistically significant (p < 0.01) correlations were further considered. The resulting values were plotted in Cytoscape v3.7.2. Other data including the relative OTU distribution of each node (Family) were also imported into Cytoscape, and plotted though the enhancedGraphics package (John et al., 2014).
Flow Cytometry
Heterotrophic bacteria were enumerated using a flow cytometer (LSR II, Becton Dickinson, Heidelberg, Germany) using the method of Marie et al. (1997) and Van Dongen-Vogels et al. (2011). FlowJo® was used to calculate prokaryote abundance through plotting SYBR Green I fluorescence (530/30 band pass) against side scatter. Heterotrophic bacteria were distinguished from Prochlorococcus through their lack of a chlorophyll signal (690 nm). Picoeukaryotes were measured through their signal emitted on the orange [phycoerythrin (PE): 585/42 band pass] vs. red (PC: 661/16 band pass) fluorescence signals. Synechococcus abundance was distinguished from picoeukaryotes through their higher PE signal.
Results
Samples collected from all four cruises were typically comprised of surface samples and samples from the fluorescence maximum, which occurred within the top 10–20 m of the water column (Table 1). Station 13, which is characterized by perennial low oxygen concentrations in the midwater zone, was sampled in September at the surface, in low oxygen waters (2.42 mL O2.L–1) at 59 m and near the bottom (105 m). For comparison during this cruise, station 5 was also sampled at the surface and near the bottom (153 m) (Table 1).
Hydrographic Conditions
Of the surface and near-surface samples obtained during the four cruises, all the shelf samples were from mature upwelled (type 2) water except for the summer (February) surface sample from station 5, which had characteristics of aged upwelled (type 3) water (Table 1). The surface and near-surface offshore samples had characteristics of mature and aged waters, and samples deeper than 20 m had low oxygen concentrations (<4 mg O2.L–1). The temperature profiles (Figure 2) showed cooling with depth, with most of the water columns being weakly stratified. The surface waters of the stations closest to the coast (stations 3, 5, and 13) generally were cooler than those at offshore stations (7 and 8). Deep samples from station 5 showed evidence of low-oxygen waters (Table 1). Salinity did not vary, ranging from 34.55–35.25 PSU throughout the dataset.
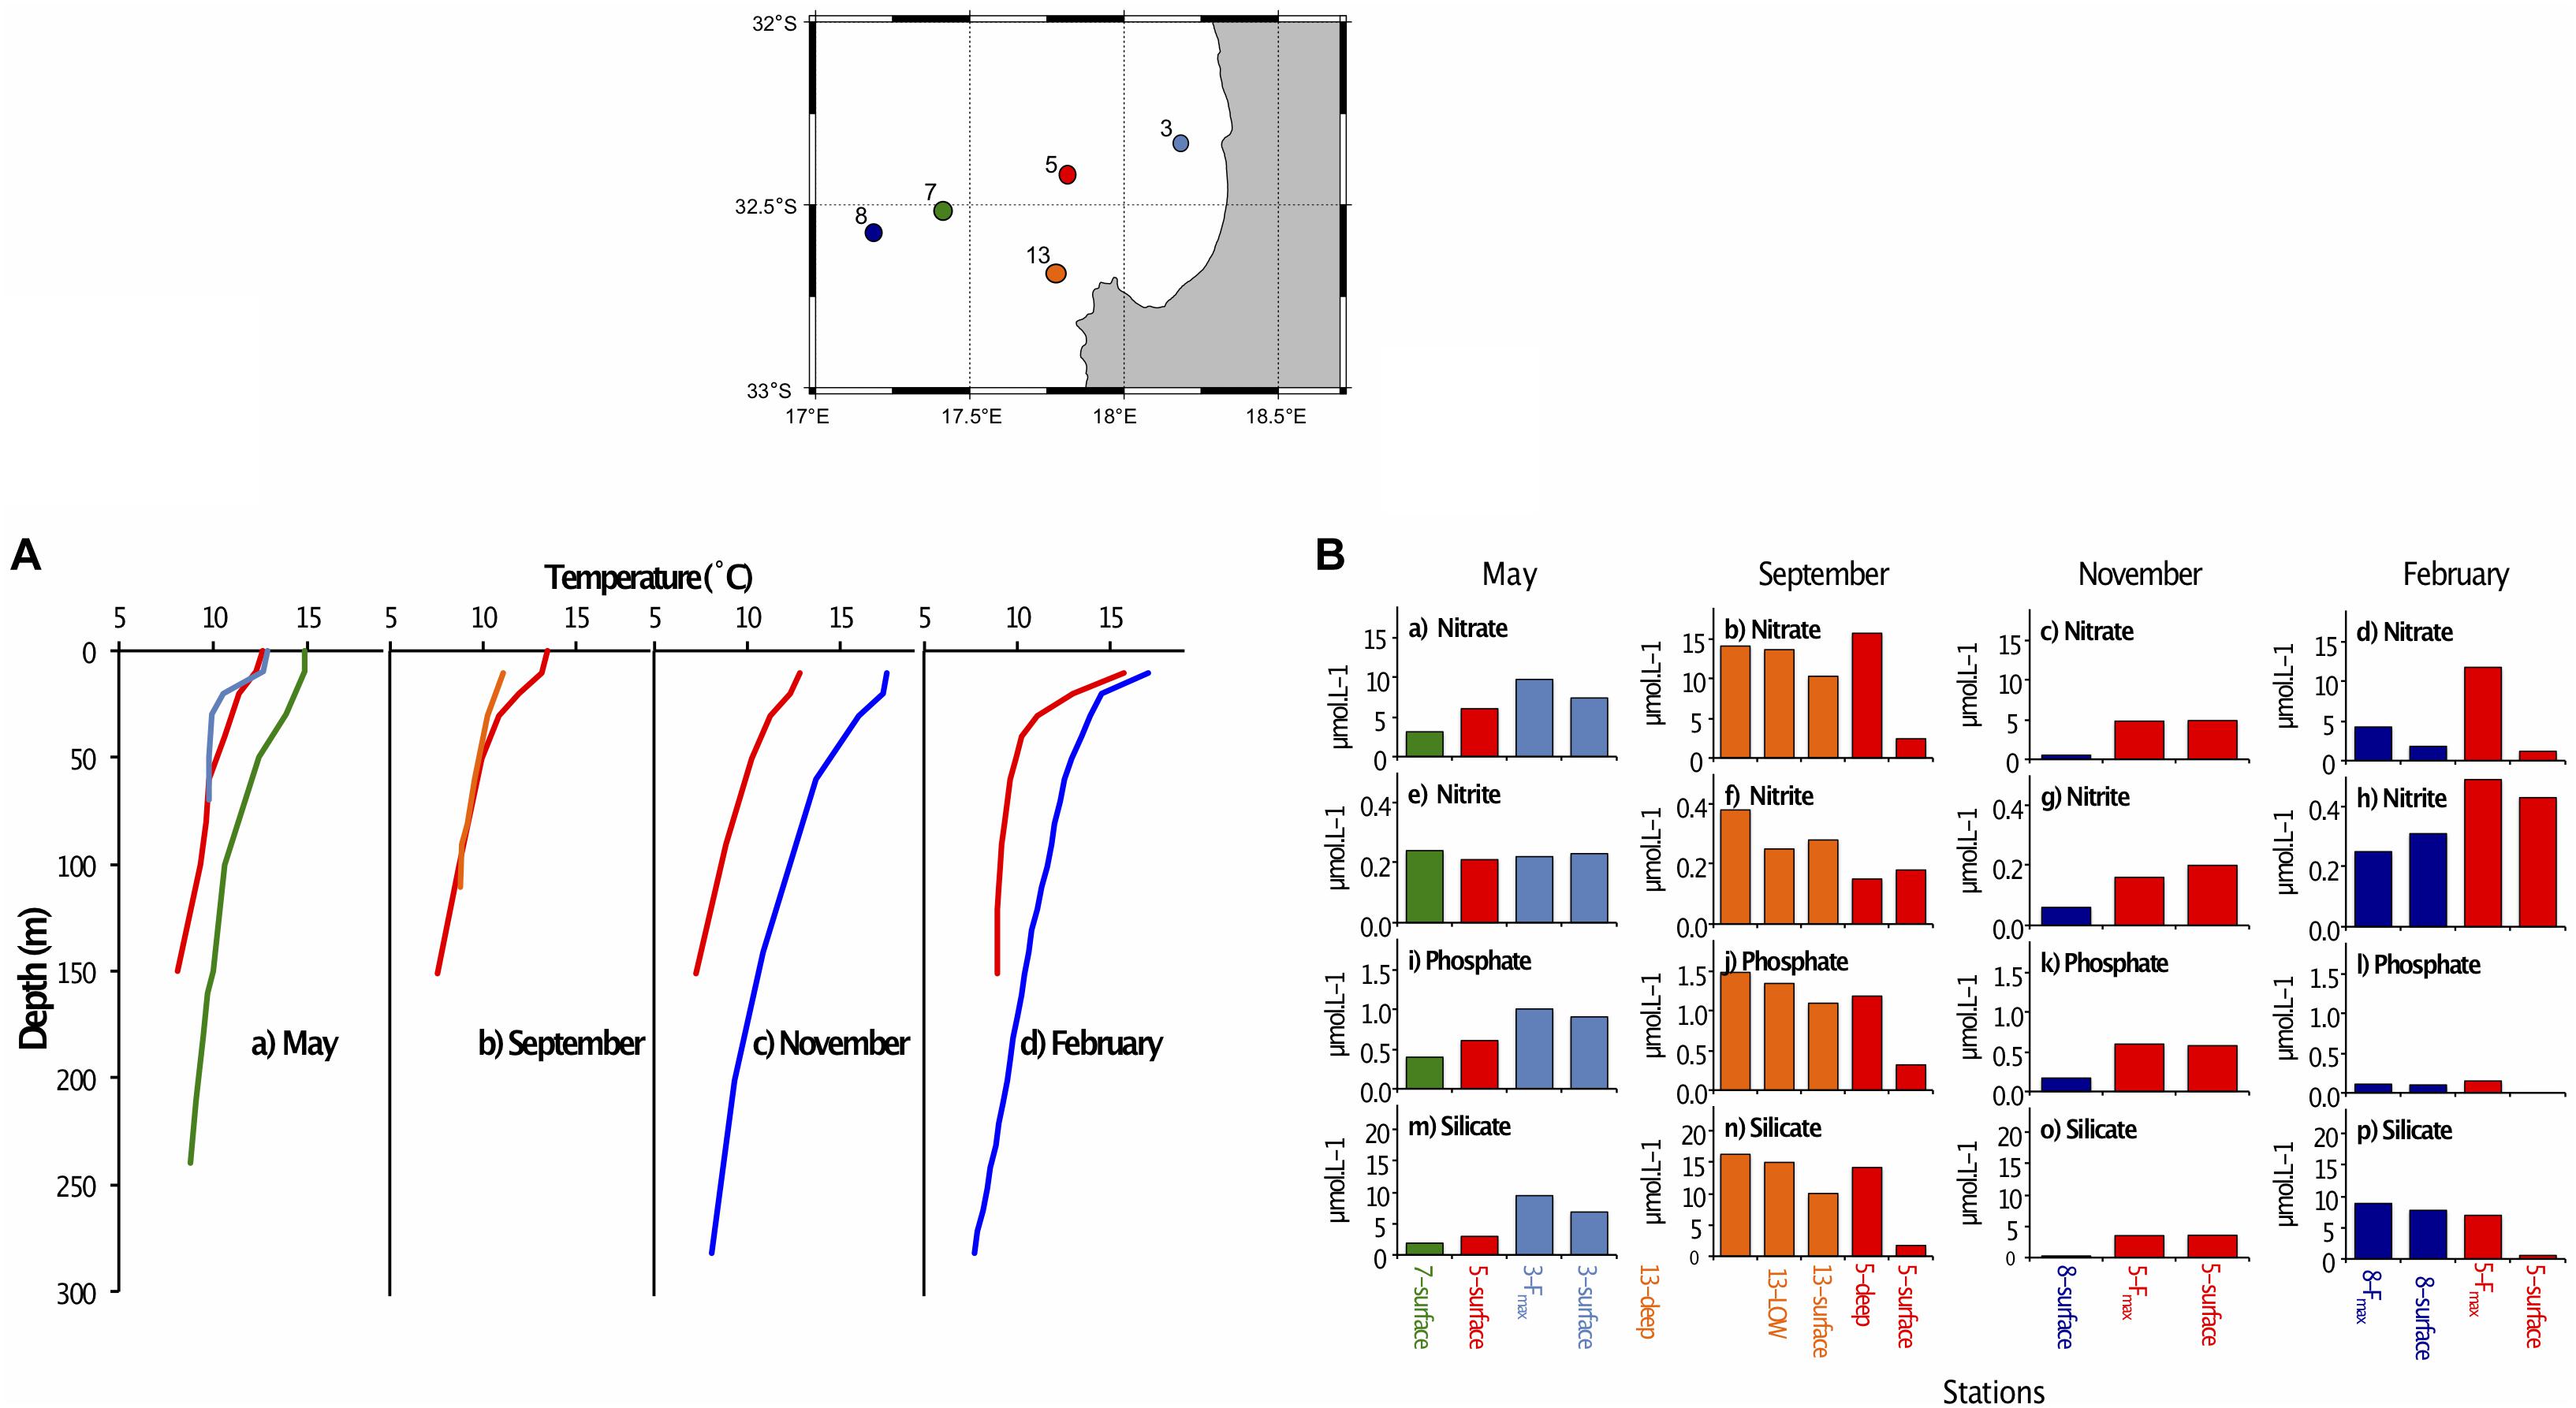
Figure 2. (A) Vertical profiles showing temperature at depth for stations sampled along the St Helena Bay Monitoring Line in (a) May 2015, (b) September 2015, (c) November 2015 and (d) February 2016. The five stations (insert) are color-coded as follows: 3 – light blue, 5 – red, 7 – green, 8 – dark blue, 13 – orange. (B) Nutrient concentrations (μmol.L–1) at stations sampled along the St Helena Bay Monitoring Line in May 2016, September 2016, November 2016 and February 2017 at the surface, the fluorescence maximum (Fmax) and near the bottom (deep). (a–d) nitrate, (e–h) nitrite, (i–l) phosphate, (m–p) silicate. The five stations (insert) are color-coded as follows: 3 – light blue, 5 – red, 7 – green, 8 – dark blue, 13 – orange.
Nutrients
All surface nutrient concentrations were low to moderate, with water characterized as either mature-upwelled (May, September) or aged upwelled (November, February) (Table 1), indicating there had not been recent upwelling. The measured nutrient values (Table 1) can be compared with concentrations found in newly upwelled water: 20.8 μmol.L–1 for nitrate, 16.6 μmol.L–1 for phosphate, 1.88 μmol.L–1 for silicate (Brown and Hutchings, 1987).
Surface nutrient concentrations in May and November were generally highest near the coast and decreased offshore. In September and February, the inshore stations were nutrient-depleted at the surface compared to the offshore stations for nitrate (Figures 2b,d), phosphate (Figures 2j,l) and silicate (Figures 2n,p), but tended to have elevated surface concentrations of nitrite (Figures 2f,h). Silicate concentrations were generally lower at the surface than at depth for all stations and months (Figures 2m–p), indicating probable diatom presence in surface waters. Nutrient concentrations at the Fmax (in May, November and February) were generally high. In September the lowest nutrient concentrations were at the surface, with elevated concentrations in the low oxygen water and near the bottom (Figure 2, second panel).
Surface waters were generally well oxygenated (Table 1), but oxygen concentrations decreased to <4 mg.mL–1 in September in the mid-water low oxygen area and near the bottom at stations 5 and 13 in September, which were the deepest stations sampled.
Bacterioplankton Diversity
Bacterioplankton species diversity was greatest in September shelf surface waters (Table 2). May offshore waters had lower OTU numbers and species diversity. September samples had similar diversities at stations 13 (Shannon index: 6.15–6.45) and 5 (Shannon index: 5.68–6.31). Taxon diversity in hypoxic waters in September (OMZ and Deep, Table 2) did not differ much from that in the shelf surface waters. In November and February community richness was highest at the surface at the offshore station (Table 2) and lowest at the surface at the shelf station. Diversity did not vary much among seasons, but there were significant differences in taxon diversity between shelf and offshore samples (Figure 3).
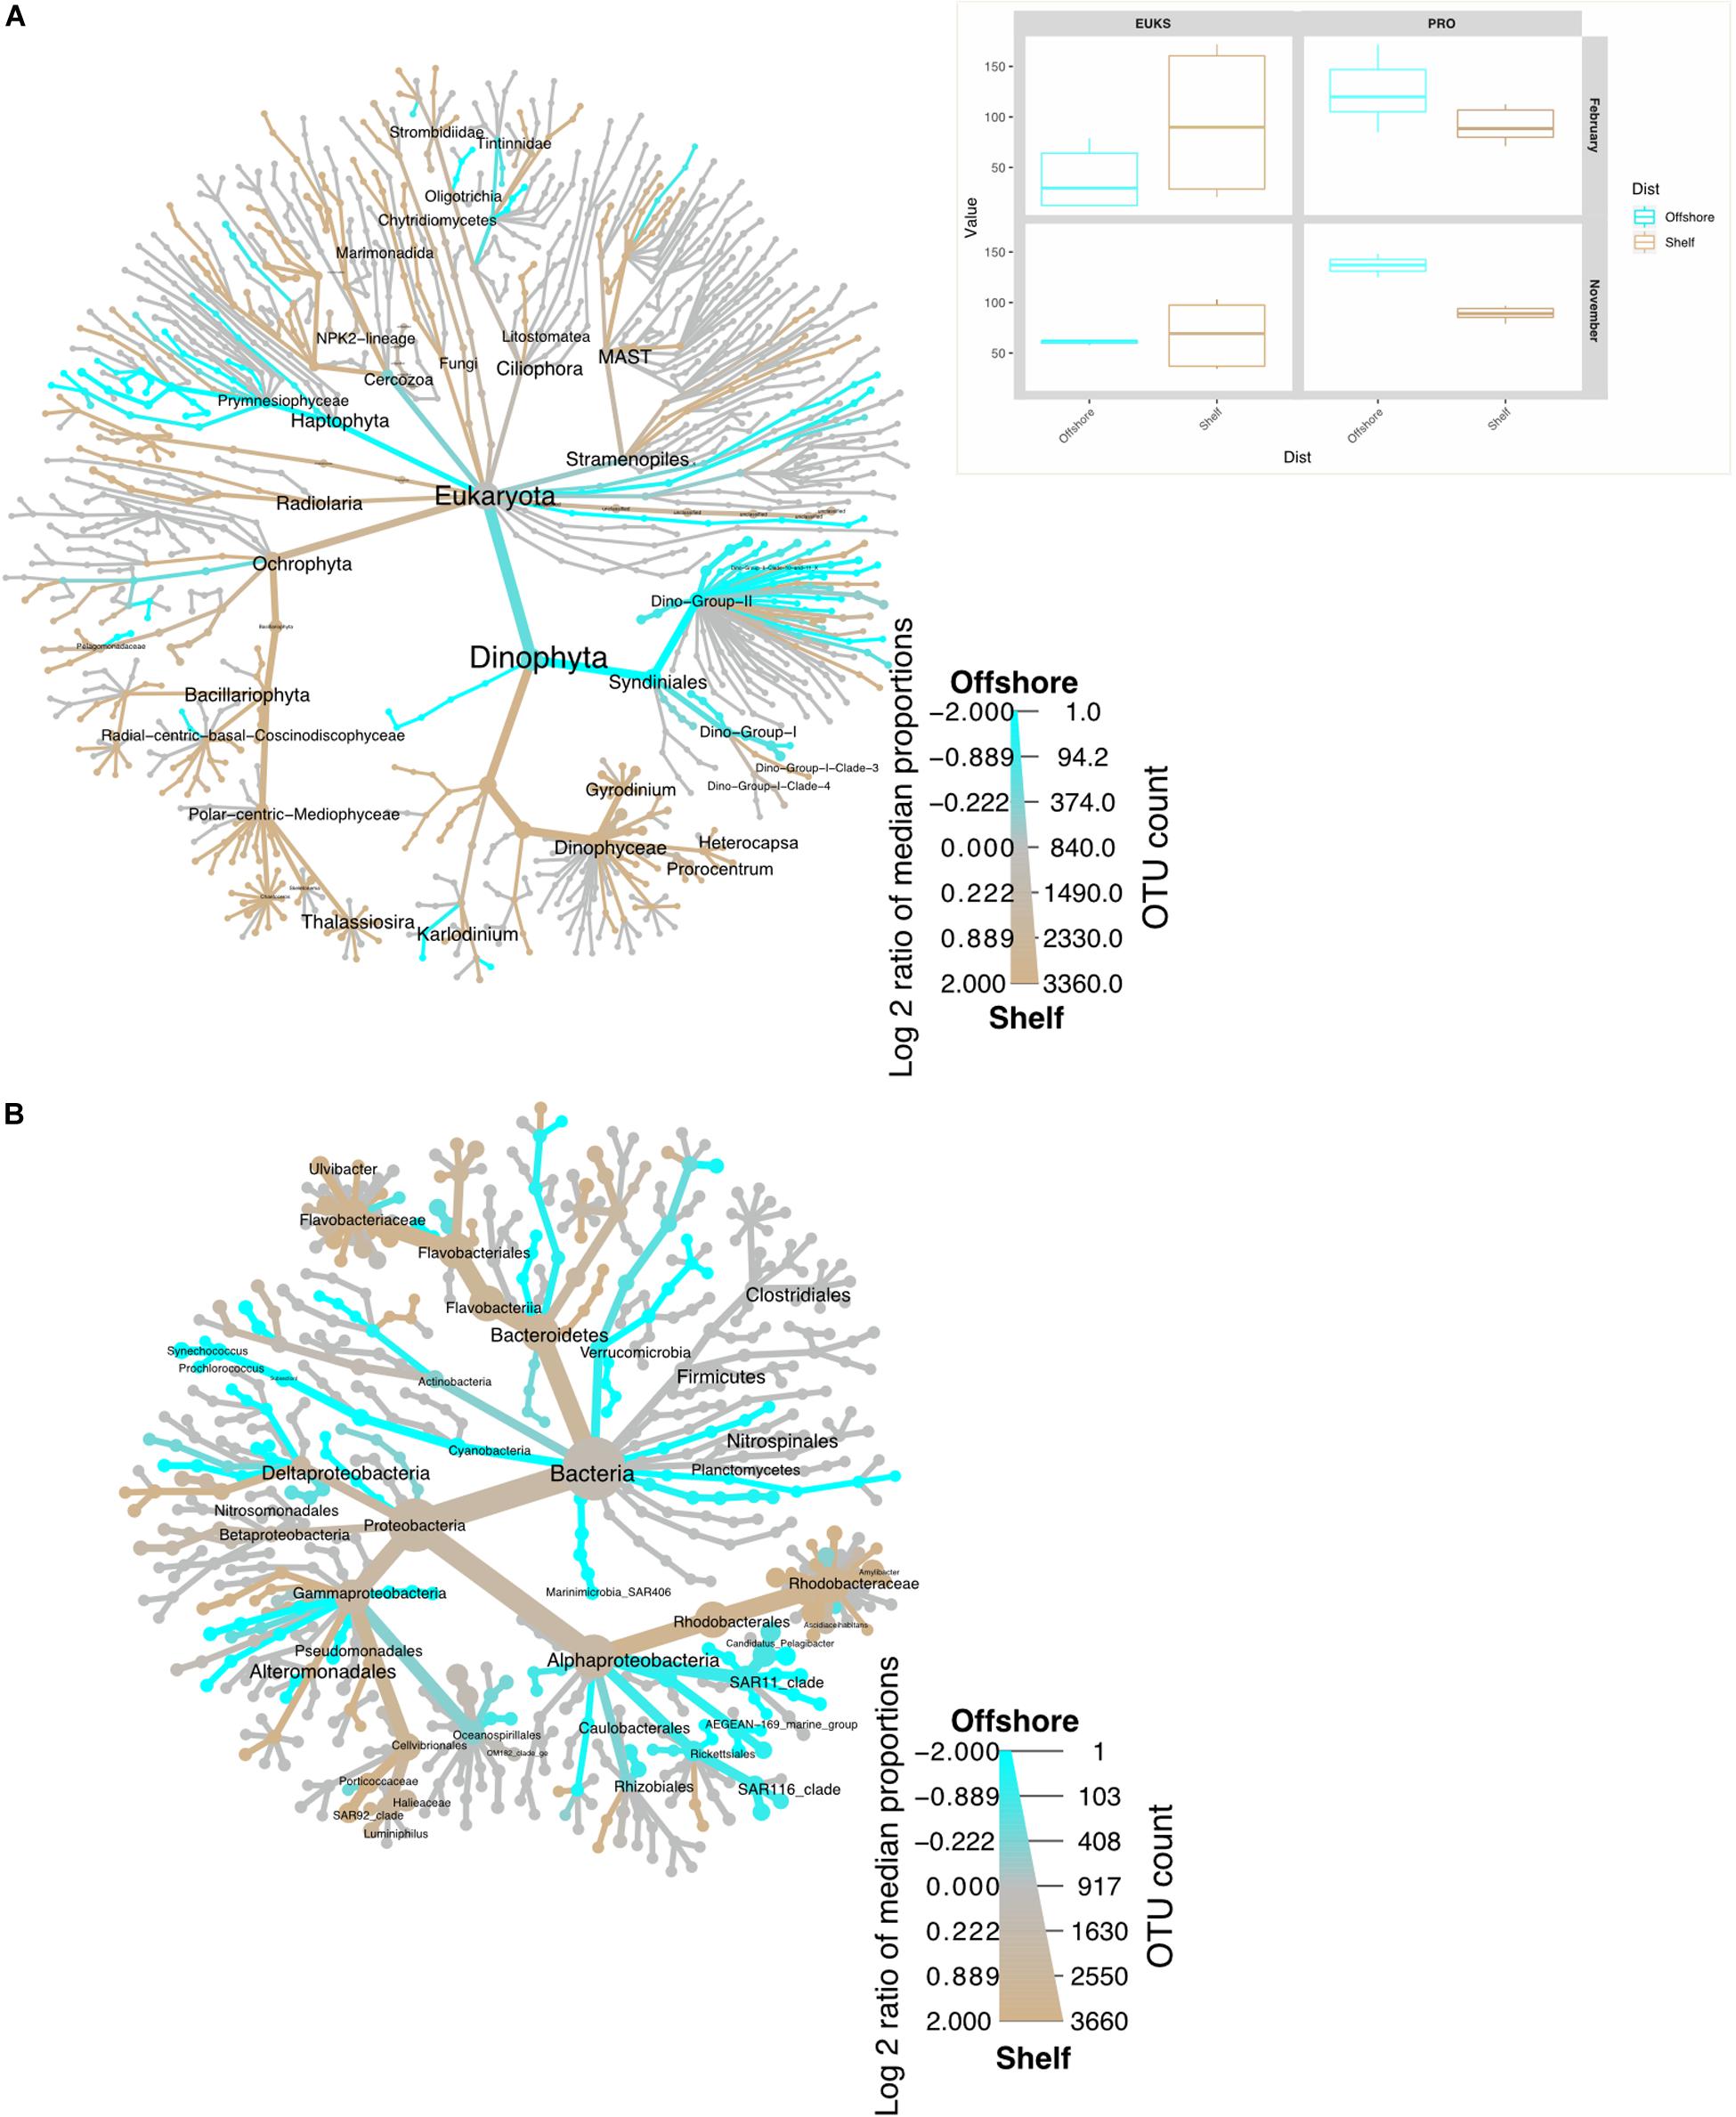
Figure 3. Heat trees representing taxon distribution inshore (beige) vs. offshore (aqua blue) for November 2015 and February 2016 samples from the St Helena Bay Monitoring Line. The color of each taxon represents the log-2 ratio of median proportions of reads observed in shelf or offshore samples. (A) 16S (B) 18S. Inset represents the true diversity index (Shannon) for the same samples, plotted in the same color scheme. Only significant differences are colored, applying a Wilcox rank-sum test followed by Benjamini-Hochberg (HDR) correction for multiple samples.
The different platforms used must be considered when comparing May and September 16S data with the February and November results (Loman et al., 2012; Smith and Peay, 2014; Sinclair et al., 2015). All three of these studies have revealed that differences between the two platforms are insignificant, given that similar PCR and bioinformatic protocols were followed. In this study, despite the fact that the primary bias lies within the 454 results which yielded a lower throughput compared to the Illumina data, no significant difference was found between the 454 and Illumina datasets (AMOVA, p > 0.5). As a result, these results have been reported in a single heatmap, however, separate ordination plots were shown in order to properly visualize the variability within hypoxic samples vs. non-hypoxic samples from the rest of the dataset.
Picoeukaryote Diversity
The picoeukaryote community richness was highest in February at the surface at station 5 (Shannon index: 4.07) and lowest at the Fmax at station 8 in February (Shannon index: 2.38) (Table 3). Diversity in November was highest at station 5 Fmax (Shannon index: 3.81), and lowest at station 5, surface waters (Shannon index: 2.85).
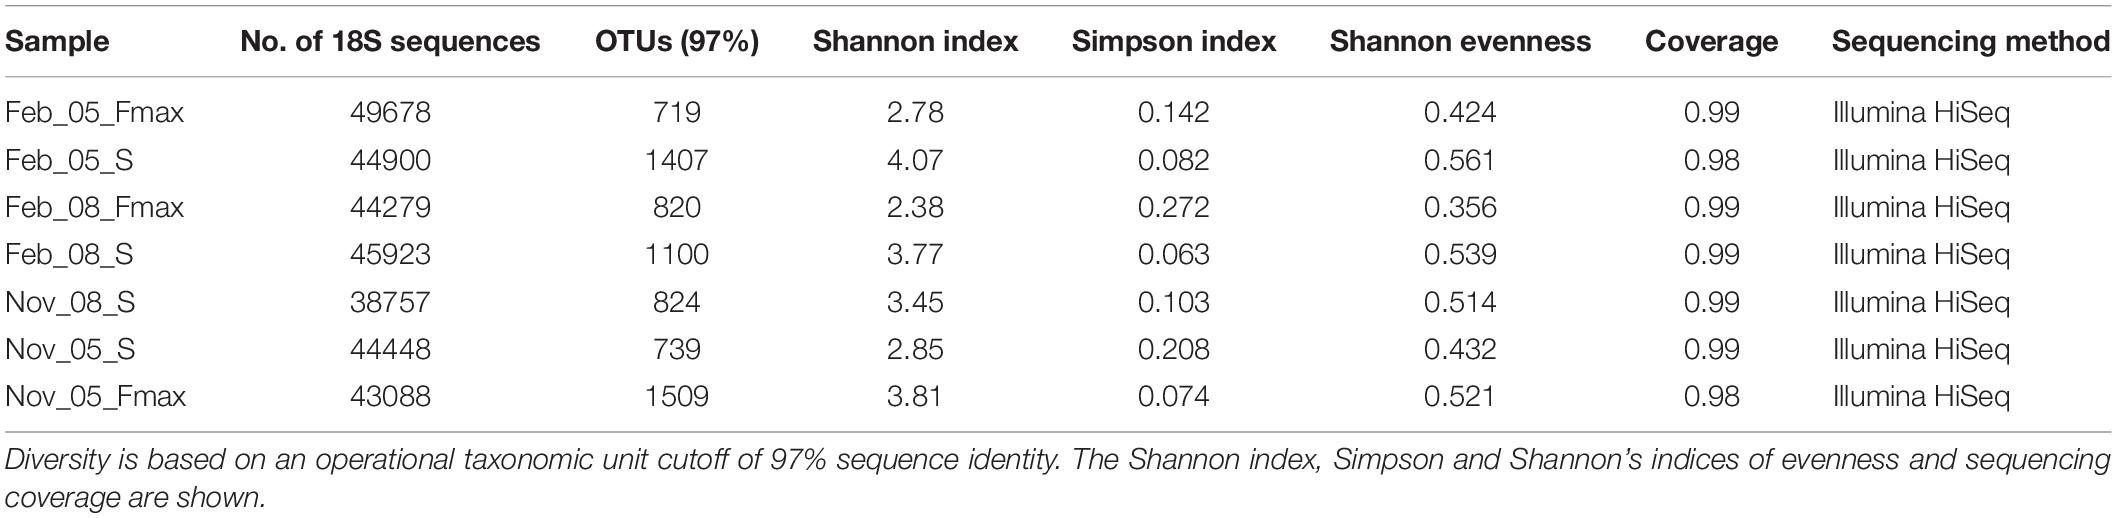
Table 3. Number of 18S sequences obtained in samples collected from stations 5 and 8 on the St Helena Bay Monitoring Line in November 2015 and February 2016.
Bacterioplankton Community Composition
For May and September samples, 454 sequencing yielded a total of 22,956 sequence reads after denoising, removal of reads present only once and chimeric sequences. The sequence dataset was clustered into 11,189 OTUs at a 97% cutoff.
Abundance data of the top 40 orders (Figure 4), represent almost 90% of the dataset. Species community composition in all samples was dominated by Bacteroidetes (Flavobacteriaceae) and Proteobacteria (Rhodobacteraceae, Oceanospirillales, Rhodobacterales) (Figure 4A). May surface waters (Station 3) contained the most OTUs but the lowest abundance of the SAR clades, Desulfobacterales and Rhizobiales. May and September samples clustered by water type. September hypoxic waters contained a large percentage of ZD0405 clade of SAR11 (8 and 10% of station 13 OMZ and bottom, 21% of Station 5 bottom). Other notable groups included a marine group B clade, Nitrospina and the Deep I SAR11 clade. In September surface samples, the “core” Rhodobacteriaceae and Flavobacteriaceae dominated the samples overall (20–23%). Further inshore in May, station 3 exhibited higher abundances of Verrucomicrobiaceae, Oceanospirillaceae, Methylophilaceae, and Thiotrichales. In September, shelf surface waters were occupied by few OTUs but included higher numbers of Rickettsiales and SAR406 compared to all other samples.
Bacterioplankton community composition on the shelf (station 5) in February was dominated by Proteobacteria – Rhodobacteriaceae, almost all of which consisted of Roseobacter sp. Offshore (station 8), however, there was a mix of SAR11 (14%), Marine Gp II – Thermoplasmata (15%) and Family I (Prochlorococcus) (10%). In November, Flavobacteria dominated inshore (station 5, 21%), accompanied by Rhodobacteraceae (13%). Offshore (station 8), Flavobacteriaceae (16%) occupied the waters equally with Rhodobacteriaceae (14%). Community composition was significantly different between February and November (p < 0.001) and community composition was significantly different between shelf and offshore waters in February (weighted unifrac, p < 0.001) but not November (p > 0.1). A weighted unifrac analysis also indicated that the 16S community structure split significantly by water type (both 454 and Illumina dataset) (PERMANOVA, p < 0.001).
Two percent of the May and November samples contained the nitrite oxidizing bacterium, Nitrospina, and 1.5% of the November-February samples contained the ammonium oxidizing archaea, Nitrosopumillus (Figure 4).
Picoeukaryote Composition
Picoeukaryote community structure split significantly by season (Figure 4B, weighted unifrac, p < 0.001), but not by location/distance from shore (p > 0.1). In February, the Dino group II dominated offshore samples (station 8, surface: 40%, Fmax: 83% of OTUs) (more specifically Dino GpII clades 10, 11, 16, and 14). At the Fmax at station 5, Syndiniales dinoflagellate groups I and II dominated (Dino gp 1: 34%, Dino gp II: 37%). However, in surface waters most OTUs were classed as unclassified dinoflagellates (27% of sequences). In November, polar-centric Mediophyceae dominated stations 8 surface and 5 surface and Fmax (22, 35, and 27%, respectively), alongside radial-centric-basal-Coscinodiscophyceae, Raphis-pennate, and Syndiniales (group II Clade 14, and 16 – NovSt5 Fmax only).
Ordination
The constrained ordination using log-transformed data (Figure 5) illustrates how spatial, temporal and environmental variables within the bacterioplankton samples influenced the distribution patterns of the OTUs. For the 16S community structure, 58% of the variability in community composition was explained by the CCA plot (Figure 5A). The samples grouped by month and by distance offshore for February samples. Nitrate, nitrite, silicate. Phosphate and dissolved oxygen concentrations all significantly affected the bacterioplankton community variability in November 2015 and February 2016 16S samples, and silicate, phosphate, dissolved oxygen and temperature significantly affected the May and September 16S samples (Table 4, p< 0.005). 49% of the picoeukaryote community structure was explained by the first two axes (Figure 5C). The samples grouped according to month but not by distance from shore. Nitrate, nitrite, silicate, dissolved oxygen, and Synechococcus abundances were found to significantly affect community variability of the picoeukaryotes (p < 0.01).
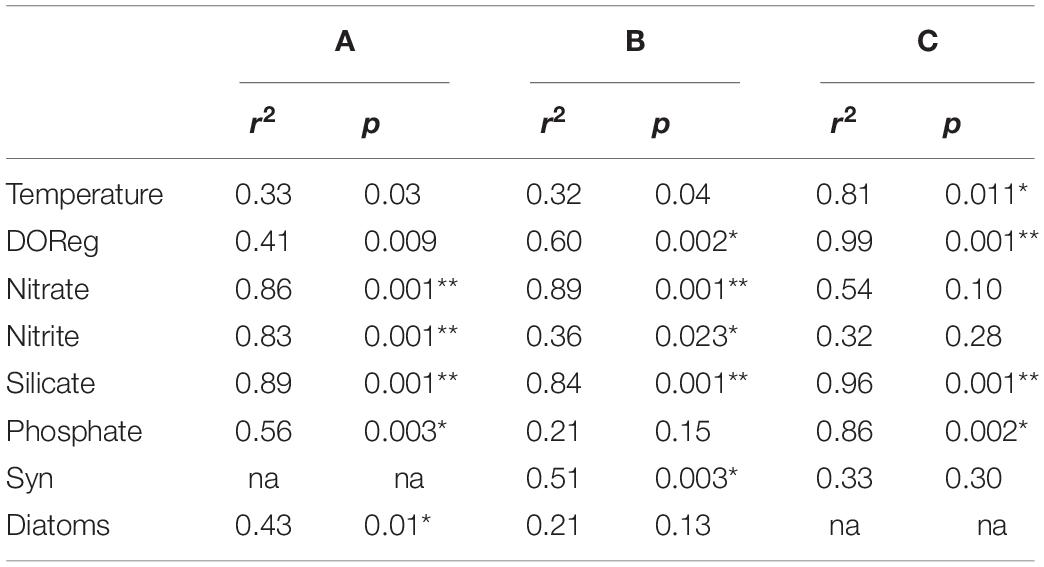
Table 4. CCA (Figure 5) ordination site scores with environmental variables (97% cutoff; A–C refer to Figures 5A–C), respectively.
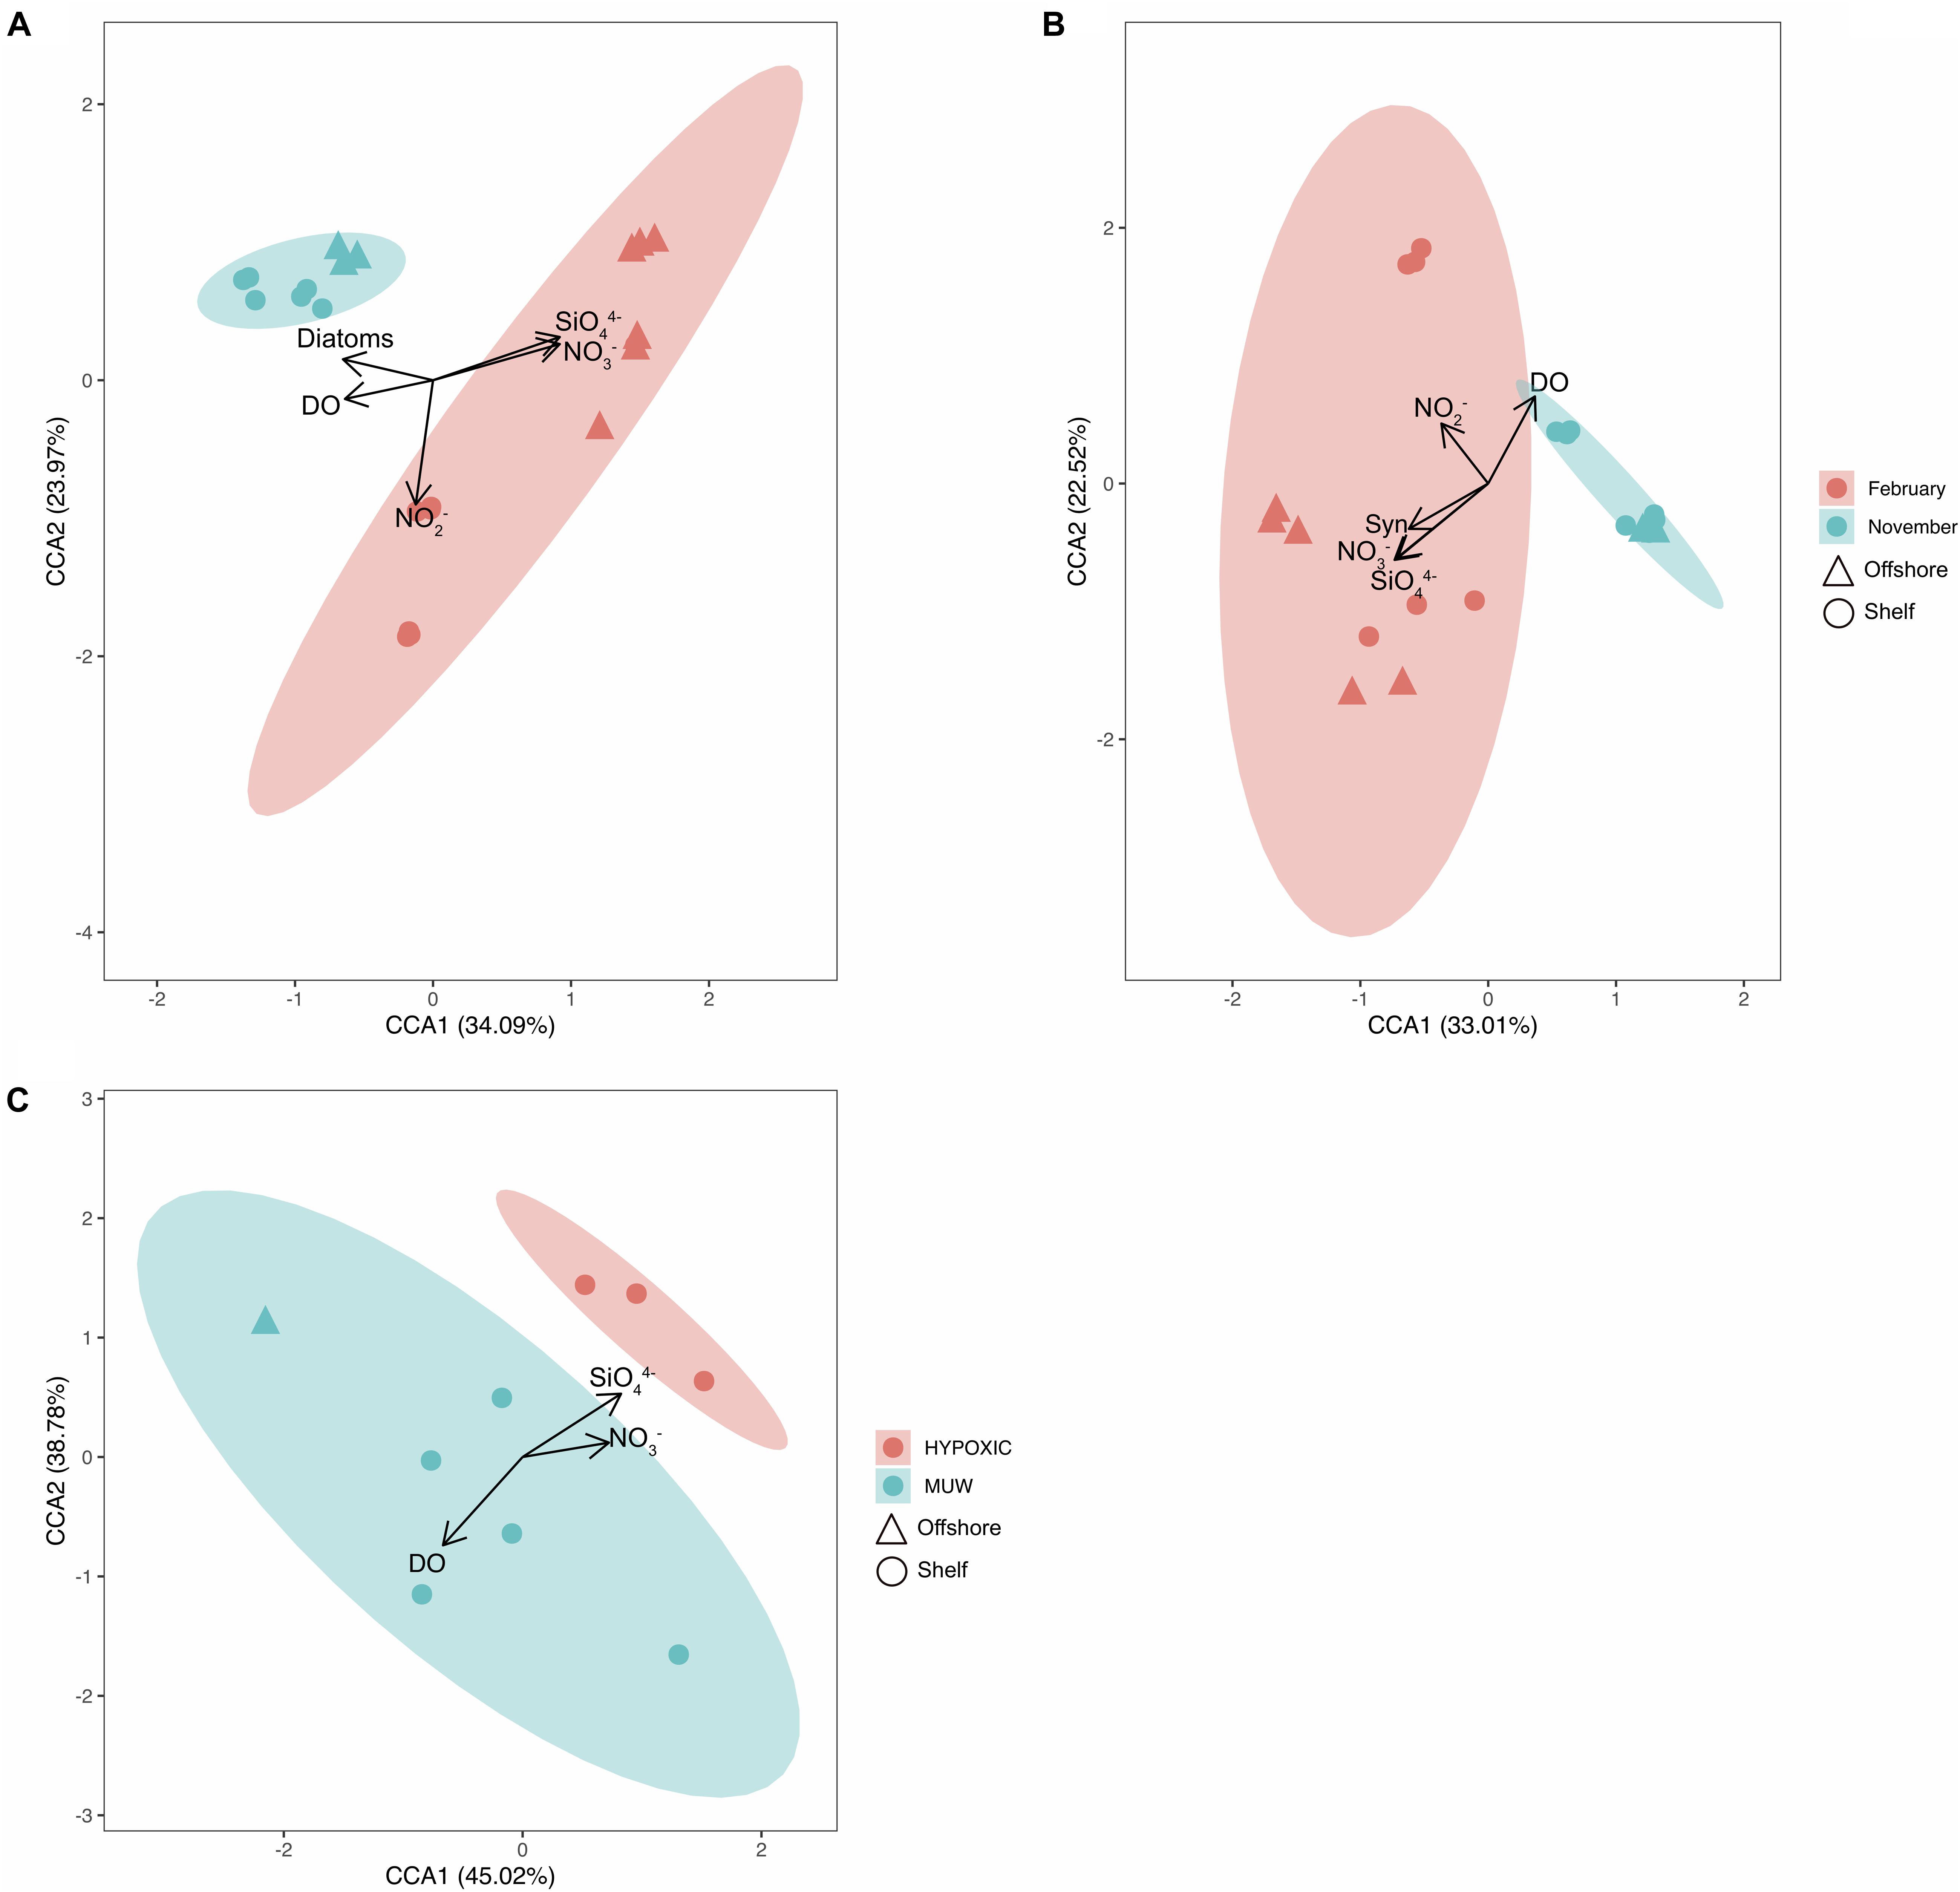
Figure 5. CCA ordination plots grouping samples from (A) 16S data from November 2015 and February 2016, (B) 18S data from November 2015 and February 2016. (C) 16S data from May and September 2015. X and y axis show percent variability explained of the OTU distributions. Eigenvectors show how metavariables significantly influence the OTU distributions. Confidence ellipses indicating the mean of each centroid (A,B by Month and C by watertype) are superimposed onto the plot. Syn, Synechococcus; DO, dissolved oxygen.
Network Analysis
A trend is immediately visible between the two main clusters in Figure 6, with the top cluster having large contributions from families from offshore samples, and the bottom cluster including mostly shelf samples. Noteworthy associations in the top (offshore) cluster include Dinoflagellate group II clades 10 and 11, 8 and 6, which were highly connected with each other, as well as resident picoeukaryotes such as Pelagomonadaceae and Pelagophyceae and bacterioplankton such as SAR116, NS7, Synechococcus and other alphaproteobacteria. Negative associations were less frequent but mostly occurred between radial centric basal Coscinodiscophyceae and Dino gp II clades 1, 3, and 6. Polar-centric Mediophyceae exhibited negative correlations with Synechococcus, PS1 clade, AEGEAN-169 marine group and NS7 marine group. The bottom cluster centered around Flavobacteria and Bacteroidetes, which correlated positively with Ulvibacter, Saprospiraceae and NS5 and negatively with Dino Group II Clade 16 and marine group II. Rhodobacteraceae completed the cluster with positive correlations between OM60, NS4, Ki89A, Halieaceae, and Luminiphilus amongst others.
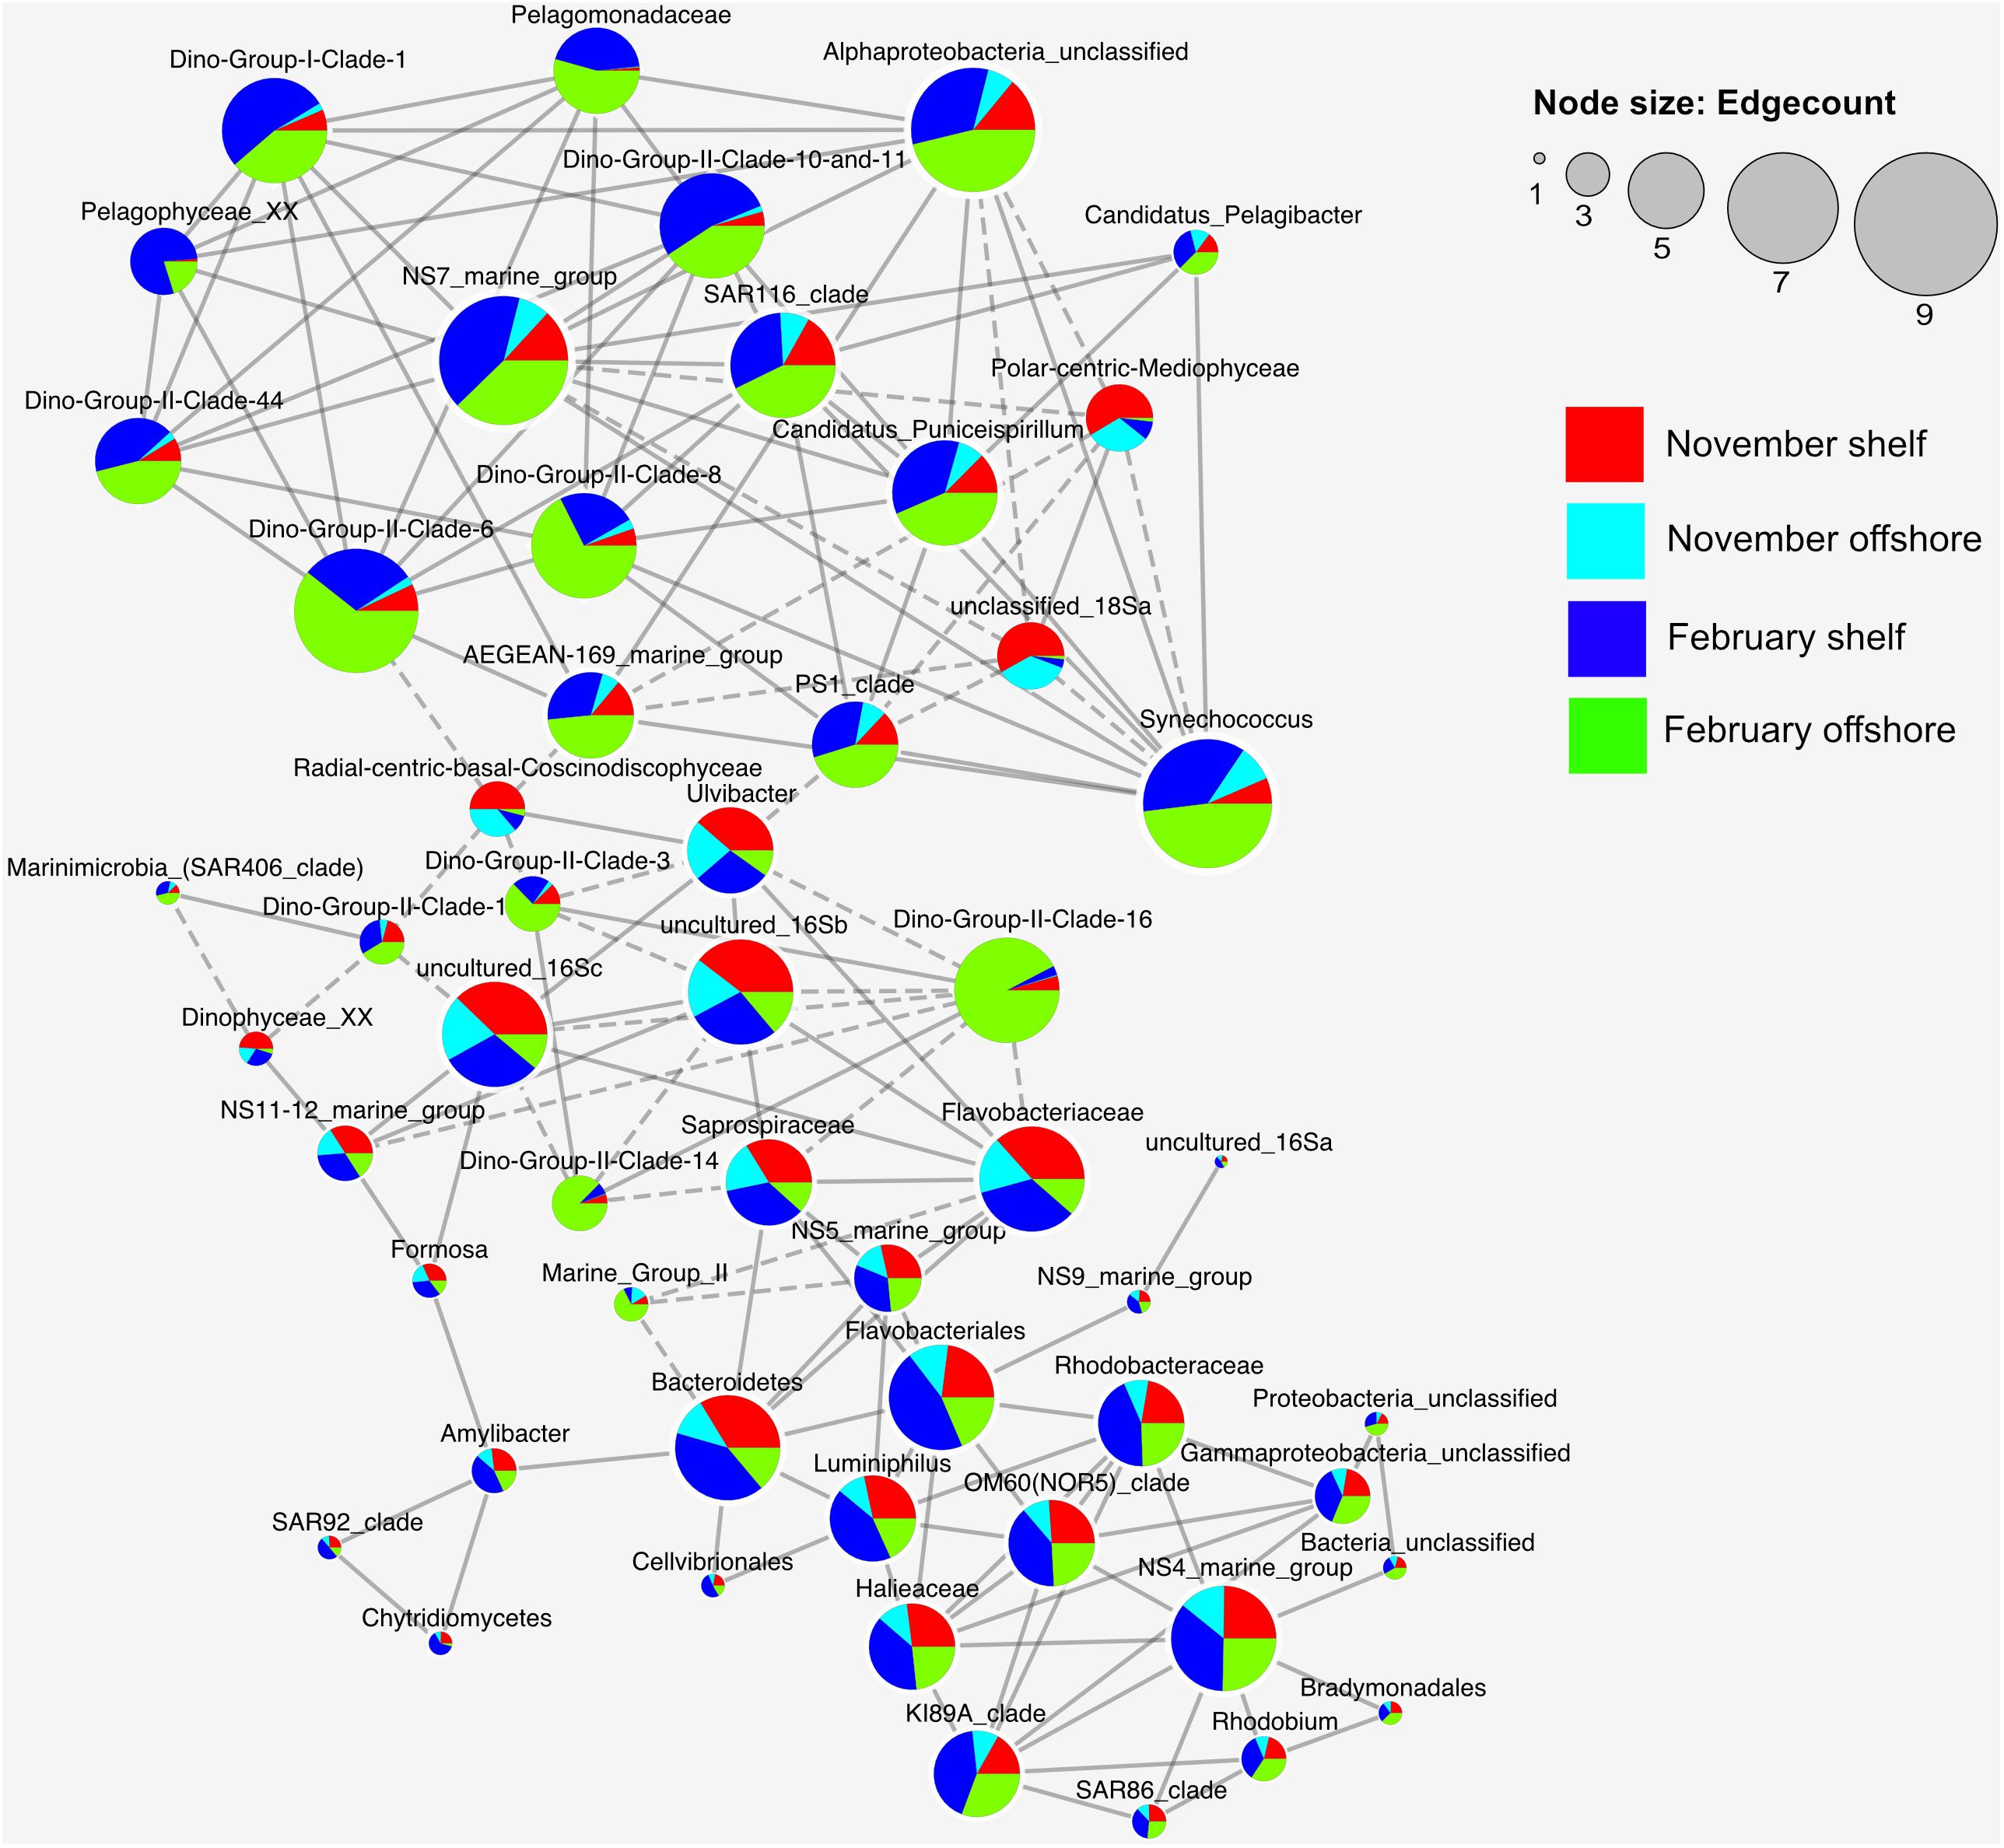
Figure 6. Co-occurrence network analysis for the top 37 bacterioplankton and picoeukaryote families present in the November 2015 and February 2016 samples. Only the Spearman rank correlations that were statistically significant (P < 0.01) and strong (r > 0.8) are shown. Edges with dashed lines represent negative associations (r-values), and nodes are sized relative to how many edges are connected to each node.
Discussion
This study is one of the first of its kind to investigate both prokaryotic and picoeukaryotic community composition and structure in the coastal upwelling region of the Southern Benguela using next generation sequencing methods. Stations 3, 5, and 13 lie in a region that typically experiences active upwelling (Shillington et al., 2006; Hutchings et al., 2009) in the spring and summer months, and stations 7 and 8 are located over the continental slope, receiving modified or aged upwelled water that has moved offshore. Upwelling stages usually start in September and last until the equatorward south-easterly winds stop blowing, around March. Results revealed a shift in community compositions in response to changes in hydrography associated with upwelling stages, with offshore and shelf stations presenting significantly different microbial community compositions in the February bacterioplankton data, and with markedly different microbial communities found in deep, hypoxic (dissolved oxygen <2mg L–1) water samples. As wind data only indicate a strong south-easterly wind in the days immediately leading up to the September sampling date (Supplementary Table S1), shifts in community distributions are more likely to be responding to less recent upwelling events shaping the water column (i.e., mature and aged upwelled waters).
Physical Environment
Temperature and salinity profiles suggested that May samples were from a stratified environment with evidence of a dying dinoflagellate (Ceratium sp.) bloom, which took place at station 3. Nitrate profiles provided additional evidence of stratification, with low surface values indicating nutrient consumption by a similar bloom at station 5 (Heisler et al., 2008). September nutrient data indicated different stages of upwelling at stations 5 and 13. Station 13 exhibited 6-fold higher surface nitrate concentrations compared to station 5 (Figure 2) suggesting stratified, bloom-like conditions at station 5, and a recent upwelling event at station 13. This is further supported by Cape Colombine wind data (Supplementary Table S1). These two stations are not far from each other (∼1–2 km) within St Helena Bay, where topography and bathymetry influence water retention. This is further encouraged by the equatorward Benguela coastal jet which, along with wind stress shear, promotes a clockwise circulation here (Penven et al., 2000). This phenomenon plays a role in causing physical, chemical and biological variability at the shelf stations (Nicholson, 2010). Shelf surface water temperatures in both November and February were warmer than 11°, indicating that, for both of these sampling periods, the water column was relaxed, or in between upwelling events (Brown, 1984) which typically take place on a 7–10 days cycle in the austral summer months (Jury et al., 2010). Nutrients such as nitrate and silicate were depleted compared with those at the Fmax, indicating recent bloom-like activity in a stratified environment.
Bacterioplankton Community Diversity, Composition
Bacterioplankton species diversity was consistently higher offshore during February and November (Figure 3 and Table 2). It is hypothesized that bacterial production inshore would be expected to be high due to increased availability of carbon substrate in the form of dying dinoflagellate blooms and picoeukaryotes (Supplementary Figure S1). However, only a select group of bacteria are specialized copiotrophs (i.e., Rhodobacteriales and Flavobacteria) (Dang et al., 2007). This would result in a low species diversity inshore as these primary colonizers can outcompete their slower-growing counterparts. As these waters mature and move offshore, the dissolved organic carbon (DOC) brought to the surface will undergo photochemical transformation, rendering it more bioavailable (Mopper et al., 1991). This would allow for an increased number of bacterial species to take hold and thrive. These mature upwelled waters therefore represent a transitional state from upwelling to aged upwelled waters, and this transition would introduce increased resource availability for the prokaryotic community. Low biodiversity offshore in May compared to that in stratified shelf waters could be the product of water current variability in this region. Offshore stations that previously received mature upwelled water during upwelling (species succession) would no longer do so, allowing different water masses to move in (Brown and Hutchings, 1987). Deep and hypoxic waters in September did not show a huge difference in biodiversity compared to surface waters. The high nutrients and available dissolved organic carbon (DOC) here favor the development of micro niche environments, allowing growth of different bacterial taxa despite lower available oxygen.
Rhodobacteriales and Flavobacteria were dominant everywhere, but especially in shelf waters (Figures 3B, 4A). Rhodobacteriales, in particular, is a known keystone primary colonizer, one of the fastest users of accumulated nutrients and playing important roles in carbon and sulfur cycling and trace metal reduction (Dang et al., 2007). Subsequent colonizers are Oceanospirillales, Bacteroidetes (using primarily detritus as a carbon source; Bauer et al., 2006), Sphingobacteriales and Alteromonadales. Bacteroidetes were not very abundant in this dataset, and Alteromonadales was most abundant in May and September samples, most likely thriving on large amounts of substrate material, especially diatoms, for which they are major colonizers (Bidle and Azam, 2001). SAR92 (Alteromonadales), SAR11 and SAR86 (Oceanospirillales) are ubiquitous, both in this dataset and elsewhere. Their primary mode of metabolism is the heterotrophic assimilation of dissolved organic carbon, of which there is an abundance in this highly productive region (Giovannoni et al., 2005b; Grote et al., 2012; Tripp, 2013; Cameron et al., 2014). Proteorhodopsin, a light dependant proton pump, has been discovered in these same orders, suggesting they are also capable of phototrophy (Sabehi et al., 2004; Giovannoni et al., 2005a; Stingl et al., 2007). This explains their abundance in both nutrient- and carbon-rich surface waters, and in light-deficient waters at depth. Bacteria containing proteorhodopsin have a fitness advantage compared to their competitors, as they are capable of surviving prolonged starvation in high light conditions (Gomez-Consarnau et al., 2010). SAR86, in particular, which has the potential for proteorhodopsin-based ATP generation (Dupont et al., 2012), was abundant in mature upwelled waters and at depth (Figure 4).
Some of the top 16S OTUs in hypoxic and bottom waters included prokaryotes such as Desulfobacteriales, and Desulfuromonadales (Figure 4A). All of these bacterial orders are specialist sulfate and iron reducer groups at depth (Miletto et al., 2011), reducing sulfur to sulfide, partly freeing up particulate organic matter at depth. Despite September shelf samples showing drastically different physical and chemical signatures (station 13 upwelling vs. station 5 relaxed water column), their bacterioplankton community structure clustered together, alongside May offshore surface samples. This could be due to similar carbon sources in each of these samples. Further studies are needed to confirm this. May offshore bacterioplankton clustering with these samples is most likely explained by the high surface water current variability in this region (Lutjeharms, 2007). Surface waters are displaced offshore quickly, often circulating back into the bay.
Community composition varied for the less abundant 16S reads, particularly between non-upwelling and upwelling months. Orders such as Chromatiales and the nitrite-oxidizing Nitrospina were present in May and September, but not in November and February. Chromatiales were mostly present in hypoxic or bottom waters and, in May, in surface waters at station 3. The dominant family present in these samples was Granulosicoccacae, a known primary colonizer of kelp, which is also abundant in these coastal waters (Bengtsson et al., 2011, 2012). A large number of prokaryotic orders also were present in November and February, such as Verrumicrobiales, Bdellovibrionales, KI89A-clade (Gammaproteobacteria) and Clostridiales. Clostridiales in particular are known obligate anaerobes (Zhao et al., 2003), and could have been be kept alive in oxygenated waters through inhabiting upwelled aggregated organic matter (Bristow, 2018).
Nitrite and Ammonium Oxidation
Both nitrite oxidizing bacteria and ammonium oxidizing archaea were present in this dataset (Figure 4A). These results are most likely skewed due to the fact that the primer set used for the 16S samples did not have sufficient coverage of Archaea, and so caution must be paid to these results. Despite this, Nitrospina have been known to increase activity in late spring at in situ light levels (Levipan et al., 2016). A significant amount of nitrification is known to take place in coastal and upwelling waters (Fernandez and Farías, 2012; Levipan et al., 2014), performed by ammonium oxidizing archaea and bacteria. Nitrosopumillus maritimus, the ammonium oxidizing archaea found in the November and February samples, were previously thought to be inhibited by light. However, new strains (PS0 and HCA) are proving to have a high tolerance to light (Qin et al., 2014). Cheung et al. (2019) recently redefined these previously defined AOA clades, revealing diverse sub lineages containing varying ecophysiological characteristics. Further investigation is needed in this region in order to properly understand how and who is responsible for regenerating nitrogen.
Bacterioplankton clustering was influenced by nitrogen species as well as silicate and dissolved oxygen concentration (MANOVA, p < 0.001) (Figure 6A). Given the presence of nitrifying bacteria and archaea in September shelf and February offshore samples, respectively, these organisms probably play an important biogeochemical cycling role in this ecosystem. Correlations with silicate suggest that these species are using senescent diatom populations as their carbon source, i.e., Amin et al. (2012). In general, the community structure agrees with previous studies from upwelling regions. Alonso-Gutiérrez et al. (2009) revealed seasonal changes in the bacterioplankton community structure in the coastal upwelling region of “Ría de Vigo,” NW Spain, driven by Roseobacter, Bacteroidetes, and SAR86, as in this study. Bergen et al. (2015) also revealed high abundances of Bacteroidetes and Gammaproteobacteria in productive upwelled waters in the Northern Benguela, in contrast to an abundance of Pelagibacterales in less productive waters, as also found in this study (i.e., Figures 4, 6).
Picoeukaryote Diversity and Composition
Picoeukaryote species diversity was highest in February in surface waters, most likely due to high nutrient and light availability. High biomass in surface waters was associated with a decreased biodiversity at Fmax at this same station, likely due to light limitation from surface waters. A drop in species diversity at station 5 surface waters in November compared to the Fmax sample can most likely be attributed to fewer available nutrients and, therefore, lower biomass in surface waters, allowing for higher light availability in Fmax waters.
The significant split in picoeukaryote community structure from November to February confirms a seasonal shift in the picoeukaryote community as the upwelling season progresses. Likewise, the split in community structure from shelf to offshore in February vs. the lack of one in November (especially for picoeukaryotes) illustrates upwelling-induced spatial variability, as shown in other upwelling systems in the California current and off northwest Africa (Baltar et al., 2007; Alonso-Gutiérrez et al., 2009; Teira et al., 2009; Allen et al., 2012).
In February, the parasitic Syndiniales dominated our dataset (Figures 3A, 4A). With the increasing use of deep sequencing technologies to describe marine microbial communities, these parasites, which are very difficult to identify under the microscope, have been shown to have a large presence in many microbial datasets. Known to be strictly obligate parasites (Guillou et al., 2008), the presence of Syndiniales in such high biomass sampling sites implies their active involvement in mitigating the spread of algal blooms. Syndiniales split primarily into two groups, Dino gp I and II, each representing 12 and 26% of the whole dataset, respectively. This agrees with the current literature (Guillou et al., 2008; Chambouvet et al., 2011). Further studies are underway investigating their hosts at this place and time. Figure 6 suggests they may be associated with diatoms. No known study to date has documented Syndiniales in such high numbers in this region.
Picoeukaryotes distributed significantly by their trophic associations (Supplementary Figure S3). November waters were occupied primarily by diatom species, mostly Polar centric Mediophyceae, defined as “floating autotrophs” in this figure. Despite the fact that these samples are coming from aged upwelled waters with reduced nutrient concentrations, it is likely that this species’ signature is resulting from a dying bloom that has stripped most nutrients from surface waters. February samples, however, classified as more mature or aged upwelled waters were dominated by parasites as described above. Different species assemblages occupied these waters inshore vs. offshore. Not enough is known about these to further discuss their ecological function here. Interestingly, a higher percentage of swimming autotrophs as well as mixotrophs were found in February waters compared to November waters, suggesting a life strategy that would benefit in bloom like waters where light is quickly a limiting factor.
The additional cercozoa and a number of diatom species found inshore in November are typical indicators of post upwelling conditions (e.g., Pitcher, 1990). Syndiniales again dominated the Fmax samples, most likely taking advantage of the sinking dinoflagellate bloom (Chambouvet et al., 2008; Montagnes et al., 2008; Chambouvet et al., 2011).
Network Analysis: Bacterioplankton – Picoeukaryote Interactions
The network analysis revealed some interesting trends with regard to bacterioplankton-picoeukaryote organism distribution within the samples as well as Dino-Gp II co-occurrences. It has already been established that bacterioplankton species diversity is significantly different between shelf and inshore waters, and eukaryotic diversity is significantly different between shelf and inshore in February but not in November (Figure 3). Dino gp II are known to be highly genetically diverse, occupying up to 30% of some picoeukaryote datasets and infecting a diverse range of hosts (Guillou et al., 2008). They also previously have been reported to have a high number of correlations with other OTUs in Saanich inlet, a seasonally anoxic fjord (Torres-Beltran et al., 2018). Negative associations were less frequent but mostly occurred between diatoms and Dino gp II clades 1, 3, and 6. The bottom cluster in Figure 6 primarily contained families that were mostly found inshore and rely on fresh carbon typically produced from highly productive inshore/shelf waters. These families (Flavobacteriales, Bacteroidetes, Rhodobacteraceae) can be typically found together in productive surface waters (Buchan et al., 2014) showing evidence of a type of mutualistic metabolism, whereby one species facilitates the growth of others resulting in multispecies biochemical dependencies (Prokopenko et al., 2013).
Conclusion
This study provides a snapshot comparison of the microbial (bacterioplankton and picoeukaryote) community in a key upwelling region in the productive Southern Benguela upwelling ecosystem. Picoeukaryotes showed clear spatial variability in communities in November and February, indicating a significant adaptation of the picoeukaryote community as the seasons progressed. 16S OTUs clustered by nitrogen concentration, revealing key prokaryotic signatures as upwelling waters aged and moved offshore. Key carbon metabolisers such as Flavobacteriales and Rhodobacteriales give way to slower-growing species such as SAR11 and Clostridiales. Notable results that deserve further investigation include the presence of ammonium oxidizing archaea offshore, which correlate with the nitrite maximum. If proven to be active, this would indicate that regenerated production is playing a significant role in these waters. The overwhelming presence of Syndiniales parasites in offshore and Fmax samples in February indicate active carbon and nutrient cycling at a different trophic level. Their further significant negative association with certain diatom species seems to be a novel finding not yet investigated in detail. Further investigations are ongoing to confirm these associations. This could have a large impact on carbon export, because the major processes involved in bloom degradation currently are thought to be zooplankton grazing and bacterial degradation.
Data Availability Statement
The datasets generated for this study can be found in the ENA accession numbers ERS3223437-ERS3223461.
Author Contributions
ER, CM, and HL designed the study. ER and ZG collected the samples. SC and HL sequenced the May and September 16S samples. ER and ND analyzed the data. All authors read and approved the final manuscript.
Funding
This work was based upon research supported by the National Research Foundation project # 98967, and the Swiss Polar Institute Antarctic Circumnavigation Expedition Grant, Project 12 (S. Fawcett). The Applied Center for Climate and Earth Systems Science also partly funded this project.
Conflict of Interest
The authors declare that the research was conducted in the absence of any commercial or financial relationships that could be construed as a potential conflict of interest.
Acknowledgments
We thank the officers, crew, and scientists of the R/V Algoa for their assistance during the IEP research cruises. We also thank the South African Department of Environmental Affairs (Integrated Ecosystem Program) for providing ship time for this project. Computations were performed using facilities provided by the University of Cape Town’s ICTS High Performance Computing team: hpc.uct.ac.za.
Supplementary Material
The Supplementary Material for this article can be found online at: https://www.frontiersin.org/articles/10.3389/fmars.2020.00255/full#supplementary-material
Footnotes
References
Aldunate, M., De La Iglesia, R., Bertagnolli, A. D., and Ulloa, O. (2018). Oxygen modulates bacterial community composition in the coastal upwelling waters off central Chile. Deep Sea Res. II Top. Stud. Oceanogr. 156, 68–79. doi: 10.1016/j.dsr2.2018.02.001
Allen, L. Z., Allen, E. E., Badger, J. H., Mccrow, J. P., Paulsen, I. T., Elbourne, L. D., et al. (2012). Influence of nutrients and currents on the genomic composition of microbes across an upwelling mosaic. ISME J. 6, 1403–1414. doi: 10.1038/ismej.2011.201
Alonso-Gutiérrez, J., Lekunberri, I., Teira, E., Gasol, J. M., Figueras, A., and Novoa, B. (2009). Bacterioplankton composition of the coastal upwelling system of ‘Ría de Vigo’, NW Spain. FEMS Microbiol. Ecol. 70, 493–505. doi: 10.1111/j.1574-6941.2009.00766.x
Amin, S. A., Parker, M. S., and Armbrust, E. (2012). Interactions between diatoms and bacteria. Microbiol. Mol. Biol. Rev. 76, 667–684. doi: 10.1128/MMBR.00007-12
Andrews, W. R. H., and Hutchings, L. (1980). Upwelling in the Southern Benguela current. Prog. Oceanogr. 9, 1–81. doi: 10.1016/0079-6611(80)90015-4
Anna, E., Victor, K., Kelly, C. W., Natasha, Z., Feng, C., Howard, O., et al. (2010). Experimental factors affecting PCR-based estimates of microbial species richness and evenness. ISME J. 4:642. doi: 10.1038/ismej.2009.153
Baltar, F., Arístegui, J., Gasol, J. M., Hernández-León, S., and Herndl, G. J. (2007). Strong coast-ocean and surface-depth gradients in prokaryotic assemblage structure and activity in a coastal transition zone region. Aquat. Microb. Ecol. 50, 63–74. doi: 10.3354/ame01156
Barlow, R. G. (1982). Phytoplankton ecology in the Southern Benguela current. I. Biochemical composition. J. Exp. Mar. Biol. Ecol. 63, 209–227. doi: 10.1016/0022-0981(82)90179-4
Bauer, M., Kube, M., Teeling, H., Richter, M., Lombardot, T., Allers, E., et al. (2006). Whole genome analysis of the marine Bacteroidetes ‘ Gramella forsetii ‘ reveals adaptations to degradation of polymeric organic matter. Environ. Microbiol. 8, 2201–2213. doi: 10.1111/j.1462-2920.2006.01152.x
Bengtsson, M. M., Sjøtun, K., Lanzén, A., and Øvreas, L. (2012). Bacterial diversity in relation to secondary production and succession on surfaces of the kelp Laminaria hyperborea. ISME J. 6, 2188–2198. doi: 10.1038/ismej.2012.67
Bengtsson, M. M., Sjøtun, K., Storesund, J. E., and Øvreas, L. (2011). Utilization of kelp-derived carbon sources by kelp surface-associated bacteria. Aquat. Microb. Ecol. 62, 191–199. doi: 10.3354/ame01477
Bergen, B., Herlemann, D. P., and Jurgens, K. (2015). Zonation of bacterioplankton communities along aging upwelled water in the northern Benguela upwelling. Front. Microbiol. 6:621. doi: 10.3389/fmicb.2015.00621
Bidle, K. D., and Azam, F. (2001). Bacterial control of silicon regeneration from diatom detritus: significance of bacterial ectohydrolases and species identity. Limnol. Oceanogr. 46, 1606–1623. doi: 10.4319/lo.2001.46.7.1606
Blamey, L. K., Plagányi, E. E., and Branch, G. M. (2013). Modeling a regime shift in a kelp forest ecosystem caused by a lobster range expansion. Bull. Mar. Sci. 89, 347–375. doi: 10.5343/bms.2011.1127
Boyd, A. J., and Nelson, G. (1998). Variability of the Benguela current off the Cape Peninsula, South Africa. S. Afr. J. Mar. Sci. 19, 27–39. doi: 10.2989/025776198784126665
Brown, P. C. (1984). Primary production at two contrasting nearshore sites in the Southern Benguela upwelling region, 1977—1979. S. Afr. J. Mar. Sci. 2, 205–215. doi: 10.2989/02577618409504369
Brown, P. C., and Hutchings, L. (1987). The development and decline of phytoplankton blooms in the southern Benguela upwelling system. 1. Drogue movements, hydrography and bloom development. S. Afr. J. Mar. Sci. 5, 357–391. doi: 10.2989/025776187784522801
Buchan, A., Lecleir, G. R., Gulvik, C. A., and González, J. (2014). Master recyclers: features and functions of bacteria associated with phytoplankton blooms. Nat. Rev. Microbiol. 12, 686–698. doi: 10.1038/nrmicro3326
Buitenhuis, E. T., Li, W. K. W., Vaulot, D., Lomas, M. W., Landry, M. R., Partensky, F., et al. (2012). Picophytoplankton biomass distribution in the global ocean. Earth Syst. Sci. Data 4, 37–46. doi: 10.5194/essd-4-37-2012
Cameron, T. J., Temperton, B., Swan, B. K., Landry, Z. C., Woyke, T., Delong, E. F., et al. (2014). Single-cell enabled comparative genomics of a deep ocean SAR11 bathytype. ISME J. 8, 1440–1451. doi: 10.1038/ismej.2013.243
Caporaso, J. G., Justin, K., Jesse, S., Kyle, B., Frederic, D. B., Elizabeth, K. C., et al. (2010). QIIME allows analysis of high-throughput community sequencing data. Nat. Methods 7:335.
Chambouvet, A., Laabir, M., Sengco, M., Vaquer, A., and Guillou, L. (2011). Genetic diversity of Amoebophryidae (Syndiniales) during Alexandrium catenella/tamarense (Dinophyceae) blooms in the Thau lagoon (Mediterranean Sea, France). Res. Microbiol. 162, 959–968. doi: 10.1016/j.resmic.2011.03.002
Chambouvet, A., Morin, P., Marie, D., and Guillou, L. (2008). Control of toxic marine dinoflagellate blooms by serial parasitic killers. Science 322, 1254–1257. doi: 10.1126/science.1164387
Cheung, S., Mak, W., Xia, X., Lu, Y., Cheung, Y., and Liu, H. (2019). Overlooked genetic diversity of ammonia oxidizing archaea lineages in the global oceans. J. Geophys. Res. Biogeosci. 124, 1799–1811. doi: 10.1029/2018jg004636
Cockcroft, A. C., Van Zyl, D., and Hutchlngs, L. (2008). Large-scale changes in the spatial distribution of South African West Coast rock lobsters: an overview. Afr. J. Mar. Sci. 30, 149–159. doi: 10.2989/ajms.2008.30.1.15.465
Cuevas, L. A., Daneri, G., Jacob, B., and Montero, P. (2004). Microbial abundance and activity in the seasonal upwelling area off concepción (∼36°S), central Chile: a comparison of upwelling and non-upwelling conditions. Deep Sea Res. II Top. Stud. Oceanogr. 51, 2427–2440. doi: 10.1016/j.dsr2.2004.07.026
Daigle, D., Simen, B. B., and Pochart, P. (2011). High-throughput sequencing of PCR products tagged with universal primers using 454 life sciences systems. Curr. Protoc. Mol. Biol. Chapter 7:Unit7.5. doi: 10.1002/0471142727.mb0705s96
Dang, H., Li, T., Chen, M., and Huang, G. (2007). Cross-Ocean distribution of Rhodobacterales bacteria as primary surface colonizers in temperate coastal marine waters. Appl. Environ. Microbiol. 74, 52–60. doi: 10.1128/aem.01400-07
Diamond, D. (1994). QuikChem Method 10-114-21-1-B: Silicate by Flow Injection Analysis. Milwaukee, WI: Lachat Instruments.
Dupont, C. L., Rusch, D. B., Yooseph, S., Lombardo, M. J., Richter, R. A., Valas, R., et al. (2012). Genomic insights to SAR86, an abundant and uncultivated marine bacterial lineage. ISME J. 6, 1186–1199. doi: 10.1038/ismej.2011.189
Egan, L. (2008). QuikChem Method 31-107-04-1-C: Nitrate and/or Nitrite in Brackish or Seawater. Milwaukee, WI: Lachat Instruments.
Fernandez, C., and Farías, L. (2012). Assimilation and regeneration of inorganic nitrogen in a coastal upwelling system: ammonium and nitrate utilization. Mar. Ecol. Prog. Ser. 451, 1–14. doi: 10.3354/meps09683
Foster, S. L. F., Sharpton, T. J., and Grunwald, N. J. (2017). Metacoder: an R package for visualization and manipulation of community taxonomic diversity data. PLoS Biol. 13:e1005404. doi: 10.1371/journal.pcbi.1005404
Giovannoni, S. J., Bibbs, L., Cho, J. C., Stapels, M. D., Desiderio, R., Vergin, K. L., et al. (2005a). Proteorhodopsin in the ubiquitous marine bacterium SAR11. Nature 438, 82–85. doi: 10.1038/nature04032
Giovannoni, S. J., Tripp, H. J., Givan, S., Podar, M., Vergin, K. L., Baptista, D., et al. (2005b). Genetics: genome streamlining in a cosmopolitan oceanic bacterium. Science 309, 1242–1245. doi: 10.1126/science.1114057
Gomez-Consarnau, L., Akram, N., Lindell, K., Pedersen, A., Neutze, R., Milton, D. L., et al. (2010). Proteorhodopsin phototrophy promotes survival of marine bacteria during starvation. PLoS Biol. 8:e1000358. doi: 10.1371/journal.pbio.1000358
Grote, J., Cameron Thrash, J., Huggett, M. J., Landry, Z. C., Carini, P., Giovannoni, S. J., et al. (2012). Streamlining and core genome conservation among highly divergent members of the SAR11 clade. mBio 3:e00252-12. doi: 10.1128/mBio.00252-12
Guillou, L., Viprey, M., Chambouvet, A., Welsh, R. M., Kirkham, A. R., Massana, R., et al. (2008). Widespread occurrence and genetic diversity of marine parasitoids belonging to Syndiniales (Alveolata). Environ. Microbiol. 10, 3349–3365. doi: 10.1111/j.1462-2920.2008.01731.x
Heisler, J., Glibert, P. M., Burkholder, J. M., Anderson, D. M., Cochlan, W., Dennison, W. C., et al. (2008). Eutrophication and harmful algal blooms: a scientific consensus. Harmful Algae 8, 3–13. doi: 10.1016/j.hal.2008.08.006
Hutchings, L., Van Der Lingen, C. D., Shannon, L. J., Crawford, R. J. M., Verheye, H. M. S., Bartholomae, C. H., et al. (2009). The Benguela current: an ecosystem of four components. Prog. Oceanogr. 83, 15–32. doi: 10.1016/j.pocean.2009.07.046
Jardillier, L., Zubkov, M. V., Pearman, J., and Scanlan, D. J. (2010). Significant CO2 fixation by small prymnesiophytes in the subtropical and tropical northeast Atlantic Ocean. ISME J. 4, 1180–1192. doi: 10.1038/ismej.2010.36
Jari Oksanen, F. G. B., Michael, F., Roeland, K., Pierre Legendre, D. M., Peter, R., Minchin, R. B., et al. (2017). vegan: Community Ecology Package. Available online at: https://CRAN.R-project.org/package=vegan
John, H. M., Allan, K., Thomas, E. F., and Alexander, R. P. (2014). enhancedGraphics: a cytoscape app for enhanced node graphics. F1000Res. 3:147. doi: 10.12688/f1000research.4460.1
Jury, M. R., MacArthur, C. I., and Brundrit, G. B. (2010). Pulsing of the Benguela upwelling region: largescale atmospheric controls. S. Afr. J. Mar. Sci. 9, 27–41. doi: 10.2989/025776190784378826
Kerkhof, L., Voytek, M. A., Sherrell, R. M., Millie, D., and Schofield, O. (1999). Variability in bacterial community structure during upwelling in the coastal ocean. Hydrobiologia 401, 139–148. doi: 10.1007/s00248-018-1179-z
Koeppel, A., Perry, E. B., Sikorski, J., Krizanc, D., Warner, A., Ward, D. M., et al. (2008). Identifying the fundamental units of bacterial diversity: a paradigm shift to incorporate ecology into bacterial systematics. Proc. Natl. Acad. Sci. U.S.A. 105, 2504–2509. doi: 10.1073/pnas.0712205105
Lamont, T., Barlow, R. G., and Kyewalyanga, M. S. (2014). Physical drivers of phytoplankton production in the southern Benguela upwelling system. Deep Sea Res. I Oceanogr. Res. Pap. 90, 1–16. doi: 10.1016/j.dsr.2014.03.003
Letscher, R. T., Knapp, A. N., James, A. K., Carlson, C. A., Santoro, A. E., and Hansell, D. A. (2015). Microbial community composition and nitrogen availability influence DOC remineralization in the South Pacific Gyre. Mar. Chem. 177, 325–334. doi: 10.1016/j.marchem.2015.06.024
Lett, C., Roy, C., Levasseur, A., Van Der Lingen, C. D., and Mullon, C. (2006). Simulation and quantification of enrichment and retention processes in the southern Benguela upwelling ecosystem. Fish. Oceanogr. 15, 363–372. doi: 10.1111/j.1365-2419.2005.00392.x
Levipan, H. A., Molina, V., Anguita, C., Rain-Franco, A., Belmar, L., and Fernandez, C. (2016). Variability of nitrifying communities in surface coastal waters of the Eastern South Pacific (approximately 36 degrees S). Environ. Microbiol. Rep. 8, 851–864. doi: 10.1111/1758-2229.12448
Levipan, H. A., Molina, V., and Fernandez, C. (2014). Nitrospina-like bacteria are the main drivers of nitrite oxidation in the seasonal upwelling area of the Eastern South Pacific (Central Chile ∼36°S). Environ. Microbiol. Rep. 6, 565–573. doi: 10.1111/1758-2229.12158
Loman, N. J., Misra, R. V., Dallman, T. J., Constantinidou, C., Gharbia, S. E., Wain, J., et al. (2012). Performance comparison of benchtop high-throughput sequencing platforms. Nat. Biotechnol. 30, 434–439. doi: 10.1038/nbt.2198
Lutjeharms, J. R. E. (2007). Three decades of research on the greater Agulhas current. Ocean Sci. 3, 129–147. doi: 10.5194/os-3-129-2007
Magoč, T., and Salzberg, S. L. (2011). FLASH: fast length adjustment of short reads to improve genome assemblies. Bioinformatics 27, 2957–2963. doi: 10.1093/bioinformatics/btr507
Marie, D., Partensky, F., Jacquet, S., and Vaulot, D. (1997). Enumeration and cell cycle analysis of natural populations of marine picoplankton by flow cytometry using the nucleic acid stain SYBR Green I. Appl. Environ. Microbiol. 63, 186–193. doi: 10.1128/aem.63.1.186-193.1997
McMurdie, P. J., and Holmes, S. (2013). phyloseq: an R package for reproducible interactive analysis and graphics of microbiome census data. PLoS One 8:e61217. doi: 10.1371/journal.pone.0061217
Miletto, M., Williams, K. H., N’guessan, A. L., and Lovley, D. R. (2011). Molecular analysis of the metabolic rates of discrete subsurface populations of sulfate reducers. Appl. Environ. Microbiol. 77:6502. doi: 10.1128/AEM.00576-11
Moloney, C. L., Field, J. G., and Lucas, M. I. (1991). The size-based dynamics of plankton food webs.II, simulations of three contrasting southern benguela food webs. J. Plankton Res. 13, 1039–1092. doi: 10.1093/plankt/13.5.1039
Montagnes, D. J. S., Chambouvet, A., Guillou, L., and Fenton, A. (2008). Responsibility of microzooplankton and parasite pressure for the demise of toxic dinoflagellate blooms. Aquat. Microb. Ecol. 53, 211–225. doi: 10.3354/ame01245
Montecino, V., Astoreca, R., Alarcón, G., Retamal, L., and Pizarro, G. (2004). Bio-optical characteristics and primary productivity during upwelling and non-upwelling conditions in a highly productive coastal ecosystem off central Chile (∼36°S). Deep Sea Res. II Top. Stud. Oceanogr. 51, 2413–2426. doi: 10.1016/j.dsr2.2004.08.012
Mopper, K., Zhou, X., Kieber, R. J., Kieber, D. J., Sikorski, R. J., and Jones, R. D. (1991). Photochemical degradation of dissolved organic carbon and its impact on the oceanic carbon cycle. Nature 353, 60–62. doi: 10.1038/353060a0
Nicholas, A. B., Sathish, S., Jeremiah, J. F., Dirk, G., Jeffrey, I. G., Rob, K., et al. (2012). Quality-filtering vastly improves diversity estimates from Illumina amplicon sequencing. Nat. Methods 10:57. doi: 10.1038/nmeth.2276
Nicholson, S. E. (2010). A low-level jet along the Benguela coast, an integral part of the Benguela current ecosystem. Clim. Chang. 99, 613–624. doi: 10.1007/s10584-009-9678-z
Painting, S. J. (1989). Bacterioplankton Dynamics in the Southern Benguela Upwelling Region. Ph.D. Thesis, University of Cape Town, Cape Town.
Painting, S. J., Moloney, C. L., and Lucas, M. I. (1993). Simulation and field measurements of phytoplankton-bacteria- zooplankton interactions in the southern Benguela upwelling region. Mar. Ecol. Prog. Ser. 100, 55–69. doi: 10.3354/meps100055
Penven, P., Roy, C., Colin de Verdière, A., and Largier, J. (2000). Simulation of a coastal jet retention process using a barotropic model. Oceanol. Acta 23, 615–634. doi: 10.1016/s0399-1784(00)01106-3
Pitcher, G. C. (1990). Phytoplankton seed populations of the Cape Peninsula upwelling plume, with particular reference to resting spores of Chaetoceros (bacillariophyceae) and their role in seeding upwelling waters. Estuar. Coast. Shelf Sci. 31, 283–301. doi: 10.1016/0272-7714(90)90105-z
Pitcher, G. C., Probyn, T. A., Du Randt, A., Lucas, A. J., Bernard, S., Evers-King, H., et al. (2014). Dynamics of oxygen depletion in the nearshore of a coastal embayment of the southern Benguela upwelling system. J. Geophys. Res. Oceans 119, 2183–2200. doi: 10.1002/2013jc009443
Ploner, A. (2019). Heatplus: Heatmaps with Row and/or Column Covariates and Colored Clusters. R package version 2.30.0.
Prieto, A., Barber-Lluch, E., Hernández-Ruiz, M., Martínez-García, S., Fernández, E., and Teira, E. (2016). Assessing the role of phytoplankton–bacterioplankton coupling in the response of microbial plankton to nutrient additions. J. Plankton Res. 38, 55–63. doi: 10.1093/plankt/fbv101
Prokopenko, M. G., Hirst, M. B., De Brabandere, L., Lawrence, D. J. P., Berelson, W. M., Granger, J., et al. (2013). Nitrogen losses in anoxic marine sediments driven by Thioploca–anammox bacterial consortia. Nature 500, 194–198. doi: 10.1038/nature12365
Qin, W., Amin, S. A., Martens-Habbena, W., Walker, C. B., Urakawa, H., Devol, A. H., et al.. (2014). Marine ammonia-oxidizing archaeal isolates display obligate mixotrophy and wide ecotypic variation. Proc. Natl. Acad. Sci. U.S.A. 111, 12504–12509. doi: 10.1073/pnas.1324115111
Quince, C., Lanzen, A., Davenport, R. J., and Turnbaugh, P. J. (2011). Removing noise from pyrosequenced amplicons. BMC Bioinform. 12:38. doi: 10.1186/1471-2105-12-38
Sabehi, G., Beja, O., Suzuki, M. T., Preston, C. M., and Delong, E. F. (2004). Different SAR86 subgroups harbour divergent proteorhodopsins. Environ. Microbiol. 6, 903–910. doi: 10.1111/j.1462-2920.2004.00676.x
Schloss, P. D., Westcott, S. L., Ryabin, T., Hall, J. R., Hartmann, M., Hollister, E. B., et al. (2009). Introducing mothur: open-source, platform-independent, community-supported software for describing and comparing microbial communities. Appl. Environ. Microbiol. 75, 7537–7541. doi: 10.1128/AEM.01541-09
Shillington, F., Reason, C. J. C., Duncombe Rae, C. M., Florenchie, P., and Penven, P. (2006). “Large scale physical variability of the Benguela current large marine ecosystem (BCLME),” in Benguela: Predicting a Large Marine Ecosystem, large marine ecosystems, eds G. Shannon, P. Hempel, C. Malanotte-Rizzoli, C. L. Moloney, and J. Woods (Amsterdam: Elsevier).
Sinclair, L., Osman, O. A., Bertilsson, S., and Eiler, A. (2015). Microbial community composition and diversity via 16S rRNA gene amplicons: evaluating the illumina platform. PLoS One 10:e0116955. doi: 10.1371/journal.pone.0116955
Smith, D. P., and Peay, K. G. (2014). Sequence depth, not PCR replication, improves ecological inference from next generation DNA sequencing. PLoS One 9:e90234. doi: 10.1371/journal.pone.0090234
Stingl, U., Desiderio, R. A., Cho, J. C., Vergin, K. L., and Giovannoni, S. J. (2007). The SAR92 clade: an abundant coastal clade of culturable marine bacteria possessing proteorhodopsin. Appl. Environ. Microbiol. 73, 2290–2296. doi: 10.1128/aem.02559-06
Stoeck, T., Bass, D., Nebel, M., Christen, R., Jones, M. D. M., Breiner, H.-W., et al. (2010). Multiple marker parallel tag environmental DNA sequencing reveals a highly complex eukaryotic community in marine anoxic water. Mol. Ecol. 19(Suppl. 1), 21–31. doi: 10.1111/j.1365-294X.2009.04480.x
Suzuki, M. T., Preston, C. M., Chavez, F. P., and Delong, E. F. (2001). Quantitative mapping of bacterioplankton populations in seawater: field tests across an upwelling plume in Monterey Bay. Aquat. Microb. Ecol. 24, 117–127. doi: 10.3354/ame024117
Teira, E., Nieto-Cid, M., and Alvarez-Salgado, X. A. (2009). Bacterial community composition and colored dissolved organic matter in a coastal upwelling ecosystem. Aquat. Microb. Ecol. 55, 131–142. doi: 10.3354/ame01290
Torres-Beltran, M., Sehein, T., Pachiadaki, M. G., Hallam, S. J., and Edgcomb, V. (2018). Protistan parasites along oxygen gradients in a seasonally anoxic fjord: a network approach to assessing potential host-parasite interactions. Deep Sea Res. II Top. Stud. Oceanogr. 156, 97–110. doi: 10.1016/j.dsr2.2017.12.026
Tripp, H. J. (2013). The unique metabolism of SAR11 aquatic bacteria. J. Microbiol. 51, 147–153. doi: 10.1007/s12275-013-2671-2
Van Dongen-Vogels, V., Seymour, J. R., Middleton, J. F., Mitchell, J. G., and Seuront, L. (2011). Influence of local physical events on picophytoplankton spatial and temporal dynamics in South Australian continental shelf waters. J. Plankton Res. 33, 1825–1841. doi: 10.1093/plankt/fbr077
Verheye, H. M. S., Huggett, J., Lamont, T., and Worship, M. (2018). Annual Plankton Report. Environ. Aff. Republic South Africa.
Watanabe, K., Kodama, Y., and Harayama, S. (2001). Design and evaluation of PCR primers to amplify bacterial 16S ribosomal DNA fragments used for community fingerprinting. J. Microbiol. Methods 44, 253–262. doi: 10.1016/s0167-7012(01)00220-2
Wen Chen, J. S., and Levesque, R. E. (2018). RAM: R for Amplicon-Sequencing-Based Microbial-Ecology. R Package Version 1.2.1.7.
Wickham, H. (2009). ggplot2: Elegant Graphics for Data Analysis. New York, NY: Springer-Verlag New York.
Wiebinga, C. J., Veldhuis, M. J. W., and De Baar, H. J. W. (1997). Abundance and productivity of bacterioplankton in relation to seasonal upwelling in the northwest Indian Ocean. Deep Sea Res. I Oceanogr. Res. Pap. 44, 451–476. doi: 10.1016/s0967-0637(96)00115-x
Worden, A. Z., Follows, M. J., Giovannoni, S. J., Wilken, S., Zimmerman, A. E., and Keeling, P. J. (2015). Environmental science. Rethinking the marine carbon cycle: factoring in the multifarious lifestyles of microbes. Science 347:1257594. doi: 10.1126/science.1257594
Worden, A. Z., Nolan, J. K., and Palenik, B. (2004). Assessing the dynamics and ecology of marine picophytoplankton: the importance of the eukaryotic component. Limnol. Oceanogr. 49, 168–179. doi: 10.4319/lo.2004.49.1.0168
Wright, J. J., Konwar, K. M., and Hallam, S. J. (2012). Microbial ecology of expanding oxygen minimum zones. Nat. Rev. Microbiol. 10, 381–394. doi: 10.1038/nrmicro2778
Keywords: microbes, picoeukaryotes, upwelling, Southern Benguela, Illumina
Citation: Rocke E, Cheung S, Gebe Z, Dames NR, Liu H and Moloney CL (2020) Marine Microbial Community Composition During the Upwelling Season in the Southern Benguela. Front. Mar. Sci. 7:255. doi: 10.3389/fmars.2020.00255
Received: 19 September 2019; Accepted: 30 March 2020;
Published: 22 April 2020.
Edited by:
Andrew Stanley Mount, Clemson University, United StatesReviewed by:
Veronica Molina, Universidad de Playa Ancha, ChileAnne W. Thompson, Portland State University, United States
Copyright © 2020 Rocke, Cheung, Gebe, Dames, Liu and Moloney. This is an open-access article distributed under the terms of the Creative Commons Attribution License (CC BY). The use, distribution or reproduction in other forums is permitted, provided the original author(s) and the copyright owner(s) are credited and that the original publication in this journal is cited, in accordance with accepted academic practice. No use, distribution or reproduction is permitted which does not comply with these terms.
*Correspondence: Emma Rocke, ZXJvY2tlQGdtYWlsLmNvbQ==