 Michael A. Brooker1,2*
 Simon de Lestang1,3
 David V. Fairclough3
 Dianne McLean1,2,4Dirk Slawinski5Matthew B. Pember3
 Tim J. Langlois1,2
- 1School of Biological Sciences, The University of Western Australia, Crawley, WA, Australia
- 2The UWA Oceans Institute, Indian Ocean Marine Research Centre, Crawley, WA, Australia
- 3Western Australian Fisheries and Marine Research Laboratories, Department of Primary Industries and Regional Development, Government of Western Australia, Hillarys, WA, Australia
- 4Australian Institute of Marine Science, Indian Ocean Marine Research Centre, Crawley, WA, Australia
- 5CSIRO Oceans and Atmosphere, Indian Ocean Marine Research Centre, Crawley, WA, Australia
Understanding the drivers of exploited fish abundance distributions is key to successful natural resource management, but it is costly to obtain this information at large spatio-temporal scales relevant to management. We used small programmable automated cameras (POTBots) deployed in commercial rock lobster fisher’s pots, during normal fishing activities, across ∼750 km of the west coast of Australia (10–120 m deep), to test for relationships between the relative abundance of fishes and both environmental (habitat composition, swell, depth and water temperature) and anthropogenic factors (recreational and commercial fishing effort). Among the six most frequently observed fishes, the abundances of two targeted species, Choerodon rubescens and Epinephelides armatus, were negatively correlated with an index of recreational effort, although this was confounded by the natural abundance distribution of these species along the west coast. For example, a unimodal abundance distribution with latitude was observed for C. rubescens, matching its known distribution. In contrast, the abundances of the commercially important Chrysophrys auratus and Lethrinus miniatus were positively correlated with an index of commercial effort, reflecting the expectation that commercial fishers typically would target areas of greatest abundance that produce higher catches per unit effort. The abundances of two non-target species, Coris auricularis and Neatypus obliquus, were correlated with expected environmental variables (water temperature, depth, habitat composition and swell) but neither recreational nor commercial fishing effort. All but one of these reef species had a strong positive relationship with reef cover, as expected, and three species exhibited a negative relationship with swell. We have developed a highly cost-effective fisheries-independent monitoring tool to understand relationships between species abundance distributions and major environmental and anthropogenic factors. It is easily deployed using existing pot or trap fishery infrastructure and is therefore highly applicable to both developed and developing countries.
Introduction
Understanding species abundance distributions is key to successful natural resource management (Stewart et al., 2010). This is particularly important in marine ecosystems due to their socio-economic importance, high biodiversity and potential to be impacted by climate change and anthropogenic influences such as fishing (Stewart et al., 2010; Smale et al., 2012). However, large scale (∼1000s km) ecosystem monitoring and modeling in the marine environment is inherently complex, due to interactions between many biotic and abiotic factors, and is costly, due to the spatial scales and required sampling densities (Langlois et al., 2012a).
Ecophysiology predicts that a species abundance distribution will be unimodal across its range, with maxima where environmental conditions are optimal (Pörtner et al., 2010). In coastal marine environments, complex oceanographic processes typically result in heterogeneous temperature and nutrient gradients and so unimodal abundance distributions are thought to be the exception, not the rule (Sagarin and Gaines, 2002). In contrast, relatively consistent unimodal abundance distributions of fish have been observed along the extensive (∼1,500 km), north-south oriented marine environment of the west coast of Australia (Hutchins, 2001; Langlois et al., 2012a). These distributions have been attributed to the region’s relatively consistent environmental gradient in terms of water temperature (Cresswell and Golding, 1980; Pearce et al., 2000). However, at a finer spatial scale, water depth, habitat type, salinity, swell exposure, substrate, and resource partitioning have all been recorded to correlate with fish abundance distributions (Fairclough et al., 2008; Watson and Harvey, 2009; Travers et al., 2010; Harvey et al., 2013). The relatively consistent environmental gradient at large spatial scales across south-western Australia’s coastal marine environment provides an ideal location to investigate the role of major environmental and anthropogenic factors in the abundances of marine organisms, such as fishes.
Anthropogenic factors such as fishing pressure and habitat modification can impact the abundance and distribution of fish species (Langlois et al., 2012b; Soler et al., 2015; Navarro et al., 2019). In south-western Australia, the commercial and recreational fishing sectors exploit fish resources in a spatio-temporal manner, which also differs between species (Fairclough and Walters, 2019). For example, annual catches of baldchin groper Choerodon rubescens and breaksea cod Epinephelides armatus by recreational fishers have recently been greater than commercial catches, while the opposite is true for snapper Chrysophrys auratus and redthroat emperor Lethrinus miniatus (Ryan et al., 2017; Lethrinidae, Forster, 1801; Fairclough and Walters, 2019). Recreational fishing effort is typically restricted by proximity to access points and typically small vessel sizes (Aidoo et al., 2015), whereas commercial fishers will travel much greater distances to achieve higher catch rates. In south-western Australia, management of these species includes spatio-temporal closures that limit fishing of one or both fishing sectors (Fairclough et al., 2015; Crisafulli et al., 2019). Thus, the activity and effort exerted by those two sectors are expected to differentially influence the abundance distributions of targeted species across the region.
Remote video survey methods, both baited and unbaited, are increasingly being used to study the abundance distribution of fishes in coastal waters globally, in both shallow waters and waters beyond safe diving limits (Langlois et al., 2015). Regularly conducting independent, spatially balanced remote video surveys of fish assemblages and marine habitats in coastal waters can be costly, in terms of ship time and field time using current remote operated video methodologies (Langlois et al., 2015). As an alternative, we developed an inexpensive (∼US$ 400), remotely operated, fisher-deployed camera system (pictures of the bottom; POTBot) for collecting georeferenced video of fish and habitats. Their design and operation allows for easy and inexpensive installation into existing infrastructure (e.g., lobster pots) and the collection of repeated sampling deployments at zero cost whilst fishers conduct their normal fishing operations over weeks or months.
This study focused on the four most abundant targeted reef fishes (C. auratus, C. rubescens, E. armatus, L. miniatus) and two of the most abundant non-target reef fishes sampled using POTBots, i.e., Western king wrasse (Coris auricularis) and Footballer sweep (Neatypus obliquus) (Table 1). These six species have different biogeographic distributions, with C. rubescens (23–34°S), E. armatus (26–35°S), C. auratus (<23–43°S), C. auricularis (23–35°S), and N. obliquus (26–35°S) being subtropical or warm temperate, while L. miniatus (20–28°S) is a tropical species (Hutchins, 2001; van Herwerden et al., 2009).
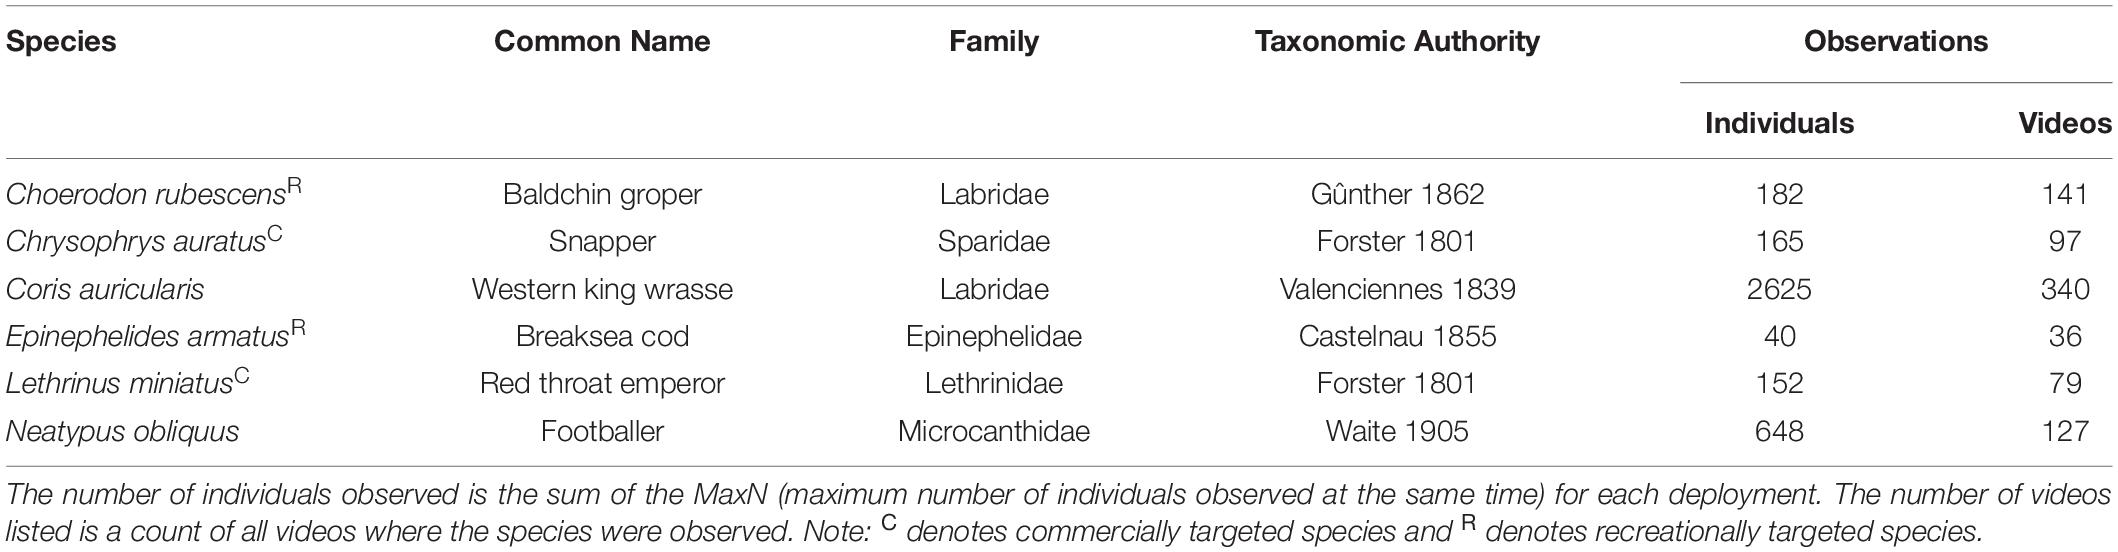
Table 1. Summary of the focus species for this study.
This study tested the ability of the POTBot system to identify the variables most correlated and likely to be related to the observed distribution patterns of these abundant species, given the prior expectations reported in published literature (Hutchins, 2001; Langlois et al., 2012a). It was expected that the abundance of each of these reef species will be greatest over reef habitats. It was also expected that with increasing latitude and decreasing average water temperature the abundance of temperate species (such as E. armatus) will increase, while tropical/subtropical species (such as L. miniatus will decrease). The abundance of C. rubescens, a species endemic to the west coast only, is expected to be unimodal, declining to the north and south of a central latitudinal maximum at ∼28°S. We also predicted that species typically targeted by either recreational fishers (such as C. rubescens and E. armatus) or commercial fishers (such as C. auratus and L. miniatus) would be negatively correlated with indices of recreational and commercial fishing pressure.
Materials and Methods
This study used automated cameras mounted to commercial lobster fishing pots which were deployed as part of standard fishing practices.
Sampling Strategy
In this study POTBots were deployed along ∼750 km of the south-western Australian coastline spanning 6.5° of latitude (∼26.5°S to 33°S; Figure 1A). The orientation and scale of the study region means that it encompasses the biogeographic overlap zone from sub-tropical to temperate ecosystems (Hutchins, 2001; Figure 1B). In addition, the region also displays a gradient of recreational and commercial fishing effort (Sumner et al., 2008; Ryan et al., 2015; Figures 1C,D).
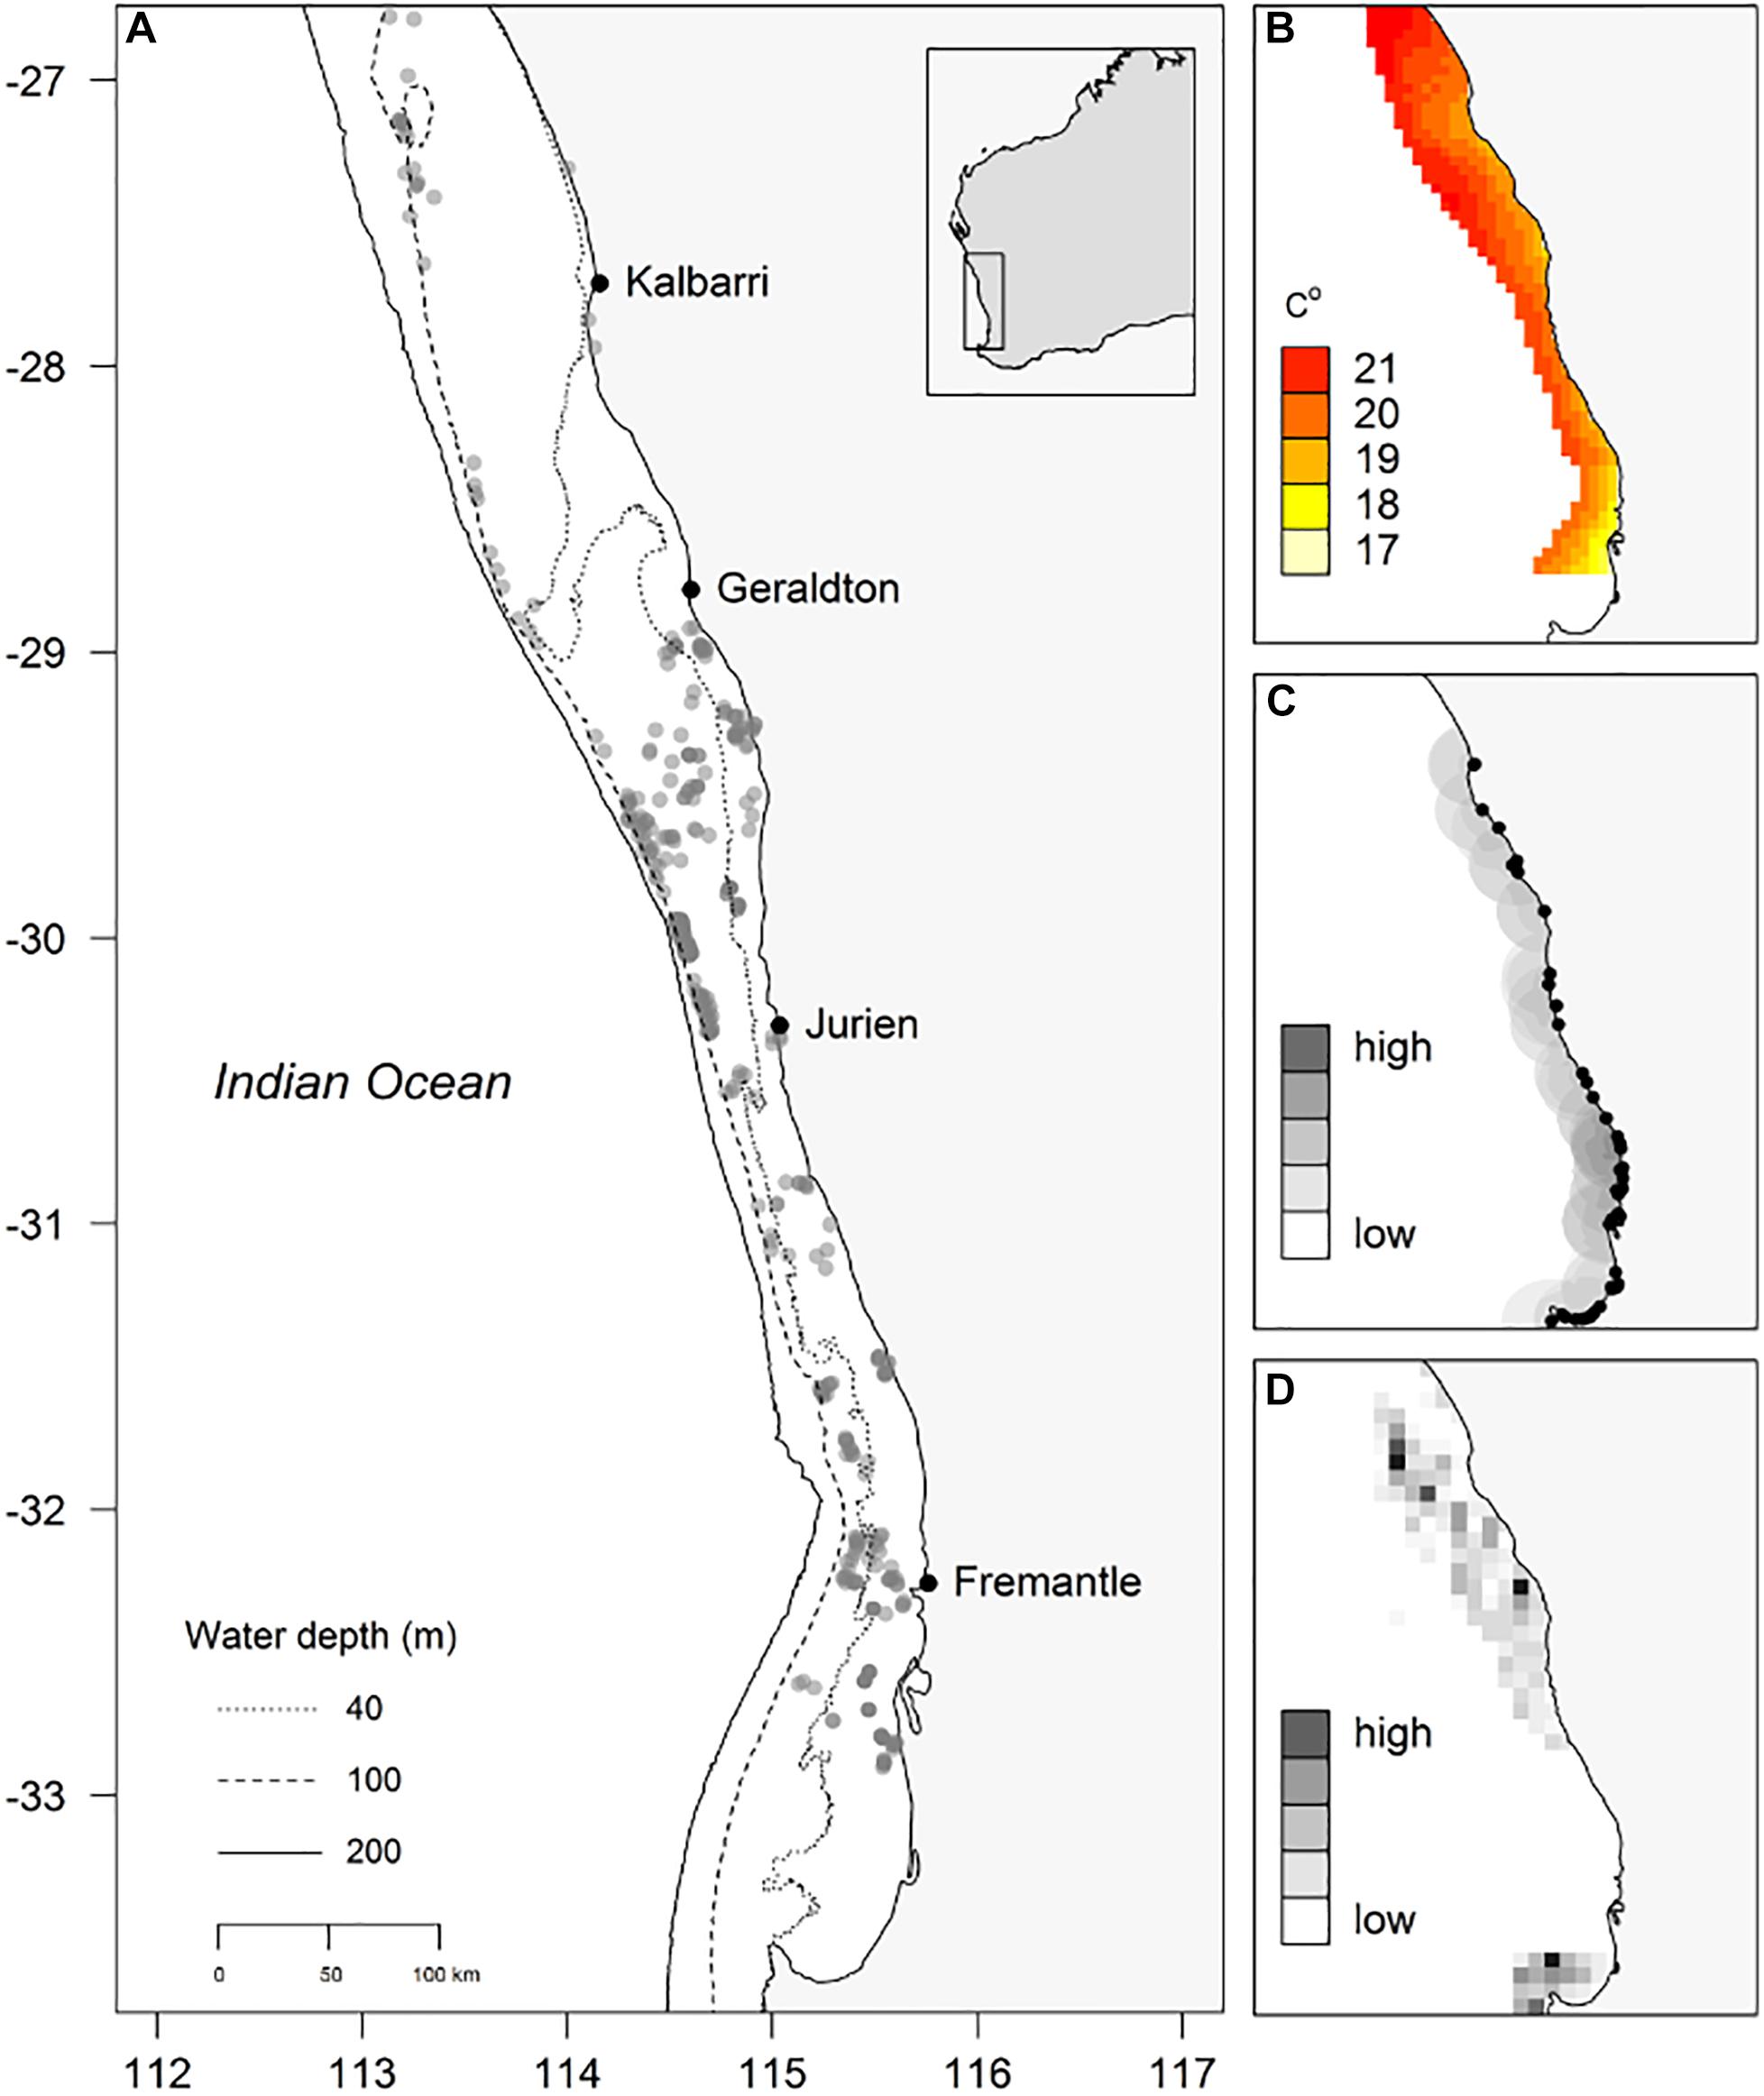
Figure 1. (A) Locations of deployment of POTBots (gray dots), (B) modeled winter ocean bottom temperature, (C) the recreational fishing index (grayscale, 0.01 degree cell size) and location of boat ramps (black dots), (D) the normalized commercial catch data (grayscale, 0.167 degree [10 min] cell size).
Between April 2013 and August 2014, 20 POTBots were opportunistically deployed inside the pots of 19 different vessels targeting western rock lobster (Panulirus cygnus George, 1962) in water depths of 10–120 m between Kalbarri and Perth, Western Australia (Figure 1A). A single POTBot was mounted inside each pot giving the camera a height of approximately 35 cm from the substrate (Figure 2). POTBots consist of a circuit board on which is mounted a camera, microcontroller, data logger, GPS, thermometer and a battery in a waterproof housing (∼150 mm long, ∼75 mm diameter). Further information on POTBot design and manufacture is available in Supplementary Material 1 and at POTBots.org.
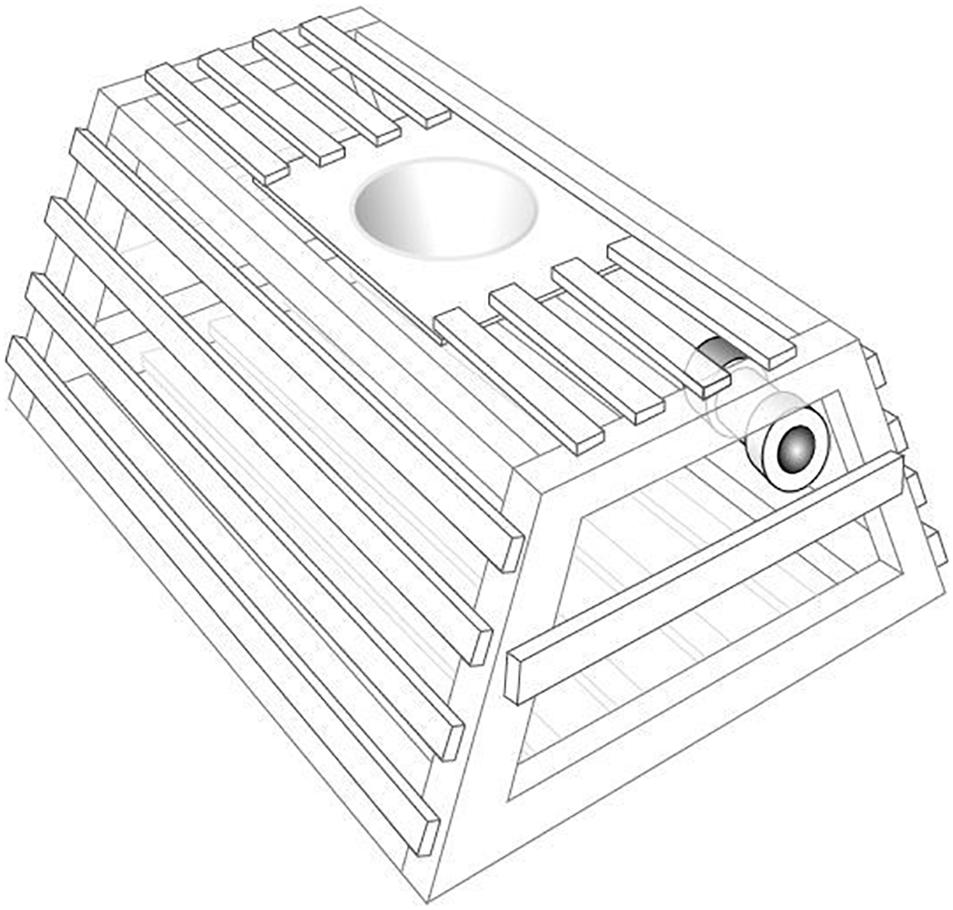
Figure 2. A diagram of a western rock lobster fishery trap with POTBot installed. Wooden batten rock lobster pots have a maximum internal length of 91.5 cm long, 80 cm wide and 42 cm high.
Upon deployment, POTBots were set to record imagery for 10 min to produce a snapshot of the relative abundance of fish species within the immediate deployment area. Collection of data commenced when the pot landed on the substrate. This sampling time is much shorter than typically used in baited remote video systems (60 min – Cappo et al., 2006; 30 min – Harasti et al., 2015) but is comparable to recent recommendations (10–15 min – Coghlan et al., 2017). The shortened video sampling time led to a reduction in the amount of data storage and processing time required, greatly reducing the time and cost of video analysis. After approximately 15 deployments over 1–2 months, each POTBot was replaced with another fully charged unit. A total of 648 videos were collected during the study period and 398 videos (∼61%) were of suitable quality for analysis. Of those not suitable, the most common reason was fisher deployment of pots before dawn (insufficient lighting) and poor positioning of the pot causing a limited field of view.
Analysis of videos was conducted using EventMeasure1. Relative abundance counts for C. auratus, C. rubescens, E. armatus, L. miniatus, C. auricularis, and N. obliquus were obtained from the maximum number of each species present in the field of view of the POTBot at one time (MaxN; Cappo et al., 2004).
Measurement of Environmental and Anthropogenic Variables
Variables to be tested against the relative abundance of each species were recorded or calculated for each sampling location. These included latitude, depth, relative habitat relief, winter/spring bottom temperature, swell, the coverage of kelp (Ecklonia radiata Agardh, 1817), large epibenthic invertebrates, reef, and recreational and commercial fishing effort.
The latitude for each deployment was derived from the POTBots internal GPS. The depth of each deployment was either recorded by the commercial fisher deploying the POTBot or derived using the Australian Bathymetry and Topography Grid of Geoscience Australia (Whiteway, 2009). Relief was visually ranked for each deployment as low, medium or high based on video observations (modified from Polunin and Roberts, 1993). To validate this method, relief categories assigned to a subset of 60 POTBot deployments were compared to fine scale bathymetry data obtained from a multi-beam hydroacoustic (MBH) survey (Hovey et al., 2012). The three-dimensional surface area of the substrate within a 9 × 9 m quadrat around each of the 60 POTBot deployments was derived from the MBH survey data using a digital elevation model (DEM) tool for ArcGIS 10.2 (ESRI 2011). A significant positive relationship existed between the visual ranking from the POTBots and the DEM derived estimates of relief using a linear regression (r2 = 0.384, p < 0.001).
Winter/spring bottom water temperature sourced from the OceanMaps model (Chamberlain et al., 2012) was used for each deployment location. The winter/spring period is when water temperatures are lowest and minimum annual water temperatures have been found to limit the distribution of fish species due to their differing thermal tolerances (Figueira and Booth, 2010). The winter/spring bottom water temperature ranged from 17 to 22°C.
Swell was visually rated from POTBot imagery using a five point scale. Indicators such as vegetation and sand movement were used. To validate this method, swell ratings assigned to a subset of 145 POTBot deployments were compared with total significant wave height recorded within the same hour by the wave rider buoy in Owen Anchorage, Western Australia (WA Department of Transport 2014). A significant positive relationship existed between the swell ratings from the POTBots and total significant wave height using a linear regression (r2 = 0.416, p < 0.001).
For each POTBot deployment, the percent coverage of substrate type (reef or sand/rubble) and biota (invertebrates [ranging from 0 to 80% cover], Ecklonia radiata [ranging from 0 to 100% cover], mixed algae, seagrass, rhodoliths, and coral) were estimated in the field of view. Only the three most dominant biota categories (E. radiata, invertebrates and reef) were used in analysis due to the rare occurrence of others.
An index of recreational effort (IR) was calculated from data collected at each of 26 boat ramps within the study area (Figure 1C) by assuming that the number of boat ramp attendances (launches and retrieves) at each ramp would be relative to the amount of recreational fishing effort at that location and that this effort would decline with increasing distance from a given boat ramp (sensu Stewart et al., 2010). The decline was assumed to occur exponentially down to zero at an “assumed maximum” distance that a recreational fisher would travel to fish, namely 50 km (based on anecdotal evidence from fisher interviews). The IR was based on data collected in 1996/97, 2005/06, 2008/09 and 2009/10 (Sumner et al., 2008; Ryan et al., 2015). The IR was derived using a Linear Model (LM) to produce an index standardized for time of day, weekday/weekend, month and year, and was expressed for each 0.01 degree block throughout the study area, with each POTBot deployment being assigned an IR value. It should be noted that the IR does not account for offshore aggregation of recreational fishers in the region, such as at the Houtman Abrolhos Islands or Rottnest Island. Although this is a shortcoming in the index, there were only eleven (2.7%) POTBot deployments within these areas as the study was focused on the coastline of south-western Australia.
An index of commercial effort (IC) was calculated by assuming that levels of commercial catch would provide a relative index of effort throughout the study region. Compulsory commercial catch returns from five years prior to the study (2008–2013) from the West Coast Demersal Scalefish (Interim) Managed Fishery contain fish catch data and spatio-temporal information such as date and fishing block (10 min of a degree ≈18.5 km2). Catch data of all commercially retained finfish were averaged over five years and aggregated into individual fishing blocks to provide a relative measure of fishing effort across all species. Temporal change in exploitation was not considered and it was assumed the 5-year averages of catches across this multi-species fishery reflected the spatial scales of effort experienced by fish populations considered. The IC value was expressed for each 0.167 degree (10 min of a degree) block as this reflected the scale that this data was recorded at.
Statistical Analysis
Initially, the data were summarized and diagnostic scatter plots were produced between the abundance of each species and predictors to determine whether the predictors should be treated as categorical factors or continuous covariates, with some predictors being allocated into bins to be examined as factors due to distribution in their response and bin widths were adjusted to ensure an approximate balance in the number of samples per bin. There were no strong correlations (>0.75) between any predictor variables. Each deployment was considered an independent sample, as POTBots were always deployed farther than 50 m from the nearest concurrent deployment and the short video length reduced the likelihood of fish traveling between POTBots during deployment (Ellis and DeMartini, 1995; Cappo et al., 2004).
Generalized additive models (GAMs) with full subset model selection (FSSgam, Fisher et al., 2018) was used to determine if any measured environmental or fishing effort metrics or interactions between these predictors best explained variance in the abundance distribution for species of interest. Models containing variable combinations with correlations >0.28 were excluded, to eliminate potential problems with collinearity and overfitting (Graham, 2003). Abundance data was modeled using a tweedie distribution, implemented via a call to the “gam()” function (mgcv, Wood, 2017). Both commercial and recreational fishing efforts were found to be positively skewed, therefore transformations were performed to achieve uniformity in their distributions (Zuur et al., 2010). Model sizes were limited to only three terms (size = 3) and k in the GAMs was limited to 5. Model selection was based on Akaike’s Information Criterion (AIC, Akaike, 1973) optimized for small samples sizes (AICc, Hurvich and Tsai, 1989) and the most parsimonious model chosen was that with the fewest variables but within two units of the lowest AIC. Importance scores of each variable were obtained by summing the AICc weights of each model that each variable occurred within (Burnham and Anderson, 2003) and these scores were then plotted to identify the relative importance of predictor variables across all possible models. The R language for statistical computing (R Core Team, 2018) was used for all data manipulation [dplyr, Wickham et al., 2018), analysis (mgcv, Wood, 2011), and graphing (ggplot2, Wickham, 2009].
Results
Baldchin Groper (Choerodon rubescens)
The most parsimonious model for the abundance distribution of Choerodon rubescens included recreational fishing effort, winter minimum water temperature and the percent cover of reef, which together explained 15% of its distribution (Table 2). Importance scores also indicated some weak support for water depth and coverage of sessile invertebrates as predictors (Figure 3). The abundance of C. rubescens was negatively correlated with the recreational fishing index (Figure 4A), whilst positively correlated with both winter minimum water temperature (Figure 4B) and the percent cover of reef (Figure 4C).
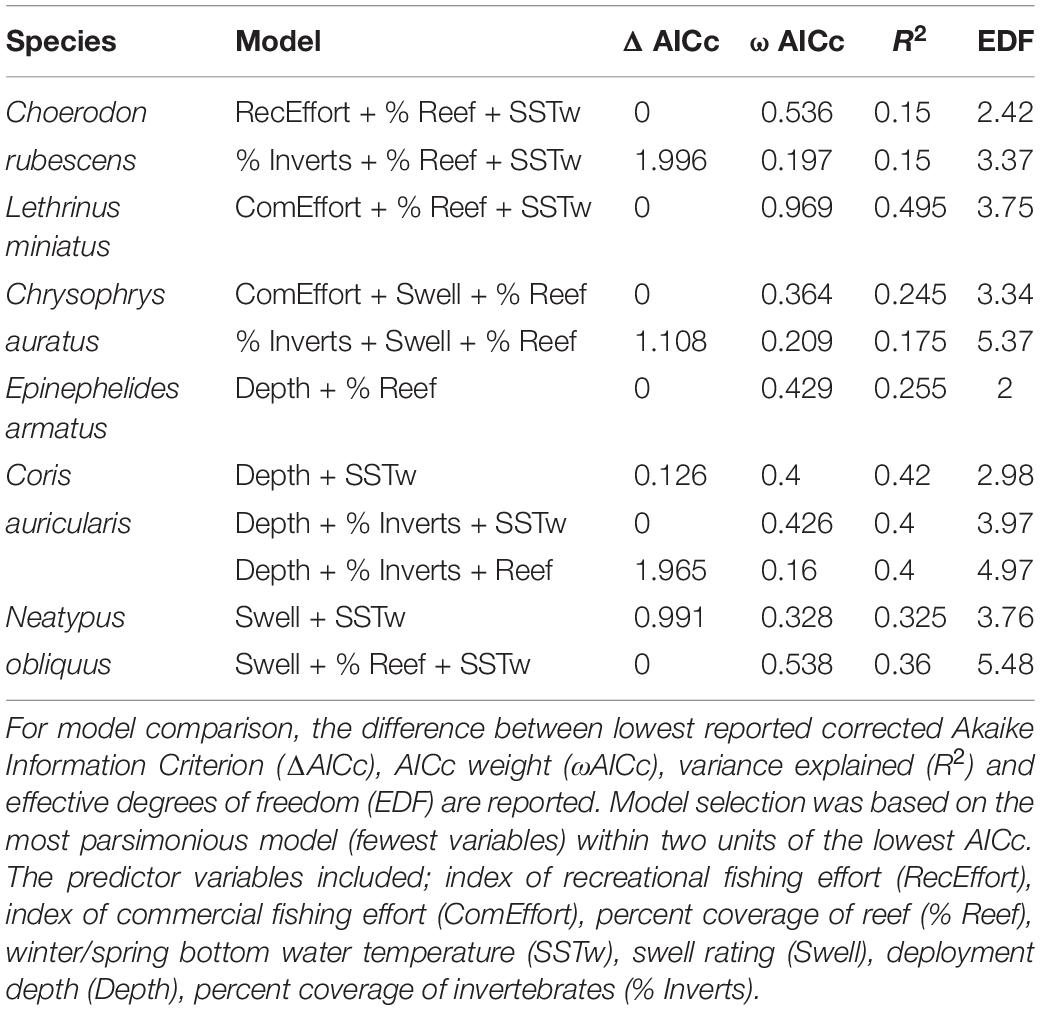
Table 2. Top generalized additive models (GAMs) for predicting the abundance distribution of species of interest from full subset analyses.
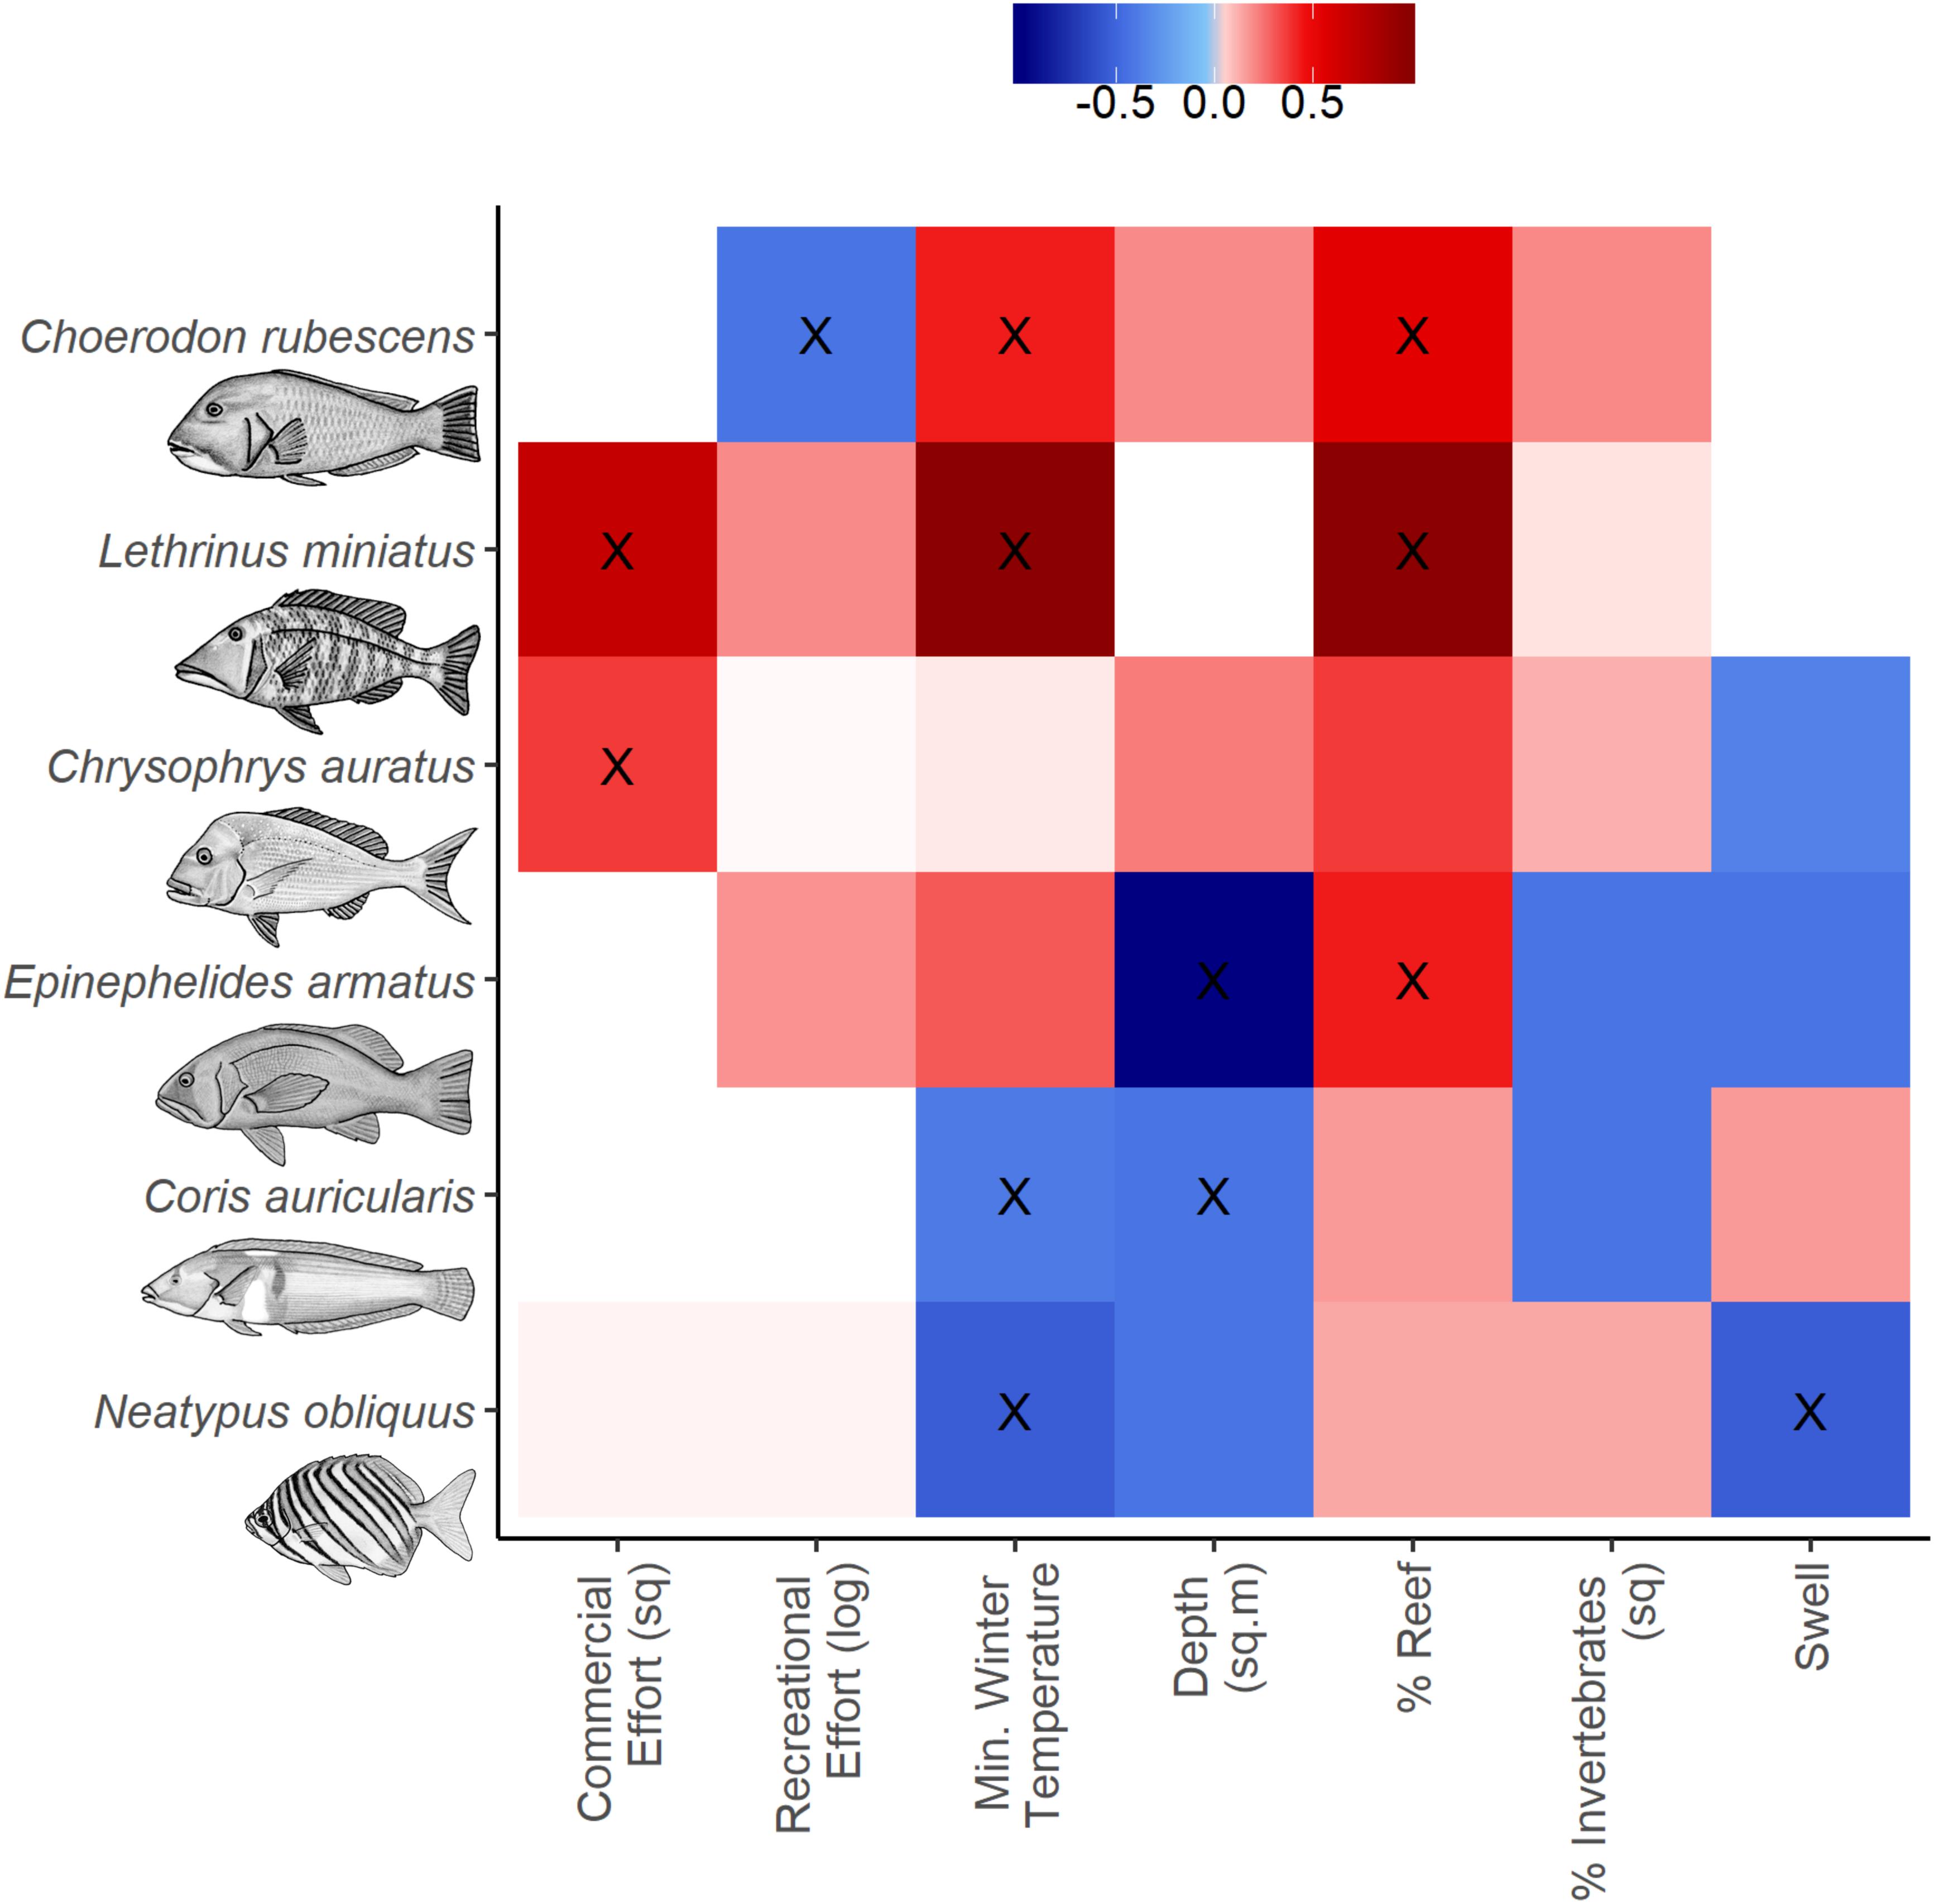
Figure 3. Variable importance scores from full subsets GAM analyses to predict the abundance distribution of the species of interest. Positive (red), zero (white) and negative (blue) relationships with response variables are indicated and variables within the most parsimonious model for each taxa are indicated (X, see Table 2).
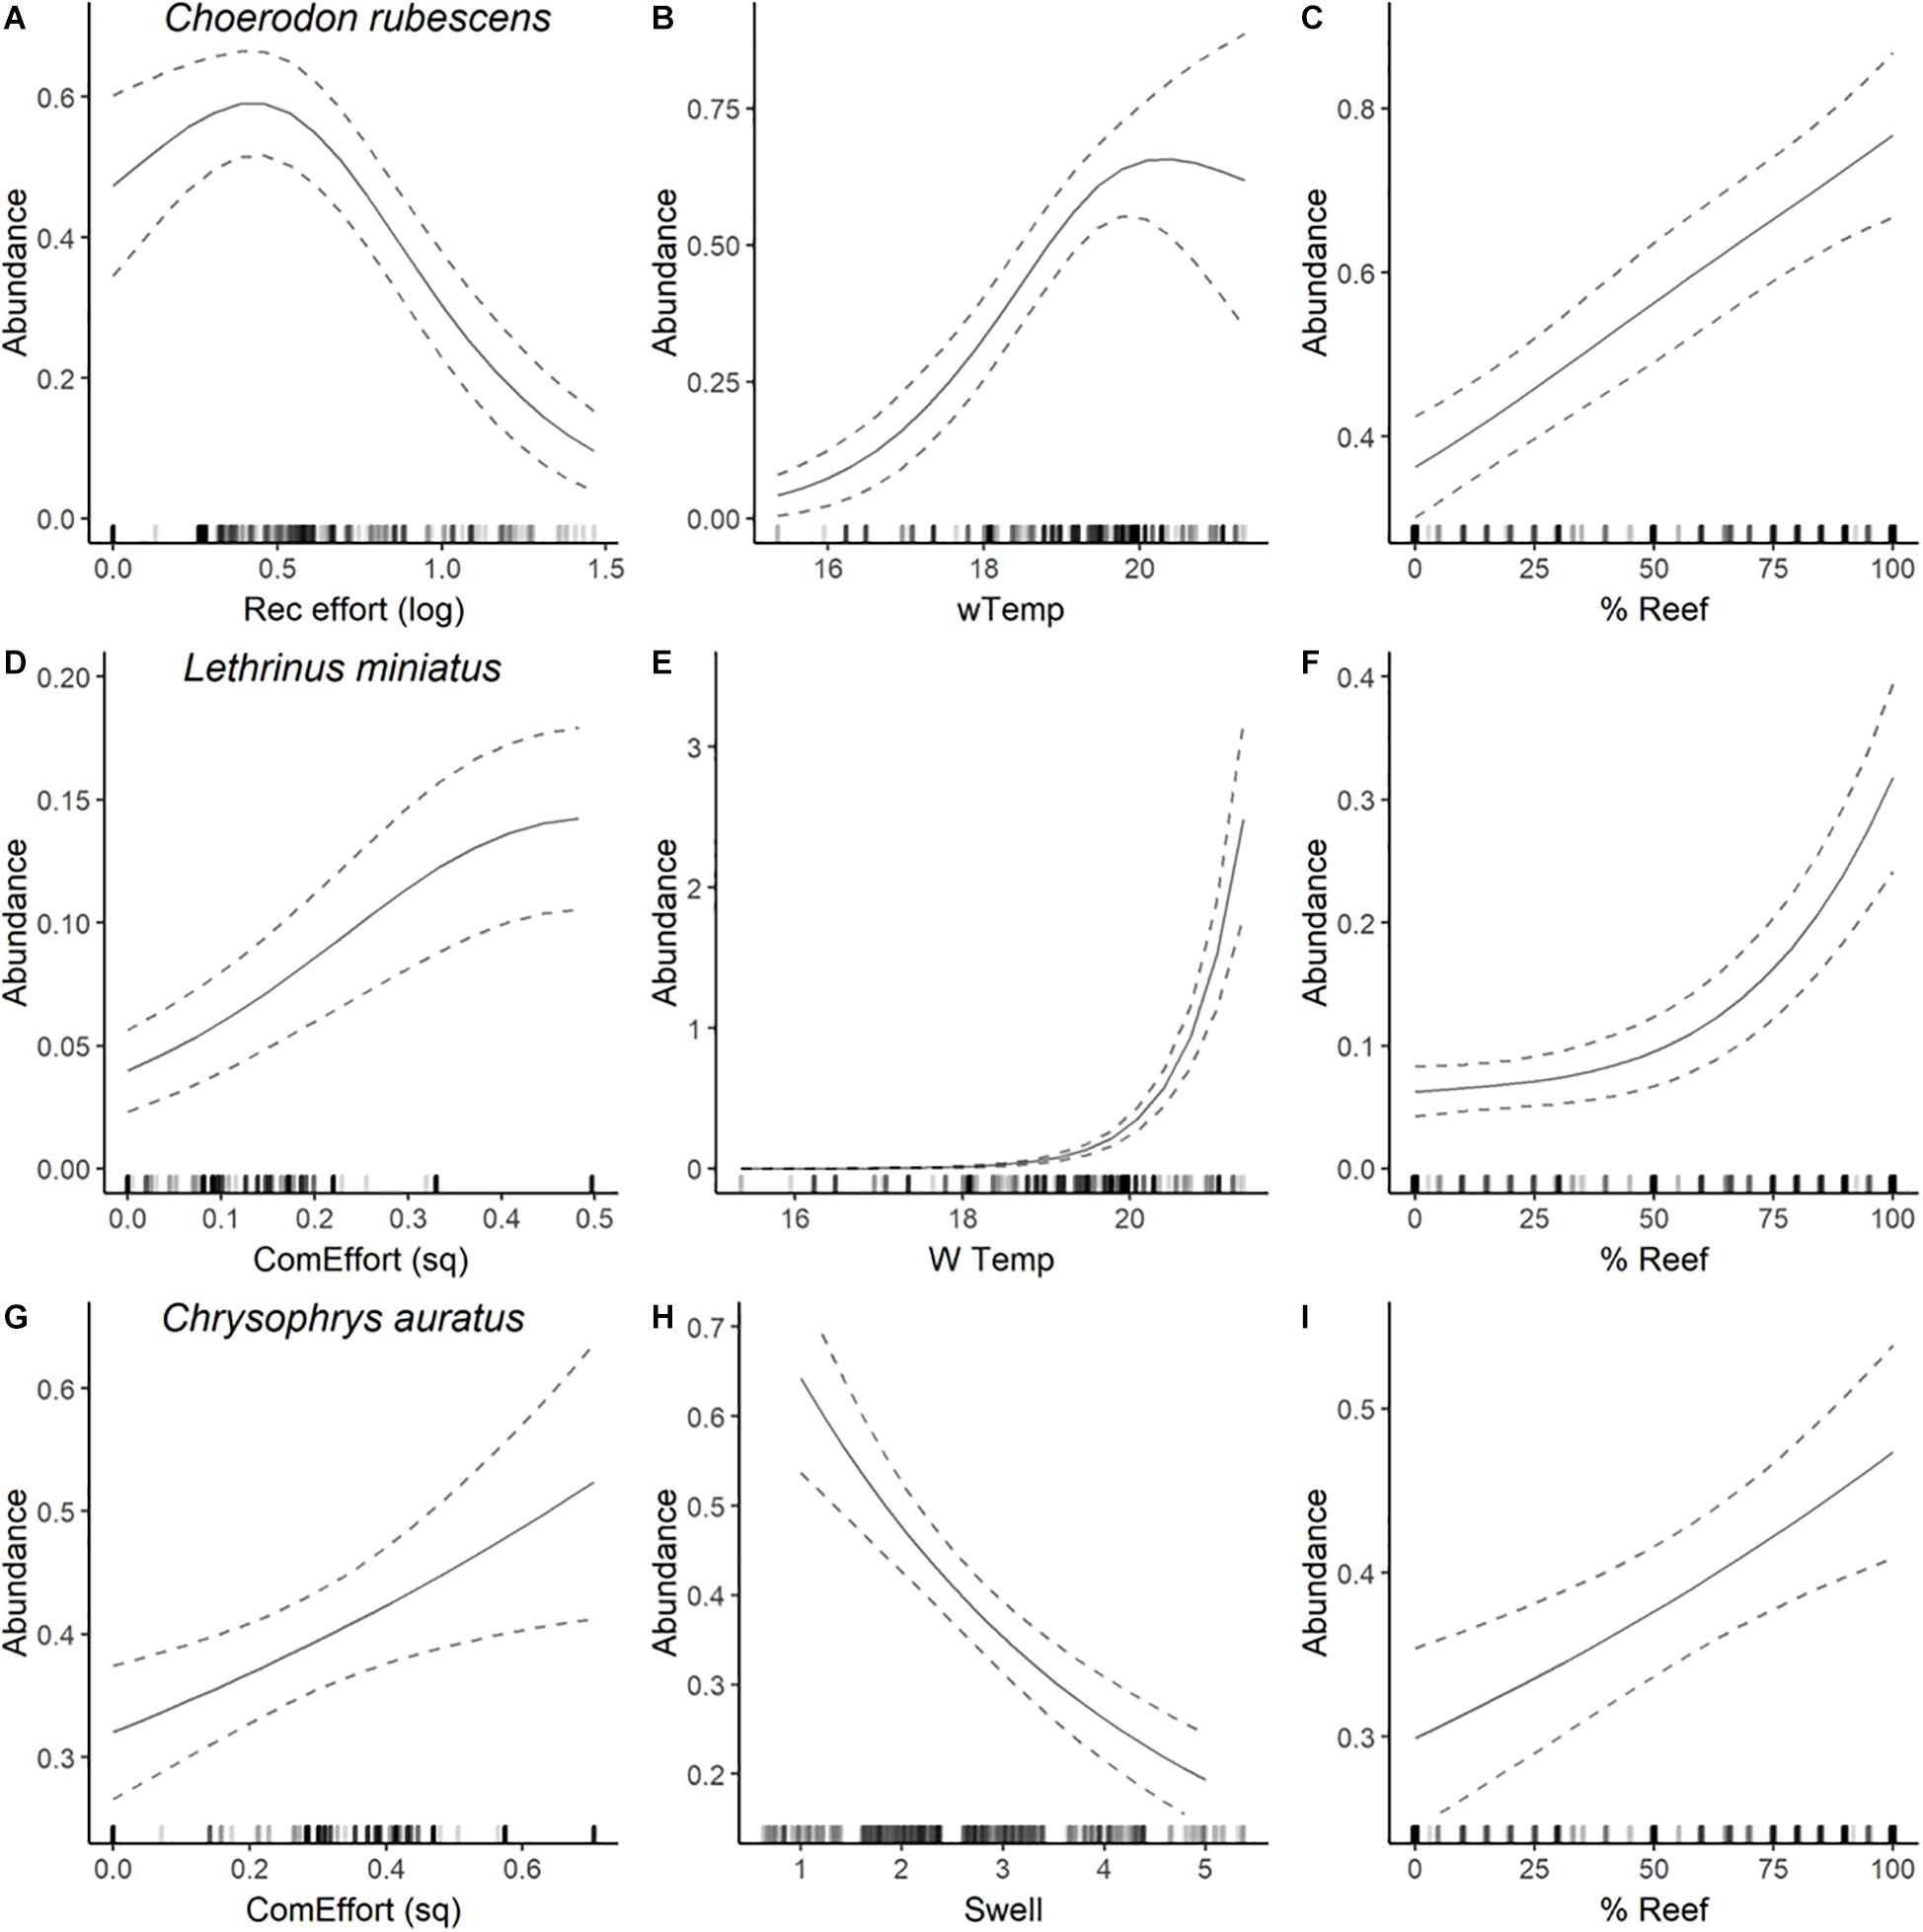
Figure 4. Plots of most parsimonious model found to predict the abundance distribution of C. rubescens (A–C), L. miniatus (D–F), and C. auratus (G–I) from full subset GAM analyses (see Table 2). Solid lines are fitted gam curves, with dashed lines indicating standard error confidence bands; rug plot is used to indicate the distribution of data.
Redthroat Emperor (Lethrinus miniatus)
The most parsimonious model for the abundance distribution of Lethrinus miniatus included commercial fishing effort, percent coverage of reef and the winter minimum sea surface temperature, which together explained 50% of its distribution (Table 2). Importance scores indicated some weak support for recreational fishing effort as a predictor (Figure 3). The abundance of L. miniatus was positively correlated with commercial effort (Figure 4D), winter minimum sea surface temperature (Figure 4E), and percent coverage of reef (Figure 4F).
Snapper (Chrysophrys auratus)
The most parsimonious model for the abundance distribution of Chrysophrys auratus included commercial fishing effort, swell and the percent cover of reef, which together explained 25% of its distribution (Table 2). Importance scores indicated some weak support for water depth and coverage of sessile invertebrates as predictors (Figure 3). The abundance of C. auratus was positively correlated with commercial effort (Figure 4G), percent coverage of reef (Figure 4H) and negatively correlated with swell (Figure 4I).
Breaksea Cod (Epinephelides armatus)
The most parsimonious model for the abundance distribution of Epinephelides armatus included depth and the percent cover of reef, which together explained 26% of its distribution (Table 2). Importance scores also indicated some weak support for recreational fishing effort, minimum winter water temperature, percent coverage of invertebrates and swell (Figure 3). The abundance of E. armatus was negatively correlated with depth (Figure 5A) and positively correlated with percent coverage of reef (Figure 5B).
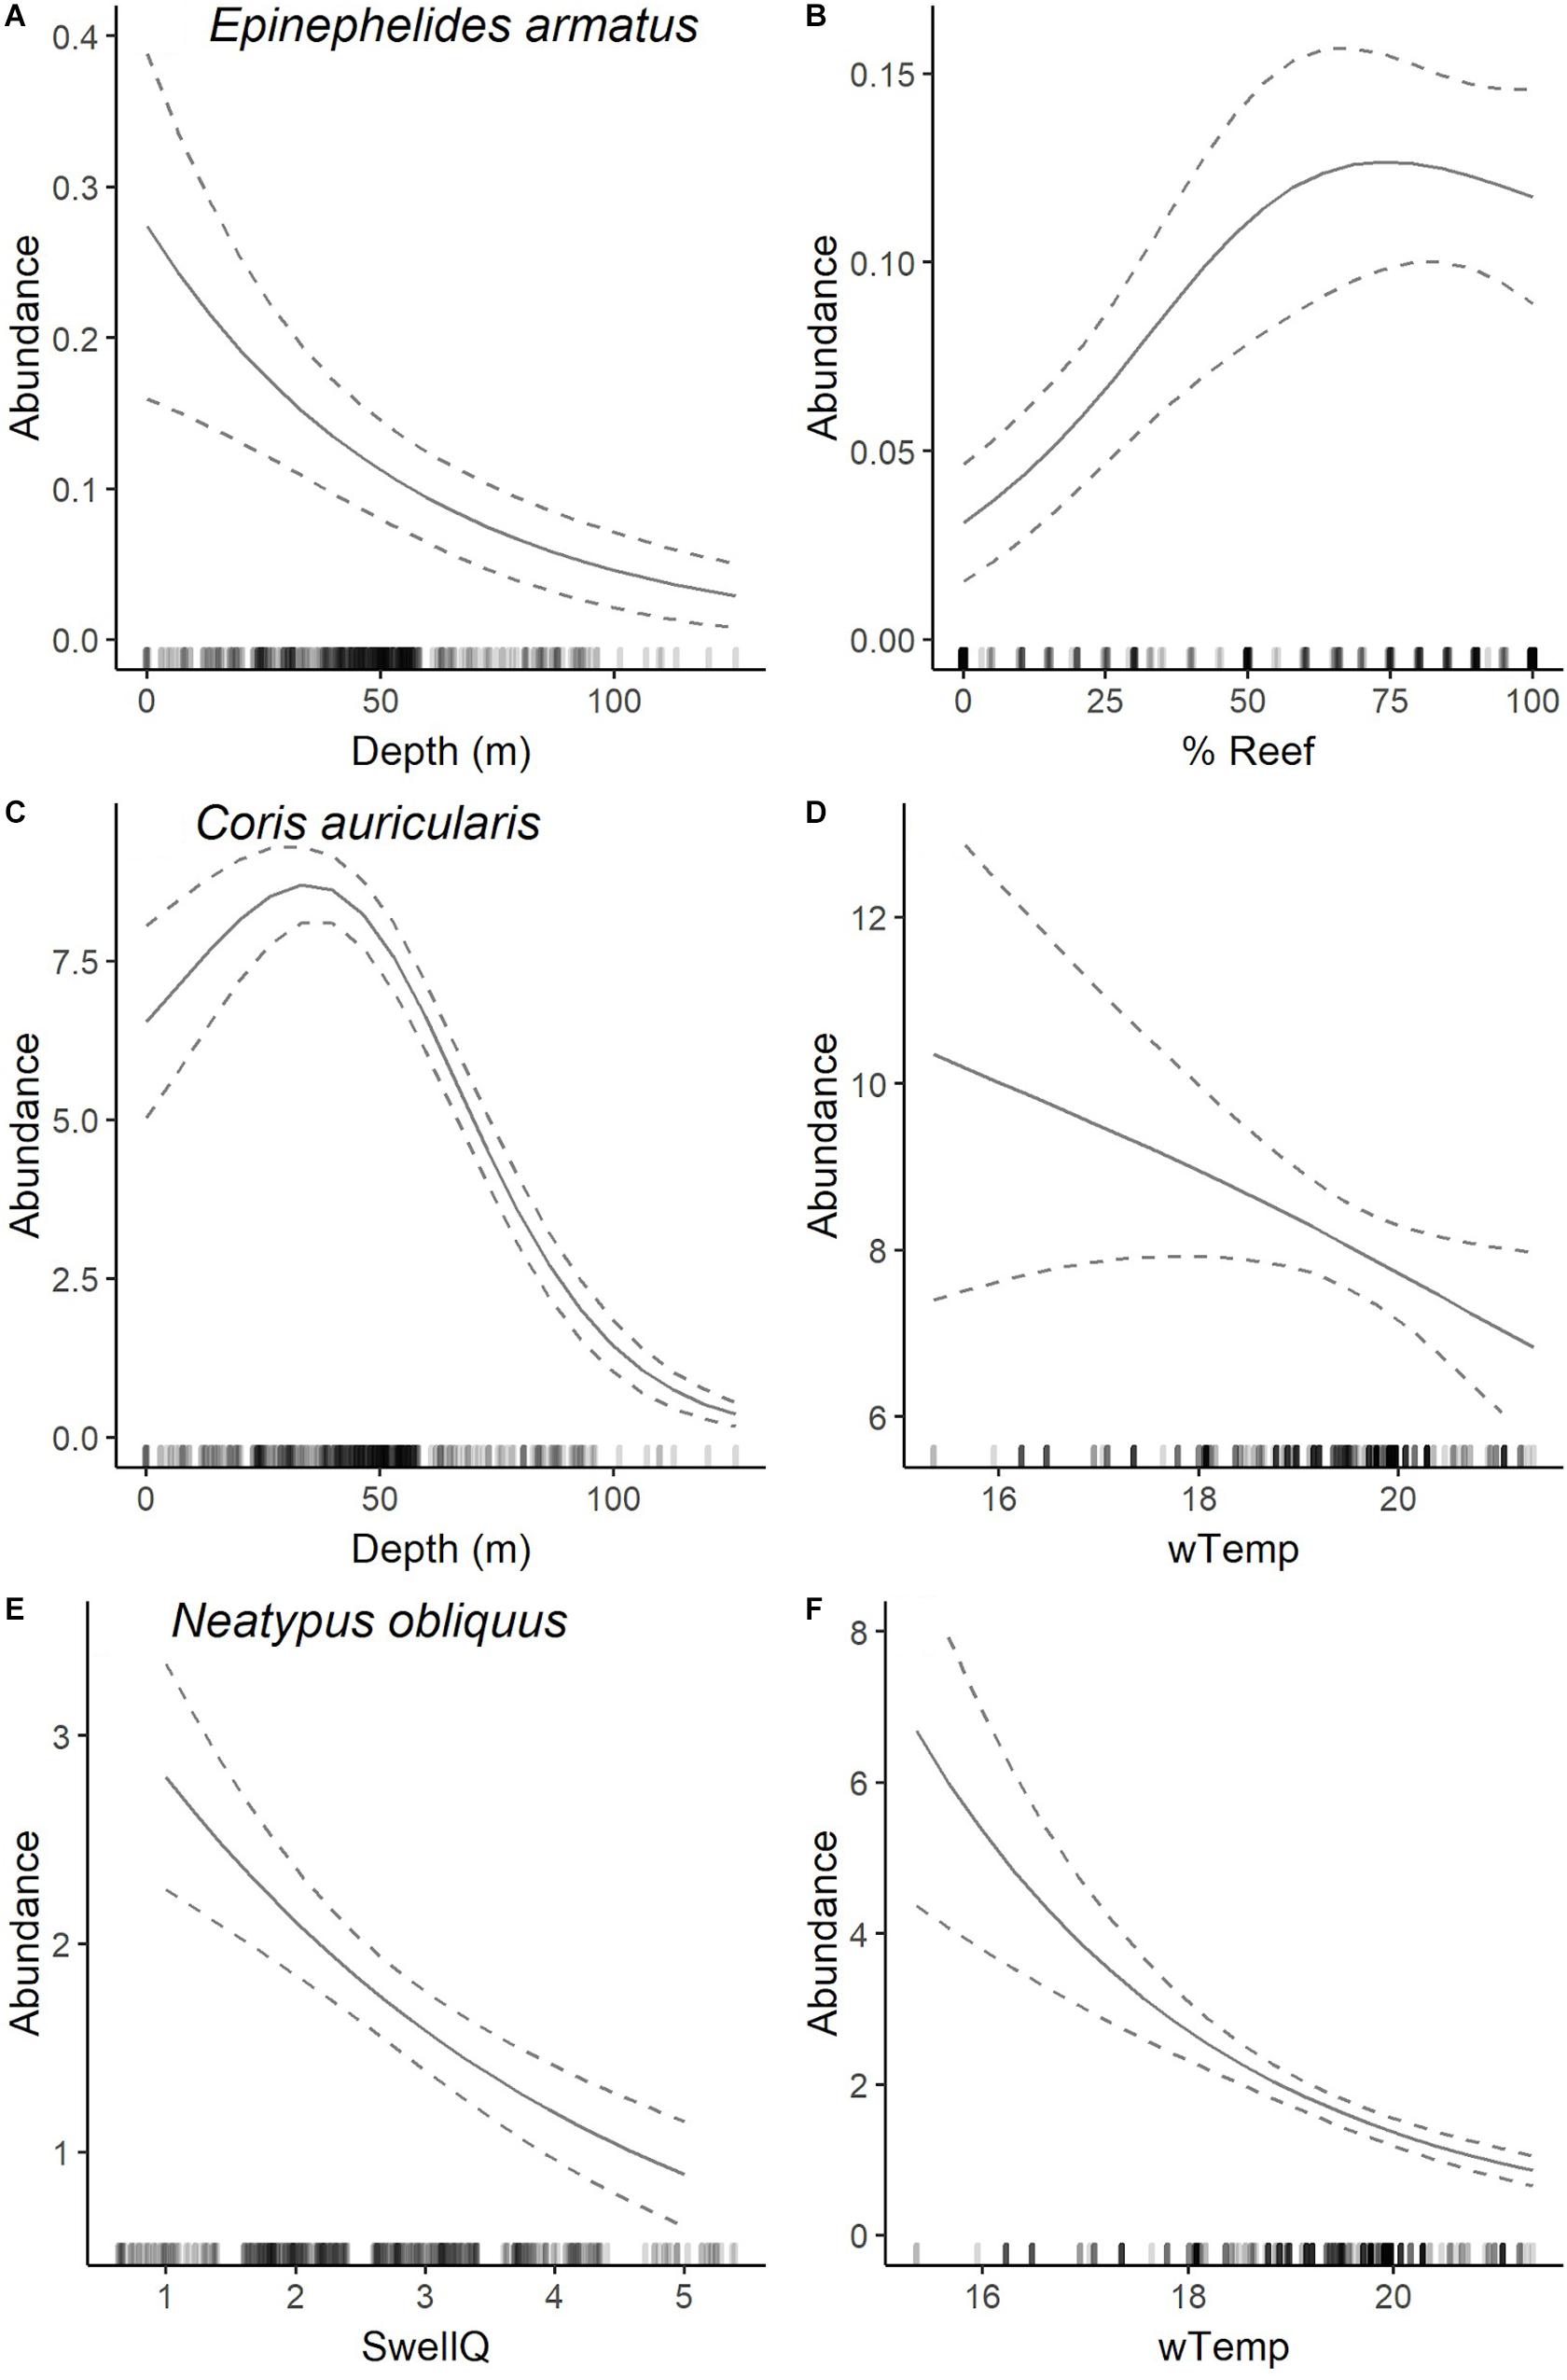
Figure 5. Plots of most parsimonious model found to predict the abundance distribution of E. armatus (A,B), C. auricularis (C,D), and N. obliquus (E,F) from full subset GAM analyses (see Table 2). Solid lines are fitted gam curves, with dashed lines indicating standard error confidence bands; rug plot is used to indicate the distribution of data.
Western King Wrasse (Coris auricularis)
The most parsimonious model for the abundance distribution of Coris auricularis included water depth and winter minimum water temperature, which explained 42% of its distribution (Table 2). Importance scores also indicated some weak support for percent coverage of reef, percent coverage of sessile invertebrates and swell as predictors (Figure 3). The abundance of C. auricularis was negatively correlated with both water depth (Figure 5C) and winter minimum water temperature (Figure 5D).
Footballer Sweep (Neatypus obliquus)
The most parsimonious model for the abundance distribution of Neatypus obliquus included swell and winter minimum water temperature, which explained 33% of its distribution (Table 2). Importance scores indicated some weak support for water depth, percent coverage of reef and percent coverage of sessile invertebrates (Figure 3). The abundance of N. obliquus was negatively correlated with both swell (Figure 5E) and winter minimum water temperature (Figure 5F).
Discussion
Novel automated cameras (POTBots) deployed during standard commercial Western Rock Lobster Fishery activities successfully collected 398 snapshot video samples of fishes over an 18 month period. They also effectively characterized the abundance distributions of common target and non-target demersal fishes across ∼750 km of the west coast of Australia. This enabled the evaluation and quantification of the extent to which environmental and anthropogenic factors are related to the abundance distribution of each species of interest. All of the measured predictor variables, apart from the coverage of kelp, were related to the abundance distribution of at least one of the species studied. The majority of species (except C. rubescens) had ramped abundance distributions related to latitude, which was expected as this study only encompassed a portion of their known ranges (Hutchins, 2001). The abundance of tropical/subtropical species increased at lower latitudes while the opposite was observed for temperate species, matching previous studies at this scale (Langlois et al., 2012a). The abundance distribution of the range restricted endemic C. rubescens exhibited a unimodal pattern, matching its expected distribution along the temperature gradient of the west coast of Australia (Hutchins, 2001; Langlois et al., 2012a). Current knowledge of species ranges across such a broad geographical area informs research examining any changes to these distributions that may arise through climate change.
Relationships With Fishing Effort
The positive relationship between the index of commercial effort and the relative abundances of the two commercially important targets, C. auratus and L. miniatus, presumably reflects the fact that commercial fishers typically focus their fishing effort in areas where these species are relatively more abundant and where higher catch per unit effort can be achieved (Hutton et al., 2004). In contrast, a negative relationship was detected between the index of recreational fishing effort and the relative abundances of C. rubescens, a species commonly caught by recreational fishers. This may reflect to some extent the historical combined effects of commercial and recreational fishing on stock levels, particularly in the Perth metropolitan area, which is the most densely populated area in the study region and has the greatest recreational fishing pressure (refer to Figure 1) (Ryan et al., 2017) and the lowest catch rate of key recreationally targeted species (Navarro et al., 2019). However, the negative relationship between the abundance of C. rubescens and recreational effort is confounded by the expected decrease in abundance of this species with increasing latitude south of the Abrolhos Islands (at ∼28°S), where it is most abundant within its sub-tropical range, and the fact that recreational effort on the coast is higher toward the southern part of its range (Hutchins, 2001; Ryan et al., 2017). The lack of a relationship between E. armatus and the index of commercial effort is likely explained by this species being a very small component of the commercial catch and that there is no longer any commercial line fishing in the Perth Metropolitan Area (from 31 to 33°S and <250 m deep). The contrasting patterns of abundance in relation to fishing effort of species typically targeted by different sectors may reflect the alternative motivations of commercial and recreational fishers. The motivation of recreational fishing is often related to non-catch elements (e.g., social benefits and the experience), whereas the motivation of commercial fishing is usually directly related to catch and profits (Camp et al., 2016).
The current study did not consider the influence of historical spatial patterns of fishing effort on the relative abundance of fishes and thus only provides a snapshot of relative abundance from one time vs. contemporary data used to parameterize the indices of recreational and commercial fishing effort. The cost-efficient evaluation of representative fisheries species abundance over time using independent monitoring methods such as POTBots, could provide an alternative to those typically derived from fishery-dependent sources, which are commonly used in stock assessments, such as catch per unit effort (Fairclough et al., 2014). This may be particularly relevant as the identification of overfishing of demersal species on the west coast of Australia in the mid-2000s (Wise et al., 2007) resulted in significant changes to management, including the introduction of a spatial closure for commercial fishing and temporal closures for recreational fishing.
Relationships With Environmental Variables
Fish habitat relationships are often studied at small to medium scales (e.g., Howard, 1989; Tuya et al., 2009; Fairclough et al., 2011; Harvey et al., 2013). In contrast, the current study modeled the relationship between the relative abundance of fishes and selected environmental variables over a large spatial scale (∼750 km), which provided information on the broad environmental factors to which the distributions of these species could be related (cf. Hutchins, 2001; Travers et al., 2010; Langlois et al., 2012a; McLean et al., 2010).
In south-western Australia, greater species richness and biomass has typically been found in fish assemblages associated with the patchy limestone reefs typical of this region in comparison with other common habitats (such as sand and seagrass; Howard, 1989; Fairclough et al., 2011). The current study demonstrated that the relative abundance of each species surveyed, except C. auricularis, was greater in reef habitats (88% of sites contained reef) which may provide protection from predators and food resources (Hutchins, 2001; Fairclough et al., 2008; Harvey et al., 2013; Fairclough, 2016). Coris auricularis is known to feed on epiphytic and benthic invertebrates associated with reef and some seagrasses, but is also known to use sandy habitats for foraging and sleeping (Tuya et al., 2009; Lek et al., 2011). Perhaps surprisingly, no significant relationship was found between the abundance distribution of any fish species and the coverage of the dominant habitat forming macroalgae (E. radiata), despite the current study straddling the ecotone between the deepest extent of macroalgal distribution and shallowest mesophotic assemblages. E. radiata is found throughout the range of the current study and depth itself is a good predictor of the ecotone between macroalgal and sessile invertebrate dominated habitats (Smale et al., 2010). Although we endeavored not to include any overly correlated explanatory variables, it is possible that the significant relationship found between depth and the abundances of C. auratus, C. auricularis, C. rubescens, and N. obliquus may be in part due to variation in habitat across the sampled depth gradient.
Influence of Swell/Water Motion
Not all fish species have the same response to swell regimes. For example, distinct fish assemblages have been found to be associated with nearshore, intermediate, and offshore reefs characterized by different levels of water motion and exposure (Denny, 2005). The morphology of fishes are often adapted to the different levels of exposure/swell, with different sizes and shapes of pectoral fins and caudal fork lengths, which allow them to function in different levels of turbulence (e.g., Fulton et al., 2001, 2005). Thus, the fact that the relative abundances of C. auratus, N. obliquus, and E. armatus were negatively related to swell, may indicate poor swimming ability in high swell conditions. Newman et al. (1997) found on the Great Barrier Reef that L. miniatus is associated with lagoonal areas where wave energy and water motion is lower than the windward reef slope and leeward reef slope areas. However, the current study did not detect a significant response of L. miniatus to swell, which may have been related to the fact that lagoonal environments were not surveyed in the study region, where this species has been found to occur in high abundances (McLean et al., 2010). The strong effect of swell demonstrated for two species in the current study suggests that swell and water motion should be carefully considered in observational studies, in particular for important fisheries species such as C. auratus, to avoid confounding the investigation of abundance distribution patterns.
Future Directions
The simplicity of the POTBot technology allowed a large-scale exploration of the relationships between fish abundance distributions and a range of factors, including commercial and recreational fishing effort, oceanographic conditions, habitat, latitude (temperature) and depth. POTBots are assembled using inexpensive and readily available components that are easily installed in existing fishery infrastructure. While volunteer-based sampling can suffer from a potential decrease in motivation over time (Bird et al., 2014), the use of the automated POTBots during standard commercial rock lobster pot-based fishing activities overcame this issue as fishers are financially motivated to fish and indirectly conduct sampling. In addition, this study was conducted at a fraction of the cost of conventional sampling programs that use remote video. For example, the hire of commercial fishing vessels to conduct 30–50 deployments per day can cost US$ 1,500–4,000 and each camera unit can cost up to US$ 3000 (Langlois et al., 2010; Cundy et al., 2017). Furthermore, the relatively short video lengths allowed the detection of patterns in the relative abundance of selected fishes whilst being much faster and thus cheaper to analyze than traditional video samples (30–60 min; Harasti et al., 2015).
Length data derived from remote stereo-video methods has been shown to be useful to further investigate the effects of fishing (Bornt et al., 2015) and contrast with fisheries-dependent data. To obtain such length data, we recommend that POTBot systems be deployed in stereo. Further comparison against spatio-temporal variation in similar fisheries-independent or -dependent indices is required, but this method could provide an alternative means for monitoring relative abundance, and if deployed as stereo cameras, length data for input into weight of evidence stock assessments (Wise et al., 2007). This sampling methodology is highly applicable in both developed and developing countries and could easily be expanded to other fisheries.
Data Availability Statement
The data associated with this manuscript is available as the “POT Bot Fish Survey: West coast of Australia” Project data in globalarchive.org, an archive of image annotations.
Ethics Statement
This study was conducted under approval from the University of Western Australia Animal Ethics Committee, approval number: RA/3/100/1420.
Author Contributions
TL, SL, DS, and MP conceived the initial ideas and designed the POTBot units. SL and MP collected the data. MB developed the image analysis protocol, analyzed the data, and led the writing of the manuscript. All authors contributed critically to the drafts and gave final approval for publication.
Funding
This project was funded by the Australian Commonwealth Government through the Fisheries Research and Development Corporation, Project reference: 2011/021.
Conflict of Interest
The authors declare that the research was conducted in the absence of any commercial or financial relationships that could be construed as a potential conflict of interest.
Acknowledgments
This project has relied heavily upon the assistance of the fishers of the western rock lobster fishery. Without their assistance in deploying the cameras this project would not have been a success. We thank Dr. Renae Hovey for performing the geospatial analysis to derive surface area estimates for method comparisons (using data from FRDC Project Number: 2008/013). We also thank J. Corley for fish and POTBot illustrations.
Supplementary Material
The Supplementary Material for this article can be found online at: https://www.frontiersin.org/articles/10.3389/fmars.2020.00279/full#supplementary-material
Footnotes
References
Aidoo, E. N., Mueller, U., Goovaerts, P., and Hyndes, G. A. (2015). Evaluation of geostatistical estimators and their applicability to characterise the spatial patterns of recreational fishing catch rates. Fish. Res. 168, 20–32. doi: 10.1016/j.fishres.2015.03.013
Akaike, H. (1973). “Information theory as an extension of the maximum likelihood principle,” in Proceedings of the 2nd International Symposium on Information Theory, (Budapest: Akademiai Kiado), 267–281.
Bird, T. J., Bates, A. E., Lefcheck, J. S., Hill, N. A., Thomson, R. J., Edgar, G. J., et al. (2014). Statistical solutions for error and bias in global citizen science datasets. Biol. Conserv. 173, 144–154. doi: 10.1016/j.biocon.2013.07.037
Bornt, K., Mclean, D., Langlois, T., Harvey, E. S., Bellchambers, L. M., Evans, S. N., et al. (2015). Targeted demersal fish species exhibit variable responses to long-term protection from fishing at the Houtman Abrolhos Islands. Coral Reefs 34, 1297–1312. doi: 10.1007/s00338-015-1336-5
Burnham, K. P., and Anderson, D. R. (2003). Model Selection and Multimodel Inference: A Practical Information-Theoretic Approach. Berlin: Springer Science & Business Media.
Camp, E. V., Ahrens, R. N. M., Allen, M. S., and Lorenzen, K. (2016). Relationships between angling effort and fish abundance in recreational marine fisheries. Fish. Manag. Ecol. 23, 264–275. doi: 10.1111/fme.12168
Cappo, M., Harvey, E., and Shortis, M. (2006). “Counting and measuring fish with baited video techniques-an overview,” in Proceedinhgs of the Workshop on Australian Society for Fish Biology, (Hobart, TAS: Australian Society for Fish Biology).
Cappo, M., Speare, P., and De’ath, G. (2004). Comparison of baited remote underwater video stations (BRUVS) and prawn (shrimp) trawls for assessments of fish biodiversity in inter-reefal areas of the Great Barrier Reef Marine Park. J. Exp. Mar. Biol. Ecol. 302, 123–152. doi: 10.1016/j.jembe.2003.10.006
Chamberlain, M., Sun, C., Matear, R. J., Feng, M., and Phipps, S. J. (2012). Downscaling the climate change for oceans around Australia. Geosci. Model Dev. 5, 1177–1194. doi: 10.5194/gmd-5-1177-2012
Coghlan, A. R., McLean, D. L., Harvey, E. S., and Langlois, T. J. (2017). Does fish behaviour bias abundance and length information collected by baited underwater video? J. Exp. Mar. Bio. Ecol. 497, 143–151. doi: 10.1016/j.jembe.2017.09.005
Cresswell, G. R., and Golding, T. J. (1980). Observations of a south-flowing current in the south-eastern Indian Ocean. Deep Sea Res. A Oceanogr. Res. Pap. 27, 449–466. doi: 10.1016/0198-0149(80)90055-2
Crisafulli, B. M., Fairclough, D. V., Keay, I. S., Lewis, P., How, J. R., Ryan, K. L., et al. (2019). Does a spatiotemporal closure to fishing Chrysophrys auratus (Sparidae) spawning aggregations also protect individuals during migration? Can. J. Fish. Aquat. Sci. 76, 1171–1185. doi: 10.1139/cjfas-2017-0449
Cundy, M. E., Santana-Garcon, J., Ferguson, A. M., Fairclough, D. V., Jennings, P., and Harvey, E. S. (2017). Baited remote underwater stereo-video outperforms baited downward-facing single-video for assessments of fish diversity, abundance and size composition. J. Exp. Mar. Bio. Ecol. 497, 19–32. doi: 10.1016/j.jembe.2017.09.004
Denny, C. M. (2005). Distribution and abundance of labrids in northeastern New Zealand: the relationship between depth, exposure and pectoral fin aspect ratio. Environ. Biol. Fish. 72, 33–43. doi: 10.1007/s10641-004-4178-5
Ellis, D. M., and DeMartini, E. E. (1995). Evaluation of a video camera technique for indexing abundances of juvenile pink snapper, Pristipomoides filamentosus, and other Hawaiian insular shelf fishes. Oceanogr. Lit. Rev. 42, 67–77.
Fairclough, D., Lai, E., and Holtz, M. (2015). “West coast demersal scalefish resource status report,” in Status Reports of the Fisheries and Aquatic Resources of Western Australia 2014/15: The State of the Fisheries, eds W. J. Fletcher and K. Santoro (Perth, WA: Department of Fisheries, Western Australia), 90–95.
Fairclough, D. V. (2016). Similar cryptic behaviour during the early juvenile phase of two unrelated reef fishes: Epinephelides armatus and Bodianus frenchii. Mar. Freshw. Behav. Physiol. 49, 109–117. doi: 10.1080/10236244.2015.1125122
Fairclough, D. V., Clarke, K. R., Valesini, F. J., and Potter, I. C. (2008). Habitat partitioning by five congeneric and abundant Choerodon species (Labridae) in a large subtropical marine embayment. Estuar. Coast. Shelf Sci. 77, 446–456. doi: 10.1016/j.ecss.2007.10.004
Fairclough, D. V., Molony, B. W., Crisafulli, B. M., Keay, I. S., Hesp, S. A., and Marriott, R. J. (2014). Status of Demersal Finfish Stocks on the West Coast of Australia. Fisheries Research Report No. 253. Perth, WA: Department of Fisheries, Western Australia.
Fairclough, D. V., Potter, I. C., Lek, E., and Bivoltsis, A. K. (2011). The Fish Communities and Main Fish Populations of the Jurien Bay Marine Park. Perthg, WA: Murdoch University.
Fairclough, D., and Walters, S. (2019). “West coast demersal scalefish resource status report 2018,” in Status Reports of the Fisheries and Aquatic Resources of Western Australia 2017/18: The State of the Fisheries, eds D. J. Gaughan, B. Molony, and K. Santoro (Perth, WA: Department of Primary Industries and Regional Development), 56–62.
Figueira, W. F., and Booth, D. J. (2010). Increasing ocean temperatures allow tropical fishes to survive overwinter in temperate waters. Glob. Chang. Biol. 16, 506–516. doi: 10.1111/j.1365-2486.2009.01934.x
Fisher, R., Wilson, S. K., Sin, T. M., Lee, A. C., and Langlois, T. J. (2018). A simple function for full-subsets multiple regression in ecology with R. Ecol. Evol. 8, 6104–6113. doi: 10.1002/ece3.4134
Fulton, C., Bellwood, D., and Wainwright, P. (2001). The relationship between swimming ability and habitat use in wrasses (Labridae). Mar. Biol. 139, 25–33. doi: 10.1007/s002270100565
Fulton, C. J., Bellwood, D. R., and Wainwright, P. C. (2005). Wave energy and swimming performance shape coral reef fish assemblages. Proc. R. Soc. Lond. B Biol. Sci. 272, 827–832. doi: 10.1098/rspb.2004.3029
Graham, M. H. (2003). Confronting multicollinearity in ecological multiple regression. Ecology 84, 2809–2815. doi: 10.1890/02-3114
Harasti, D., Malcolm, H., Gallen, C., Coleman, M. A., Jordan, A., and Knott, N. A. (2015). Appropriate set times to represent patterns of rocky reef fishes using baited video. J. Exp. Mar. Biol. Ecol. 463, 173–180. doi: 10.1016/j.jembe.2014.12.003
Harvey, E. S., Cappo, M., Kendrick, G. A., and McLean, D. L. (2013). Coastal fish assemblages reflect geological and oceanographic gradients within an Australian Zootone. PLoS One 8:e80955. doi: 10.1371/journal.pone.0080955
Hovey, R. K., Van Niel, K. P., Bellchambers, L. M., and Pember, M. B. (2012). Modelling deep water habitats to develop a spatially explicit, fine scale understanding of the distribution of the western rock lobster, Panulirus cygnus. PLoS One 7:e34476. doi: 10.1371/journal.pone.0034476
Howard, R. K. (1989). The structure of a nearshore fish community of Western Australia: diel patterns and the habitat role of limestone reefs. Environ. Biol. Fish. 24, 93–104. doi: 10.1007/BF00001280
Hurvich, C. M., and Tsai, C.-L. (1989). Regression and time series model selection in small samples. Biometrika 76, 297–307. doi: 10.1093/biomet/76.2.297
Hutchins, J. B. (2001). Biodiversity of shallow reef fish assemblages in Western Australia using a rapid censusing technique. Rec. West. Aust. Mus. 20, 247–270.
Hutton, T., Mardle, S., Pascoe, S., and Clark, R. A. (2004). Modelling fishing location choice within mixed fisheries: english north sea beam trawlers in 2000 and 2001. ICES J. Mar. Sci. 61, 1443–1452. doi: 10.1016/j.icesjms.2004.08.016
Langlois, T. J., Harvey, E. S., Fitzpatrick, B., Meeuwig, J. J., Shedrawi, G., and Watson, D. L. (2010). Cost-efficient sampling of fish assemblages: comparison of baited video stations and diver video transects. Aquat. Biol. 9, 155–168. doi: 10.3354/ab00235
Langlois, T. J., Harvey, E. S., Radford, B. T., Van Niel, K. P., Meeuwig, J. J., Pearce, A. F., et al. (2012a). Consistent abundance distributions of marine fishes in an old, climatically buffered, infertile seascape. Glob. Ecol. Biogeogr. 21, 886–897. doi: 10.1111/j.1466-8238.2011.00734.x
Langlois, T. J., Meeuwig, J. J., and Harvey, E. S. (2012b). Strong direct and inconsistent indirect effects of fishing found using stereo-video: testing indicators from fisheries closures. Ecol. Indic. 23, 524–534. doi: 10.1016/j.ecolind.2012.04.030
Langlois, T. J., Newman, S. J., Cappo, M., Harvey, E. S., Rome, B. M., Skepper, C. L., et al. (2015). Length selectivity of commercial fish traps assessed from in situ comparisons with stereo-video: is there evidence of sampling bias? Fish. Res. 161, 145–155. doi: 10.1016/j.fishres.2014.06.008
Lek, E., Fairclough, D. V., Platell, M. E., Clarke, K. R., Tweedley, J. R., and Potter, I. C. (2011). To what extent are the dietary compositions of three abundant, co-occurring labrid species different and related to latitude, habitat, body size and season? J. Fish Biol. 78, 1913–1943. doi: 10.1111/j.1095-8649.2011.02961.x
McLean, D. L., Harvey, E. S., and Fairclough, D. V. (2010). Large decline in the abundance of a targeted tropical lethrinid in areas open and closed to fishing. Ecol. Prog. Series 418, 189–199. doi: 10.3354/meps08834
Navarro, M., Hailu, A., Langlois, T., Ryan, K. L., and Kragt, M. E. (2019). Determining spatial patterns in recreational catch data: a comparison of generalized additive mixed models and boosted regression trees. ICES J. Mar. Sci. doi: 10.1093/icesjms/fsz123
Newman, S. J., Williams, D. M., and Russ, G. R. (1997). Patterns of zonation of assemblages of the Lutjanidae, Lethrinidae and Serranidae (Epinephelinae) within and among mid-shelf and outer-shelf reefs in the central Great Barrier Reef. Mar. Freshw. Res. 48, 119–128. doi: 10.1071/MF96047
Pearce, A. F., Helleren, S., and Marinelli, M. A. (2000). Review of Productivity Levels of Western Australian Coastal and Estuarine Waters for Mariculture Planning Purposes. Perth, WA: Fisheries Western Australia.
Polunin, N., and Roberts, C. M. (1993). Greater biomass and value of target coral-reef fishes in two small Caribbean marine reserves. Mar. Ecol. Prog. Ser. 100, 167–167. doi: 10.3354/meps100167
Pörtner, H.-O., Schulte, P. M., Wood, C. M., and Schiemer, F. (2010). Niche dimensions in fishes: an integrative view∗. Physiol. Biochem. Zool. 83, 808–826. doi: 10.1086/655977
R Core Team (2018). R: A Language and Environment for Statistical Computing. Vienna: R Foundation for Statistical Computing.
Ryan, K. L., Hall, N. G., Lai, E. K., Smallwood, C. B., Taylor, S. M., and Wise, B. S. (2015). State-Wide Survey of Boat-Based Recreational Fishing in Western Australia 2013/14 Fisheries Research Report No. 268. Perth, WA: Department of Fisheries Western Australia.
Ryan, K. L., Hall, N. G., Lai, E. K., Smallwood, C. B., Taylor, S. M., and Wise, B. S. (2017). Statewide Survey of Boatbased Recreational Fishing in Western Australia 2015/16. Fisheries Research Report No. 287. Perth, WA: Department of Primary Industries and Regional Development.
Sagarin, R. D., and Gaines, S. D. (2002). The “abundant centre”distribution: to what extent is it a biogeographical rule? Ecol. Lett. 5, 137–147. doi: 10.1046/j.1461-0248.2002.00297.x
Smale, D. A., Kendrick, G. A., Harvey, E. S., Langlois, T. J., Hovey, R. K., Van Niel, K. P., et al. (2012). Regional-scale benthic monitoring for ecosystem-based fisheries management (EBFM) using an autonomous underwater vehicle (AUV). ICES J. Mar. Sci. 69, 1108–1118. doi: 10.1093/icesjms/fss082
Smale, D. A., Langlois, T. J., Kendrick, G. A., Meeuwig, J. J., and Harvey, E. S. (2010). From fronds to fish: the use of indicators for ecological monitoring in marine benthic ecosystems, with case studies from temperate Western Australia. Rev. Fish Biol. Fish. 21, 311–337. doi: 10.1007/s11160-010-9173-7
Soler, G. A., Edgar, G. J., Thomson, R. J., Kininmonth, S., Campbell, S. J., Dawson, T. P., et al. (2015). Reef fishes at all trophic levels respond positively to effective marine protected areas. PLoS One 10:e0140270. doi: 10.1371/journal.pone.0140270
Stewart, K. R., Lewison, R. L., Dunn, D. C., Bjorkland, R. H., Kelez, S., Halpin, P. N., et al. (2010). Characterizing fishing effort and spatial extent of coastal fisheries. PLoS One 5:e14451. doi: 10.1371/journal.pone.0014451
Sumner, N. R., Williamson, P. C., Blight, S. J., and Gaughan, D. J. (2008). A 12-Month Survey of Recreational Boat-Based Fishing Between Augusta and Kalbarri on the West Coast of Western Australia during 2005-06. Fisheries Research Report No. 177. Perth, WA: Department of Fisheries, Western Australia.
Travers, M. J., Potter, I. C., Clarke, K. R., Newman, S. J., and Hutchins, J. B. (2010). The inshore fish faunas over soft substrates and reefs on the tropical west coast of Australia differ and change with latitude and bioregion. J. Biogeogr. 37, 148–169. doi: 10.1111/j.1365-2699.2009.02183.x
Tuya, F., Wernberg, T., and Thomsen, M. S. (2009). Habitat structure affect abundances of labrid fishes across temperate reefs in south-western Australia. Environ. Biol. Fishes 86, 311–319. doi: 10.1007/s10641-009-9520-5
van Herwerden, L., Aspden, W. J., Newman, S. J., Pegg, G. G., Briskey, L., and Sinclair, W. (2009). A comparison of the population genetics of Lethrinus miniatus and Lutjanus sebae from the east and west coasts of Australia: evidence for panmixia and isolation. Fish. Res. 100, 148–155. doi: 10.1016/j.fishres.2009.07.003
Watson, D. L., and Harvey, E. S. (2009). Influence of the Leeuwin Current on the distribution of fishes and the composition of fish assemblages. J. R. Soc. West. Aust. 92, 147–154.
Whiteway, T. (2009). Australian Bathymetry and Topography Grid, June 2009. Canberra, ACT: Geoscience Australia.
Wickham, H. (2009). ggplot2: Elegant Graphics for Data Analysis. New York, NY: Springer-Verlag. doi: 10.1007/978-0-387-98141-3
Wickham, H., François, R., Henry, L., and Müller, K. (2018). dplyr: A Grammar of Data Manipulation. R package version 0.7.6. Available of online: https://CRAN.R-project.org/package=dplyr
Wise, B. S., St John, J., and Lenanton, R. C. (2007). Spatial Scales of Exploitation Among Populations of Demersal Scalefish: Implications for Management. Stock Status of the Key Indicator Species for the Demersal Scalefish Fishery in the West Coast Bioregion. Perth, WA: Department of Fisheries.
Wood, S. N. (2011). Fast stable restricted maximum likelihood and marginal likelihood estimation of semiparametric generalized linear models. J. R. Stat. Soc. Ser. B Stat. Methodol. 73, 3–36. doi: 10.1111/j.1467-9868.2010.00749.x
Wood, S. N. (2017). Generalized Additive Models: An Introduction with R, Second Edition. Boca Raton, FL: CRC Press.
Keywords: automated video, BRUV – baited remote underwater video, POTBot – pictures of the bottom, recreational fishing, commercial fishing, fishery-independent, fishing effort
Citation: Brooker MA, de Lestang S, Fairclough DV, McLean D, Slawinski D, Pember MB and Langlois TJ (2020) Environmental and Anthropogenic Factors Affect Fish Abundance: Relationships Revealed by Automated Cameras Deployed by Fishers. Front. Mar. Sci. 7:279. doi: 10.3389/fmars.2020.00279
Received: 29 January 2020; Accepted: 07 April 2020;
Published: 21 May 2020.
Edited by:
Susana Carvalho, King Abdullah University of Science and Technology, Saudi ArabiaReviewed by:
Andy R. Davis, University of Wollongong, AustraliaPaulo Vasconcelos, Portuguese Institute of Ocean and Atmosphere (IPMA), Portugal
Copyright © 2020 Brooker, de Lestang, Fairclough, McLean, Slawinski, Pember and Langlois. This is an open-access article distributed under the terms of the Creative Commons Attribution License (CC BY). The use, distribution or reproduction in other forums is permitted, provided the original author(s) and the copyright owner(s) are credited and that the original publication in this journal is cited, in accordance with accepted academic practice. No use, distribution or reproduction is permitted which does not comply with these terms.
*Correspondence: Michael A. Brooker, bWljaGFlbC5hbnRob255LmJyb29rZXJAZ21haWwuY29t