 Maximilian Berthold
 Rhena Schumann
- Institute of Biological Sciences, Applied Ecology & Phycology, University of Rostock, Rostock, Germany
Coastal ecosystems are subject to human impacts both through adjacent lands and by run-off from the broader catchment area. Nutrient inputs, like phosphorus, were often lowered decades ago, but many aquatic ecosystems have not recovered accordingly. Therefore, restoration and future protection measures need to be founded upon insights on the nutrient demands of phytoplankton in order to limit their growth and negative impacts upon coastal water bodies. This study investigated phosphatase activity, phosphate uptake, and growth of phytoplankton in a model lagoon system at the southern Baltic Sea coast. This lagoon system is perennially dominated by Cyanobium, a clade of picocyanobacteria which lack nitrogen fixation but which are common in brackish waters. Dissolved phosphate and total nutrient ratios from long-term monitoring point to an overall P-limitation of the system. Apparent phosphatase activities confirmed P-starvation. However, experimental phosphate-fertilizations repeated over an annual cycle increased chlorophyll concentration only when either dissolved nitrogen, or N-fixing cyanobacteria were present. In contrast to chlorophyll, particulate matter increased within a week most of the time at the observed stations, even in unfertilized samples. The difference between chlorophyll and particulate responses could be explained by chlorosis after phosphorus fertilization, as nitrogen was co-limiting. Similar findings have been described for other water bodies. This study indicates that nitrogen is co-limiting in the lagoon system, and that phosphorus input has not yet declined sufficiently.
Introduction
Anthropogenically induced eutrophication is one of the most challenging problems in aquatic ecosystems worldwide, as it not only changed the amounts, but also the timing of nutrient flows to water bodies. Nowadays most eutrophied aquatic ecosystems retain altered communities and biological functions, even after strong nutrient reduction measures, especially in Europe and North America. Large enclosed seas, like the Mediterranean, Black or Baltic Sea are particularly affected by eutrophication (Moncheva et al., 2001; Gustafsson et al., 2012). The Baltic Sea is of particular interest, as it is regarded as a “time machine” with sea surface temperature anomalies already more pronounced. This fact makes the Baltic Sea a model for future climate scenarios (Reusch et al., 2018). Furthermore, the Baltic Sea shows ongoing cyanobacteria blooms (Janssen et al., 2004), in spite of intense restoration measures by its riparian states (HELCOM Indicators, 2017). One important aspect of restoration is ensuring nutrients do not enter larger water bodies. In case of the Baltic Sea, coastal lagoon systems cover 5% of the entire coastal zone, but account for 10% of the P burial and half of the denitrification of all coastal ecosystems in this region (Asmala et al., 2017). These characteristics point at the potential of coastal water bodies to protect larger water bodies. Therefore, coastal water bodies, like lagoons stand in the focus of restoration measures. However, this filter effect makes coastal water bodies themselves prone to eutrophication, as they receive and store nutrient loads from a catchment area. Increased primary production and biomass can lead to increased turbidity, changed food webs, and sometimes harmful algal blooms (see de Jonge et al., 2002; Smith and Schindler, 2009 and sources cited therein).
Restoration measures through nutrient reductions have failed in most cases in Germany, even with 80% reductions of nitrogen (N) and phosphorus (P) from point sources (Umweltbundesamt, 2017). This sustained eutrophied state shows that improvements in water quality are not a linear, but rather a hysteretic process. This hysteresis was described for coastal water bodies and implies that nutrient reductions must be even stronger before phytoplankton biomass eventually drops (Duarte et al., 2009). It is therefore necessary to gain more knowledge about physiological adaptations of phytoplankton beyond nutrient ratios and apparent limitation regimes.
The Darß-Zingst lagoon system (DZLS) can be regarded as model ecosystem for the whole southern Baltic, due to its salinity (salinity of 0–11) and eutrophication gradient spanning poly- to mesotrophic (Schiewer, 2007). The DZLS is monitored daily at one point and monthly at 10 stations along the gradient. These gradients represent the same range of trophic and salinity ranges as the Baltic Sea itself but on a small geographic scale of 60 km. Nutrient loads in the DZLS decreased by more than 80% for P and 60% for N in the 1990s (Bachor, 2005). Yet, the phytoplankton biomass and production remained high, up to 600 mg C m–2 yr–1 and 200 μg Chlorophyll a l–1 (Schiewer, 1998; Berthold, 2016). In comparison to other coastal water bodies of the southern Baltic Sea, the DZLS shows a shallower Secchi depth at lower total P concentrations, and total N: total P ratios of up to 50:1 (Berthold et al., 2018a). Simultaneously, the DZLS is perennially dominated by picocyanobacteria of the clade Cyanobium (Schiewer, 2007; Albrecht et al., 2017), which lack the capacity for N-fixation (Scanlan et al., 2009). Cyanobium seems to be a brackish-adapted clade that is omnipresent in the Baltic Sea (Celepli et al., 2017). This leads to the questions of why and how this cyanobacterial assemblage is so competitive in terms of biomass and if Cyanobium assemblages can and will increase in other managed coastal water bodies as well. The focus of this study was on P cycling, as the greater relative decline in P inputs compared to N inputs, and the mean TN:TP ratio of 36–50:1 point to an overall P-limitation of biomass production in the system. Therefore, P-uptake kinetics, phosphatase activity and P utilization by a growth assay were observed at two sites. One site was close to the main riverine inflow with elevated P inputs while the other was in a region of the mid-lagoon without a direct riverine P input. Phytoplankton close to a permanent, elevated nutrient supply should show less physiological acclimations, like P uptake rates and production of phosphatases, to P-limitation. It was hypothesized that the cyanobacteria assemblage is able to increase its uptake rate of dissolved inorganic P (DIP), if both demand for, and concentration of, P were high. Contrarily, in times with very low DIP concentrations the cyanobacteria assemblage should be able to increase the production of phosphatase (free and cell-bound) to release organic bound P through enzymatic degradation.
Furthermore, the fertilizing effect of a DIP pulse on phytoplankton growth was investigated using two different approaches. One approach was the determination of biomass increase in batch tanks 7 days after fertilization, the other approach a determination of in situ growth by chlorophyll a (Chl a) fluorescence in growth cuvettes. The increase of Chl a and seston (particulate matter) was used to determine the increase of biomass, to compare trends to the actual ecosystem. Furthermore, growth was followed using fluorescence to calculate growth rates. All these experiments combined give a holistic approach to understand the spatial and temporal P dynamics in eutrophic lagoons.
Knowledge about seasonally variable P demand in eutrophic coastal systems can be important for restoration measures, in order to limit cyanobacteria blooms by timely reduction of P inputs. This approach might also be useful to artificially initiate a re-mesotrophication to change the phytoplankton community composition.
Materials and Methods
Sampling Area
The DZLS is a shallow, non-tidal estuary system with a salinity and trophic gradient from west (salinity of 1 ppt, polytrophic) to east (salinity of 10 ppt, mesotrophic) where the system connects to the Baltic Sea. The DZLS has a mean water depth of 2 m and shows no stratification (Schiewer, 2007). Water samples were taken from the Zingster Strom and Ribnitzer See (Zingster Strom: 54°25′47.0′′ N 12°41′14.5′′ E; Ribnitzer See: 54°15′04.2′′ N 12°25′24.1′′ E) in the DZLS (see Figure 1). These sampling points were chosen because the Biological Station Zingst monitors abiotic (salinity, pH, oxygen, nutrients) and biotic (chlorophyll, species composition, particulate matter) parameters on a daily (Zingster Strom) or monthly (Ribnitzer See) basis. Hence, results from experiments were compared to documented seasonal patterns. The Ribnitzer See is in the westernmost part of the lagoon system. It receives an annual load of 20 t total P (TP) yr–1 (LUNG, 2013). The Zingster Strom, in the middle part of the lagoon does not receive any direct freshwater runoff influxes but is rather controlled by in- and outflow events with adjacent lagoon parts, and possibly diffuse sources of nutrients from sediment and surrounding wetlands. It was expected that growth and nutrient demands at both stations are different, as their P-supplies are different.
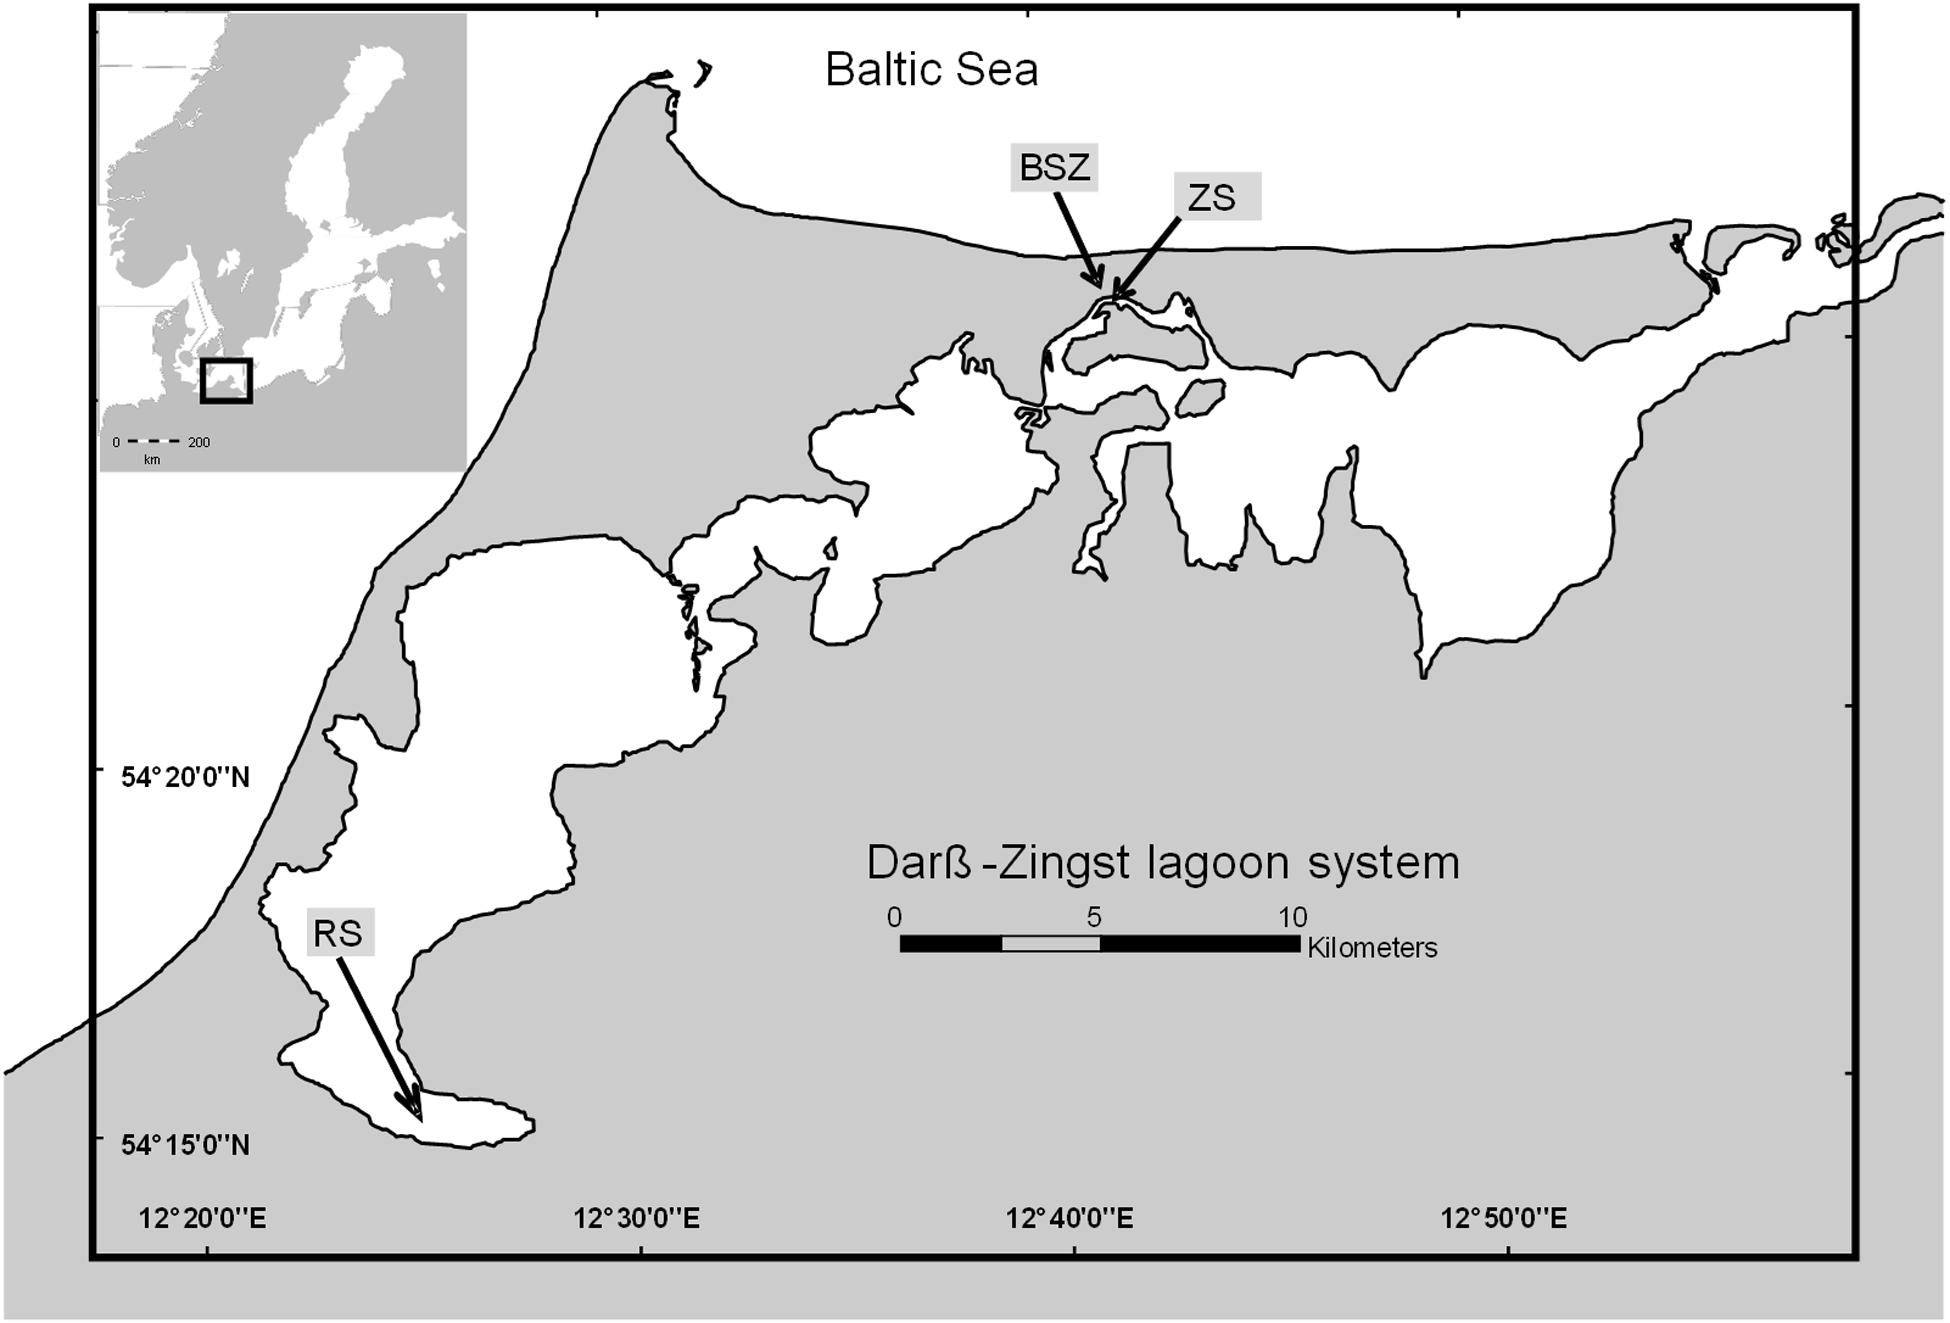
Figure 1. Map of the Darß-Zingst lagoon system (drawn with ArcGIS version 10.2). RS, Ribnitzer See; ZS, Zingster Strom.
Environmental Analysis
Prior to experimental set-ups, water aliquots were separated for later analysis of Chl a, TP, TN, DIN, DIP, and seston (see Table 1 and Figure 2). Zingster Strom samples were taken every 2–4 weeks from July 2013 to November 2014. The Ribnitzer See was sampled monthly from November 2013 to November 2014 with the RV Nauplius (University of Rostock). All samples were taken at ca. 50 cm water depth with a water sampler (volume 1 l, Hydrobios). Zingster Strom samples were processed within 1 h and Ribnitzer See samples within 6 h.
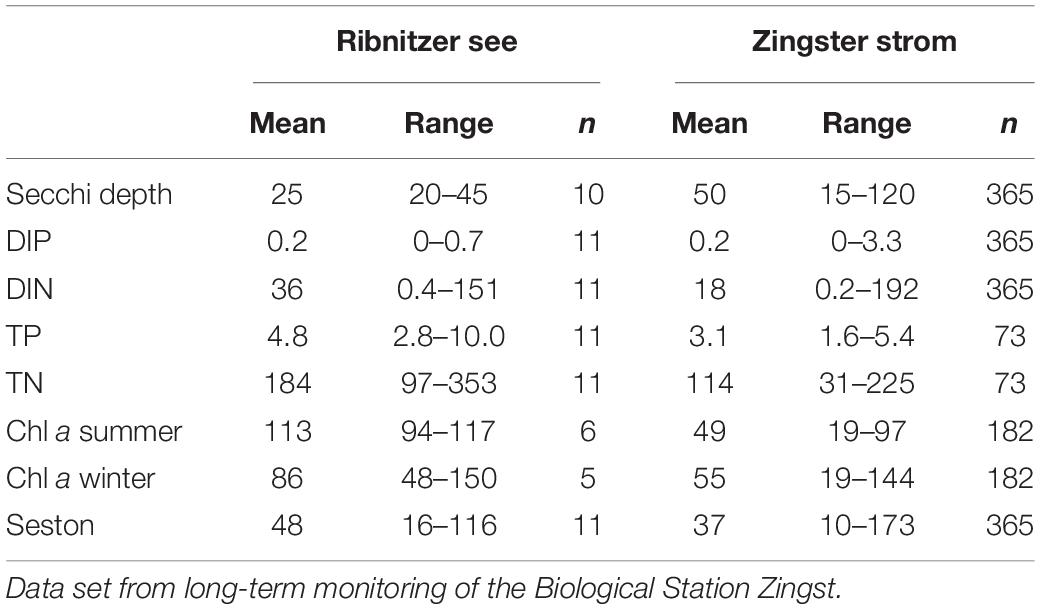
Table 1. Mean and ranges of selected parameters characterizing the Ribnitzer See near the main freshwater inflow (most eutrophied) and the Zingster Strom (center of the eutrophication gradient) for 2014: Secchi depth (cm), DIP (phosphate, μmol l–1), DIN (dissolved inorganic nitrogen, sum of nitrate, nitrite and ammonium, μmol l–1), TP (total phosphorus, μmol l–1), TN (total nitrogen, μmol l–1) seston (mg dry mass l–1) and phytoplankton biomass as chlorophyll a concentration (Chl a, μg l–1) separated into winter (October–March) and summer (April–September), n = number of observations.
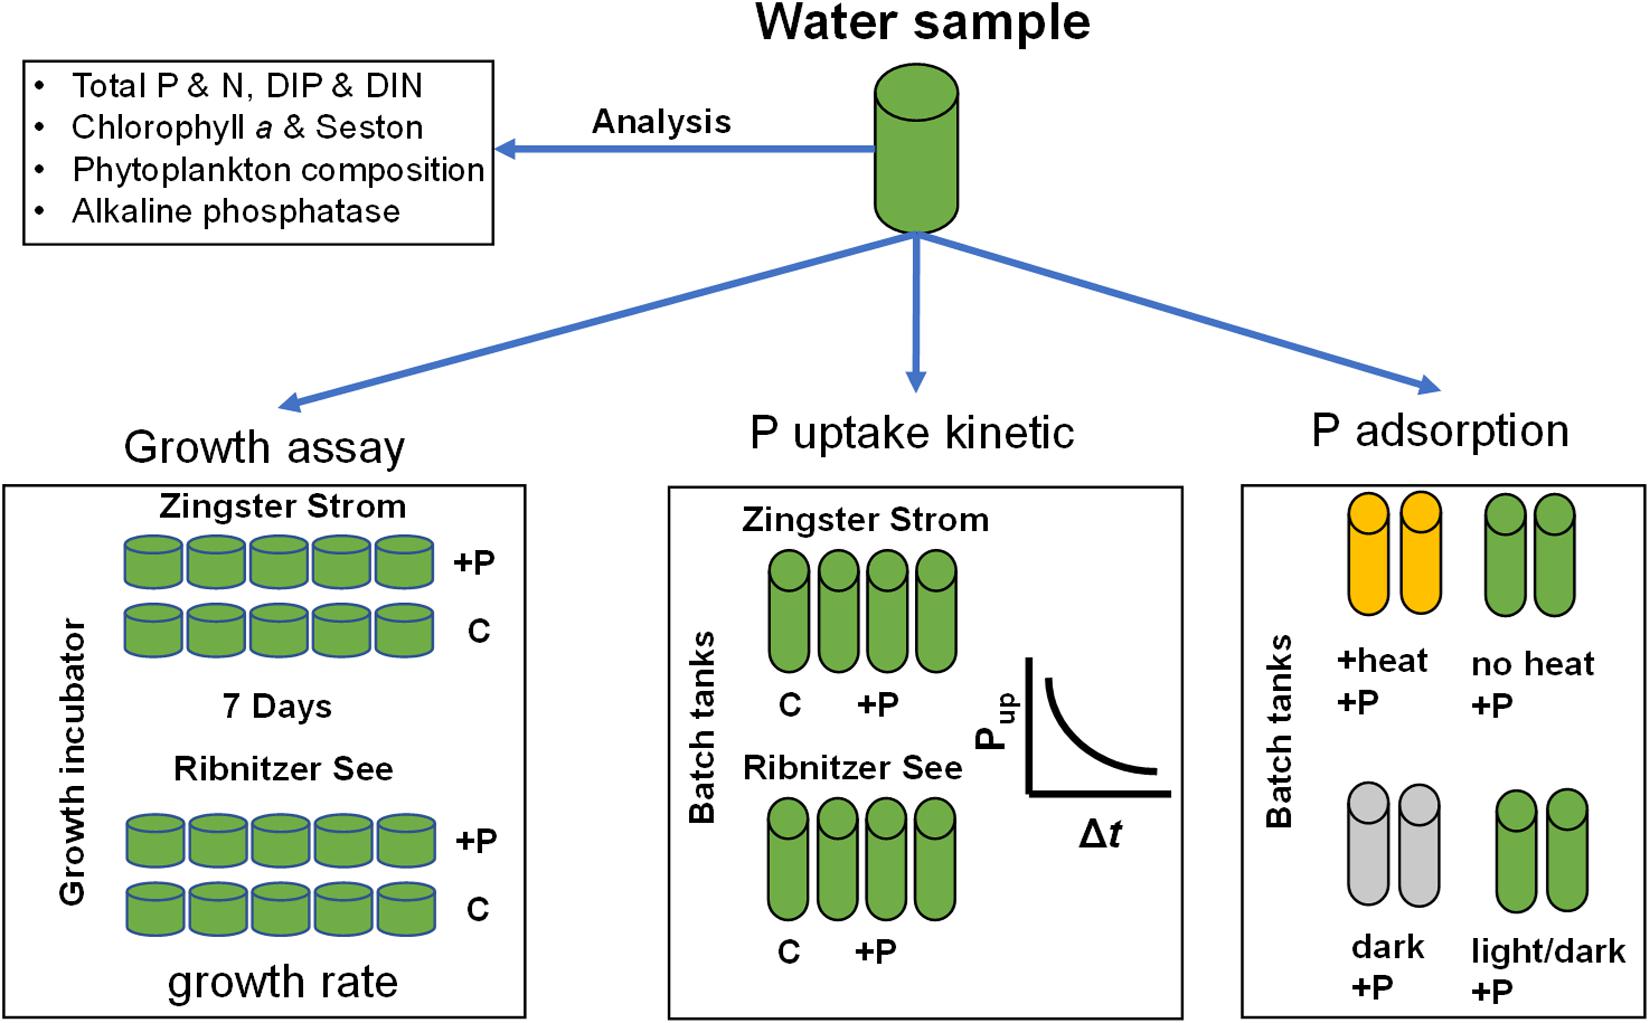
Figure 2. Scheme of the experimental and analytical workflow. P, phosphorus; N, nitrogen; DIP, dissolved inorganic phosphorus; DIN, dissolved inorganic nitrogen (sum of nitrate, nitrite, ammonium); C, control; +P, phosphate addition to final concentration of 10 μmol l–1. Heat experiment – pre-incubation at 70°C for 1 h, dark–dark incubation for at least 12 h.
Water transparency was measured with a Secchi disk. DIN was calculated as the sum of nitrate (NO3), nitrite (NO2) and ammonium (NH4). DIP and the fractions of DIN were analyzed according to Hansen and Koroleff (1999). Samples for TP and TN determinations were digested in an alkaline persulfate solution (Hansen and Koroleff, 1999 modified by Berthold et al., 2015). Fifteen ml of sample were mixed with 1.5 ml alkaline persulfate reagent and incubated at 90°C in perfluoralkoxy-polymer (PFA) vessels for 24 h (Huang and Zhang, 2009). Samples were later neutralized and analyzed with the molybdenum blue method for TP, or by reduction of NO3 to NO2 for TN (Hansen and Koroleff, 1999) either with a spectrophotometer (Hach, DR3900) or using a continuous flow analyzer (Malcolm-Lawes and Wong, 1990).
Apparent APA was measured by the hydrolysis of methylumbelliferyl phosphate (Sigma-Aldrich) (Perry, 1972). Water samples were buffered with 50 μmol l–1 TRIS/HCl (1 part buffer to 10 parts sample) to pH 8.2. Final concentration of substrate was 100 μmol l–1, which is in the saturation range of the enzyme kinetics for the samples investigated here (Heyl, 2016). Triplicate samples were incubated at room temperature for 1–2 h and read at least three times. Fluorescence was measured in a HITACHI 4010 (Excitation 365 nm, emission 451 nm, response 2 s, average 2 s, bandpass 1.5 nm) in acryl cuvettes (Sarstedt). APA was calculated from fluorescence increase over time in each cuvette separately and corrected for a blank value (ultra-pure water with substrate). Results were an average and standard deviation from the three respective replicates of the fluorescence increase, which were corrected for chemical hydrolysis (measured in blanks). Additionally, free APA, i.e., enzymes that were excreted into the water, was determined for the Zingster Strom.
Chl a and seston were collected on glass fiber filters (GF6, nominal pore size 1–3 μm, Co. Roth). GF6-glass fiber filters were used to get enough water on the filter, as the dominating cyanobacteria can form colonies, which clog glass fiber filters with smaller pore size very fast. Lower filtration volume leads to higher deviation between replicates. Therefore, filtrate was checked regularly for signs of chlorophyll, to rule out systematic errors (see analytical quality control). Chl a concentrations were determined photometrically in duplicate after a cold ethanol extraction for 24 h (Strickland and Parsons, 1972). The Chl a content was calculated in μg l–1 according to HELCOM (2015). Before filtration, filters for seston content were pre-combusted at 450°C in a muffle oven (Heraeus Instruments, Type M110) for 4 h and stored in a desiccator. After filtration, filters were dried at 60°C for 24 h. Filters were re-weighed after drying and the difference was used to calculate the seston content in mg l–1.
Phytoplankton composition was determined by microscopy. Sedimentation chambers (volume 1 ml, depth 3 mm) were used to count colonies and eukaryotic phytoplankton with a laboratory light microscope (Euromex) at a magnification of 256x (16x oculars and 16x objective). Small cyanobacteria (<2 μm) were counted using an epifluorescence microscope (Olympus BX51). Therefore, sub-samples (0.5–1 ml) were filtered onto Irgalan-black stained polycarbonate Track-Etch membranes (Sartorius, 0.2 μm, 25 mm) and stained with DAPI solution (1 ml, 92 μmol DAPI l–1, pH = 7.6, 5 min). Biovolume was calculated by using published cell sizes for diatoms and green algae according to HELCOM (Olenina et al., 2006; HELCOM, 2013). Small cyanobacteria (<2 μm) were scanned with an electron microscope for cell sizes, and used to calculate cell sizes (Schumann, unpublished data).
Phosphate Uptake Kinetics
Water samples were incubated ex situ in batch tanks to determine DIP uptake rates and phytoplankton growth. Batch tanks had a diameter of 5 cm, volume 360 ml and were cooled with a water bath. Water samples were not filtered prior to incubation, as only 0.2 to 6% (mean 2.5%) of primary production (kg C ha–1 yr–1) is lost to grazing (Schiewer, 1998; Heerkloss et al., 1999). Furthermore, by allowing any grazers to remain, achieved growth after 7 days would represent not a potential but an already grazing-corrected phytoplankton biomass increase. Typical freshwater grazers like Daphnia are not present in the DZLS. Every experiment included one control per sampling site, and three replicates with DIP-pulses per sampling site. Controls were water samples incubated in parallel but without a DIP-pulse. Incubation started at least 8 h before the treatment for acclimation to light and temperature. Water temperature was kept at 15°C (±1 C) (AquaMedic, Titan 1500) and photon fluxes at 100 μmol m–1 s–2 (16:8 h, Osram Lumilux Deluxe Daylight) inside the batch vessels. The 1% light penetration depth varies around 0.8–1.5 m for the investigated water bodies with photon flux rates during noon at 1600 μmol m–2 s–1 (July, Schubert et al., 2001; Schoor et al., 2008). Light compensation points of phytoplankton (EK) were described to range from 35 to 175 μmol photons m–2 s–1 (Schumann et al., 2005). Therefore, the chosen photon flux rate was neither high enough to induce photoinhibition nor too low. The added DIP-pulse consisted of 3.6 ml of a 1 mmol l–1 DIP (stock solution KH2PO4, Roth) to keep community dilution by fertilization to a minimum and to reach a starting concentration of 10 μmol l–1 DIP. Aliquots of 15 ml were retrieved from all batch tanks, and filtered (GF6 glass fiber filters, Roth) right before, right after the pulse, after 1, 3, 5, 7, and 24 h to determine how much DIP was taken up.
Test for Abiotic Phosphate Adsorption
Two different treatments (heat or dark incubation, were used to determine the impact of biological processes on the DIP loss from the water, i.e., biological vs. non-biological DIP removal in the batch tanks. The DIP loss rates of these two treatments were compared to simultaneously conducted experiments with normal conditions as described above. For the heat treatment, water samples were heated at 70°C to analyze possible adsorptive processes removing DIP from solution to the batch tank walls or onto particles in the seston, rather than a biological uptake which would be inactivated by heat. A temperature of 70°C or higher leads to a release of Chl a molecules and complete inactivation of Photosystem II (Lípová et al., 2010). DIP uptake in plankton is energy driven. Water samples of the second treatment were incubated by covering them in aluminum foil. Therefore, some water samples were kept in the dark at 15°C (±1°C) (AquaMedic, Titan 1500) for at least 12 h to pre-incubate. It was assumed that the pre-incubation would lower energy reserves within the phytoplankton community. This approach should determine the DIP uptake capacity of phytoplankton under aphotic conditions within the lagoon system. Experiments with dark samples were replicated in July 2013 and September 2014, with heat experiments in November 2013 and January 2014. Water temperature was kept at 15°C (±1°C) (AquaMedic, Titan 1500) and photon fluxes at 100 μmol m–1s–2 (except dark incubation, 16:8 h, Osram Lumilux Deluxe Daylight) inside the batch vessels. The added DIP-pulse consisted of 3.6 ml of a 1 mmol l–1 DIP (stock solution KH2PO4, Roth) to keep community dilution by fertilization to a minimum and to reach a final concentration of 10 μmol l–1 DIP. Aliquots of 15 ml were retrieved from all batch tanks, and filtered (GF6 glass fiber filters, Roth) right before, right after the pulse and after 1, 3, 5, 7, and 24 h for DIP quantification.
Growth Rates and Biomass Increase
P-enriched experiments were used to observe the biomass increase at both stations from December 2013 onwards. Samples were analyzed for seston and Chl a in the beginning and after 7 days. Chl a was used as a proxy for phytoplankton biomass. Seston was used to describe the increase of particulate matter.
Additionally, phytoplankton growth rates were determined at Ribnitzer See and Zingster Strom stations by following in vivo fluorescence of Chl a (Gustavs et al., 2009). Water samples were diluted 1:10 with the respective GF6 filtrates of the sampling site to prevent light limitation and decrease the fluorescence signal upon incubation. Otherwise, the fluorescence signal would have been out of range after a few days. Diluted samples (20 ml) were placed into UV-C sterilized cuvettes (Licefa). The fluorometer was blanked with filtrate of the respective water samples. The fluorescence signal is stated in relative fluorescence units (rfu). All treatments were incubated and measured in five replicate cuvettes. Those cuvettes were shaken gently before and after each measurement to prevent accumulation of phytoplankton somewhere at the cuvette bottom. The fluorometer (MFMS, Hansatech) was calibrated daily by a Rhodamin-B standard (Karsten et al., 1996). Water samples without DIP fertilization were treated as controls. DIP-stock solution (1 mmol l–1 KH2PO4, Roth) was added after the first measurement. Final concentrations were 10 μmol l–1 DIP. Cuvettes were incubated at 15°C (±1 C). Mean photon flux was 80 μmol m–1 s–2 (16:8 h light/dark) inside the incubator equipped with white light LEDs (Kunststofftechnik Rostock). The photon flux rate was kept at a lower level compared to the batch tanks, as samples were diluted. Cuvettes changed positions in the incubator every day horizontally to compensate for possible uneven light climate. Incubation started at least 12 h before the first measurement, i.e., phytoplankton was subjected to a dark period of 8 h before the start of the experiment. Cuvettes were measured daily at the same time for 7 days allowing early observations of phytoplankton growth stagnation. Growth curves were fitted for a logistic growth (Fuchs and Schlegel, 2007) by an iterative optimization procedure (least square estimator, Solver function of MS Office Excel). The equation parameters were optimized for the minimal accumulated deviance of measured and calculated biomasses, which were normalized by the calculated biomass. The curve variables were the maximum (exponential) growth rate and the capacity, which were calculated for each replicate separately.
Analytical Quality Control
The determination limits for quantitation’s were 0.05 μmol l–1 DIP (continuous flow analyzer) and 0.4 μg l–1 Chl a. Blanks and standards were measured in every analytical series and were plotted in control charts. Standard deviations or spans were calculated from replicate sample measurements, normalized over the arithmetic means and were summarized in deviation control charts. Average sample deviations of seston and Chl a (no standards available) were 8.9 and 2.7%, respectively. Chl a concentrations in filtrate lost through GF6-filters were 1.2 μg l–1 (mean, n = 21), equivalent to 2.6% of total Chl a concentrations in 2014. The average standard deviation from the nominal value was added to average standard deviation of sample replicates (Doerffel, 1990) to a combined standard deviation. Random errors of replicate samples and all standard values measured over the whole investigation period were included into a combined standard deviation. The combined standard deviations were 15% for DIP, and 12% for TP.
Statistical Analysis
SigmaPlot 13.0 was used for statistical analysis. Shapiro–Wilk-tests were run to test all data for normal distributions. The correlation analysis used the Spearman-Rho-test for non-parametric data. t-Tests (if normally distributed) and Wilcoxon-signed-rank tests (if non-normally distributed) were used to compare groups before and after a treatment. An ANOVA (Holm-Sidak method) was used to compare many groups with each other.
Results
Environmental Conditions in the Zingster Strom and Ribnitzer See
There was no ice formation in winter during the observation period. Water temperatures were lowest with an average of 2°C in February and highest at 23°C in July. Secchi depth was < 50 cm at both stations, but lower at the Ribnitzer See than at the Zingster Strom (Table 1). Average DIP was low at both stations and close to the determination limit (<0.05 μmol l–1) although higher concentrations were observed in the Zingster Strom (up to 3 μmol DIP l–1, with six measures of DIP > 1 μmol DIP l–1, n = 365 in 2014, see Supplementary Figure 1 for weekly averages). DIN showed very high peaks (>150 μmol l–1) during winter at both stations, and was always above the detection limit (>0.5 μmol l–1) in summer. The Ribnitzer See always had 25% higher TP concentration, and had on average15–50% higher TN concentrations, compared to the Zingster Strom. Average Chl a concentration was twice as high at Ribnitzer See compared to the Zingster Strom during summer. However, average Chl a concentrations at Ribnitzer See was 35% lower in winter compared to summer, contrary to Zingster Strom where Chl a stayed the same over winter and summer. The seston content of Ribnitzer See was on average 10% higher than the Zingster Strom.
Cyanobacteria were the dominant group at both stations throughout the sampling period (Figure 3). However, there was a brief period where Bacillariophyceae reached an equal biovolume to cyanobacteria between March and May in the Ribnitzer See. The total biovolume was at least two- to four-times higher in the Ribnitzer See, compared to the Zingster Strom. The Zingster Strom was exclusively dominated by Synechococcales in biovolume throughout the observed period. The difference in biovolume is consistent with the difference in Chl a concentrations between stations.
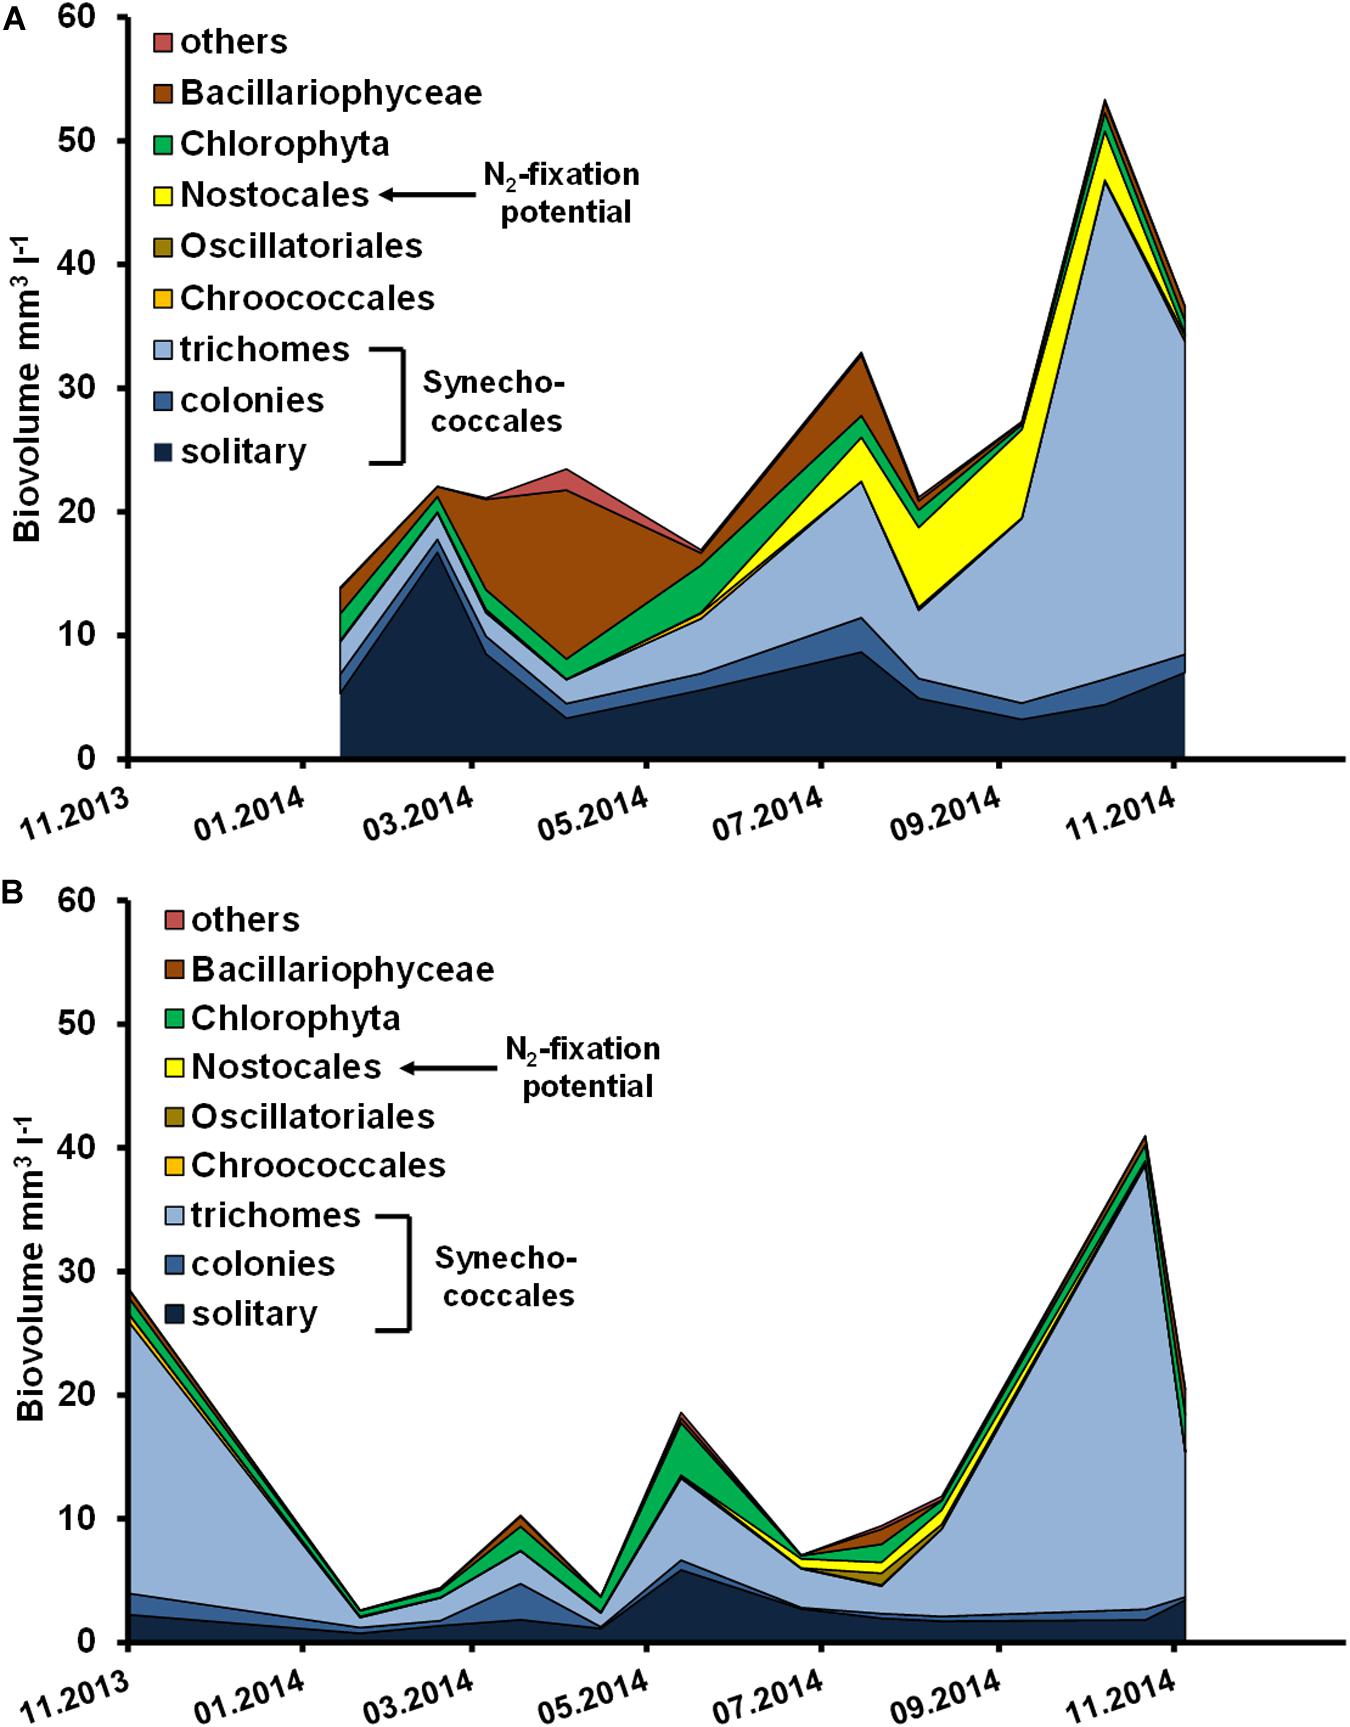
Figure 3. Phytoplankton biovolume (mm–3 l–1) in the (A) Ribnitzer See from January to November 2014, and (B) Zingster Strom from November 2013 to November 2014.
Estimation of Abiotic DIP Adsorption
DIP decreased in the water of heated treatments at a rate of only 12 nmol DIP h–1 compared to 215 nmol DIP h–1 in untreated ones within 24 h (Figure 4A). There was no DIP release in the heated water samples without DIP fertilization as they were comparable to concentrations before incubation (start DIP = 0.2 μmol l–1, heat control DIP = 0.2–0.4 μmol l–1). Seston concentrations remained the same after heat treatment (Sestonbefore: 21.9 ± 4.6 mg l–1, Sestonafter: 22.5 ± 2.5 mg l–1). The Chl a concentration dropped from 34 to 3.1 μg l–1 after the heat treatment. These results indicate our measures of DIP loss from water were heavily dominated by biological processes inactivated by heat.
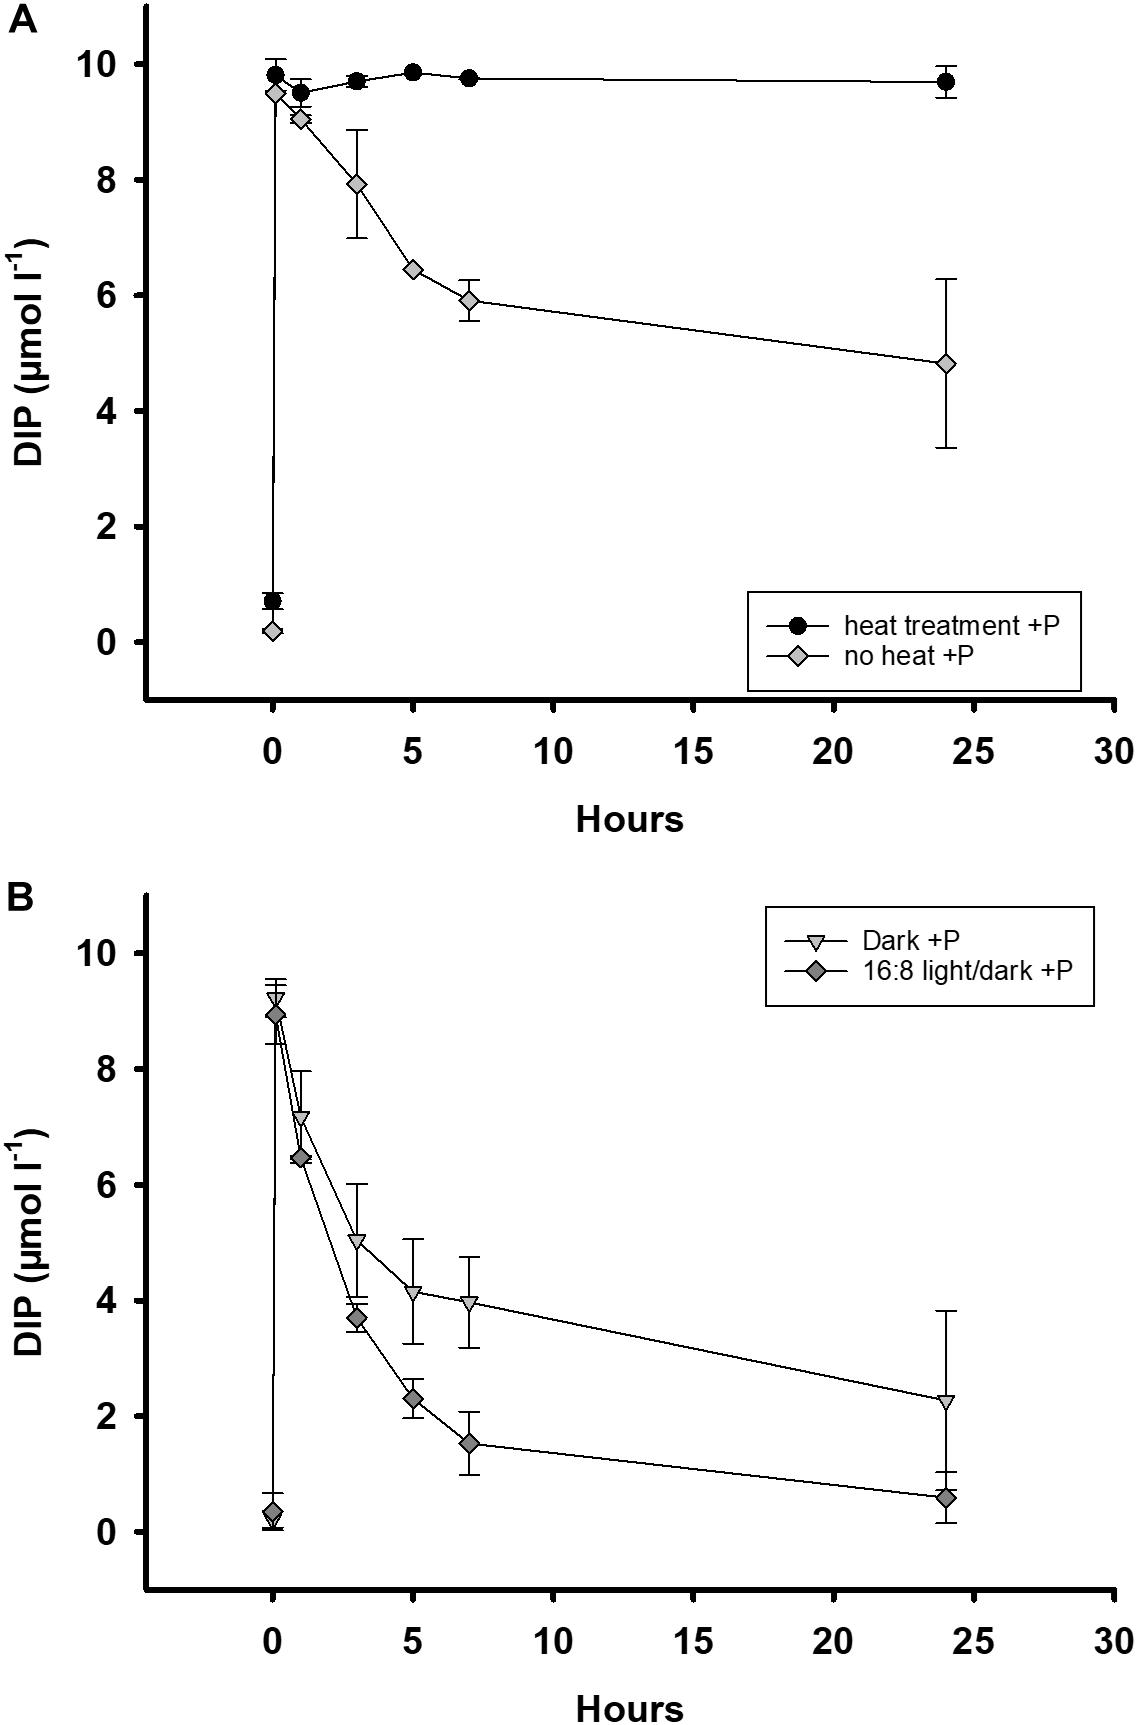
Figure 4. Development of a DIP addition (DIP, 10 μmol l–1) in batch tanks for 24 h. All samples were from the Zingster Strom. (A) DIP addition to pre-heated (70, ± 2°C) and unheated batch tanks (n = 2) for 24 h. Heat treatment was conducted in November 2013 and January 2014. (B) DIP addition to dark incubated (n = 2) and normally irradiated batch tanks (n = 2). Dark incubation started 12 h before DIP addition and was conducted in July 2013 and September 2014 (n = 2). Error bars are calculated as standard deviation. Incubation in batch tanks at 15°C (±1°C), photon flux 100 μmol photons m–2 s–1, light:dark 16:8 h.
In dark incubated batch tanks, DIP uptake rates were 320 nmol DIP h–1 whereas in batch tanks with light/dark cycle DIP uptake rates were 390 nmol DIP h–1 within 24 h (Figure 4B). Decrease of DIP in dark incubated batch tanks differed significantly during autumn (t-test, p = 0.006), and summer (t-test, p = 0.05), when compared to batch tanks with a day/night light cycle. The DIP concentrations in dark incubated batch tanks without DIP fertilization remained constant before and after the incubation, above detection limit (∼0.2 μmol l–1). These results indicate that there was no detectable DIP release nor uptake in unfertilized, dark incubated treatments during the experiments.
DIP uptake rates in untreated batch tanks (no heat, normal light) were within the range of other observed DIP uptake rates in the respective season (see Figure 4 and Supplementary Figure 2).
Phosphatase Activity and Phosphate Uptake
Absolute APA ranged between 1.5 (May) – 10.8 (August) μmol l–1 h–1 in the Ribnitzer See and 0.5 (May) – 6 (August) μmol l–1 h–1 in the Zingster Strom (not shown). Absolute APA was always low during periods of high DIP-concentrations in the Zingster Strom. In contrast, low DIP-concentrations (<0.2 μmol l–1) coincided with both high and low total APA (1–6 μmol l–1 h–1). Absolute APA correlated moderately with Chl a (Spearman Rank, r = 0.5, p = 0.002, n = 38), but with none of the other measured parameters at the Zingster Strom. Free APA was highest during summer months, where it contributed up to 50% of all APA in the Zingster Strom (mean 15%, see Supplementary Figure 1). Contrary to total APA, the activity of free APA was negatively correlated with the amount of DIP (Spearman Rank, r = −0.39, p = 0.04, n = 30, weekly averages were compared). This negative correlation becomes apparent during summer, where DIP was below the detection limit from mid of July until end of August (weekly mean) with simultaneously high free APA. The apparent threshold to an up-regulation of free APA was around 100–150 nmol DIP l–1, depending upon the mode of calculation; daily measurements or weekly averages.
APA per Chl a dropped after March 2014 by 75–80% at both stations (Figure 5). There was a steady increase thereafter until the highest APA per Chl a were measured in late August 2014 at both stations. Even though Chl a at Ribnitzer See was twice that at the Zingster Strom APA per Chl a was not significantly different between stations (ANOVA, Holm-Sidak method, p = 0.79).
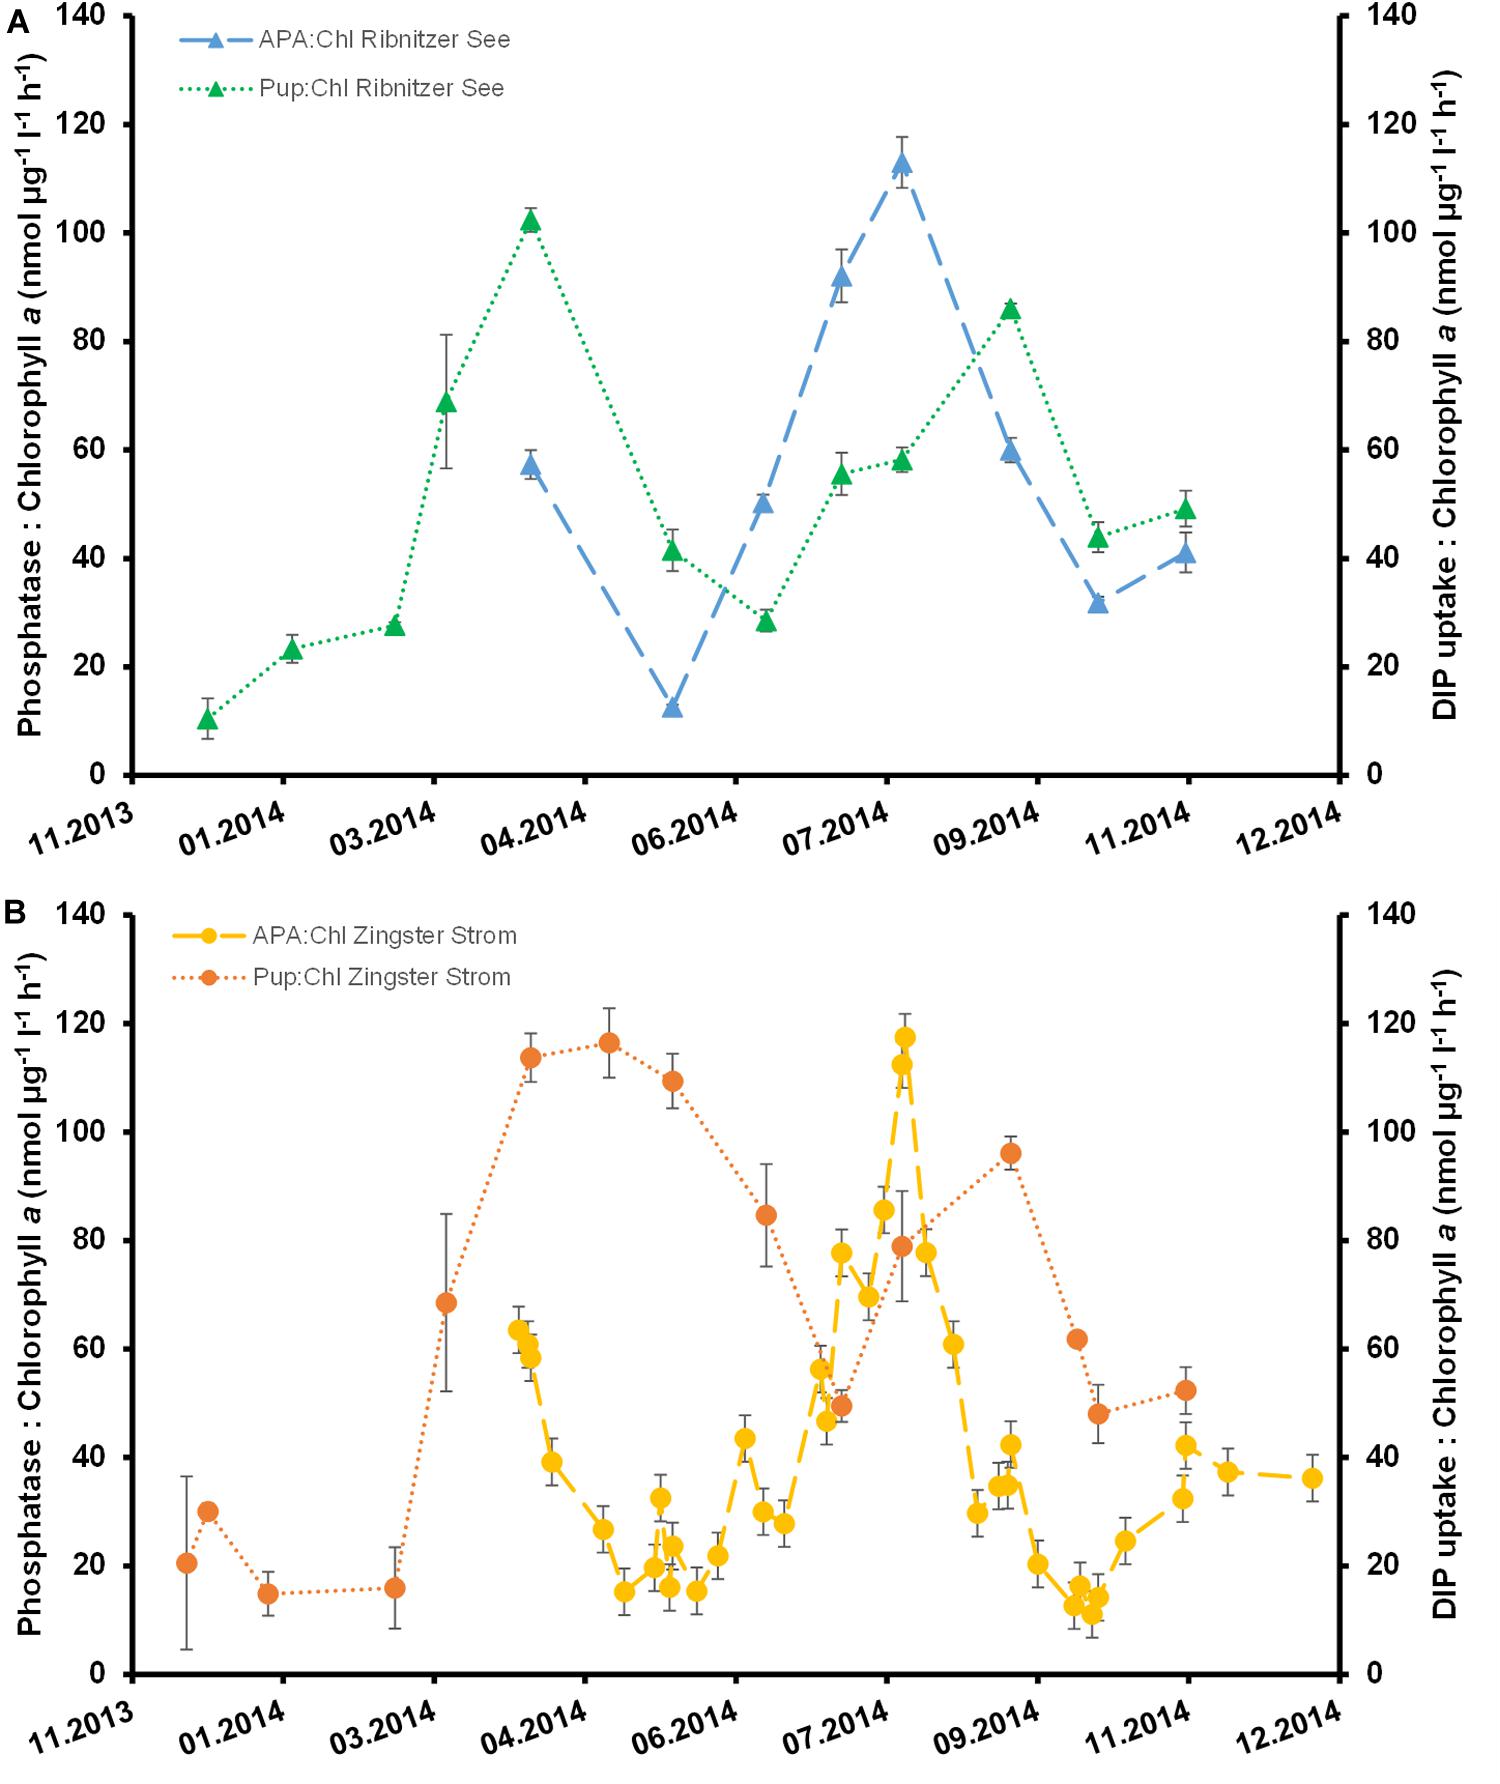
Figure 5. Phosphatase activity normalized to chlorophyll a (nmol μg–1 l–1 h–1) and dissolved inorganic phosphate uptake of the first hour normalized to chlorophyll a (nmol μg–1 l–1 h–1) for the Ribnitzer See (A) and in the Zingster Strom (B). Error bars represent the combined standard deviation from measuring replicates of phosphatase activity (n = 3), DIP uptake (n = 3), and Chl a (n = 2).
Absolute DIP uptake rates were always highest within the first hour after DIP fertilization at both stations. Absolute DIP uptake rates within the first hour were slower in winter (December to February, 1–2 μmol l–1) compared to the remaining year (March to November, 4–9.5 μmol l–1) in batch tanks from the Ribnitzer See. The same pattern was observed for absolute DIP uptake rates in batch tanks of the Zingster Strom with slower uptake during winter (0.7–2 μmol l–1, December–February) compared to the remaining year (4–7.5 μmol l–1, March to November). Added DIP was taken up completely in 11 out of 13 experiments (Ribnitzer See) and in 12 out of 16 experiments (Zingster Strom) within 24 h. In the other experiments (November to February), 1–4 μmol DIP l–1 remained within the water by 24 h after DIP fertilization. Surprisingly, absolute DIP-uptake within the first hour did not correlate significantly with Chl a (r = 0.396; p = 0.18, n = 12) nor with the seston content (r = 0.52, p = 0.06, n = 12) in the Ribnitzer See, but did correlate with Chl a and with seston at the Zingster Strom (Chl a r = 0.39; p = 0.03, n = 31, seston r = 0.56, p ≤ 0.01, n = 31). The slowest DIP uptake per Chl a was during winter (Figure 5) at both stations. The Ribnitzer See showed (on average) lower DIP uptake per Chl a during spring and summer at simultaneously higher total Chl a concentrations compared to the Zingster Strom. Interestingly, phytoplankton at the Ribnitzer See seemed to have very high initial uptake capacities, as DIP concentrations and simultaneously uptake rates dropped within 3 h (see Supplementary Figure 2). Phytoplankton in the Zingster Strom took longer to deplete the added DIP and DIP uptake rates decreased more slowly. Interestingly, APA per Chl a was similar at both stations, but the DIP uptake per Chl a was not.
Absolute Growth and Growth Rates With and Without DIP-Fertilization
Figures 6, 7 show the deviation of Chl a and seston concentrations in batch tanks with and without DIP fertilization, compared to the development at both sampling stations. In the Ribnitzer See DIP fertilization increased the Chl a concentration compared to unfertilized samples when either DIN was high (winter, Table 1), or when N-fixing cyanobacteria were present (Figure 3A). The Chl a concentrations in batch tanks both with and without DIP fertilization were consistently different from the probable Chl a development in the Ribnitzer See (Figure 6A). Chl a increased in 7 out of 12 experiments with DIP fertilization, and also in four experiments without DIP fertilization. Interestingly, Chl a concentrations after 7 days in fertilized batch tanks dropped below probable Chl a concentrations in the ecosystem when either diatoms were abundant, or when the phytoplankton composition had shifted (see Figure 3A).

Figure 6. Comparison of Chlorophyll a concentration (μg l–1) in unfertilized (control) and fertilized (+P) samples after 7 days and the actual ecosystem (Ribnitzer See and Zingster Strom) in 2014. Samples were fertilized with a 10 μmol l–1 DIP pulse (final concentration) at day 0. Treatments with waters of the Ribnitzer See (A) and Zingster Strom (B) were filtrated after 7 days of incubation. Additionally, Chlorophyll-values from the actual ecosystem (only Zingster Strom) were included as weekly average. Incubation in batch tanks at 15°C (±1°C), photon flux 100 μmol photons m–2 s–1, light:dark 16:8 h. Error bars in A and B are calculated as standard deviation (n = 3).
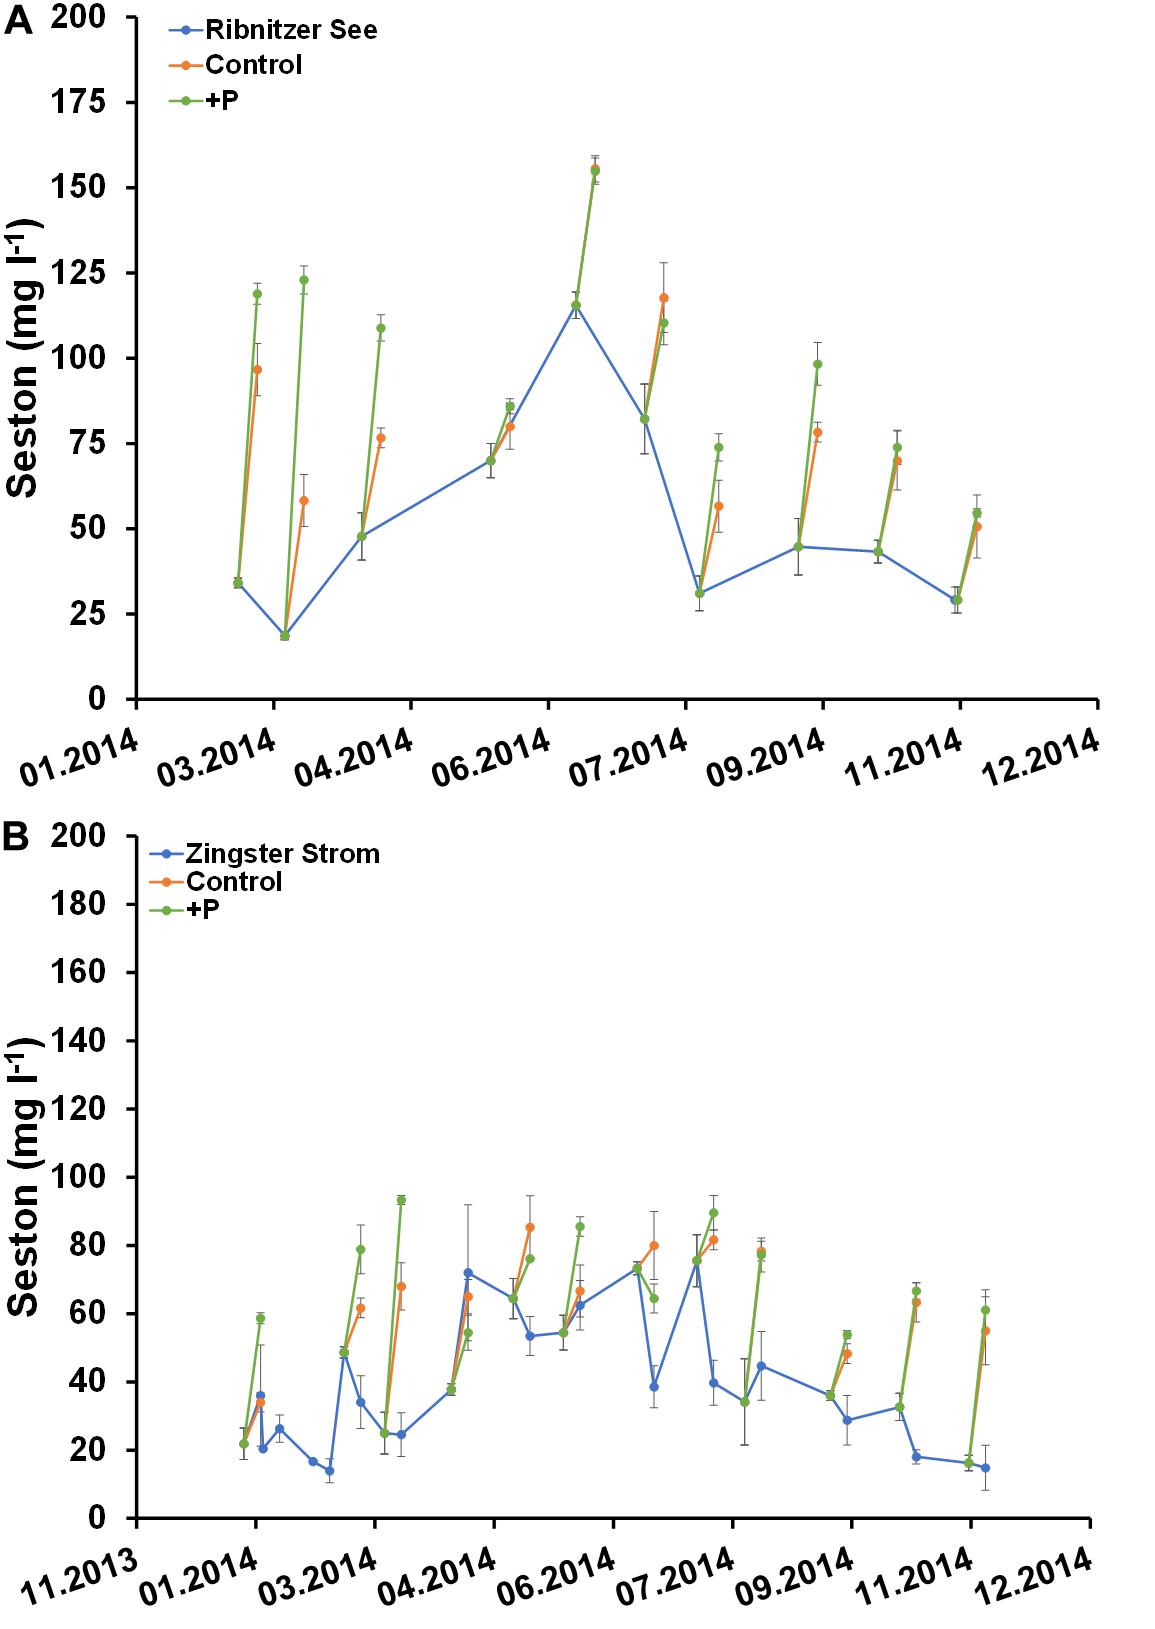
Figure 7. Comparison of seston concentration (mg l–1) in unfertilized (control) and fertilized (+P) samples after 7 days and the actual ecosystem (Ribnitzer See and Zingster Strom) in 2014. Samples were fertilized with a 10 μmol l–1 DIP pulse (final concentration) at day 0. Treatments with waters of the Ribnitzer See (A) and Zingster Strom (B) were filtrated after 7 days of incubation. Additionally, Chlorophyll-values from the actual ecosystem (only Zingster Strom) were included as weekly average. Incubation in batch tanks at 15°C (±1°C), photon flux 100 μmol photons m–2 s–1, light:dark 16:8 h. Error bars in A and B are calculated as standard deviation (n = 3).
The Zingster Strom showed a different pattern, with Chl a being higher after 7 days in fertilized and unfertilized batch tanks only in winter and late autumn than in the actual ecosystem (Figure 6B). It is noticeable that Chl a concentrations in batch tanks with Zingster Strom water from spring and summer showed patterns similar to the actual Zingster Strom, regardless of whether DIP was added or not. Interestingly, the highest Chl a increase in batch tanks was observed when relative P-uptake rates were lowest at both stations (Figures 5, 6).
Seston development within the batch tanks from both stations did not show the same pattern as Chl a (Figure 7). Seston concentrations in fertilized and unfertilized samples were almost always higher than seston concentrations at the respective sampling sites after 7 days (Figure 7). However, there were no significant differences in seston between controls and fertilized samples after 7 days. It was surprising that seston increased more often, compared to Chl a.
The simultaneously performed growth rate experiments in an incubator showed similar growth patterns as found in the batch tanks. Growth rates were significantly higher in DIP-fertilized cuvettes of the Ribnitzer See (Wilcoxon-signed-rank, p = 0.004, n = 11) and the Zingster Strom (Wilcoxon-signed-rank, p = 0.025, n = 11) compared to control cuvettes without DIP fertilization after 7 days (Table 2). At both stations, samples from January to March outgrew the measurement range in a couple of days, unlike the remainder of the year where growth stagnated early after P addition. Calculated growth rates indicated that phytoplankton would have continued growing in winter, as growth curves were still in exponential phase. Phytoplankton biomass in cuvettes incubated for 7 days consisted mostly of diatoms and less cyanobacteria between January and March, contrary to the incubations over the remaining year and the species development in the actual system where cyanobacteria generally dominated (Figure 3). Interestingly, P fertilization in incubators during summer increased growth rates in water from both stations by at least 30% compared to controls (see Table 2), which was in contrast to lowered Chl a concentrations in the batch tanks experiments.
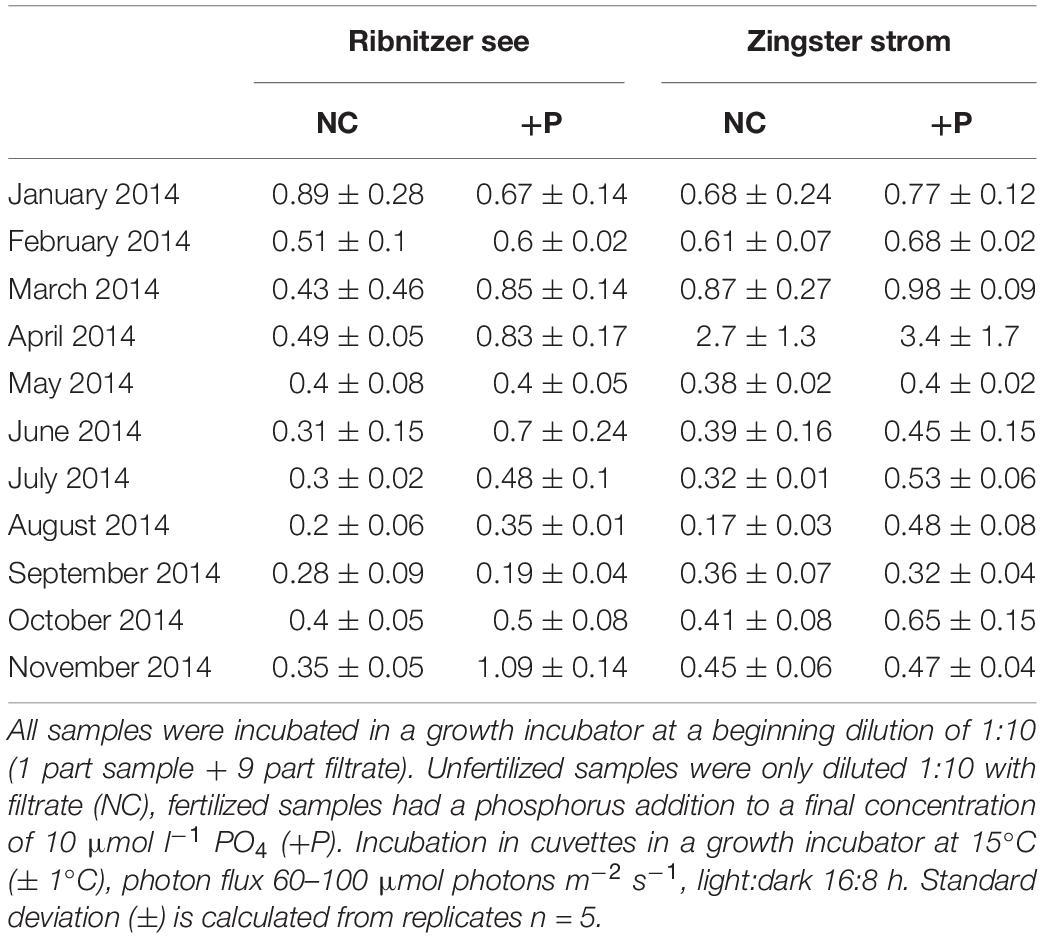
Table 2. Mean growth rates of fertilized and unfertilized samples of the Ribnitzer See and Zingster Strom during January 2014 to November 2014.
Discussion
Seasonal Development of P Uptake and Demand
The main question of this work was how a phytoplankton community sustains its biomass at low DIP concentrations and under mostly light-limiting conditions. The results of the adsorption and uptake experiments under heated or dark conditions reveal several implications for the ecosystem. There was neither an adsorption nor precipitation of DIP onto or within seston in heated treatments to inactivate biological uptake. This result indicates the dominant role of living compartments, like bacterio- or phytoplankton, in DIP removal from the water. This result was surprising, because one pathway for DIP loss from oxic, brackish waters is co-precipitation with calcite (Gunduz et al., 2011) or the formation of iron-rich colloids with DIP (Gunnars et al., 2002). Such colloids can remove 40% of DIP within ca. 40 h in brackish waters (salinity of around 6) (Gunnars et al., 2002). The 24 h duration of the post-heat experiment (see Figure 4) would be enough to see a DIP decline attributable to abiotic precipitation, but no such decline was observed in our system.
The uptake rates in dark incubated treatments were significantly lowered although not to the extent of the heat treatment (see Figure 4), which strongly points to the biological component dominating the uptake, i.e., bacterio- and phytoplankton. Joint et al. (2002) showed that bacterioplankton competed with phytoplankton for nutrient pulses, at least when provided with sufficient organic C supply, in the form of glucose. Schumann et al. (2003) showed that the DZLS has a high autochthonous POC (up to 16 mg C l–1) and DOC (up to 12 mg C l–1) concentrations and a high bacterial activity (18 μg C l–1 h–1). This result indicates that bacterioplankton had a large C supply in this lagoon and could therefore compete with phytoplankton for DIP. Bacterial DIP uptake rates can range from 70% of total planktonic uptake close to anthropogenic inflows to 15% along the salinity gradient of an estuary (Lebo, 1990). It can therefore be assumed that a significant part of the DIP fertilization pulses goes into the bacterioplankton, if phytoplankton uptake rates are slowed in aphotic zones. Eutrophic systems are usually very turbid, so that phytoplankton is often light-limited. The Secchi depths presented in this study were 30 to 45 cm (see Table 1). The 1% light penetration depth where a balanced primary production is still possible, was 0.8 to 1.5 m, depending on Chl a (Schubert et al., 2001). These depths indicate that much of the phytoplankton would be in aphotic zones, because the DZLS is 2–3 m deep on average (Correns, 1976). If the nutrient uptake in those aphotic zones is dominated by bacterioplankton, a DIP pulse from sediment would have only a minor effect on the DIP nutrition of phytoplankton. However, viral lysis or grazing pressure on bacterioplankton within the microbial loop could possibly support phytoplankton through a delayed remineralization reaction (Azam et al., 1983; Schiewer, 2007).
Nonetheless, the environmental TN:TP ratios (see Table 1) indicated P-limitation, while available dissolved nutrients were close to detection limits during summer months. These findings are in agreement with long-term data sets from this and other coastal water bodies in this region (Berthold et al., 2018a). Furthermore, absolute APA and APA per Chl a were highest during summer, which can be accounted as proxy for P-demand (e.g., Hoppe, 2003). A high APA normalized to seston (equivalent to POM Gage and Gorham, 1985, or POC Healey and Hendzel, 1979) indicates P-starvation. Values > 48 nmol DIP release mg POM–1 h–1 indicate a starvation condition, values > 125 nmol DIP release mg POM–1 h–1 indicate severe starvation. Assuming that 60% of seston is POM in the DZLS (values from J. Meyer, personal communication, n = 40 in 2014), then all observed summer samples had high phosphatase values consistent with severe P starvation. In contrast to APA : seston, APA : Chl a was lower in the DZLS than in coastal waters of the Mediterranean (Gage and Gorham, 1985) and never exceeded the P-starvation threshold of 200 nmol DIP release μg Chl a–1 h–1 (Vidal et al., 2003). However, this starvation threshold might be variable, as Carbon to Chl a in microalgae can range from 6 to 40 depending on light and temperature (Geider, 1987). The high absolute phosphatase and relative APA : seston may also indicate a P depletion by other planktonic organisms, like bacteria. Interestingly, free APA increased its proportion of absolute APA during summer months. These results indicate that plankton was trying to mobilize P-reserves from the total dissolved P pool. However, monitoring of total dissolved P was only started in 2016. The monthly averages ranged from 0.4 to 1.3 μmol l–1 total dissolved P from 2016 to 2018 (both stations, data Biological Station Zingst, unpublished). Free APA (up to 0.9 μmol l–1 h–1) would have turned-over the complete DOP pool in an hour, if this total dissolved P range was assumed to be valid for 2014.
Furthermore, the increase of free APA coincided with a decrease of DIP below detection limits (see Supplementary Figure 1). DIP concentrations dropped below 0.1 μmol l–1 during the summer. Grillo and Gibson (1979) described a P-uptake threshold for Synechococcales of 0.1 μmol DIP l–1, below which P uptake becomes too energy-demanding. Furthermore, Nausch (1998) described for the Pomeranian Bay (southern Baltic Sea) an environmental threshold of 0.2 μmol DIP l–1 resulting in a strong up-regulation of APA. The results of this study found a similar threshold around 0.15 μmol DIP l–1 for induction of APA. It is possible that plankton sustained itself by releasing and taking up DIP so fast, that virtually no free DIP could be detected (Supplementary Figure 1). Furthermore, this fast turn-over could explain the simultaneous drop in measured DIP uptake rates during summer (Figure 5). Phytoplankton can regulate cellular P uptake systems, based on antecedent DIP pulses rather than previously stored P (Aubriot et al., 2011). These results combined with our findings indicate that plankton showed a slower response to applied DIP pulses during summer, because DIP was already supplied through high APA-release rates, even though DIP was below detection.
There are studies with comparably fast absolute uptake rates (e.g., Ritchie et al., 2001; Aubriot et al., 2011). Those studies were all done in lakes or with phytoplankton cultures of comparable Chl a concentrations as presented in this study. However, relative uptake rates in other systems, like fjords or riverine estuaries (both 0.3–5 nmol DIP l–1 Chl a –1 h–1 Taft et al., 1975; Thingstad et al., 1993) were at least three times lower compared to this study (15–150 nmol DIP l–1 Chl a –1 h–1). High potential uptake rates do not necessarily indicate a P demand for growth but may also be triggered by storage strategies of certain species. Cyanobacteria are well-known to consume P and store it as polyphosphate (e.g., Ritchie et al., 2001), which may be interpreted as luxury consumption. This behavior can be an adaptation to generally low nutrient levels (Droop, 1974; Hagemann et al., 2019). Sommer (1991) described the possibility of DIP luxury consumption even at N-limiting nutrient levels in a eutrophic lake. This result would explain high uptake rates found in this study even at possibly co-limiting N conditions during summer.
These results are consistent with this community dominated by small cyanobacteria. Finkel et al. (2010) found that cyanobacterial species, e.g., Synechococcales, can have elemental ratios of up to 33 N:P (mol : mol) without being affected by P-limitation. These findings might explain the cyanobacterial dominance of this habitat with high N:P ratios. Furthermore, DIN was at very low concentrations during summer (<1 μmol l–1), which suggest a possible co-limitation for N at least during summer. Such a co-limitation however would be surprising, because the dominating clade Cyanobium (Albrecht et al., 2017) lacks N-fixating genes (Scanlan et al., 2009). Thus, phytoplankton dominated by these Cyanobium cells cannot cover their N-demand by N-fixation, at least not autogenously. It is possible, though, that co-occurring N-fixing clades supplied some available N. Chl a only increased after DIP fertilization in batch tanks from both stations when either DIN was present, or N-fixing species were abundant (Figures 3, 6). A co-limitation for N for most of the year therefore seems reasonable.
There are several internal and external nutrient sources, which may explain how phytoplankton sustained its biomass across the eutrophication gradient at simultaneously low dissolved nutrient concentrations. There were DIP pulses observed in the adjacent wetland (Karstens et al., 2015), and described to support phytoplankton growth proximate to the wetland but not apart from it (Berthold et al., 2018b). More recently, the impact of dry and wet deposition was described to be of similar magnitude (up to 15 t TP per year) as riverine inflow (up to 24 t per year) (Berthold et al., 2019). The highest depositional rates were observed during summer months and may fertilize the euphotic zone. Furthermore, actual P release by diffusion from sediment was not determinable in the shallow areas (∼0.5 m) and was variable (13–44 μmol DIP m–2 d–1) in the deeper, aphotic zones (Bitschofsky, 2016). Ammonium release from the sediment showed the opposite, with diffusive fluxes up to 2 mmol NH4 m–2 d–1 in the shallow areas, and 0.25 mmol NH4 m–2 d–1 in deeper areas, indicating a permanent fertilization in shallow areas. It seems reasonable, that simultaneous input of N and P through the adjacent wetland, sediment and deposition supply phytoplankton with enough nutrients to sustain its biomass. Such pulses seem to be transient and may, therefore, be underestimated in their occurrence and importance in shallow lagoons.
Growth Stimulation by DIP Fertilization
The question arises why there was no apparent growth after P fertilization in water from the Zingster Strom station distant from riverine nutrient inputs. There is a possible co-limitation for N, as stated above and indicated by the DIN values during summer. However, it is also possible that physiological adaptations of the cyanobacterial assemblage led to undetected growth.
Görl et al. (1998) found that Synechococcus PCC 7942 lowered its Chl a content by 60% after 1 week of N-depleted incubation. It would explain the lower Chl a concentrations of fertilized and unfertilized samples after 7 days of incubation, which showed the same development like in the Zingster Strom. On the other hand, a high organic supply (>100 μmol l–1 glucose as organic carbon source) may increase Chl a per biomass or cell (Lewitus and Kana, 1995). This effect would bias Chl-normalized phosphatase and DIP uptake values. Interestingly, Chl a only increased when either DIN or N-fixing cyanobacteria were present, but seston increased at both stations in almost every experiment. This result is superficially contradictory to previous results of this study, because it makes it appear the particulate matter did increase without phytoplankton biomass as tracked by the Chl a proxy. The seston increase was observed for fertilized and unfertilized samples at both stations. Synechococcus can still grow under N- and P-depleted situations, but the Chl a content per cell decreased after cell division (Collier and Grossman, 1992). This effect combined with the chlorosis after 7 days, might explain the higher seston content, but lower Chl a concentration. Furthermore, Synechococcus seems to use P stored shortly before for RNA synthesis and possible growth within 6 h (Grillo and Gibson, 1979). Thus, the biomass proxy Chl a, might be misleading in growth approaches with cyanobacterial dominated communities. It is therefore likely that DIP pulses can increase biomass, in the form of particulate matter even during a co-limitation for N, without an increase in Chl a. The higher seston content, would in turn, increase light attenuation. Higher light attenuation would in turn favor low-light adapted small species, in particular cyanobacteria (Kirk, 1986). Similar findings were described for cyanobacteria in shallow lakes which dis-proportionally lowered light per mole P compared to other phytoplankton functional categories (Scheffer et al., 1997). The light availability for other phytoplankton species and submerged macrophytes will be further lowered even at low DIP pulses. This effect can have a high impact on the ecology of eutrophic or post-eutrophic coastal water bodies.
Örnólfsdóttir et al. (2004) stated that nano- and picoplankton in turbid estuaries grow faster under pulsed nutrient supply. Pulse-wise nutrients can support dominating species, which have high nutrient affinity and adaptations to accumulate cells even at low nutrient concentrations. Even low ambient nutrient concentrations in the water will be buffered by phytoplankton through physiological adaptations including high APA (see above). This result is contrary to the paradigm that large cells dominate in coastal water bodies, as they use pulsed nutrients more efficiently through larger storage capacities (Cloern, 2018). However, this study observed that small species out-competed larger phytoplankton species at low nutrient supply and with nutrient pulses. The only time diatoms out-competed cyanobacteria in this study was in diluted samples, when light and nutrients were not limiting within the growth incubator during January to March. The highest DIN concentrations (average up to 60 μmol l–1) were found during winter and spring time in these coastal waters (Berthold et al., 2018a). Large diatoms could then out-compete small cyanobacteria because light and nutrient limitations were both eliminated (Litchman et al., 2010) inside the growth incubator. Later in the year, small phytoplankton would out-compete larger cells for nutrients (Moutin et al., 2002), but the small phytoplankton itself is limited as well. Phytoplankton can grow faster with DIP addition in the Ribnitzer See, even though DIN is also low during summer (Selig et al., 2006). This growth may rely on fast N uptake analogous to fast P uptake, higher direct inputs from the main freshwater inflow, and N-fixing species. An oversupply of P may have enabled the occurrence of N-fixing cyanobacteria, even though it was not apparent from the observed nutrient ratios. In general, the results of this study suggest that nutrient inputs close to the river are still enough to support biomass increase almost the whole year. Growth increases in response to DIP pulses may not occur for stations farther away from riverine inflow, as seen at the station Zingster Strom. These results indicate that even a high DIP pulse inside the system as for example induced by suboxia of the sediment, or inputs from the adjacent wetland, may not increase Chl a, but rather seston. Nutrient input controls may have to be even stronger to effectively lower phytoplankton biomass in the face of such community resilience mechanisms through a hysteresis effect described by, e.g., Duarte et al. (2009).
Conclusion
Phytoplankton in the DZLS, especially the dominating picocyanobacteria, appear well-adapted to low DIP inputs (Figure 8). The results of this study indicated that phytoplankton is sufficiently supplied with DIP during winter at both stations, and for the whole year at the Ribnitzer See. Even though DIP levels were constantly low, phytoplankton sustained its biomass by physiological acclimation through APA and uptake rates, and ecological selection of favorable traits including small cell size. Chemical parameters and ratios, like DIP and TN:TP, may not fully explain the nutrient status of phytoplankton. The question arises of whether cyanobacteria dominate coastal water bodies because of a pulsed nutrient supply, or because nutrient pulses happen so rarely that only those species adapted to low ambient nutrient concentrations, survived. This study showed a clear temporal and spatial development. Future restoration measures should focus even more on a lowered input of P during summertime to further limit phytoplankton. Ultimately, P will be the limiting nutrient, as N can potentially be fixed by cyanobacteria. Countermeasures could include erosion control, balanced P fertilization in the adjacent land, or control of P accumulation in soils. However, point sources by riverine inflow are still currently too high to lower the phytoplankton biomass in the DZLS, a representative coastal water body. Further internal restoration measures will be useless for such highly productive, cyanobacteria-dominated lagoons unless thorough external restorations have been made to generate a sustained limitation on P inputs to the system.
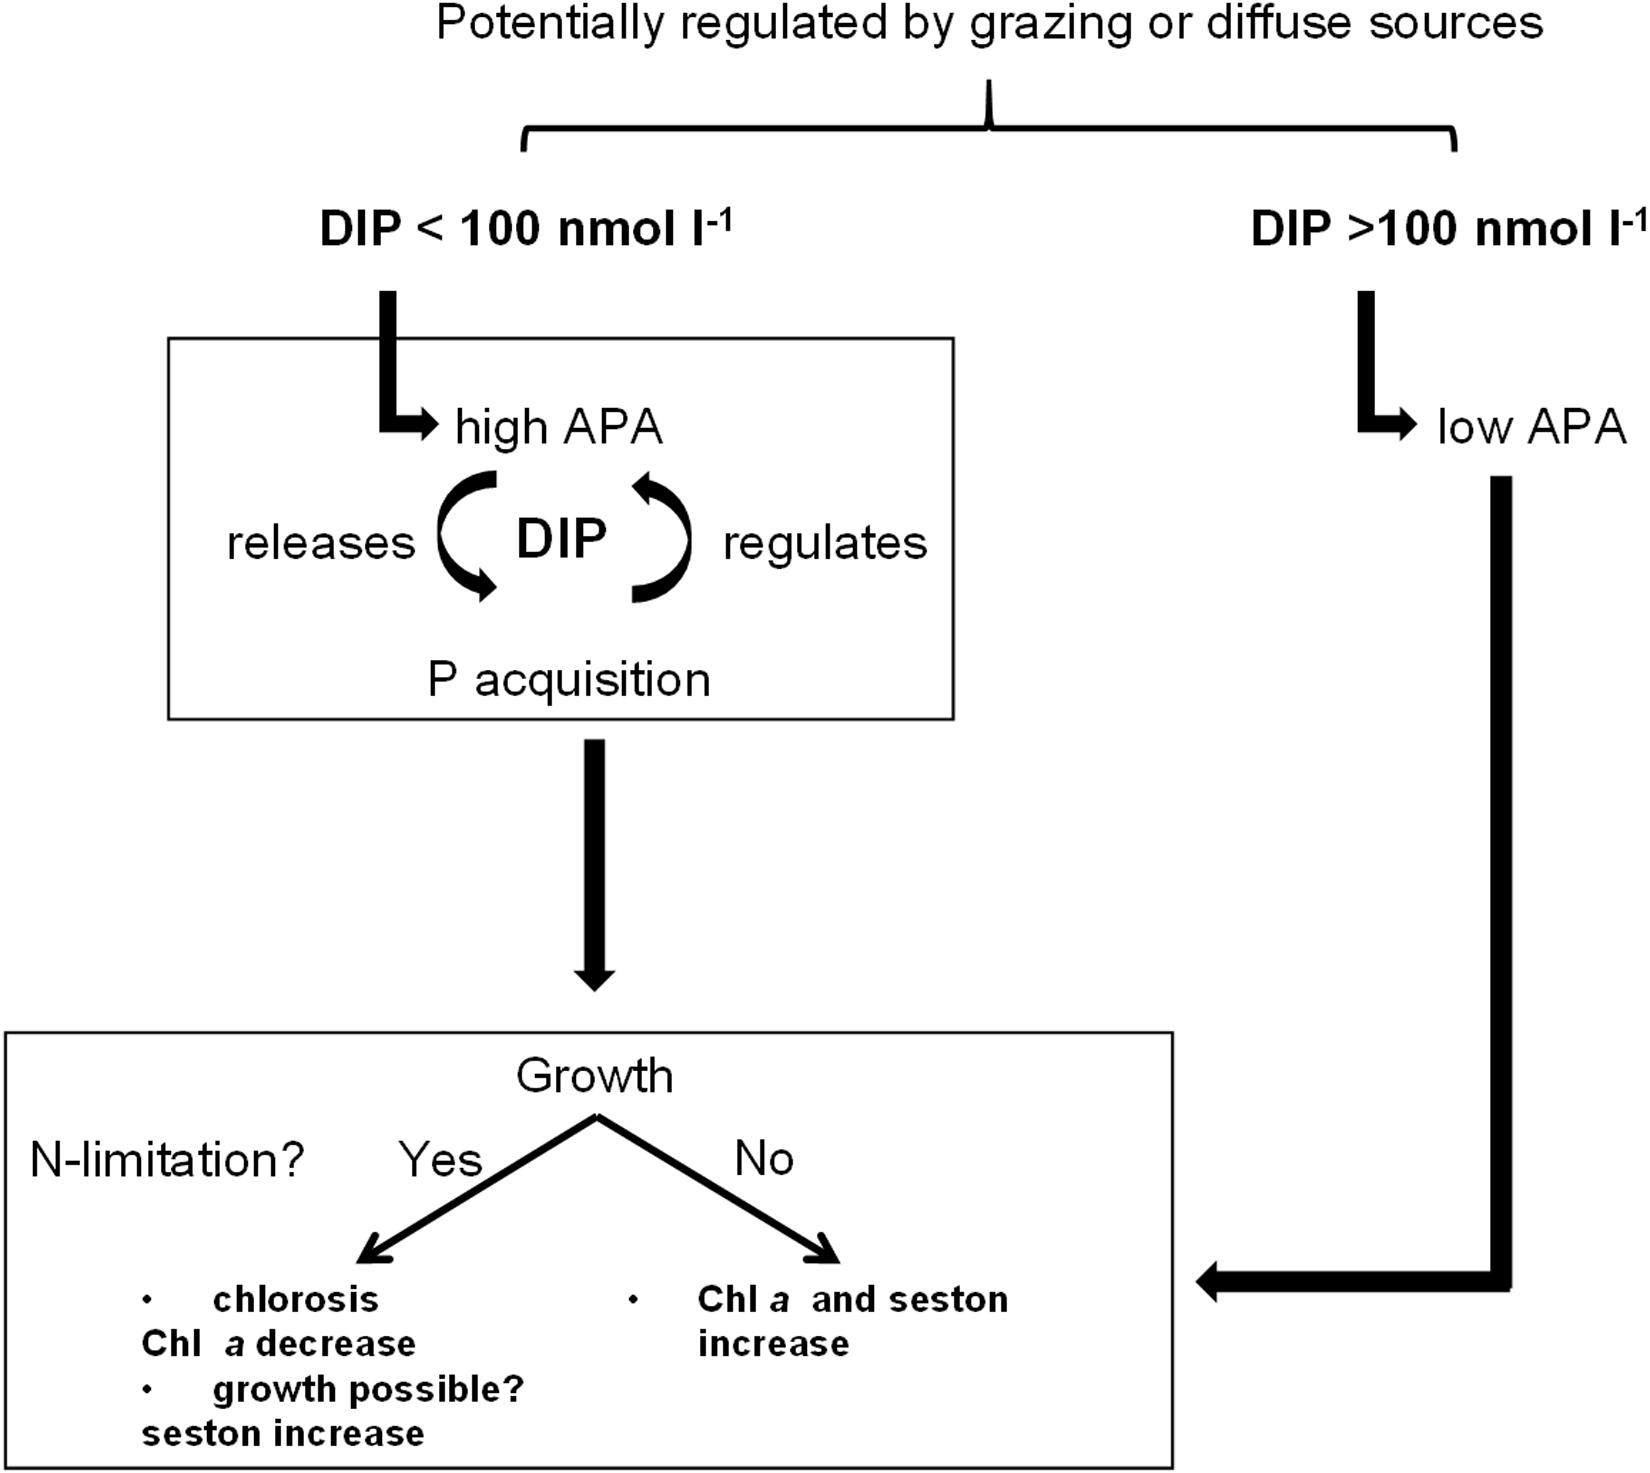
Figure 8. Graphical summary of phosphate (DIP) regulation and subsequently following physiological acclimatization of phytoplankton to different available DIP concentrations.
Data Availability Statement
The original data sets can be requested from the corresponding author.
Author Contributions
MB and RS planned the experiments and conducted further sample processing and data analyses. MB sampled and conducted the experiments. MB wrote the manuscript with extensive input from RS.
Funding
This project was funded by the Federal Ministry of Education and Research Germany (BMBF). It was part of the project BACOSA I (grant: 03F0665A).
Conflict of Interest
The authors declare that the research was conducted in the absence of any commercial or financial relationships that could be construed as a potential conflict of interest.
Acknowledgments
The authors thank the team of the Biological Station Zingst (Volker Reiff and Rita Wulff) for the long-term monitoring, the assistance during the field work and subsequent analyses. The authors thank Jutta Meyer for the conversion factor of seston to POM as well as Claudia Lott and Martin Albrecht for their help with the phosphatase measurements. The Biological Station Zingst is part of the L-TER network. MB thanks Douglas Campbell for his comments on the manuscript. This research was performed within the scope of the Leibniz Science Campus Phosphorus Rostock.
Supplementary Material
The Supplementary Material for this article can be found online at: https://www.frontiersin.org/articles/10.3389/fmars.2020.00281/full#supplementary-material
Abbreviations
APA, apparent alkaline phosphatase activity; Chl a, chlorophyll a;; DIN, dissolved inorganic nitrogen; DIP, dissolved inorganic phosphorus; DZLS, Darß-Zingst lagoon system; N, nitrogen; P, phosphorus; TN, total nitrogen; TP, total phosphorus.
References
Albrecht, M., Pröschold, T., and Schumann, R. (2017). Identification of cyanobacteria in a eutrophic coastal lagoon on the southern baltic coast. Front. Microbiol. 8:923. doi: 10.3389/fmicb.2017.00923
Asmala, E., Carstensen, J., Conley, D. J., Slomp, C. P., Stadmark, J., and Voss, M. (2017). Efficiency of the coastal filter: nitrogen and phosphorus removal in the Baltic Sea. Limnol. Oceanogr. 62, 222–238. doi: 10.1002/lno.10644
Aubriot, L., Bonilla, S., and Falkner, G. (2011). Adaptive phosphate uptake behaviour of phytoplankton to environmental phosphate fluctuations. FEMS Microbiol. Ecol. 77, 1–16. doi: 10.1111/j.1574-6941.2011.01078.x
Azam, F., Fenchel, T., Field, J. G., Gray, J. S., Meyer-Reil, L. A., and Thingstad, F. (1983). The ecological role of water-column microbes in the sea. Mar. Ecol. Prog. Ser. 10, 257–263. doi: 10.3354/meps010257
Bachor, A. (2005). Nährstoffeinträge in die Küstengewässer Mecklenburg-Vorpommerns–eine Belastungsanalyse. Rostocker: Meeresbiologische Beiträge, 17–32.
Berthold, M. (2016). The Influence of Phosphorus On the Eutrophication Process in the Darß-Zingst Bodden Chain. Rostock: Universität Rostock. doi: 10.18453/rosdok_id00002106
Berthold, M., Karsten, U., von Weber, M., Bachor, A., and Schumann, R. (2018a). Phytoplankton can bypass nutrient reductions in eutrophic coastal water bodies. Ambio 47(1), 146–158. doi: 10.1007/s13280-017-0980-0
Berthold, M., Karstens, S., Buczko, U., and Schumann, R. (2018b). Potential export of soluble reactive phosphorus from a coastal wetland in a cold-temperate lagoon system: buffer capacities of macrophytes and impact on phytoplankton. Sci. Total Environ. 616–617, 46–54. doi: 10.1016/j.scitotenv.2017.10.244
Berthold, M., Wulff, R., Reiff, V., Karsten, U., Nausch, G., and Schumann, R. (2019). Magnitude and influence of atmospheric phosphorus deposition on the southern Baltic Sea coast over 23 years: implications for coastal waters. Environ. Sci. Eur. 31:27. doi: 10.1186/s12302-019-0208-y
Berthold, M., Zimmer, D., and Schumann, R. (2015). A simplified method for total phosphorus digestion with potassium persulphate at sub-boiling temperatures in different environmental samples. Rostocker Meeresbiol. Beiträge 25, 7–25.
Bitschofsky, F. (2016). Phosphorus Dynamics in Sediments of Darß-Zingst Bodden Chain, a Eutrophic Estuary in the Southern Baltic Sea, University of Rostock. Available online at: http://rosdok.uni-rostock.de/resolve/id/rosdok_disshab_0000001782 (accessed September, 2017).
Celepli, N., Sundh, J., Ekman, M., Dupont, C. L., Yooseph, S., Bergman, B., et al. (2017). Meta-omic analyses of Baltic Sea cyanobacteria: diversity, community structure and salt acclimation. Environ. Microbiol. 19, 673–686. doi: 10.1111/1462-2920.13592
Cloern, J. E. (2018). Why large cells dominate estuarine phytoplankton. Limnol. Oceanogr. 63, S392-S409. doi: 10.1002/lno.10749
Collier, J. L., and Grossman, A. R. (1992). Chlorosis induced by nutrient deprivation in Synechococcus sp. strain PCC 7942: not all bleaching is the same. J. Bacteriol. 174, 4718–4726. doi: 10.1128/jb.174.14.4718-4726.1992
Correns, M. (1976). Charakteristische morphometrische daten der bodden- und Haffgewässer der DDR. Vermessungstechnik 24, 459–461.
de Jonge, V. N., Elliott, M., and Orive, E. (2002). Causes, historical development, effects and future challenges of a common environmental problem: eutrophication. Hydrobiologia 475, 1–19. doi: 10.1023/A:1020366418295
Doerffel, K. (1990). Statistik in der Analytischen Chemie. Leipzig: Deutscher Verlag für Grundstoffindustrie.
Droop, M. R. (1974). The nutrient status of algal cells in continuous culture. J. Mar. Biol. Assoc. UK 54, 825–855. doi: 10.1017/S002531540005760X
Duarte, C. M., Conley, D. J., Carstensen, J., and Sánchez-Camacho, M. (2009). Return to Neverland: Shifting baselines affect eutrophication restoration targets. Estuaries Coasts 32, 29–36. doi: 10.1007/s12237-008-9111-2
Finkel, Z. V., Beardall, J., Flynn, K. J., Quigg, A., Rees, T. A. V, and Raven, J. A. (2010). Phytoplankton in a changing world: cell size and elemental stoichiometry. J. Plankton Res. 32, 119–137. doi: 10.1093/plankt/fbp098
Gage, M. A., and Gorham, E. (1985). Alkaline phosphatase activity and cellular phosphorus as an index of the phosphorus status of phytoplankton in Minnesota lakes. Freshw. Biol. 15, 227–233. doi: 10.1111/j.1365-2427.1985.tb00195.x
Geider, R. J. (1987). Light and temperature dependence of the carbon to chlorophyll a ratio in micralgae and cyanobacteria: implications for physiology amd growth of phytoplankton. New Phytol. 106, 1–34. doi: 10.1111/j.1469-8137.1987.tb04788.x
Görl, M., Sauer, J., Baier, T., and Forchhammer, K. (1998). Nitrogen-starvation-induced chlorosis in Synechococcus PCC 7942: adaptation to long-term survival. Microbiology 144, 2449–2458. doi: 10.1099/00221287-144-9-2449
Grillo, J. F., and Gibson, J. (1979). Regulation of phosphate accumulation in the unicellular cyanobacterium Synechococcus. J. Bacteriol. 140, 508–517. doi: 10.1093/humupd/dmt057
Gunduz, B., Aydin, F., Aydin, I., and Hamamci, C. (2011). Study of phosphorus distribution in coastal surface sediment by sequential extraction procedure (NE Mediterranean Sea, Antalya-Turkey). Microchem. J. 98, 72–76.
Gunnars, A., Blomqvist, S., Johansson, P., and Andersson, C. (2002). Formation of Fe (III) oxyhydroxide colloids in freshwater and brackish seawater, with incorporation of phosphate and calcium. Geochim. Cosmochim. Acta 66, 745–758.
Gustafsson, B. G., Schenk, F., Blenckner, T., Eilola, K., Meier, H. E. M., Müller-Karulis, B., et al. (2012). Reconstructing the development of baltic sea eutrophication 1850-2006. Ambio 41, 534–548. doi: 10.1007/s13280-012-0318-x
Gustavs, L., Schumann, R., Eggert, A., and Karsten, U. (2009). In vivo growth fluorometry: accuracy and limits of microalgal growth rate measurements in ecophysiological investigations. Aquat. Microb. Ecol. 55, 95–104.
Hagemann, M., Möke, F., Springer, A., Westermann, L., Frank, M., Wasmund, N., et al. (2019). Cyanobacterium Nodularia spumigena strain CCY9414 accumulates polyphosphate under long-term P-limiting conditions. Aquat. Microb. Ecol. 82, 265–274.
Hansen, H. P., and Koroleff, F. (1999). “Determination of nutrients,” in Methods of Seawater analysis, eds K. Grasshoff, K. Kremling, and M. Ehrhardt (Weinheim: Wiley-VCH), 159–251.
Healey, F. P., and Hendzel, L. L. (1979). Fluorometric measurement of alkaline phosphatase activity in algae. Freshw. Biol. 9, 429–439. doi: 10.1111/j.1365-2427.1979.tb01527.x
Heerkloss, R., Burckhardt, R., and Hammer, A. (1999). Funktionelle untersuchungen an dominanten arten des zooplanktons. Bodden 8, 25–28.
HELCOM, (2015). “Annex C-4. Phytoplankton chlorophyll a,” in HELCOM Combine, 257–263. Helsinki: HELCOM.
HELCOM Indicators, (2017). Inputs of Nitrogen and Phosphorus to the Baltic Sea (2012 – 2014). Helsinki: HELCOM
Heyl, K. (2016). Role and Function of Hydrolytic Enzymes for Cycling of Organic Material within Microbial Mats. Ph. D. Thesis, University of Rostock, Rostock.
Hoppe, H. G. (2003). Phosphatase activity in the sea. Hydrobiologia 493, 187–200. doi: 10.1023/A:1025453918247
Huang, X.-L., and Zhang, J.-Z. (2009). Neutral persulfate digestion at sub-boiling temperature in an oven for total dissolved phosphorus determination in natural waters. Talanta 78, 1129–1135. doi: 10.1016/j.talanta.2009.01.029
Janssen, F., Neumann, T., and Schmidt, M. (2004). Inter-annual variability in cyanobacteria blooms in the Baltic Sea controlled by wintertime hydrographic conditions. Mar. Ecol. Prog. Ser. 275, 59–68.
Joint, I., Henriksen, P., Fonnes, G. A., Bourne, D., Thingstad, T. F., and Riemann, B. (2002). Competition for inorganic nutrients between phytoplankton and bacterioplankton in nutrient manipulated mesocosms. Aquat. Microb. Ecol. 29, 145–159.
Karsten, U., Klimant, I., and Holst, G. (1996). A new in vivo fluorimetric technique to measure growth of adhering phototrophic microorganisms. Appl. Environ. Microbiol. 62, 237–243.
Karstens, S., Buczko, U., and Glatzel, S. (2015). Phosphorus storage and mobilization in coastal Phragmites wetlands: influence of local-scale hydrodynamics. Estuar. Coast. Shelf Sci. 164, 124–133. doi: 10.1016/j.ecss.2015.07.014
Kirk, J. T. O. (1986). Light and Photosynthesis in Aquatic Ecosystems. 1st Edn, Cambridge: Cambridge University Press.
Lebo, M. E. (1990). Phosphate uptake along a coastal plain estuary. Limnol. Oceanogr. 35, 1279–1289. doi: 10.4319/lo.1990.35.6.1279
Lewitus, A. J., and Kana, T. M. (1995). Light respiration in six estuarine phytoplankton species: contrasts under photoautotrophic and mixotrophic growth conditions. J. Phycol. 31, 754–761. doi: 10.1111/j.0022-3646.1995.00754.x
Lípová, L., Krchňák, P., Komenda, J., and Ilík, P. (2010). Heat-induced disassembly and degradation of chlorophyll-containing protein complexes in vivo. Biochim. Biophys. Acta 1797, 63–70. doi: 10.1016/j.bbabio.2009.08.001
Litchman, E., de Tezanos Pinto, P., Klausmeier, C. A., Thomas, M. K., and Yoshiyama, K. (2010). Linking traits to species diversity and community structure in phytoplankton. Hydrobiologia 653, 15–28. doi: 10.1007/s10750-010-0341-5
LUNG, (2013). Development and Status of Nutrient Loads in the Coastal Water Bodies of Mecklenburg-Vorpommern (in German). Güstrow: LUNG.
Malcolm-Lawes, D., and Wong, K. (1990). Determination of orthophosphate in water and soil using a flow analyzer. Analyst 15, 65–67.
Moncheva, S., Gotsis-Skretas, O., Pagou, K., and Krastev, A. (2001). Phytoplankton blooms in Black Sea and mediterranean coastal ecosystems subjected to anthropogenic eutrophication: similarities and differences. Estuar. Coast. Shelf Sci. 53, 281–295. doi: 10.1006/ecss.2001.0767
Moutin, T., Thingstad, T. F., Van Wambeke, F., Marie, D., Slawyk, G., Raimbault, P., et al. (2002). Does competition for nanomolar phosphate supply explain the predominance of the cyanobacterium Synechococcus? Limnol. Oceanogr. 47, 1562–1567. doi: 10.4319/lo.2002.47.5.1562
Nausch, M. (1998). Alkaline phosphatase activities and the relationship to inorganic phosphate in the Pomeranian Bight (southern Baltic Sea). Aquat. Microb. Ecol. 16, 87–94.
Olenina, I., Hajdu, S., Andersson, A., Edler, L., Wasmund, N., Busch, S., et al. (2006). Biovolumes and size-classes of phytoplankton in the Baltic Sea. Balt. Sea Environ. Proc. 106, 144.
Örnólfsdóttir, E. B., Lumsden, S. E., and Pinckney, J. L. (2004). Phytoplankton community growth-rate response to nutrient pulses in a shallow turbid estuary, Galveston Bay, Texas. J. Plankton Res. 26, 325–339. doi: 10.1093/plankt/fbh035
Perry, M. J. (1972). Alkaline phosphatase activity in subtropical Central North Pacific waters using a sensitive fluorometric method. Mar. Biol. 15, 113–119.
Reusch, T. B. H., Dierking, J., Andersson, H. C., Bonsdorff, E., Carstensen, J., Casini, M., et al. (2018). The Baltic Sea as a time machine for the future coastal ocean. Sci. Adv. 4:eaar8195. doi: 10.1126/sciadv.aar8195
Ritchie, R. J., Trautman, D. A., and Larkum, A. W. D. (2001). Phosphate limited cultures of the cyanobacterium Synechococcus are capable of very rapid, opportunistic uptake of phosphate. New Phytol. 152, 189–201. doi: 10.1046/j.0028-646X.2001.00264.x
Scanlan, D. J., Ostrowski, M., Mazard, S., Dufresne, A., Garczarek, L., Hess, W. R., et al. (2009). Ecological genomics of marine picocyanobacteria. Microbiol. Mol. Biol. Rev. 73, 249–299. doi: 10.1128/MMBR.00035-08
Scheffer, M., Rinaldi, S., and Mur, L. R. (1997). On the dominance of filamentous blue-green algae in shallow lakes. Ecology 78, 272–282. doi: 10.2175/106143013x13807328849332
Schiewer, U. (1998). 30 years’ eutrophication in shallow brackish waters – lessons to be learned. Hydrobiologia 363, 73–79. doi: 10.1023/A:1003194226294
Schiewer, U. (2007). “Darß-zingst boddens, northern rügener boddens and schlei,” in Ecology of Baltic Coastal Waters, eds U. Schiewer, M. M. Caldwell, G. Heldmaier, R. B. Jackson, O. L. Lange, H. A. Mooney, et al. (Berlin: Springer), 35–86.
Schoor, A., Selig, U., Geiß-Brunschweiger, U., Schaible, R., Schumann, R., Schubert, B., et al. (2008). Phytoplankton diversity and photosynthetic acclimation along a longitudinal transect through a shallow estuary in summer. Mar. Ecol. Prog. Ser. 364, 31–46.
Schubert, H., Sagert, S., and Forster, R. M. (2001). Evaluation of the different levels of variability in the underwater light field of a shallow estuary. Helgol. Mar. Res. 55, 12–22.
Schumann, R., Hammer, A., Görs, S., and Schubert, H. (2005). Winter and spring phytoplankton composition and production in a shallow eutrophic Baltic lagoon. Estuar. Coast. Shelf Sci. 62, 169–181.
Schumann, R., Rieling, T., Görs, S., Hammer, A., Selig, U., and Schiewer, U. (2003). Viability of bacteria from different aquatic habitats. I. Environmental conditions and productivity. Aquat. Microb. Ecol. 32, 121–135. doi: 10.3354/ame032121
Selig, U., Baudler, H., Krech, M., and Nausch, G. (2006). Nutrient accumulation and nutrient retention in coastal waters – 30 years investigation in the Darss-Zingst Bodden chain. Acta Hydrochim. Hydrobiol. 34, 9–19.
Smith, V. H., and Schindler, D. W. (2009). Eutrophication science: where do we go from here? Trends Ecol. Evol. 24, 201–207. doi: 10.1016/j.tree.2008.11.009
Sommer, U. (1991). A comparison of the Droop and the Monod models of nutrient limited growth applied to natural populations of phytoplankton. Funct. Ecol. 5, 535–544. doi: 10.2307/2389636
Strickland, J. D. H., and Parsons, T. R. (1972). A practical Handbook of Seawater Analysis. 2nd Edn, eds J. C. Stevenson, J. Watson, J. M. Reinhart, D. G. Cook, J. Camp, and M. I. Smith, Ottawa: Alger Press Ltd.
Taft, J. L., Taylor, W. R., and McCarthy, J. J. (1975). Uptake and release of phosphorous by phytoplankton into the Chesapeake Bay estuary, USA. Mar. Biol. 33, 21–32.
Thingstad, T. F., Skjoldal, E. F., and Bohne, R. A. (1993). Phosphorus cycling and algal-bacterial competition in Sandsfjord, western Norway. Mar. Ecol. Prog. Ser. 99, 239–259.
Umweltbundesamt, (2017). Gewässer in Deutschland: Zustand und Bewertung. eds C. Schulte, and K. Blondzik, Dessau-Roßlau: Umweltbundesamt.
Keywords: phosphatase, eutrophication, lagoon, phytoplankton, nutrient limitation, pulsed nutrient uptake
Citation: Berthold M and Schumann R (2020) Phosphorus Dynamics in a Eutrophic Lagoon: Uptake and Utilization of Nutrient Pulses by Phytoplankton. Front. Mar. Sci. 7:281. doi: 10.3389/fmars.2020.00281
Received: 29 November 2019; Accepted: 07 April 2020;
Published: 13 May 2020.
Edited by:
Michelle Jillian Devlin, Centre for Environment, Fisheries and Aquaculture Science (CEFAS), United KingdomReviewed by:
Monika Nausch, Leibniz Institute for Baltic Sea Research (LG), GermanyFrederico Pereira Brandini, University of São Paulo, Brazil
Copyright © 2020 Berthold and Schumann. This is an open-access article distributed under the terms of the Creative Commons Attribution License (CC BY). The use, distribution or reproduction in other forums is permitted, provided the original author(s) and the copyright owner(s) are credited and that the original publication in this journal is cited, in accordance with accepted academic practice. No use, distribution or reproduction is permitted which does not comply with these terms.
*Correspondence: Maximilian Berthold, bWF4aW1pbGlhbi5iZXJ0aG9sZEB1bmktcm9zdG9jay5kZQ==
†ORCID: Maximilian Berthold, orcid.org/0000-0003-1985-6426 Rhena Schumann, orcid.org/0000-0002-0605-3379