 Avery B. Paxton1,2*
 Kyle W. Shertzer3Nathan M. Bacheler3
 G. Todd Kellison3
 Kenneth L. Riley2
 J. Christopher Taylor2
- 1CSS-Inc., Fairfax, VA, United States
- 2National Centers for Coastal Ocean Science, National Ocean Service, National Oceanic and Atmospheric Administration, Beaufort, NC, United States
- 3Southeast Fisheries Science Center, National Marine Fisheries Service, National Oceanic and Atmospheric Administration, Beaufort, NC, United States
Approaches toward habitat conservation and restoration often include supplementing or enhancing existing, degraded, or lost natural habitats. In aquatic environments, a popular approach toward habitat enhancement is the introduction of underwater human-made structures or artificial reefs. Despite the nearly global prevalence of artificial reefs deployed to enhance habitat, it remains debated whether these structures function similarly to comparable natural reefs. To help resolve this question, we conducted a literature review and accompanying meta-analysis of fish community metrics on artificial reefs within the coastal ocean and made comparisons with naturally-occurring reference reefs (rocky reefs and coral reefs). Our findings from a synthesis of 39 relevant studies revealed that, across reef ecosystems, artificial reefs support comparable levels of fish density, biomass, species richness, and diversity to natural reefs. Additional analyses demonstrated that nuances in these patterns were associated with the geographic setting (ocean basin, latitude zone) and artificial reef material. These findings suggest that, while artificial reefs can mimic natural reefs in terms of the fish assemblages they support, artificial reefs are not one-size-fits-all tools for habitat enhancement. Instead, artificial reefs should be considered strategically based on location-specific scientific assessments and resource needs to maximize benefits of habitat enhancement.
Introduction
Coastal reef habitats face diverse and varied threats, including overharvesting, habitat destruction, pollution, and climate change (Millennium Ecosystem Assessment, 2005; Lotze et al., 2006). For example, extensive habitat degradation and loss has been documented on coral reefs (Burke et al., 2011; McClenachan et al., 2017). Foundation species (e.g., kelp) associated with rocky reefs have also declined (Filbee-Dexter and Wernberg, 2018). Even when reefs are not actively facing degradation, the value of ecosystem services that reefs provide (Hughes et al., 2017; Townsend and Lohrer, 2019) often prompt managers to enhance the existing reefs (Seaman, 2007; Becker et al., 2018). A popular approach toward reef habitat enhancement is the introduction of underwater human-made, artificial structures (Seaman, 2007). Human-made artificial structures, such as metal vessels and concrete modules, are frequently deployed as artificial reefs on the seafloor to create reef habitats (Becker et al., 2018), and decommissioned energy platforms are dismantled and converted to artificial reefs (Macreadie et al., 2011).
Artificial reefs are defined as “submerged structure[s] deliberately constructed or placed on the seabed to emulate some functions of a natural reef, such as protecting, regenerating, concentrating, and/or enhancing populations of living marine resources” (United Nations Environment Programme, 2009). Artificial reefs have a long history, with the first recorded use in Japan during the 1600s when rock and rubble from former buildings were deployed to aggregate fish and grow kelp (Stone et al., 1991). In the United States, the first documented use of artificial reefs occurred in the 1830s when small wooden structures (log huts) were deployed off South Carolina to facilitate fishing (McGurrin et al., 1989). More widespread reef construction in the open ocean began in the United States in 1935 but then lulled during World War II (McGurrin et al., 1989). During the 1950s artificial reefs surged in popularity, as fishermen deployed disposable objects, such as tires and concrete, to enhance their fishing opportunities, eventually leading to commonplace government-led artificial reef programs (McGurrin et al., 1989). In the modern era since the environmental movement in the 1960s and 1970s, artificial reefs have garnered increasing attention as a tool for habitat restoration and enhancement of fisheries resources.
Artificial reefs are widespread globally across temperate and tropical systems (Seaman, 2002; Ilieva et al., 2019). In the United States, for example, artificial reefs are established and maintained by state-run artificial reef programs with national guidance (National Oceanic Atmospheric Administration, 2007). Artificial reefs are also prevalent in Europe (Jensen, 2002; Fabi et al., 2011), Africa (Lechanteur and Griffiths, 2001; Seaman, 2002), South America (Honório et al., 2010; Hackradt et al., 2011), Asia (Nakamura, 1985; Chou, 1997), and Australia (Branden et al., 1994; Mills et al., 2017). The goals of artificial reef programs vary geographically, yet common goals across regions are to support fisheries management, increase fishing yield, provide fishing and diving opportunities, mitigate habitat loss, and to restore habitats, such as kelp forests and coral reefs, by providing substrate (Becker et al., 2018).
Despite the popularity of deploying artificial reefs to enhance habitat, it remains debated whether these reefs function similarly to comparable natural reefs (Carr and Hixon, 1997; Simon et al., 2013; Granneman and Steele, 2015). Artificial reefs are known to facilitate abundance of tropical fish at their range edges (Paxton et al., 2019), enhance nursery grounds (Mercader et al., 2017), and host elevated predator densities (Paxton et al., in revision), but also facilitate invasive species (Airoldi et al., 2015) and increase biotic homogenization (Dafforn et al., 2015). Evidence for whether artificial reefs support similar fish communities to natural reefs is mixed. In some systems, artificial reefs have been demonstrated to support equivalent amounts and types of fish as natural reefs (Stone et al., 1979; Lemoine et al., 2019). However, in other instances, artificial reefs have been documented to hold greater (Bohnsack et al., 1994; Arena et al., 2007; Paxton et al., 2017) or fewer (Carr and Hixon, 1997; Froehlich and Kline, 2015) fish and fish species. Given the differing evidence, knowledge gaps remain in whether fish community metrics are similar on artificial reefs relative to natural reference habitats. Resolving this question requires a global synthesis of artificial reefs, natural reefs, and their associated fish communities.
Here, we conducted a literature search and meta-analysis to test whether artificial reefs host similar fish community metrics to comparable natural reefs. We focused our synthesis on four fish community metrics—density, biomass, species richness, diversity—reported on marine artificial reefs and naturally-occurring habitats (rocky reefs and coral reefs) at depths shallower than 150 m. Specifically, we asked: (1) Do fish community metrics differ between artificial reefs and natural reefs and (2) What potential mechanisms (e.g., geographic setting and artificial reef material) explain differences in fish community metrics on artificial vs. natural reefs?
Methods
Literature Screening
We conducted a literature search of fish communities associated with artificial reefs vs. natural reefs in the coastal ocean using Web of Science and Google Scholar. In addition to artificial reefs, other structures, such as shipwrecks (Hoyt et al., 2014) and oil and gas infrastructure (Macreadie et al., 2011), also reside on the seafloor. In this study, we collectively refer to these structures (artificial reefs, shipwrecks, energy infrastructure) as artificial reefs. We conducted the Web of Science search on 5 November 2019 using the advanced search function with Boolean logic with the search query: TS = (artificial reef* OR artificial habitat* OR man-made reef* OR shipwreck* OR oil rig* OR oil platform*) AND TS = (fish*) AND TS=(rocky reef* OR coral reef* OR hardbottom* OR hard-bottom* OR hard bottom* OR livebottom OR live-bottom* OR live bottom* OR natural reef*) AND TS = (abundance* OR biomass* OR densit* OR richness* OR diversity*) (note that the * acts as a wildcard, so a string such as densit* would represent density or densities). This search for the dates 1900 to present yielded 524 potentially relevant articles. We imported the title and abstract of each article into Colandr (Cheng et al., 2018) and screened each article according to specified inclusion criteria (Table 1). Briefly, we included field-based studies that reported fish community metrics on artificial habitats and comparable reference reef habitats in the coastal ocean through direct observations, such as diver surveys, video surveys, and net tows at depths shallower than 150 m. This initial screening revealed that 103 of the 524 articles were candidates for inclusion; we then conducted a full-text screening of these 103 articles based on the inclusion criteria. Of these studies, 32 met our criteria and were retained for data extraction.
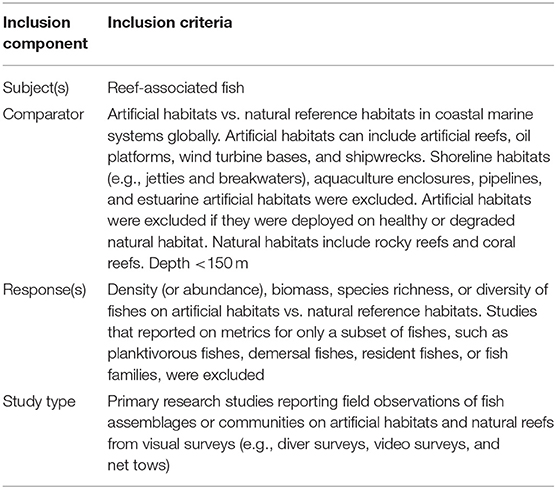
Table 1. Study inclusion components and criteria for literature review.
To ensure that additional relevant papers were not overlooked, we completed a complementary search with a more basic search query (fish assemblage OR fish community AND artificial reef AND natural reef) from 1900 to present in Google Scholar on 6 November 2019. Since this was a complementary and intentionally broader search, it returned 23,600 articles sorted by relevance. We screened the titles and abstracts of the first 200 articles sorted in order of relevance in Google Scholar, conducted a full text-screen on 24 potentially relevant articles, and found 7 that met our inclusion criteria. Thus, 39 papers (32 Web of Science, 7 Google Scholar) in total were targeted for data extraction. Both the Web of Science and Google Scholar searches were for peer-reviewed literature (Table S1).
Data Extraction
We built a relational database in Microsoft Access to facilitate data extraction. During data extraction, we recorded identifying information for each study: author, title, publication date, and journal information. We then extracted metadata related to geographic location [continent, country, state (if applicable), ocean basin, local water body, latitude, and longitude], survey approach (method, year), natural reef descriptions (natural reef type, depth, complexity, and description), artificial reef descriptions (artificial reef type, depth, complexity, description, material, date of deployment, and substrate deployed on), and any additional notes that might be important for understanding conditions of the study. If a range of depths were provided, we used the mean of the upper and lower range values as the depth. We categorized complexity as low (<2 m vertical relief), medium (2–4 m vertical relief), or high (>4 m vertical relief). If multiple sites were surveyed with differing complexities, we categorized complexity according to the highest relief reef. If complexity values were not provided, we used typical values (e.g., patch reef = low relief, concrete modules = low relief, shipwreck = high relief). We converted latitude to a factor called “latitude zone,” where 0–23.5° N/S is tropical, 23.5–35° N/S subtropical, 35–50° N/S temperate, and 50–70° N/S subarctic. There were no studies with latitudes >70° N/S. We coded artificial reefs composed of more than one material (e.g., concrete, metal, boulders, and tires) as “mixed.”
Next, we extracted data for each fish community metric (i.e., density, biomass, richness, and diversity) reported in a given study. For each fish community metric, we recorded the units, and if units were not explicitly provided, we determined them based on methodological information, such as the transect dimensions for diver surveys. We then recorded the mean value of the metric reported on artificial reefs and natural reefs, as well as the accompanying precision and noted the type of precision (none, standard error, standard deviation, 95% confidence intervals). We extracted the sample size per reef type and the location within the paper where data were extracted (e.g., table number, figure number, or paragraph location). For several papers, data on fish metrics were only available from figures, so we used the “digitize” package (Poisot, 2011) in R (R Core Team, 2019) to extract the relevant values.
While data extraction was straightforward for most publications, others required us to make decisions about which data were most relevant. In such cases, we made these decisions on the basis of comparability. As an example, in several studies, mean values were reported for one artificial reef and for multiple natural reefs but without information necessary to calculate a pooled group mean for natural reefs. In these cases, we extracted the metric value from a single natural reef that most closely matched the single artificial reef in location (e.g., geography, depth). If studies reported metrics for multiple artificial reef materials separately (e.g., metal vessel and concrete pipes), then these values were recorded as different entries (rows) in the database and associated with the same natural reef data. If a study included only a segment of the fish community (e.g., only resident species or excluded certain fish families), then it was omitted according to our inclusion criteria (Table 1) since it did not report on the entire community.
Effect Size Calculations
To calculate effect sizes (e.g., outcome representing relationship between fish community metrics for artificial vs. natural reefs), we required standard deviation (SD), sample sizes (n), and mean values (X) for each community metric and each study on both artificial and natural reefs. Computations or conversions were necessary to obtain the required values for some studies. When standard error (SE) was presented but not SD, we calculated SD as:
(Higgins et al., 2019). Similarly, when 95% confidence intervals (CI) were provided, we calculated the SD as:
where CIlower and CIupper represent the lower and upper bounds of the 95% confidence interval (Higgins et al., 2019). When multiple groups were presented for a reef type (e.g., three artificial reefs of the same material with metrics reported separately), we pooled the means and weighted by the sample size following:
where Xi is the value of the ith group, ni is the sample size of the ith group, and is the weighted mean (Borenstein et al., 2009; Higgins et al., 2019). We calculated pooled SD as:
where N is the number of groups and SDi is the SD of the ith group (Borenstein et al., 2009).
We calculated effect size as a standardized mean difference. Specifically, we used Hedges' g because it contains a correction factor that reduces bias. Using the sample means, standard deviation, and sample size for artificial (AR) and natural reef (NR) groups, we then calculated the Hedges' g effect size as:
(Borenstein et al., 2009), where J is a bias correction factor calculated as:
(Koricheva et al., 2013), and where s is the standard deviation pooled across reef type as:
(Borenstein et al., 2009). We calculated the variance of Hedges' g as:
(Borenstein et al., 2009). For one study, fish community metric means on artificial and natural reefs were unavailable, but ANOVA results examining the effect of artificial vs. natural reefs on metrics were available. We used the reported F value to calculate Hedges' g as:
and ensured that g was positive if the metric was higher on artificial than natural reefs and negative if the opposite (Koricheva et al., 2013). Similarly, for another study we used the reported t-value to calculate Hedges' g as:
Imputation of Missing SD
For studies that did not report measures of precision (n = 10 density, n = 4 biomass, n = 17 richness, n = 5 diversity), we imputed SD by fitting a linear model between the known mean and SD, both log transformed, from the other studies (Marinho et al., 2003; Higgins et al., 2019). It is generally preferable to impute missing values than to exclude those studies with missing values from the meta-analysis (Batson and Burton, 2016; Weir et al., 2018). We then used the fitted model to impute the unknown SD values for the studies that reported means but not SD. For the one study that provided a t-value and the one study that provided an F-value that permitted calculation of Hedges' g but not the variance in Hedges' g, we used the mean variance in Hedges' g from the other studies for the same community metric and applied it (Batson and Burton, 2016). We later verified that our model outcomes were robust to imputation, as described below.
Meta-Analysis
We used the extracted data to explicitly test whether fish community metrics differ between artificial reefs and natural reefs using random effects models. We fit these meta-analytic models with the “metaphor” package (Viechtbauer, 2010), providing the Hedges' g effect size and variance in Hedges' g for each study. We used random effects meta-analysis models because of their assumption that there may be different effect sizes underlying different studies (Borenstein et al., 2009). For each fish community metric, we first fit a base model without moderators (i.e., independent predicator variables). We then fit a series of mixed models using categorical moderators: ocean basin (Atlantic, Pacific, Mediterranean), latitude zone (tropical, subtropical, temperate, subarctic), and artificial reef material (metal, concrete, boulders, mixed, tires). We chose not to include depth as a moderator since our inclusion criteria specified that all studies were shallower than 150 m. We also did not include reef complexity as a moderator because reef complexity closely relates to reef material. For example, metal ships are usually high complexity, whereas concrete structures are usually low complexity. We fit models for each combination of one, two, or three moderators (ocean basin, latitude zone, artificial material), resulting in eight total models per fish community metric.
We selected the final model from each of the eight candidate models per fish community metric using Akaike Information Criteria (Burnham and Anderson, 2004), with the lowest AIC value indicating the best performing model. We also examined the heterogeneity metrics associated with each model to verify our model selection (Borenstein et al., 2009). These included several metrics: T2 (tau2), the estimated total amount of heterogeneity (or residual heterogeneity if moderator included in model); I2, the percent of total variability due to heterogeneity; H2, the total variability divided by the within-study variance, and R2, the proportion of true variance explained by the moderators relative to the base model without moderators. Model selection aimed to pick low T2, I2, H2, values and high R2 values (Borenstein et al., 2009). We additionally examined effect sizes for the models. When models contained moderators, we obtained the effect sizes of each moderator level by subtracting the model intercept. To then test for effects of moderators, we conducted omnibus tests of moderator significance (yielding QMp values, which provide a p-value for the moderator associated with the residual heterogeneity test). We also conducted likelihood ratio tests (LRTs) between the full and reduced versions of the model to examine the effect of each moderator. We visualized model results by plotting mean effect sizes and associated 95% confidence intervals, as well as by creating forest plots to visualize the effect sizes and confidence intervals of individual studies.
To verify that our final model results for each of the four fish community metrics were not dependent upon the imputation of the missing SD values, we bootstrapped the imputation procedure 1,000 times. In each bootstrap iteration, we generated a new log-log linear model, with model coefficients drawn from a 95% truncated multivariate normal distribution using the “tmvtnorm” package (Wilhelm and Manjunath, 2015). We tested how many times the significance of the moderators in each of the final models changed relative to the original fits. We also tested how many times the Hedges' g value was positive vs. negative for the base models without predictors to provide a supplementary test of the robustness of our overall results. To examine potential effects of publication bias in the final models, we created funnel plots, which help visually diagnose publication bias, and quantitatively tested for funnel plot asymmetry using regression tests (Viechtbauer, 2010). Specifically, we tested whether the observed outcomes for models without moderators or the residuals for models with moderators were related to their standard error values.
Results
Our meta-analysis of 39 studies (Figure 1; Table S1) revealed that metrics describing fish communities are equivalent on artificial and natural reefs (Figure 2). The studies included in the meta-analysis span all continents except Antarctica and include artificial reefs in three ocean basins (Atlantic, Pacific, and Mediterranean). The artificial reefs were composed of metal, concrete, boulders, mixed materials (>1 material), and tires. Across the studies, density metrics were reported on 30 occasions, biomass 15, richness 34, and diversity 10. This general pattern of similar communities on artificial and natural reefs was robust to imputation for all community metrics, as the effect size and associated confidence intervals always overlapped zero during the bootstrap procedure.
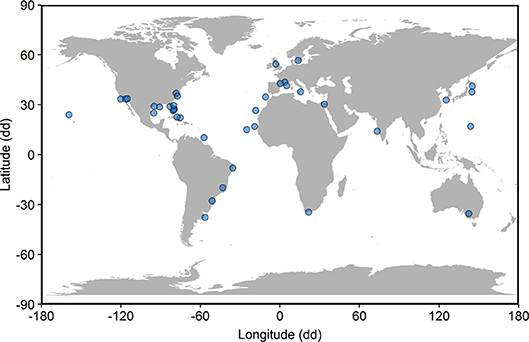
Figure 1. Locations of 39 studies included in global synthesis of fish community metrics on artificial reefs relative to nearby natural reefs. Locations, in decimal degrees (dd), have been offset to avoid visual overlap of points.
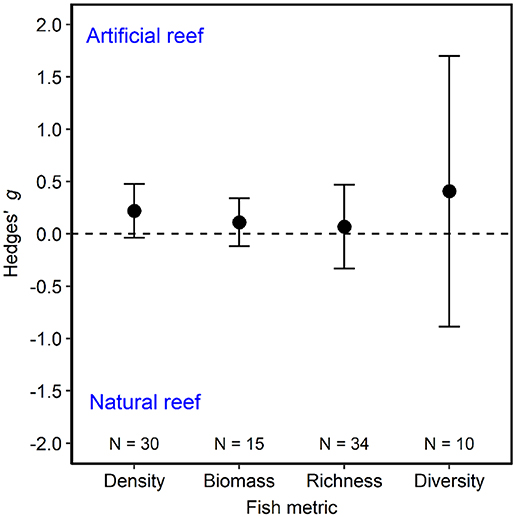
Figure 2. Fish community metrics on artificial vs. natural reefs. Shown are mean Hedges' g effect size estimated with random-effects models without moderators for fish density, biomass, species richness, and diversity. Positive g indicates the fish community metric is higher on artificial than natural reefs, and a negative g means the opposite. Error bars represent 95% confidence intervals. If error bars overlap with zero, then the fish community metric is not significantly different on artificial vs. natural reefs. N represents the number of studies.
Below, we detail our findings and detected nuances for each of the fish community metrics. When reporting the Hedges' g effect size, positive values indicate that a fish community metric is higher on artificial reefs than natural reefs. In contrast, a negative Hedges' g effect size represents a community metric that is higher on natural than artificial reefs. If 95% confidence intervals overlap with zero, then the difference between artificial and natural reefs is considered to not be statistically significant.
Density
Artificial reefs hosted similar fish densities to natural reefs (Figure 2). When we examined how fish density by reef type differed as a function of moderator variables, we discovered nuances to this pattern (Figures 3, 4). Although ocean basin was not significantly related to fish density, artificial reefs in the Atlantic Ocean but not the Pacific Ocean or the Mediterranean Sea tended to host higher density than natural reefs (Figure 3A; LRT χ2 = 4.13, p = 0.13). Fish density on artificial and natural reefs was associated with the latitude zone that the reefs were located in Figure 3B (LRT χ2 = 10.76, p = 0.01). Artificial reefs in subarctic (50–70° N/S) zones supported higher fish density than natural reefs, whereas artificial reefs in tropical regions tended to support lower density, although this latter pattern was not statistically significant (Figures 3B, 4). Additionally, reefs composed of concrete tended to have higher density than natural reefs (Figure 3C), but material was not significant overall (LRT χ2 = 6.34, p = 0.18). These patterns were represented in the final model selection that included latitude zone as a moderator (QMp < 0.001), which explained 45.97% more variance than the base model without the moderator (Table S2). These results were not influenced by the imputation of standard deviation, as all 1,000 bootstraps of the final model imputation yielded p-values for the moderator that remained significant. Additionally, the regression test for publication bias indicated no asymmetry in the funnel plot, suggesting there was not significant publication bias (Figure S4A; p =0.79).
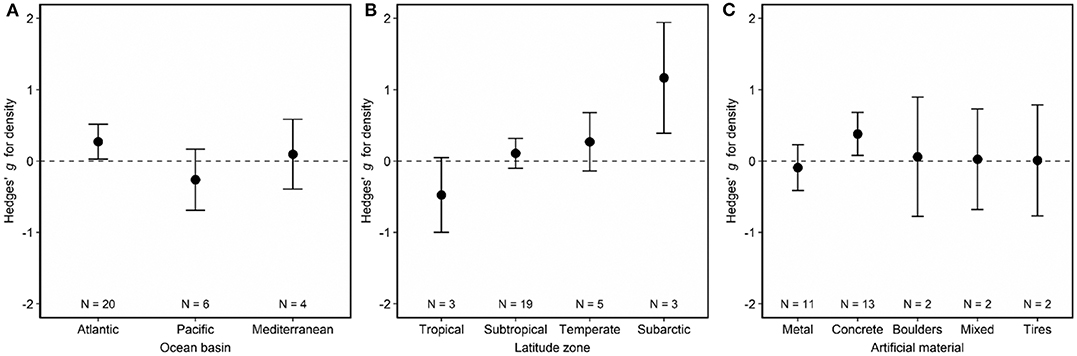
Figure 3. Effects of (A) ocean basin, (B) latitude zone, and (C) artificial material on fish density associated with artificial and natural reefs. Shown are mean Hedges' g effect size estimated with mixed-effects models including either (A) ocean basin, (B) latitude zone, or (C) artificial material as a moderator. Positive g indicates density is higher on artificial than natural reefs, and a negative g means the opposite. Error bars represent 95% confidence intervals. If error bars overlap with zero, then density is not significantly different on artificial vs. natural reefs. N represents the number of studies.
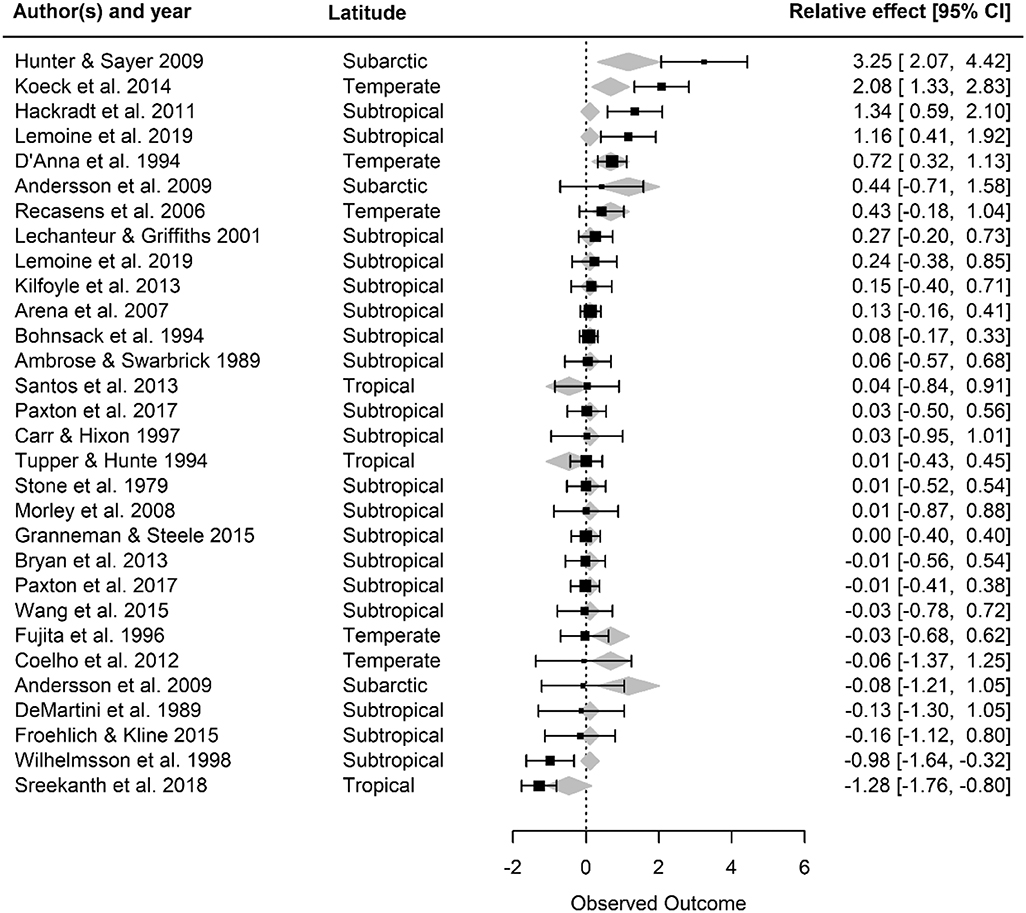
Figure 4. Forest plot of observed outcome (Hedges' g effect size) for the final fish density model with latitude included as a moderator. For each study, the effect size and its 95% confidence intervals are provided, along with the latitude zone. Gray diamonds represent the mean effect size of latitude zones; the width of the diamonds corresponds to the confidence interval limits for the fitted value. Positive effect sizes (Hedges' g) indicate that fish density is higher on artificial than natural reefs, and a negative value means the opposite. If the 95% confidence intervals overlap with zero, then density is not significantly different on artificial vs. natural reefs.
Biomass
Fish biomass did not differ on artificial and natural reefs (Figure 2, Figure S1). Biomass remained similar on artificial and natural reefs regardless of the ocean basin (Figure 5A; LRT χ2 = 0.33, p = 0.85) and latitude zone (Figure 5B; LRT χ2 = 2.36, p = 0.31). However, biomass was higher on artificial materials of mixed composition relative to natural reefs (Figure 5C, Table S3; LRT χ2 = 15.30, p = 0.004). The final model including artificial reef material as the moderator (QMp < 0.0001) explained 100% more variance than the base model without the moderator (Table S3). The funnel plot (Figure S4B) and bootstrapping procedure both verified that these results were robust to imputation, and the regression test suggested no asymmetry (publication bias) in the funnel plot (Figure S4B; p = 0.91).
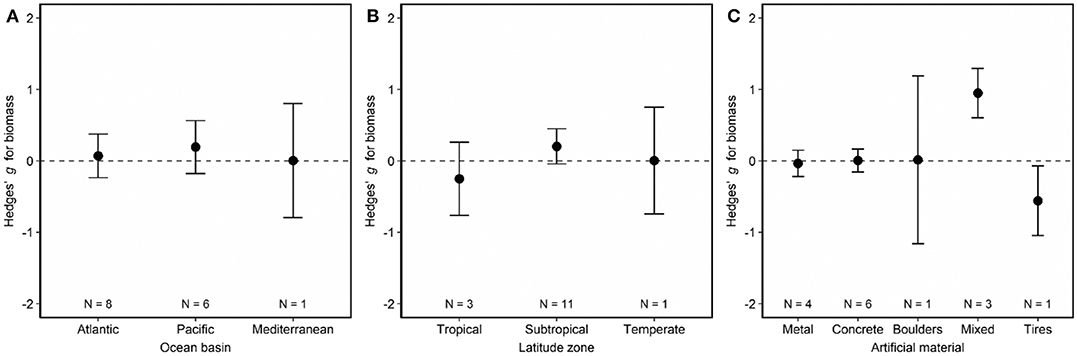
Figure 5. Effects of (A) ocean basin, (B) latitude zone, and (C) artificial material on fish biomass associated with artificial and natural reefs. Shown are mean Hedges' g effect size estimated with mixed-effects models including either (A) ocean basin, (B) latitude zone, or (C) artificial material as a moderator. Positive g indicates biomass is higher on artificial than natural reefs, and a negative g means the opposite. Error bars represent 95% confidence intervals. If error bars overlap with zero, then biomass is not significantly different on artificial vs. natural reefs. N represents the number of studies.
Richness
Species richness was similar on artificial vs. natural reefs (Figure 2, Figure S2). Neither ocean basin (Figure 6A; LRT χ2 = 2.86, p = 0.24), latitude zone (Figure 6B; LRT χ2 = 4.53, p = 0.10), artificial material (Figure 6C; LRT χ2 = 0.41, p = 0.98), nor imputation affected this outcome. Although not statistically significant, artificial reefs located in the Mediterranean tended to have lower species richness than natural reefs (Figure 6A), and artificial reefs located in subtropical latitudes tended to have higher species richness than natural reefs (Figure 6B). The final model, therefore, did not include moderators (Table S4). The regression test indicated asymmetry in the funnel plot (Figure S4C; p < 0.01), suggesting the possibility that studies with small or non-significant findings were not published and thus not included in this analysis. If so, such a publication bias could influence our results.
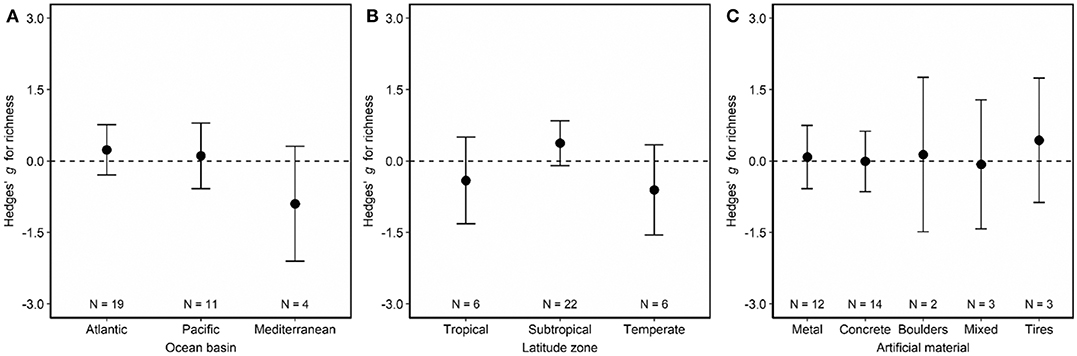
Figure 6. Effects of (A) ocean basin, (B) latitude zone, and (C) artificial material on fish species richness associated with artificial and natural reefs. Shown are mean Hedges' g effect size estimated with mixed-effects models including either (A) ocean basin, (B) latitude zone, or (C) artificial material as a moderator. Positive g indicates species richness community metric is higher on artificial than natural reefs, and a negative g means the opposite. Error bars represent 95% confidence intervals. If error bars overlap with zero, then species richness is not significantly different on artificial vs. natural reefs. N represents the number of studies.
Diversity
Artificial and natural reefs exhibited similar fish diversity (Figure 2, Figure S3). Nuances emerged with both ocean basin (Figure 7A; LRT χ2 = 6.61, p = 0.04) and latitude zone (Figure 7B; LRT χ2 = 12.46, p = 0.006) influencing diversity (QMp < 0.0001). In general, artificial reefs in the Mediterranean or in tropical or temperate locations seemed to have higher diversity than natural reefs, although the difference was not statistically significant. Artificial material did not influence the similarity in diversity on artificial and natural reefs (Figure 7C; LRT χ2 = 0.08, p = 0.78). The final model with both ocean and latitude included as moderators explained 78.25% more variance than the base model without these moderators (Table S5). The imputation procedures did not affect the model outcome, and funnel plot asymmetry was not significant, per the regression test (Figure S4D; p = 0.72).
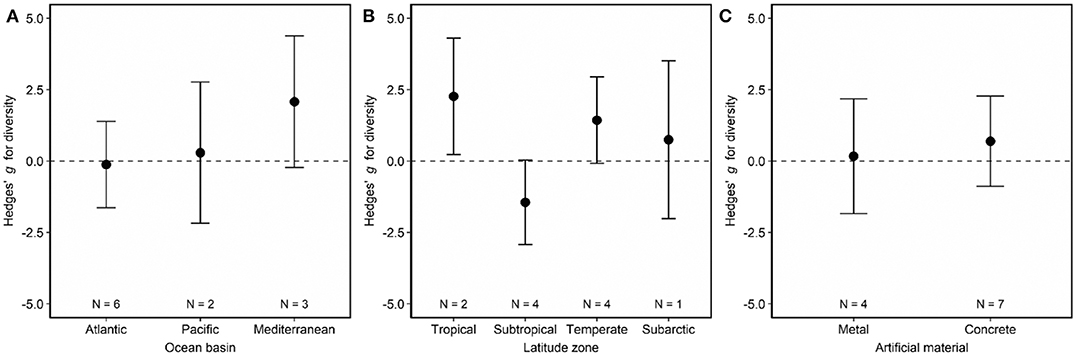
Figure 7. Effects of (A) ocean basin, (B) latitude zone, and (C) artificial material on fish diversity associated with artificial and natural reefs. Shown are mean Hedges' g effect size estimated with mixed-effects models including either (A) ocean basin, (B) latitude zone, or (C) artificial material as a moderator. Positive g indicates diversity is higher on artificial than natural reefs, and a negative g means the opposite. Error bars represent 95% confidence intervals. If error bars overlap with zero, then diversity is not significantly different on artificial vs. natural reefs. N represents the number of studies.
Discussion
Our findings from synthesis of 39 relevant global studies demonstrate that artificial reefs exhibit similar fish density, biomass, richness, and diversity to natural reefs. Further analyses revealed nuances in these patterns with geography and artificial material. For example, artificial reefs located in the Atlantic Ocean or composed of concrete hosted higher fish densities than natural reefs. These findings suggest that artificial reefs are effective tools for fish habitat enhancement because they can support fish communities similar to those found on natural reefs. Yet differences in fish communities with geography and reef material indicate artificial reefs are not one-size-fits-all tools for habitat enhancement, and deployment strategies should be location-specific to address specific objectives, such as those related to fisheries management or habitat enhancement. We explore the implications of our findings with regards to deployment of artificial reefs to enhance or restore habitats.
The evidence that artificial and natural reefs can host similar fish community metrics stems from our synthesis of peer-reviewed publications from North America, South America, Europe, Asia, Africa, and Australia in coastal oceans up to 150 m deep. Our meta-analysis models revealed that, even with variation in studies, artificial and natural reefs tend to host similar density and biomass of fish, as well as species richness and diversity, to neighboring rocky or coral reefs. This is reassuring since many artificial reef deployments aim to enhance or restore natural reef habitats (Becker et al., 2018). Our meta-analysis adds a quantitative synthesis to the body of literature on the efficacy of artificial reefs for fish habitat enhancement and in some cases, restoration of degraded habitats (Pickering et al., 1999; Seaman, 2007; Dupont, 2008).
Despite the overall evidence garnered in our synthesis that artificial and natural reefs perform similarly as fish habitat, artificial reefs in certain locations may perform better than others relative to natural reefs. We discovered these distinctions may be attributed to the ocean basin—Atlantic, Pacific, or Mediterranean, as well as the latitudinal zone—tropical, subtropical, temperate, or subarctic. These findings are logical since previous studies have found that deployment location of an artificial reef can affect the reef's performance (Baine, 2001). For example, local factors linked to reef function include the surrounding habitat characteristics, current, waves, water temperature, turbidity, and depth (Baine, 2001). Spacing of artificial reef structures relative to one another can also influence fish communities (Strelcheck et al., 2005). In particular, the pattern of lower fish density in tropical latitudes, where natural reefs are largely coral reefs, suggests that it may be hard for corals to recruit to and propagate on artificial reefs at rates similar to natural reefs. In contrast, subarctic latitude reefs, which are mainly rocky and often lack slow-growing, hard corals, hosted higher fish density, perhaps because artificial reefs at these higher latitudes may mimic natural reefs more quickly. Interestingly, artificial reefs in the Mediterranean exhibited lower species richness yet higher species diversity than natural reefs, which may reflect upon evenness of the fish communities. Our findings of broad-scale patterns in artificial reef function coupled with previous knowledge that fine-scale patterns affect reef function support the notion that artificial reefs should be evaluated on case-by-case bases according to location-specific parameters and needs (Dupont, 2008).
Fish community metrics on artificial vs. natural reefs are also associated with artificial reef material. In our synthesis, we found higher fish density on artificial reefs composed of concrete than natural reefs but that reefs of other materials hosted similar amounts of fish to natural reefs. Interestingly, when we examined fish biomass, we found higher biomass on mixed-material artificial than on natural reefs. We know that material can affect fish community metrics from prior studies examining the performance of different types of artificial materials relative to one another. For example, in the Atlantic Ocean, two studies have documented higher densities and biomasses of fish on large, high-relief metal structures as opposed to on smaller, low-relief concrete structures (Paxton et al., 2017; Lemoine et al., 2019). This directly contrasts with the meta-analysis findings that concrete hosts higher fish densities than metal, which we interpret as another indication of the necessity of location-specific decisions on artificial reef deployments.
Given the association of geographic setting and artificial material with changes in fish community metrics on artificial vs. natural reefs, we consider location-specific siting of artificial reefs to be both wise and necessary. For example, if an artificial reef mimics a natural reef in the Pacific Ocean, we cannot assume that it will in the Atlantic Ocean. Therefore, while our global meta-analysis indicates that artificial reefs can be effective at supplementing natural reefs, artificial reef deployment strategies should be guided on local contexts, rather than global or regional generalities. Additionally, even though artificial reefs tended to host similar fish communities as natural reefs, the amount of heterogeneity detected among studies and the strong influence (weight) of select studies further stress the importance of place-based artificial reef deployment strategies.
We caution that while artificial reefs exhibit similar fish community metrics to natural reefs in the 39 studies included in our synthesis, our conclusions are limited to four specific metrics—density, biomass, species richness, and diversity. Other metrics, such as fish community composition or metrics specific to functional groups, may behave differently. For example, studies report that the trophic structure differs between artificial and natural reefs for fishes (Simon et al., 2013), as well as for invertebrates (Page et al., 2007). Additionally, we do not know whether the food support that fish receive differs between artificial and natural reefs, nor whether there are species-specific patterns or differences related to reef size. The age of artificial reefs may also have an influence on community metrics, especially as water-column associated fish seem to occupy artificial reefs soon after deployment, followed by demersal species (Paxton et al., 2018). It is also plausible that the survey gear and design (scuba survey type, net type, etc.) may relate to fish detectability and thus influence patterns by reef type. Disentangling such questions may contribute to our understanding of how artificial reefs perform relative to natural reefs, which could provide insight into traits of artificial reefs that can best maximize fish habitat enhancement. Lastly, we acknowledge the debate on whether artificial reefs aggregate fish from nearby natural reefs or produce fish (Bohnsack, 1989; Layman et al., 2016; Smith et al., 2016). Whether aggregation or production occurs is likely system- or species-specific, and we do not attempt to address this debate with our meta-analysis. Instead, we simply document and synthesize snapshots of fish community metrics reported in global studies.
In conclusion, our synthesis revealed that artificial reefs, when evaluated on the bases of fish community density, biomass, richness, and diversity, perform similarly to natural reefs. This suggests that artificial reefs can be effective habitat enhancement tools for reef-associated fish communities. We caution that, given patterns in fish community metrics on artificial vs. natural reefs that emerged with geography and artificial material, location-specific siting, and evaluations of artificial reefs will be critical for maximizing the likelihood of reef success.
Data Availability Statement
The raw data supporting the conclusions of this article will be made available by the authors, without undue reservation, to any qualified researcher.
Author Contributions
AP conducted the literature search and screening, and wrote the manuscript. AP and KS extracted and analyzed the data. All authors assisted with data extraction, discussed and interpreted the results, edited the manuscript, and conceptualized this research.
Funding
We thank NOAA National Centers for Coastal Ocean Science and CSS-Inc. for support.
Conflict of Interest
AP was employed by company CSS-Inc.
The remaining authors declare that the research was conducted in the absence of any commercial or financial relationships that could be construed as a potential conflict of interest.
Acknowledgments
We thank E. Williams, B. Pickens, J. Christensen, G. Piniak, A. Hohn, and A. Chester for helpful reviews and feedback. The scientific results and conclusions, as well as any views or opinions expressed herein, are those of the author(s) and do not necessarily reflect the views of NOAA or the Department of Commerce.
Supplementary Material
The Supplementary Material for this article can be found online at: https://www.frontiersin.org/articles/10.3389/fmars.2020.00282/full#supplementary-material
References
Airoldi, L., Turon, X., Perkol-Finkel, S., and Rius, M. (2015). Corridors for aliens but not for natives: effects of marine urban sprawl at a regional scale. Divers. Distrib. 21, 755–768. doi: 10.1111/ddi.12301
Arena, P. T., Jordan, L. K. B., and Spieler, R. E. (2007). Fish assemblages on sunken vessels and natural reefs in southeast Florida, USA. Hydrobiologia 580, 157–171. doi: 10.1007/s10750-006-0456-x
Baine, M. (2001). Artificial reefs: a review of their design, application, management and performance. Ocean Coast. Manag. 44, 241–259. doi: 10.1016/S0964-5691(01)00048-5
Batson, S., and Burton, H. (2016). A systematic review of methods for handling missing variance data in meta-analyses of interventions in type 2 diabetes mellitus. PLoS ONE 11:e0164827. doi: 10.1371/journal.pone.0164827
Becker, A., Taylor, M. D., Folpp, H., and Lowry, M. B. (2018). Managing the development of artificial reef systems: the need for quantitative goals. Fish Fish. 19, 740–752. doi: 10.1111/faf.12288
Bohnsack, J. A. (1989). Are high densities of fishes at artificial reefs the result of habitat limitation or behavioral preference? Bull. Mar. Sci. 44, 631–645.
Bohnsack, J. A., Harper, D. E., Mcclellan, D. B., and Hulsbeck, M. (1994). Effects of reef size on colonization and assemblage structure of fishes at artificial reefs off southeastern Florida, U.S.A. Bull. Mar. Sci. 55, 796–823.
Borenstein, M., Hedges, L. V., Higgins, J. P. T., and Rothstein, H. R. (2009). Introduction to Meta-Analysis. West Sussex, UK: John Wiley & Sons, Ltd.
Branden, K. L., Pollard, D. A., and Reimers, H. A. (1994). A review of recent artificial reef developments in Australia. Bull. Mar. Sci. 55, 982–994.
Burke, L., Reytar, K., Spaulding, M., and Perry, A. (2011). Reefs at Risk Revisited. Washington DC: World Resources Institute.
Burnham, K. P., and Anderson, D. R. (2004). Multimodel inference: understanding AIC and BIC model selection. Soc. Methods Res. 33, 261–304. doi: 10.1177/0049124104268644
Carr, M. H., and Hixon, M. A. (1997). Artificial reefs: the importance of comparisons with natural reefs. Fish 22, 28–33. doi: 10.1577/1548-8446(1997)022<0028:ARTIOC>2.0.CO;2
Cheng, S. H., Augustin, C., Bethel, A., Gill, D., Anzaroot, S., Brun, J., et al. (2018). Using machine learning to advance synthesis and use of conservation and environmental evidence. Conserv. Biol. 32, 762–764. doi: 10.1111/cobi.13117
Chou, L. M. (1997). Artificial reefs of southeast Asia - do they enhance or degrade the marine environment? Environ. Monit. Assess. 44, 45–52. doi: 10.1023/A:1005759818050
Dafforn, K. A., Glasby, T. M., Airoldi, L., Rivero, N. K., Mayer-Pinto, M., and Johnston, E. L. (2015). Marine urbanization: an ecological framework for designing multifunctional artificial structures. Front. Ecol. Environ. 13, 82–90. doi: 10.1890/140050
Dupont, J. M. (2008). Artificial reefs as restoration tools: a case study on the West Florida shelf. Coast. Manag. 36, 495–507. doi: 10.1080/08920750802395558
Fabi, G., Spagnolo, A., Bellan-Santini, D., Charbonnel, E., Çiçek, B. A., Goutayer, J., et al. (2011). Overview of artificial reefs in Europe. Braz. J. Ocean. 59, 155–166. doi: 10.1590/S1679-87592011000500017
Filbee-Dexter, K., and Wernberg, T. (2018). Rise of turfs: a new battlefront for globally declining kelp forests. BioScience 68, 64–76. doi: 10.1093/biosci/bix147
Froehlich, C. Y. M., and Kline, R. J. (2015). Using fish population metrics to compare the effects of artificial reef density. PLoS ONE 10:e0139444. doi: 10.1371/journal.pone.0139444
Granneman, J. E., and Steele, M. A. (2015). Between artificial and natural reefs. ICES J. Mar. Sci. 72, 2385–2397. doi: 10.1093/icesjms/fsv094
Hackradt, C. W., Félix-Hackradt, F. C., and García-Charton, J. A. (2011). Influence of habitat structure on fish assemblage of an artificial reef in southern Brazil. Mar. Environ. Res. 72, 235–247. doi: 10.1016/j.marenvres.2011.09.006
Higgins, J., Thomas, J., Chandler, J., Cumpston, M., Li, T., Page, M., et al. (2019). Cochrane Handbook for Systematic Reviews of Interventions Version 6.0. Cochrane. doi: 10.1002/9781119536604
Honório, P. P. F., Ramos, R. T. C., and Feitoza, B. M. (2010). Composition and structure of reef fish communities in Paraíba State, north-eastern Brazil. J. Fish Biol. 77, 907–926. doi: 10.1111/j.1095-8649.2010.02728.x
Hoyt, J., Delgado, J. P., Barr, B., Terrell, B., and Grussing, V. (2014). “Graveyard of the Atlantic: an overview of North Carolina's maritime cultural landscape,” in Maritime Heritage Program Series: Number 4 (Silver Spring, MD: NOAA Office of National Marine Sanctuaries Heritage Program).
Hughes, T. P., Barnes, M. L., Bellwood, D. R., Cinner, J. E., Cumming, G. S., Jackson, J. B. C., et al. (2017). Coral reefs in the Anthropocene. Nature 546, 82–90. doi: 10.1038/nature22901
Ilieva, I., Jouvet, L., Seidelin, L., Best, B. D., Aldabet, S., Da Silva, R., et al. (2019). A global database of intentionally deployed wrecks to serve as artificial reefs. Data Brief 23:103584. doi: 10.1016/j.dib.2018.12.023
Jensen, A. (2002). Artificial reefs of Europe: perspective and future. ICES J. Mar. Sci. 59, S3–S13. doi: 10.1006/jmsc.2002.1298
Koricheva, J., Gurevitch, J., and Mengersen, K. (2013). Handbook of Meta-Analysis in Ecology and Evolution. Princeton, NJ: Princeton University Press.
Layman, C. A., Allgeier, J. E., and Montaña, C. G. (2016). Mechanistic evidence of enhanced production on artificial reefs: a case study in a Bahamian seagrass ecosystem. Ecol. Eng. 95, 574–579. doi: 10.1016/j.ecoleng.2016.06.109
Lechanteur, Y. A. R. G., and Griffiths, C. L. (2001). Fish associated with artificial reefs in False Bay, South Africa: a preliminary survey. Zoology 36, 87–93. doi: 10.1080/15627020.2001.11657118
Lemoine, H. R., Paxton, A. B., Anisfeld, S. C., Rosemond, R. C., and Peterson, C. H. (2019). Selecting the optimal artificial reefs to achieve fish habitat enhancement goals. Biol. Conserv. 238:108200. doi: 10.1016/j.biocon.2019.108200
Lotze, H. K., Lenihan, H. S., Bourque, B. J., Bradbury, R. H., Cooke, R. G., Kay, M. C., et al. (2006). Depletion, degradation, and recovery potential of estuaries and coastal seas. Science 312, 1806–1809. doi: 10.1126/science.1128035
Macreadie, P. I., Fowler, A. M., and Booth, D. J. (2011). Rigs-to-reefs: will the deep sea benefit from artificial habitat? Front. Ecol. Environ. 9, 455–461. doi: 10.1890/100112
Marinho, V. C., Higgins, J. P., Logan, S., and Sheiham, A. (2003). Topical fluoride (toothpastes, mouthrinses, gels or varnishes) for preventing dental cavities in children and adolescents. Cochrane Database Syst. Rev. 2003:CD002782. doi: 10.1002/14651858.CD002284
McClenachan, L., O'connor, G., Neal, B. P., Pandolfi, J. M., and Jackson, J. B. C. (2017). Ghost reefs: nautical charts document large spatial scale of coral reef loss over 240 years. Sci. Adv. 3:e1603155. doi: 10.1126/sciadv.1603155
McGurrin, J. M., Stone, R. B., and Sousa, R. J. (1989). Profiling United States artificial reef development. Bull. Mar. Sci. 44, 1004–1013.
Mercader, M., Mercière, A., Saragoni, G., Cheminée, A., Crec'hriou, R., Pastor, J., et al. (2017). Small artificial habitats to enhance the nursery function for juvenile fish in a large commercial port of the Mediterranean. Ecol. Eng. 105, 78–86. doi: 10.1016/j.ecoleng.2017.03.022
Millennium Ecosystem Assessment (2005). Ecosystems and Human Well-Being. Washington DC: Island Press.
Mills, K. A., Hamer, P. A., and Quinn, G. P. (2017). Artificial reefs create distinct fish assemblages. Mar. Ecol. Prog. Ser. 585, 155–173. doi: 10.3354/meps12390
Nakamura, M. (1985). Evolution of artificial fishing reef concepts in Japan. Bull. Mar. Sci. 37, 271–278.
National Oceanic and Atmospheric Administration (2007). National Artificial Reef Plan (as Amended): Guidelines for Siting, Construction, Development, and Assessment of Artificial Reefs. National Oceanic and Atmospheric Administration (NOAA).
Page, H. M., Dugan, J. E., Schroeder, D. M., Nishimoto, M. M., Love, M. S., and Hoesterey, J. C. (2007). Trophic links and condition of a temperate reef fish: comparisons among offshore oil platform and natural reef habitats. Mar. Ecol. Prog. Seri. 344, 245–256. doi: 10.3354/meps06929
Paxton, A. B., Peterson, C. H., Taylor, J. C., Adler, A. M., Pickering, E. A., and Silliman, B. R. (2019). Artificial reefs facilitate tropical fish at their range edge. Commun. Biol. 2:168. doi: 10.1038/s42003-019-0398-2
Paxton, A. B., Pickering, E. A., Adler, A. M., Taylor, J. C., and Peterson, C. H. (2017). Flat and complex temperate reefs provide similar support for fish: Evidence for a unimodal species-habitat relationship. PLoS ONE 12:e0183906. doi: 10.1371/journal.pone.0183906
Paxton, A. B., Revels, L. W., Rosemond, R. C., Van Hoeck, R. V., Lemoine, H. R., Taylor, J. C., et al. (2018). Convergence of fish community structure between a newly deployed and an established artificial reef along a five-month trajectory. Ecol. Eng. 123, 185–192. doi: 10.1016/j.ecoleng.2018.09.012
Pickering, H., Whitmarsh, D., and Jensen, A. (1999). Artificial reefs as a tool to aid rehabilitation of coastal ecosystems: investigating the potential. Mar. Pollut. Bull. 37, 505–514. doi: 10.1016/S0025-326X(98)00121-0
Poisot, T. (2011). The digitize package: extracting numerical data from scatterplots. R J. 3.1, 25–26. doi: 10.32614/R.J.-2011-004
R Core Team (2019). R: A Language and Environment for Statistical Computing, 3.5 Edn. Vienna: Foundation for Statistical Computing.
Seaman, W. (2002). Unifying trends and opportunities in global artificial reef research, including evaluation. ICES J. Mar. Sci. 59, S14–S16. doi: 10.1006/jmsc.2002.1277
Seaman, W. (2007). Artificial habitats and the restoration of degraded marine ecosystems and fisheries. Hydrobiologia 580, 143–155. doi: 10.1007/s10750-006-0457-9
Simon, T., Joyeux, J. C., and Pinheiro, H. T. (2013). Fish assemblages on shipwrecks and natural rocky reefs strongly differ in trophic structure. Mar. Environ. Res. 90, 55–65. doi: 10.1016/j.marenvres.2013.05.012
Smith, J. A., Lowry, M. B., Champion, C., and Suthers, I. M. (2016). A designed artificial reef is among the most productive marine fish habitats: new metrics to address 'production versus attraction'. Mar. Biol. 163:188. doi: 10.1007/s00227-016-2967-y
Stone, R. B., Mcgurrin, J. M., Sprague, L. M., and Seaman, W. J. (1991). “Artificial habitats of the world: synopsis and major trends,” in Artificial Habitats for Marine and Freshwater Fisheries, eds W. J. Seaman and L. M. Sprague (San Diego, CA: Academic Press), 31–60.
Stone, R. B., Pratt, H. L., Parker Jr, R. O., and Davis, G. E. (1979). A comparison of fish populations on an artificial and natural reef in the Florida Keys. Mar. Fish. Rev. 41, 1–11.
Strelcheck, A. J., Cowan, J.r., J. H., and Shah, A. (2005). Influence of reef location on artificial-reef fish assemblages in the northcentral Gulf of Mexico. Bull. Mar. Sci. 77, 425–440.
Townsend, M., and Lohrer, A. M. (2019). Empirical validation of an ecosystem service map developed from ecological principles and biophysical parameters. Front. Mar. Sci. 6:21. doi: 10.3389/fmars.2019.00021
United Nations Environment Programme (2009). London Convention and Protocol/UNEP Guidelines for the Placement of Artificial Reefs. London: United Nations Environment Programme (UNEP).
Viechtbauer, W. (2010). Conducting meta-analyses in R with the metafor package. J. Stat. Soft. 36, 1–48. doi: 10.18637/jss.v036.i03
Weir, C. J., Butcher, I., Assi, V., Lewis, S. C., Murray, G. D., Langhorne, P., and Brady, M. C. (2018). Dealing with missing standard deviation and mean values in meta-analysis of continuous outcomes: a systematic review. BMC Med Res Methodol 18:25. doi: 10.1186/s12874-018-0483-0
Wilhelm, S., and Manjunath, B. G. (2015). tmvtnorm: Truncated Multivariate Normal and Student t Distribution. R package version 1.4-10. Available online at: http://CRAN.R-project.org/package=tmvtnorm
Keywords: artificial reef, habitat enhancement, habitat creation, marine restoration, habitat supplementation, reef fish, fish community, meta-analysis
Citation: Paxton AB, Shertzer KW, Bacheler NM, Kellison GT, Riley KL and Taylor JC (2020) Meta-Analysis Reveals Artificial Reefs Can Be Effective Tools for Fish Community Enhancement but Are Not One-Size-Fits-All. Front. Mar. Sci. 7:282. doi: 10.3389/fmars.2020.00282
Received: 12 February 2020; Accepted: 07 April 2020;
Published: 07 May 2020.
Edited by:
Christine Angelini, University of Florida, United StatesReviewed by:
Charles William Martin, University of Florida, United StatesHeather D. Penney, Memorial University of Newfoundland, Canada
Copyright © 2020 Paxton, Shertzer, Bacheler, Kellison, Riley and Taylor. This is an open-access article distributed under the terms of the Creative Commons Attribution License (CC BY). The use, distribution or reproduction in other forums is permitted, provided the original author(s) and the copyright owner(s) are credited and that the original publication in this journal is cited, in accordance with accepted academic practice. No use, distribution or reproduction is permitted which does not comply with these terms.
*Correspondence: Avery B. Paxton, YXZlcnkucGF4dG9uQG5vYWEuZ292