 Saskia A. Otto1*
 Susa Niiranen2
 Thorsten Blenckner2
 Maciej T. Tomczak3
 Bärbel Müller-Karulis3
 Gunta Rubene4
 Christian Möllmann1
- 1Institute of Marine Ecosystem and Fishery Science, Center for Earth System Research and Sustainability, University of Hamburg, Hamburg, Germany
- 2Stockholm Resilience Centre, Stockholm University, Stockholm, Sweden
- 3Baltic Sea Centre, Stockholm University, Stockholm, Sweden
- 4Department of Fish Resources Research, Institute of Food Safety, Animal Health and Environment, Riga, Latvia
Identifying key indicator species, their life cycle dynamics and the multiple driving forces they are affected by is an important step in ecosystem-based management. Similarly important is understanding how environmental changes and trophic interactions shape future trajectories of key species with potential implications for ecosystem state and service provision. We here present a statistical modeling framework to assess and quantify cumulative effects on the long-term dynamics of the copepod Pseudocalanus acuspes, a key species in the Baltic Sea. Our model integrates linear and non-linear responses to changes in life stage density, climate and predation pressure as well as stochastic processes. We use the integrated life cycle model to simulate copepod dynamics under a combination of stressor scenarios and to identify conditions under which population responses are potentially mitigated or magnified. Our novel modeling approach reliably captures the historical P. acuspes population dynamics and allows us to identify females in spring and younger copepodites in summer as stages most sensitive to direct and indirect effects of the main environmental stressors, salinity and temperature. Our model simulations furthermore demonstrate that population responses to stressors are dampened through density effects. Multiple stressor interactions were mostly additive except when acting on the same life stage. Here, negative synergistic and positive dampening effects lead to a lower total population size than expected under additive interactions. As a consequence, we found that a favorable increase of oxygen and phosphate conditions together with a reduction in predation pressure by 50% each could counteract the negative effect of a 25% decrease in salinity by only 6%. Ultimately, our simulations suggest that P. acuspes will most certainly decline under a potential freshening of the Baltic Sea and increasing temperatures, which is conditional on the extent of the assumed climate change. Also the planned nutrient reduction strategy and fishery management plan will not necessarily benefit the temporal development of P. acuspes. Moving forward, there is a growing opportunity for using population modeling in cumulative effects assessments. Our modeling framework can help here as simple tool for species with a discrete life cycle to explore stressor interactions and the safe operating space under future climate change.
Introduction
With a growing human population and advances in technology comes an increase in interconnected threats to marine ecosystems at a rate unprecedented in human history (Halpern et al., 2019). In the recent past, the cumulative effects of a changing climate and anthropogenic pressures, such as habitat degradation, overfishing, bioinvasions or pollution, have led to increased environmental stress and ultimately to persistent changes in ecosystem structure and function. These include shifts from coral dominance to less desirable, degraded ecosystems (Jouffray et al., 2015), global fisheries collapses (Pinsky et al., 2011; Sguotti et al., 2019b) or re-organizations of entire food webs (e.g., Hare and Mantua, 2000; Daskalov et al., 2007; Möllmann et al., 2009; Conversi et al., 2010; Törnroos et al., 2019). As a consequence, research on cumulative effects and ecological futures has become increasingly important for improving planning and decision-making processes (Halpern and Fujita, 2013; Korpinen and Andersen, 2016; Dietze et al., 2018). This is particularly true for key species, which may exert a dominant role in the cascading of predator-prey interactions due to a unique combination of physiological performance, metabolic demands and life history strategies (Verity and Smetacek, 1996). By dominating local ecosystem functions they have a proportionally large influence on the community and its stability (Power et al., 1996; Hooper et al., 2005). The more sensitive key species are to disturbances and stressors the less resilient and more prone to regime shifts communities become (Thrush et al., 2009).
Determining key species dynamics as a response to a single stressor is generally a relatively easy task as the relationship between the species’ traits and the specific stressor can often be well described by a function defining a linear, exponential, asymptotic or bell-shaped curve (Ruel and Ayres, 1999; Brown et al., 2004; Schulte, 2015). The extrinsic stressor can be any natural or human-induced change in environmental conditions that places stress on the health and functioning of organisms and ultimately a population such as oxygen deficiency or fishing pressure. Most often, stressors occur in combination with joint effects that are less predictable because of their additive, antagonistic or synergistic interactive natures (Crain et al., 2008; Piggott et al., 2015; Sguotti et al., 2019a). Especially synergistic and antagonistic interactions are considered to be the dominant mode in animal populations (Crain et al., 2008; Jackson et al., 2016) and by definition greater than the additive effects produced by multiple stressors acting in isolation (Folt et al., 1999). Moreover, stressors might act simultaneously, at a rate faster than the rate of recovery (Paine et al., 1998), or at different time periods, e.g., due to cyclic patterns of the drivers (Becks and Arndt, 2013), which then could be dampened or amplified through density-dependence effects (Hodgson et al., 2017).
An important, yet underrepresented task in assessing cumulative effects and in projecting animal populations is the consideration of life cycle dynamics (Russell et al., 2012). Life stages may differ in their environmental niches, and hence vary in their adaptive ability to changes in the stressors (Catalán et al., 2019). Stage-specific differences in thermal tolerance have been demonstrated for instance among eggs, larvae, and pupal of moth species (Kingsolver et al., 2011) or juveniles and adults of water snakes (Winne and Keck, 2005). Seasonal components in the stage-specific response to environmental changes can be additionally relevant as shown for ungulates (Coulson et al., 2001) or birds (Dybala et al., 2013). Population dynamics are even more complex as species are not only driven by their abiotic environment but strongly interact with other species in the community. Species interactions such as competition or predation can have a great influence on the spatial and temporal dynamics of species (Guisan and Thuiller, 2005; Poloczanska et al., 2008; Albouy et al., 2019), being sometimes the key driver as observed in trophic cascades (Pace et al., 1999; Frank et al., 2007). In the light of this complexity, Russell et al. (2012) have advocated a more integrated approach in ecosystem predictions, including the identification of key species, critical life stages as well as their main interactions.
One ubiquitous group with multiple distinct life stages are copepods, a species rich taxon which dominates the marine zooplankton community by numbers and biomass (Miller, 2005). Copepods have a complex life cycle developing through 11 larval stages (6 nauplii and 5 copepodite stages) to the adult stage with one to 12 generations per year in temperate and high latitude regions (Mauchline, 1998). Because of their rapid reproduction with wide dispersal ability (Cowen and Sponaugle, 2009), their high sensitivity to environmental changes (Reid et al., 1998; Richardson, 2008) and ability to integrate and transfer environmental signals over generation time (Goberville et al., 2014) they represent suitable indicators of the effect of climate change on marine ecosystems. In addition, copepods are essential for larval fish recruitment (Llopiz, 2013) and as such they could be used to evaluate planktivorous fish status (Beaugrand, 2005). But despite this undeniable indicator potential, their omnipresence, great abundance and vital role in mediating the energy flow from primary producers to consumers (Turner, 2004; Richardson, 2008) copepods have been in contrast to higher trophic levels (DeMaster et al., 2001; Lindegren et al., 2010; Barbraud et al., 2011; Cheung et al., 2011) or primary production (Litchman et al., 2006; Jang et al., 2011) underrepresented in scenario modeling. A few studies have now emerged that apply life cycle or bioclimate envelope models to project future geographic distributions of copepod species or communities (e.g., Helaouët et al., 2011; Reygondeau and Beaugrand, 2011; Maar et al., 2013; Beaugrand et al., 2019). However, projections of zooplankton dynamics using simulation models that incorporate biotic interactions and non-linearity are sparse.
In the Baltic Sea, the largest brackish water system worldwide, the study of copepod dynamics is especially challenging as most species live here at their physiological limits. This is particularly true for the calanoid copepod Pseudocalanus acuspes, which is considered a marine, glacial relict species in this system (Holmborn et al., 2011). As one of the dominant zooplankton species in the Central Baltic Sea it serves as important food source for the planktivorous Atlantic herring (Clupea harengus) and European sprat (Sprattus sprattus) (Möllmann et al., 2004) but also for Atlantic cod (Gadus morhua) larvae during the spawning season in spring (Voss et al., 2003). P. acuspes also played a key role in the regime shift from a cod- to a sprat-dominated system in the late 1980s/early 1990s (Möllmann et al., 2009). The climate-induced decrease in salinity and increase in temperature caused a change in dominance from P. acuspes to the copepod Acartia spp. (Otto et al., 2014a), which had negative implications for cod larval survival. In addition, the change in hydrography had a direct negative effect on the reproductive success of cod. Together with stabilizing fisheries-induced feedback loops this resulted in the dominance of the planktivorous sprat (Lade et al., 2015).
In contrast to other Pseudocalanus spp. congeners, the life cycle of Baltic P. acuspes is characterized by an annual generation with a reproductive peak in spring, usually around May (Renz and Hirche, 2006). Although a small fraction of the egg-carrying population is able to reproduce year round (Renz et al., 2007), a stable progression of the stage structure is observed with older copepodite stages accumulating in autumn and overwintering before they mature in spring. In addition to the seasonal stage structure, P. acuspes shows also an ontogenetic vertical distribution with nauplii living near the surface, younger copepodites in mid-depth water and older stages in the deep water near the permanent halocline (Hansen et al., 2006; Renz and Hirche, 2006). While experimental studies on the life cycle dynamic of the Baltic populations have been challenging, statistical analysis of seasonal stage dynamics in the Central Baltic Sea revealed a complex interplay of linear density and predation effects and non-linear hydro-climatic effects (Otto et al., 2014b). In general, younger stages (i.e., nauplii and copepodites I-III) were more affected by water temperature and regional climate conditions, while older stages (i.e., copepodites IV-V and females) were mainly influenced by salinity and predation.
While statistical analyses can help identify key stressors and sensitive life stages, quantifying the effect size of changes in individual stressors and their cumulative effects at the population level requires model simulations. For populations with non-overlapping generations such as P. acuspes in the Baltic, discrete time models are a useful tool and easy to apply (Turchin, 2003). In zooplankton ecology discrete population models are typically based on the Leslie matrix (Leslie, 1945) or a modification of it (Caswell, 2001). These approaches explicitly address the population structure (e.g., Davis, 1984b; Miller and Tande, 1993; Twombly et al., 2007; Maar et al., 2013) but model mainly vital rates instead of abundances. Such models have mainly been used to reconstruct past dynamics rather than to develop scenario-based projections. In this study, we develop and expand an alternative approach (see Otto, 2012) that has been so far used for food web simulations only (Blenckner et al., 2015; Kadin et al., 2019). Specifically, we link empirically derived statistical relationships of individual life stages with their environment into an integrative, stochastic stage-resolved population model. Using our novel modeling approach we aim to reproduce the observed long-term life cycle dynamics of P. acuspes in the Central Baltic Sea and to identify the cumulative effects and interaction types under single and multiple stressors on the population size. In our model all external predictors are considered as potential extrinsic stressors (climatic or biological) as they all can place stress on the organisms once outside the optimal range.
Materials and Methods
Data
Zooplankton Time Series
Abundance (N m–3) data for P. acuspes are derived from a database of a zooplankton monitoring program of the Institute of Food Safety, Animal Health and Environment (BIOR) in Riga, Latvia. The sampling is conducted seasonally since the 1960s, usually in February, May, August and October, with a variable number of stations in the Eastern Gotland Basin, i.e., within the boundaries of the International Council for the Exploration of the Sea (ICES) subdivision 28 (see Otto et al., 2014b). These stations are irregularly sampled with a Juday Net as sampling gear (UNESCO, 1979), which has a mesh size of 160 μm and an opening diameter of 0.36 m. It is operated vertically and considered to quantitatively catch all copepodite stages as well as adult copepods, whereas nauplii may be slightly underestimated. Individual hauls were carried out in vertical steps, resulting in a full coverage of the water column to a maximum depth of 150 m. During analysis, abundance of nauplii (N), early copepodites 1–3 (C13), later copepodites 4–5 (C45) as well as adult females (F) were enumerated. For our simulation study, stage-specific abundance data were averaged across stations and season (i.e., annual quarters) and covered the period 1960 – 2017, except for winter where sampling stopped after 2008. Hence, the training data for the model fitting procedures ended in 2008. Only abundant stages of P. acuspes were considered for each season and all abundance data were ln(X + 1) – transformed to reduce intrinsic mean-variance relationships (see Supplementary Table 1). When modeling C13 stages in spring and summer we removed the outlier year 1983 as in Otto et al. (2014b).
Observed Environmental Data
For model construction and retrospective simulation we used observations from the period 1960 – 2017 as forcing, derived from the ICES1 database (Supplementary Table 1 and Supplementary Figure 1). Spring and summer temperature time series (Tempspr and Tempsum) were computed for the midwater (20–60 m) shown to affect early copepodite stages, while salinity in the deepwater layer (70–100 m) affects late copepodites (i.e., C45) and females stages from spring to autumn (Salspr - Salaut) (Otto et al., 2014b). Oxygen concentrations were also calculated for the deepwater layer and aggregated for all four seasons (Oxywin-Oxyaut). All hydrographic time series were compiled to match the zooplankton sampling period, i.e., January–February for winter, April–May for spring, July–August for summer, and October–November for autumn.
The relative role of bottom–up control was tested using phosphate concentrations (PO4win; 0–10 m) during December – February as indicator for nutrient enrichment in the system and primary production in spring (Jurgensone et al., 2011; HELCOM, 2018). We included here December for the winter mean to ensure a consistent sampling design, since Phosphate was less frequently sampled than the hydrography. Top–down control was tested using annual sprat spawning stock biomass (SSB) as proxy for predation pressure. Late copepodite stages and females of P. acuspes represent major prey items for both Baltic planktivorous fish species herring (Clupea harengus) and sprat (Sprattus sprattus) (Möllmann and Köster, 2002). However, the population size of P. acuspes is mainly controlled by sprat (Casini et al., 2008). To cover the full study period we used SSB estimates for sprat from the latest official stock assessment that date back to 1974 (ICES, 2018) and extended the time series back to 1960 using estimates by Eero (2012). The recent time series reconstruction by Eero (2012) allowed us to include sprat as direct forcing in the model instead of using an indirect predation index based on Atlantic cod (Gadus morhua) as in Otto et al. (2014b).
Modeling and Simulation Strategy
We developed an integrative, stochastic life cycle model of P. acuspes by coupling individual, i.e., stage- and season-specific, statistical models through density effects between successive life stages (Figure 1). Compared to an earlier study (Otto et al., 2014b), we exchanged Generalized Additive Models (GAM; Hastie and Tibshirani, 1990) for linear and polynomial regression approximations to facilitate integration into numerical food web and end-to-end models. All statistical modeling was performed in R 3.5.0 (R Core Team, 2018) and using the ‘mgcv’ package, version 1.8-26 (Wood, 2006) for the GAMs. Below we present our modeling and simulation approach.
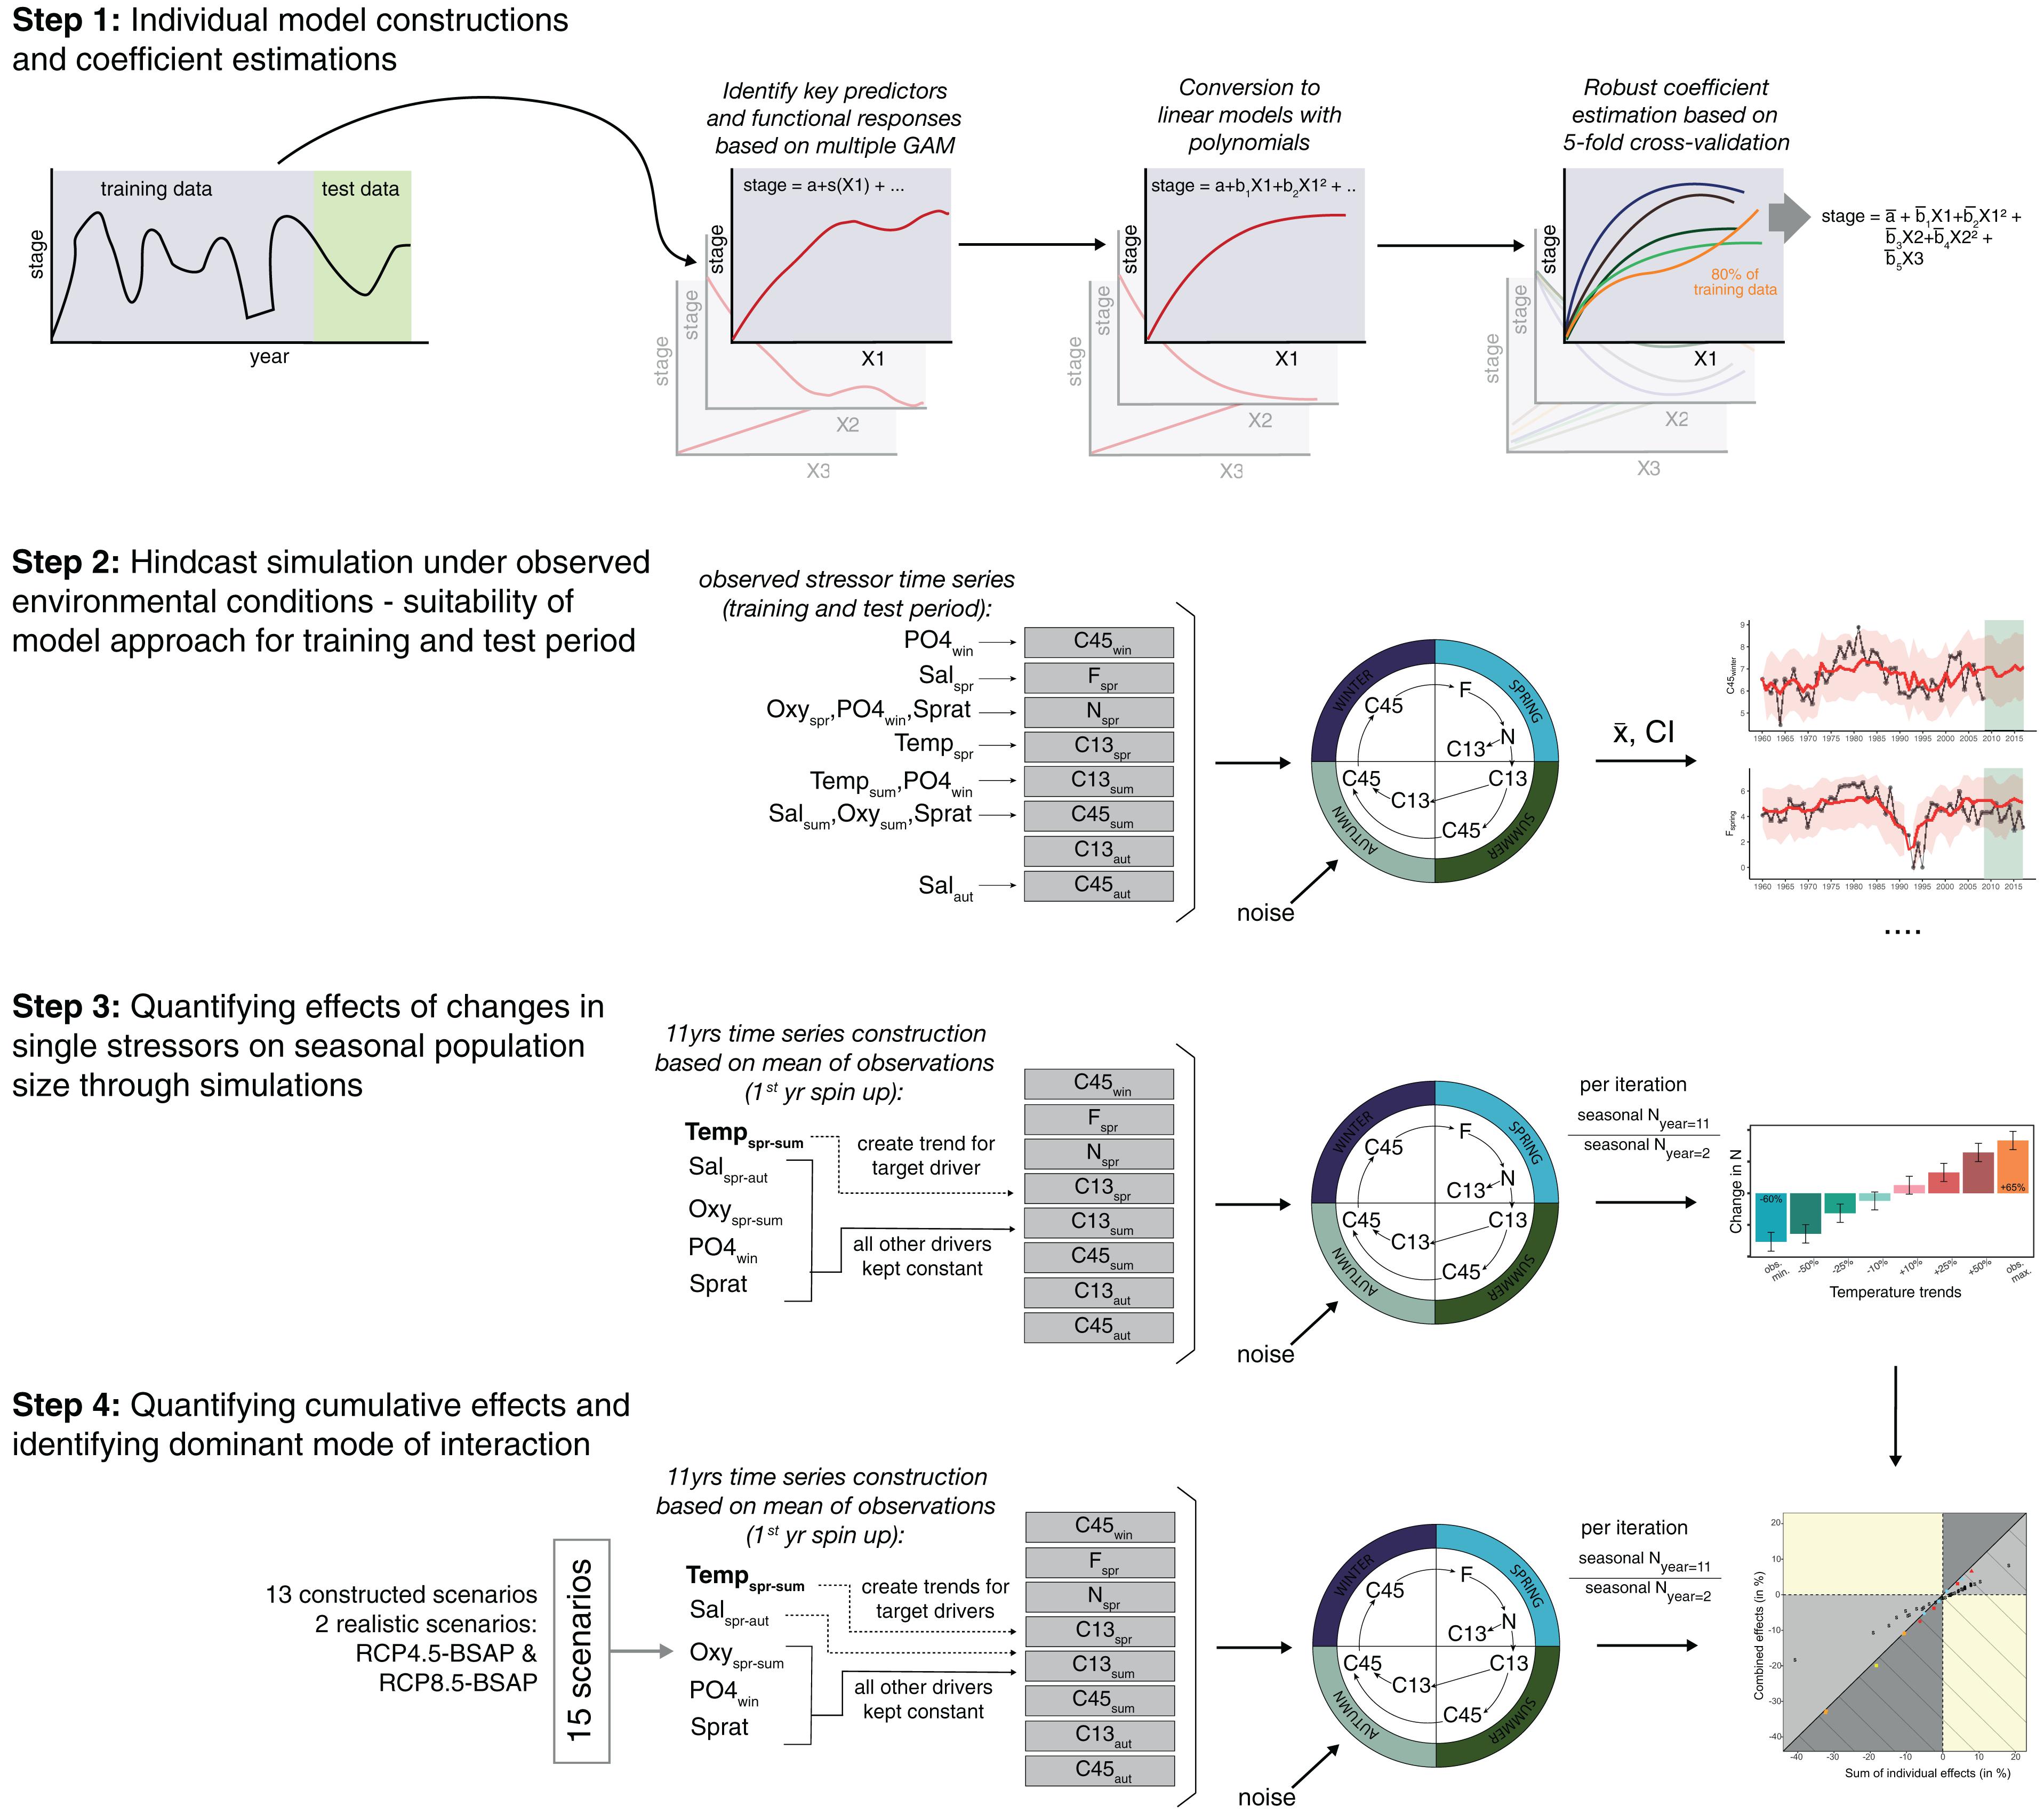
Figure 1. Conceptual diagram of the study design (steps 1–3). Single stage models of nauplii (N), young copepodites 1-3 (C13), old copepodites 4-5 (C45) and females (F) in the different seasons were constructed (step 1) and coupled to a stochastic life cycle model. This model was then forced by observed past external conditions (step 2), and by simulated environmental conditions to test for individual (step 3) and combined stressor effects (step 4).
Step 1: Stage-Specific Statistical Modeling
First, we split the zooplankton and environmental data into a training and test set covering the periods 1960–2008 and 2009–2017, respectively. These periods were chosen to have a minimum number of training observations (∼50) required to robustly estimate coefficients in our complex multiple polynomial regression model for which we had also abundance data for all stages. At the same time the test period ensured a sufficient number of observations (∼15%) for model validation (Figure 1, step 1). Stage- and season-specific models were then built using GAMs in which seasonal stage abundances of the training period were modeled by a combination of internal density effects and external conditions:
where Xsy is the natural logarithm [ln(X + 1)] of the abundance of a particular life stage group of P. acuspes during a particular season s in training year y. Di represents a vector of density effects, i.e., ln(X + 1)-transformed population abundances of different stage groups in the same or previous season of year y or y-1. Density terms that showed a significant albeit weak effect but could not be directly modeled due to low abundances in a specific season (e.g., the effect of summer females on summer C13) were excluded. Environmental variables of the same year y (and in the case of hydrographical conditions also the same season) are summarized in the row vector []. The superscripts i and j identify the single components of both vectors. α is the intercept and εsy random noise term assumed to be normally distributed with zero mean and finite variance. fi and gj are thin plate regression spline functions describing the effect of internal and external processes, respectively. Effective degrees of freedom (edf) were restricted to a maximum of 4 to avoid over-fitting. The optimal model was selected based on the AIC in a backward-selection approach (Akaike, 1973).
Once the optimal GAM and final explanatory variables were found, we replaced the GAM with polynomial regression models where all non-linear smoothing terms (i.e., edf > 1) were substituted with polynomials of different order. After identifying the most parsimonious model with the best fitting polynomial order using the AIC, we additionally applied a robust coefficient estimation based on a 5-fold cross-validation (James et al., 2013). For this, we split the training data into five subsets and in each of the five iterations we fitted the final model to 4 of the 5 subsets (i.e., to 80%). The final coefficient estimates were then obtained by averaging across the estimates from each iteration, which gave us estimates less sensitive to outliers.
For the C45sum model we applied in addition an alternative model selection strategy to better capture the observed decline in the test period. Here, we applied a backward selection process on the GAMs using the full time series, which lead to a slightly more complex model including salinity and oxygen conditions. The model was then converted into the most optimal polynomial regression model. The coefficient estimation based on the k-fold cross-validation, however, was again conducted on the training dataset to allow for an evaluation of the model performance.
Step 2: Model Coupling and Hindcast Simulations
The fitted models were first used to simulate the observed intra- and inter-annual population dynamics of P. acuspes after linking the models through the detected stage dependencies (Figure 1, step 2). Specifically, we initialized our simulations in year 1960 with the first observation of older copepodites in winter (C45win). Subsequent life-stages were then predicted. Predictions of C45 in autumn eventually served as input for predicting C45win the following year hence closing the annual life cycle.
We performed time series reconstructions of individual stage abundances together for the training and test periods to compare model performances. We repeated the reconstructions 1000 times adding in each iteration the same level of random noise as observed in our models (see eq. 1) to the predicted abundances by re-sampling (with replacement) the residuals from the fitted models in step 1. For all model-specific predictions in a given year the residual samples were drawn from the same original year in order to preserve the contemporaneous correlation of errors. For model validation, we averaged the abundances of each seasonal life stage over the 1000 Monte Carlo simulations and calculated 95% confidence intervals. We used these mean abundances to calculate the error rates for the training and test period. For better comparison across life stages, we computed the root mean square error normalized by the standard deviation (NRMSE). Since the inter-annual variability in P. acuspes stage abundances is relatively high and the explanatory power of most models range between 50 and 60%, the remaining noise from which we re-sampled lead to rather high uncertainty levels. Supplementary Figure 2 demonstrates how narrow the range of prediction uncertainty becomes if the magnitude of random noise would be a quarter of the one observed and added to our simulation.
Step 3: Simulation of Single Stressor Changes
To estimate the effect size of changes in a single target stressor on the total population abundance of P. acuspes, we ran 11-year simulations using the mean C45win abundance for 1960–2017 as starting value. Instead of using past observed environmental conditions as in step 2, we forced the model with constant environmental conditions, i.e., using the time series (1960–2017) mean of each stressor, except for the target stressor. Here, we increased or decreased the stressor by a constant value that amounted to a ± 10%, ± 25% or ± 50% change of the time series average (Figure 1, step 3). The same levels across all stressors were chosen to allow a quantitative comparison. But since the variability differed greatly between stressors (see Supplementary Figure 3) we also tested an increasing or decreasing trend equal to the maximum observed change from the mean). For each stressor and scenario we again performed 1000 Monte Carlo simulations and calculated average population sizes across all simulations as well as the difference between the second year and the last year in percentages. The first year served as spin up period in our simulation.
Step 4: Simulation of Multiple Stressor Changes and Types of Cumulative Effects
The effect size of changes in multiple stressors was estimated for 15 scenarios (see Table 1) using the same simulation set up as in step 3. Specifically, we estimated the combined effects under same or opposing trends of climate-driven or nutrient load-driven stressors. We then contrasted manageable stressors, i.e., nutrient load-driven stressors (oxygen and phosphate concentrations) and fisheries-related stressors (sprat SSB), with each other. While major trends in sprat biomass in past decades have also been linked to climatic changes and nutrient enrichment, key drivers were still fishing and particularly the release of predation pressure through cod overfishing (Möllmann et al., 2009; Eero et al., 2016). Hence, we regard in this study sprat SSB as mainly fisheries-related stressor, either directly or indirectly.
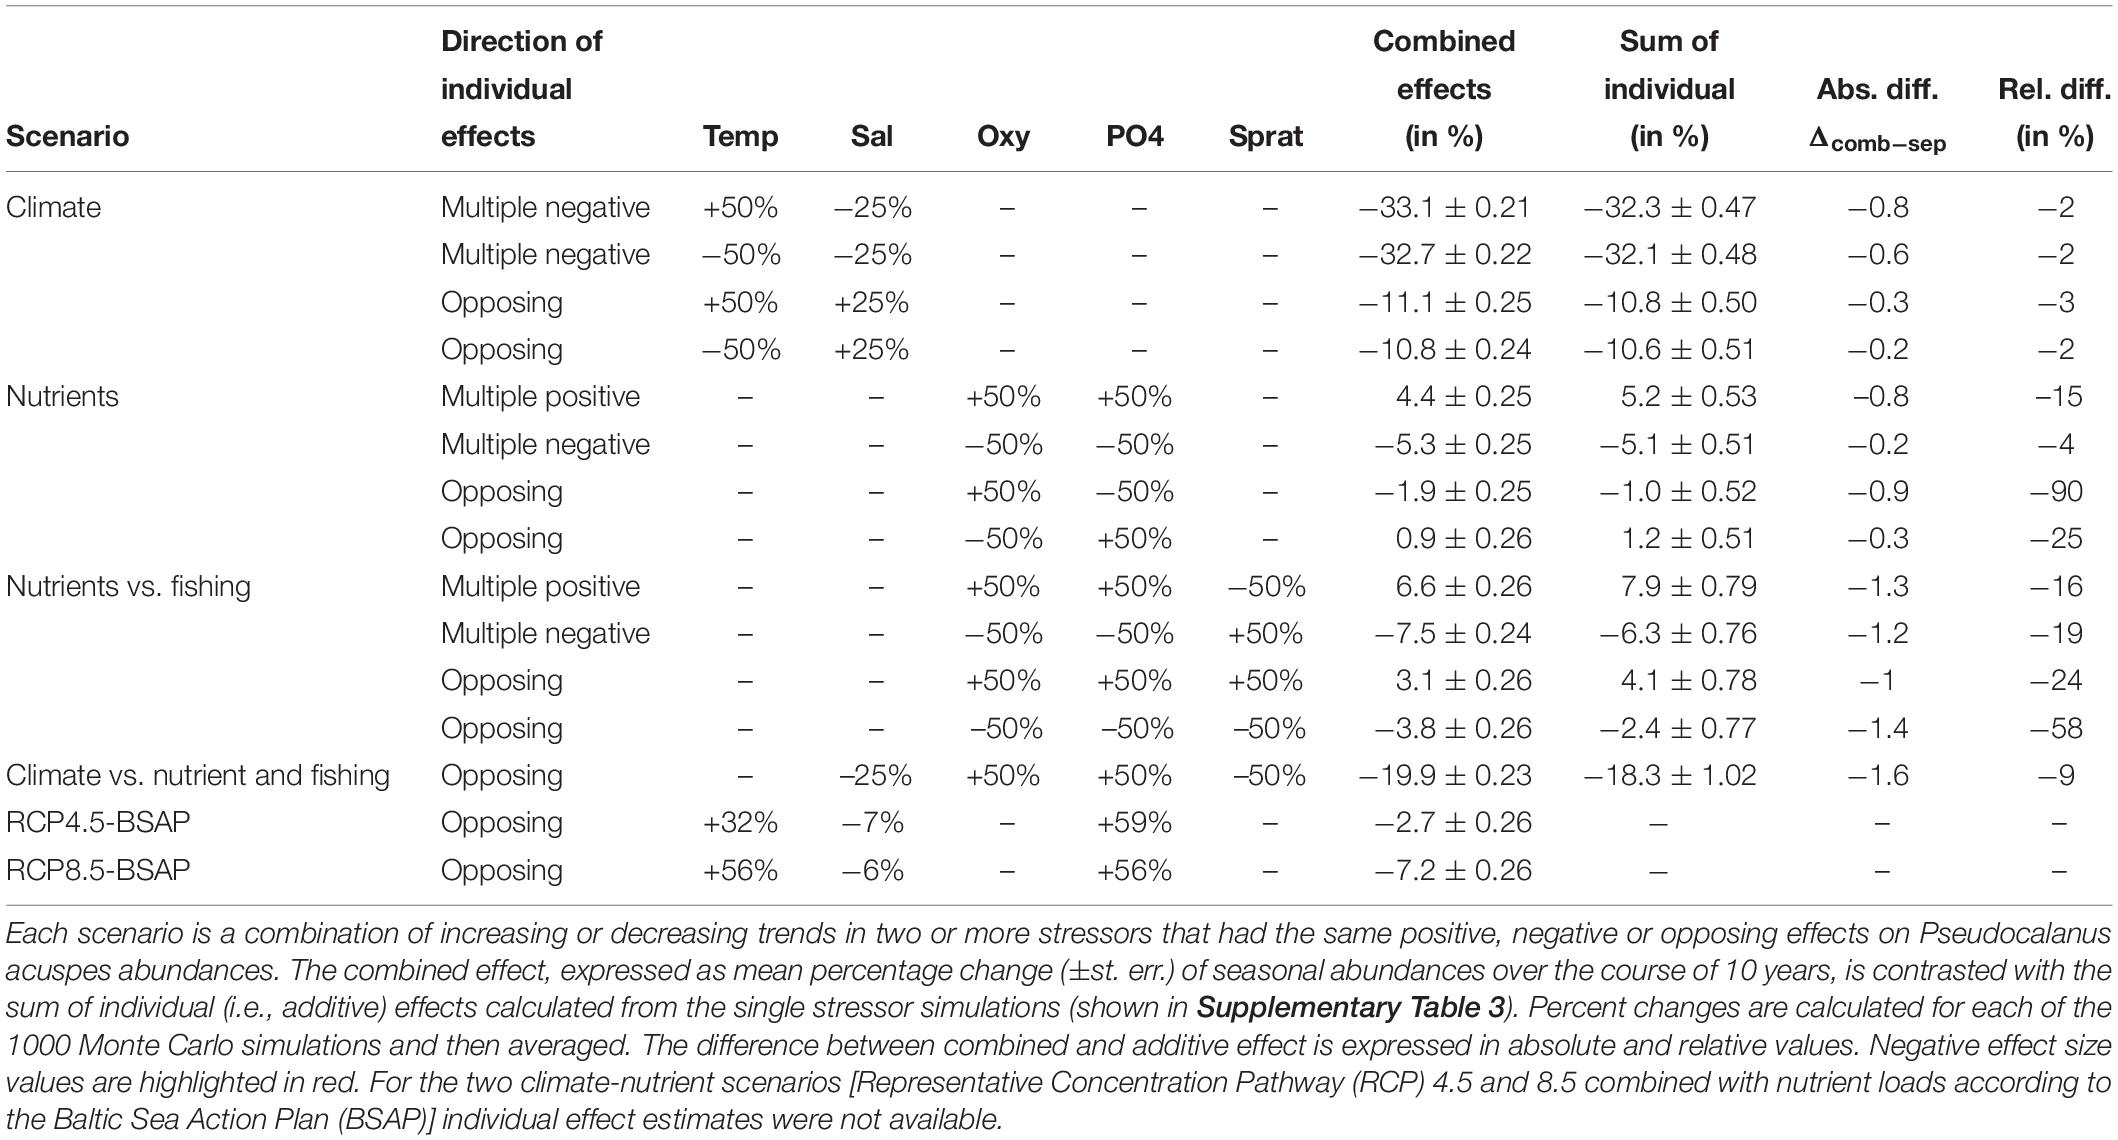
Table 1. Summary of scenarios and effect sizes under multiple environmental changes.
We tested furthermore to what extent favorable conditions of manageable stressors could mitigate a decrease in salinity conditions, a key stressor for P. acuspes. For comparability, we kept the trend magnitude of ±50% for all stressors constant, except for salinity (±25%) for which we found a much stronger individual effect on the overall abundance of P. acuspes. Ultimately, we combined changes in temperature, salinity and phosphate concentrations as projected by Saraiva et al. (2019) under the proposed nutrient load abatement strategy, i.e., the Baltic Sea Action Plan, and two greenhouse gas emission scenarios corresponding to the Representative Concentration Pathways (R), RCP 4.5 and RCP 8.5 (IPCC, 2014). Using a coupled physical-biogeochemical circulation model Saraiva and co-authors provide in their study long-term projections for temperature, salinity and biogeochemical variables for the entire Baltic Sea as well as for individual subsystems. From this study, we estimated the percent change of each stressors in the respective water depth and used these as trends in our simulations. According to Saraiva et al. (2019), oxygen concentrations under the BSAP are not expected to change, hence, we did not add a trend in these two scenarios. Similarly, we did not include a trend in sprat SSB. While sprat SSB is estimated to increase under the EU multiannual plan (ICES, 2019) the lower productivity under the BSAP might counteract such increase as projected by Niiranen et al. (2013). These two RCP4.5-BSAP and RCP8.5-BSAP scenarios are less comparable with the single stressor simulations but represent more realistic scenarios to evaluate potential trajectories of P. acuspes under expected climate change and management scenarios.
To identify the type of cumulative effects and potential interactions resulting from multiple stressor changes, we contrast the mean percent change in seasonal abundances under each scenario () with the sum of individual effects () obtained from the single stressor simulation. Following Piggott et al. (2015) and Fu et al. (2018) we consider a 1:1 ratio as additive interaction, while a ratio ≷ 1 falls into the following category:
1. If the combined effect has an opposite direction than the sum of individual effects, the interaction is either positively antagonistic (+and −) or negatively antagonistic (+and −).
2. If both effects have the same positive or negative direction but the magnitude is increased under the combined effect this is considered as positive and negative synergistic interaction, respectively.
3. If both effects have the same positive or negative direction but the magnitude is dampened under the combined effect this is considered as positive and negative dampened interaction, respectively.
Consequently, any interaction type where < , i.e., where abundances are lower under the combined effect than expected under additive effects, is posing an additional risk for the population. This applies to neg. antagonism and synergism as well as to positive dampened interactions (Fu et al., 2018).
We used the same approach to identify how effects of single stressors on multiple stages accumulate within the life cycle and whether effects are magnified or dampened on the total population level. Here, we contrasted the mean percent change in total seasonal abundances under each of the single stressor scenarios with the sum of mean percent change in individual seasonal stage abundances, averaged across seasons.
Results
Key Predictors and Types of Relationships
Positive linear density effects were found for all seasonal stage abundances we tested for, which allowed us to couple the individual regression models (Table 2). In contrast, responses to external conditions were highly stage- as well as season-specific and in terms of the hydrography often better characterized by polynomial equations. Midwater temperature was the key predictor for younger copepodites (C13) in spring and summer where the relationship was best described by a dome-shaped response curve with an optimum around 4 and 5°C respectively (Supplementary Figure 4A). In contrast, deepwater salinity had a strong positive effect on females and older copepodites (C45) from spring till autumn. This effect saturated around 10 psu for females (Supplementary Figure 4B). Oxygen concentrations in the deepwater layer had a positive linear effect on the nauplii in spring and, hence, recruitment success, but also a highly non-linear effect on C45 summer abundances (Supplementary Figure 4C). The most parsimonious model for C45 in summer in fact did not include oxygen and salinity as explanatory variables (see Table 2), but failed to predict the observed decline during the test period (see Supplementary Figure 5F). Hence, we selected a better performing but slightly more complex model, which we trained based on the full time series. When including the last 9 years from the test period (i.e., 2009–2017), salinity and oxygen revealed also as important predictors of C45 summer abundances in addition to C13 summer abundances and sprat SSB.
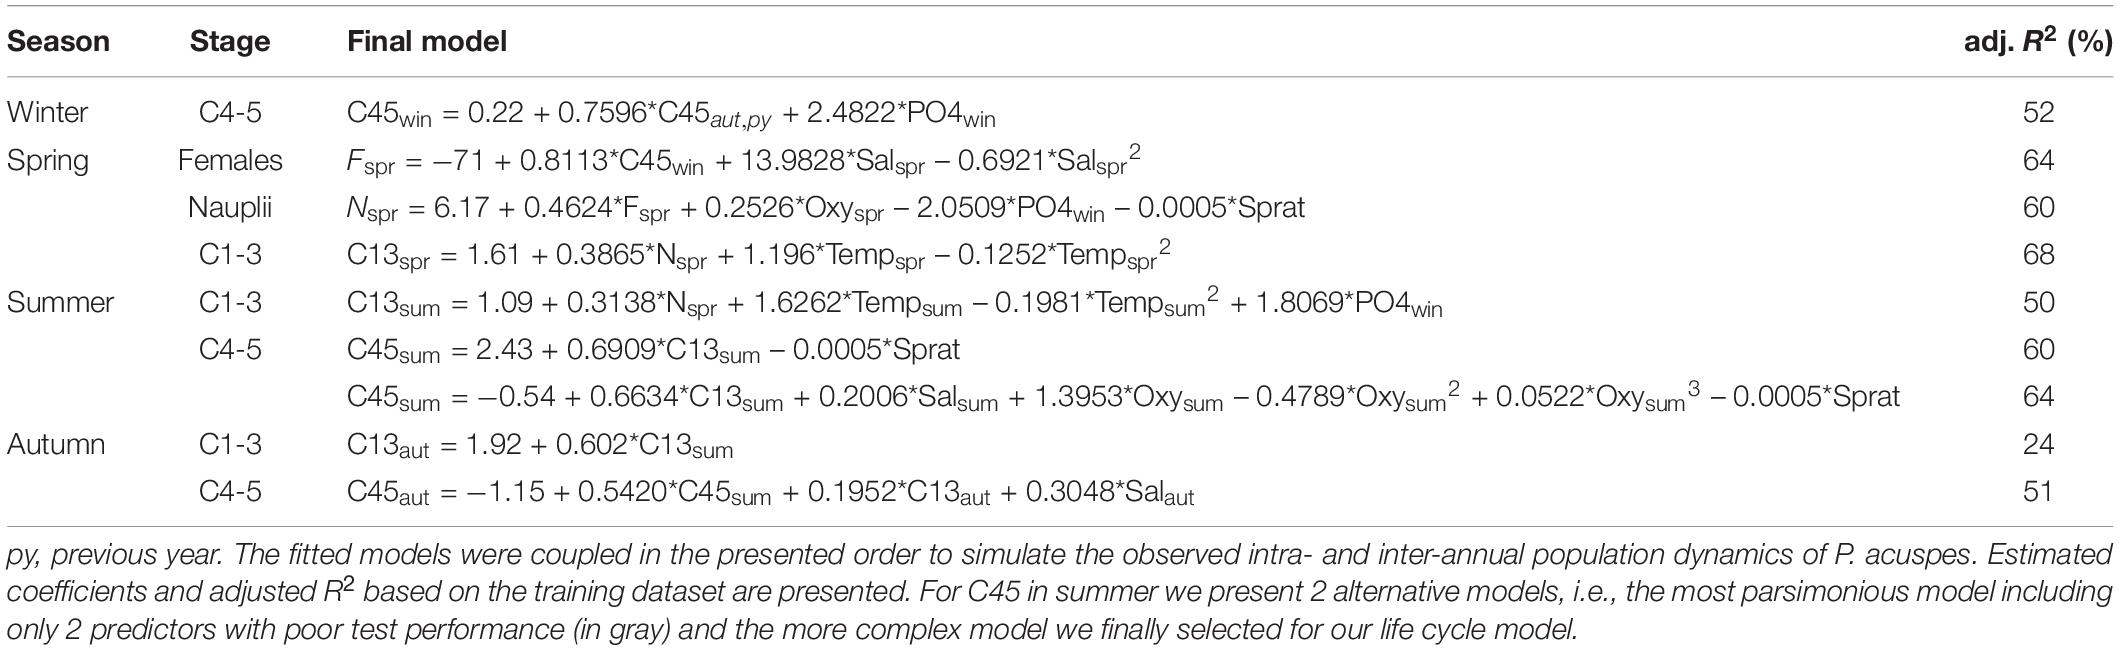
Table 2. Overview of the final linear and polynomial regression models we selected for our simulations.
Combinations of winter phosphate concentrations and sprat SSB as indicator for bottom–up and top–down control, respectively, were found for both nauplii and the younger copepodites in summer. On the other hand, older copepodite abundances in winter were better explained by phosphate alone, while in summer C45 were more affected by predation pressure from sprat. Similar to the density effects, all phosphate and sprat effects, which we consider here as indirect or direct biotic stressors, were linear in our final models.
Performance of the Coupled Life Cycle Model
Our coupled model reproduced well the past dynamics of seasonal stage abundances in the training period (Figure 2). The increase in P. acuspes population size in the 1970s and the following strong decline around the mid-1980s, observed mainly for older copepodites, females and nauplii in spring, is adequately captured. Model results furthermore agreed with observations of earlier copepodite stages, particularly in spring, that exhibited stationary dynamics without a clear temporal trend. For most time series the normalized root mean square error (NRMSE) of the training data is fairly similar and ranges between 0.70 and 1 indicating that the deviation of the predicted values is smaller than the standard deviation of the observations. The lowest training error rates were obtained for spring females and copepodites in summer (Figures 2B,E,F). A good test set performance was also obtained for the younger stages, i.e., the nauplii and C13. Here, the NRMSE for the test data was at similar levels or even lower than the NRMSE for the training data (Figure 2D).
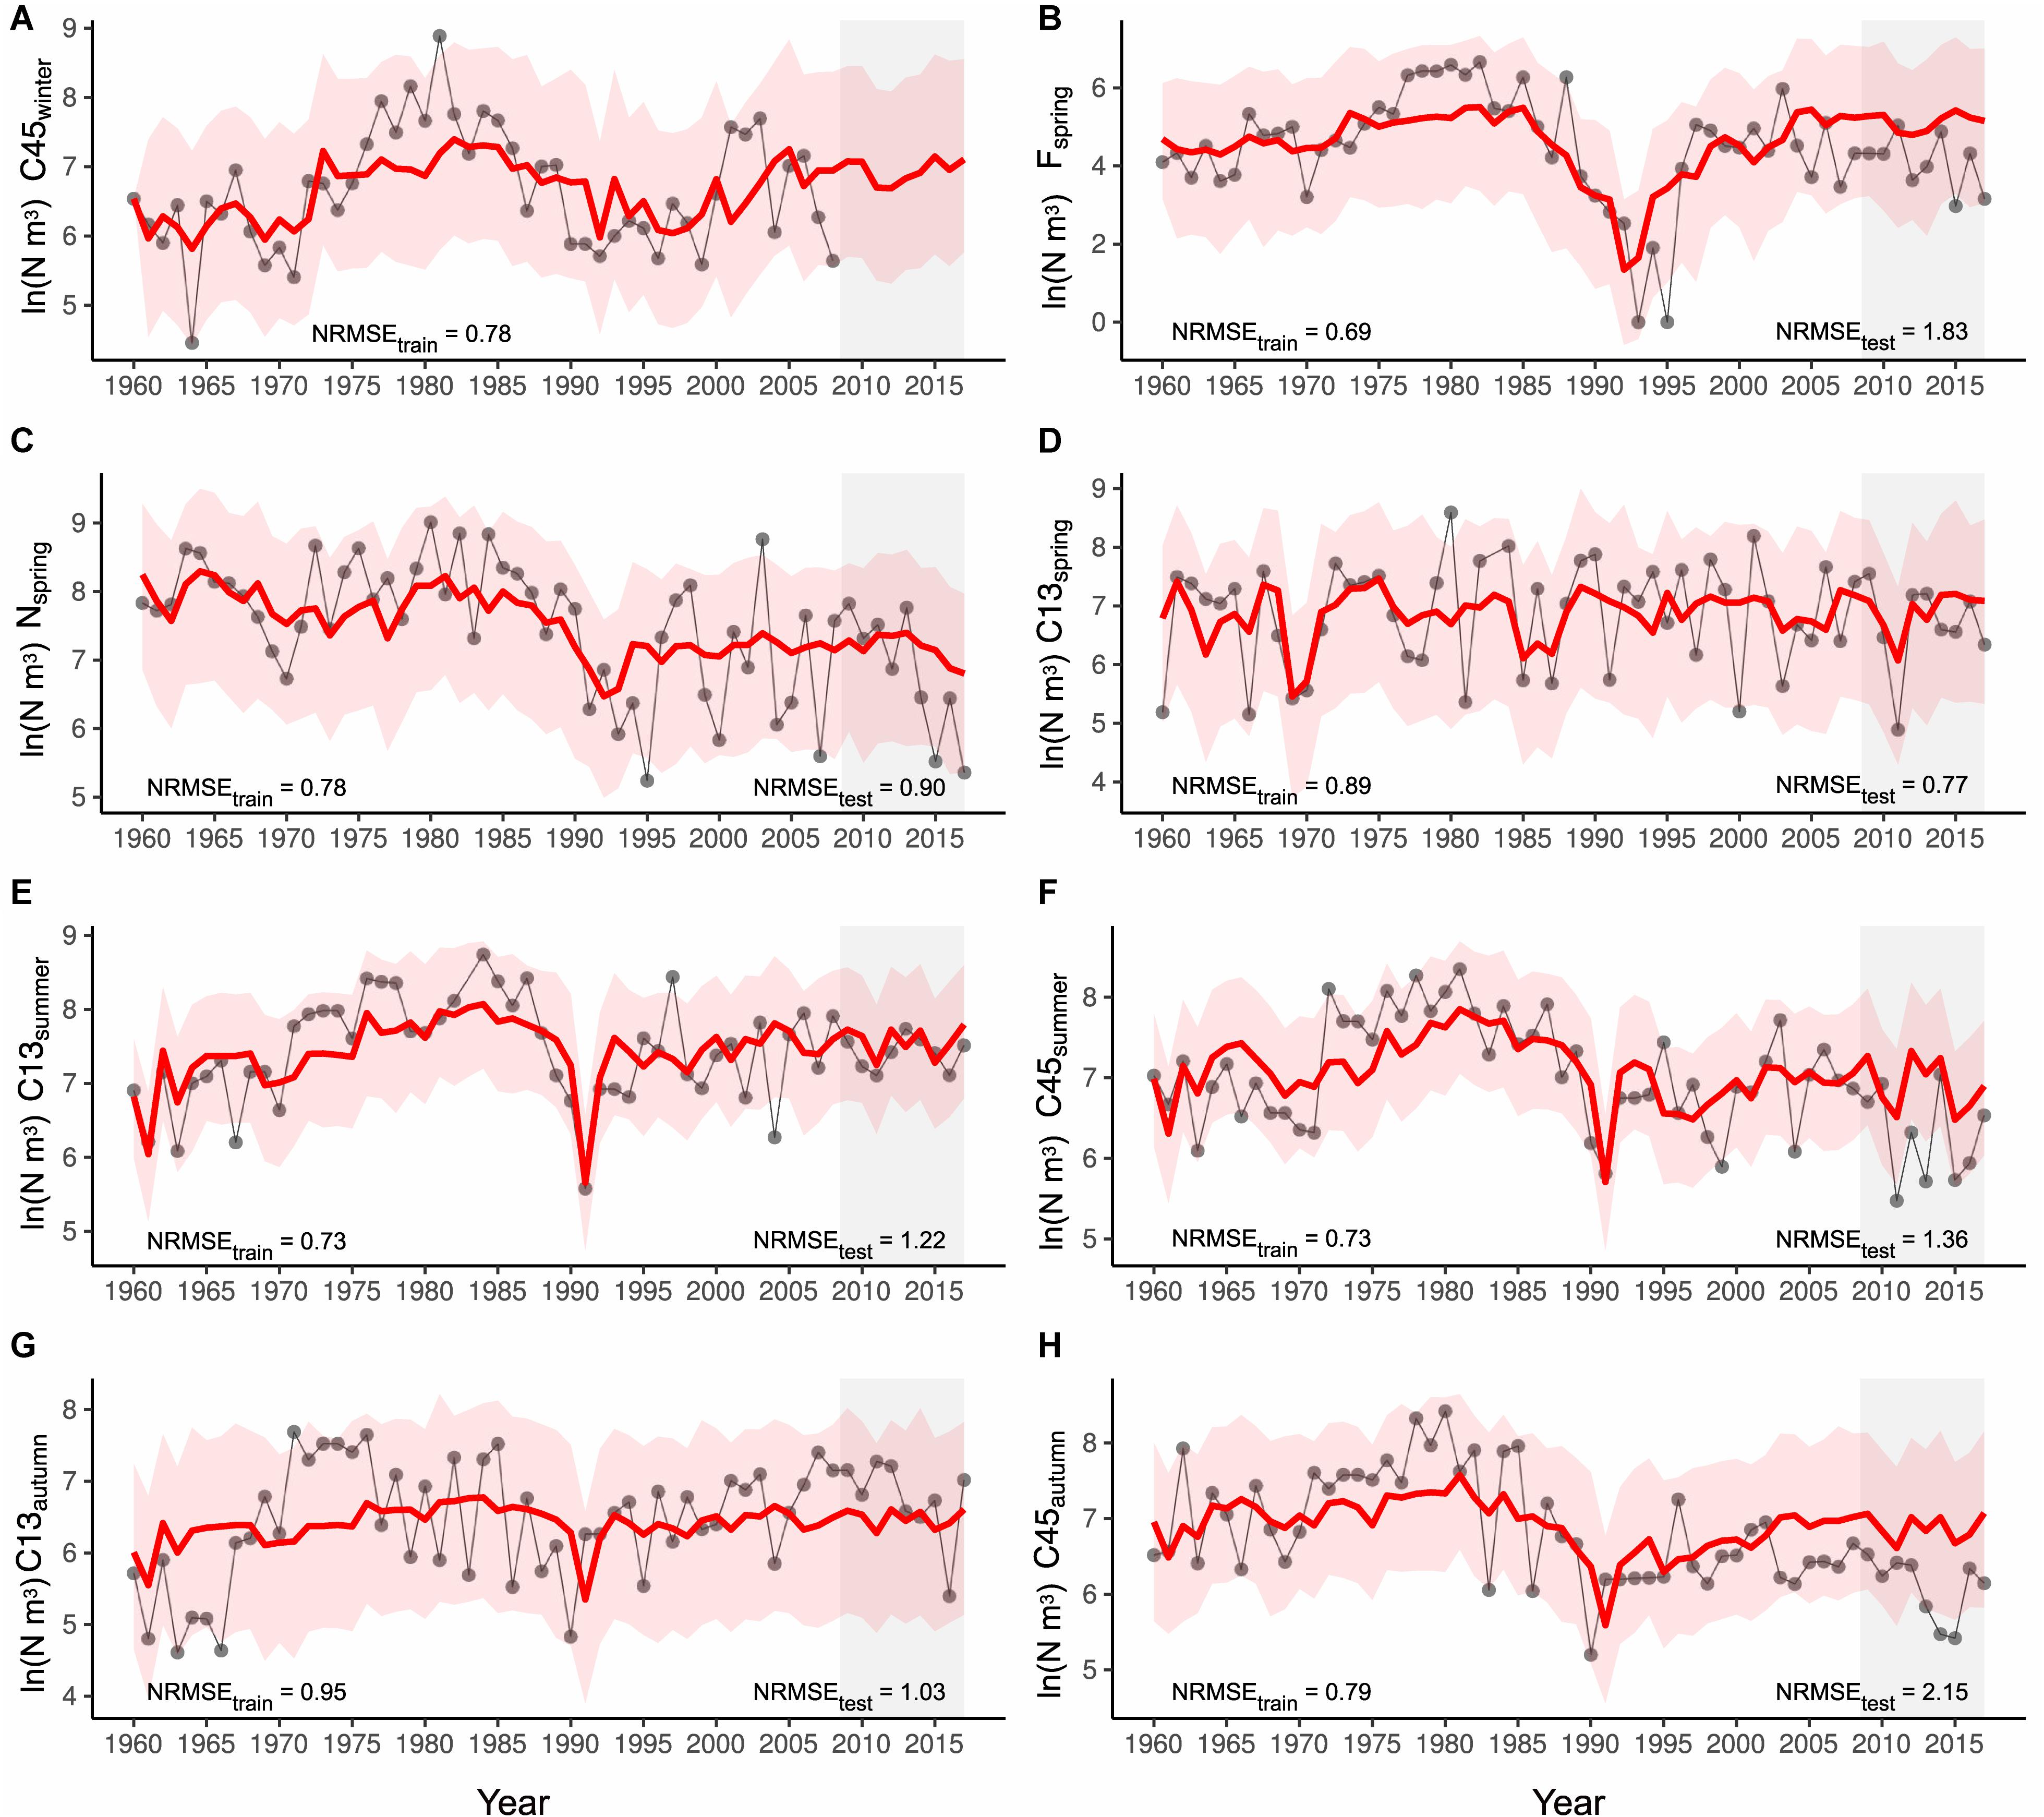
Figure 2. Hindcast of seasonal stage abundances for the training and test (gray shaded box) period using our coupled life cycle model. Simulations were started using the first observation of C45 winter abundances of the series (in 1960) from which the female spring abundance and consecutively the various seasonal stage abundances within this and the following years were predicted (from A–H). The red line represents the mean of the 1000 Monte Carlo simulations, the red shaded area the 95% confidence interval. The gray line with circles represents the observed time series. The normalized root mean square error (NRMSE) for both the training and test period is provided as measure of model performance.
We have unfortunately no data on C45 abundance since 2008 and hence could not derive information on the test set performance. But a less optimal test set performance was obtained for females in spring and C45 in summer and autumn, where the NRMSE ranged between 1.4 and 2.2 (Figures 2B,F,H). However, when producing an alternative hindcast based on a life cycle model that includes the more parsimonious C45 summer model with only C13 summer abundances and sprat SSB as covariates (Table 2), NRMSE test values are even higher for these stages (see Supplementary Figures 5B,F,H) but not for the others (Supplementary Figures 5A,C–E,G). This is particularly notable for C45 in autumn where the NRMSE increases from 2.15 to 2.48 under the simpler model. The fact that modifications of a single stage- and season-specific model cause changes in the predictive performance of subsequent stages and seasons highlights the strong internal coupling and importance of cascading effects.
Individual Stressor Effects
The analysis of net effects of changes in single stressors on the total population size of P. acuspes revealed complex dynamics that were not simply the sum of individual stage effects. We found changes in individual stressors that have linear effects on individual stages (i.e., phosphate and sprat), leading to proportional changes in the total population size, while trends in hydrographical variables caused less self-evident population responses. When keeping all external stressors constant but increasing temperature (by ±10%, ±25%, ±50%, −60%, and +65%) from the observed time series mean, we found overall changes in the total population size of P. acuspes ranging between −11 and 0.2% (see Figure 3 and Supplementary Table 2). The direction of population responses was independent of the direction in temperature changes as P. acuspes showed major declines both when temperature decreased and increased by more than 50%. This net effect resembles largely the stage-specific dome-shaped effect found for younger copepodites. Changes in deepwater salinity had by far the greatest impact on the total population size in our 10-year simulation. We found decreases of 10–50% leading to a drop in the overall population size by 7–86%, which was mainly driven by severe declines of females in spring (Supplementary Table 3 and Supplementary Figure 6). On the other hand, positive salinity trends caused little changes at the stage and population level except for unobserved high increases of 50%. Here, the population starts declining again triggered by the drop in spring females. An explanation for this is the saturating salinity effect on spring females we characterized by a polynomial approximation, which tends to become also dome-shaped and predict lower abundances at both side of the salinity range when extrapolating. However, the actual scale of salinity fluctuations observed in the past decades was at about −20 to +10% around the mean. Hence, potential changes of the total population size under more realistic salinity trends are not much greater than under observed temperature changes. In contrast, changes in oxygen, phosphate and sprat SSB caused only minor changes in the population size, which hardly exceeded 5% in our simulation (Supplementary Table 2). In addition, uncertainty levels were comparably greater, also in terms of the direction of change (Figure 3). Only at pronounced increases of oxygen concentrations by 160% as seen in the past, the overall stock size will most likely show a significant increase.
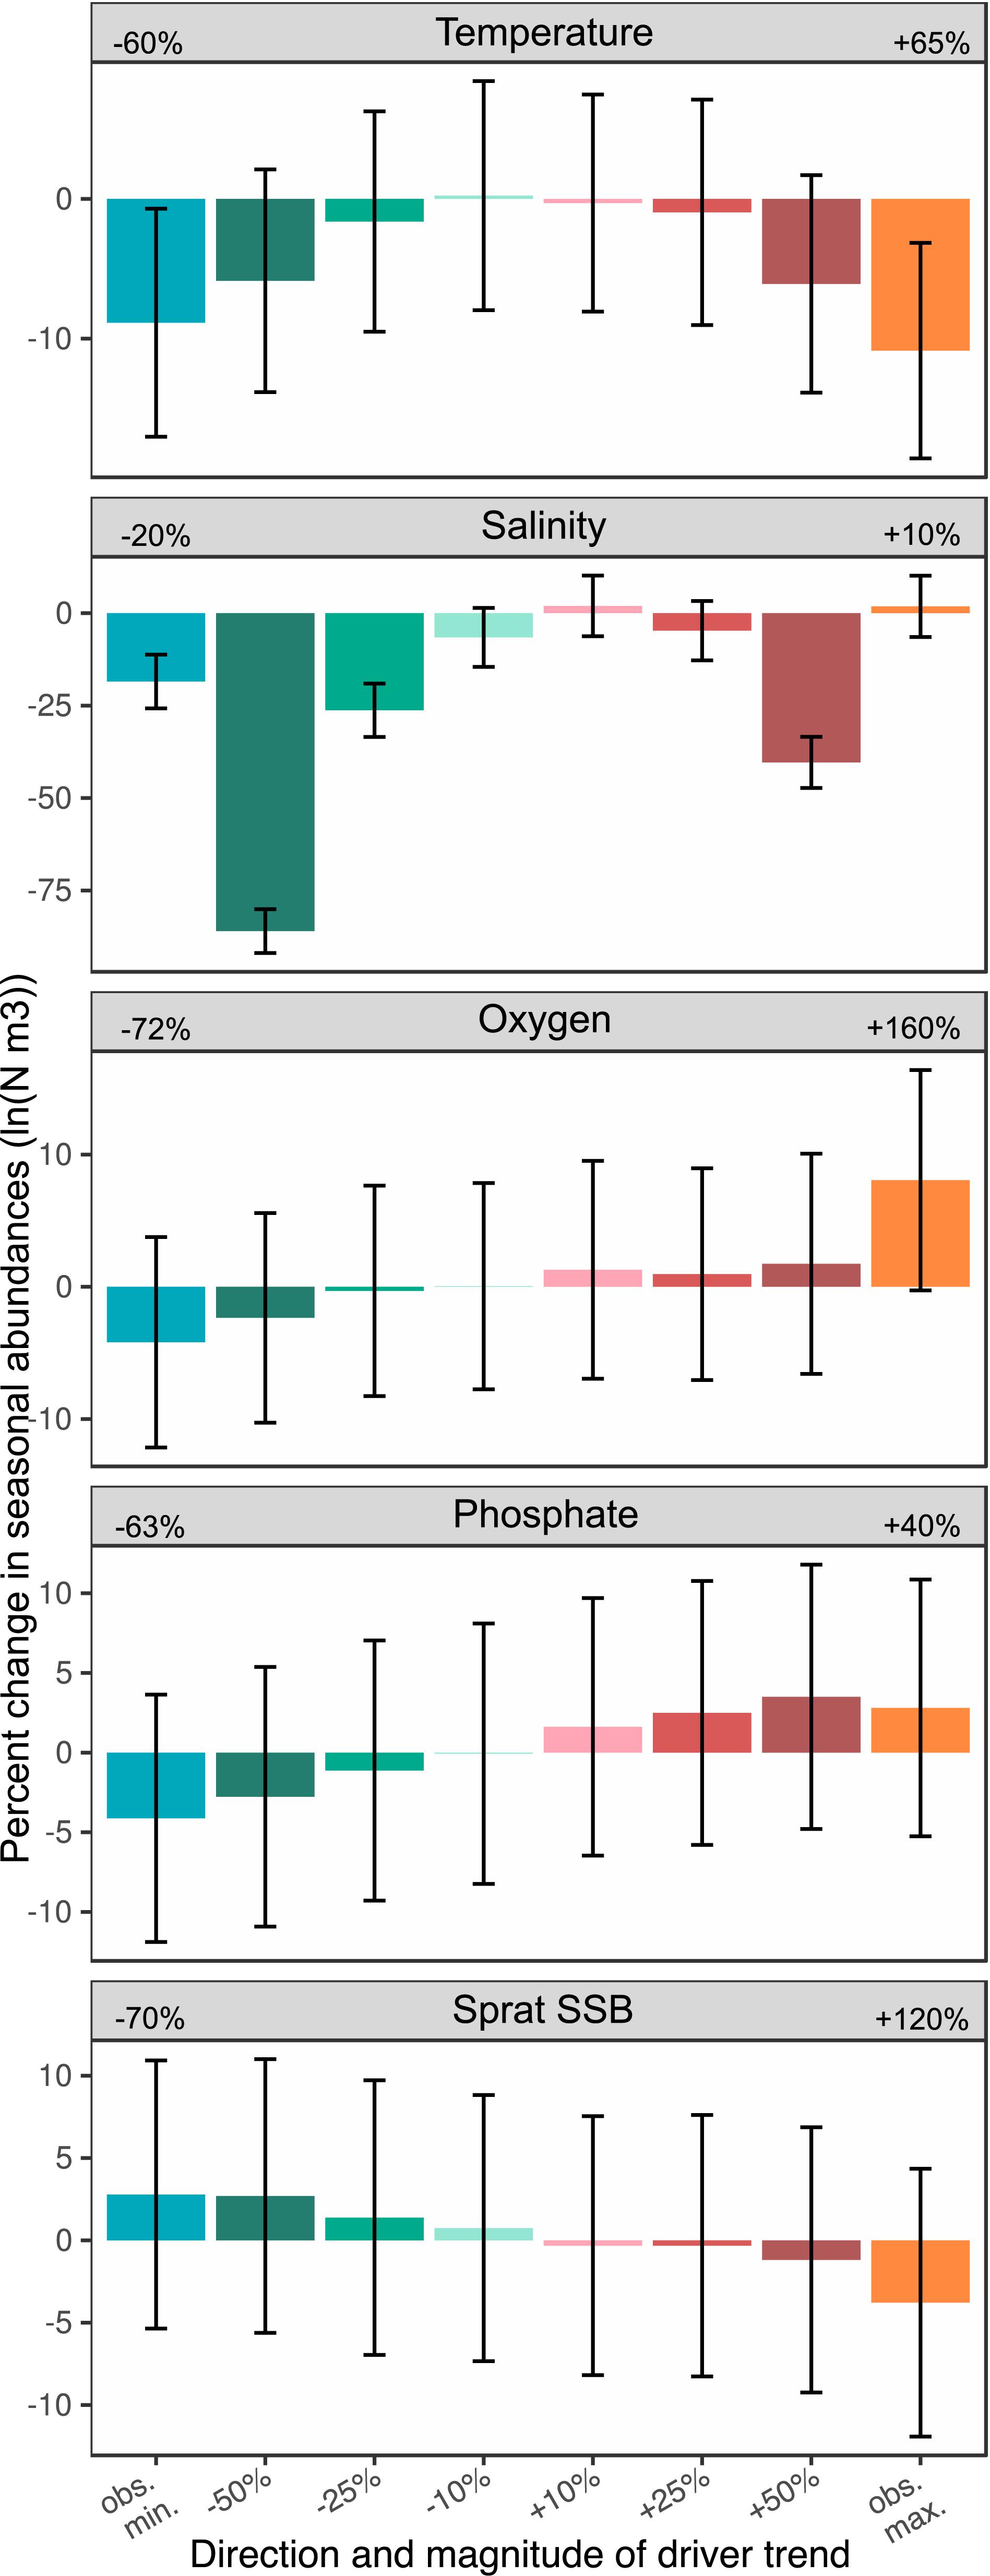
Figure 3. Effect size of single environmental changes. The percent change of mean seasonal abundances over the course of 10 years under eight different trend scenarios is presented for each stressor. Percent changes are calculated for each of the 1000 Monte Carlo simulations and then averaged. The error bars represent the standard deviation. The numbers next to the stressor names represent the maximum observed negative and positive deviations from the time series mean.
We found in our single-stressor simulations that stressor effects were clearly positively and negatively dampened at the total population level (Figure 4). While individual life stages directly affected showed a strong response to the stressor, effects mostly cascaded only to 1 or 2 subsequent stages and eventually faded over the course of the year (Supplementary Figure 6). For overwintering copepodites C45 and females in spring we even found opposite trends to previous stages indicating a dampening mechanisms through density dependence being greatest during the maturation period.
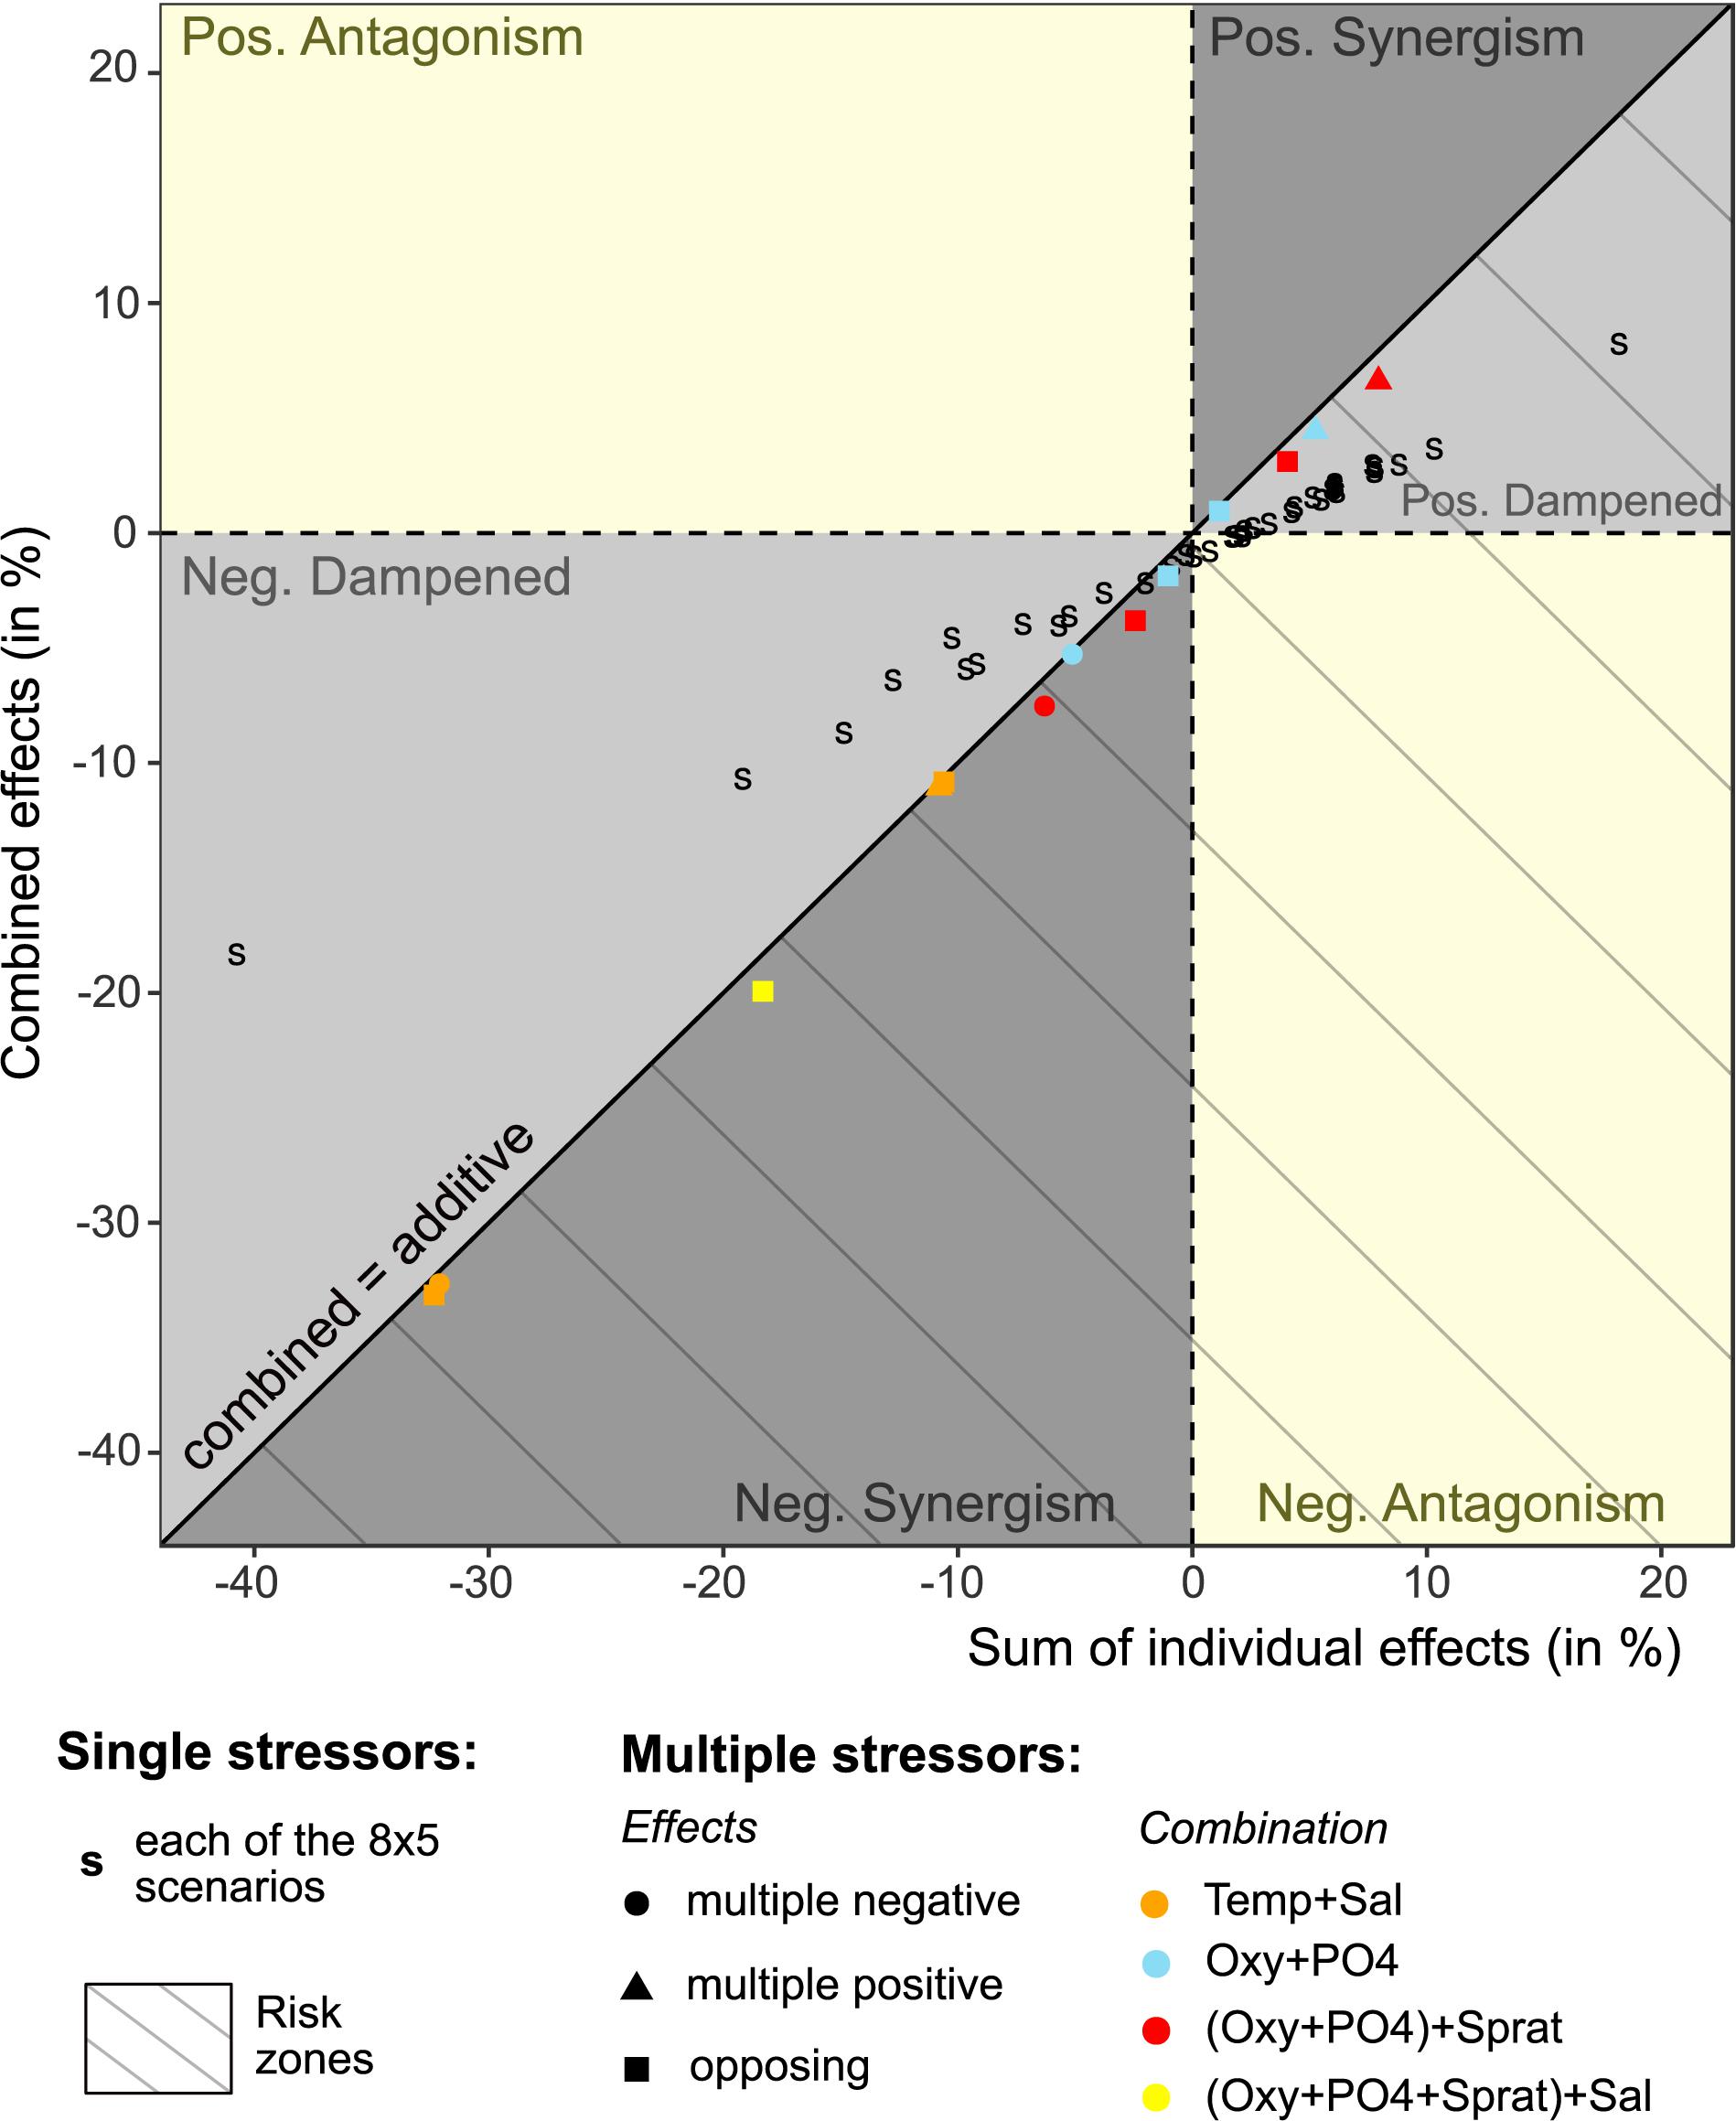
Figure 4. Comparison of the combined versus additive individual stressor effects. The combined effects were simulated for 13 scenarios in which we combined increasing or decreasing trends in two or more stressors that had the same positive, negative or opposing effects on Pseudocalanus acuspes abundances. Effects are presented as percent change of mean seasonal abundances over the course of 10 years, averaged across 1000 Monte Carlo simulations. The additive effects are calculated as the sum of mean percent change under single environmental changes (shown in Figure 3). For single stressor simulations the combined effect represents the net effect on the total population in comparison to the sum of individual seasonal stage effects. Population responses to single changes in salinity by 25 and 50% are not shown as they lied outside the selected X- and Y-range. The gray and yellow areas indicate the type of interaction present, i.e., positive and negative synergism, antagonism and dampening effects. All interactions below the diagonal lines are considered as risk zones where combined effects lead to lower abundances than expected under additive interactions.
Combined Stressor Effects and Dominant Mode of Interaction
In contrast to single stressors, multiple stressors had rather an additive effect on the total abundance, although we did find indications of positive dampening and negative synergistic interactions (Figure 4 and Table 1). Both types of interactions lead to lower abundances than expected and were mainly found when multiple stressors affected the same life stage, e.g., oxygen conditions, phosphate concentrations, and sprat SSB affecting all nauplii in spring. The individual response direction, i.e., whether individual stressor effects on the population size are all positive, negative, or opposing, had no impact on the interaction type.
Given the strong individual response to climatic stressors and an additive interaction, the strongest decline in the P. acuspes abundances was observed under decreasing salinity conditions and changes in temperature. This decline could be mitigated by favorable changes in manageable stressors. In our multi-stressor simulation, we found that a 50% increase of oxygen and phosphate conditions together with a 50% reduction in predation pressure could counteract the negative effect of a 25% decrease in salinity by 6% (see Table 1 and Supplementary Table 2). This is overall less than expected under a purely additive interaction indicating a negative synergistic interaction. Under constant climate conditions the same stressor changes lead to notable but slightly dampened increases in the total population size.
Current projections of long-term salinity reduction in the Baltic Sea and specifically Eastern Gotland basins under the intermediate and high RCP scenarios greatly diverge depending on the model setup but are generally below the 25% simulated here. Given a salinity decline by only 7% (RCP4.5) and 6% (RCP8.5) together with an increase in temperature and phosphate concentrations between 30-60% we still observe a decrease in the population size of P. acuspes but only up to 7% (see Table 1).
Discussion
Suitability of the Modeling Approach
We here developed a novel stochastic stage-structured life cycle model for a zooplankton population that plays a key role in Baltic Sea ecosystem dynamics. Discrete stage- or age-structured population models in zooplankton ecology usually belong to the group of matrix models (Carlotti et al., 2000), which theoretically can be linear or non-linear, deterministic or stochastic (Caswell, 2001), the latter achieved by randomization of model parameters (Turchin, 2003). However, unlike our approach, in zooplankton ecology population models including stochasticity is seldomly considered (Carlotti et al., 2000) and applied matrix models are usually built on linear relationships only (e.g., Torres-Sorando et al., 2003; Twombly et al., 2007). The great advantage of our modeling approach lies hence in the explicit consideration of non-linear relationships between discrete life-stages. Furthermore, adding stochasticity in the population dynamics allowed us to provide robust uncertainty estimates associated with the direction and magnitude of stressor effects for a species with high interannual variability. Our statistical model is however not directly comparable with mechanistic stage-resolved copepod models that can be coupled to a 3-dimensional ecosystem model (see e.g., Fennel, 2001; Fennel and Neumann, 2003; Dzierzbicka-Głowacka et al., 2013) as it is constrained to the sampling design and does not resolve the spatial dynamics, both horizontal and vertical, at any desired resolution. However, being a more simple and data-driven approach that requires less prior knowledge and supercomputing power, the presented modeling framework can serve as ideal tool for management strategy evaluation and cumulative effect exploration.
Relative Importance and Magnitude of Biotic and Abiotic Stressors
Long-term dynamics of P. acuspes in our model were the result of multiple stressor effects (Otto et al., 2014b). These acted either in concert or asynchronously and then accumulated during the life cycle. Moreover, our model simulations demonstrate that climate-driven stressors, particularly salinity, are by far the most important players at the stage as well as population level. Females in spring and younger copepodites in summer were identified as the most vulnerable stages toward climate-driven changes in hydrography, while bottom-up and top-down processes were comparably negligible for all stages.
Previous studies on long-term monitoring data showed that zooplankton species are highly sensitive to environmental conditions, which, in turn, can be influenced by large-scale hydroclimatic processes (Roemmich and McGowan, 1995; Taylor, 1995; Stephens et al., 1998; Greene and Pershing, 2000; Möllmann et al., 2000; Beare et al., 2002; Beaugrand, 2003; Molinero et al., 2005; Gislason et al., 2009). In the Baltic Sea, reproduction and population expansions of endemic as well as invading marine species are generally limited by the strong salinity gradient (Jaspers et al., 2011; Vuorinen et al., 2015). Similarly, P. acuspes, a marine arctic relict species in the Baltic Sea (Grabbert et al., 2010), is generally perceived as being driven by salinity since the brackish water may display sub-optimal reproductive conditions (Möllmann et al., 2003). Also in our analysis, salinity had the strongest and most significant impact on female abundance in spring, in particular when salinity declined. Renz and Hirche (2006) suggested a direct physiological effect of low salinity on growth and reproduction but also considered a potential role of co-occurring low oxygen levels for the recruitment success. Indeed, our study suggests that while salinity is an important predictor for abundance of females, oxygen conditions determine the offspring survival. At low salinities reproducing females might be forced to move into anoxic or low oxygen deeper waters potentially affecting egg production, the attached eggs or hatched nauplii stages (Möller et al., 2015). On the other hand, temperature has not been identified as a key stressor of Baltic P. acuspes in previous long-term studies when disregarding stage-specific responses (Dippner et al., 2000; Möllmann et al., 2000), except for the spring season (Otto et al., 2014a). Here, we show that temperature plays a key role in summer when C13 stages are most abundant. Particularly juvenile copepodites are known to depend on temperature, affecting growth rates, development times and molting rates (Vidal, 1980a, b; Hirst and Bunker, 2003; Dzierzbicka-Glowacka, 2004) and ultimately abundances as shown in our simulation for C13 in spring and even more in summer.
While studies on long-term effects of biotic interactions on zooplankton species are sparse, we here show for the first time that climate effects have the potential to impact copepod species by nearly 2 orders of magnitude in comparison to biotic interactions, which supports recent findings of low ecotrophic efficiency in deeper basins of the Central Baltic Sea (Bernreuther et al., 2018). However, we did find stage-and season-specific bottom–up and top–down effects which we tested indirectly by winter phosphate concentrations and directly by sprat SSB. The genus Pseudocalanus sp. has been generally considered as not food-limited because of their low food requirements for maximal ingestions rates, development, and maximum body size and sufficient ambient concentrations of phytoplankton (Paffenhöfer and Harris, 1976; Corkett and McLaren, 1978; Vidal, 1980a, b; Davis, 1984a; Ohman, 1985). But in the Baltic Sea, P. acuspes stages inhabiting deeper water layers are dependent on sinking algae, microzooplankton or detritus (Peters et al., 2006; Möller et al., 2012), which can strongly decrease after the degradation of the spring bloom (van Beusekom et al., 2009). This could negatively affect summer C13 abundances but also the overwintering stages. A negative top–down control is mainly exerted on C45 abundances in summer, when the estimated total predation of sprat is highest (Arrhenius and Hansson, 1993) with larval and young-of-the-year sprat feeding greatly on older P. acuspes stages (Dickmann et al., 2007). In spring, when sprat recruitment starts to peak (Karasiova, 2002), first-feeding larvae select particularly nauplii stages (Voss et al., 2003), which could explain the negative predation effect found for nauplii.
Cumulative Effects of Multiple Stressors
Predicting cumulative effects is challenging due to potential higher order interactions, but is key to devising appropriate management and conservation strategies under multiple changing stressors. The magnitude of climate and human impacts on the total size of a population can be attributed to a combination of the stressors’ effect size on individual stages, the level of exposure of the stages to the stressor, the interaction type between stressors and cascading effects between life-stages. The complex interplay of changes in abiotic and biotic ecosystem components can act multiplicatively on animal’s population dynamics, e.g., leading to an increase or decrease of the population or generating stable limit cycles (Shimada and Tuda, 1996). Identifying the type of interaction when both stressors operate in the same direction is generally much more straightforward than studying opposing individual effects (Piggott et al., 2015). More so, if the response curve for a stressor is a bell-shaped curve as in the typical thermal performance curve (Schulte, 2015) found also in our study, the effect direction might even be not constant. By applying an integrated life cycle modeling framework for P. acuspes, we revealed that population responses to stressors that act on distinct life stages are mitigated through density effects, particularly during the overwintering and maturation phase. Density-dependence is generally considered as a mechanism stabilizing animal population dynamics (Sinclair and Pech, 1996; Bjørnstad and Grenfell, 2001). The importance of density-dependence in population dynamics has been controversially debated for decades (Nicholson, 1933; Andrewartha and Birch, 1954), and only recently its role in zooplankton long-term dynamics has been acknowledged. Ohman et al. (2002) and Plourde et al. (2009) observed that mortality rates of eggs and nauplii of Calanus finmarchicus depended on the number of females during the growth period. Cannibalism and food supply are generally major sources for density-dependence in zooplankton, although both mechanisms are not well investigated for P. acuspes in the Baltic Sea.
Although density dependence has been shown to govern population responses to multiple effects (Hodgson et al., 2017), we did not find strong amplifications of the positive and negative dampening effect across life stages in our multi-stressor simulations. In fact, additive interactions were more prevalent than non-additive interactions when changing two stressors suggesting that stressors are operating independently of each other. Despite growing evidence for the importance of non-additive interactions between multiple stressors (e.g., Folt et al., 1999; Crain et al., 2008; Darling and Côté, 2008; Piggott et al., 2015; Fu et al., 2018) additive effects are still the dominant interaction mode on the individual and population level (see review in Côté et al., 2016). But when changing more than two stressors in our simulations interactions tended toward negative synergism and positive dampening effects. An explanation for this could be the cumulative effect on the same life stage. Impacts of two stressors are more likely to directly affect life stages such as in the case of temperature (affecting younger copepodites) and salinity (affecting older copepodites and females). In contrast, when changing manageable stressors altogether to mitigate the salinity decrease, nauplii in spring and older copepodite in summer were affected by two or three stressors directly leading to a slightly stronger decline than expected under additive effects. Thus, stressors acting at different life stages or asynchronously may be additive, while those acting jointly at the same stage may be synergistic. Similarly, Fu et al. (2018) found a relatively high risk of negative synergism for lower trophic levels in a multi-model simulation across regional seas. As a consequence, increases of predation pressure under low primary productivity would cause larger than expected biomass declines.
Implications for Management Under Climate Change
Cumulative effects assessments have become an integral part of environmental impact assessments. Stage resolved population models offer a key tool for providing a mechanistic understanding of the impacts of multiple stressors and help predict future responses under changing human impacts. Simulations based on these models have the advantage to assess a broad range of potential scenarios and to explore possibilities in ecosystems with important uncertainties rather than to predict a unique future (Carpenter, 2002). Projections have gained increasing appreciation in recent years, particularly in conservation science and the decision-making process with a focus on socio-ecological scenarios (Tansey et al., 2002; Bohensky et al., 2006; Langmead et al., 2009). Our model simulations show that P. acuspes will most certainly decline under a potential freshening of the Baltic Sea and increasing temperatures, which is conditional on the extent of the assumed climate change (BACC II Author Team, 2015). A reduction in salinity conditions is likely to cause shifts in other marine species living at their physiological limits in the Central Baltic Sea (Vuorinen et al., 2015). Recent projections of water temperature based on dynamical downscaling of global model results using regional climate models show all an increase in time as a direct consequence of the increase in air temperature, which could be nearly twice as high under the RCP8.5 scenario (Saraiva et al., 2019). In terms of salinity projections, however, the differences between RCP 4.5 and RCP 8.5 are much smaller. Instead, the greatest differences were found between the individual climate models ranging from >25% to no salinity change until the end of the century. Given this high uncertainty in future salinity conditions, any long-term projection of P. acuspes is consequently difficult to make.
In the case of this Baltic key species, the observed prevalence of additive effects suggest that stressors are largely operating independently of each other, so mitigation of any of the individual stressors will yield predictable benefits. At the same time, the effectiveness of management strategies targeting eutrophication and commercial fish stocks depends highly on the climate development, due to the strong influence of temperature and salinity on P. acuspes. To mitigate the negative effect of the projected temperature and salinity changes on this key species, oxygen and phosphate concentrations would need to increase substantially while predation pressure would need to lessen by 50%. The implementation of the nutrient load abatement strategy under the Baltic Sea Action Plan is indeed expected to counteract the decrease in mean oxygen concentrations caused by increasing water temperature, but not to levels > 50% (Saraiva et al., 2019). At the same time, phosphate concentrations will rather be reduced under this strategy. A decrease in the sprat stock size is also not expected in the near future under the EU multiannual plan for Baltic cod, herring and sprat and the fisheries exploiting those stock (ICES, 2019), rather the opposite. Similarly, long-term projections of sprat under nutrient load reductions and reduced cod fishing mortality show a consistent stock size over the next decades. As a consequence, the planned management strategies do not necessarily benefit P. acuspes. Potential cascading effects in the ecosystem structure and functioning and ultimately ecosystem services could be extensive and underpin the importance of an ecosystem approach to management.
Our modeling approach demonstrates that zooplankton has the hitherto unused potential as an integrative indicator of ecosystem change under multiple global change drivers (i.e., climate, fisheries, eutrophication). Furthermore, our results provide a general framework for investigating how population consequences will be magnified or dampened under multiple stressors. For instance, management strategies to counteract climate-related stressors might be more successful and particularly more predictable when targeting life stages not affected by climate. Moving forward, there is a growing opportunity for using population modeling in cumulative effects assessments. Our modeling framework offers a simple tool for any species with a discrete life cycle to explore stressor interactions and the safe operating space under future climate change.
Data Availability Statement
The datasets generated for this study are available on request to the corresponding author.
Author Contributions
SO and CM conceived the original idea. SO, TB, and CM designed the research. SO, SN, MT, BM-K, and GR prepared the data. SO analyzed the data. SO led the writing with contributions from all co-authors.
Funding
This study is a contribution to the BONUS AMBER project supported by BONUS (Art 185). SO received financial support from Stockholm University’s Strategic Marine Environmental Research Funds through the Baltic Ecosystem Adaptive Management Program (BEAM). SO, TB, MT, BM-K, SN, and CM were partially financed by the BONUS BLUEWEBS project supported by BONUS (Art 185); BM-K and MT received support from EU Horizon 2020 project ClimeFish (grant agreement 677039).
Conflict of Interest
The authors declare that the research was conducted in the absence of any commercial or financial relationships that could be construed as a potential conflict of interest.
Acknowledgments
We are grateful to the colleagues from the Department of Fish Resources Research, Institute of Food Safety, Animal Health and Environment (BIOR) in Riga, Latvia, for maintaining this extensive long-term monitoring program and providing such detailed data on P. acuspes. We would like to thank the International Council of the Exploration of the Sea (ICES) for providing access to their comprehensive oceanographic database. Moreover, we acknowledge that this manuscript is an expansion of SO’s Ph.D. thesis.
Supplementary Material
The Supplementary Material for this article can be found online at: https://www.frontiersin.org/articles/10.3389/fmars.2020.00296/full#supplementary-material
Footnotes
References
Akaike, H. (1973). “Information theory and an extension of the maximum likelihood principle,” in Second International Symposium on Information Theory, eds B. N. Petrov and F. Csaki (Budapest: Akademiai Kiado), 267–281.
Albouy, C., Archambault, P., Appeltans, W., Araújo, M. B., Beauchesne, D., Cazelles, K., et al. (2019). The marine fish food web is globally connected. Nat. Ecol. Evol. 3, 1153–1161. doi: 10.1038/s41559-019-0950-y
Andrewartha, H. G., and Birch, L. C. (1954). The Distribution And Abundance Of Animals. Chicago: University Chicago Press.
Arrhenius, F., and Hansson, S. (1993). Food-consumption of larval, young and adult herring and sprat in the Baltic Sea. Mar. Ecol. Prog. Ser. 96, 125–137.
BACC II Author Team (2015). Second Assessment of Climate Change for the Baltic Sea Basin. Cham: Springer.
Barbraud, C., Rivalan, P., Inchausti, P., Nevoux, M., Rolland, V., and Weimerskirch, H. (2011). Contrasted demographic responses facing future climate change in Southern Ocean seabirds. J. Anim. Ecol. 80, 89–100. doi: 10.1111/j.1365-2656.2010.01752.x
Beare, D. J., Batten, S., Edwards, M., and Reid, D. G. (2002). Prevalence of boreal Atlantic, temperate Atlantic and neritic zooplankton in the North Sea between 1958 and 1998 in relation to temperature, salinity, stratification intensity and Atlantic inflow. J. Sea Res. 48, 29–49.
Beaugrand, G. (2003). Long-term changes in copepod abundance and diversity in the north-east Atlantic in relation to fluctuations in the hydroclimatic environment. Fish. Oceanogr. 12, 270–283.
Beaugrand, G. (2005). Monitoring pelagic ecosystems using plankton indicators. ICES J. Mar. Sci. 62, 333–338.
Beaugrand, G., Conversi, A., Atkinson, A., Cloern, J., Chiba, S., Fonda-Umani, S., et al. (2019). Prediction of unprecedented biological shifts in the global ocean. Nat. Clim. Change 9, 237–243.
Becks, L., and Arndt, H. (2013). Different types of synchrony in chaotic and cyclic communities. Nat. Comm. 4:1359. doi: 10.1038/ncomms2355
Bernreuther, M., Peters, J., Möllmann, C., Renz, J., Dutz, J., Herrmann, J. P., et al. (2018). Trophic decoupling of mesozooplankton production and the pelagic planktivores sprat Sprattus sprattus and herring Clupea harengus in the Central Baltic Sea. Mar. Ecol. Prog. Ser. 592, 181–196.
Bjørnstad, O. N., and Grenfell, B. T. (2001). Noisy clockwork: time series analysis of population fluctuations in animals. Science 293, 638–643. doi: 10.1126/science.1062226
Blenckner, T., Llope, M., Möllmann, C., Voss, R., Quaas, M. F., Casini, M., et al. (2015). Climate and fishing steer ecosystem regeneration to uncertain economic futures. Proc. R. Soc. B Biol. Sci. 282:20142809. doi: 10.1098/rspb.2014.2809
Bohensky, E. L., Reyers, B., and Van Jaarsveld, A. S. (2006). Future ecosystem services in a southern african river basin: a scenario planning approach to uncertainty. Conserv. Biol. 20, 1051–1061. doi: 10.1111/j.1523-1739.2006.00475.x
Brown, J. H., Gillooly, J. F., Allen, A. P., Savage, V. M., and West, G. B. (2004). Toward a metabolic theory of ecology. Ecology 85, 1771–1789.
Carlotti, F., Giske, J., and Werner, F. (2000). “Modeling zooplankton dynamics,” in ICES Zooplankton Methodology Manual, eds R. Harris, P. Wiebe, J. Lenz, H. R. Skjoldal, and M. Huntley (San Diego: Academic Press), 571–667.
Carpenter, S. R. (2002). Ecological futures: building an ecology of the long now. Ecology 83, 2069–2083.
Casini, M., Lövgren, J., Hjelm, J., Cardinale, M., Molinero, J.-C., and Kornilovs, G. (2008). Multi-level trophic cascades in a heavily exploited open marine ecosystem. Proc. R. Soc. B Biol. Sci. 275, 1793–1801. doi: 10.1098/rspb.2007.1752
Caswell, H. (2001). Matrix Population Models: Construction, Analysis, And Interpretation. Sunderland, MA: Sinauer Associates, Inc.
Catalán, I. A., Auch, D., Kamermans, P., Morales-Nin, B., Angelopoulos, N. V., Reglero, P., et al. (2019). Critically examining the knowledge base required to mechanistically project climate impacts: a case study of Europe’s fish and shellfish. Fish Fish. 20, 501–517.
Cheung, W. W. L., Dunne, J., Sarmiento, J. L., and Pauly, D. (2011). Integrating ecophysiology and plankton dynamics into projected maximum fisheries catch potential under climate change in the Northeast Atlantic. ICES J. Mar. Sci. 68, 1008–1018.
Conversi, A., Umani, S. F., Peluso, T., Molinero, J. C., Santojanni, A., and Edwards, M. (2010). The mediterranean sea regime shift at the end of the 1980s, and intriguing parallelisms with other european basins. PLoS One 5:33. doi: 10.1371/journal.pone.0010633
Côté, I. M., Darling, E., and Brown, C. J. (2016). Interactions among ecosystem stressors and their importance in conservation. Proc. R. Soc. B Biol. Sci. 283:20152592. doi: 10.1098/rspb.2015.2592
Coulson, T., Catchpole, E. A., Albon, S. D., Morgan, B. J. T., Pemberton, J. M., Clutton-Brock, T. H., et al. (2001). Age, sex, density, winter weather, and population crashes in soay sheep. Science 292, 1528–1531. doi: 10.1126/science.292.5521.1528
Cowen, R. K., and Sponaugle, S. (2009). larval dispersal and marine population connectivity. Annu. Rev. Mar. Sci. 1, 443–466. doi: 10.1146/annurev.marine.010908.163757
Crain, C., Kroeker, K., and Halpern, B. (2008). Interactive and cumulative effects of multiple stressors in marine systems. Ecol. Lett. 11, 1304–1315. doi: 10.1111/j.1461-0248.2008.01253.x
Darling, E., and Côté, M. I. (2008). Quantifying the evidence for ecological synergies. Ecol. Lett. 11, 1278–1286. doi: 10.1111/j.1461-0248.2008.01243.x
Daskalov, G. M., Grishin, A. N., Rodionov, S., and Mihneva, V. (2007). Trophic cascades triggered by overfishing reveal possible mechanisms of ecosystem regime shifts. Proc. Natl. Acad. Sci. U.S.A. 104, 10518–10523. doi: 10.1073/pnas.0701100104
Davis, C. S. (1984a). Food concentrations on Georges Bank - non-limiting effect on development and survival of laboratory reared Pseudocalanus sp. and Paracalanus parvus (Copepoda, Calanoida). Mar. Biol. 82, 41–46.
Davis, C. S. (1984b). Interaction of a copepod population with the mean circulation on Georges Bank. J. Mar. Res. 42, 573–590.
DeMaster, D. P., Fowler, C. W., Perry, S. L., and Richlen, M. E. (2001). Predation and competition: the impact of fisheries on marine-mammal populations over the next one hundred years. J. Mammal. 82, 641–651.
Dickmann, M., Möllmann, C., and Voss, R. (2007). Feeding ecology of Central Baltic sprat Sprattus sprattus larvae in relation to zooplankton dynamics: implications for survival. Mar. Ecol. Prog. Ser. 342, 277–289.
Dietze, M. C., Fox, A., Beck-Johnson, L. M., Betancourt, J. L., Hooten, M. B., Jarnevich, C. S., et al. (2018). Iterative near-term ecological forecasting: needs, opportunities, and challenges. Proc. Nat. Ac. Sci. U.S.A. 115, 1424–1432. doi: 10.1073/pnas.1710231115
Dippner, J. W., Kornilovs, G., and Sidrevics, L. (2000). Long-term variability of mesozooplankton in the Central Baltic Sea. J. Mar. Sys. 25, 23–31.
Dybala, K. E., Eadie, J. M., Gardali, T., Seavy, N. E., and Herzog, M. P. (2013). Projecting demographic responses to climate change: adult and juvenile survival respond differently to direct and indirect effects of weather in a passerine population. Glob. Change Biol. 19, 2688–2697. doi: 10.1111/gcb.12228
Dzierzbicka-Glowacka, L. (2004). Growth and development of copepodite stages of Pseudocalanus spp. J. Plankton Res. 26, 49–60.
Dzierzbicka-Głowacka, L., Kalarus, M., Janecki, M., Musialik, M., Mudrak, S., and ñmijewska, M. I. (2013). Population dynamics of Pseudocalanus minutus elongatus in the Gulf of Gdansk (southern Baltic Sea) – experimental and numerical results. J. Nat. Hist. 47, 715–738.
Eero, M. (2012). Reconstructing the population dynamics of sprat (Sprattus sprattus balticus) in the Baltic Sea in the 20th century. ICES J. Mar. Sci. 69, 1010–1018.
Eero, M., Andersson, H. C., Almroth-Rosell, E., and MacKenzie, B. R. (2016). Has eutrophication promoted forage fish production in the Baltic Sea? Ambio 45, 649–660. doi: 10.1007/s13280-016-0788-3
Fennel, W. (2001). Modeling of copepods with links to circulation models. J. Plankton Res. 23, 1217–1232.
Fennel, W., and Neumann, T. (2003). Variability of copepods as seen in a coupled physical biological model of the Baltic Sea. ICES Mar. Sci. Symp. 219, 208–219.
Folt, C. L., Chen, C. Y., Moore, M. V., and Burnaford, J. (1999). Synergism and antagonism among multiple stressors. Limnol. Oceanogr. 44, 864–877.
Frank, K. T., Petrie, B., and Shackell, N. L. (2007). The ups and downs of trophic control in continental shelf ecosystems. Trends Ecol. Evol. 22, 236–242. doi: 10.1016/j.tree.2007.03.002
Fu, C. H., Travers-Trolet, M., Velez, L., Gruss, A., Bundy, A., Shannon, L. J., et al. (2018). Risky business: The combined effects of fishing and changes in primary productivity on fish communities. Ecol. Model. 368, 265–276.
Gislason, A., Petursdottir, H., Astthorsson, O. S., Gudmundsson, K., and Valdimarsson, H. (2009). Inter-annual variability in abundance and community structure of zooplankton south and north of Iceland in relation to environmental conditions in spring 1990-2007. J. Plankton Res. 31, 541–551.
Goberville, E., Beaugrand, G., and Edwards, M. (2014). Synchronous response of marine plankton ecosystems to climate in the Northeast Atlantic and the North Sea. J. Mar. Sys. 129, 189–202.
Grabbert, S., Renz, J., Hirche, H. J., and Bucklin, A. (2010). Species-specific PCR discrimination of species of the calanoid copepod Pseudocalanus, P. acuspes and P. elongatus, in the Baltic and North Seas. Hydrobiologia 652, 289–297.
Greene, C. H., and Pershing, A. J. (2000). The response of Calanus finmarchicus populations to climate variability in the Northwest Atlantic: basin-scale forcing associated with the North Atlantic Oscillation. ICES J. Mar. Sci. 57, 1536–1544.
Guisan, A., and Thuiller, W. (2005). Predicting species distribution: offering more than simple habitat models. Ecol. Lett. 8, 993–1009.
Halpern, B., and Fujita, R. (2013). Assumptions, challenges, and future directions in cumulative impact analysis. ESA 4, 1–11.
Halpern, B. S., Frazier, M., Afflerbach, J., Lowndes, J. S., Micheli, F., O’Hara, C., et al. (2019). Recent pace of change in human impact on the world’s ocean. Sci. Rep. 9:11609. doi: 10.1038/s41598-019-47201-9
Hansen, F. C., Möllmann, C., Schutz, U., and Neumann, T. (2006). Spatio-temporal distribution and production of calanoid copepods in the central Baltic Sea. J. Plankton Res. 28, 39–54.
Hare, S. R., and Mantua, N. J. (2000). Empirical evidence for North Pacific regime shifts in 1977 and 1989. Prog. Oceanogr. 47, 103–145.
Hastie, T. J., and Tibshirani, R. J. (1990). Generalized Additive Models. Boca Raton: Chapman & Hall.
Helaouët, P., Beaugrand, G., and Reid, P. C. (2011). Macrophysiology of Calanus finmarchicus in the North Atlantic Ocean. Prog. Oceanogr. 91, 217–228.
Hirst, A. G., and Bunker, A. J. (2003). Growth of marine planktonic copepods: global rates and patterns in relation to chlorophyll a, temperature, and body weight. Limnol. Oceanogr. 48, 1988–2010.
Hodgson, E. E., Essington, T. E., and Halpern, B. S. (2017). Density dependence governs when population responses to multiple stressors are magnified or mitigated. Ecology 98, 2673–2683. doi: 10.1002/ecy.1961
Holmborn, T., Goetze, E., Pollupuu, M., and Pollumae, A. (2011). Genetic species identification and low genetic diversity in Pseudocalanus acuspes of the Baltic Sea. J. Plankton Res. 33, 507–515.
Hooper, D. U., Chapin, F. S., Ewel, J. J., Hector, A., Inchausti, P., Lavorel, S., et al. (2005). Effects of biodiversity on ecosystem functioning: a consensus of current knowledge. Ecol. Monogr. 75, 3–35.
ICES (2019). Sprat (Sprattus sprattus) in Subdivisions 22–32 (Baltic Sea). Report of the ICES Advisory Committee, 2019. Denmark: ICES.
IPCC (2014). “Climate change 2014: synthesis report,” in Contribution of Working Groups I, II and III to the Fifth Assessment Report of the Intergovernmental Panel on Climate Change, eds R. K. Pachauri and L. A. Meyer (Geneva: IPCC).
Jackson, M. C., Loewen, C. J. G., Vinebrooke, R. D., and Chimimba, C. T. (2016). Net effects of multiple stressors in freshwater ecosystems: a meta-analysis. Glob. Change Biol. 22, 180–189. doi: 10.1111/gcb.13028
James, G., Witten, D., Hastie, T., and Tibshirani, R. (2013). An Introduction to Statistical Learning - with Applications in R. New York, NY: Springer.
Jang, C. J., Park, J., Park, T., and Yoo, S. (2011). Response of the ocean mixed layer depth to global warming and its impact on primary production: a case for the North Pacific Ocean. ICES J. Mar. Sci. 68, 996–1007.
Jaspers, C., Moller, L. F., and Kiorboe, T. (2011). Salinity gradient of the baltic sea limits the reproduction and population expansion of the newly invaded comb jelly Mnemiopsis leidyi. PLoS One 6:24065. doi: 10.1371/journal.pone.0024065
Jouffray, J.-B., Nyström, M., Norström, A. V., Williams, I. D., Wedding, L. M., Kittinger, J. N., et al. (2015). Identifying multiple coral reef regimes and their drivers across the Hawaiian archipelago. Phil. Trans. R. Soc. B 370:20130268.
Jurgensone, I., Carstensen, J., Ikauniece, A., and Kalveka, B. (2011). Long-term changes and controlling factors of phytoplankton community in the gulf of riga (Baltic Sea). Estuaries Coasts 34:1205.
Kadin, M., Blenckner, T., Casini, M., Gårdmark, A., Torres, M. A., and Otto, S. A. (2019). Trophic interactions, management trade-offs and climate change: the need for adaptive thresholds to operationalize ecosystem indicators. Front. Mar. Sci. 6:249. doi: 10.3389/fmars.2019.00249
Karasiova, E. (2002). Variability of sprat peak spawning and larvae appearance timing in the southeastern Baltic Sea during the past six decades. Bull. Sea Fish. Inst. 156, 57–67.
Kingsolver, J. G., Woods, H. A., Buckley, L. B., Potter, K. A., MacLean, H. J., and Higgins, J. K. (2011). Complex life cycles and the responses of insects to climate change. Integr. Comp. Biol. 51, 719–732. doi: 10.1093/icb/icr015
Korpinen, S., and Andersen, J. H. (2016). A global review of cumulative pressure and impact assessments in marine environments. Front. Mar. Sci. 3:153. doi: 10.3389/fmars.2016.00153
Lade, S. J., Niiranen, S., Hentati-Sundberg, J., Blenckner, T., Boonstra, W. J., Orach, K., et al. (2015). An empirical model of the Baltic Sea reveals the importance of social dynamics for ecological regime shifts. Proc. Nat. Ac. Sci. U.S.A. 112, 11120–11125. doi: 10.1073/pnas.1504954112
Langmead, O., McQuatters-Gollop, A., Mee, L. D., Friedrich, J., Gilbert, A. J., Gomoiu, M. T., et al. (2009). Recovery or decline of the northwestern Black Sea: a societal choice revealed by socio-ecological modeling. Ecol. Model. 220, 2927–2939.
Leslie, P. H. (1945). On the use of matrices in certain population mathematics. Biometrika 33, 183–212. doi: 10.1093/biomet/33.3.183
Lindegren, M., Möllmann, C., Nielsen, A., Brander, K., MacKenzie, B. R., and Stenseth, N. C. (2010). Ecological forecasting under climate change: the case of Baltic cod. Proc. R. Soc. B Biol. Sci. 277, 2121–2130. doi: 10.1098/rspb.2010.0353
Litchman, E., Klausmeier, C. A., Miller, J. R., Schofield, O. M., and Falkowski, P. G. (2006). Multi-nutrient, multi-group model of present and future oceanic phytoplankton communities. Biogeosciences 3, 585–606.
Llopiz, J. K. (2013). Latitudinal and taxonomic patterns in the feeding ecologies of fish larvae: a literature synthesis. J. Mar. Syst. 10, 69–77.
Maar, M., Moller, E. F., Gurkan, Z., Jonasdottir, S. H., and Nielsen, T. G. (2013). Sensitivity of Calanus spp. copepods to environmental changes in the North Sea using life-stage structured models. Prog. Oceanogr. 111, 24–37.
Miller, C. B., and Tande, K. S. (1993). Stage duration estimation for Calanus populations, a modeling study. Mar. Ecol. Prog. Ser. 102, 15–34.
Molinero, J.-C., Ibanez, F., Nival, P., Buecher, E., and Souissi, S. (2005). North Atlantic climate and northwestern Mediterranean plankton variability. Limnol. Oceanogr. 50, 1213–1220.
Möller, K. O., Schmidt, J. O., John, M. S., Temming, A., Diekmann, R., Peters, J., et al. (2015). Effects of climate-induced habitat changes on a key zooplankton species. J. Plankton Res. 37, 530–541.
Möller, K. O., St John, M. A., Temming, A., Floter, J., Sell, A. F., Herrmann, J. P., et al. (2012). Marine snow, zooplankton and thin layers: indications of a trophic link from small-scale sampling with the video plankton recorder. Mar. Ecol. Prog. Ser. 468, 57–69.
Möllmann, C., Diekmann, R., Müller-Karulis, B., Kornilovs, G., Plikshs, M., and Axe, P. (2009). Reorganization of a large marine ecosystem due to atmospheric and anthropogenic pressure: a discontinuous regime shift in the Central Baltic Sea. Glob. Change Biol. 15, 1377–1393.
Möllmann, C., Kornilovs, G., Fetter, M., Köster, F. W., and Hinrichsen, H. H. (2003). The marine copepod, Pseudocalanus elongatus, as a mediator between climate variability and fisheries in the Central Baltic Sea. Fish. Oceanogr. 12, 360–368.
Möllmann, C., Kornilovs, G., Fetters, M., and Köster, F. W. (2004). Feeding ecology of central Baltic Sea herring and sprat. J. Fish Biol. 65, 1563–1581.
Möllmann, C., Kornilovs, G., and Sidrevics, L. (2000). Long-term dynamics of main mesozooplankton species in the central Baltic Sea. J. Plankton Res. 22, 2015–2038.
Möllmann, C., and Köster, F. W. (2002). Population dynamics of calanoid copepods and the implications of their predation by clupeid fish in the Central Baltic Sea. J. Plankton Res. 24, 959–977.
Niiranen, S., Yletyinen, J., Tomczak, M. T., Blenckner, T., Hjerne, O., MacKenzie, B. R., et al. (2013). Combined effects of global climate change and regional ecosystem drivers on an exploited marine food web. Glob. Change Biol. 19, 3327–3342. doi: 10.1111/gcb.12309
Ohman, M. D. (1985). Resource-satiated population growth of the copepod Pseudocalanus sp. Arch. Hydrobiol. Beih. Ergebn. Limnol. 21, 15–32.
Ohman, M. D., Runge, J. A., Durbin, E. G., Field, D. B., and Niehoff, B. (2002). On birth and death in the sea. Hydrobiologia 480, 55–68.
Otto, S. A. (2012). Long-Term Population Dynamics Of Key Copepods Under Climate And Food Web Changes: The Baltic Sea As A Case Study. Ph. D. Dissertation, University of Hamburg, Hamburg.
Otto, S. A., Diekmann, R., Flinkman, J., Kornilovs, G., and Möllmann, C. (2014a). Habitat heterogeneity determines climate impact on zooplankton community structure and dynamics. PLoS One 9:e90875. doi: 10.1371/journal.pone.0090875
Otto, S. A., Kornilovs, G., Llope, M., and Möllmann, C. (2014b). Interactions among density, climate, and food web effects determine long-term life cycle dynamics of a key copepod. Mar. Ecol. Prog. Ser. 498, 73–84.
Pace, M. L., Cole, J. J., Carpenter, S. R., and Kitchell, J. F. (1999). Trophic cascades revealed in diverse ecosystems. Trends Ecol. Evol. 14, 483–488. doi: 10.1016/s0169-5347(99)01723-1
Paffenhöfer, G. A., and Harris, R. P. (1976). Feeding, growth and reproduction of marine planktonic copepod Pseudocalanus elongatus Boeck. J. Mar. Biol. Assoc. U.K. 56, 327–344.
Paine, R. T., Tegner, M. J., and Johnson, E. A. (1998). Compounded Perturbations Yield Ecological Surprises. Ecosystems 1, 535–545.
Peters, J., Renz, J., Beusekom, J., Boersma, M., and Hagen, W. (2006). Trophodynamics and seasonal cycle of the copepod Pseudocalanus acuspes in the Central Baltic Sea (Bornholm Basin): evidence from lipid composition. Mar. Biol. 149, 1417–1429.
Piggott, J. J., Townsend, C. R., and Matthaei, C. D. (2015). Reconceptualizing synergism and antagonism among multiple stressors. Ecol. Evo. 5, 1538–1547. doi: 10.1002/ece3.1465
Pinsky, M. L., Jensen, O. P., Ricard, D., and Palumbi, S. R. (2011). Unexpected patterns of fisheries collapse in the world’s oceans. Proc. Nat. Ac. Sci. U.S.A. 108:8317. doi: 10.1073/pnas.1015313108
Plourde, S., Pepin, P., and Head, E. J. H. (2009). Long-term seasonal and spatial patterns in mortality and survival of Calanus finmarchicus across the Atlantic Zone Monitoring programme region, Northwest Atlantic. ICES J. Mar. Sci. 66, 1942–1958.
Poloczanska, E. S., Hawkins, S. J., Southward, A. J., and Burrows, M. T. (2008). Modeling the response of populations of competing species to climate change. Ecology 89, 3138–3149. doi: 10.1890/07-1169.1
Power, M. E., Tilman, D., Estes, J. A., Menge, B. A., Bond, W. J., Mills, L. S., et al. (1996). Challenges in the quest for keystones. Bioscience 46, 609–620.
R Core Team (2018). R: A Language and Environment for Statistical Computing. Vienna: R Foundation for Statistical Computing.
Reid, P. C., Planque, B., and Edwards, M. (1998). Is observed variability in the long-term results of the continuous plankton recorder survey a response to climate change? Fish Oceanogr. 7, 282–288.
Renz, J., and Hirche, H.-J. (2006). Life cycle of Pseudocalanus acuspes giesbrecht (Copepoda, Calanoida) in the Central Baltic Sea: I. Seasonal and spatial distribution. Mar. Biol. 148, 567–580.
Renz, J., Peters, J., and Hirche, H.-J. (2007). Life cycle of Pseudocalanus acuspes giesbrecht (Copepoda, Calanoida) in the Central Baltic Sea: II. Reproduction, growth and secondary production. Mar. Biol. 151, 515–527.
Reygondeau, G., and Beaugrand, G. (2011). Future climate-driven shifts in distribution of Calanus finmarchicus. Glob. Change Biol. 17, 756–766.
Richardson, A. J. (2008). In hot water: zooplankton and climate change. ICES J. Mar. Sci. 65, 279–295.
Roemmich, D., and McGowan, J. (1995). Climatic warming and the decline of zooplankton in the California Current. Science 267, 1324–1326. doi: 10.1126/science.267.5202.1324
Ruel, J. J., and Ayres, M. P. (1999). Jensen’s inequality predicts effects of environmental variation. Trends Ecol. Evol. 14, 361–366. doi: 10.1016/s0169-5347(99)01664-x
Russell, B. D., Harley, C. D. G., Wernberg, T., Mieszkowska, N., Widdicombe, S., Hall-Spencer, J. M., et al. (2012). Predicting ecosystem shifts requires new approaches that integrate the effects of climate change across entire systems. Biol. Lett. 8, 164–166. doi: 10.1098/rsbl.2011.0779
Saraiva, S., Meier, H. E. M., Andersson, H., Höglund, A., Dieterich, C., Gröger, M., et al. (2019). Uncertainties in projections of the baltic sea ecosystem driven by an ensemble of global climate Models. Front. Earth Sci. 6:16. doi: 10.5194/esd-2018-16
Schulte, P. M. (2015). The effects of temperature on aerobic metabolism: towards a mechanistic understanding of the responses of ectotherms to a changing environment. J. Exp. Biol. 218:1856. doi: 10.1242/jeb.118851
Sguotti, C., Otto, S. A., Cormon, X., Werner, K. M., Deyle, E., Sugihara, G., et al. (2019a). Non-linearity in stock-recruitment relationships of Atlantic cod: insights from a multi-model approach. ICES J. Mar. Sci. fsz113. doi: 10.1093/icesjms/fsz113
Sguotti, C., Otto, S. A., Frelat, R., Langbehn, T. J., Ryberg, M. P., Lindegren, M., et al. (2019b). Catastrophic dynamics limit Atlantic cod recovery. Proc. R. Soc. B Biol. Sci. 286, 10. doi: 10.1098/rspb.2018.2877
Shimada, M., and Tuda, M. (1996). Delayed density dependence and oscillatory population dynamics in overlapping-generation systems of a seed beetle Callosobruchus chinensis: Matrix population model. Oecologia 105, 116–125. doi: 10.1007/BF00328799
Sinclair, A. R. E., and Pech, R. P. (1996). Density dependence, stochasticity, compensation and predator regulation. Oikos 75, 164–173.
Stephens, J. A., Jordan, M. B., Taylor, A. H., and Proctor, R. (1998). The effects of fluctuations in North Sea flows on zooplankton abundance. J. Plankton Res. 20, 943–956.
Tansey, J., Carmichael, J., VanWynsberghe, R., and Robinson, J. (2002). The future is not what it used to be: participatory integrated assessment in the Georgia Basin. Glob. Environ. Change Hum. Policy Dimens. 12, 97–104.
Taylor, A. H. (1995). North-South shifts of the Gulf Stream and their climatic connection with the abundance of zooplankton in the UK and its surrounding seas. ICES J. Mar. Sci. 52, 711–721.
Thrush, S. F., Hewitt, J. E., Dayton, P. K., Coco, G., Lohrer, A. M., Norkko, A., et al. (2009). Forecasting the limits of resilience: integrating empirical research with theory. Proc. R. Soc. B Biol. Sci. 276, 3209–3217. doi: 10.1098/rspb.2009.0661
Törnroos, A., Pecuchet, L., Olsson, J., Gårdmark, A., Blomqvist, M., Lindegren, M., et al. (2019). Four decades of functional community change reveals gradual trends and low interlinkage across trophic groups in a large marine ecosystem. Glob. Change Biol. 25, 1235–1246. doi: 10.1111/gcb.14552
Torres-Sorando, L. J., Zacarias, D., de Roa, E. Z., and Rodriguez, D. J. (2003). Population dynamics of Oithona hebes (Copepoda: Cyclopoida) in a coastal estuarine lagoon of Venezuela: a stage-dependent matrix growth model. Ecol. Model. 161, 159–168.
Turchin, P. (2003). Complex Population Dynamics - A Theoretical/Empirical Synthesis. Princeton: Princeton University Press.
Turner, J. T. (2004). The importance of small planktonic copepods and their roles in pelagic marine food webs. Zool. Stud. 43, 255–266.
Twombly, S., Wang, G. M., and Hobbs, N. T. (2007). Composite forces shape population dynamics of copepod crustaceans. Ecology 88, 658–670. doi: 10.1890/06-0423
van Beusekom, J. E. E., Mengedoht, D., Augustin, C. B., Schilling, M., and Boersma, M. (2009). Phytoplankton, protozooplankton and nutrient dynamics in the Bornholm Basin (Baltic Sea) in 2002-2003 during the German GLOBEC Project. Int. J. Earth Sci. 98, 251–260.
Verity, P. G., and Smetacek, V. (1996). Organism life cycles, predation, and the structure of marine pelagic ecosystems. Mar. Ecol. Prog. Ser. 130, 277–293.
Vidal, J. (1980a). Physioecology of Zooplankton.1. Effects of Phytoplankton Concentration, Temperature, and Body Size on the Growth Rate of Calanus pacificus Pseudocalanus sp. Mar. Biol. 56, 111–134.
Vidal, J. (1980b). Physioecology of zooplankton.2. Effects of phytoplankton concentration, temperature, and body size on the development and molting rates of Calanus pacificus and Pseudocalanus sp. Mar. Biol. 56, 135–146.
Voss, R., Köster, F. W., and Dickmann, M. (2003). Comparing the feeding habits of co-occurring sprat (Sprattus sprattus) and cod (Gadus morhua) larvae in the Bornholm Basin, Baltic Sea. Fish Res. 63, 97–111.
Vuorinen, I., Hänninen, J., Rajasilta, M., Laine, P., Eklund, J., Montesino-Pouzols, F., et al. (2015). Scenario simulations of future salinity and ecological consequences in the Baltic Sea and adjacent North Sea areas–implications for environmental monitoring. Ecol. Indic. 50, 196–205. doi: 10.1016/j.ecolind.2014.10.019
Winne, C. T., and Keck, M. B. (2005). Intraspecific differences in thermal tolerance of the diamondback watersnake (Nerodia rhombifer): effects of ontogeny, latitude, and sex. Comp. Biochem. Physiol. A Mol. Integr. Physiol. 140, 141–149. doi: 10.1016/j.cbpb.2004.11.009
Keywords: Pseudocalanus acuspes, Baltic Sea, stochastic life cycle model, polynomial regression, cumulative and cascading effects, model simulations, density dependence, vulnerable life stage
Citation: Otto SA, Niiranen S, Blenckner T, Tomczak MT, Müller-Karulis B, Rubene G and Möllmann C (2020) Life Cycle Dynamics of a Key Marine Species Under Multiple Stressors. Front. Mar. Sci. 7:296. doi: 10.3389/fmars.2020.00296
Received: 16 October 2019; Accepted: 14 April 2020;
Published: 15 May 2020.
Edited by:
Susana Agusti, King Abdullah University of Science and Technology, Saudi ArabiaReviewed by:
Rene Friedland, Joint Research Centre, ItalySamuli Korpinen, Finnish Environment Institute, Finland
Copyright © 2020 Otto, Niiranen, Blenckner, Tomczak, Müller-Karulis, Rubene and Möllmann. This is an open-access article distributed under the terms of the Creative Commons Attribution License (CC BY). The use, distribution or reproduction in other forums is permitted, provided the original author(s) and the copyright owner(s) are credited and that the original publication in this journal is cited, in accordance with accepted academic practice. No use, distribution or reproduction is permitted which does not comply with these terms.
*Correspondence: Saskia A. Otto, c2Fza2lhLm90dG9AdW5pLWhhbWJ1cmcuZGU=