 John H. R. Burns1
 Grady Weyenberg2*
 Travis Mandel3
 Sofia B. Ferreira1
 Drew Gotshalk3Chad K. Kinoshita3Micah J. Marshall2Nicholas A. V. Del Moral3Shane J. Murphy1Kailey H. Pascoe1Alexandra Runyan1
 Alexander J. Spengler1Brittany D. Wells1Danielle K. Wilde1Roberto Pelayo2†
- 1Marine Science, University of Hawaii at Hilo, Hilo, HI, United States
- 2Mathematics, University of Hawaii at Hilo, Hilo, HI, United States
- 3Computer Science and Engineering, University of Hawaii at Hilo, Hilo, HI, United States
The prevalence of coral disease is steadily increasing throughout the global ocean, and there is a growing need for efficient methods for detecting and monitoring coral health. At present, coral health assessments are primarily conducted using in-situ surveys, which record visual observations of disease in the field. Recent technological advancements allow researchers to instead collect high-resolution imagery of benthic habitats, and these images can be used in conjunction with digital tools to assess the health of coral colonies at a later time. However, little is known about the relative efficacy or diagnostic accuracy of these two approaches. This study contrasts the diagnostic accuracy of in-situ and digital methodologies for detecting diseases and adverse health conditions affecting corals. Multiple 1 m2 plots are surveyed on coral reefs located on both the windward and leeward side of Hawaii Island. For each plot, an in-situ visual analysis of coral health is conducted by a diver and images are collected and rendered into a high-resolution orthomosaic for subsequent digital analysis. Both methods assess the same coral colonies, resulting in paired health diagnoses for multiple health conditions. Lacking a gold-standard diagnosis of health conditions, a latent class model is used to estimate the sensitivity (true positive rate) and specificity (true negative rate) of both methods. We find that in-situ assessments of coral health have a higher sensitivity and lower specificity in detecting health conditions when compared to digital analyses based on orthomosaics. However, the effect size is relatively modest, indicating that while the in-situ method provides a more sensitive diagnostic approach, the techniques are of comparable accuracy, and should both be considered viable methods of characterizing and monitoring coral health.
1. Introduction
Disease is a serious threat to coral reefs worldwide and is a major cause of coral reef deterioration (Aeby et al., 2011; Obura et al., 2019). Increasing levels of anthropogenic stressors such as pollution, eutrophication, sedimentation, and recreational overuse in near-shore environments are detrimentally affecting the health and function of coral reef ecosystems (Harvell et al., 2007), and global stressors such as climate change are increasing the frequency of large-scale mortality associated with disease outbreaks and mass coral bleaching events (Hoegh-Guldberg et al., 2007; Ward et al., 2007). As global and local stressors affecting coral reefs are predicted to intensify, researchers and managers will need to implement effective monitoring strategies to characterize and track changes in coral health.
In-situ visual benthic surveys are currently the standard approach for characterizing coral communities (Raymundo et al., 2008; Page et al., 2017; Obura et al., 2019). In-situ surveys do not require complex technological equipment, but they do feature considerable logistic constraints. In particular, in-situ surveys require substantial underwater observation time by specialists certified to conduct scientific diving and trained in identification of corals and their diseases and adverse health conditions. Surveys of deep reefs or large spatial areas present major challenges due to the limitations associated with SCUBA diving (Raymundo et al., 2008; Rosenberg and Loya, 2013).
Various recent technological advancements have dramatically lowered the costs associated with collecting high-resolution imagery of benthic habitats, while also increasing the speed at which these images can be collected and processed. Furthermore, improvements in computing power, algorithms, and camera resolution have enabled wide-spread use of Structure-from-Motion (SfM) photogrammetry. SfM techniques use overlapping image sequences from traditional 2D cameras to estimate 3D structure, enabling users to create accurate and highly detailed (<1 cm resolution) 3D models without the need for specialized stereo imaging equipment. The resulting 3D models and orthomosaics can then be processed in various ways to characterize marine benthic communities (Burns et al., 2015; Ferrari et al., 2016; Fukunaga et al., 2019).
Terrestrial and marine studies have validated the accuracy and efficacy of the SfM approach for creating spatially accurate habitat maps (Javernick et al., 2014; Lavy et al., 2014; Figueira et al., 2015; Burns et al., 2016; Magel et al., 2019). SfM surveys can be conducted rapidly in the field and require less specialized training, which enables scientists to study coral communities at much larger spatial scales and deeper depths than are feasible using conventional visual surveys. These methods also have the potential for the photo surveys to be carried out by autonomous or remotely-operated underwater vehicles, greatly reducing logistical difficulties associated with surveying underwater habitats (Palma et al., 2017; Parsons et al., 2018; Bayley and Mogg, 2019; Obura et al., 2019).
As monitoring programs begin adopting these new technologies and methods, there is a need for statistical comparisons of surveys conducted using conventional visual assessments (hereafter: “in-situ”) to those based on photography, orthomosaics, and 3D models (hereafter: “digital”). Both in-situ and digital health assessments may be expected to produce imperfect diagnoses of health conditions affecting a coral colony: in-situ visual surveys are impacted by difficulties inherent to working in underwater environments, while digital computer-based surveys are limited by resolution and restricted visual perspective inherent to the collected images. SfM produces 3D digital surface models, however, researchers predominantly create 2.5D digital elevation models (DEMs) and 2D orthomosaics from a single projection angle for use in further analyses (Bayley and Mogg, 2019; Obura et al., 2019). An open debate now exists as to whether these products, produced from a single projection angle, are capable of detecting and characterizing coral health conditions. Despite the widespread adoption of SfM photogrammetry for marine ecosystem monitoring (Bayley and Mogg, 2019; Obura et al., 2019), few formal comparisons of digital to in-situ techniques have been conducted.
Page et al. (2017) conducted surveys on the same plots using both in-situ and digital photography methods and compared estimated prevalence values for various coral health conditions on the reefs of Northwest Australia. The study concluded that the digital method produces systematically lower estimates of disease prevalence than in-situ methods. However, a difference in estimated prevalence does not allow us to directly compare the quality of results from the two methods, and thus leaves open the question of which approach is more accurate.
Diagnostic tests for a binary trait, such as the presence or absence of a disease, are often judged by their rates of classification error (or equivalently, the corresponding rates of correct classification). Two commonly used metrics are the following: sensitivity, η, also known as the true positive rate or recall, representing the probability that an individual positive for the trait is classified as such by the test; and the specificity, θ, or true negative rate, representing the probability that an individual without the trait is classified correctly. Both η and θ influence the outcome of a diagnostic test in competing ways. A decrease in η will lead to lower diagnosed prevalence by making false negatives more numerous, while a decrease in θ will lead to higher diagnosed prevalence by increasing the number of false positives.
A diagnostic test which always (or nearly always) produces a correct diagnosis is known as a gold-standard test. Such a test will have sensitivity and specificity values which are both very close to 100%. If a gold-standard diagnosis is available, it is possible to design a straightforward experiment and directly estimate the sensitivity and specificity of a new diagnostic test by applying the imperfect test to groups of known-healthy and known-diseased subjects. However, there is no practical way to obtain such a gold-standard diagnosis of coral colony health, precluding direct estimation of η and θ. Fortunately, the biomedical literature has long recognized the problem of evaluating diagnostic methods in the absence of a readily available gold-standard test and has developed statistical methods to address this issue.
An important class of approaches to the no-gold-standard problem treats the true disease state as an unobservable latent variable. The foundational model in this class was presented by Hui and Walter (1980) and has been extended in various ways by subsequent authors. Collins and Huynh (2014) provide a systematic review of the no-gold-standard literature and its applications in various disciplines. They find that the use of latent class methods has spread well beyond the biomedical and veterinary literature and examples can be found among diverse topics such as trial jury decisions (Spencer, 2007), disability eligibility determinations (Beńıtez-Silva et al., 2004), and wildlife tracking (Blick and Hagen, 2002; Conn and Diefenbach, 2007).
In this study we apply the Hui and Walter model to estimate the sensitivities and specificities of in-situ and digital assessments of coral health. This approach requires diagnosing a sample of individuals using both methods and linking the results of the two methods back to the individual colonies diagnosed. Coral colonies in multiple 1 m2 quadrats are surveyed using the in-situ method and overlapping images of the quadrats are then immediately captured for use in the digital approach. SfM methods are used to create high resolution orthomosaics, and each of the colonies affected by disease are marked and linked to entries in the diver data sheets. The digital representations of these colonies are then diagnosed for disease and adverse health conditions, and the resulting comparison of the two diagnostic results are used to jointly estimate all sensitivity and specificity values. To our knowledge, this is the first attempt to directly compare the efficacy of the digital and in-situ approaches by estimating each method's η and θ.
2. Methods
2.1. In-situ Health Surveys and Photography
Surveys were conducted along nearshore coral reef habitat adjacent to Honokohau in Kailua-Kona, HI, USA (19°40′9″ N, 156°1′44″ W) from April 20th to April 21st 2019, and at Laehala in Hilo, HI, USA (19°44′15″ N, 155°1′54″ W) from May 30th to June 7th 2019. A stratified random sampling design was used to determine survey locations for the 1 m2 quadrats at each site. Divers performed a comprehensive visual assessment of coral health for all coral colonies at least 50% contained inside each quadrat and immediately collected the overlapping imagery required to produce the 3D models and orthomosaics.
Before conducting the surveys, all divers completed the standardized benthic survey training materials used by the National Oceanic and Atmospheric Administration Pacific Reef Assessment and Monitoring Program (Swanson et al., 2018). Training was provided on the proper identification and measurement of survey parameters including coral species, morphology, size (longest linear length), number of diseased areas, type of disease, and colony surface area affected by disease. Diseases and adverse health conditions targeted for diagnoses included: Bleaching (BLE), Pigmentation Response (PRS), Tube-worm Infestation (TIN), Macro-algae Overgrowth (MACA), Porites Trematodiasis (PTR), Tissue Loss (TLS), Predation (PRED), Discoloration (DIS), Skeletal Growth Anomaly (SGA), Sedimentation (SEDI), and Physical Damage/Abrasion (DAMA). Several of these adverse health conditions are not true diseases (BLE, PRED, DAMA, MACA, TIN), so for the sake of brevity we refer to all diagnosed diseases and adverse health conditions as simply “health conditions.”
Photos for subsequent digital analysis were captured with Canon SL2 cameras fitted with 18–55 mm lenses and mounted in an Ikelite waterproof housing. Ground control points (GCPs) of known dimensions were placed at opposing corners of the quadrat. Images overlapping by approximately 70–80% were captured from planar and oblique angles while swimming over the survey area in a boustrophedonic (back-and-forth) pattern. Photo surveys encompassed the entire 1 m2 quadrat with a buffer of approximately 1 m of the surrounding area to ensure spatial accuracy of the rendered orthomosaic.
2.2. Digital Modeling
Methods developed specifically for creating 3D reconstructions and orthomosaics from coral reef habitats were used to create digital reconstructions of the surveyed quadrats, as described in Burns et al. (2015). Image alignment and rendering of digital models were completed using Agisoft Photoscan software (Agisoft LLC). Following alignment, a dense point cloud was estimated with SfM techniques. The point cloud was converted into a polygon mesh and textures derived from the photo imagery were overlaid to complete the 3D model. Finally, we rendered a high-resolution orthomosaic projected from a planar angle (directly overhead) to be used for digital assessment of coral disease on all paired colonies. An example orthomosaic from the present study is provided in Figure 1.
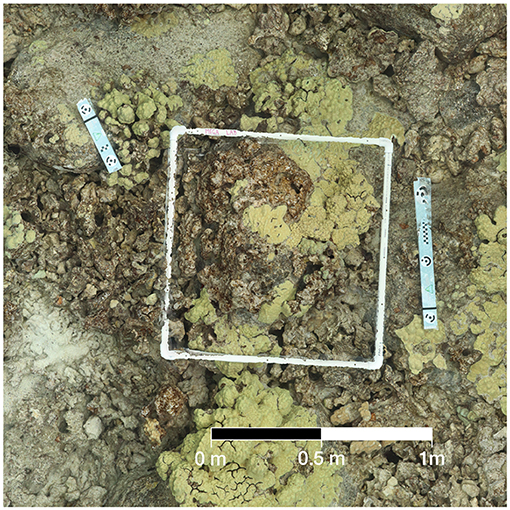
Figure 1. Example of orthomosaic used in digital health surveys. When zoomed in, details of this image can be resolved at a high resolution with raster cells under 1 cm in size.
2.3. Colony Matching and Digital Health Surveys
The orthomosaics for each quadrat were imported into ArcMap geospatial software (ArcGIS 10.1). The Hui and Walter model requires that each surveyed individual has paired test results for each competing diagnostic method. To facilitate this pairing, an additional reference photo was taken of each surveyed colony during the in-situ phase to allow for easier identification of the colony in the orthomosaic reconstruction. The in-situ records were matched to the representations of the colony within the orthomosaics, and the digital representation tagged for digital diagnosis.
In the course of the study it became clear that pairing could only be reliably accomplished for colonies of appreciable size, and many small or poorly defined colonies from the in-situ surveys were excluded. Accordingly, our findings may be interpreted as fully justified only as applied to diagnosing colonies that are sufficiently developed to be readily identifiable by visual inspection.
Similar to in-situ surveys, our digital analysis parameters included coral species, morphology, size (longest linear length in cm and surface area), number of affected areas, type of health condition, and colony surface area affected by the health condition(s). GCPs in the image were used to scale the model and create accurate local coordinate systems, and ArcMap's spatial measurement tools were used to record length and area information. Digital analysis on each quadrat orthomosaic was repeated for a total of three trials, each conducted by a different observer. An individual was not permitted to diagnose the same colony in both the in-situ and digital phase of the project, and the digital observers were kept blind to the results of the in-situ health assessments of their assigned colonies. A composite diagnosis for the presence or absence of each health condition was produced from the three digital diagnosis replicates using majority rule.
2.4. Statistical Model
The result of the diagnosed presence/absence of a particular health condition under both the in-situ survey and the digital analysis assigns each colony into one of four categories: both tests positive (++), in-situ positive and digital negative (+−), in-situ negative and digital positive (−+), or both tests negative (−−). For condition k, counting the number of colonies in each category is modeled by a multinomial random vector yk, with parameter vector pk describing the distribution among the four diagnosis categories,
Counts for different health conditions k are assumed to be independent of each other. Each diagnostic method has a sensitivity, ηs for in-situ and ηd for the digital method; and likewise each has a specificity, θs and θd. The probability vectors pk are specified by the Hui and Walter (1980) model in terms of these sensitivities and specificities, together with the prevalence of the condition πk:
This model arises by assuming independence of the two test results conditional on true disease state. Under this assumption, joint conditional probabilities are obtained by simply multiplying the relevant sensitivity and specificity values. For example, two true positives has Pr(++|diseased) = ηsηd while the two true negative outcome has Pr(−−|healthy) = θsθd, and so on.
This model has two potential issues that can complicate parameter estimation. The first involves a straightforward over parameterization issue: If there are K health conditions surveyed, the summarized data have 3K degrees of freedom and the model has K + 4 parameters. This problem does not affect us as we surveyed K ≥ 2 different health conditions, and thus the data have available degrees of freedom sufficient to estimate the model.
The second identifiability problem is the result of the fact that the set of probability vectors {pk} obtained from Equation (1) is invariant to the following transformation of the underlying prevalence, sensitivity, and specificity parameters:
This second set of parameter values represents a situation where the labeling of the true state is reversed (i.e., a + test result should indicate a healthy individual instead of diseased), but the diagnostic test output was not updated appropriately, resulting in systematically wrong classification. Fortunately, this means that if the diagnostic tests under consideration make practically useful predictions, only one of these two possible sets of parameters is reasonable. The unreasonable option can be eliminated by placing an appropriate constraint on the parameter values, or with the use of sufficiently strong priors in a Bayesian setting. We opted to take the latter approach.
Moderately informative priors for health condition prevalence were developed from previous coral health survey results at nearby sites (Caldwell et al., 2016). We selected Beta(α, β) distributions with means matching previous point estimates and with an effective sample size (α + β) of 100. For conditions not included in the Caldwell et al. study, prevalences were estimated using technical reports that characterized coral reef health in the Main Hawaiian Islands, and a smaller effective sample size was used (Walsh et al., 2009). The prior hyperparameters for disease prevalence are summarized in Table 1. Less informative Beta (20, 10) priors were placed on each sensitivity, ηs and ηd, and Beta (9, 1) priors were used for specificities θs and θd. These choices reflect our belief that the diagnostic results are not systematically wrong, and that false negatives are more common than false positives. The joint prior assumes full independence of all prevalence, sensitivity, and specificity parameters.
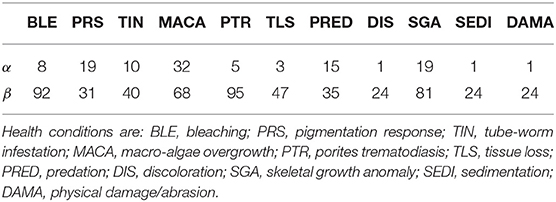
Table 1. Hyperparameters for the independent Beta(α,β) priors on health condition prevalences, πk.
To investigate possible deviations from the Equation (1) assumption that sensitivities and specificities do not vary across health conditions, we fitted a second model with additional hierarchical structure. The hierarchical model allows the sensitivity and specificity of each method to vary across the conditions k,
For each method, i ∈ {s, d}, the parameters μi and νi represent mean values for the sensitivity and specificity, while ϕi and ξi are precision parameters controlling the degree to which individual condition sensitivities and specificities vary about their respective overall means. This parameterization, in terms of a mean and precision, is often used in the beta regression problem (Ferrari and Cribari-Neto, 2004).
Under this extended model, priors on the sensitivities and specificities were transferred to the new hierarchical mean parameters. Allowing the condition-specific sensitivity and specificity parameters full freedom results in overparameterization and unidentifiable parameters. Therefore, we enforced statistical regularity by placing a strong prior on the precision parameters, allowing the ηi, k and θi, k values to vary about their respective means, μi and νi, by approximately 10% in either direction,
All data analysis was conducted using R, version 3.6.
3. Results
A total of 46 1 m2 quadrats were surveyed for this study, resulting in in-situ health surveys of 895 coral colonies. Of these, 191 colonies were successfully paired with a representation in the digital models and subsequently diagnosed using the digital method. Every colony remaining after the pairing had been diagnosed with at least one health condition in the in-situ survey. Counts summarizing the distribution of these colonies into the four categories of (dis)agreement between in-situ and digital methods are presented in Tables 2 (single observer) and 3 (majority rule).
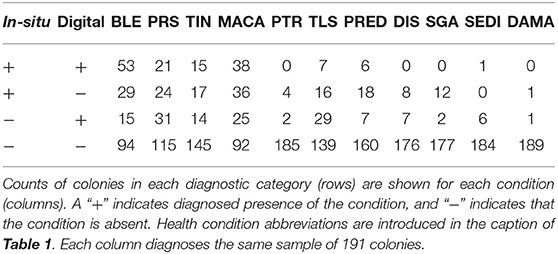
Table 2. Summary of health condition diagnoses using results from a single digital observer.
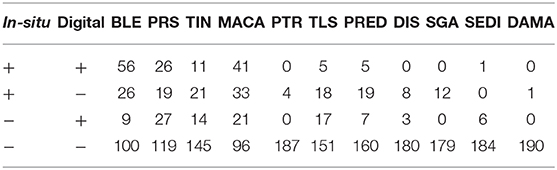
Table 3. Summary of the health condition diagnoses when using the results from majority-rule of three digital observers.
Samples from the posterior distributions are obtained using the Stan sampling engine (Carpenter et al., 2017). Traceplots and MCMC diagnostic statistics do not indicate obvious sampling problems, suggesting successful convergence to the stationary distribution. In particular, the multimodality in the model likelihood is not observed in the posterior when using the priors described in the Statistical Model section. This multimodality is seen when using flat priors, and when the amount of information in the priors is reduced by decreasing the effective sample size of the Beta prior distributions. Code used to obtain the posterior samples and MCMC diagnostics is included in the Supplementary Material.
Summaries of the posterior distribution of the parameters of interest are presented in Figure 2. When using the majority-rule diagnosis, the posterior means (standard deviations) of the sensitivities are estimated to be for in-situ and for the digital method. Posterior means for specificity are for the in-situ method, and for the digital method. A summary of the evidence for the size of the sensitivity effect is displayed in Figure 3, showing the posterior probability that in-situ sensitivity exceeds that of the digital method by at least a given amount. The difference in sensitivity between the in-situ and digital methods is estimated to have a mean of 0.08 with standard deviation 0.05. Summaries of the posterior distributions of sensitivities under the expanded hierarchical model (Equation 2) are shown in Figure 4.
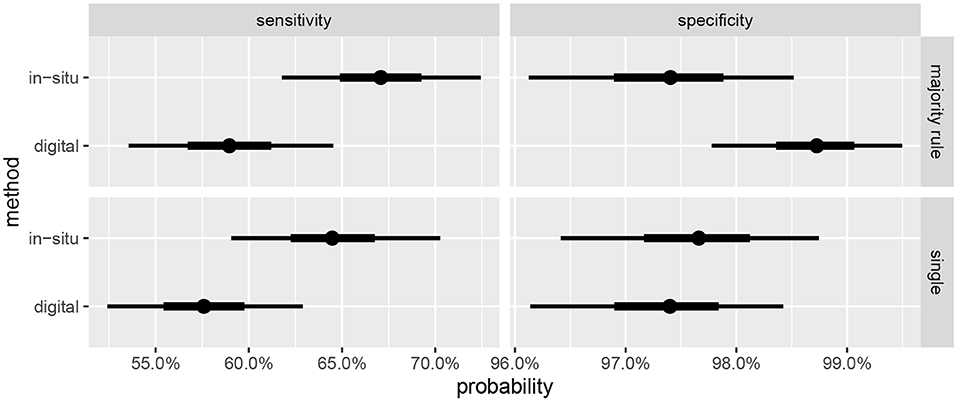
Figure 2. Marginal posterior credible intervals for sensitivities and specificities. (Top) panels show results using majority-rule digital diagnoses (Table 3), and (Bottom) panels show results of using only one digital diagnosis per colony (Table 2). Points indicate posterior medians, inner credible intervals are at the 50% level, and outer intervals at 90% level.
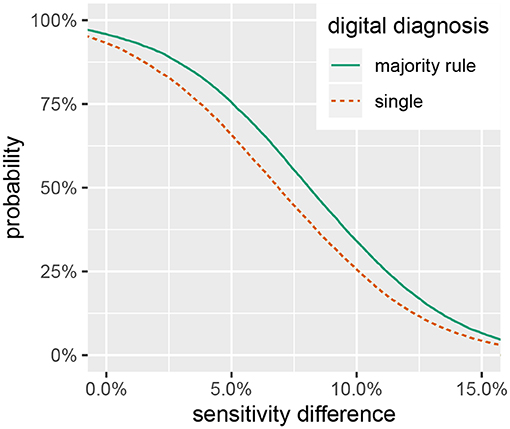
Figure 3. Posterior probability that in-situ diagnostic sensitivity exceeds digital sensitivity by at least a given value, .
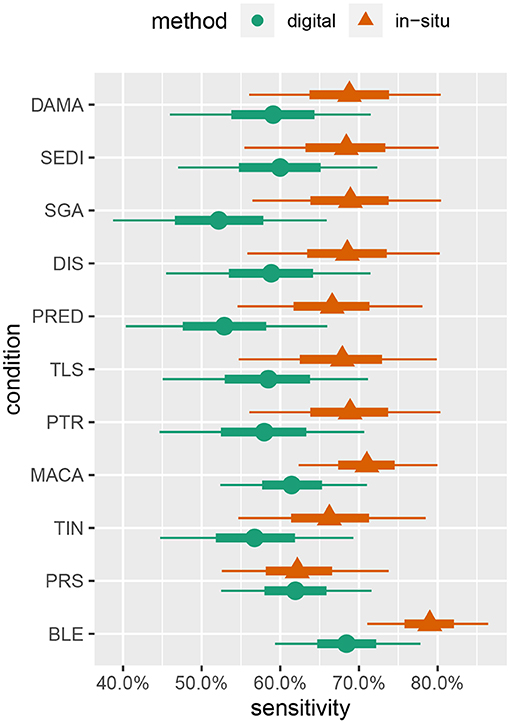
Figure 4. Marginal posterior intervals for majority-rule sensitivity under the hierarchical model allowing sensitivity and specificity to vary by condition. Points indicate posterior medians, inner credible intervals are at the 50% level, and outer intervals are at the 90% level.
4. Discussion
We find substantial evidence that the sensitivity of the in-situ method is higher than that of the digital methods, as reflected in Figures 2, 3, and that the specificities of both approaches are near to 100%. This result is in agreement with the findings of Page et al. (2017) that coral health condition prevalence estimated by photographic analysis is lower than that of in-situ assessments (although that study did not attempt to estimate the sensitivities and specificities).
Sensitivity estimates for the digital method are slightly higher when the majority-rule diagnosis is used, compared to diagnoses based on a single individual's judgement. However, the effect size is small relative to the uncertainty in the estimates. The effect on the specificity is more pronounced, with the estimates showing an approximate halving of the false positive rate. Given the ease of having multiple observers diagnose the coral once the orthomosaics are constructed, and the small amount of time this step takes compared to the preceding steps, we recommend this be done whenever feasible.
While the in-situ approach has a higher sensitivity, the size of the difference is not large enough to disregard the utility of digital analysis methods for assessing coral health. Figure 3 shows a smaller than 50% chance that the difference in diagnostic sensitivity exceeds 8%, a 33% chance that the difference exceeds 10% and only a 7% chance that the difference exceeds 15%. These results suggest that a digital assessment of coral health is a reasonable option if conducting in-situ surveys is logistically prohibitive. As researchers push to explore deeper reef habitats and characterize large spatial areas with the assistance of autonomous underwater vehicles (Turner et al., 2018; Armstrong et al., 2019), digital processing of benthic imagery can provide a viable method to assess the prevalence of coral disease.
The model estimates also strongly suggest that in-situ visual surveys cannot be considered a gold-standard for assessing coral health, as the sensitivities for both approaches are not close to 100%. Provided the health condition in question is not extremely rare, surveys using these methods without correcting for the effect of imperfect diagnosis may be systematically underestimating true health condition prevalence. It is reasonable to suggest that researchers use caution when relying on visual estimates of coral health condition prevalence to make broad distinctions about the health of coral reefs. Future analyses of within-observer variability will improve our understanding on the reliability efficacy of visual estimates of coral health condition prevalence.
Although the parameter estimates under the hierarchical model (Figure 4) are not very precise given our study's sample size, some interesting patterns emerge. These patterns suggest some avenues for future investigations, as discussed later in this section, and also give us some confidence in the model's behavior as they largely concur with other prior knowledge of coral disease. For example, sensitivity to bleaching (BLE) is estimated to be moderately higher, relative to other conditions, for both in-situ and digital analysis. This is to be expected, as bleaching is one of the most readily visually identifiable coral health conditions (Rosenberg and Loya, 2013).
Pigmentation response (PRS) has the lowest sensitivity value in relation to the other health conditions detected by in-situ surveys, while it had the second highest sensitivity value in the digital analysis. This may be attributable to both the bright pink color and the small size of many PRS lesions. Red is one of the first colors to be lost with depth in the water column, making a bright pink color less likely to be detected in the field; however, it is more easily identified when looking at a properly white-balanced and color-corrected high-resolution image (Mumby et al., 2004). This condition may be missed by divers when subjected to time limitations associated with SCUBA, while the lack of such time constraints in the digital assessments combined with the ability to zoom in on small features may conspire to give the digital methods an advantage for this condition.
Skeletal growth anomalies (SGA) and predation (PRED) are estimated to have the lowest sensitivities for the digital analysis. Conversely, the in-situ surveys of SGA and PRED have similar sensitivity values as the other health conditions. Visually cryptic coral diseases such as these, which form at the base and sides of coral colonies, require careful examination from multiple angles which can be particularly difficult when using only digital imagery (Willis et al., 2004; Bennett et al., 2016; Page et al., 2017).
Despite the promising results of this study, we caution against direct use of these estimates of sensitivity and specificity to attempt to correct for non-detection. A central assumption of the Hui and Walter model, embedded in Equation (1), is the independence of the two diagnostic tests conditional on the true disease state. This assumption is most reasonable when the two diagnostic tests are based on different sources of information, e.g., a test based on tissue chemistry and a second test based on x-ray imaging. However, here both diagnostics are based on a macroscopic visual inspection of the coral, making this modeling assumption immediately suspect. Presumably, our two approaches would be expected to agree with each other more often than predicted by the conditionally independent model.
When this assumption is violated, the parameters η and θ estimated by the Bayesian approach will no longer be directly relatable to the sensitivity and specificity of the tests. However, attempting to model this dependency requires one to specify (and presumably estimate) the dependency structure among tests. There are multiple reasonable dependency structures that have been proposed, and choosing among them based solely on data is difficult or impossible. However, while estimates of the sensitivity and specificity may vary considerably when fitting different dependency structures to a data set, the relative ranking between tests is more robust (Albert and Dodd, 2004). A better understanding of the conditional dependence of the two diagnostic methods would likely suggest a different form for Equation (1), leading to more robust estimates of the sensitivity and specificity.
A second caveat relates to the difficulties arising in the pairing process. Since small and indistinct colonies needed to be excluded from the analysis to ensure reliability of the pairings, the sensitivities and specificities estimated are effectively conditional on the colonies being large enough to be confidently identifiable. Smaller, more cryptic, colonies may have different diagnostic characteristics. However, since monitoring efforts are usually aimed at well-developed reefs with many large colonies, we think these estimates are of practical interest and value.
The equivalence of sensitivities and specificities across all health conditions is also questionable, as it seems quite reasonable for particular conditions to be easier or harder to successfully detect. Indeed, the results of fitting the hierarchical model (Figure 4) provide moderate evidence that sensitivities of some conditions (e.g., bleaching) may differ. Over-parameterization concerns preclude letting these values vary freely, and a hierarchical approach allowing for some pooling of information across conditions seems to be a reasonable compromise.
An alternative to the hierarchical approach may be found in Johnson et al. (2001). They propose an approach to the problem of estimating sensitivities and specificities for a single condition that relies on sampling from distinct populations of individuals with significantly different prevalences. Taxonomy or morphology may provide a definition for distinct populations suitable for this purpose, when prior information indicates that prevalence of a particular condition varies significantly among the populations. Such an approach alleviates the over-parameterization problem, allowing for diagnostic parameters to vary freely across health conditions, and future work could incorporate an experimental design focused on collecting data suitable for such an analysis.
Comparing the in-situ and digital methodologies requires precise pairing of coral colonies affected by disease or adverse health conditions. This can be challenging due to many corals having fragmented and indistinct colony borders. In fact, we found that successfully pairing the colonies was one of the most difficult aspects of this study. Only colonies that could be distinctly identified and confidently paired were included in the study, limiting the sample size. Future studies comparing diagnostic sensitivities must diligently ensure colonies are properly paired, while also minimizing potential dependence between successful pairing and health status. Developing a simple protocol that allows for easy and accurate pairing would allow future work in this area to greatly increase the usable number of observations.
The possibility of differential diagnostic performance across different health conditions suggests an opportunity to optimize data collection by having certain conditions surveyed in-situ, while others are left for the digital approach. For example, workload on divers may be reduced by focusing on conditions that commonly occur in difficult to photograph areas of the colony, while digital methods might focus effort on color-based disorders that may be difficult to perceive in the aquatic environment. If diagnostic difficulty varies significantly by species or morphology, this would provide additional opportunities for such improvements to survey efficiency. Previous studies support this approach of optimizing the use of digital and in-situ surveys to maximize the quantity of data collected in the face of logistical constraints (Page and Stoddart, 2010; Page et al., 2017; Obura et al., 2019).
Better knowledge of the strengths and weaknesses of each approach could also spur improvements to the methods themselves. For example, the digital method appears to have weak sensitivity to certain conditions such as skeletal growth anomalies. Since this disorder is a 3D phenomenon, performance may significantly improve if digital surveys are conducted using the 3D digital surface models instead of the 2D projected orthomosaics (House et al., 2018; Obura et al., 2019). For this study, we focused on analyzing projected orthomosaics as this data product has been predominantly used when characterizing coral reef habitats using SfM methods (Bayley and Mogg, 2019).
A last interesting avenue of further investigation involves attempting to separately quantify method-specific and observer-specific sources of diagnostic error. It is possible that the relative contributions of these error sources may be significantly different for the two methods. For example, if a large part of the digital error is due to the limited perspective of the orthomosaic, finding or training highly-skilled observers may not be a viable way to improve survey accuracy. Conversely, it could be the case that the in-situ errors are mostly attributable to observer-specific effects, which would suggest a greater benefit from using highly-trained observers. Independently addressing observer variability will provide useful insight into the processes by which diagnostic errors are generated.
This study is a preliminary investigation of the diagnostic performance of conventional in-situ surveys and digital image-based techniques. Although the in-situ technique is estimated to have a modest advantage in sensitivity, we believe there remains a role for both approaches in coral health monitoring. When using digital survey methods, researchers should take the opportunity to have multiple observers view the images and diagnose disease, as we find this improves the specificity. A better understanding of the dependence structure of the two tests should lead to more robust estimates of the diagnostic performance, and this will in turn allow for more comprehensive comparisons of the survey methodologies. A more complete understanding of the capabilities of the methods will allow investigators to make more carefully informed decisions, taking into account their specific research goals and the trade-offs involving speed, cost, scale, and accuracy.
Data Availability Statement
All datasets generated for this study are included in the article/Supplementary Material.
Author Contributions
GW, JB, and TM: conceptualization, methodology, supervision, and editing. AR, AS, BW, SF, and KP: data collection. AR, AS, BW, CK, DG, DW, MM, ND, SF, SM, and KP: formal analysis, writing, and visualization. RP: project administration, funding acquisition, and manuscript review.
Funding
Primary funding for this study, including open publication access fees, was provided by Hawaii EPSCoR, NSF award 1557349. Equipment used in this study was funded by NSF awards to the Center for Research Excellence in Science and Technology, numbers 0833211 and 1345247, and the Spatial Data Analysis and Visualization Lab at the University of Hawaii at Hilo, award EPS-0903833. The Academy for Creative Media provided support for computing resources housed in the Spatial Data Analysis and Visualization Lab.
Conflict of Interest
The authors declare that the research was conducted in the absence of any commercial or financial relationships that could be construed as a potential conflict of interest.
Acknowledgments
We thank Alina Abramovich, Briana Craig, Mia Lamirand, and Ashley Pugh for their assistance with the in-situ surveys.
Supplementary Material
The Supplementary Material for this article can be found online at: https://www.frontiersin.org/articles/10.3389/fmars.2020.00304/full#supplementary-material
References
Aeby, G. S., Williams, G. J., Franklin, E. C., Kenyon, J., Cox, E. F., Coles, S., et al. (2011). Patterns of coral disease across the Hawaiian archipelago: relating disease to environment. PLoS ONE 6:e20370. doi: 10.1371/journal.pone.0020370
Albert, P. S., and Dodd, L. E. (2004). A cautionary note on the robustness of latent class models for estimating diagnostic error without a gold standard. Biometrics 60, 427–435. doi: 10.1111/j.0006-341X.2004.00187.x
Armstrong, R. A., Pizarro, O., and Roman, C. (2019). “Underwater robotic technology for imaging mesophotic coral ecosystems,” in Mesophotic Coral Ecosystems, eds Y. Loya, KA. Puglise, and T. Bridge (Cham: Springer), 973–988. doi: 10.1007/978-3-319-92735-0_51
Bayley, D. T., and Mogg, A. O. (2019). “New advances in benthic monitoring technology and methodology,” in World Seas: An Environmental Evaluation, ed C. Sheppard (Cambridge, MA: Elsevier), 121–132. doi: 10.1016/B978-0-12-805052-1.00006-1
Benítez-Silva, H., Buchinsky, M., Man Chan, H., Cheidvasser, S., and Rust, J. (2004). How large is the bias in self-reported disability? J. Appl. Econ. 19, 649–670. doi: 10.1002/jae.797
Bennett, K., Wilson, S., Shedrawi, G., McLean, D., and Langlois, T. (2016). Can diver operated stereo-video surveys for fish be used to collect meaningful data on benthic coral reef communities? Limnol. Oceanogr. 14, 874–885. doi: 10.1002/lom3.10141
Blick, D. J., and Hagen, P. T. (2002). The use of agreement measures and latent class models to assess the reliability of classifying thermally marked otoliths. Fish. Bull. 100, 1–10.
Burns, J. H. R., Delparte, D., Gates, R., and Takabayashi, M. (2015). Integrating structure-from-motion photogrammetry with geospatial software as a novel technique for quantifying 3D ecological characteristics of coral reefs. PeerJ 3:e1077. doi: 10.7717/peerj.1077
Burns, J. H. R., Delparte, D., Kapono, L., Belt, M., Gates, R., and Takabayashi, M. (2016). Assessing the impact of acute disturbances on the structure and composition of a coral community using innovative 3D reconstruction techniques. Methods Oceanogr. 15, 49–59. doi: 10.1016/j.mio.2016.04.001
Caldwell, J. M., Burns, J. H. R., Couch, C., Ross, M., Runyon, C., Takabayashi, M., et al. (2016). Hawaii coral disease database (hicordis): species-specific coral health data from across the Hawaiian archipelago. Data Brief 8, 1054–1058. doi: 10.1016/j.dib.2016.07.025
Carpenter, B., Gelman, A., Hoffman, M. D., Lee, D., Goodrich, B., Betancourt, M., et al. (2017). Stan: A probabilistic programming language. J. Stat. Softw. 76. doi: 10.18637/jss.v076.i01
Collins, J., and Huynh, M. (2014). Estimation of diagnostic test accuracy without full verification: a review of latent class methods. Stat. Med. 33, 4141–4169. doi: 10.1002/sim.6218
Conn, P. B., and Diefenbach, D. R. (2007). Adjusting age and stage distributions for misclassification errors. Ecology 88, 1977–1983. doi: 10.1890/07-0369.1
Ferrari, R., McKinnon, D., He, H., Smith, R. N., Corke, P., González-Rivero, M., et al. (2016). Quantifying multiscale habitat structural complexity: a cost-effective framework for underwater 3D modelling. Remote Sens. 8:113. doi: 10.3390/rs8020113
Ferrari, S., and Cribari-Neto, F. (2004). Beta regression for modelling rates and proportions. J. Appl. Stat. 31, 799–815. doi: 10.1080/0266476042000214501
Figueira, W., Ferrari, R., Weatherby, E., Porter, A., Hawes, S., and Byrne, M. (2015). Accuracy and precision of habitat structural complexity metrics derived from underwater photogrammetry. Remote Sens. 7, 16883–16900. doi: 10.3390/rs71215859
Fukunaga, A., Burns, J. H. R., Craig, B. K., and Kosaki, R. K. (2019). Integrating three-dimensional benthic habitat characterization techniques into ecological monitoring of coral reefs. J. Mar. Sci. Eng. 7:27. doi: 10.3390/jmse7020027
Harvell, D., Jordán-Dahlgren, E., Merkel, S., Rosenberg, E., Raymundo, L., Smith, G., et al. (2007). Coral disease, environmental drivers, and the balance between coral and microbial associates. Oceanography 20, 172–195. doi: 10.5670/oceanog.2007.91
Hoegh-Guldberg, O., Mumby, P. J., Hooten, A. J., Steneck, R. S., Greenfield, P., Gomez, E., et al. (2007). Coral reefs under rapid climate change and ocean acidification. Science 318, 1737–1742. doi: 10.1126/science.1152509
House, J. E., Brambilla, V., Bidaut, L. M., Christie, A. P., Pizarro, O., Madin, J. S., et al. (2018). Moving to 3d: relationships between coral planar area, surface area and volume. PeerJ 6. doi: 10.7717/peerj.4280
Hui, S. L., and Walter, S. D. (1980). Estimating the error rates of diagnostic tests. Biometrics 36, 167–171. doi: 10.2307/2530508
Javernick, L., Brasington, J., and Caruso, B. (2014). Modeling the topography of shallow braided rivers using structure-from-motion photogrammetry. Geomorphology 213, 166–182. doi: 10.1016/j.geomorph.2014.01.006
Johnson, W. O., Gastwirth, J. L., and Pearson, L. M. (2001). Screening without a “gold standard”: the Hui-Walter paradigm revisited. Am. J. Epidemiol. 153, 921–924. doi: 10.1093/aje/153.9.921
Lavy, A., Eyal, G., Neal, B., Keren, R., Loya, Y., and Ilan, M. (2014). A quick, easy and non-intrusive method for underwater volume and surface area evaluation of benthic organisms by 3D computer modelling. Methods Ecol. Evol. 6, 521–531. doi: 10.1111/2041-210X.12331
Magel, J. M., Burns, J. H. R., Gates, R. D., and Baum, J. K. (2019). Effects of bleaching-associated mass coral mortality on reef structural complexity across a gradient of local disturbance. Sci. Rep. 9:2512. doi: 10.1038/s41598-018-37713-1
Mumby, P. J., Skirving, W., Strong, A. E., Hardy, J. T., LeDrew, E. F., Hochberg, E. J., et al. (2004). Remote sensing of coral reefs and their physical environment. Mar. Pollut. Bull. 48, 219–228. doi: 10.1016/j.marpolbul.2003.10.031
Obura, D. O., Appeltans, W., Amornthammarong, N., Aeby, G., Bax, N. J., Bishop, J., et al. (2019). Coral reef monitoring, reef assessment technologies, and ecosystem-based management. Front. Mar. Sci. 6:580. doi: 10.3389/fmars.2019.00580
Page, C., Field, S., Pollock, F., Lamb, J., Shedrawi, G., and Wilson, S. (2017). Assessing coral health and disease from digital photographs and in situ surveys. Environ. Monit. Assess. 189:18. doi: 10.1007/s10661-016-5743-z
Page, C. A., and Stoddart, J. A. (2010). New records of five coral diseases from the Pilbara region of Western Australia. Coral Reefs 29, 987–987. doi: 10.1007/s00338-010-0659-5
Palma, M., Rivas Casado, M., Pantaleo, U., and Cerrano, C. (2017). High resolution orthomosaics of African coral reefs: a tool for wide-scale benthic monitoring. Remote Sens. 9:705. doi: 10.3390/rs9070705
Parsons, M., Bratanov, D., Gaston, K., and Gonzalez, F. (2018). UAVs, hyperspectral remote sensing, and machine learning revolutionizing reef monitoring. Sensors 18:2026. doi: 10.3390/s18072026
Raymundo, L. J., Couch, C. S., Harvell, C. D., Raymundo, J., Bruckner, A. W., Work, T. M., et al. (2008). Coral disease Handbook: Guidelines for Assessment, Monitoring, and Management. Technical report, Coral Reef Targeted Research & Capacity Building for Management Program.
Rosenberg, E., and Loya, Y. (2013). Coral Health and Disease. Berlin: Springer Science & Business Media.
Spencer, B. D. (2007). Estimating the accuracy of jury verdicts. J. Empir. Legal Stud. 4, 305–329. doi: 10.1111/j.1740-1461.2007.00090.x
Swanson, D. W., Bailey, H., Schumacher, B., Ferguson, M., and Vargas-Ángel, B. (2018). Ecosystem Sciences Division Standard Operating Procedures: Data Collection for Rapid Ecological Assessment Benthic Surveys. Technical report, NOAA.
Turner, J. A., Babcock, R. C., Hovey, R., and Kendrick, G. A. (2018). AUV-based classification of benthic communities of the Ningaloo shelf and mesophotic areas. Coral Reefs 37, 763–778. doi: 10.1007/s00338-018-1700-3
Walsh, W., Cotton, S., Barnett, C., Couch, C., Preskitt, L., Tissot, B., and Osada-D'Avella, K. (2009). Long-Term Monitoring of Coral Reefs of the Main Hawaiian Islands. Technical report, Hawaii Division of Aquatic Resources.
Ward, J. R., Kim, K., and Harvell, C. D. (2007). Temperature affects coral disease resistance and pathogen growth. Mar. Ecol. Prog. Ser. 329, 115–121. doi: 10.3354/meps329115
Keywords: Hawaii, coral, coral disease, photogrammetry, orthomosaic, diagnostic test accuracy, no gold standard, latent class model
Citation: Burns JHR, Weyenberg G, Mandel T, Ferreira SB, Gotshalk D, Kinoshita CK, Marshall MJ, Del Moral NAV, Murphy SJ, Pascoe KH, Runyan A, Spengler AJ, Wells BD, Wilde DK and Pelayo R (2020) A Comparison of the Diagnostic Accuracy of in-situ and Digital Image-Based Assessments of Coral Health and Disease. Front. Mar. Sci. 7:304. doi: 10.3389/fmars.2020.00304
Received: 07 November 2019; Accepted: 15 April 2020;
Published: 06 May 2020.
Edited by:
Eric Jeremy Hochberg, Bermuda Institute of Ocean Sciences, BermudaReviewed by:
Aldo Cróquer, Simón Bolívar University, VenezuelaDavid Obura, Coastal Oceans Research and Development in the Indian Ocean (CORDIO), Kenya
Copyright © 2020 Burns, Weyenberg, Mandel, Ferreira, Gotshalk, Kinoshita, Marshall, Del Moral, Murphy, Pascoe, Runyan, Spengler, Wells, Wilde and Pelayo. This is an open-access article distributed under the terms of the Creative Commons Attribution License (CC BY). The use, distribution or reproduction in other forums is permitted, provided the original author(s) and the copyright owner(s) are credited and that the original publication in this journal is cited, in accordance with accepted academic practice. No use, distribution or reproduction is permitted which does not comply with these terms.
*Correspondence: Grady Weyenberg, Z3JhZHlzd0BoYXdhaWkuZWR1
†Present address: Roberto Pelayo, Mathematics, University of California, Irvine, Irvine, CA, United States