 Margit R. Wilhelm1,2*
 Bryan A. Black2,3
 Tarron Lamont4,5Sarah C. Paulus6Chris Bartholomae6Deon C. Louw6
- 1Department of Fisheries and Aquatic Sciences, University of Namibia, Henties Bay, Namibia
- 2Marine Science Institute, The University of Texas at Austin, Port Aransas, TX, United States
- 3Laboratory of Tree-Ring Research, University of Arizona, Tucson, AZ, United States
- 4Oceans and Coasts Research Branch, Department of Environmental Affairs, Cape Town, South Africa
- 5Department of Oceanography, Marine Research Institute, University of Cape Town, Cape Town, South Africa
- 6National Marine Information and Research Centre, Ministry of Fisheries and Marine Resources, Swakopmund, Namibia
In this study we develop a 32-year (1982–2013) otolith biochronology of the commercially important deepwater hake Merluccius paradoxus in the northern Benguela, Namibia. Mean annual growth (mm) calculated from 140 thin-sectioned M. paradoxus otoliths were compared with change in mean length at age 3 to age 4 determined from Namibian whole-otolith-read age-length keys (ALKs). Annual growth rates calculated from the two methods (overlapping 2000–2013) were strongly positively correlated (ρ = 0.730, n = 14, p < 0.01). This indirectly validated annual age determination of M. paradoxus, the accuracy of otolith chronologies, and the ability of ALKs to capture annual variability in fish growth. Annual M. paradoxus growth rates were significantly positively correlated with the July–September upwelling index 1982–2013 at 30°S, (ρ = 0.414, n = 32, p < 0.05) and positively correlated with August mean chlorophyll-a concentrations (as indicator for primary production) 2002–2013 in the 28–30°S area (ρ = 0.734, n = 12, p < 0.01). Annual M. paradoxus growth rates significantly negatively correlated with October (austral spring) sea surface temperatures in the 24–28°S area (ρ = −0.381, n = 32, p < 0.05). This Orange-River Namaqua upwelling cell corresponds to the area where juvenile and young adult M. paradoxus live, suggesting growth rate strongly responds to local forcing. We also determined that mean length-at-age 3 calculated from ALKs (current and literature) significantly increased from 1977 through 2016 at 0.075 cm.year–1 (t = 3.04, df = 41, p = 0.004), while length-at-age 8 significantly decreased at 0.25 cm.year–1 (t = −3.59, df = 30, p = 0.001). Both trends may indicate fisheries-induced adaptive changes. M. paradoxus occurring at >300 m bottom depth, are thus strongly influenced by fisheries. As an upper-level demersal predator, this species integrates signals throughout the food web to provide a unique “view from the top” of long-term changes in the northern Benguela upwelling system. These results provide background ranges of growth variability and context for what will likely be negative impacts of predicted decreases in future upwelling.
Introduction
As one of the four major Eastern Boundary Upwelling Systems of the world, the Benguela Upwelling System, located along the west coast of southern Africa, supports a productive environment typified by a complex ecosystem structure that supports numerous species of substantial commercial value (Hutchings et al., 2009; Verheye et al., 2016). The deepwater hake, Merluccius paradoxus, form an important component of these commercially valued species, with the total stocks in the Benguela system representing more than 33% of the global hake biomass (Kathena et al., 2016). The Benguela system is commonly described as two sub-systems separated by the Lüderitz upwelling cell (Duncombe Rae, 2005), with the northern Benguela characterized by perennial upwelling, and the southern Benguela characterized by strongly seasonal upwelling (Hardman-Mountford et al., 2003; Lamont et al., 2018a). Recent studies have revealed that upwelling ecosystems globally are undergoing long-term change, marked by a poleward shift in upwelling, linked with poleward shifts in the atmospheric high pressure systems that drive upwelling-favorable winds (Rykaczewski et al., 2015; Wang et al., 2015). Similar changes have been observed in the Benguela system, with substantially less upwelling-favorable wind in the northern Benguela in recent years (Lamont et al., 2018a), accompanied by positive trends in Sea Surface Temperatures (SSTs) (Jarre et al., 2015). In contrast, coastal cooling of about 0.5°C per decade has been identified in the southern Benguela, though this cooling has been less pronounced farther south on the Agulhas Bank (Rouault et al., 2010). These cooling trends appear to be linked to an increase in upwelling-favorable south-easterly and easterly winds (Rouault et al., 2010; Lamont et al., 2018a).
Water temperature is one of the main factors influencing the biology, distribution and life history of fishes, along with other aquatic organisms, especially in high latitude freshwater systems (e.g., Magnuson et al., 1997; Casselman et al., 2002; Vieira et al., 2020). In temperate areas, too, fish growth increased due to a disproportionate lengthening of the growing season with climate change (e.g., Morrongiello et al., 2011). In the northern part of the northern Benguela (Angola-Benguela Front), a temperate marine system, increasing inshore temperatures in an ocean-warming hot-spot resulted in species mixing and even hybridization of two Sciaenid Argyrosomus species (Potts et al., 2014). Changing water temperatures thus have consequences for processes such as growth rates, timing of seasonal events (phenology), species distributions, species interactions, and overall levels of productivity (e.g., Carey and Zimmerman, 2014; Morrongiello et al., 2014; Tanner et al., 2019).
Apart from changes in the life history strategies and productivity of fish populations due to climate, changes in life history strategies can also occur as a result of selective fishing. For example, Morrongiello et al. (2019) determined, using a biochronology approach on a recently exploited temperate marine reef fish in Tasmania, that fishing not only increased adult growth rates, but it also changed thermal reaction norms to increased sensitivity of these fish to temperature, over the relatively short time period of 10 years. Fisheries-induced changes in growth rates due to density-dependent processes or selection for investment into pre-mature growth and reproduction of fish, were discussed by Lorenzen and Enberg (2002), and Enberg et al. (2012), respectively.
In the northern Benguela, the hakes, consisting of the shallow-water hake Merluccius capensis and deepwater hake M. paradoxus make up Namibia’s most valuable fishery, and are a research priority at the Ministry of Fisheries and Marine Resources (MFMR). Exploitation of hakes (demersal trawl-fishing) in Namibia started in 1964 with catches peaking at 800,000 tons in 1972, with open access fishing by many foreign fleets. This resulted in an initial drastic decline in the stock biomass (Kirchner et al., 2012). From 1976 to 1989 the fishery was controlled by the International Commission for Southeast Atlantic Fisheries (ICSEAF), implementing a legal mesh size limit and member country quotas or total allowable catch (TAC) limits. Despite this, the stock biomass continued to decline to only 170,000 t by 1980. In 1990 Namibia became independent and the Ministry of Fisheries and Marine Resources (MFMR) took over management of the fishery on a heavily depleted resource. More stringent management measures were immediately implemented including closure of fishing to all foreign vessels, enforcement of a 200-mile exclusive economic zone and immediately reducing the TAC to 60,000 tons in 1990-1991. From 1992 to current, between 88,000 and 190,000 t (mean of 148,000 t) of hake have been caught annually (Wilhelm et al., 2015a). The Namibian hake resource is currently assessed (two stocks combined) using a Statistical Catch-at-Age Analysis (SCAA, since 1998) at between 14 and 26% of the pristine spawning stock biomass (SSB) and at 95–120% at best case scenario of SSB values of 1990 (Kirchner et al., 2012; Kathena et al., 2016). Climate-induced as well as fisheries-induced changes in growth, are expected to be evident in these stocks over the last few decades.
Merluccius paradoxus are believed to spawn on the western Agulhas Bank between 32 and 34°S in the southern Benguela (Strømme et al., 2016). The smallest juveniles caught in bottom trawls (<5 cm total length), are usually found between 31 and 32°S off the West coast of South Africa. As these fish grow, they move northwards and southwards, and fish between 15 and 65 cm total length are most frequently caught off Namibia (Strømme et al., 2016). M. paradoxus grow to about 100 cm in length and to about 12 years of age. Length at 50% maturity (L50) is 41–54 cm and age at 50% maturity (A50) 4–6 years (Durholtz et al., 2015; Wilhelm et al., 2019).
Growth rates and age information of fishes are imperative to understanding population dynamics and life history strategies, and ultimately to improve methods for sustainable exploitation. Such information can be obtained through analyzing annual growth increments in fish otoliths. There are two ways to use annual otolith increments to describe fish growth rates. Counting annual increments to determine the age of individual fish is a relatively simple method to calculate population-level growth rates using, e.g., von Bertalanffy growth parameters. This is mostly applied to incorporate individual or cohort-level growth rate effects (e.g., Pilling et al., 2002), but also to explore environmental and temporal trends using time-series data (e.g., Baudron et al., 2014). This approach is usually used at a population-level and time-invariant analysis, and misses the complexity of the drivers of growth at individual level (Morrongiello and Thresher, 2015).
The second approach is using annual otolith growth as a proxy of fish growth and relies on the fact that fish somatic growth (fish length) and otolith growth (otolith length) are strongly related. The width of each annual increment can be measured to estimate the annual growth of an individual fish over their life span. An annual growth increment on a fish otolith usually consists of one zone pair, one translucent and one opaque zone. The translucent zone is thought to form during a period of slow somatic growth and the opaque zone is thought to form during a period of fast somatic growth, which often coincides with the productive period. The width of the annual increment thus generally reflects the annual fast growth period of the fish. Consequently, otolith chronologies have been used to describe annual growth rate variability of fish and explore its environmental drivers. For example, Boehlert et al. (1989) and Dorn (1992) showed that increment width chronologies of Pacific whiting, splitnose rockfish and canary rockfish caught off the coast of California were significantly correlated to sea surface temperature and upwelling, amongst other environmental variables. In this study we used both approaches to describe changes in M. paradoxus growth over time.
Black et al. (2005) described how the dendrochronology (tree ring analysis) technique of crossdating could be applied to sclerochronology (analysis of growth increments in hard structures) using a long-lived rockfish species caught off the Californian coast. The technique assumes that climate limits growth variation over time, causing synchronous growth increment widths of individuals from the same species and climate regime. Crossdating is then the process of matching these synchronous growth patterns among individuals beginning at the known year of capture and working back through time. Resulting biochronologies are therefore annually resolved and can be readily integrated with climate data. In the California Current Ecosystem of the northeast Pacific, Black et al. (2011) demonstrated that Pacific rockfish otolith chronologies strongly reflect inter-annual variability in winter upwelling. Moreover, these rockfish chronologies strongly correlated with other biological indicators including time series of seabird reproductive success, corroborating their ability to capture climate variables associated with bottom-up forcing (Black et al., 2014). Whenever possible, all growth increment data should be crossdated prior to developing biochronologies.
Morrongiello et al. (2014) and Morrongiello and Thresher (2015) use mixed effect modeling (MEM) (Weisberg et al., 2010) to analyze growth-increment widths. MEM efficiently represents the hierarchy of otolith biochronology data (Morrongiello et al., 2014) and captures both extrinsic (time, temperature, fishery activity, and spatial structure) and intrinsic (individual, age, sex, and cohort) effects. The MEM method makes use of all available information to partition the relative impact of intrinsic and extrinsic effects on growth variability (Morrongiello and Thresher, 2015). Morrongiello and Thresher (2015) demonstrate that temporal growth rate variability in Australian tiger flathead Platycephalus richardsoni was driven by two main factors, namely annual fluctuations in environmental conditions (extrinsic) and an intrinsic cohort-specific factor that reflects density dependence and/or juvenile experience. The biochronology approach thus demonstrates important applications in broad-scale ecological connectivity and hind-casting (Black et al., 2011, 2014) as well as disentangling fisheries, environmental, and genetic effects (Morrongiello et al., 2014; Morrongiello and Thresher, 2015) and in this way enables forecasting expected responses, which is necessary for Ecosystem Approach to Fisheries (EAF) management strategies. Otolith archives and their associated data also exist for the main commercial fish species in Namibia since 1991.
This study thus aims to make use of these archived otolith resources of the heavily exploited deepwater hake, M. paradoxus, in Namibia. Of the two hake species in the Benguela M. capensis has relatively fast growth rates and considerable dating uncertainties that result in age over-estimates when enumerating otolith translucent zones (Wilhelm et al., 2013, 2015b, 2017, 2018, 2019). We therefore used M. paradoxus, given that otolith growth and zonation is less variable, likely due to the stability of their deeper habitat relative to M. capensis (Wilhelm et al., 2019). Accordingly, ages from their otoliths are generally more readily identifiable due to fewer “false zones” or “checks” on their otoliths (BCC, 2015).
The aim of this study was, first, to develop an otolith biochronology of the commercially important deepwater hake, M. paradoxus caught in the northern Benguela off Namibia using otoliths collected from 1991 to 2014. We aimed to subsequently correlate the predicted growth estimated from the biochronology with years 3–4 growth rate changes of the fish from age-length keys, and fish condition indices to validate M. paradoxus annual age determination. We additionally aimed to test the relationships between predicted annual growth form the biochronology and selected environmental/climatic factors. Lastly, we aimed to describe the long-term changes in length-at-age of M. paradoxus using the first approach to age determination with current and historical data (from which otoliths had not been archived).
Materials and Methods
The Study Species and Sample Collection
Merluccius paradoxus were collected during routine biomass surveys conducted by the Ministry of Fisheries and Marine Resources, Namibia (MFMR) covering the Namibian coast from 17 to 29°S (Figure 1 and Table 1). Otoliths were available from surveys conducted since 1991 and ±30 otoliths were randomly selected from fish ≥35 cm, within ±5-year intervals from 1991 through 2013, totalling an initial 258 otoliths. Because of the truncated stock structure and distribution of M. paradoxus as described by Strømme et al. (2016) not many >65 cm M. paradoxus were available from survey catches in Namibia (Table 1).
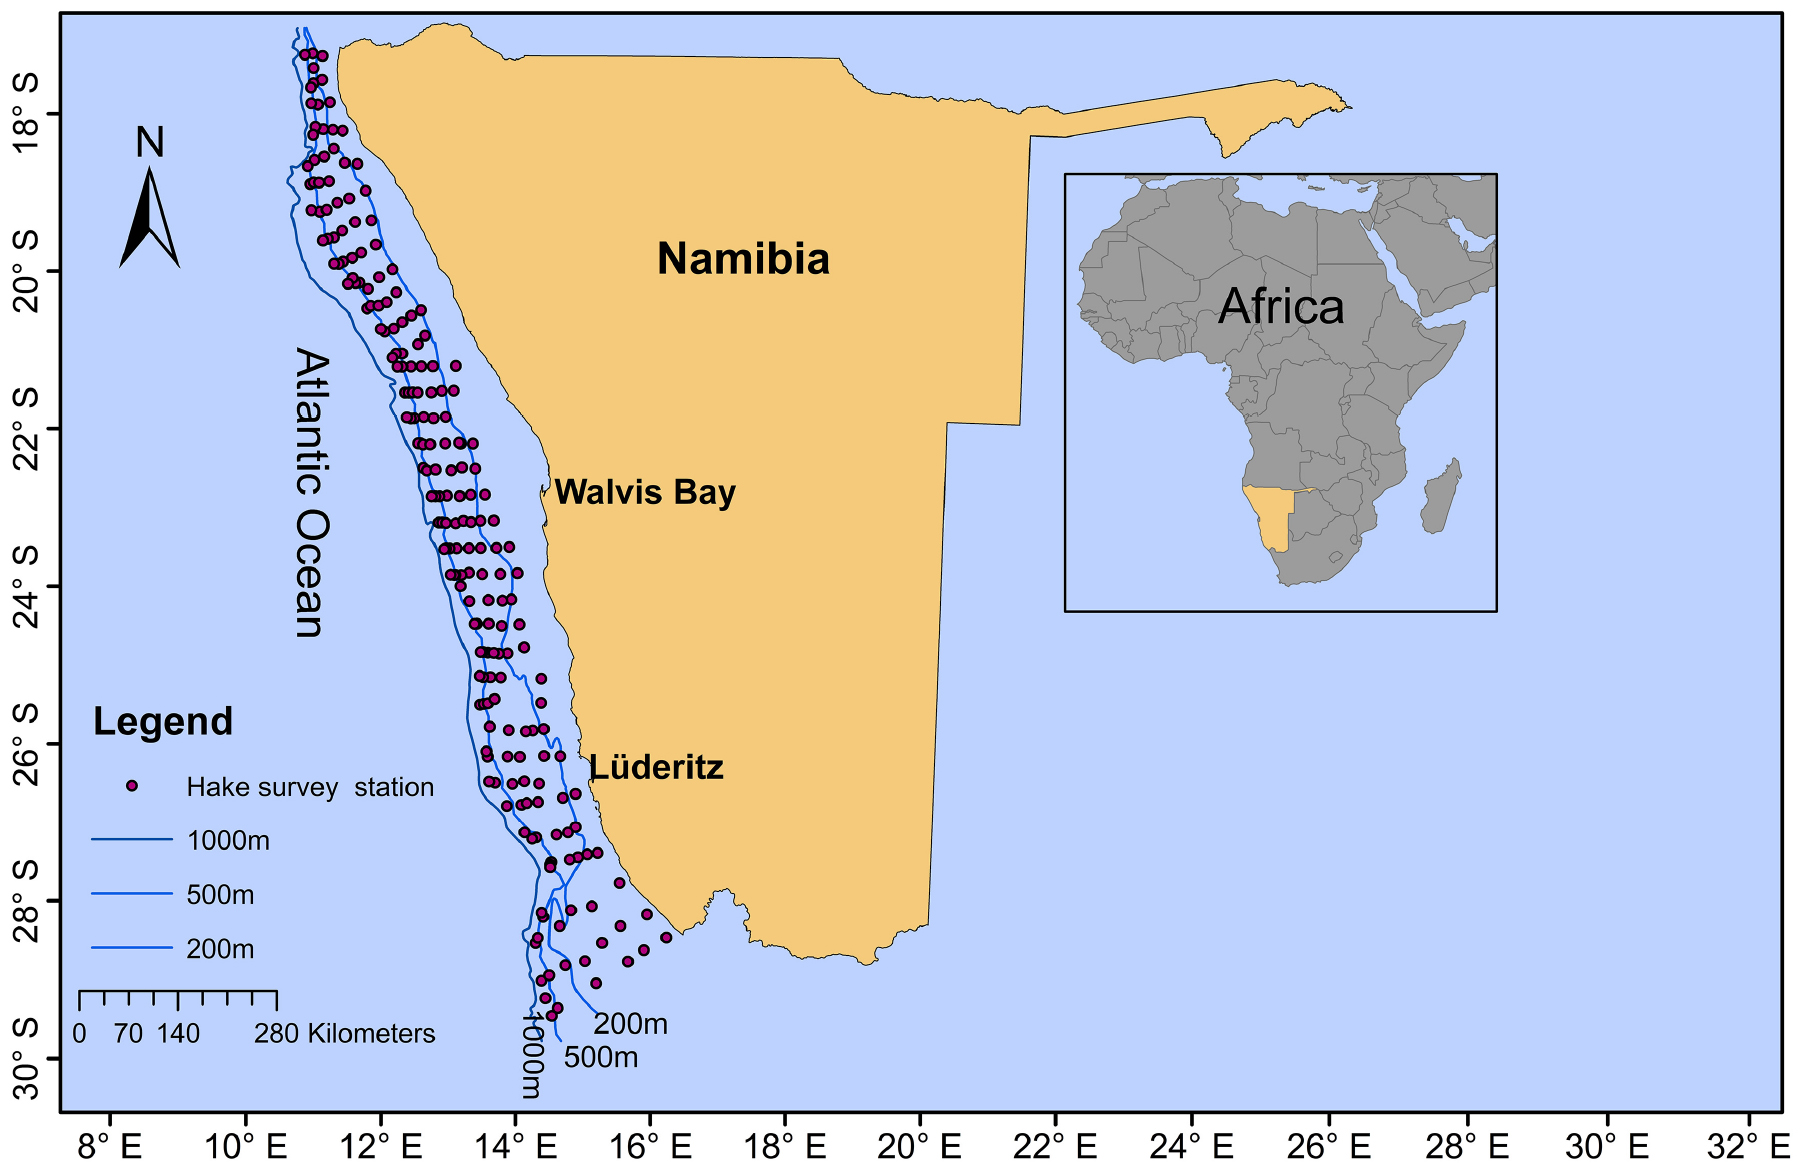
Figure 1. Sampling area and demersal (hake) summer survey stations (red dots) from which samples were selected for the Merluccius paradoxus otolith chronology along the Namibian coast. Bottom depth contours (200, 500, and 1,000 m) are indicated by blue lines.
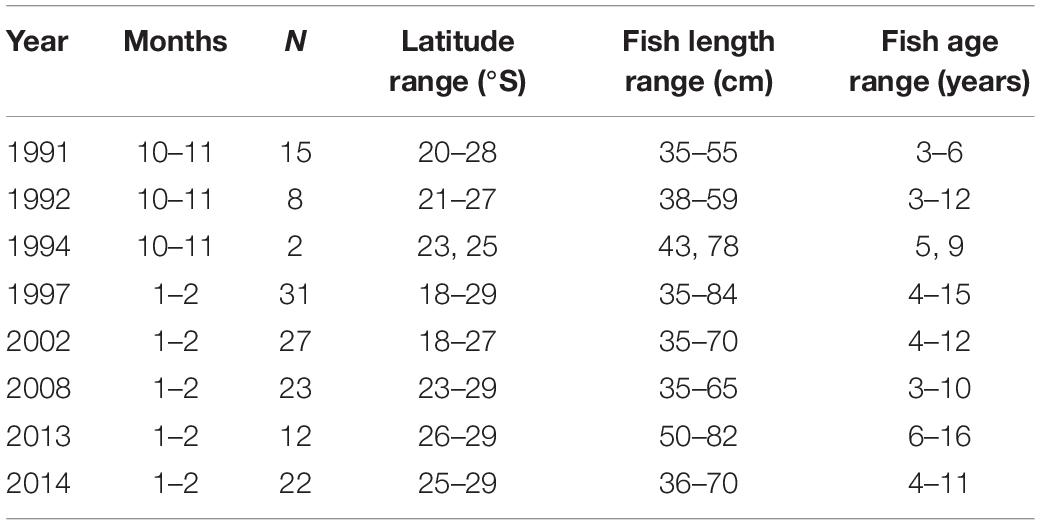
Table 1. Sample sizes (N), age and length ranges of Merluccius paradoxus used for the final dataset of the otolith biochronology, sampled during Namibian hake biomass surveys 1991 to 2014.
Merluccius paradoxus were assumed to spawn in austral spring to summer (September to February) (Jansen et al., 2015). Thus the translucent zones on the otoliths of M. paradoxus were assumed to form mainly in spring (September–October), which has been validated with edge analysis (ICSEAF, 1983a; BCC, 2015; MW, unpublished data). In addition, most of the fish were caught January-February (Table 1), and most of them had translucent zones near or on the edge of the otolith, indicating that they had just completed these in spring or early summer or were still completing them in late summer. One increment was designated as the couplet of the relatively wide opaque zone and the relatively narrow translucent zone. Measurement of the last increment, if complete, was thus assumed to be from the austral spring-early summer (near the end of the previous year) to the summer of the year before, and thus reflected growth of mostly that calendar year (over austral autumn, winter and spring). For example, if a fish was caught in February 2014, the last complete increment was assumed to reflect growth from October 2012 to October 2013, and the second-last from October 2011 to October 2012, continuing backward in time. If incomplete, the last increment was omitted from the analysis.
Otolith Chronologies
In the laboratory, the otoliths were embedded in epoxy resin and transversally sectioned through the nucleus at 0.5 mm thickness using a low-speed double-bladed saw. The sections were mounted onto glass slides using CrystalbondTM adhesive. After drying, otoliths were polished with 10 μm lapping film to improve the clarity of the macrostructures. Each otolith was digitally photographed using Image-Pro® Plus Version 6.0 (Media Cybernetics, Inc.) software under a Leica dissecting microscope at 3.2× magnification.
Once imaged, the width of each annual otolith growth increment was measured using ImageJ 1.49d1 (Abramoff et al., 2004) and the macro ObjectJ plugin Version 1.03p.2 ImageJ was used here because of free access and accessibility for multiple users and computers. Each growth increment was measured from the end of the translucent zone to the end of the next translucent zone. Increments were measured from the dorsal edge to the nucleus of the sectioned otolith perpendicular to the annual growth zone. Some otoliths were measured along the axis of maximum growth (Figure 2A). However, for most otoliths, increments were only discernible on the nucleus-to-medial-edge axis of the otolith. In that case, they were measured along this axis from the medial edge to the nucleus of the sectioned otolith (Figure 2B). The axis of measurement was noted, and accounted for in the mixed effects model. The nuclear opaque area plus first translucent zone (age 0-year to 1-year growth) was not used as measurement. Only clearly discernible increments were measured, and thus of the initial 258 selected otoliths, only 140 were used in the final data set (Table 1).
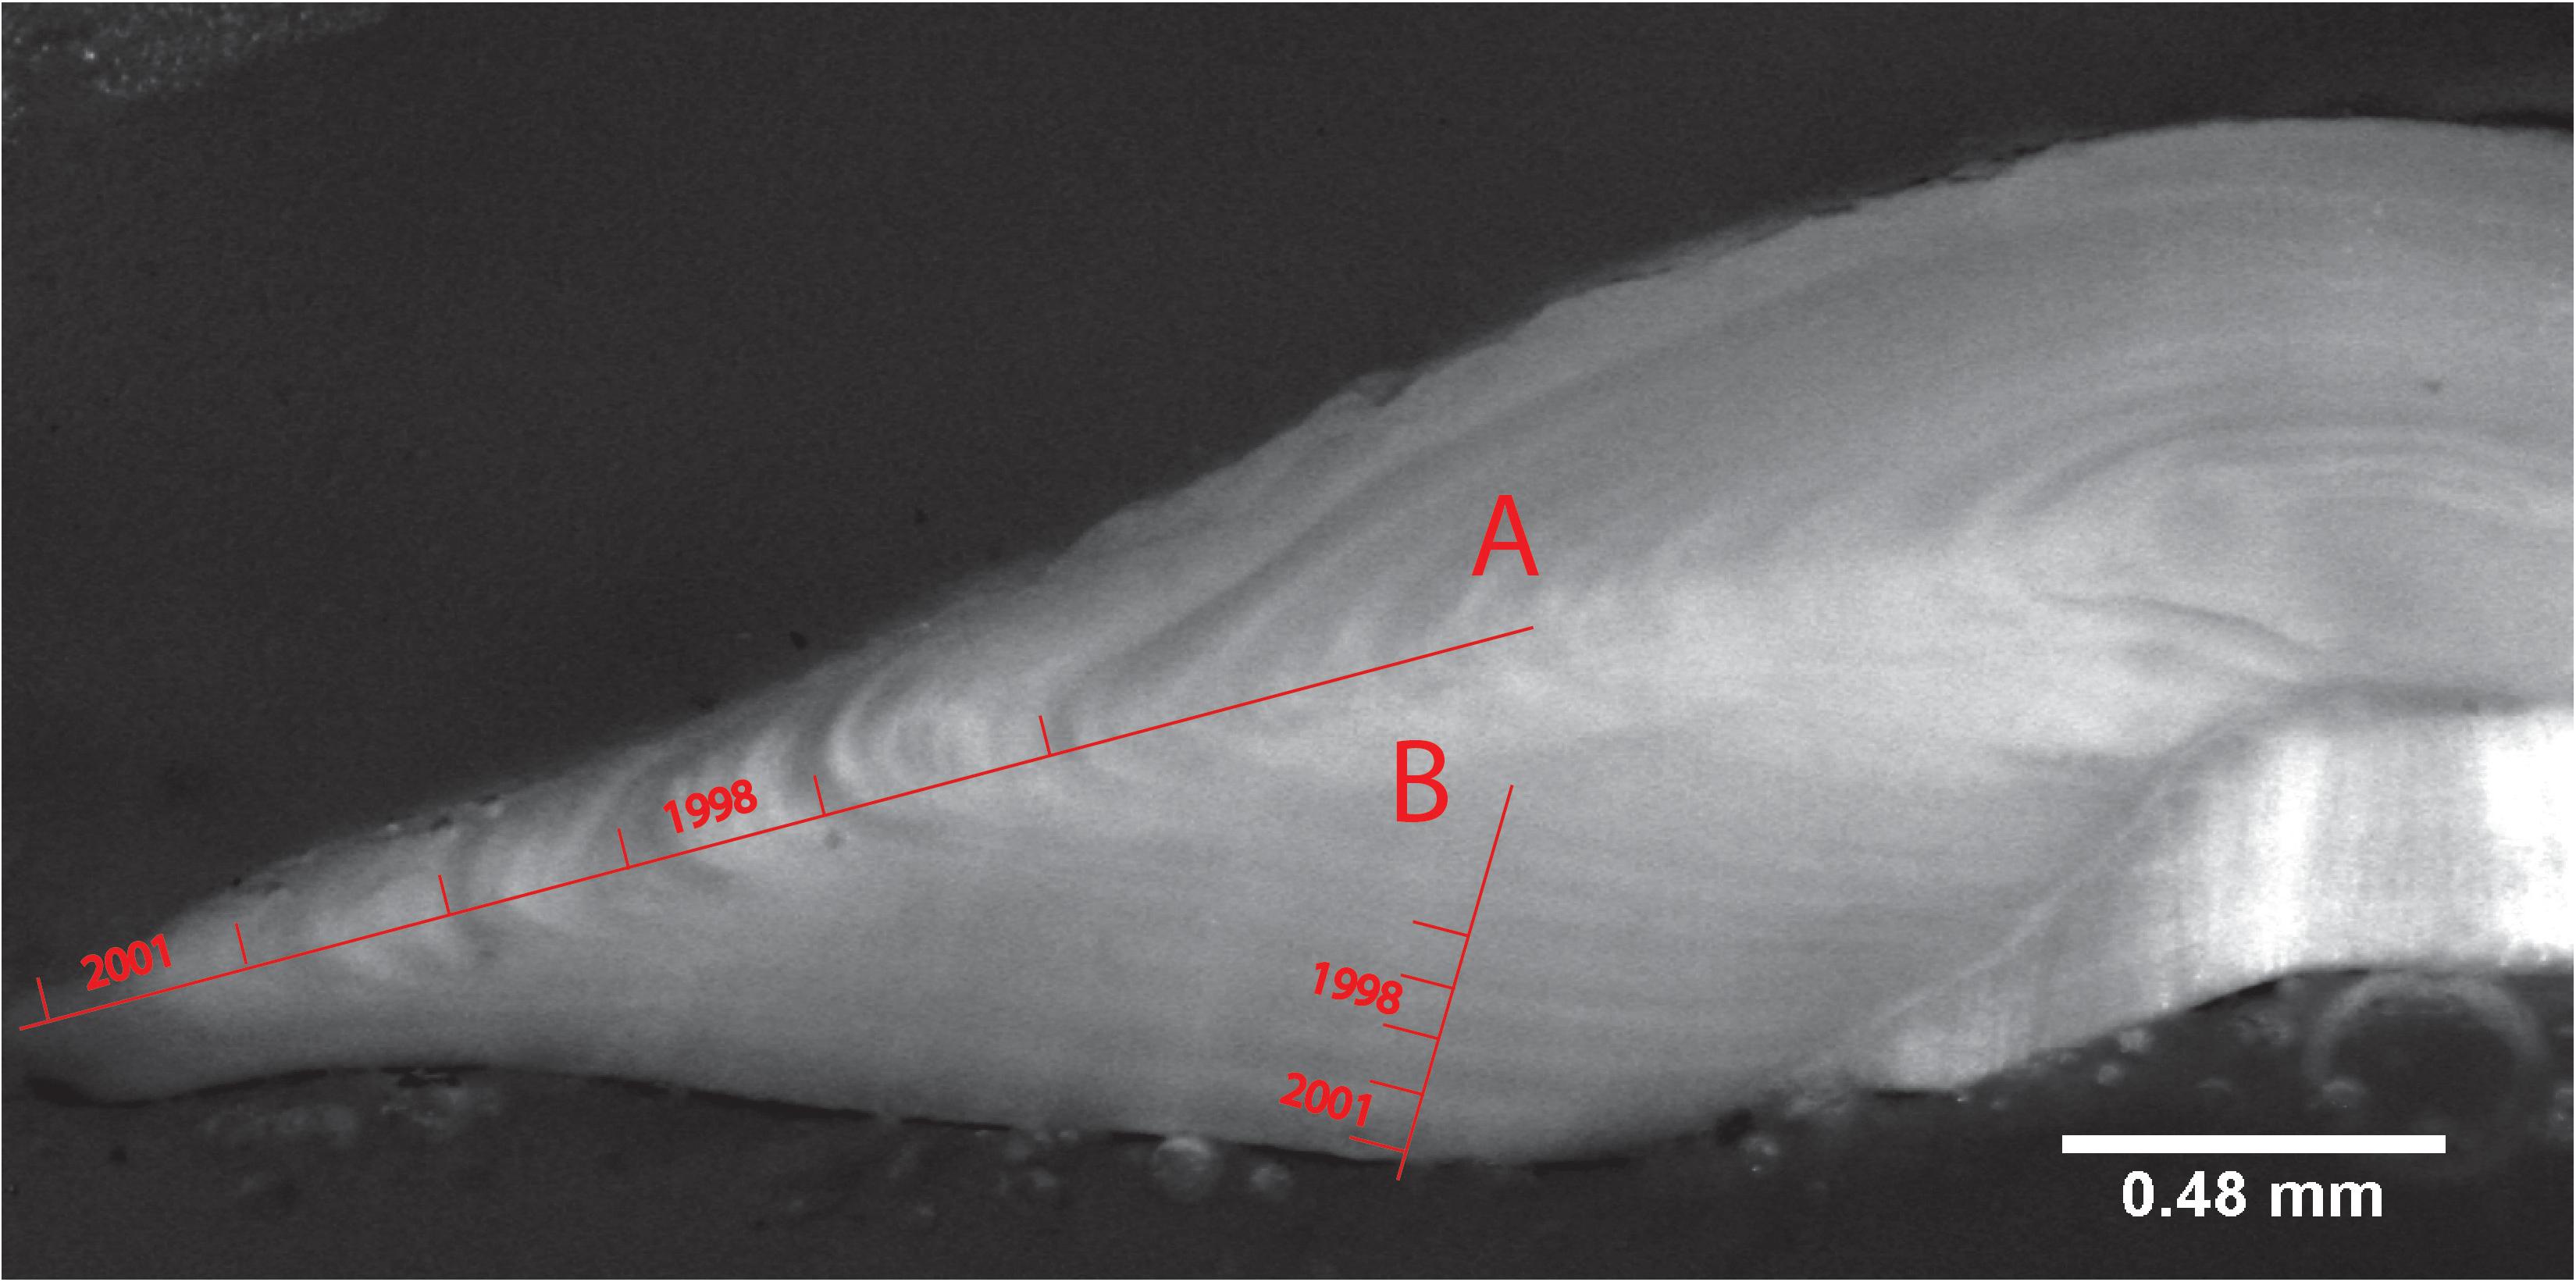
Figure 2. Anterior view of a right-side sliced otolith of a 6-year old female M. paradoxus caught off Namibia in February 2002. The otolith is viewed with reflected light at 3.2× magnification. Lines show the end of a growth zone marked with the years (spring to spring) that they represent on (A) the “long” axis and (B) the “short” nucleus-to-medial-edge axis.
Where possible (in cases when the time series and overlap of increments was long enough), increment measurements were visually cross-dated (Black et al., 2005).
Mixed Effects Modeling
Once increments were marked and cross-dated, each fish was assigned a final age-at-capture (AAC) and Cohort. Cohort was defined as the year of birth of the fish (calculated for February-caught fish as: year of capture – AAC – 1). Each raw otolith increment width measurement in mm (Inc) was assigned an age at the time of increment formation (Age) and calendar year of increment formation (Year). Before analysis, otolith increment-widths, Age, and AAC were log-transformed and mean-centered. These data were then used in a mixed effects model, to relate increment width (Inc), the response variable, to a series of intrinsic (fish-specific) and extrinsic (environmental, represented by inter-annual variation) factors (Morrongiello and Thresher, 2015). Intrinsic factors included Age, AAC, Sex (of the individual fish, male or female), allowing for the interaction between Age and Sex, measurement Axis (“Long” or “Short,” see Figure 2) on the otolith, allowing for the interaction between Axis and Age, Cohort and FishID (each individual sample’s unique identification). Age, AAC, Sex and Axis were treated as fixed effects. The effects of Cohort and FishID intercepts were treated as random effects. FishID accounts for pseudo-replication, i.e., correlation of the same individual due to genetic ID and sample preparation. Cohort accounts for density dependence and/or juvenile experience. The AAC term was included to correct for biases associated with sampling (skewed age distributions) and tests for bias associated with growth-rate based selectivity (Morrongiello and Thresher, 2015). Year intercept was treated as a random effect. Further random effects included were by-FishID, by-Cohort, and by-Year random slopes for the effects of age. Equation 1 shows the full model fitted to the entire otolith chronology data series 1982–2012 (Table 1).
A series of mixed effects models (Weisberg et al., 2010; Morrongiello and Thresher, 2015) was used to test for the best possible combination of the explanatory variables, testing all possible combinations of fixed effects and random effects, intercept and slope for random effects [denoted by e.g., log(Age)| FishID, Equation 1]. The most parsimonious model was selected using maximum likelihood estimates of error and the lowest Akaike’s Information Criterion (AIC) corrected for small sample sizes (AICc) (Burnham and Anderson, 2002; Zuur et al., 2009). The optimal selected model was refitted with restricted maximum likelihood (REML) to produce unbiased parameter estimates (Zuur et al., 2009), using the random effects of year (intercept) to produce a best linear unbiased predictor of growth (BLUP) for each year 1982–2012. The BLUP time series was used to visualize the temporal pattern of M. paradoxus growth variability and was correlated with an independently calculated growth rate, a fish condition index as well as environmental data/indices that represent local and remote forcing. All analyses were performed in R Version 3.5.0 (R Core Team, 2018), with libraries lme4 (Bates et al., 2015), AICcmodavg (Mazerolle, 2019), effects (Fox, 2003; Fox and Weisberg, 2019), and lattice (Sarkar, 2008) for plotting.
Annual Population-Level Age 3 Growth
Annual age-length-keys (ALKs), used in the Namibian hake stock assessments and read from whole otoliths collected in January-February of each year, were available from 2000 to 2016 (SP, MFMR, unpublished data). These were used to calculate mean lengths at each age 1 to 7 years for each calendar year (Supplementary Table S1). These data were used to calculate change in length from age 3 to 4 years (G3) from calendar year y to the next, at the population level, by the following equation:
where y = the year of growth, L3y = length at age 3 in calendar year y, and L4y + 1 = length at age 4 in calendar year y + 1 (Supplementary Table S1). Growth from age 3 to 4 years was used because these fish are in the juvenile-to-sexually mature-adult transition (Wilhelm et al., 2015a) and are no longer influenced by cohort effects or hatch timing (this study, data not shown).
Fish Condition Index
Biological data collected from Namibian hake biomass surveys from 1994 to 2013 (Table 2) were used to calculate mean relative weight as a measure of fish condition for that year for M. paradoxus. Relative weight was calculated by dividing by survey-measured wet weight of each individual fish by the expected weight. Expected weight was calculated using a length-weight relationship:
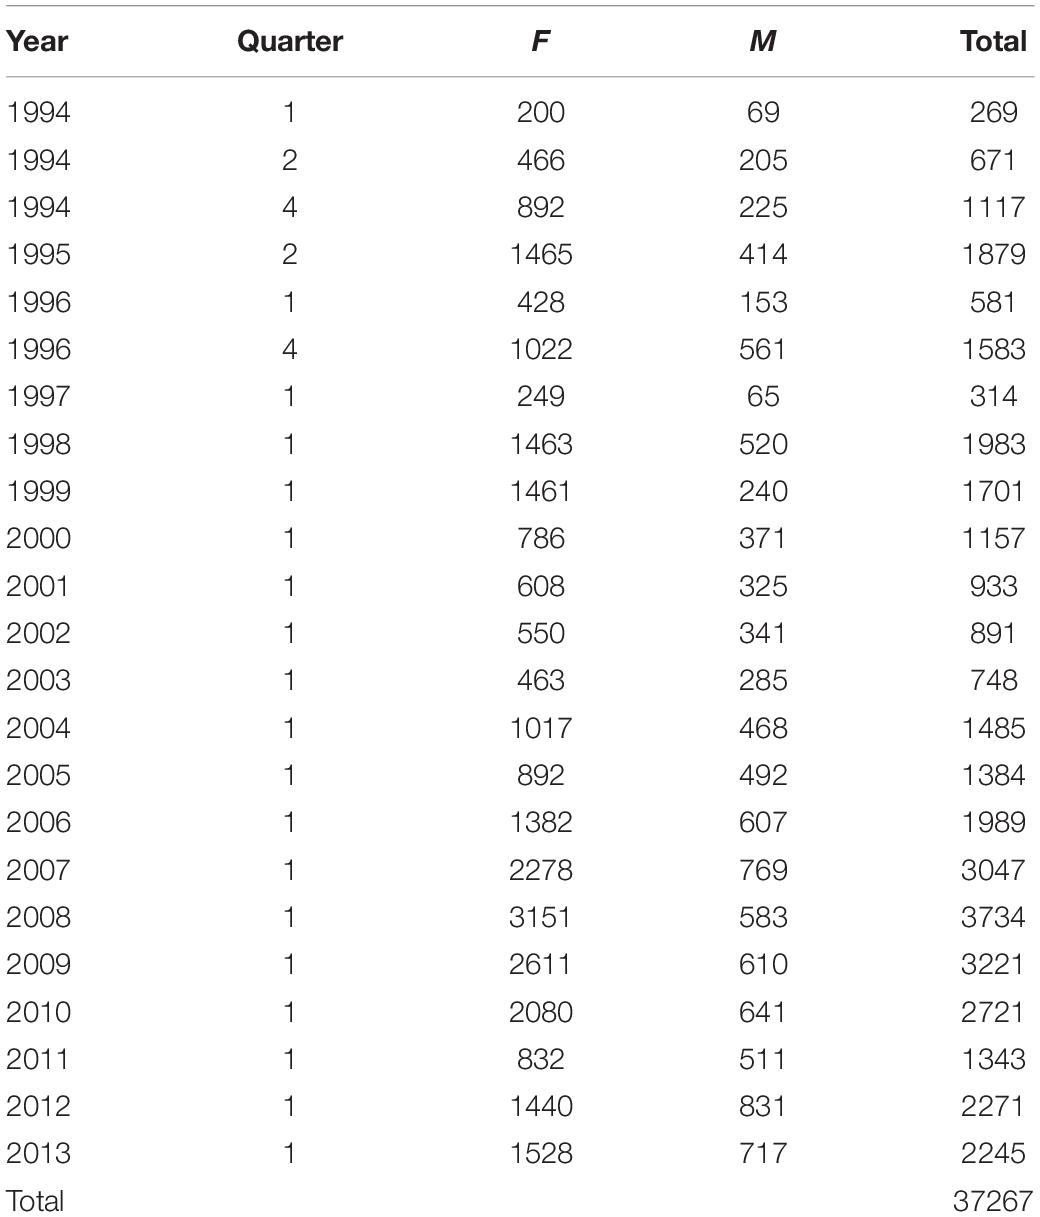
Table 2. Sample sizes of biological samples of Merluccius paradoxus females (F), males (M), and total used for each biomass survey, in austral summer (quarter 1), autumn (quarter 2) or spring (quarter 4) 1994 to 2013.
where We = expected weight in g, Lt = total fish length in cm, and a and b are constants calculated for all fish measured for all surveys 1999–2013, a = 3.10 and b = −2.31 (Supplementary Figure S1).
After the data were cleaned for obvious errors using weight-length plots, the mean relative weight was calculated for each survey 1994 to 2013 for all fish between 25 and 59 cm. Most surveys were conducted in Quarter 1, January and February, while before 1997 surveys were also conducted in Quarter 2, April and May and Quarter 4, September to November (Table 2). Prior to 1997 not all years had surveys in the first quarter of the year, and there may also have been area and length sampling differences between these surveys. Thus, a General Linear Mixed Effects Model (GLMM) was performed in order to calculate a mean relative weight (condition index) for each year (keeping year as a random effect), taking into account all other variables (the unbalanced sampling design).
The full model, which was also the best-fit model (AICc = −78582.9, Supplementary Table S2) was as follows:
where W = wet weight of fish i in g, Lt = total length of fish i in cm (continuous variable). All other factors were added as categorical variables: Sex = male or female or unsexed, Lat = latitude to the nearest degree in which fish i was caught (17–29°S), Year = year of sampling (1994–2013), Quarter = sampling quarter of the year, either 1 (summer), 2 (autumn), or 4 (spring) using the same centring function, model selection procedures and R-packages as explained for Equation 1. Within the selection procedure, Quarter and Lat were also added as random effects to test for the best fit model. The model-estimated random intercept for each year was antilogged to obtain a relative weight for that year to be used for comparison with the otolith chronology annual growth estimate.
Environmental Data
The BLUP time series from the mixed effect model was correlated (Pearson’s Correlation Coefficient) with an upwelling index, chlorophyll-a concentration, and sea surface temperature (SST) as indicators of local environmental drivers. The environmental variables were used as monthly, three-monthly and annual means and were correlated with the annual BLUP they overlapped with (lag 0 and lag 1 for spring), as well as lagged by 1 year for all (lag 1 and lag 2 for spring).
Similar to Lamont et al. (2018a), daily NCEP-DOE Reanalysis 2 wind vectors (Kanamitsu et al., 2002) along the coast were used to calculate daily values of Ekman transport (m3 s–1) per 100 m of coastline at the Lüderitz upwelling cell (27°30′′S) in the northern Benguela (15–29°S), and at the Namaqua upwelling cell in the southern Benguela (30°S). Daily values of cumulative offshore transport were summed per month to obtain total monthly values, which were then used as an indicator of upwelling variability.
Chlorophyll-a (chl-a) concentrations were calculated in mg m–3 using MODIS satellite data from the Giovanni website3 for the period 2002–2013 at 4 km resolution (Acker and Leptoukh, 2007). The chl-a data were summarized to calculate monthly means for each of six zones within the northern part of the Benguela ecosystem. These were defined by homogeneity in severity and seasonality of the Chl-a concentration as: Zone 1: the Angola-Benguela Front (14–19°S, 7–12°E); Zone 2: nBUS N upwelling cell (19–21°S, 8–14°E); Zone 3: nBUS Center upwelling cell (21–23°S, 9–14°E); Zone 4: nBUS S upwelling cell (23–26°S, 10–15°E); Zone 5: Lüderitz upwelling cell (26–28°S, 10–15°E) and Zone 6: the Orange River-Namaqua upwelling cell (28–30°S, 11–17°E). For the purposes of overlap with the main M. paradoxus distribution, only Zones 4–6 were used.
Average monthly sea surface temperature (SST) values were extracted from the NOAA National Centre for Environmental System (NCEP) database4 (Reynolds et al., 2002) for the area 24–28°S, 13–15°E from January 1982 to October 2016.
Indicators of remote drivers of M. paradoxus growth included the mean monthly multivariate ENSO index (MEI) (Wolter and Timlin, 1993) as an indicator of El Niño–Southern Oscillation (ENSO) as well as the Antarctic Annular Oscillation Index (AAO), which is the dominant 700 mb height anomalies poleward of 20°S that captures decadal-scale climate variability in the Southern Hemisphere (Thompson and Wallace, 2000). These climate indicators were correlated with the BLUP of annual M. paradoxus growth. MEI and AAO were obtained from KNMI Climate Explorer.5
Historical Length-at-Age
Finally, in order to view possible changes in fish growth over time over a period longer than the chronology time series, ALKs were retrieved from literature (ICSEAF, 1977, 1978, 1979, 1980, 1981, 1982, 1983b, 1984, 1985, 1987) for M. paradoxus caught in ICSEAF Divisions 1.3, 1.4 and 1.5 (off Namibia). ALKs from the three divisions and different countries and fleets were pooled by 3-month periods for each year (January–March, April–June, July–September, and October–December). Mean length at each age group a (1–8) was then calculated from each pooled ALK by:
where fi = frequency of the age group in length class i, xi = class mark of length class i and Σfa = total frequency in age group a. (Sum of lengths of each individual fish in that age group divided by the total number of fish in the age group). Historical (ICSEAF data) mean lengths-at-age were used together with the current (Supplementary Table S1), and time-related directional changes in fish growth were investigated by linear regressions of mean lengths against year of capture (for each age group).
Results
The best supported model of the growth increment data (Supplementary Figure S2) was that which included fixed effects for Age and Axis, and random effects intercept and slope for Year and FishID (AICc = 603.14, Conditional R2 = 0.820, Supplementary Tables S3, S4 and Table 3). The selected model explained 82% of the variation in M. paradoxus growth. Age-at-capture did not add significantly to the explanation of otolith growth variation, meaning there was no evidence for biases associated with the sampling scheme. Sex of the fish, cohort, and latitude at which the individual fish was caught did not add significantly to changes in growth variation. Growth declined significantly with age (Figure 3A). The differences in mean increment width against age between short and long axes are shown in Figures 3B,C. From the random effects of Year, annual growth was lowest for 2003, after which mean growth rates appeared to increase toward 2013. However, no significant negative or positive trend in predicted growth was apparent over the time series from 1982 to 2013, which was dominated by decadal variability rather than a long-term trend (Figure 4 and Table 4).
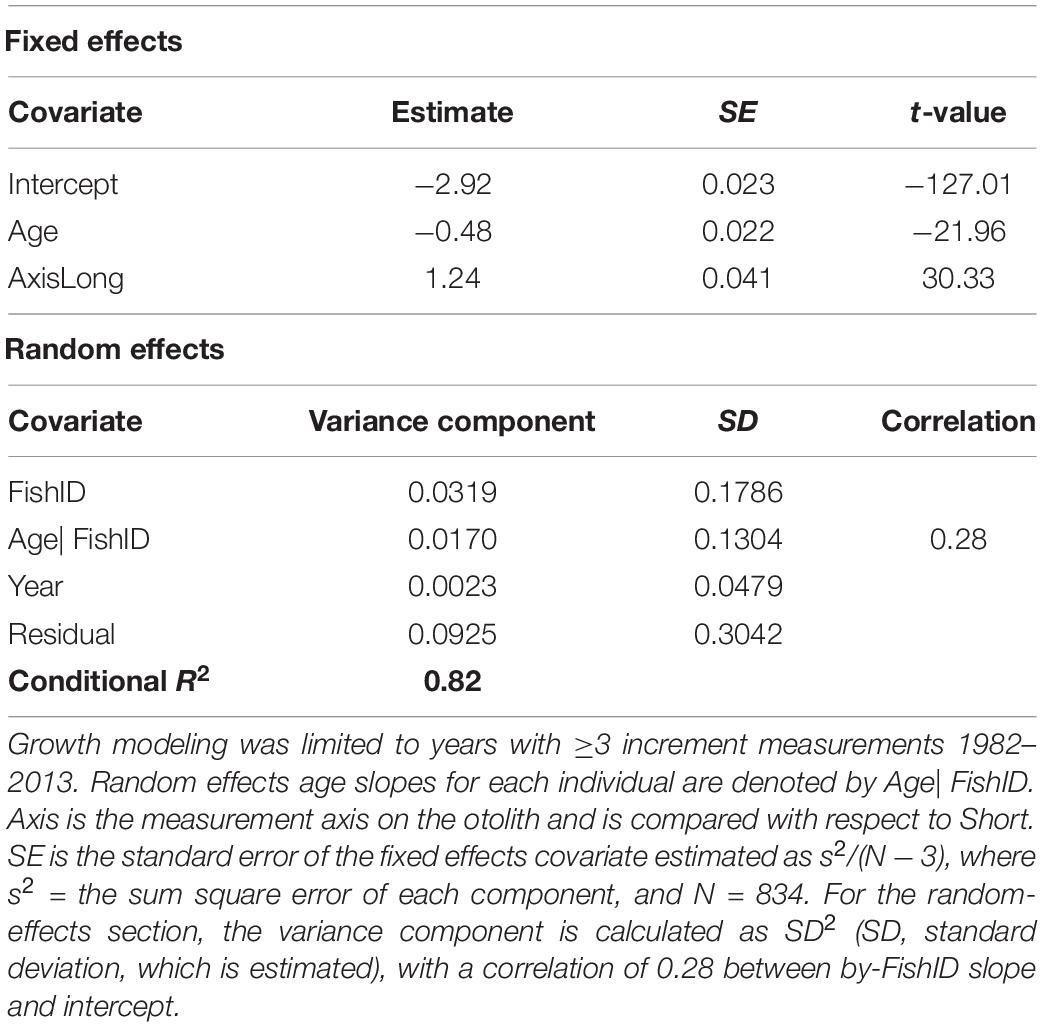
Table 3. Optimal model parameter estimates and test statistics describing Fixed and Random sources of growth variation in Merluccius paradoxus caught along the Namibian coast 1991 to 2013 (Table 1).
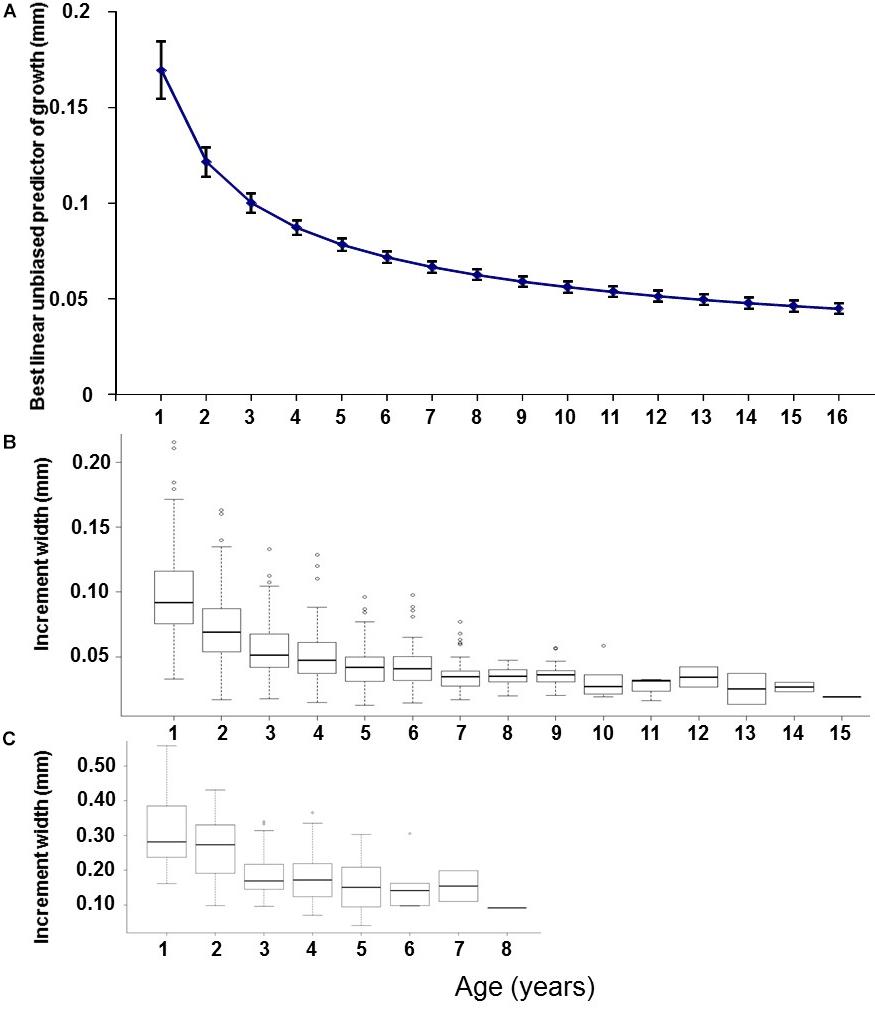
Figure 3. (A) Predicted growth (mm) against age estimated in the full mixed effects model (mean age-related growth decline), back-transformed to the original scale. (B) Boxplots of absolute otolith increment width (mm) against age for the short measurement axis and (C) the long measurement axis, all for 140 otoliths of M. paradoxus caught off Namibia.
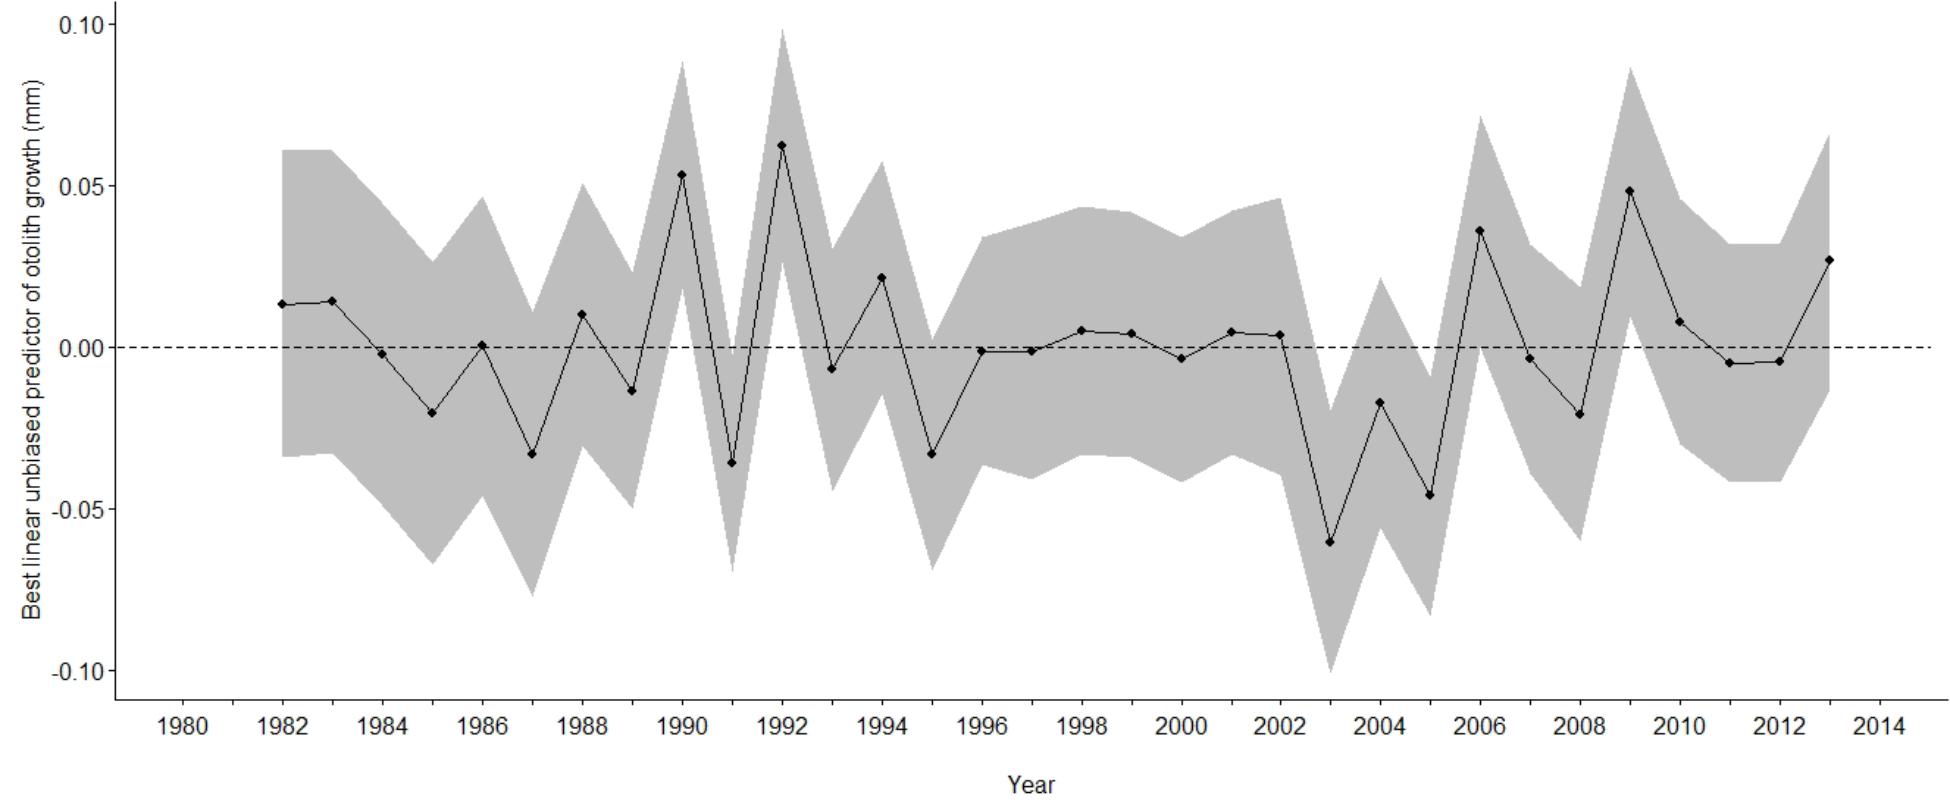
Figure 4. Best linear unbiased predictor of growth, (dots and solid lines) against year of M. paradoxus caught off Namibia estimated from the most parsimonious mixed effects model on otolith increments (Table 3). Grayed areas indicate 95% confidence limits and the dashed line indicates mean growth.
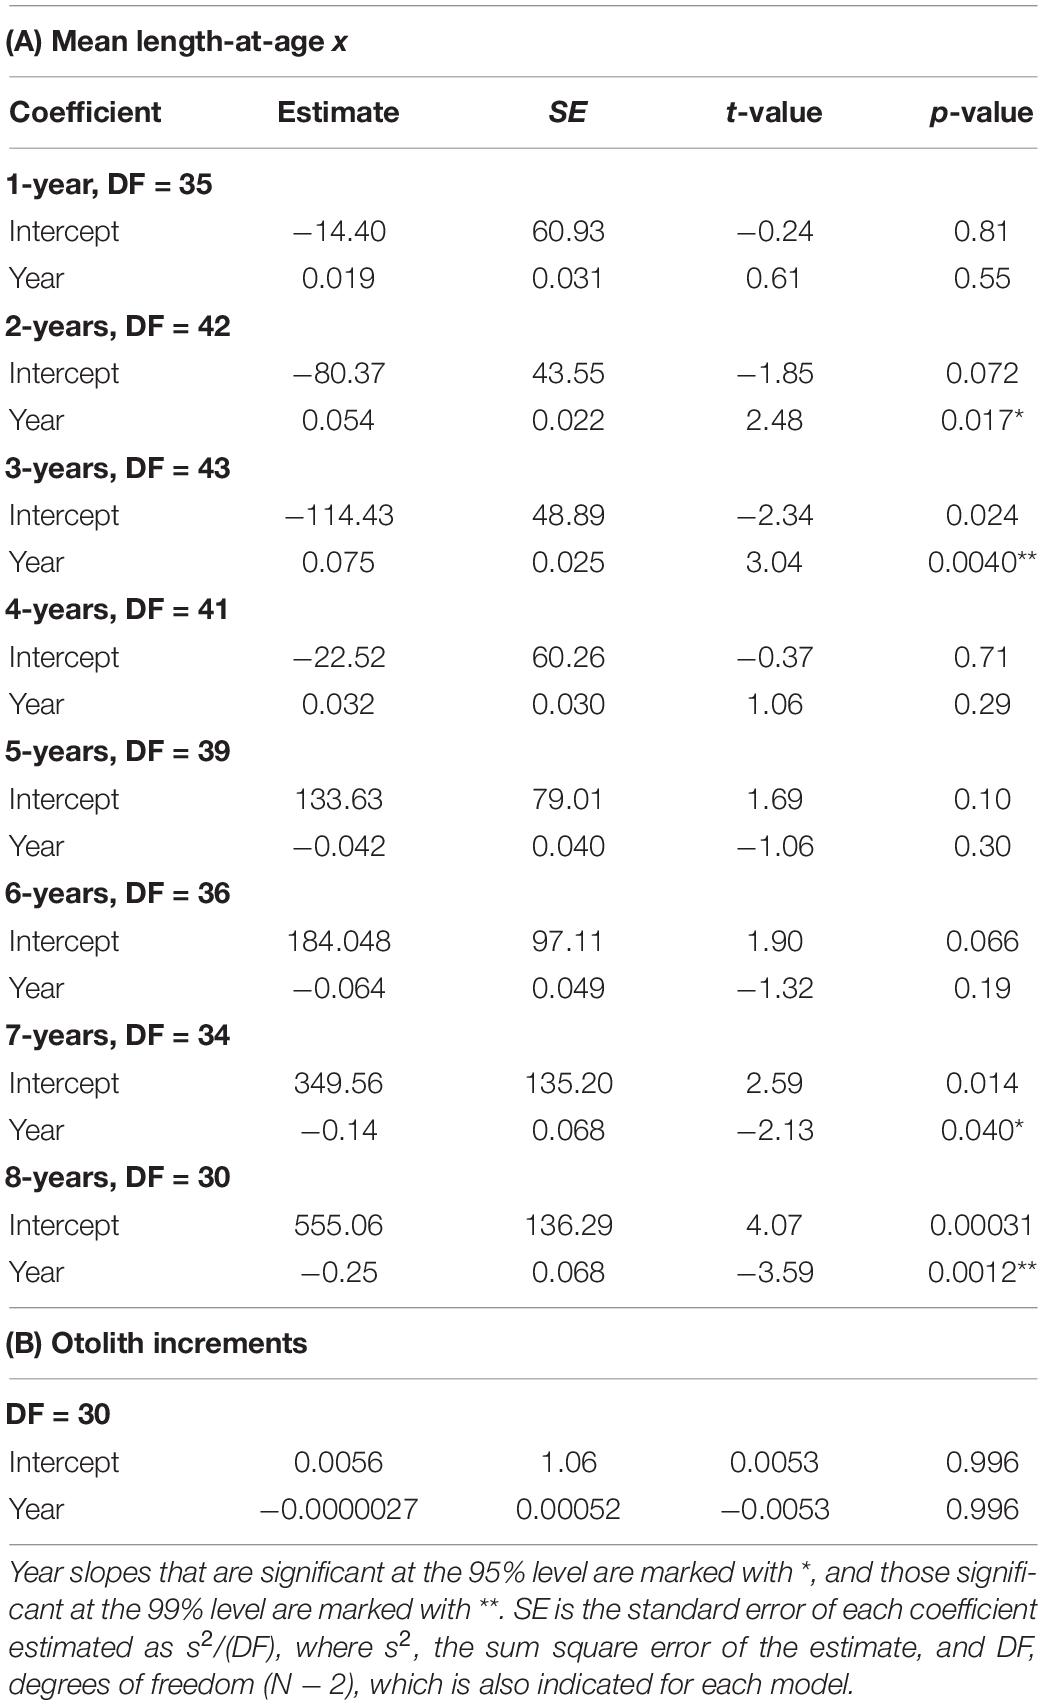
Table 4. Regression results of (A) Mean length-at-age 1–8 years against year of sampling (Year), calculated from otolith-based age-length keys of Merluccius paradoxus caught off Namibia 1977 to 1987 from literature (ICSEAF, 1977, 1978, 1979, 1980, 1981, 1982, 1983b, 1984, 1985, 1987) and 1999 to 2016 from current data (SP, MFMR, and Supplementary Table S1) and (B) BLUP of growth from the otolith increments against year.
Mean annual population-level growth at age 3 years varied between 6 and 9 cm per year, 2000–2013 (Figure 5). Age-3 mean population-level growth per year was strongly positively correlated with the mean (individual-level) BLUP of growth from otolith increments (ρ = 0.730, n = 14, p < 0.01), overlapping from 2000 through 2013.
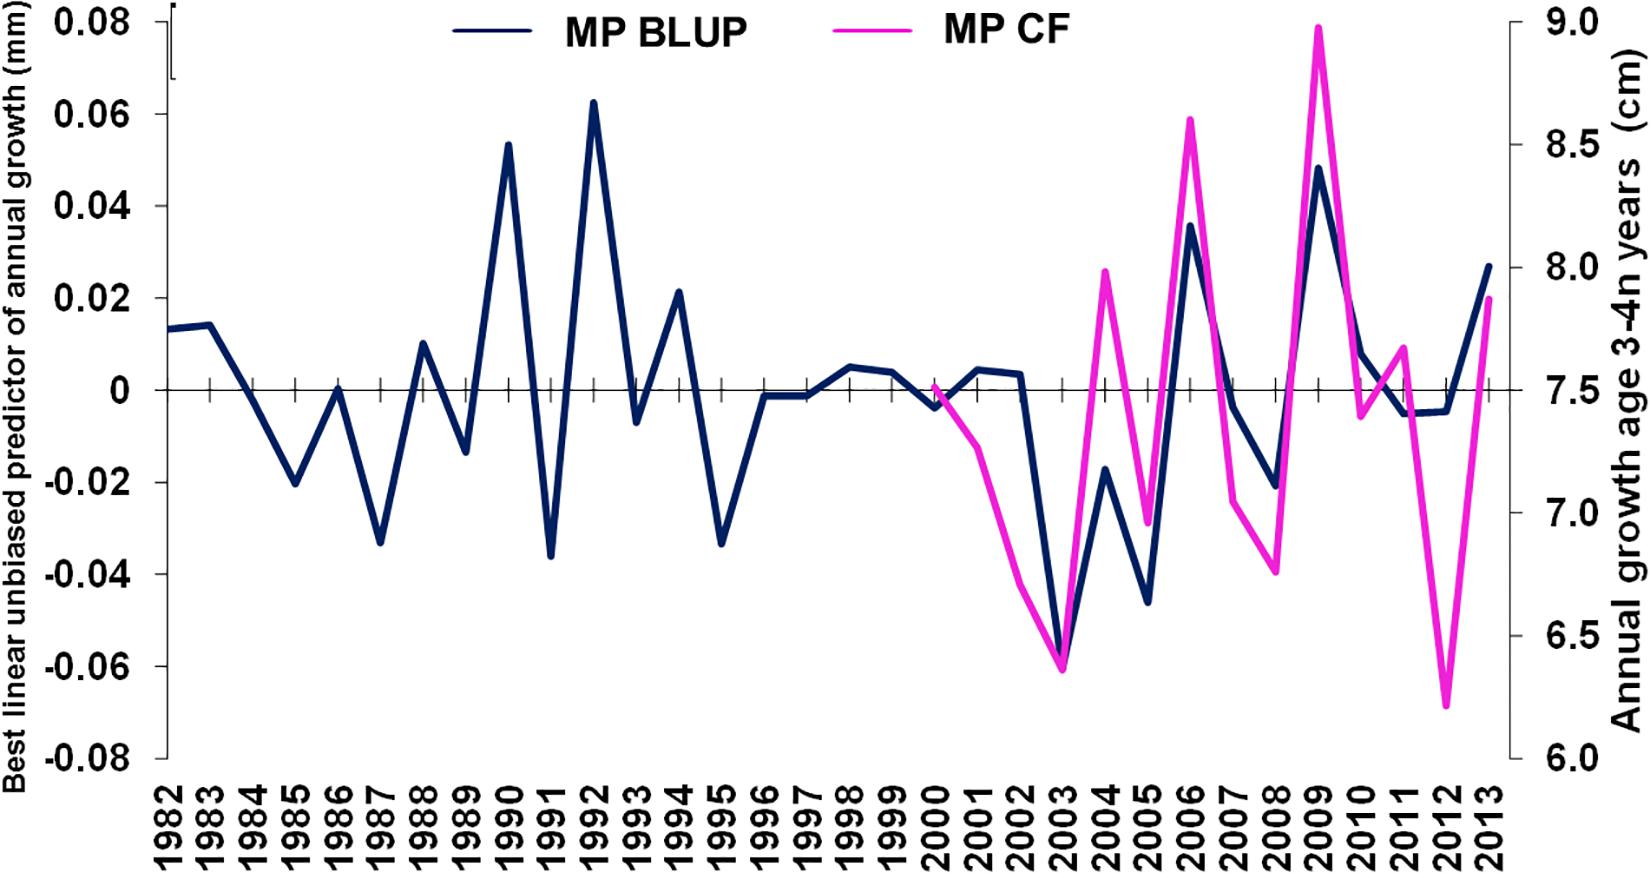
Figure 5. Merluccius paradoxus (MP) caught in Namibia best linear unbiased predictor (BLUP) of annual growth from otolith increments (blue) and age 3 annual growth calculated from annual age-length keys (pink) against year.
The GLMM-estimated relative weight (Supplementary Table S5) was used as an estimate of summer fish condition factor of M. paradoxus (see Supplementary Figure S3). Condition factor was weakly positively correlated with BLUP of growth from otolith increments (ρ = 0.358, n = 20, p < 0.2, Figure 6), overlapping in the period 1994–2013.
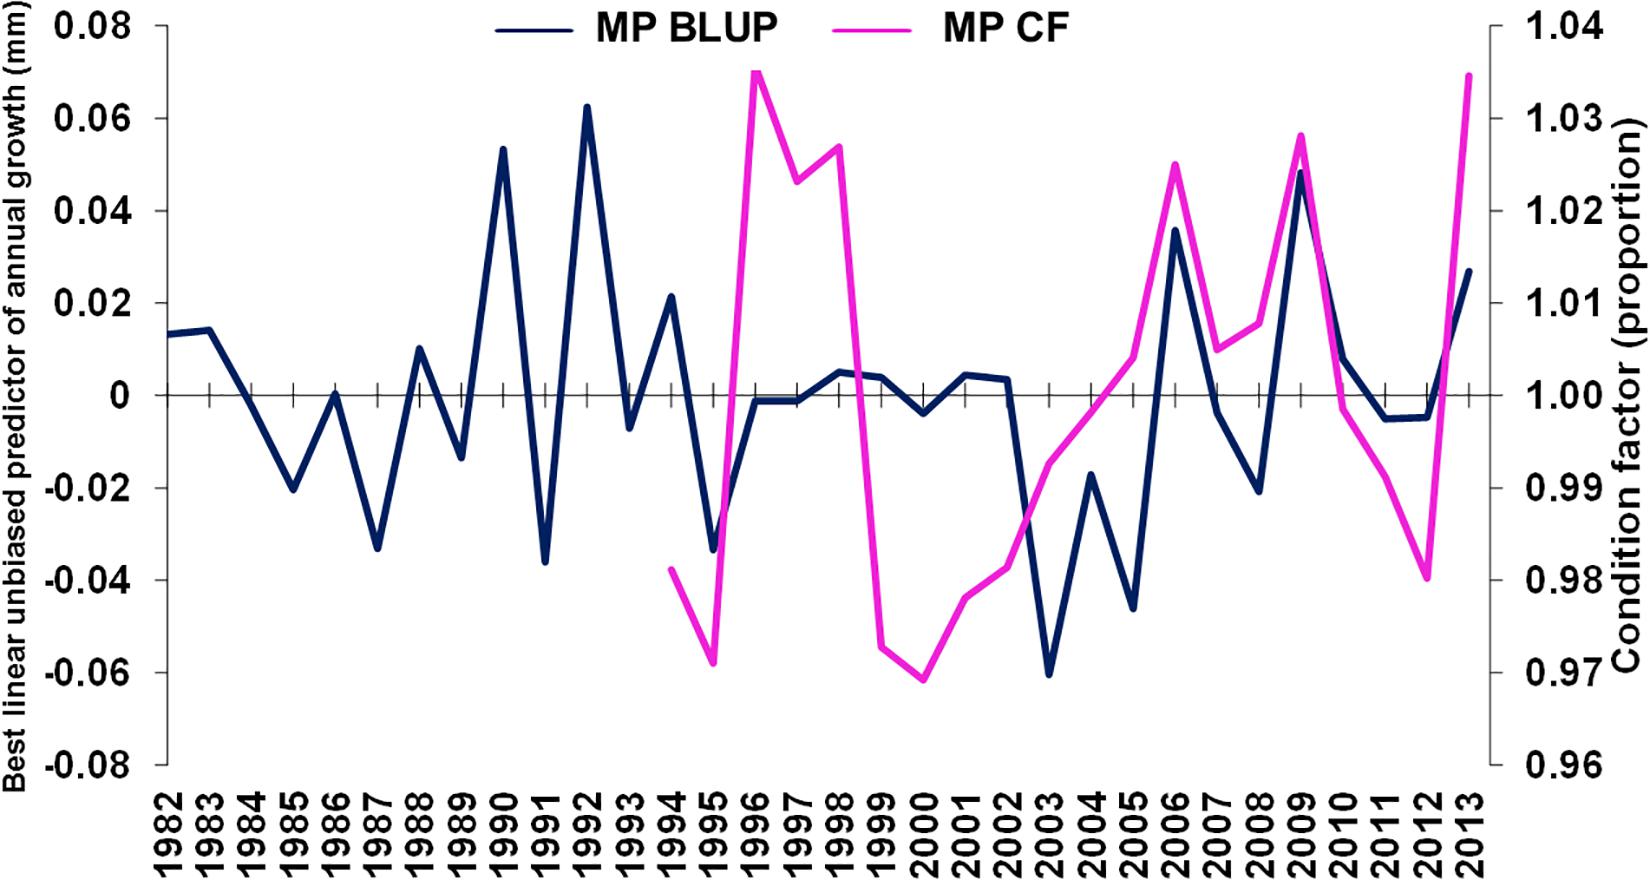
Figure 6. Merluccius paradoxus (MP) caught in Namibia predicted annual growth from otolith increments (blue) and GLMM condition factor (CF, pink) against year.
The best environmental indicators for M. paradoxus BLUP of growth from otolith increments were the August and July–September mean upwelling index in the 30°S area, southern Benguela (Supplementary Figure S4B), the August, October, and August–October (austral winter to spring) mean chl-a concentrations at the Namaqua upwelling cell in the southern Benguela (Supplementary Figure S5B) and the October and previous December–February SSTs in the 24–28°S area (Supplementary Figure S6). BLUP of otolith growth significantly positively correlated with the August upwelling index (ρ = 0.411, n = 32, p < 0.05) and the July–September upwelling index (ρ = 0.414, n = 32, p < 0.05) 1982–2013 at 30°S in the southern Benguela (Figure 7). BLUP of otolith growth also significantly positively correlated with the August (ρ = 0.734, n = 12, p < 0.01), October (ρ = 0.587, n = 12, p < 0.05) and August–October (ρ = 0.600, n = 12, p < 0.05) mean chlorophyll-a concentrations 2002–2013 in the 28–30°S area (Figure 8). Predicted growth significantly negatively correlated with October (austral spring) (ρ = −0.381, n = 32, p < 0.05) and previous December to February (austral summer) (ρ = −0.355, n = 32, p < 0.05) mean SSTs 24–28°S (Figure 9). Mean annual growth did not correlate with the upwelling index at the Lüderitz upwelling cell (Supplementary Figure S4A), the chlorophyll-a concentrations in all other areas (Supplementary Figure S5), the climate data lagged by 1 year (Supplementary Figures S7–S9) or the MEI or the AAO (Supplementary Figure S10).
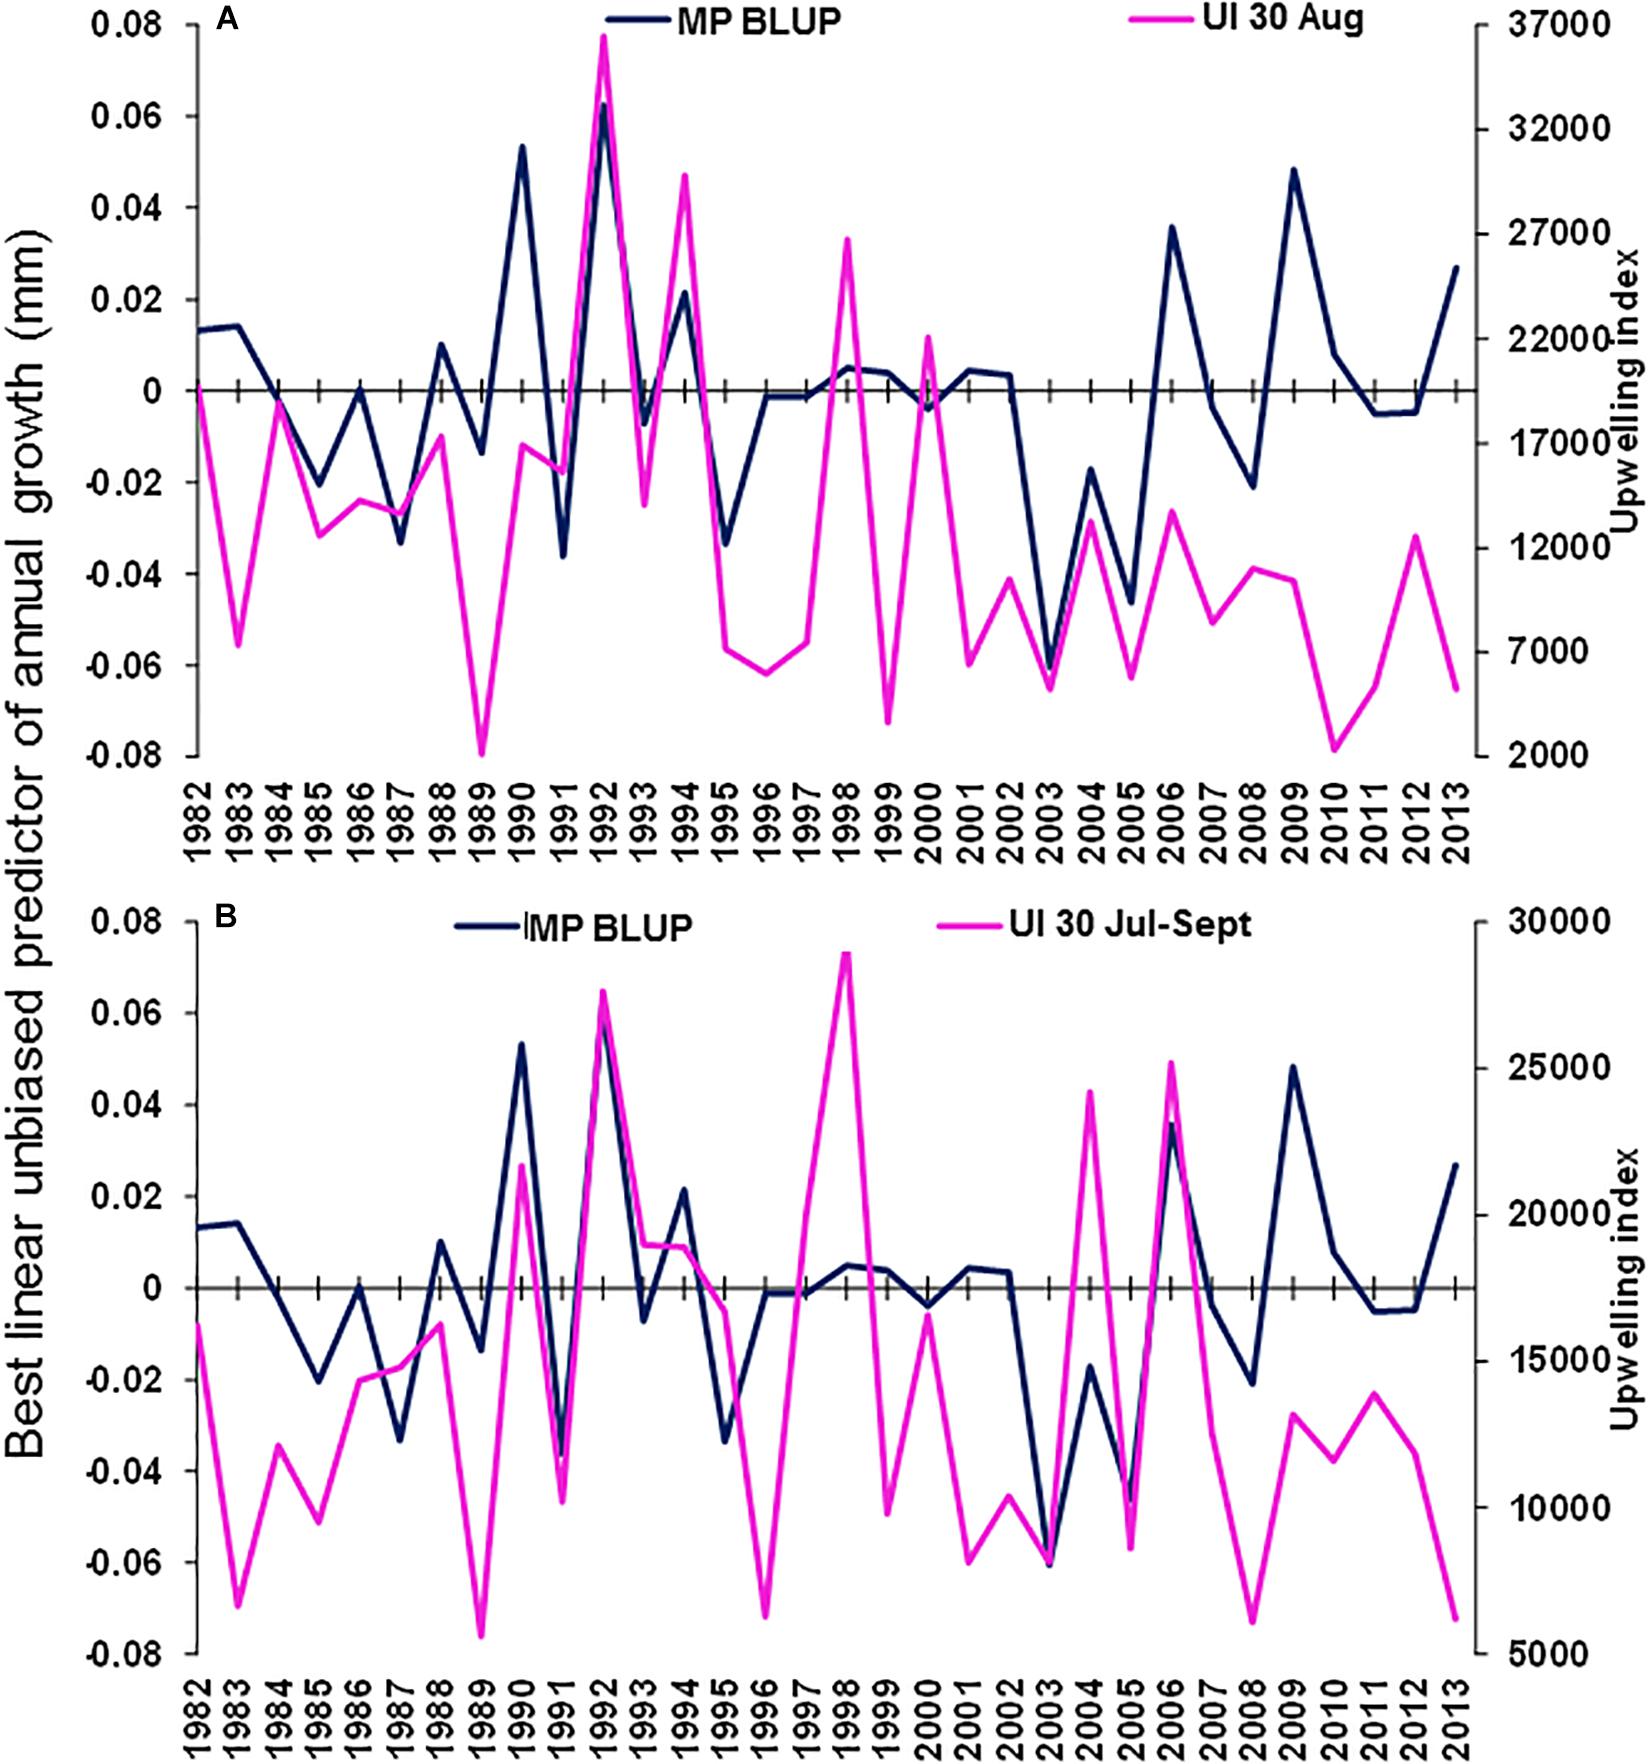
Figure 7. Merluccius paradoxus (MP) caught in Namibia best linear unbiased predictor (BLUP) of annual growth from otolith increments (blue) and the (A) August and (B) August–October mean upwelling index (UI) along the coast for the southern Benguela at –30.0 latitude (30) (pink).
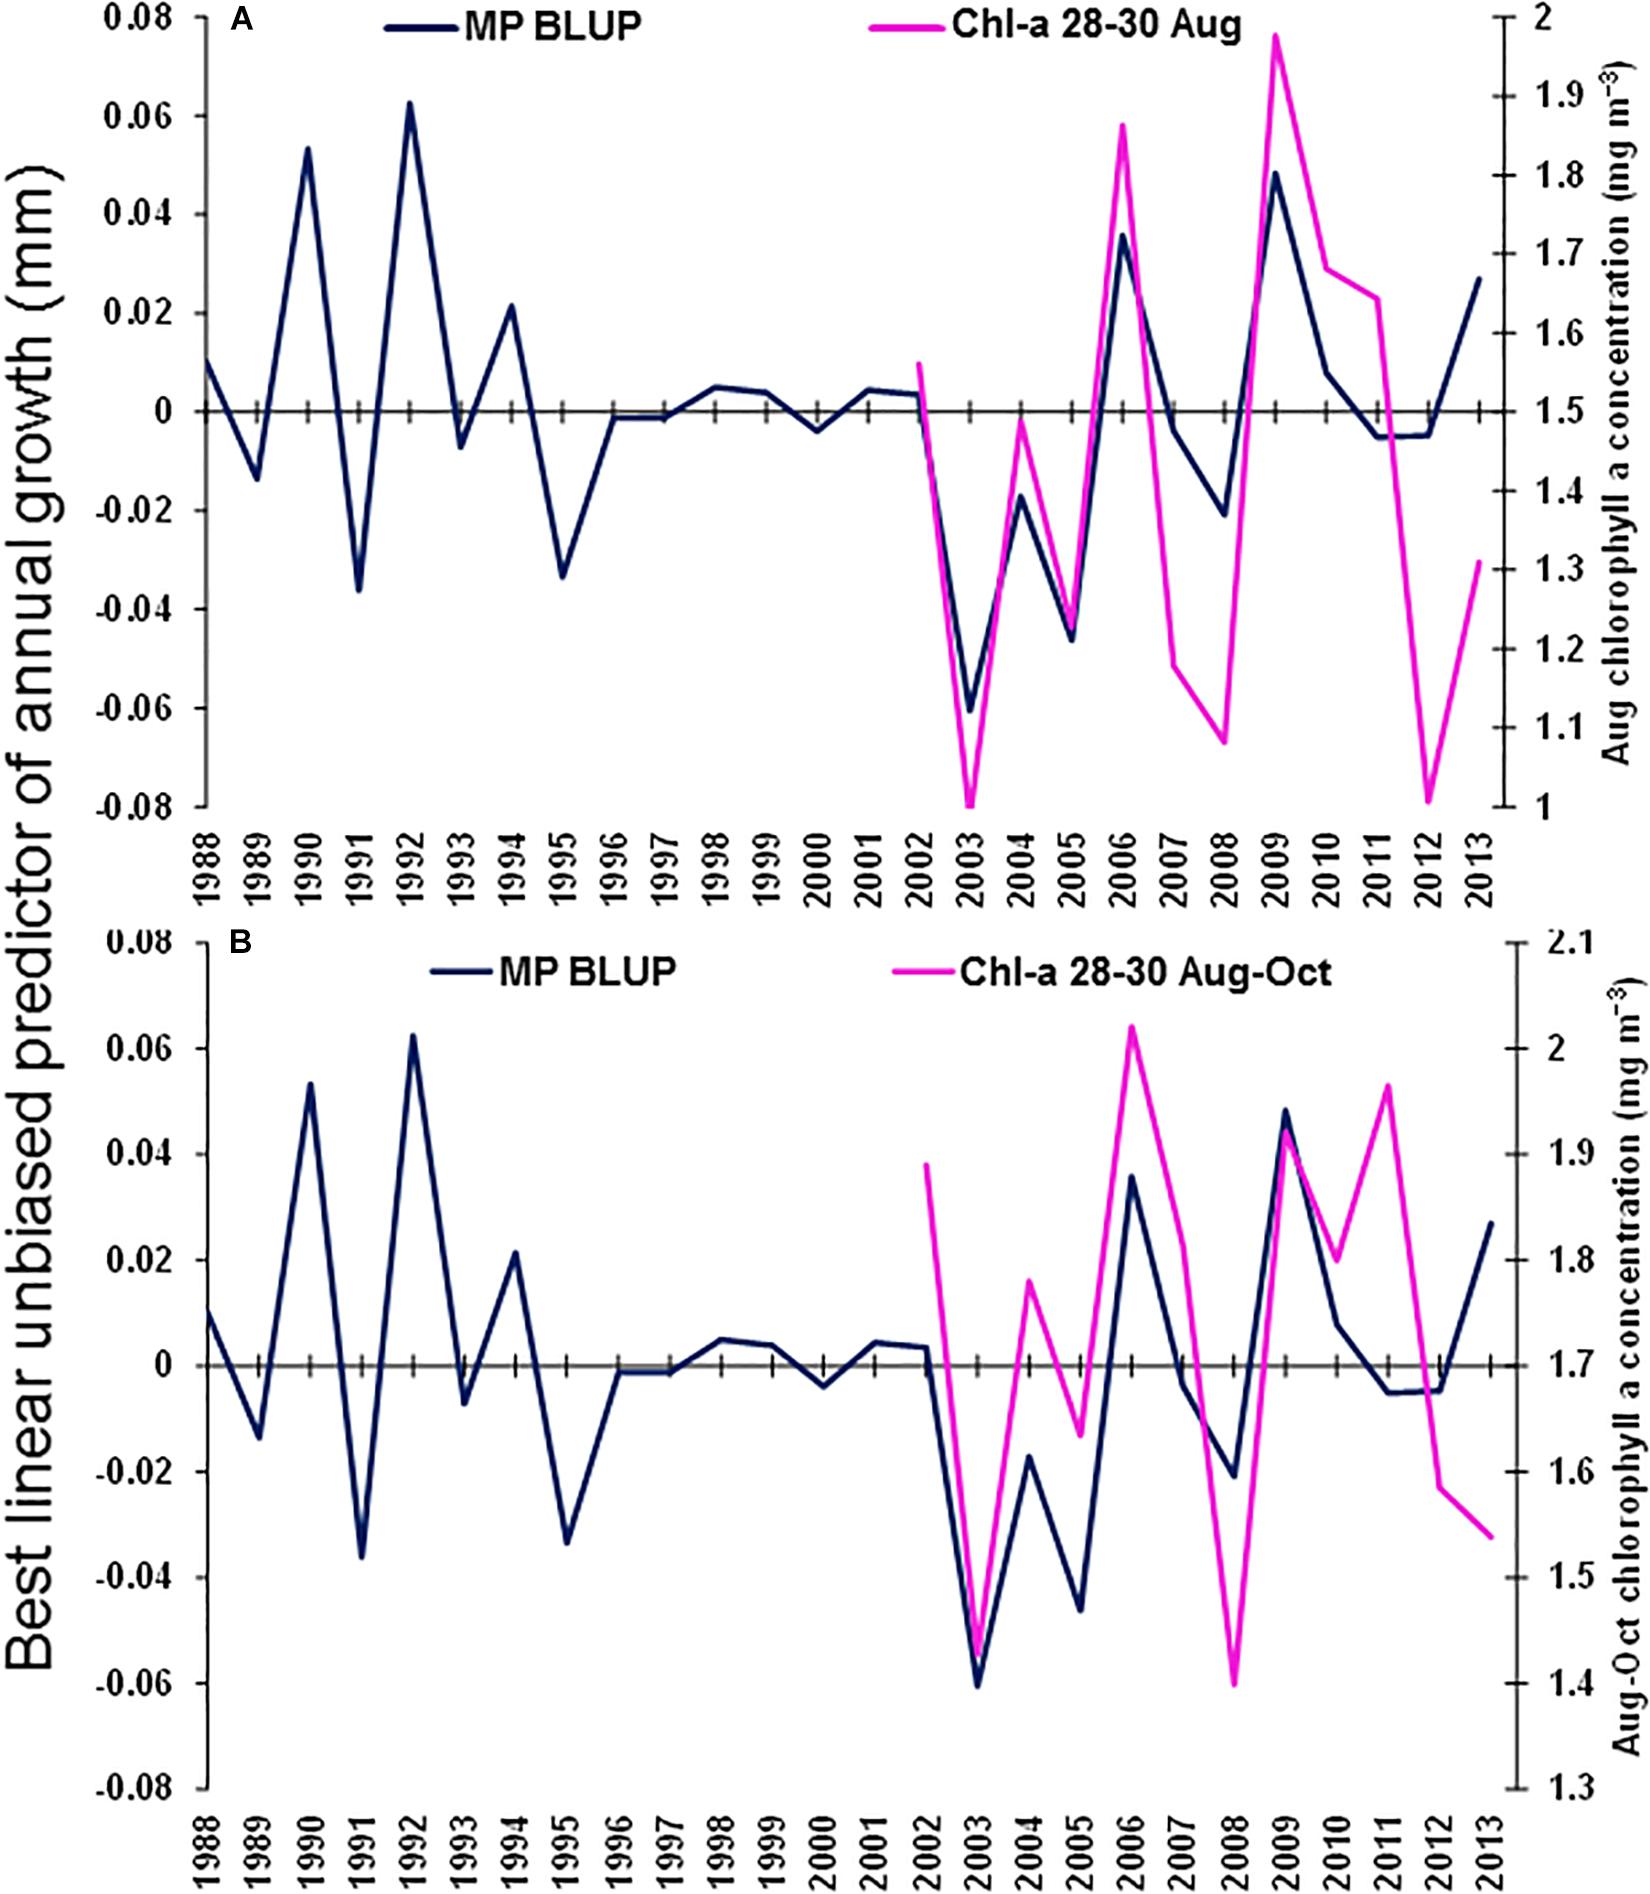
Figure 8. Merluccius paradoxus (MP) caught in Namibia best linear unbiased predictor (BLUP) of annual growth from otolith increments (blue) and (A) August mean chlorophyll-a concentration (Chl-a 28–30 August); and (B) August to October mean chlorophyll-a concentration (Chl-a 28–30 August–October); both in the area –28.0 to –30.0 latitude and 11.0 to 17.0 longitude (pink).
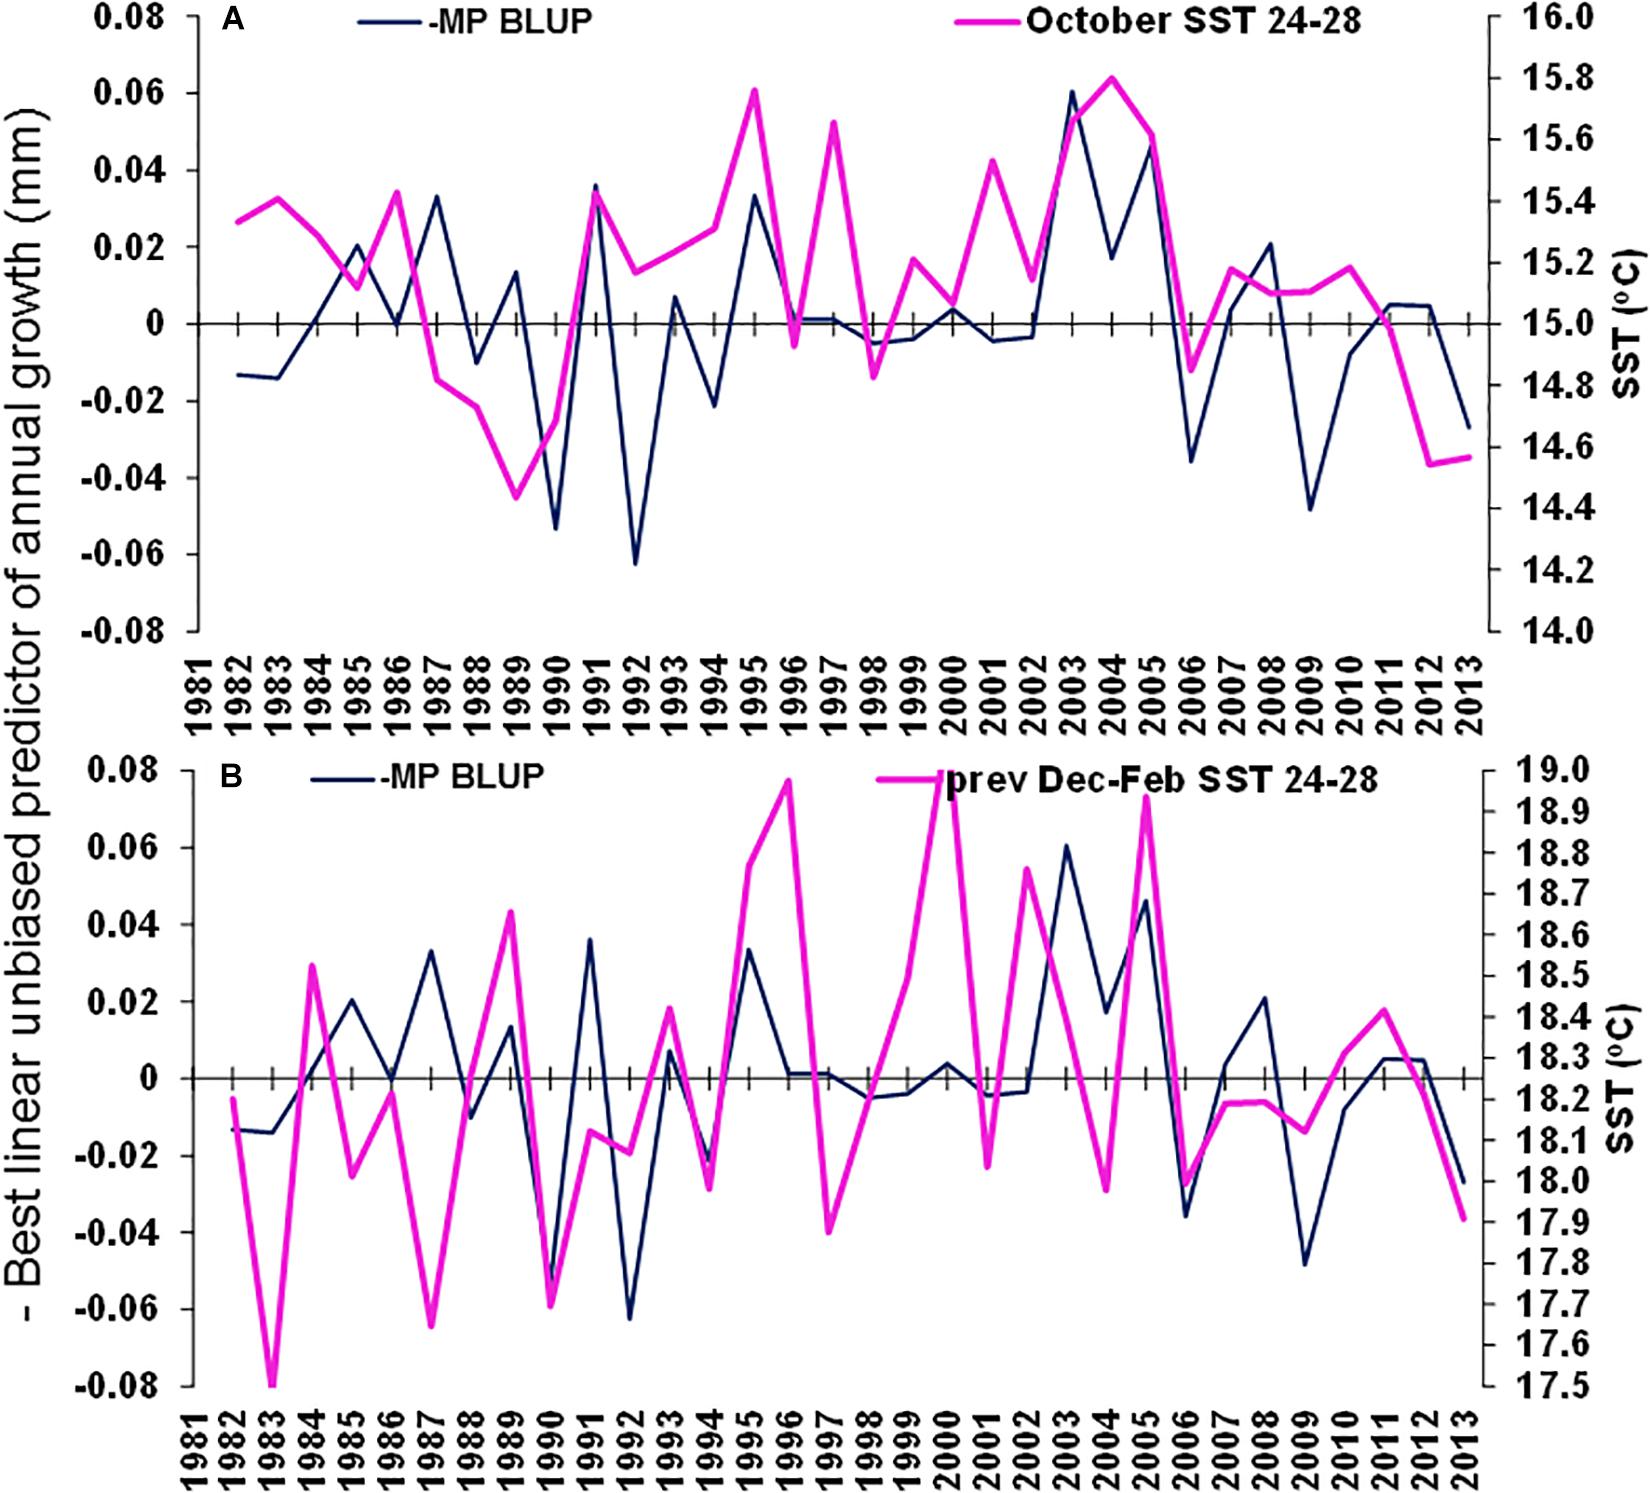
Figure 9. Merluccius paradoxus (MP) caught in Namibia best linear unbiased predictor (BLUP) of annual growth from otolith increments (negative to demonstrate negative correlations) (blue) and (A) October Sea Surface temperature (SST) in the area –24.0 to –28.0 latitude, 13.0 to 15.0 longitude and (B) previous December to February SST in the area –24.0 to –28.0 latitude, 13.0 to 15.0 longitude.
Trends in mean population-level lengths-at-ages 1–8 from 1977 to 2016 showed that lengths-at-ages 1–4 increased by between 0.02 and 0.08 cm⋅year–1 and mean length-at-ages 5–8 decreased by between 0.004 and 0.25 cm⋅year–1 (Figure 10 and Table 4). Significant time-related changes in mean lengths were seen for age 2 by 0.054 cm⋅year–1 (t = 2.48, df = 42, p = 0.0017), age 3 by 0.075 cm⋅year–1 (t = 3.04, df = 43, p = 0.0040), age 7 by −0.14 cm⋅year–1 (t = −2.13, df = 34, p = 0.040), and age 8 by −0.25 cm⋅year–1 (t = −3.58, df = 30, p = 0.0012) (Table 4).
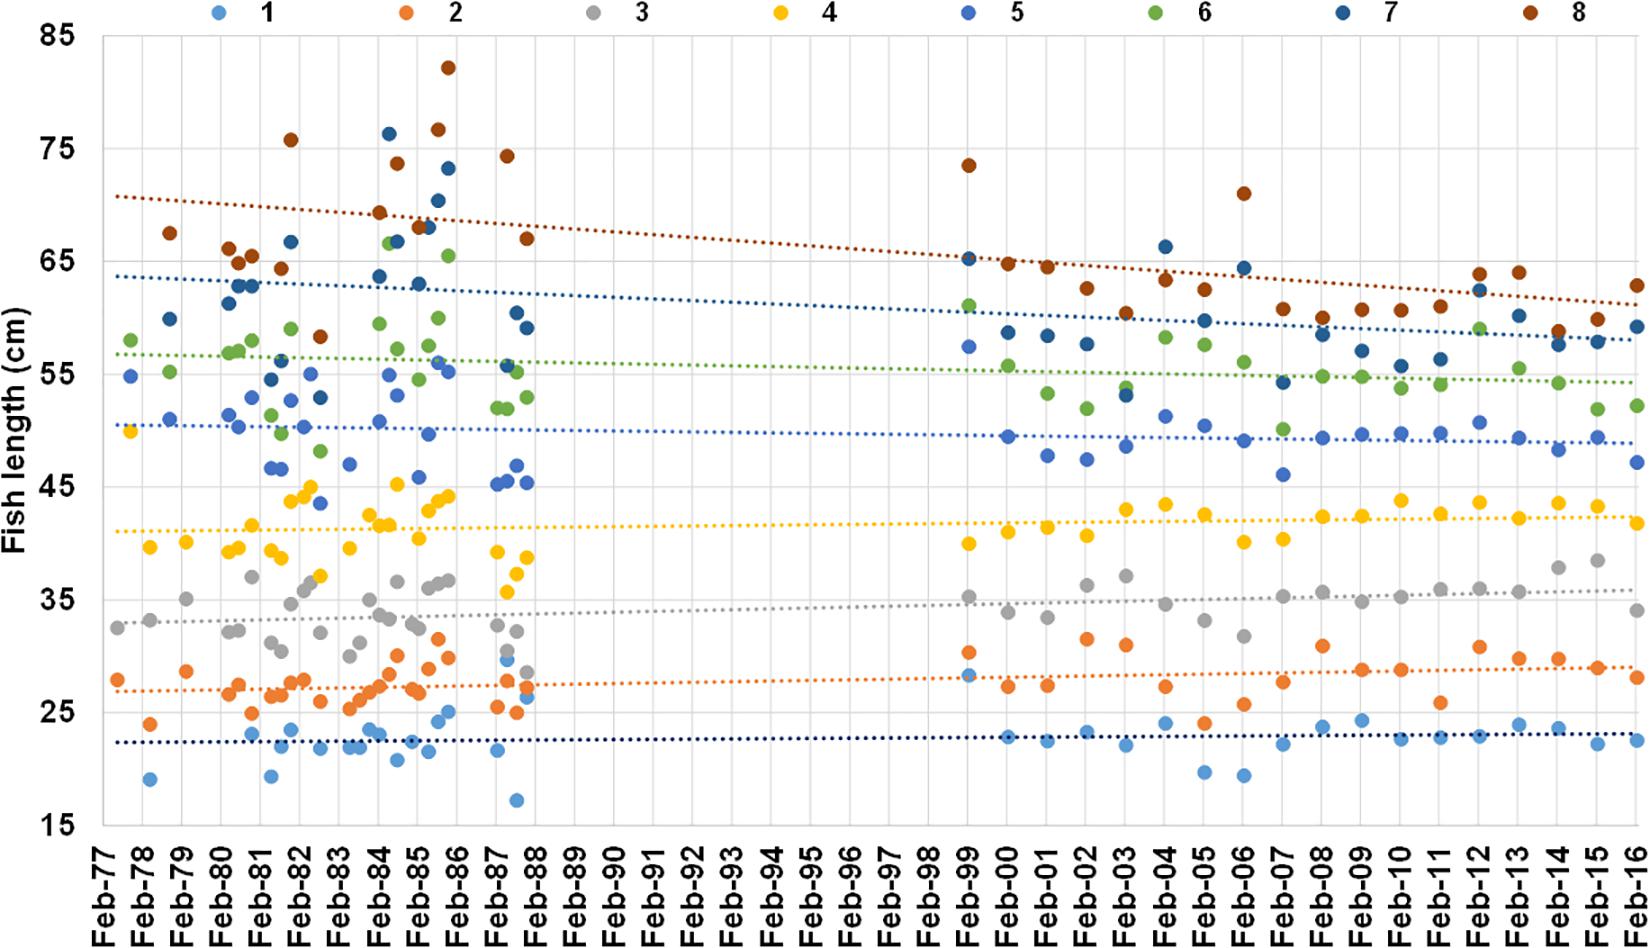
Figure 10. Mean length at age 1–8 years (different color dots) from otolith-based age-length keys of M. paradoxus caught off Namibia 1977–1987 from literature (ICSEAF, 1977, 1978, 1979, 1980, 1981, 1982, 1983b, 1984, 1985, 1987) and 1999 to 2016 from current data (SP, MFMR unpublished data, Supplementary Table S1). Linear regression lines of mean length-at-age against date of capture are shown in the same color as the dots for each age (all regression outputs are shown in Table 4).
Discussion
In this study we developed a 32-year otolith chronology for M. paradoxus. This is the first study of its kind in the Benguela upwelling system. We showed that otolith chronologies (individual-level growth) as well as ALKs (population-level mean length at age) can be used as indicators of annual fish growth, fish condition and local climatic forcing, despite otoliths of the hakes and other species in the Benguela being notoriously difficult to read. By correlating annual otolith growth with annual fish growth age 3–4 using two independent methods of growth estimation, we indirectly validate age determination of M. paradoxus using the whole otolith method and its current age determination criteria. This confirms that M. paradoxus grow 6 to 9 cm year–1 at 3-years-old (Figure 4), with higher inter-annual variations (3–12 cm year–1) apparent for other ages and in other years (Figure 9). Similarly, Wilhelm et al. (2015a, 2019) calculated growth of northern Benguela M. paradoxus using the von Bertalanffy growth curve fitted to 1999 to 2007 pooled lengths at ages as 7.3 cm year–1 at age group 1 to 4.4 cm year–1 at age group 8. The mean growth of 8.32 cm year–1 (all ages) that was estimated by a geostatistical model using survey length-frequency distributions of M. paradoxus caught off South Africa and Namibia (Jansen et al., 2017) is faster than this, probably driven by South African-caught M. paradoxus that grow 10–12 cm year–1 until about 50–60 cm length and age 5 years (Durholtz et al., 2015). This means that, compared to M. capensis in the northern Benguela (Wilhelm et al., 2015b, 2017, 2018, 2019), M. paradoxus exhibits slower growth, with stable and more consistent annual zone formation on their otoliths.
Otolith growth rates were dominated by high individual and inter-annual growth rate variation, rather than sex-specific or cohort-specific variation in the present study. The inter-annual variability of M. paradoxus growth appears to be influenced by local environmental conditions with long-term trends driven by other, possibly fisheries-induced, adaptive changes.
The best predictors for M. paradoxus growth were the July–September (austral winter-spring) upwelling index at 30°S and the August–October chl-a concentration in the 28–30°S area, the Namaqua upwelling cell, as well as spring and summer SSTs further northwards of this upwelling cell. Upwelling promotes primary productivity, reflected in the chlorophyll-a concentration, and gives rise to secondary productivity and increased abundances of forage fishes, and in that way promotes growth of predators. M. paradoxus at 35–50 cm (ages 3–5 years) mainly feed on krill (euphausiids and macrozooplankton) and myctophids (such as Lampanyctodes hectoris) (Wilhelm et al., 2015a) or other mesopelagic fishes such as Maurolicus mueueri (Armstrong and Prosch, 1991). Abundances and reproductive activity of these prey populations have been linked with the strength of upwelling (e.g., Hulley and Prosch, 1987; Hutchings et al., 1995; Landaeta and Castro, 2002). This provides evidence that M. paradoxus growth is limited by upwelling, i.e., productivity and consequently food availability, reflected by high chl-a concentrations, and cold sea surface temperatures in winter-spring at the Namaqua upwelling cell and slightly northwards. M. paradoxus growth also responds positively to cold summers (cold SST in November to February). Summer SST averaged over a large area is mostly a function of the seasonal surface irradiation signal rather than upwelling (Demarcq et al., 2007). Bottom temperatures usually lag SSTs by about 6 weeks (Wilhelm, 2012) and M. paradoxus have been associated with bottom temperatures between 6 and 8°C and were most negatively associated with warm (>10°C) bottom temperatures (Mbatha et al., 2019). We thus argue that warm water temperatures in summer would directly negatively affect growth rates of M. paradoxus (as opposed to reflecting upwelling productivity) when the increased energy demand generated by warm temperature is not matched with the necessary food supply (e.g., van der Sleen et al., 2018).
Demarcq et al. (2003, 2007) demonstrated, based on SeaWiFS satellite data 1997–2003, that phytoplankton blooms peaked in December to March off Lüderitz (26°S) and October to March off St. Helena Bay (33°S). On a broader spatial scale, a distinct chlorophyll-a minimum could be seen around Lüderitz (26–27°S), the main upwelling cell of the entire Benguela. They also demonstrated that chlorophyll-a was less variable in the southern than in the northern Benguela, but upwelling intensity at the Namaqua upwelling cell (29–31°S) peaked in October–December (Demarcq et al., 2003, 2007). In the present study, M. paradoxus growth, however, appeared to be driven by the austral winter–spring production of the Namaqua upwelling cell (28–30°S), where the peak in chl-a concentration was usually around that time (July–October) in recent years (Supplementary Figure S11). The reason for this discrepancy in seasonality of phytoplankton blooms in the Namaqua area between Demarcq et al. (2003, 2007) and values from the present study, is that Demarcq et al. (2003, 2007) used average coastal chl-a concentrations (20 km × 20 km), while the values in the present study were averaged from 11 to 17°E, 28 to 30°S, which stretches beyond the shelf edge to >1,000 m bottom depth (see Figure 1). Integrating chl-a concentrations between coastal and oceanic regions would have resulted in a different seasonality (Lamont et al., 2018b). Mesopelagic fishes are distributed from the coastal area to beyond the shelf edge (Hulley and Prosch, 1987). Their distribution, reproduction and vertical migration (and therefore availability to their predators) is dependent on upwelling productivity (Hulley and Prosch, 1987; Armstrong and Prosch, 1991), similar to mesopelagic fishes in other upwelling areas (e.g., Landaeta and Castro, 2002). This is a plausible explanation why M. paradoxus growth was sensitive to winter upwelling at the Namaqua upwelling cell in the present study. We thus establish that M. paradoxus growth variability is a suitable indicator for environmental variability and change, particularly upwelling and primary productivity along the trans-boundary area between the northern and southern Benguela, and between Namibia and South Africa (28–30°S).
Local/small-scale variability in the southern Benguela (as used in the present study) is not necessarily driven by large-scale climatic indices such as the ENSO or AAO. No significant correlations were found between SSTs and AAO by Rouault et al. (2010). According to Tim et al. (2015), El Niño events (ENSO) weakly increase upwelling, and La Niña events (AAO) strengthen upwelling in the southern Benguela. However, correlations between ENSO and upwelling indices were evident only in the summer months, where the strongest upwelling peaks were seen in the southern Benguela (Tim et al., 2015). Since M. paradoxus growth is most strongly related to winter upwelling/productivity, this explains why M. paradoxus growth was not sensitive to the MEI or AAO (remote forcing) in the present study. Similarly, the summer upwelling mode in the California current (39°N) (June–August, corresponding to winter time in the Benguela), was not driven by the same forcing mechanism as the winter upwelling mode (sea level pressure and ENSO), but was instead linked with more local and fine-scale gradients and low-frequency processes (Black et al., 2011). Black et al. (2011, 2014) used fish growth from chronologies and fledging success across different taxa to show that some taxa were driven by the summer upwelling mode and some taxa by the winter upwelling mode. This could be the case in the Benguela upwelling system and linkages of growth of different species with winter and summer climate and with different local or remote drivers should be further explored.
Merluccius paradoxus growth sensitivity to upwelling variability may have changed over time, having a stronger correlation with upwelling indices in the present than the past. A different growth response to environmental variability is likely to be fishery-induced, similar to what was shown for purple wrasse in Tasmania (Morrongiello et al., 2019). Also, the directional change of fish growth seen in the population-scale data in the present study, is likely to be a fishery-induced adaptive change. Mean lengths at ages 2 and 3 have increased, so cumulative growth up to age 3 years has significantly increased since 1977. Since M. paradoxus A50 occurs at 4–6 years of age (Durholtz et al., 2015; Wilhelm et al., 2019), age 3 fish are pre-mature fish. Conversely, length-at-age of the 7–8-year-old post-mature fish have significantly decreased since 1977. All this occurred over a period of 40 years. This speaks to the evolutionary response to fishing, when fishing selection favors increased resource acquisition, faster growth, early maturation, and increased reproductive investment because of reduced longevity (Enberg et al., 2012). This is visible in the population by increased growth rates up to sexual maturity, smaller post-mature fish (reduced size-at-age) and at the same time decreased length-at-maturity (Enberg et al., 2012). Overall growth rates of adults may also increase due to easing of density-dependent processes related to fishing (Lorenzen and Enberg, 2002; Morrongiello et al., 2019). In terms of fishing on M. paradoxus in Namibia, the maximum hake catches (for both species combined) in Namibia occurred in 1971 and after an initial stock decline again in 1985–1986 (Wilhelm et al., 2015a). Hake catch data in Namibia are only separated by hake species from 1997 onwards. However, given that the vessel strength and capacity and therefore fishing depth of the hake-directed fleet has increased since the start of the fishery (early 1960s), and while the M. capensis resource became heavily depleted toward 1990 (Kirchner et al., 2012), the proportion of M. paradoxus in the hake catches would have substantially increased in that period (1970–1990). From 1997 to current, between 50 and 80% of the total hake catch in Namibia consisted of M. paradoxus (Johnsen and Kathena, 2012), while in the 1980s the majority of the hake catch in Namibia was M. capensis (van der Westhuizen, 2001), leading to the evolutionary response of fast growth to this increased fishing mortality on M. paradoxus seen in the present study.
The results of the present study are in line with results of previous studies on other species and/or in other areas. For example, Duncan (2019) developed a chronology of the resident temperate reef fish Chrysoblephus laticeps found along the South African South coast. He negatively correlated annual growth of this species with cumulative intensity of extreme cold-water events and positively correlated annual growth with austral autumn (growing season) water temperature. Duncan (2019) also showed that growth rates of young fish (<12 year-olds) were higher in the exploited population than those in the protected population, and for old (>18-year-old) fish this scenario switched, highlighting a fisheries-induced evolutionary effect similar to the effect described in the present study. In European hake (M. merluccius), Vieira et al. (2020) established a relationship between predicted otolith growth and both winter SSTs and spring bottom temperatures. They in fact showed that winter SSTs and spring bottom temperatures affected growth differently in different age groups. They also showed that M. merluccius predicted otolith growth was related to recruitment, ascribing this to density dependence. Using another species in the same genus as a species occurring in the Benguela, Atlantic horse mackerel Trachurus trachurus, Tanner et al. (2019) identified relationships between otolith growth and SSTs, primary productivity and fish biomass (density dependence). van der Sleen et al. (2018) also revealed density-dependent (SSB and CPUE) as well as temperature-dependent (autumn bottom temperature) changes in otolith growth of European plaice (Pleuronectes platessa) in the North Sea. Gillanders et al. (2012) determined strong correlations of otolith growth of a temperate reef fish in the southern hemisphere with summer SSTs.
The predicted climate-induced changes in in the Benguela are that upwelling-favorable winds will decrease in the northern Benguela as the pole-ward region of the Benguela, but increase toward the southern Benguela and the Namaqua area (Rykaczewski et al., 2015; Wang et al., 2015). This would negatively affect M. paradoxus growth in the northern Benguela as M. paradoxus growth was negatively correlated with SST in the northern Benguela (decreased upwelling would mean warmer SST), but conversely would affect M. paradoxus growth positively in the southern Benguela. Lamont et al. (2019) determined a general increase in chl-a concentration in the northern Benguela 1997 to 2017, with an increasing upwelling trend in summer and winter; and a slight increasing trend in chl-a in the open ocean domain in the southern Benguela. This would have a positive effect on M. paradoxus growth rates. In addition to the climate-induced growth rate changes, there are other, age-specific and long-term (most likely fisheries-induced) effects on growth highlighted in the present study, which need to be considered in future population models. Individual-level growth rate affects fish population productivity (e.g., Morrongiello et al., 2014). This is important to take into account for an EAF management of fisheries on the heavily exploited resource, M. paradoxus, shared between the northern and southern Benguela. Time-varying growth should be incorporated in stock assessment and prediction models in the future (e.g., JABBA-Select, Winker et al., 2020), and ultimately, together with error estimates, feed into a comprehensive expert system approach as proposed by Jarre et al. (2006). Future models of M. paradoxus growth need to incorporate other environmental factors that have not been tested here, such as bottom temperatures and oxygen concentrations. Low oxygen events, which have been shown to affect hake distribution and mortality occur regularly in the northern Benguela (Hamukuaya et al., 1998; van der Lingen et al., 2006a). However, bottom temperatures and oxygen concentrations are not available on such a fine time-scale in the Benguela. It is therefore necessary and important to record temperature, oxygen and salinity regularly, including every bottom trawl station on fisheries-independent surveys, in the future.
The fact that pre-mature M. paradoxus growth has increased and post-mature fish growth has decreased shown by the ALK data in the present study, may explain why the overall individual growth rates from the chronology data (averaged over all age groups) show no significant long-term trend. Not enough samples were available for the otolith increment width data in the present study for these growth rates to be separated by age group. As Enberg et al. (2012) discuss, length-at-age data need to also usually be complemented with maturation information. However, L50 data for M. paradoxus in Namibia are only available from 1994 onwards, and from 1994 to present L50 remained constant. Age-at-50%-maturity (A50) data are available from 1999 onwards, and has remained constant between 5.5 and 8 years since then (MFMR, unpublished data). It is therefore imperative that age data (and consequently A50 data) are updated from otolith archives at MFMR back to 1990, and analyzed for the southern Benguela. For Cape horse mackerel Trachurus capensis, another heavily exploited fish resource in the northern Benguela, L50 decreased by about 2 cm from the 1950s to the early 2000s (van der Lingen et al., 2006b). For sardine Sardinops sagax in the Benguela, changes in condition factor (CF), gonad mass and L50 have been linked with density dependence, with CF and gonad mass increasing and L50 decreasing in years of low population density (van der Lingen et al., 2006c).
Apart from adding biological information from existing data on the hakes in the Benguela, there is a further need to investigate species-specific growth responses to environmental forces, especially in the Benguela upwelling system, and with longer time series of otoliths available. These types of analyses on individual species have been used, for example, to detect regime shifts, in the Bering Sea (van der Sleen et al., 2016) and the Baltic Sea (Smoliñski and Mirny, 2017) and the Canary Current upwelling system (Tanner et al., 2019). In order to detect a regime shift in otolith growth for the Benguela, there is a need for using a longer otolith increment width time series spanning the time before and across the northern Benguela regime shift that occurred during the 1980s (Cury and Shannon, 2004; van der Lingen et al., 2006b). Different taxa have different growth responses to extreme environmental forces and the same species respond differently in different regions (e.g., Izzo et al., 2016; van der Sleen et al., 2016), and even different age groups respond differently for the same species in the same region (e.g., van der Sleen et al., 2018; Vieira et al., 2020). In another example, species across different taxa and trophic levels in the same region, the California Current Upwelling System, were influenced by either winter or summer upwelling modes (Black et al., 2011). Tanner et al. (2019) illustrated that in the Canary Current many different factors, biotic and abiotic factors interacted to influence ecosystem productivity. All of these examples highlight a further need for investigating such responses for different taxa in the Benguela upwelling system (Morrongiello et al., 2012). Otolith chronologies, as well as long term time series of length-at-age of the aquatic resources in the Benguela, such as provided in the present study, prove useful for such long-term (ecosystem-level) indicators and for the possibility to forecast climate- and fisheries-induced changes in growth and ultimately population abundances.
Data Availability Statement
The datasets generated for this study are available on request to the corresponding author.
Ethics Statement
Ethical review and approval was not required for the animal study because we were not working with any living animals, only otoliths and other secondary data that had been collected for other purposes on research surveys.
Author Contributions
BB conceptualized the study. SP acquired and organized the condition index and age-length databases. TL, CB, and DL acquired and calculated the upwelling index, SST and chlorophyll datasets, respectively. MW developed the methods for and acquired the otolith chronology data, performed all the statistical analyses, and led the writing of the manuscript. All authors contributed to the manuscript revision, read and approved the submitted version.
Funding
This publication stemmed from research supported by the Marine Science Institute, University of Texas, Port Aransas, Texas, United States (MSI), the Ministry of Fisheries and Marine Resources, Namibia (MFMR), and the Department of Fisheries and Aquatic Sciences, University of Namibia (DFAS); and funded by the United States National Science Foundation Division of Ocean Sciences (Grant 1434732) and the ECOFISH project (Grant 2010/222387) in agreement with the Benguela Current Commission (BCC) and the National Institute for Aquatic Resources (DTU Aqua), Denmark.
Conflict of Interest
The authors declare that the research was conducted in the absence of any commercial or financial relationships that could be construed as a potential conflict of interest.
Acknowledgments
We thank the MFMR staff and crew on board all research surveys since 1991 for otolith, age and biological data collections. Wayne Hall (MSI) assisted with preparing and imaging otoliths. Rauha Shipindo, Veronica Kavela, Loide Ndatipo, and Titus Johannes (DFAS) typed up ALK data from hard copies of ICSEAF Sampling Bulletins. Analyses of chl-a data were produced with the Giovanni online data system, developed and maintained by the NASA GES DISC.
Supplementary Material
The Supplementary Material for this article can be found online at: https://www.frontiersin.org/articles/10.3389/fmars.2020.00315/full#supplementary-material
Footnotes
- ^ http://imagej.nih.gov/ij/
- ^ https://sils.fnwi.uva.nl/bcb/objectj/examples/TreeRings/TreeRings-9.htm
- ^ http://disc.sci.gsfc.nasa.gov/Giovanni
- ^ https://iridl.ldeo.columbia.edu/SOURCES/.NOAA/.NCEP/.EMC/.CMB/.GLOBAL/.Reyn_SmithOIv2/
- ^ climexp.knmi.nl/
References
Abramoff, M. D., Magelhaes, P. J., and Ram, S. J. (2004). Image processing with Image. J. Biophotonics Int. 11, 36–42.
Acker, J. G., and Leptoukh, G. (2007). Online analysis enhances use of NASA earth science data. EOS Trans. Am. Geophys. Union 88, 14–17.
Armstrong, M. J., and Prosch, R. M. (1991). Abundance and distribution of the mesopelagic fish Maurolicus muelleri in the southern Benguela system. S. Afr. J. Mar. Sci. 10, 13–28.
Bates, D., Maechler, M., Bolker, B., and Walker, S. (2015). Fitting linear mixed-effects models using lme4. J. Stat. Softw. 67, 1–48. doi: 10.18637/jss.v067.i01
Baudron, A. R., Needle, C. L., Rijnsdorp, A. D., and Marshall, C. T. (2014). Warming temperatures and smaller body sizes: synchronous changes in growth of North Sea fishes. Glob. Change Biol. 20, 1023–1031. doi: 10.1111/gcb.12514
BCC, (2015). ECOFISH Workshop on Hake and Horse Mackerel Marginal Increment Analysis and Age Determination, 30 November – 11 December 2015. Swakopmund: The Dome Conference Centre.
Black, B. A., Boehlert, G. W., and Yoklavich, M. M. (2005). Using tree-ring crossdating techniques to validate annual growth increments in long-lived fishes. Can. J. Fish. Aquat. Sci. 62, 2277–2284.
Black, B. A., Schroeder, I. D., Sydeman, W. J., Bograd, S. J., Wells, B. K., and Schwing, F. B. (2011). Winter and summer upwelling modes and their biological importance in the California current ecosystem. Glob. Change Biol. 17, 2536–2545.
Black, B. A., Sydeman, W. J., Frank, D. C., Griffin, D., Stahle, D. W., García-Reyes, M., et al. (2014). Six centuries of variability and extremes in a coupled marine-terrestrial ecosystem. Science 345, 1498–1502. doi: 10.1126/science.1253209
Boehlert, G. W., Yoklavich, M. M., and Chelton, D. B. (1989). Time series of growth in the genus Sebastes from the northeast Pacific Ocean. Fish. Bull. 87, 791–806. doi: 10.1890/04-1832
Burnham, K. P., and Anderson, D. R. (2002). Model Selection and Inference: A Practical Information-Theoretic Approach. New York: Springer.
Carey, M. P., and Zimmerman, C. E. (2014). Physiological and ecological effects of increasing temperature on fish production in lakes of Arctic Alaska. Ecol. Evol. 4, 1981–1993. doi: 10.1002/ece3.1080
Casselman, J. M., Brown, D. M., Hoyle, J. A., and Eckert, T. H. (2002). “Effects of climate and global warming on year-class strength and relative abundance of smallmouth bass in eastern Lake Ontario,” in Black Bass: Ecology, Conservation, and Management, eds D. P. Philipp and M. S. Ridgway (Bethesda, MA: American Fisheries Society), 73–90.
Cury, P., and Shannon, L. J. (2004). Regime shifts in upwelling ecosystems: observed changes and possible mechanisms in the northern and southern Benguela. Prog. Oceanog. 60, 223–243.
Demarcq, H., Barlow, R. G., and Shillington, F. A. (2003). Climatology and variability of sea surface temperature and surface chlorophyll in the Benguela and Agulhas ecosystems as observed by satellite imagery. Afr. J. Mar. Sci. 25, 363–372.
Demarcq, H., Barlow, R., and Hutchings, L. (2007). Application of a chlorophyll index derived from satellite data to investigate the variability of phytoplankton in the Benguela ecosystem. Afr. J. Mar. Sci. 29, 271–282.
Dorn, M. W. (1992). Detecting environmental covariates of Pacific whiting Merluccius productus growth using a growth-increment regression model. Fish. Bull. 90, 260–275.
Duncan, M. I. (2019). A Physiological Study on a Commercial Reef Fish to Quantify the Relationship Between Exploitation and Climate Change Resilience. Ph. D. thesis, Rhodes University, Grahamstown.
Duncombe Rae, C. M. (2005). A demonstration of the hydrographic partition of the Benguela upwelling ecosystem at 26°40’S. Afr. J. Mar. Sci. 27, 617–628.
Durholtz, M. D., Singh, L., Fairweather, T. P., Leslie, R. W., van der Lingen, C. D., Bross, C. A. R., et al. (2015). “Fisheries, ecology and markets of South African hake,” in Hakes: Biology and exploitation (1st edition), ed. H. Arancibia (Chichester: John Wiley & Sons, Ltd), 38–69.
Enberg, K., Jørgensen, C., Dunlop, E. S., Varpe, Ø, Boukal, D. S., Baulier, L., et al. (2012). Fishing−induced evolution of growth: concepts, mechanisms and the empirical evidence. Mar. Ecol. 33, 1–25. doi: 10.1111/j.1439-0485.2011.00460.x
Fox, J., and Weisberg, S. (2019). An R Companion to Applied Regression, 3rd Edn. Thousand Oaks, CA: Sage.
Gillanders, B. M., Black, B. A., Meekan, M. G., and Morrison, M. A. (2012). Climatic effects on the growth of a temperate reef fish from the Southern Hemisphere: a biochronological approach. Mar. Biol. 159, 1327–1333. doi: 10.1007/s00227-012-1913-x
Hamukuaya, H., O’Toole, M. J., and Woodhead, P. M. J. (1998). Observations of severe hypoxia and offshore displacement of Cape hake over the Namibian shelf in 1994. S. Afr. J. Mar. Sci. 19, 57–59.
Hardman-Mountford, N. J., Richardson, A. J., Agenbag, J. J., Hagen, E., Nykjaer, L., Shillington, F. A., et al. (2003). Ocean climate of the South East Atlantic observed from satellite and wind models. Prog. Oceanogr. 59, 181–221.
Hulley, P. A., and Prosch, R. M. (1987). Mesopelagic fish derivatives in the southern Benguela upwelling region. S. Afr. J. Mar. Sci. 5, 597–611.
Hutchings, L., Pitcher, G. C., Probyn, T. A., and Bailey, G. W. (1995). “The chemical and biological consequences of coastal upwelling,” in Upwelling in the Ocean: Modern Processes and Ancient Records, eds C. P. Summerhayes, K. C. Emeis, M. V. Angel, R. L. Smith, and B. Zeitzschel (New York: John Wiley & Sons, Ltd), 65–81.
Hutchings, L., van der Lingen, C. D., Shannon, L. J., Crawford, R. J. M., Verheye, H. M. S., Bartholomae, C. H., et al. (2009). The Benguela current: an ecosystem in four components. Prog. Oceanogr. 83, 15–32.
ICSEAF (1978). Sampling bulletin. 1978. Sampl. Bull. Int. Commn. SE Atl. Fish. 7:165. doi: 10.1177/1745691610369339
ICSEAF (1983a). ICSEAF Otolith interpretation guide. 1. Hake Otol. Interp. Gde Int. Commn. SE Atl. Fish. 1, 18.
Izzo, C., Doubleday, Z. A., Grammer, G. L., Barnes, T. C., Delean, S., Ferguson, G. J., et al. (2016). Multi-species response to rapid environmental change in a large estuary system: a biochronological approach. Ecol. Indic. 69, 739–748. doi: 10.1016/j.ecolind.2016.05.019
Jansen, T., Kainge, P., Singh, L., Wilhelm, M. R., Durholtz, D., Strømme, T., et al. (2015). Spawning patterns of shallow-water hake (Merluccius capensis) and deep-water hake (M. paradoxus) in the Benguela current large marine ecosystem shown by gonadosomatic index. Fish. Res. 172, 168–180. doi: 10.1016/j.fishres.2015.07.009
Jansen, T., Kristensen, K., Fairweather, T. P., Kainge, P., Kathena, J. N., Durholtz, M. D., et al. (2017). Geostatistical modelling of the spatial life history of post-larval deepwater hake Merluccius paradoxus in the Benguela current large marine ecosystem. Afr. J. Mar. Sci. 39, 349–361. doi: 10.2989/1814232X.2017.1379437
Jarre, A., Moloney, C. L., Shannon, L. J., Fréon, P., van der Lingen, C. D., Verheye, H. M., et al. (2006). “Developing a basis for detecting and predicting long-term ecosystem changes,” in Large Marine Ecosystems, Vol. 14, eds V. Shannon, G. Hempel, P. Malanotte-Rizzoli, C. Moloney, and J. Woods (Amsterdam: Elsevier), 239–272. doi: 10.1016/S1570-0461(06)80016-9
Jarre, A., Hutchings, L., Kirkman, S. P., Kreiner, A., Tchipalanga, P. C. M., Kainge, P., et al. (2015). Synthesis: climate effects on biodiversity, abundance and distribution of marine organisms in the Benguela. Fish. Oceanogr. 24, 122–149.
Johnsen, E., and Kathena, J. (2012). A robust method for generating separate catch time-series for each of the hake species caught in the Namibian trawl fishery. Afr. J. Mar. Sci. 34, 43–53.
Kanamitsu, M., Ebisuzaki, W., Woollen, J., Yang, S.-K., Hnilo, J. J., Fiorino, M., et al. (2002). NCEP-DOE AMIP-II Reanalysis (R-2). Bull. Am. Meteorol. Soc. 83, 1631–1643.
Kathena, J. N., Nielsen, A., Thygesen, U. H., and Berg, C. W. (2016). Hake species (Merluccius capensis and M. paradoxus) assessment in the Benguela current large marine ecosystem. Environm. Dev. 17, 193–201.
Kirchner, C., Kainge, P., and Kathena, J. (2012). Evaluation of the status of the Namibian hake resource (Merluccius spp.) using statistical catch-at-age analysis. Environm. Dev. 12, 1–52.
Lamont, T., García−Reyes, M., Bograd, S. J., van der Lingen, C. D., and Sydeman, W. J. (2018a). Upwelling indices for comparative ecosystem studies: variability in the benguela upwelling system. J. Mar. Syst. 188, 3–16. doi: 10.1016/j.jmarsys.2017.05.007
Lamont, T., Brewin, R. J. W., and Barlow, R. G. (2018b). Seasonal variation in remotely-sensed phytoplankton size structure around southern Africa. Remote Sens. Env. 204, 617–631.
Lamont, T., Barlow, R. G., and Brewin, R. J. W. (2019). Long−term trends in phytoplankton chlorophyll a and size structure in the Benguela Upwelling System. J. Geophys. Res. Letters 124, 1170–1195. doi: 10.1029/2018JC014334
Landaeta, M. F., and Castro, L. R. (2002). Spring spawning and early nursery zone of the mesopelagic fish Maurolicus parvipinnis at the coastal upwelling zone off Talcahuano, central Chile. Mar. Ecol. Progr. Ser. 226, 179–191.
Lorenzen, K., and Enberg, K. (2002). Density-dependent growth as a key mechanism in the regulation of fish populations: evidence from among-population comparisons. Proc. R. Soc. Lond. B. 269, 49–54. doi: 10.1098/rspb.2001.1853
Magnuson, J. J., Webster, K. E., Assel, R. A., Bowser, C. J., Dillon, P. J., Eaton, J. G., et al. (1997). Potential effects of climate changes on aquatic systems: laurentian great lakes and precambrian shield region. Hydrol. Processes 11, 825–871.
Mazerolle, M. J. (2019). AICcmodavg: Model Selection and Multimodel Inference Based on (Q) AIC(c). R Package Version 2.2-2. Available at: cran.r-project.org/package=AICcmodavg (accessed December 3, 2019).
Mbatha, F. L., Yemane, D., Ostrowski, M., Moloney, C. L., and Lipiñski, M. R. (2019). Oxygen and temperature influence the distribution of deepwater Cape hake Merluccius paradoxus in the southern Benguela: a GAM analysis of a 10-year time-series. Afr. J. Mar. Sci. 41, 413–427.
Morrongiello, J. R., Beatty, S. J., Bennett, J. C., Crook, D. A., Ikedife, D. N., Kennard, M. J., et al. (2011). Climate change and its implications for Australia’s freshwater fish. Mar. Freshw. Res. 62, 1082–1098.
Morrongiello, J. R., Thresher, R. E., and Smith, D. C. (2012). Aquatic biochronologies and climate change. Nat. Clim. Change 2, 849–857. doi: 10.1038/nclimate1616
Morrongiello, J. R., Walsh, C. T., Gray, C. A., Stocks, J. R., and Crook, D. A. (2014). Environmental change drives long-term recruitment and growth variation in an estuarine fish. Glob. Change Biol. 20, 1844–1860. doi: 10.1111/gcb.12545
Morrongiello, J. R., and Thresher, R. E. (2015). A statistical framework to explore ontogenetic growth variation among individuals and populations: a marine fish example. Ecol. Monogr. 85, 93–115.
Morrongiello, J. R., Sweetman, P. C., and Thresher, R. E. (2019). Fishing constrains phenotypic responses of marine fish to climate variability. J. Anim. Ecol. 88, 1645–1656. doi: 10.1111/1365-2656.12999
Pilling, G. M., Kirkwood, G. P., and Walker, S. G. (2002). An improved method for estimating individual growth variability in fish, and the correlation between von Bertalanffy growth parameters. Can. J. Fish. Aquat. Sci. 59, 424–432.
Potts, W. M., Henriques, R., Santos, C. V., Munnik, K., Ansorge, I., Dufois, F., et al. (2014). Ocean warming, a rapid distributional shift, and the hybridization of a coastal fish species. Glob. Change Biol. 20, 2765–2777. doi: 10.1111/gcb.12612
R Core Team. (2018). R: A Language and Environment for Statistical Computing. Version 3.5.0. Vienna: R Foundation for Statistical Computing.
Reynolds, R. W., Rayner, N. A., Smith, T. M., Stokes, D. C., and Wang, W. (2002). An improved in situ and satellite SST Analysis for climate. J. Clim. 15, 1609–1625.
Rouault, M., Pohl, B., and Penven, P. (2010). Coastal oceanic climate change and variability from 1982 to 2009 around South Africa. Afr. J. Mar. Sci. 32, 237–246.
Rykaczewski, R. R., Dunne, J. P., Sydeman, W. J., García−Reyes, M., Black, B. A., and Bograd, S. J. (2015). Poleward displacement of coastal upwelling−favourable winds in the ocean’s eastern boundary currents through the 21st century. J. Geophys. Res. Lett. 42, 6424–6431.
Smoliñski, S., and Mirny, Z. (2017). Otolith biochronology as an indicator of marine fish responses to hydroclimatic conditions and ecosystem regime shifts. Ecol. Indic. 79, 286–294.
Strømme, T., Lipinski, M. R., and Kainge, P. (2016). Life cycle of hake and likely management implications. Rev. Fish Biol. Fish. 26, 235–248.
Tanner, S. E., Vieira, A. R., Vasconcelos, R. P., Dores, S., Azevedo, M., Cabral, H. N., et al. (2019). Regional climate, primary productivity and fish biomass drive growth variation and population resilience in a small pelagic fish. Ecol. Indic. 103, 530–541.
Thompson, D., and Wallace, J. (2000). Annular modes in the extra-tropical circulation. 1. Month-to-month variability. J. Climate 13, 1000–1016. doi: 10.1038/s41598-019-39392-y
Tim, N., Zorita, E., and Hünicke, B. (2015). Decadal variability and trends of the Benguela upwelling system as simulated in a high-resolution ocean simulation. Ocean Sci. 11, 483–502.
van der Lingen, C. D., Fréon, P., Hutchings, L., Roy, C., Bailey, G. W., Bartholomae, C., et al. (2006a). “Forecasting shelf processes of relevance to living marine resources in the BCLME,” in Large Marine Ecosystems, Vol. 14, eds V. Shannon, G. Hempel, P. Malanotte-Rizzoli, C. Moloney, and J. Woods (Amsterdam: Elsevier), 309–347.
van der Lingen, C. D., Shannon, L. J., Cury, P., Kreiner, A., Moloney, C. L., Roux, J.-P., et al. (2006b). “Resource and ecosystem variability, including regime shifts, in the Benguela Current System,” in Large Marine Ecosystems, Vol. 14, eds V. Shannon, G. Hempel, P. Malanotte-Rizzoli, C. Moloney, and J. Woods (Amsterdam: Elsevier), 147–184.
van der Lingen, C. D., Fairweather, T. P., Fréon, P., and van der Westhuizen, J. J. (2006c). Density dependent changes in reproductive parameters and condition of southern Benguela sardine Sardinops sagax. Afr. J. Mar. Sci. 28, 625–636. doi: 10.2989/18142320609504212
van der Sleen, P., Dzaugis, M. P., Gentry, C., Hall, W. P., and Hamilton, V. (2016). Long-term Bering Sea environmental variability revealed by a centennial-length biochronology of Pacific ocean perch (Sebastes alutus). Clim. Res. 71, 33–45.
van der Sleen, P., Stransky, C., Morrongiello, J. R., Haslob, H., Peharda, M., and Black, B. A. (2018). Otolith increments in European plaice (Pleuronectes platessa) reveal temperature and density-dependent effects on growth. ICES J. Mar. Sci. 75, 1655–1663.
van der Westhuizen, A. (2001). A decade of exploitation and management of the Namibian hake stocks. S. Afr. J. Mar. Sci. 23, 307–315.
van Zuiden, T. M., Chen, M. M., Stefanoff, S., Lopez, L., and Sharma, S. (2016). Projected impacts of climate change on three freshwater fishes and potential novel competitive interactions. Div. Distr. 22, 603–614.
Verheye, H. M., Lamont, T., Huggett, J. A., Kreiner, A., and Hampton, I. (2016). Plankton productivity of the Benguela Current Large Marine Ecosystem (BCLME). Environ. Dev. 17, 75–92.
Vieira, A. R., Dores, S., Azevedo, M., and Tanner, S. E. (2020). Otolith increment width-based chronologies disclose temperature and density-dependent effects on demersal fish growth. ICES J. Mar. Sci. 77, 633–644. doi: 10.1093/icesjms/fsz243
Wang, D., Gouhier, T. C., Menge, B. A., and Ganguly, A. R. (2015). Intensification and spatial homogenization of coastal upwelling under climate change. Nature 518, 390–394. doi: 10.1038/nature14235
Weisberg, S., Spangler, G. R., and Richmond, L. S. (2010). Mixed effects models for fish growth. Can. J. Fish. Aquat. Sci. 67, 269–277.
Wilhelm, M. R. (2012). Growth and Otolith Zone Formation of Namibian Hake Merluccius Capensis. Ph. D. Thesis, University of Cape Town, Cape Town.
Wilhelm, M. R., Roux, J.-P., Moloney, C. L., and Jarre, A. (2013). Data from fur seal scats reveal when Namibian Merluccius capensis are hatched and how fast they grow. ICES J. Mar. Sci. 70, 1429–1438. doi: 10.1093/icesjms/fst101
Wilhelm, M. R., Kirchner, C. H., Roux, J.-P., Jarre, A., Iitembu, J. A., Kathena, J. N., et al. (2015a). “Biology and fisheries of the shallow-water hake (Merluccius capensis) and the deep-water hake (M. paradoxus) in Namibia,” in Hakes: Biology and exploitation, 1st Edn, ed. H. Arancibia (Chichester: John Wiley & Sons, Ltd), 70–100. doi: 10.1002/9781118568262.ch3
Wilhelm, M. R., Roux, J.-P., Moloney, C. L., and Jarre, A. (2015b). Biannual otolith zone formation of young shallow-water hake Merluccius capensis in the northern Benguela: age validation using otoliths sampled by a top predator. J. Fish Biol. 87, 1–16. doi: 10.1111/jfb.12684
Wilhelm, M. R., Moloney, C. L., Paulus, S. C., and Roux, J.-P. (2017). Fast growth inferred for northern Benguela shallow-water hake Merluccius capensis using annual survey- and monthly commercial length-frequency distributions. Fish. Res. 193, 7–14. doi: 10.1016/j.fishres.2017.03.001
Wilhelm, M. R., Moloney, C. L., Paulus, S. C., Kashava, S., Brinkman, F. R. V., van der Plas, A. K., et al. (2018). Biannual otolith zonation of Cape hake (Merluccius capensis) in response to environment and fish physiology in the northern Benguela. J. Mar. Syst. 188, 98–108. doi: 10.1016/j.jmarsys.2017.08.001
Wilhelm, M. R., Paulus, S. C., and Kashava, S. (2019). New age determination method based on fast growth rate of Namibian Merluccius capensis. Afr. J. Mar. Sci. 41, 119–124. doi: 10.2989/1814232X.2019.1581659
Winker, H., Carvalho, F., Thorson, J. T., Kell, L. T., Parker, D., Kapur, M., et al. (2020). JABBA-Select: Incorporating life history and fisheries’ selectivity into surplus production models. Fish. Res. 222:105355. doi: 10.1016/j.fishres.2019.105355
Wolter, K., and Timlin, M. S. (1993). “Monitoring ENSO in COADS with a seasonally adjusted principal component index,” in Proceedings of the 17th Climate Diagnostics Workshop (Norman: NOAA), 52–57.
Keywords: climate change, deepwater hake, fishery-induced adaptive change, inter-annual variability, sclerochronology, upwelling
Citation: Wilhelm MR, Black BA, Lamont T, Paulus SC, Bartholomae C and Louw DC (2020) Northern Benguela Merluccius paradoxus Annual Growth From Otolith Chronologies Used for Age Verification and as Indicators of Fisheries-Induced and Environmental Changes. Front. Mar. Sci. 7:315. doi: 10.3389/fmars.2020.00315
Received: 31 January 2020; Accepted: 17 April 2020;
Published: 08 May 2020.
Edited by:
Esteban Avigliano, Consejo Nacional de Investigaciones Científicas y Técnicas (CONICET), ArgentinaReviewed by:
Barbara Maichak de Carvalho, Federal University of Paraná, BrazilGuido Plaza, Pontificia Universidad Católica de Valparaíso, Chile
Copyright © 2020 Wilhelm, Black, Lamont, Paulus, Bartholomae and Louw. This is an open-access article distributed under the terms of the Creative Commons Attribution License (CC BY). The use, distribution or reproduction in other forums is permitted, provided the original author(s) and the copyright owner(s) are credited and that the original publication in this journal is cited, in accordance with accepted academic practice. No use, distribution or reproduction is permitted which does not comply with these terms.
*Correspondence: Margit R. Wilhelm, bXdpbGhlbG1AdW5hbS5uYQ==