 David J. Curnick1,2*
 Ben Collen2†
 Heather J. Koldewey3,4Kate E. Jones2
 Kirsty M. Kemp1
 Francesco Ferretti5,6
- 1Institute of Zoology, Zoological Society of London, London, United Kingdom
- 2Centre for Biodiversity and Environment Research, Department of Genetics, Evolution and Environment, University College London, London, United Kingdom
- 3Conservation Programmes, Zoological Society of London, London, United Kingdom
- 4Centre for Ecology and Conservation, University of Exeter, Penryn, United Kingdom
- 5Department of Fish and Wildlife Conservation, Virginia Tech, Blacksburg, VA, United States
- 6Hopkins Marine Station, Stanford University, Pacific Grove, CA, United States
The efficacy of large marine protected areas (MPA) for the conservation of mobile pelagic species is widely debated. Here, we quantified spatial and temporal trends in standardized catch per unit effort (CPUE) of two target pelagic species, yellowfin (Thunnus albacares) and bigeye tuna (Thunnus obesus) in the Indian Ocean to analyze the impact of the British Indian Ocean Territory (BIOT) MPA’s creation in 2010. We applied generalized additive mixed effects models to historical BIOT longline fishery logbooks and official catch and effort statistics from the Indian Ocean Tuna Commission (IOTC) to standardize CPUEs and to evaluate long-term trends and distribution patterns across the equatorial Indian Ocean. We find that trends in population indices from within BIOT prior to the MPA’s establishment mirror those of the wider Indian Ocean. We also suggest that there may be behavioral plasticity within the yellowfin tuna stock, with some individuals possibly undertaking alternative migration patterns or exhibiting residency behavior within BIOT. Yet, we find no direct evidence of any improvement in standardized CPUE indices of either species in the area surrounding the BIOT MPA, nearly 8 years after its establishment. The average size of yellowfin and bigeye tunas caught both increased after the MPA’s establishment. These patterns were also evident across the equatorial Indian Ocean, suggesting that any MPA effect is in combination with other regional drivers, such as behavioral changes in the fishing fleets in response to the threat of Somali Piracy. We therefore conclude that BIOT MPA may be providing local conservation value to tunas, but it is not significant enough to halt the overall regional decline in yellowfin tuna stocks. Thus, we emphasize that large MPAs should be considered in conjunction with other fishery management regulations and wider regional processes, rather than as a silver bullet, in order to provide the conservation and management benefits needed for mobile species like tunas.
Introduction
A number of very large marine protected areas (MPAs), defined as those over 100,00 km2 in area, have recently been established (Jones and De Santo, 2016). MPAs have been shown to be effective for coastal benthic species (Follesa et al., 2011), resident fish species (Aburto-Oropeza et al., 2011; Tewfik et al., 2017), and reef-associated sharks (White et al., 2017), and can lead to increases in fish density, biomass, size, and diversity (Lester et al., 2009). However, it is unclear whether these benefits can be scaled to large MPAs, and to highly mobile pelagic species such as tunas or sharks (Kaplan et al., 2014; Breen et al., 2015).
One of the largest MPAs (∼640,000 km2), the British Indian Ocean Territory (BIOT) MPA, was declared a no-take MPA in 2010. Prior to the MPA’s establishment, the main fishery in BIOT was an international commercial fleet targeting tunas - yellowfin (Thunnus albacares), bigeye (Thunnus obesus), and skipjack (Katsuwonus pelamis) - and billfishes with longlines and purse seines (Koldewey et al., 2010; Dunn and Curnick, 2019), and accounted for 1.86% of the tropical tuna catch in the Indian Ocean between 1993 and 2008 (Dunne et al., 2014). Bigeye and skipjack tuna stocks are currently deemed sustainable in the region, but the yellowfin stock is classified as “overfished and subject to overfishing” (IOTC, 2018). Whilst tuna protection was not the primary driver of establishing the BIOT MPA, by excluding industrial fishing it is possible to investigate the impact such a large spatial closure can have on commercially important species and their fisheries.
Yellowfin mature at approximately 100 cm (3–5 years) and spawn mainly from December to March in the equatorial area (0–10°S) west of 75°E (Zudaire et al., 2013). Bigeye mature at a similar size (∼100 cm and ∼3 years), but spawn predominantly from December to January in the eastern Indian Ocean (Nootmorn et al., 2005). Both species tend to reside in the top 50 m at night and forage between 100 and 300 m during the day, occasionally over 1,000 m (Dagorn et al., 2000; Schaefer and Fuller, 2002; Schaefer et al., 2007, 2014), but are segregated by thermal preferences, with yellowfin preferring 20 to 26°C compared to bigeye 17 to 23°C (Boyce et al., 2008). Their horizontal movement ecologies in the Indian Ocean remain poorly understood, although some small-scale pop-up satellite archival tags (PSATs) studies have been undertaken on yellowfin (Sabarros et al., 2017). It has previously been hypothesized that tunas undertake a cyclical migration pattern across the West Indian Ocean (Pearce, 1996). It has therefore been suggested that the BIOT MPA would have little conservation value for tropical tunas as they are too mobile (Dueri and Maury, 2013) and would simply displace fishing effort (Kaplan et al., 2014). Yet, the importance of oceanic islands for tropical tunas is being revealed in the Atlantic (Richardson et al., 2018) and the Pacific (Boerder et al., 2017). Indeed, tagging studies from within BIOT have only reported limited evidence of emigration by pelagic predators such as blue marlin (Makaira nigricans), sailfish (Istiophorus platyperus), silky sharks (Carcharhinus falciformis), and yellowfin tuna, although it should be noted that tag numbers were relatively low and tag duration limited (Carlisle et al., 2019). Thus, it is possible that the BIOT MPA represents an important area for pelagic species and could provide some conservation value (Koldewey et al., 2010) or spill over effects to nearby fisheries, as has been shown in the Galapagos (Boerder et al., 2017).
Here, we empirically assess the impact of the MPA on two tropical tuna species and their associated fisheries using regional fisheries management organization catch and effort data and fisheries logbook data of fleets fishing in the BIOT prior to the closure. We analyzed spatial and temporal patterns of efforts, catch per unit effort (CPUE, total catch divided by the number of hooks set) and average tuna size to investigate the impact of the BIOT MPA on two highly mobile and commercially important pelagic species, yellowfin and bigeye tuna, since the MPA’s establishment.
Materials and Methods
Study Area
In this study, we first assessed the historical BIOT logbook data from within the BIOT Exclusive Economic Zone (EEZ) (Figure 1A) up to the point that the BIOT MPA was declared in 2010. To assess trends post-MPA establishment, we extracted available catch and effort data from the IOTC online database for the nine grid cells pertaining BIOT and its immediately adjacent waters (hereafter referred to as the BIOT quadrant). These data were then coupled with two ecologically and environmentally comparable longitudinal quadrants, the “western” and “eastern” quadrants. These quadrants were selected to incorporate considerable portions of species’ spawning grounds (Nootmorn et al., 2005; Zudaire et al., 2013) and because in areas further south, the water cools and the target species shifts to Albacore tuna Thunnus alalonga (Chen et al., 2005; Figure 1A).
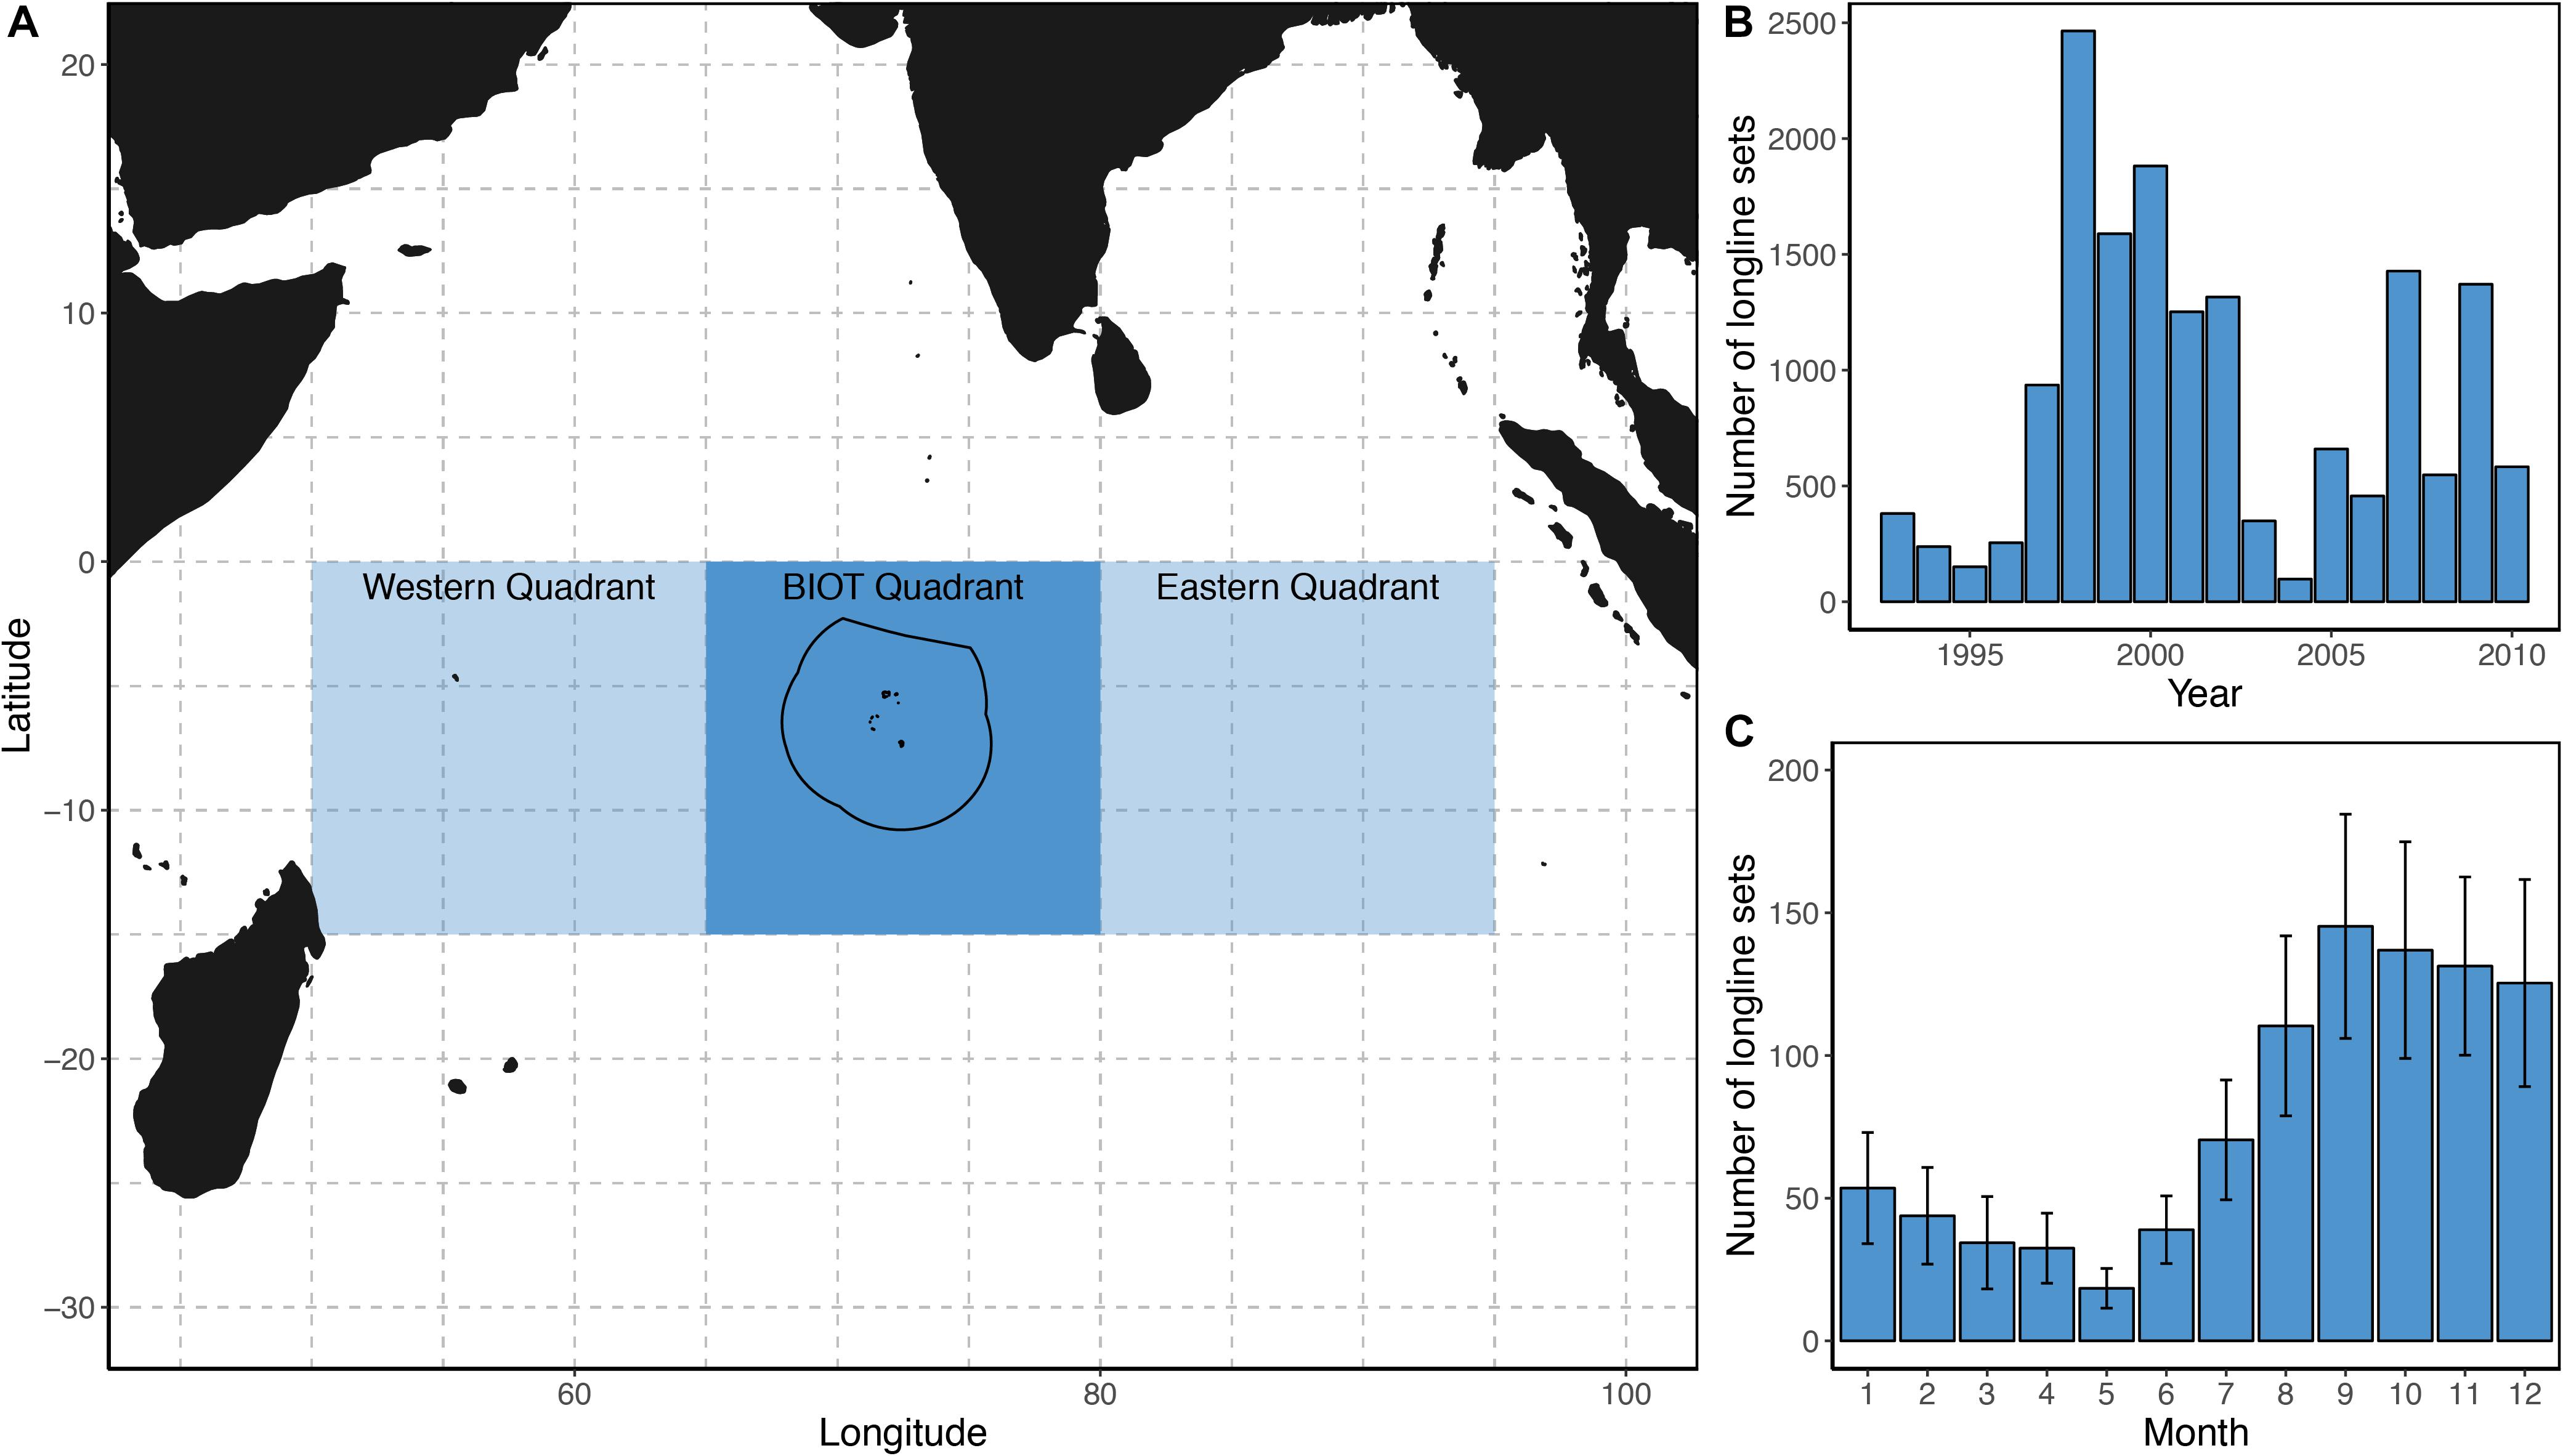
Figure 1. The location of the British Indian Ocean Territory (BIOT) (A). Dashed grid lines represent the Indian Ocean Tuna Commission longline reporting grid cells. The solid line denotes the BIOT marine protected area boundary with the shaded areas depicting the three quadrants (the BIOT Quadrant, the western Quadrant and the eastern Quadrant) used in subsequent analyses. The total number of longline fishing sets recorded per year within the BIOT between 1993 and 2010 (B), and the mean number of longline fishing sets recorded per month in BIOT across all years (C). Error bars represent ± standard error.
BIOT Data Analysis
British Indian Ocean Territory logbook data were used to generate indices of population abundance and to establish temporal (inter-annual and seasonal trends) baselines for the species within BIOT prior to the MPA’s establishment. Data were available for the period July 1993–May 2010 from the BIOT Administration and the Marine Resources Assessment Group (MRAG). Each record (n = 16,955) consisted of a longline fishing event and detailed boat identifiers, year, month, latitude and longitude, the number of hooks deployed (effort) and the total catch by species (t, tons). Of these, we removed 1,127 records that had no associated effort data before subsequent analyses.
With the remaining data (n = 15,828), we analyzed temporal (monthly and annual) variations in fishing effort. We then analyzed trends in the catch of each species with generalized additive mixed models (GAMM; Wood, 2006) using the mgcv package (Wood, 2001) in R v3.5.1 (R Development Core Team, 2018). To account for the high proportion of zeros and possible skewed positive values, we modeled the presence–absence and positive biomass separately and then multiplied the respective predictions (Maunder and Punt, 2004). Presence-absence data were modeled with a binomial family and logit link function. Positive catches were then modeled with a gamma distribution and a logarithm link function. As tuna catches are influenced by a number of temporal, spatial, environmental and methodological variables (Brill and Lutcavage, 2001; Lan et al., 2013), we constructed initial global models (containing all covariates deemed important in explaining the variability of the catches) for both the presence-absence and positive catches, to account for these influences. Thus explanatory variables included in the global models were year (within two models, one with year as a factor and one with year as a continuous variable), month (as a sinusoidal function), fishing nation (Supplementary Table S1), latitude and longitude (decimal degrees), water depth (meters) at 30 arc-second resolution (Becker et al., 2009), and included first order interactions between spatial and month covariates (Supplementary Tables S2–S9). Interactions were only included if main effect terms were present. For monthly predictions, we also ran models with month as a factor (Supplementary Tables S10–S13). We also incorporated the monthly Dipole Mode Index (DMI), the difference of sea surface temperature anomaly between the western and the eastern Indian Ocean (Saji et al., 1999), as this has been previously shown to influence tuna catch rates (Corbineau et al., 2008; Lan et al., 2013). Year (continuous) and depth covariates were modeled with a thin plate regression spline (Wood, 2003). To account for variation in methods used and species targeted, fishing nation (n = 14) was incorporated as a nested random effect (penalisation by a ridge penalty). Finally, as the number of hooks deployed per longline set (within these data ∼96% of the sets contained between 2400 and 3600 hooks) was assumed to be directly proportional to the biomass of fish caught, it was included as a logged offset term (Maunder and Punt, 2004). Prior to modeling, all continuous variables were centred and scaled by subtracting the variable’s mean and dividing by its standard deviation to generate comparable effect sizes (Zuur et al., 2009).
From within the initial global models, we created a list of all possible candidate sub-models for each species, with the offset term [log(number of hooks)] and random effect (fishing nation) always included in all candidate models (Supplementary Tables S2–S13). Models were ranked according to the corrected Akaike Information Criterion (AICc) and, for each standardization, those with delta AICc < 4 were averaged (Burnham and Anderson, 2002) and used to predict standardized CPUE trends (scaled to per thousand hooks) annually and monthly within BIOT by fixing all other explanatory variables at their median (continuous variables) or modal (factors) values. Equations and covariate estimates for all models used in standardization are reported in the supporting information. To account for inter-fleet variation, we predicted trends using the modal (most frequently occuring within the data) nation as a reference category. For this, we used the Taiwanese fleet as it accounted for 54% of all the longline records and was temporally the most consistent data (Supplementary Table S1). The 95% confidence intervals (CI) were calculated by assuming a normal distribution of the linear predictor (i.e., Θ ± 1.96 × SEΘ).
IOTC Data Analyses
To investigate trends in longline fishing across the Indian Ocean, and since the MPA’s establishment, we extracted 105,927 longline catch and effort records between 1967 to 2017 from the IOTC database1 (accessed April 2019). Effort data for each reporting grid cell were summed and grouped into five temporal bins (1998–2001, 2002–2005, 2006–2009, 2011–2014, and 2015–2017) for analysis of temporal shifts in effort across the Indian Ocean. To investigate the potential impact of MPA establishment on adjacent tuna fisheries, we focused on three quadrants with each comprizing of nine IOTC reporting 5° grid cells (Figure 1A). The three quadrants consisted of a BIOT quadrant (total number of records within database between 1998 and 2017 = 7,136) and two longitudinal comparative quadrants, the western quadrant (n = 11,382) and the eastern quadrant (n = 4,953) (Figure 1). Temporal trends in effort between 1998 and 2017 within each quadrant were then compared (including the hooks known to be deployed in the BIOT EEZ from the BIOT longline logbooks). We then analyzed long-term temporal trends in CPUE across the three quadrants using IOTC catch and effort data between 1967 and 2017. To analyze the catches, where catch was only reported in number of tunas caught, numbers were converted to tons by multiplying the number caught by the standardized average size of tuna caught that year (see size methods below). As the IOTC catch and effort data are aggregated by month and 5° grid cell and therefore very few zero catches exist in the data, the delta-gamma approach we applied to the BIOT data was not necessary. Instead, we modeled catch data using a GAMM with a gamma distribution, adding a small constant to all zero catches (1/10 of minimum positive value). Due to the higher level of aggregation within the IOTC data, water depth could not be included. All other covariates were similar to that of the BIOT models with latitude and longitude calculated as the northwest corner of each grid IOTC 5°grid cell (as per IOTC Secretariat, 2014), and then scaled and centered. Fleet (including Australia, China, European Union (unspecified), India, Japan, Korea, Maldives, Mauritius, Malaysia, Seychelles, Africa, Spain, Thailand, and Taiwan) was incorporated as a random effect. Within the three quadrants, Taiwan accounted for 34.4% of records (Japan were the second highest with 33.2%). As such, we predicted IOTC trends based on the Taiwanese fleet as it was the modal fleet, had operated broadly temporally and spatially across the time series, and was consistent and comparable with the analyses of the historical BIOT logbook data. We formed initial global models for each quadrant, and created a list of all possible candidate sub-models for each species, with the offset term [log(number of hooks)] and random effect (fishing nation) included in all candidate models (Supplementary Tables S26–S37). Models were again ranked according to AICc and, those with delta AICc < 4 were averaged (Burnham and Anderson, 2002) and used to predict standardized CPUE trends annually and monthly across the three quadrants.
Finally, we investigated whether the average size of tunas caught had changed since the MPA was established. We extracted all IOTC catch records across the three quadrants where the number of fish caught and the total weight of the catch were simultaneously measured (n = 4,962 for yellowfin, n = 4,768 for bigeye) and calculated the mean weight (kilograms, kg) of individual fish per longline fishing set. These data were then standardized, analyzed and model averaged using the same GAMM structure as the IOTC analyses (i.e., with year, a sinusoidal function of month, DMI included as covariates), across all three quadrants and for each species (Supplementary Tables S14–S25). Limitations on the numbers of paired weight and number records prevented the use of spatial covariates at the grid cell level. Again, fleet was included as a fixed random effect, with predictions based on the Taiwanese fleet for consistency. The number of hooks deployed were not included as an offset term for this analysis as they are not directly proportional to sizes of individuals caught.
Results
BIOT
Over the period 1993 to 2010, the annual number of longline fishing events within BIOT varied widely (98 in 2004 to 2,465 in 1998 (Figure 1B), with a mean of 887 events each year (SD: 677). Longlining effort in BIOT was also variable by month, with the peak between September and December (mean: 135, SD: 146; Figure 1C).
Standarised yellowfin and bigeye tuna CPUE from within BIOT showed contrasting temporal trends (Figures 2A,B). In models with year as a factor, annual standardized yellowfin CPUEs peaked in 1998 at 0.21t (95% CI = 0.19–0.23) before generally declining to 0.03t by 2008 (95% CI = 0.02–0.04; Figure 2A). By comparison, standardized bigeye CPUEs showed no clear trend and were highly variable, with CPUEs ranging from 0.06t in 1994 (95% CI = 0.04–0.08) to 0.24t in 2003 (95% CI = 0.20–0.26; Figure 2B). When considering seasonal patterns, yellowfin and bigeye were caught year-round within BIOT. However, yellowfin CPUEs showed a more pronounced seasonal trend (Figures 2C,D), where catch rates were highest during November (0.20t, 95% CI: 0.19–0.22) and lowest in April (0.11t, 95% CI: 0.09–0.13) (Figure 2C).
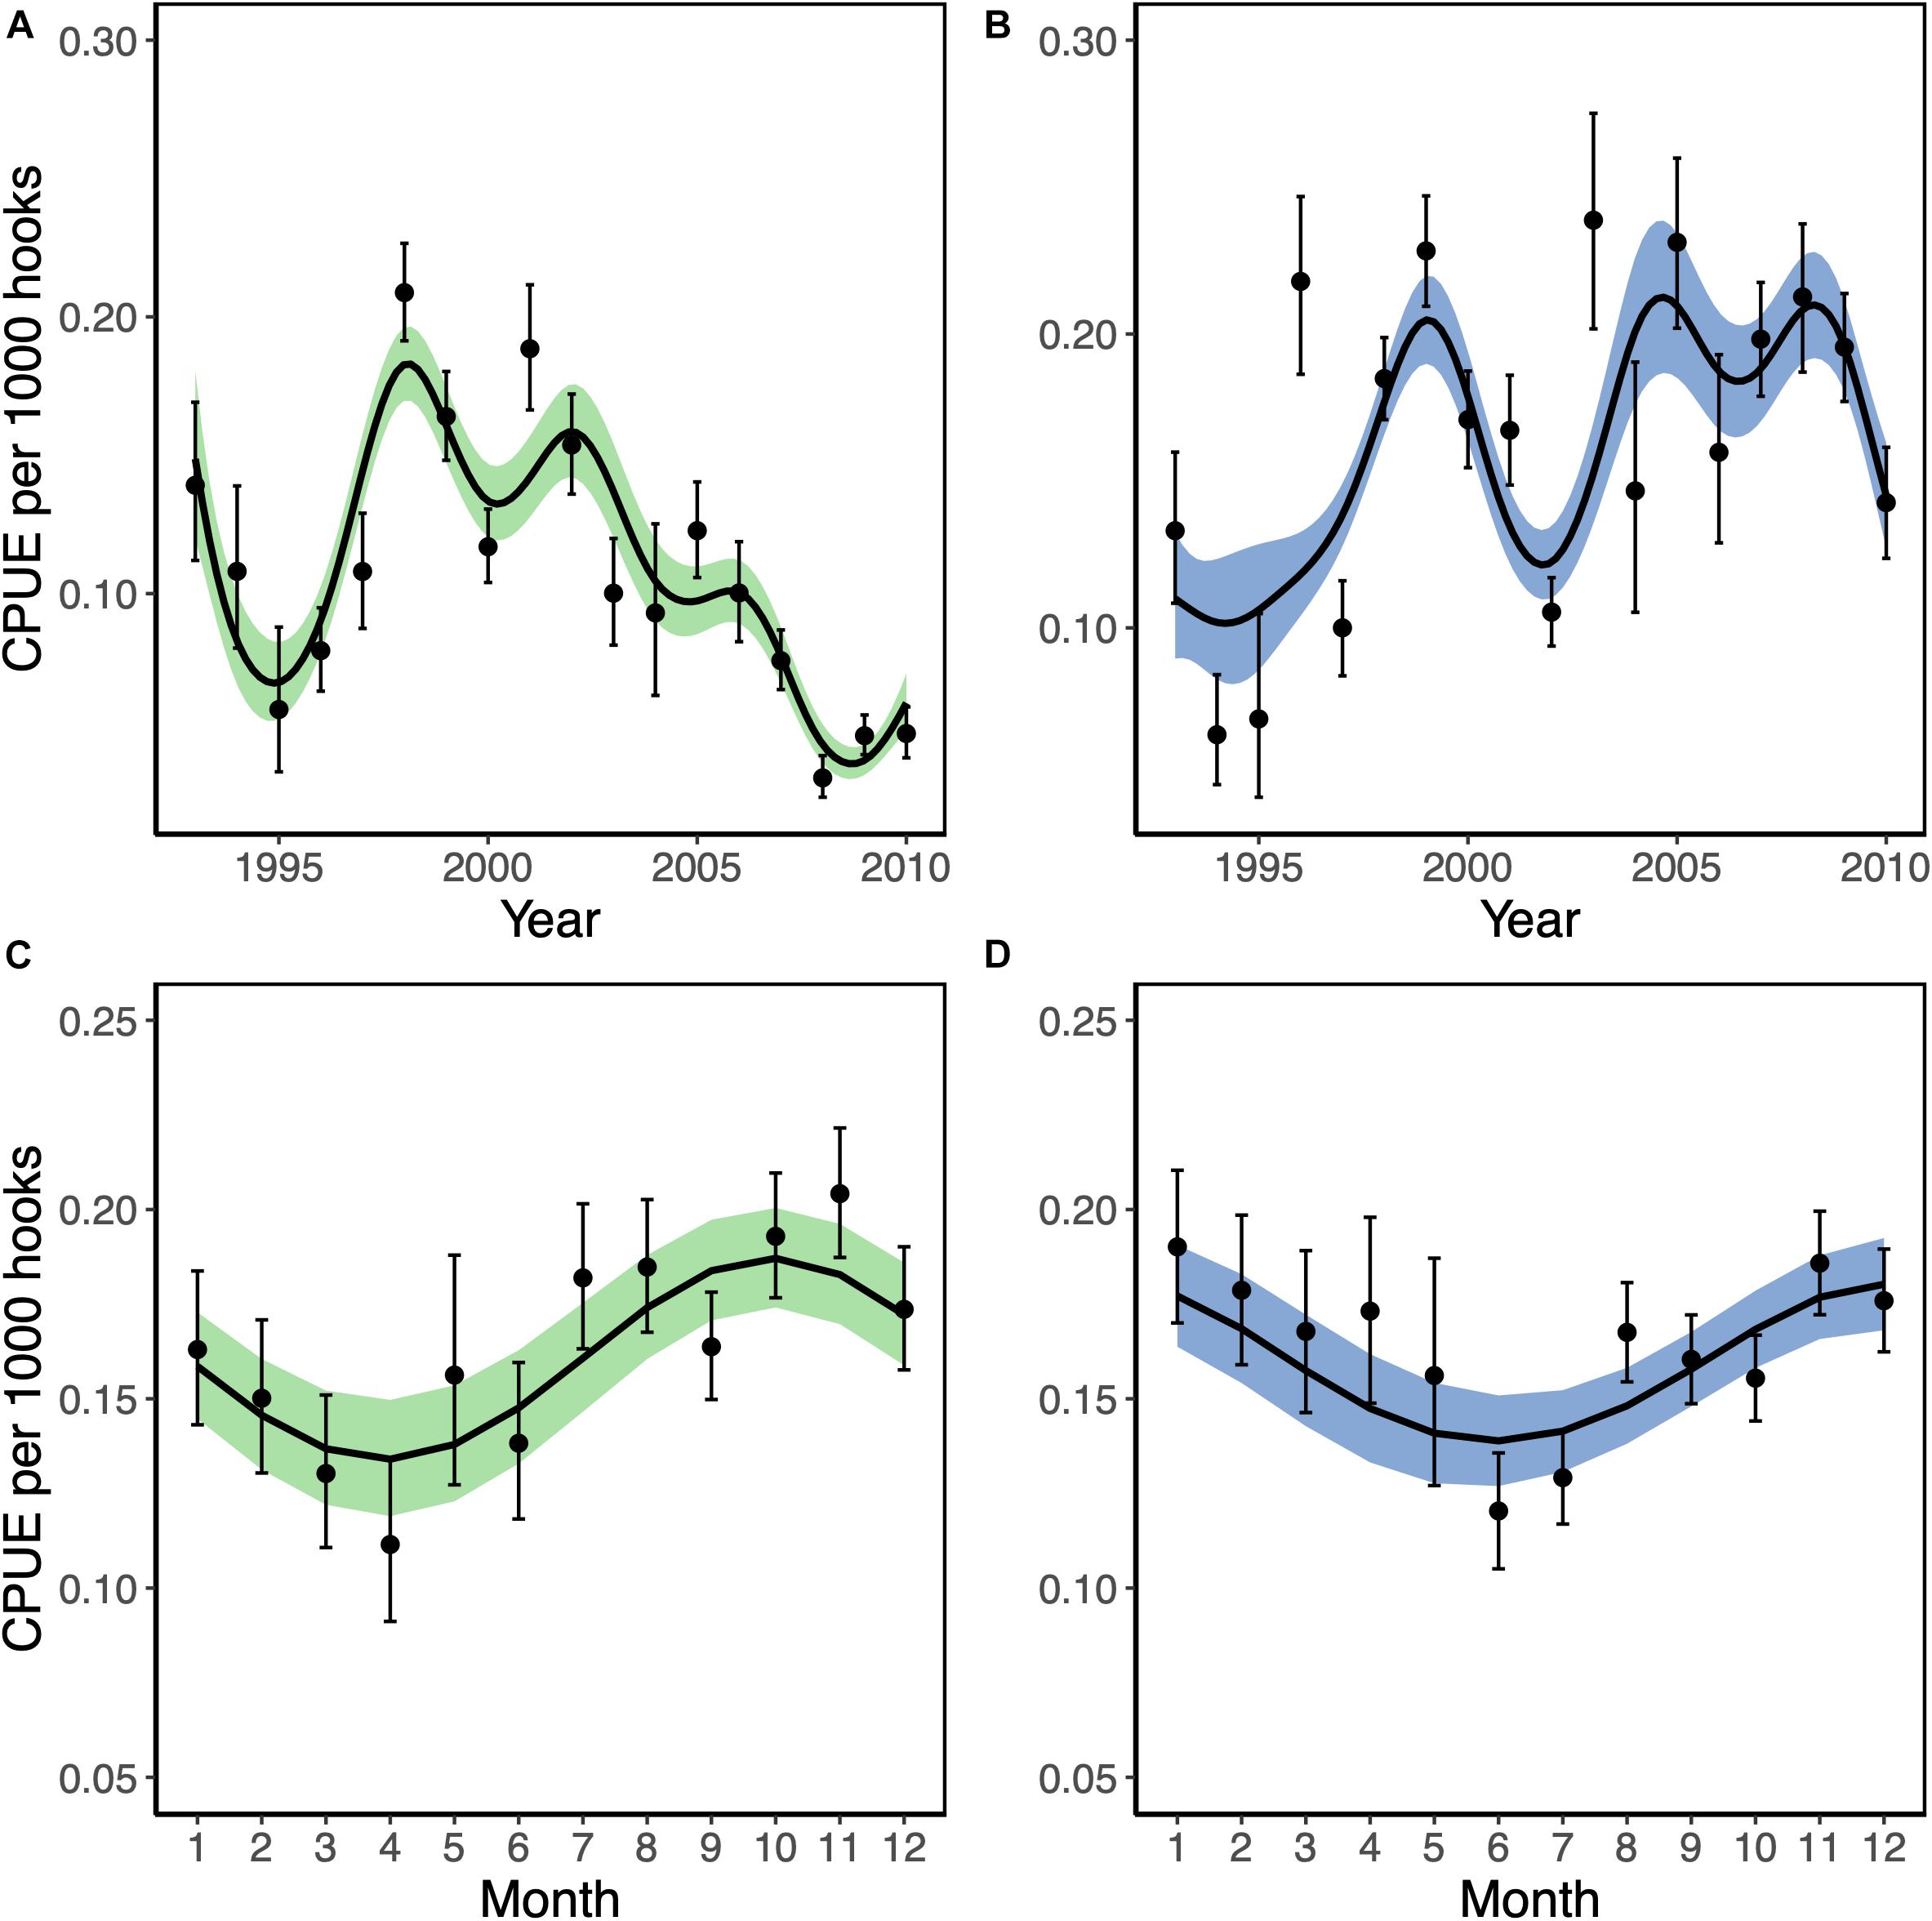
Figure 2. Standardized trends in catch per unit effort (CPUE; tons per thousand hooks) of yellowfin (Thunnus albacares; green) and bigeye tuna (Thunnus obesus; blue) from longline vessels in the British Indian Ocean Territory between 1993 and 2010. Trend lines represent the predicted CPUE from averaged generalized additive mixed models with year (A,C) and month (B,D) as continuous response variables. Points indicate CPUE estimates from models with the temporal response variable as factors. Shaded polygons and error bars represent ± two standard errors.
IOTC
Longline fishing effort has decreased across the Indian Ocean since 2002–2005 (Figures 3B–E). Most notably, in the northwest Indian Ocean and Arabian Sea effort reduced drastically after 2006–2009 (Figures 3C–E). Furthermore, effort decreased considerably along the Chagos-Laccadive Ridge from 2011–2014 onward (Figures 3A–E). From a peak in 1998, the number of hooks deployed in the BIOT quadrant declined by 76.01% between 1998 and 2010 (Figure 3D). Across this period, the BIOT fishery effort contributed between 1.5 and 17.1% of the total effort recorded within the BIOT Quadrant, suggesting considerable fishing activity around the perimeter of the territory (Figure 3F). The BIOT fishery accounted for 2.32% of reported number of total longline hooks deployed across the three quadrants between 1998 and 2010, varying from 0.20 to 5.01% annually (Figure 3F). After the MPA was established, effort continued to drop in the BIOT quadrant, constituting a 59% reduction in effort between 2010 and 2017 (Figure 3D). Effort in the eastern quadrant followed a similar trend to the BIOT quadrant, including the increased effort in 2009. Effort in the western quadrant peaked in 2005 with 134.67 million hooks deployed, before dropping 82.79% by 2011 (23.18 million hooks). Effort then increased in the western quadrant after 2011 to 89.43 million hooks in 2016 (Figure 3F).
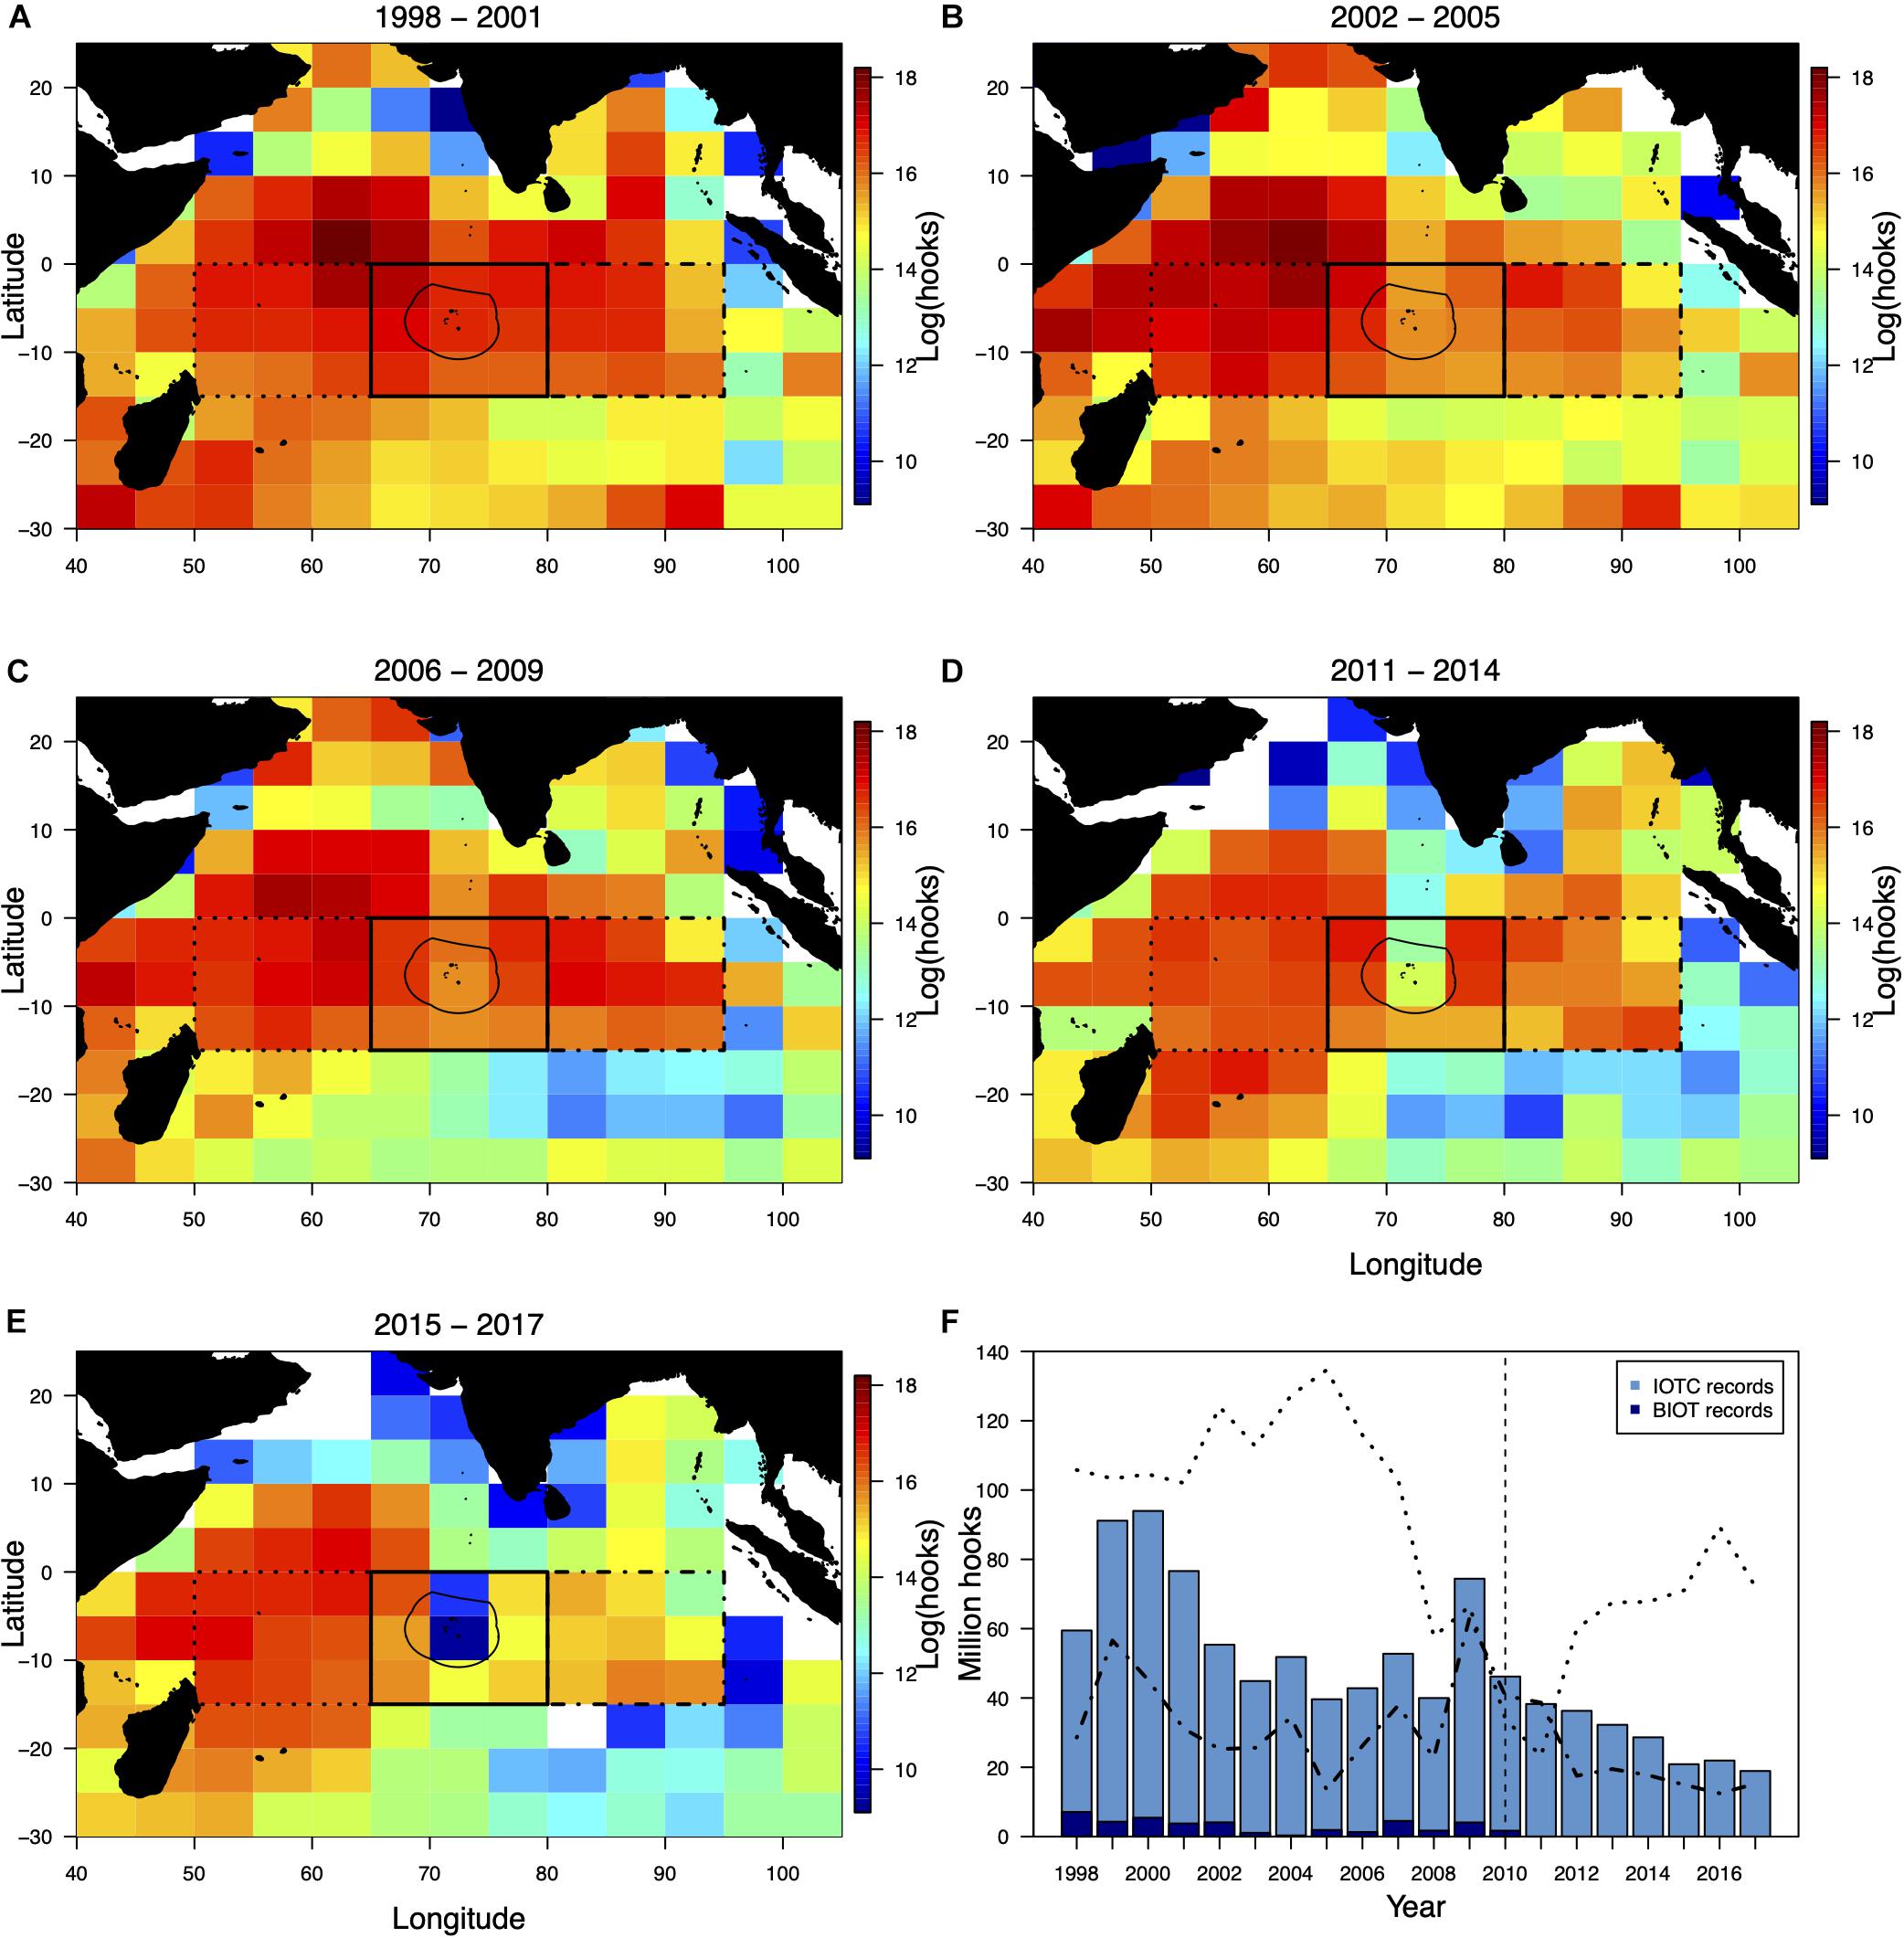
Figure 3. The spatial distribution of mean annual longline hooks set (on a natural logarithm scale) by Indian Ocean Tuna Commission reporting grid cell between (A) 1998–2001, (B) 2002–2005, (C) 2006–2009, (D) 2001–2014, and (E) 2015–2017. Effort data for 2010 were excluded from spatial plots as this was a transition year in the British Indian Ocean Territory (BIOT) with the BIOT marine protected area (MPA) declared in April and the last fisheries license expiring in October. The thin solid line denotes the BIOT MPA boundary with the western (dotted), eastern (dot-dash) and BIOT (thick solid) quadrants delineated (A–E). Bars represent total numbers of hooks deployed within the BIOT quadrant each year within the IOTC database (F). The darker blue sub-sections represent the number of hooks that were recorded within the BIOT exclusive economic zone specifically (from the BIOT longline fisheries dataset). Dotted line represents effort in the western quadrant. Dot-dash line represents effort in the eastern quadrant. Vertical dashed line denotes the BIOT MPA’s establishment in 2010.
Yellowfin CPUEs declined steadily across all three quadrants, with the exception of 1977 within the BIOT quadrant. Standardized CPUEs modeled with year as a factor dropped from 0.45t in 1968 to 0.04t by 2009 within the BIOT quadrant (Figure 4A). Predicted yellowfin CPUE variation also reduced over this time period. The BIOT quadrant’s standardized yellowfin CPUEs then more than quadrupled between 2009 and 2011 (0.04–0.14t). Yet, CPUEs dropped again after 2011, reaching a low of 0.03t in 2014. Model predictions with year as a continuous factor showed an overall decline during this period. Similar patterns were observed in the standardized CPUE indices from the other two quadrants, although CPUEs were consistently lower in the eastern quadrant. Conversely, bigeye CPUEs were variable but stable across all quadrants over the period prior to the MPA’s establishment in 2010 (Figure 4B). Also, bigeye CPUEs (both when modeled with year as a factor and continuous) seemed to increase notably post-2010 in the BIOT and western quadrants. CPUEs in the eastern region remained similar to those pre-2010. BIOT quadrant’s bigeye CPUEs more than doubled between 2009 (0.21t) and 2011 (0.50t) and remained elevated in 2012 (0.46t) before falling to 0.10t by 2017.
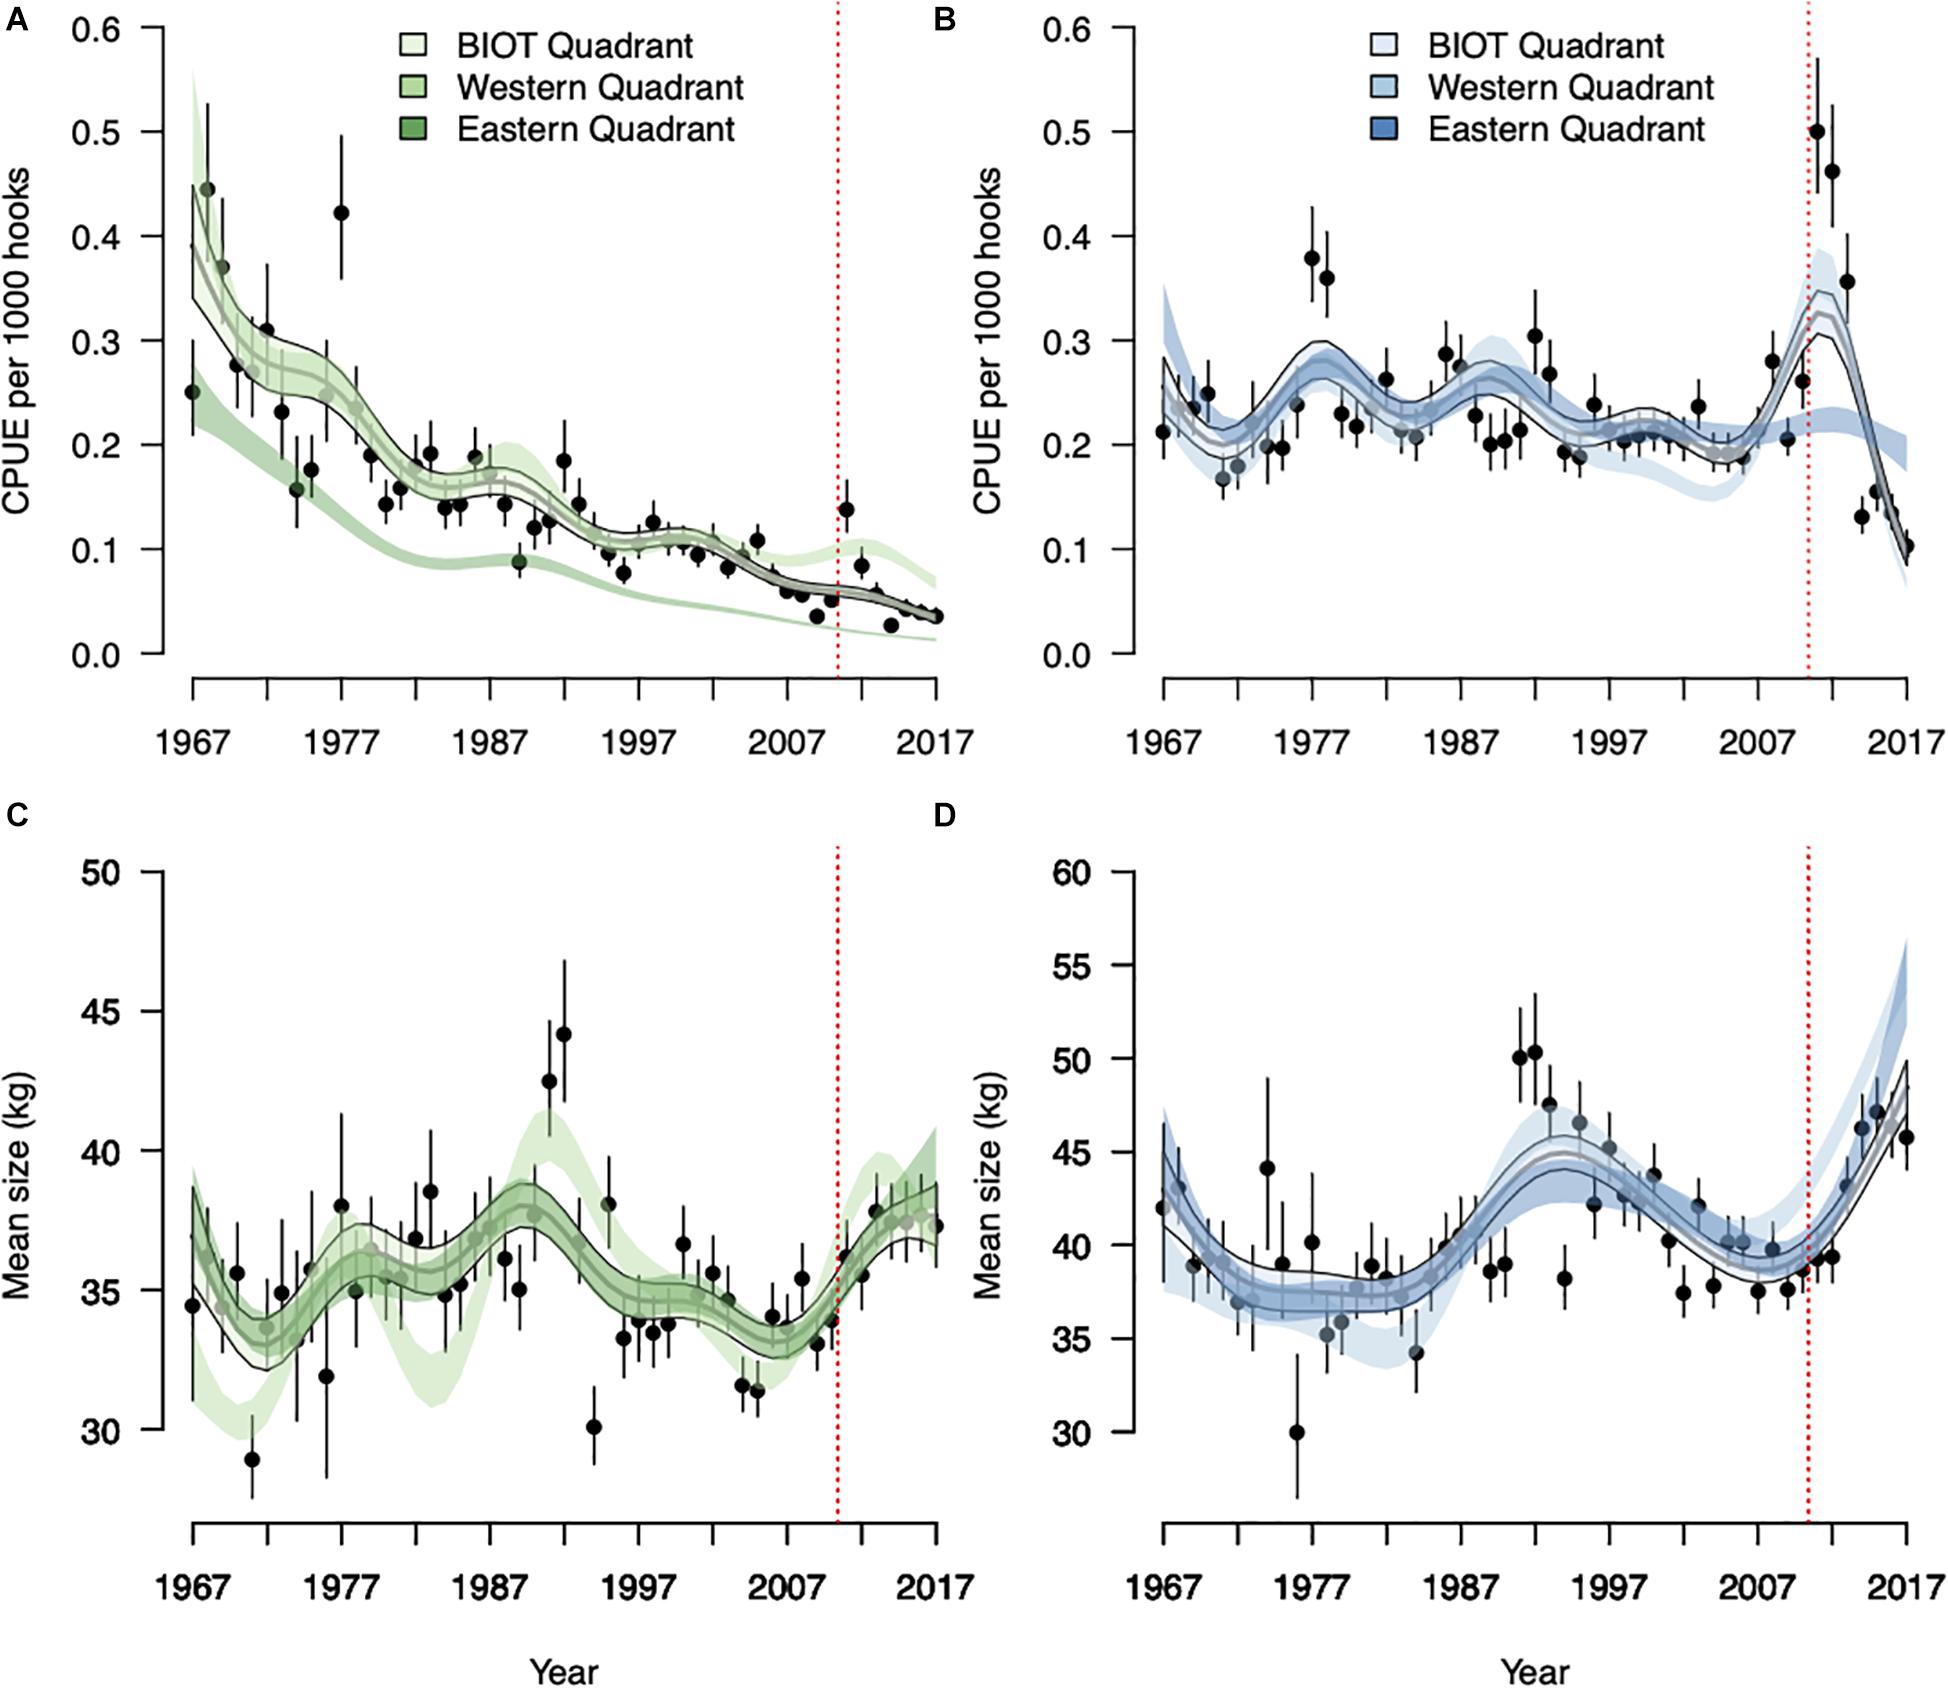
Figure 4. Annual trends in catch per unit effort (CPUE; tons per thousand hooks) and the mean size (in kilograms) of yellowfin tuna [Thunnus albacares; (A,C), respectively] and bigeye tuna [Thunnus obesus; (B,D), respectively] caught by longline vessels within the British Indian Ocean Territory (BIOT), eastern and western quadrant (each relating to nine Indian Ocean Tuna Commission reporting grid cells). The solid lines depict predicted CPUE from BIOT quadrant models with a continuous year effect. Vertical dashed red line denotes the BIOT marine protected area’s establishment in 2010. The shaded polygons represent the 95% confidence intervals, with the BIOT quadrant polygons outlined. Points indicate estimates from BIOT quadrant models only, with year treated as a factor variable and error bars representing ± two standard errors. Predictions for the eastern and western quadrants from models with year treated as a factor are omitted for clarity.
Within the IOTC data, standardized yellowfin CPUE remained highest in the western quadrant throughout the year, with peaks in November through to February. By comparison, standardized yellowfin CPUE in the eastern quadrant peaked in May and June and the BIOT quadrant in September and October. For bigeye, seasonal trends in standardized CPUE in BIOT and eastern quadrant peaked in November to Februrary, with a less distinctive seasonal effect within the western quadrant (Supplementary Figure S1).
Mean sizes of yellowfin and bigeye were highly variable throughout the observed period. However, mean size increased for both species after 2010 across all quadrants. Within the BIOT quadrant, mean yellowfin size increased by 12.76% between 2009 and 2016 (33.09 to 37.31 kg) and bigeye increased by 21.56% between 2009 and 2017 (37.66 to 45.78 kg) when considering models with year as a factor (Figures 4C,D). Over the same period, 2009 to 2017, standardized yellowfin size increased by 11.02% (3.61 kg) in the western quadrant (peaking at 40.22 kg in 2014) and by 7.18 kg (22.75%) in the eastern quadrant (peaking at 44.06 kg in 2014) (Figure 4C). Standardized bigeye size increased by 39.73% between 2009 and 2016 in the western quadrant, and by 41.77% in the eastern quadrant between 2009 and 2017, when sizes peaked.
Discussion
The effective management of tuna fisheries is an important means of achieving international policy commitments such as Sustainable Development Goal 14. Yet, the potential conservation benefits of large MPAs like BIOT for pelagic species, and specifically tunas, are widely debated (Koldewey et al., 2010; Kaplan et al., 2014). We find no direct evidence that standardized CPUE indices of yellowfin or bigeye tuna have improved in region surrounding the BIOT MPA, nearly 8 years after its establishment. Furthermore, most trends and patterns observed in the quadrant surrounding the BIOT MPA, were also observed in both comparative quadrants. Such ocean-wide trends suggest that any possible impacts of establishing the BIOT MPA are mitigated by larger processes elsewhere in the Indian Ocean. For example, yellowfin tuna has been classified as “overfished and subject to overfishing” by the IOTC since 2015. Then, the science committee recommended that a 20% reduction in catches was needed to give the stock a 50% chance of recovery by 2024. Yet, in 2017, the first year this catch reduction was applied, total catch actually increased by 3% (Rattle, 2019). It is therefore possible that any benefits afforded by the BIOT MPA were overawed by persistent overfishing of the stock. Alternatively, as the Indian Ocean is characterized by strong environmental fluctuations and high variability and movement in tropical tuna fisheries, the region may not well be well suited to static spatial closures (Kaplan et al., 2014). Yet the impacts of any MPA are likely to increase with time after establishment (Edgar et al., 2014). It may therefore simply be too early to detect any positive benefits for the fish and fishers alike. Regardless, it is unlikely that large MPAs will be able to provide the conservation and management benefits needed for mobile species like tunas alone. Therefore, they will need to be established, managed and evaluated in conjunction with effective regional fishery management regulations.
Standardized CPUEs of yellowfin tuna within the historical BIOT longline fisheries data declined between 1993 and 2010 in a manner consistent with other parts of the Indian Ocean (Nishida et al., 2012; Ochi et al., 2014), while standardized bigeye tuna CPUEs remained generally stable. This suggests that yellowfin tuna populations were declining in BIOT prior to the MPA’s establishment. Using raw CPUEs as a proxy of species’ population abundance comes with its limitations and may represent a biased proxy if not properly handled and standardized (Maunder et al., 2006; Polacheck, 2006). In some cases, CPUEs may underestimate population declines as fishers can compensate for reduced catch rates by changing fishing strategy and improving gear (Harley et al., 2001; Polacheck, 2006). While we accounted for some of these variations in our standardization processes, we were limited by available logbook data which did not contain information on potentially important factors, such as gear or method modifications (Chang et al., 2011; Song and Wu, 2011; Matsumoto et al., 2016), and possible underreporting and misreporting (Walsh et al., 2005). Therefore, we cannot rule out the impact of these factors on the reported trends. CPUE may also overestimate population declines, particularly in the early stages of a fishery (Hilborn and Walters, 1992). However, in the case of BIOT, we believe this case is unlikely as commercial longlining was already well established in the Indian Ocean prior to the start of the BIOT dataset in 1993. Yet, the usefulness of even standardized CPUEs can be limited, if analyses are spatially restricted (Walters, 2003) or are considered in isolation (Maunder et al., 2006). Thus, integrated stock assessments are often viewed as the best means of assessing the population status of an entire stock (see Maunder et al., 2006). Therefore, it is important to note that the trends observed in BIOT mirrored those reported across the wider Indian Ocean and are broadly consistent with regional relative stock assessments (IOTC, 2018), which considers both species single homogenous stocks across the Indian Ocean and, in the case of yellowfin tuna, overexploited (IOTC, 2018).
Yellowfin and bigeye tuna fisheries stock assessments postulate that the BIOT is located on the eastern most limit of a cyclical tuna migration pattern in the West Indian Ocean (Pearce, 1996). The shift in peak CPUEs across the three quadrants reported here are broadly consistent with this hypothesis, although we feel that it is an oversimplification. BIOT was historically targeted by fishers between December and January (Dunne et al., 2014), especially by purse seiners (Dunn and Curnick, 2019). This period coincided with the main yellowfin spawning season (Zudaire et al., 2013) and stable isotope analyses of predators within BIOT has shown an increased dependence on pelagic resources during this period (Curnick et al., 2019). We detected this seasonal pattern in yellowfin CPUEs in BIOT. However, in BIOT, both species were caught year-round, suggesting that not all tunas follow the aforementioned migration route. It is therefore possible that there is behavioral plasticity within the stock, with some individuals undertaking alternative migration patterns or exhibiting residency behavior, possibly linked to ontogeny. Such behaviors have been shown in other highly mobile species (Walli et al., 2009; Meyer et al., 2010) and can be driven by increased productivity around islands (Worm et al., 2003) or the presence of seamounts (Morato et al., 2008), of which there are an estimated 86 within BIOT (Yesson et al., 2011). Such behavior could have significant implications for how these stocks are managed in the region and for the potential future impact of the BIOT MPA. Yet, little is known about the spatial ecology and behavior of tunas in BIOT and the region more generally. Therefore, a focussed tuna tagging study, building on the regional tuna tagging project (Hallier and Fonteneau, 2015) and those in BIOT (Carlisle et al., 2019) to test these hypotheses, would be an important direction for future research. The establishment of MPAs may even promote residency behavior as a result of selective genetic pressure exerted by fishing outside the MPA boundary (Mee et al., 2017), and thus increase the conservation value of the MPA for these species. MPAs have also been shown to enhance tuna stock availability to local fisheries over time, as was recently documented around the Galapagos MPA (Boerder et al., 2017).
It has been previously suggested that BIOT would be unlikely to yield any benefits to tunas or tuna fishers given it is not a key area to the longline fishery (nor the purse seine fishery) and hotspots in catch of juveniles and supposed spawners are located elsewhere, often in areas of the high seas (Kaplan et al., 2014). Indeed, other studies have suggested that the global MPA movement has been biased to areas that are politically easier to establish – for example, in remote or unattractive areas for extractive activities (Devillers et al., 2015; Stevenson et al., 2019) – rather than biodiversity outcomes. So, while it may be true that BIOT isn’t at the center of the tuna fishing ground in the Indain Ocean, it is important to recognize that the primary objective of the BIOT MPA was for broader biodiversity conservation, rather than fisheries management. Also, establishing MPAs in areas beyond national jurisdiction is difficult (Ardron et al., 2008), with limited legal frameworks currently available to do so (Wright et al., 2019). In such instances, conservation outcomes may be better achieved through other methods, such as effective ecosystem fisheries management, integrated ocean management or marine spatial planning (Fulton et al., 2015; Dunstan et al., 2016).
Yet, as a modest fishery existed in BIOT prior to the MPA’s establishment, the territory was clearly not too remote or unattractive to fishers to declare it completely obsolete. It is therefore interesting that we found a moderate peak in effort in the BIOT quadrant immediately prior to the MPA’s establishment. We posit this is due to fishers trying to maximize catch before regulations restricted access, akin to observations in the Phoenix Islands where fishers more than doubled their fishing effort once the area was earmarked for a potential protected area (McDermott et al., 2019). In the years subsequent to 2009, effort in the BIOT quadrant realigned and contracted, in line with that of the long-term trend within the region. We suggest that this overall trend of reduced effort is in part a factor of the BIOT MPA’s establishment, but also a result of multiple other concurrent factors such as the Maldives closing their waters to foreign longliners (Adam et al., 2015) and creating a shark sanctuary (Ward-Paige, 2017), and Somali piracy activity in the western Indian Ocean (Matsumoto et al., 2016). Notably, the effort in the western quadrant increased after 2011, once the threat of piracy started to abate (Matsumoto et al., 2016).
Another expectation is that displaced fishers will simply “fish the line” (Kellner et al., 2007) and concentrate along the borders of MPA to exploit biomass spillover (Roberts et al., 2001). Recent studies using satellite-based vessel position data from Automatic Identification Systems (AIS) has shown purse seine vessels fishing on the edge of the Galápagos reserve boundary (Boerder et al., 2017), and bottom trawlers fishing around a large fisheries restricted area in the Adriatic Sea (Elahi et al., 2018). Our spatial effort data were too aggregated and coarse to deduce whether the remaining effort was “fishing the line” around BIOT, and AIS data are only available in the Indian Ocean since 2012. However, the increase in effort post-2011 in the western quadrant does indicate a possible displacement of fishing activity into this area. However, like changes in CPUE, it is impossible to attribute this directly to the MPA’s establishment, with the reduction in piracy threat in the western Indian Ocean a major factor.
In the year following the MPA closure, standardized CPUEs of yellowfin tuna in the BIOT quadrant (only in models containing year as a factor) and bigeye tuna within the BIOT and western quadrants increased sharply. This spike could therefore indicate that fleets were benefitting from a surplus generated by the unfished recruits of the previous year. Unfished recruits may have been a result of the MPA providing a spatial refuge. Yet, this boost in CPUEs was quickly eroded as CPUEs of both species fell consistently after 2011. Thus, this spike is possibly driven by previous good recruitment years or Indian Ocean wide processes, and not simply the MPA. For example, a lagged response to the threat of Somali piracy from 2007 onward, where longline fishing effort reduced considerably in the northwest Indian Ocean and Arabian Sea, especially in the Japanese fleet (Okamoto, 2011). This resulted in an overall reduction of effort, a switch to focus on more temperate tunas, and a redistribution of remaining effort toward the southern and eastern Indian Ocean (Chassot et al., 2010; Okamoto, 2011; Matsumoto et al., 2016), all of which would reduce overall effort and boost catch rates.
The increase in the mean size of both tunas caught post-2010 was more persistent. This increase was apparent across all quadrants and for both species. Our results are broadly consistent with those reported across the Indian Ocean, for both species, by the longline fishery (IOTC-WPTT21, 2019). A major benefit for MPAs in coastal environments is their ability to increase fish biomass (Aburto-Oropeza et al., 2011). Yet, especially for yellowfin, this upturn started prior to the MPA’s establishment (∼2006). Therefore, the increased sizes of yellowfin and bigeye tunas reported here are also likely to be the result of a combination of processes across the Indian Ocean, such as the combined spatial closure between BIOT and the Maldives, the reduction in longline effort in the northwest Indian Ocean as a concurrent impact of Somali piracy at that time (Matsumoto et al., 2016), or a few strong year classes. Furthermore, there has been an ever increasing use of and dependence on drifting fish aggregating devices (dFADs) by the purse seine fishery within the Indian Ocean, with use increasing 4-fold between 2007 and 2013 alone (Maufroy et al., 2017). The use of dFADs has multiple negative effects (reviewed in Davies et al., 2017), including an increased capture of small yellowfin and bigeye tunas (Leroy et al., 2009) compared to “free schooling” that targets larger, mature fish. This shift may have, at least in the short-term, reduced purse-seine fishing pressure on larger tunas, affording larger individuals in the longline fishery. Indeed, when considering all fisheries (longline, pole and line, gillnet and purse seine), the average sizes of bigeye tuna caught has recently decreased, driven by a marked increase in catches reported by purse seine fisheries that target smaller size classes (IOTC-WPTT21, 2019). For yellowfin, concerns have been raised regarding the credibility of average weights derived from catch-and-effort longline data, especially from the Tawainese fleet in recent years (IOTC-WPTT21, 2019). We therefore cannot categorically rule out the potential influence of such inconsistencies on our findings for both yellowfin and bigeye. However, we note that the more credible IOTC yellowfin length-frequency data also generally indicate an increase in fish size post-2011, albeit less pronounced (IOTC-WPTT21, 2019). Regardless of the cause of the increase in fish sizes reported here within the longline fishery, as female and male yellowfin mature at 109.69 cm (25 kg) and 104.95 cm (22 kg), respectively (Nootmorn et al., 2005), the average tuna caught by longliners around the BIOT MPA is reproductively mature. An increase in average size means higher fecundity, with larger individuals producing more eggs and spawning for longer periods (Zudaire et al., 2013). Therefore, as BIOT was historically targeted by fishers during peak yellowfin spawning season (Pearce, 1996; Zudaire et al., 2013), the MPA may now be protecting sexually mature individuals during key spawning stage and therefore contributing positively to management of the yellowfin stock. This is an aspect that deserves further investigation as it is especially important given the stock’s current status of being overfished and subject to overfishing (Hilborn and Walters, 1992) and the Near Threated status of the species on the IUCN Red List (IUCN, 2019).
We cannot rule out that the BIOT MPA may be providing local conservation value to tropical tunas. However, disentangling the effects of the BIOT MPA from other coincidental processes occurring across the surrounding region is difficult and requires a large effort of data integration. Unfortunately the data available (in IOTC public datasets) is currently too coarse to undertake such meaningful analyses. Here, with analyses on historical logbook data within the BIOT and public catch and effort statistics of Indian Ocean longline fisheries, we highlighted emerging effects of the BIOT MPA on the status of two important tuna species in the Indian Ocean and now call for deeper and more targeted investigations. Using CPUEs as a proxy of species’ population abundance (Polacheck, 2006), and aggregated effort statistics to detect changes in fishing fleet behaviors come with limitations, but our findings emphasize that large MPAs should be considered in conjunction with other fishery management regulations and wider regional processes, in order to provide the conservation and management benefits needed for mobile species like tunas. Continued monitoring of the fishery in the areas adjacent to the BIOT MPA, preferably with spatially and temporally disaggregated data, is needed in order to test whether these patterns hold and to assess any future conservation value of the MPA. This is of extreme timely importance as the role of large MPAs may be key in aligning management and conservation objectives for ensuring sustainable food production and biodiversity conservation.
Data Availability Statement
The datasets analyzed in this manuscript are not all publicly available. Requests to access the datasets should be directed to to the BIOT Administration (for BIOT data). The IOTC data are, publicly available through the IOTC website.
Author Contributions
DC, HK, KJ, KK, and BC secured the funding for the programme and conceived the manuscript. DC and FF analyzed the data and drafted the manuscript, with input from all co-authors. All authors, except for BC who sadly passed away during the preparation of the manuscript, read and approved the final manuscript.
Funding
This work was funded by the Zoological Society of London, a University College London Impact Award and the Bertarelli Foundation through the Bertarelli Programme in Marine Science.
Conflict of Interest
The authors declare that the research was conducted in the absence of any commercial or financial relationships that could be construed as a potential conflict of interest.
Acknowledgments
This manuscript was dedicated to co-author, friend, and mentor Dr. Ben Collen. We would like to thank the BIOT Administration for granting us permission to undertake the research, and MRAG for the provision of data.
Supplementary Material
The Supplementary Material for this article can be found online at: https://www.frontiersin.org/articles/10.3389/fmars.2020.00318/full#supplementary-material
Footnotes
References
Aburto-Oropeza, O., Erisman, B., Galland, G. R., Mascareñas-Osorio, I., Sala, E., and Ezcurra, E. (2011). Large recovery of fish biomass in a no-take marine reserve. PLoS One 6:e23601. doi: 10.1371/journal.pone.0023601
Adam, M. S., Ziyad, A., Sinan, H., Ali, K., Shifaz, A., Ahusan, M., et al. (2015). Maldives National Report to Scientific Committee of the Indian Ocean Tuna Commission. Malé: Ministry of Fisheries and Agriculture
Ardron, J., Gjerde, K., Pullen, S., and Tilot, V. (2008). Marine spatial planning in the high seas. Mar. Policy 32, 832–839. doi: 10.1016/j.marpol.2008.03.018
Becker, J. J., Sandwell, D. T., Smith, W. H. F., Braud, J., Binder, B., Depner, J., et al. (2009). Global bathymetry and elevation data at 30 arc seconds resolution: SRTM30_PLUS. Mar. Geod. 32, 355–371. doi: 10.1080/01490410903297766
Boerder, K., Bryndum-Buchholz, A., and Worm, B. (2017). Interactions of tuna fisheries with the Galápagos marine reserve. Mar. Ecol. Prog. Ser. 585, 1–15. doi: 10.3354/meps12399
Boyce, D. G., Tittensor, D. P., and Worm, B. (2008). Effects of temperature on global patterns of tuna and billfish richness. Mar. Ecol. Prog. Ser. 355, 267–276. doi: 10.3354/meps07237
Breen, P., Posen, P., and Righton, D. (2015). Temperate marine protected areas and highly mobile fish: a review. Ocean Coast. Manag. 105, 75–83. doi: 10.1016/j.ocecoaman.2014.12.021
Brill, R. W., and Lutcavage, M. E. (2001). “Understanding environmental influences on movements and depth distributions of tunas and billfishes can significantly improve population assessments,” in Proceedings of the American Fisheries Society Symposium (Bethesda, MA: American Fisheries Society), 179–198.
Burnham, K. P., and Anderson, D. R. (2002). Model Selection and Multimodel Inference: A Practical Information-Theoretic Approach. Berlin: Springer Science & Business Media, doi: 10.1016/j.ecolmodel.2003.11.004
Carlisle, A. B., Tickler, D., Dale, J. J., Ferretti, F., Curnick, D. J., Chapple, T. K., et al. (2019). Estimating space use of mobile fishes in a large marine protected area with methodological considerations in acoustic array design. Front. Mar. Sci. 6:256. doi: 10.3389/fmars.2019.00256
Chang, S. K., Hoyle, S., and Liu, H. I (2011). Catch rate standardization for yellowfin tuna (Thunnus albacares) in Taiwan’s distant-water longline fishery in the Western and Central Pacific Ocean, with consideration of target change. Fish. Res. 107, 1–3. doi: 10.1016/j.fishres.2010.11.004
Chassot, E., Dewals, P., Floch, L., Lucas, V., Morales-Vargas, M., and Kaplan, D. (2010). Analysis of the Effects of Somali Piracy on the European Tuna Purse Seine Fisheries of the Indian Ocean. Rome: FAO.
Chen, I. C., Lee, P. F., and Tzeng, W. N. (2005). Distribution of albacore (Thunnus alalunga) in the Indian Ocean and its relation to environmental factors. Fish. Oceanogr. 14, 71–80. doi: 10.1111/j.1365-2419.2004.00322.x
Corbineau, A., Rouyer, T., Cazelles, B., Fromentin, J.-M., Fonteneau, A., and Ménard, F. (2008). Time series analysis of tuna and swordfish catches and climate variability in the Indian Ocean (1968-2003). Aquat. Living Resour. 21, 277–285. doi: 10.1051/alr:2008045
Curnick, D. J., Carlisle, A. B., Gollock, M. J., Schallert, R. J., and Hussey, N. E. (2019). Evidence for dynamic resource partitioning between two sympatric reef shark species within the British Indian Ocean Territory. J. Fish Biol. 94, 680–685. doi: 10.1111/jfb.13938
Dagorn, L., Bach, P., and Josse, E. (2000). Movement patterns of large bigeye tuna (Thunnus obesus) in the open ocean, determined using ultrasonic telemetry. Mar. Biol. 136, 361–371. doi: 10.1007/s002270050694
Davies, T., Curnick, D., Barde, J., and Chassot, E. (2017). “Potential environmental impacts caused by beaching of drifting fish aggregating devices and identification of management solutions and uncertainties,” in Proceedings of the First IOTC Ad Hoc Working Group on FADs, (Madrid: IOTC). 14.
Devillers, R., Pressey, R. L., Grech, A., Kittinger, J. N., Edgar, G. J., Ward, T., et al. (2015). Reinventing residual reserves in the sea: Are we favouring ease of establishment over need for protection? Aquat. Conserv. Mar. Freshw. Ecosyst. 25, 480–504. doi: 10.1002/aqc.2445
Dueri, S., and Maury, O. (2013). Modelling the effect of marine protected areas on the population of skipjack tuna in the Indian Ocean. Aquat. Living Resour. 26, 171–178. doi: 10.1051/alr/2012032
Dunn, N., and Curnick, D. (2019). Using historical fisheries data to predict tuna distribution within the British Indian Ocean Territory Marine Protected Area, and implications for its management. Aquat. Conserv. Mar. Freshw. Ecosyst. 29, 2057–2070. doi: 10.1002/aqc.3204
Dunne, R. P., Polunin, N. V. C., Sand, P. H., and Johnson, M. L. (2014). The creation of the Chagos marine protected area: a fisheries perspective. Adv. Mar. Biol. 69, 79–127. doi: 10.1016/B978-0-12-800214-8.00003-7
Dunstan, P. K., Bax, N. J., Dambacher, J. M., Hayes, K. R., Hedge, P. T., Smith, D. C., et al. (2016). Using ecologically or biologically significant marine areas (EBSAs) to implement marine spatial planning. Ocean Coast. Manag. 121, 116–127. doi: 10.1016/j.ocecoaman.2015.11.021
Edgar, G. J., Stuart-Smith, R. D., Willis, T. J., Kininmonth, S., Baker, S. C., Banks, S., et al. (2014). Global conservation outcomes depend on marine protected areas with five key features. Nature 506, 216–220. doi: 10.1038/nature13022
Elahi, R., Ferretti, F., Bastari, A., Cerrano, C., Colloca, F., Kowalik, J., et al. (2018). Leveraging vessel traffic data and a temporary fishing closure to inform marine management. Front. Ecol. Environ. 16:1936. doi: 10.1002/fee.1936
Follesa, M. C., Cannas, R., Cau, A., Cuccu, D., Gastoni, A., Ortu, A., et al. (2011). Spillover effects of a Mediterranean marine protected area on the European spiny lobster Palinurus elephas (Fabricius, 1787) resource. Aquat. Conserv. Mar. Freshw. Ecosyst. 21, 564–572. doi: 10.1002/aqc.1213
Fulton, E. A., Bax, N. J., Bustamante, R. H., Dambacher, J. M., Dichmont, C., Dunstan, P. K., et al. (2015). Modelling marine protected areas: insights and hurdles. Phil. Trans. R. Soc. B: Biol. Sci. 370:20140278. doi: 10.1098/rstb.2014.0278
Hallier, J. P., and Fonteneau, A. (2015). Tuna aggregation and movement from tagging data: a tuna “hub” in the Indian Ocean. Fish. Res. 163, 34–43. doi: 10.1016/j.fishres.2014.06.003
Harley, S., Myers, R., and Dunn, A. (2001). Is catch-per-unit-effort proportional to abundance? Can. J. Fish. Aquat. Sci. 58, 1760–1772. doi: 10.1139/cjfas-58-9-1760
Hilborn, R., and Walters, C. J. (1992). Quantitative Fisheries Stock Assessment: Choice, Dynamics and Uncertainty. New York, NY: Springer, doi: 10.1007/BF00042883
IOTC (2018). Report of the 20th Session of the IOTC Working Party on Tropical Tunas. Victoria: IOAT.
IOTC Secretariat (2014). Guidelines for the reporting of fisheries statistics to the IOTC. Seychelles: Mahé.
IOTC-WPTT21 (2019). Report of the 21st Session of the IOTC Working Party on Tropical Tunas. Seychelles: Mahé. doi: IOTC-2019-WPTT21-R[E]
IUCN (2019). The IUCN Red List of Threatened Species. Version 2019-2. Available online at: http://www.iucnredlist.org (accessed July 30, 2019).
Jones, P. J. S., and De Santo, E. M. (2016). Viewpoint – Is the race for remote, very large marine protected areas (VLMPAs) taking us down the wrong track? Mar. Policy 73, 231–234. doi: 10.1016/j.marpol.2016.08.015
Kaplan, D. M., Chassot, E., Amandé, J. M., Dueri, S., Demarcq, H., Dagorn, L., et al. (2014). Spatial management of Indian Ocean tropical tuna fisheries: potential and perspectives. ICES J. Mar. Sci. J. du Cons. 71, 1728–1749. doi: 10.1093/icesjms/fst233
Kellner, J. B., Tetreault, I., Gaines, S. D., and Nisbet, R. M. (2007). Fishing the line near marine reserves in single and multispecies fisheries. Ecol. Appl. 17, 1039–1054. doi: 10.1890/05-1845
Koldewey, H. J., Curnick, D., Harding, S., Harrison, L. R., and Gollock, M. (2010). Potential benefits to fisheries and biodiversity of the Chagos Archipelago/British Indian Ocean Territory as a no-take marine reserve. Mar. Pollut. Bull. 60, 1906–1915. doi: 10.1016/j.marpolbul.2010.10.002
Lan, K. W., Evans, K., and Lee, M. A. (2013). Effects of climate variability on the distribution and fishing conditions of yellowfin tuna (Thunnus albacares) in the western Indian Ocean. Clim. Change 119, 63–77. doi: 10.1007/s10584-012-0637-8
Leroy, B., Itano, D. G., Usu, T., Nicol, S. J., Holland, K. N., and Hampton, J. (2009). “Vertical behavior and the observation of FAD effects on tropical tuna in the warm-pool of the Western Pacific Ocean,” in Tagging and Tracking of Marine Animals with Electronic Devices. Reviews: Methods and Technologies in Fish Biology and Fisheries, Vol. 9, eds J. L. Nielsen, H. Arrizabalaga, N. Fragoso, A. Hobday, M. Lutcavage, and J. Sibert (Dordrecht: Springer), doi: 10.1007/978-1-4020-9640-2_10
Lester, S. E., Halpern, B. S., Grorud-Colvert, K., Lubchenco, J., Ruttenberg, B. I., Gaines, S. D., et al. (2009). Biological effects within no-take marine reserves: A global synthesis. Mar. Ecol. Prog. Ser. 384, 33–46. doi: 10.3354/meps08029
Matsumoto, T., Nishida, T., Satoh, K., and Kitakado, T. (2016). “Japanese longline CPUE for yellowfin tuna in the Indian Ocean standardized by generalized linear model,” in Proceedings of the 1 National Research Institute of Far Seas Fisheries (NRIFSF), (Yokohama: Fisheries Research Agency), 5–7.
Maufroy, A., Kaplan, D. M., Bez, N., De Molina, A. D., Murua, H., Floch, L., et al. (2017). Massive increase in the use of drifting Fish Aggregating Devices (dFADs) by tropical tuna purse seine fisheries in the Atlantic and Indian oceans. ICES J. Mar. Sci. 74, 215–225. doi: 10.1093/icesjms/fsw175
Maunder, M. N., and Punt, A. E. (2004). Standardizing catch and effort data: A review of recent approaches. Fish. Res. 70, 141–159. doi: 10.1016/j.fishres.2004.08.002
Maunder, M. N., Sibert, J. R., Fonteneau, A., Hampton, J., Kleiber, P., and Harley, S. J. (2006). Interpreting catch per unit effort data to assess the status of individual stocks and communities. ICES J. Mar. Sci. 63, 1373–1385. doi: 10.1016/j.icesjms.2006.05.008
McDermott, G. R., Meng, K. C., McDonald, G. G., and Costello, C. J. (2019). The blue paradox: Preemptive overfishing in marine reserves. Proc. Natl. Acad. Sci. U.S.A. 116, 5319–5325. doi: 10.1073/pnas.1802862115
Mee, J. A., Otto, S. P., and Pauly, D. (2017). Evolution of movement rate increases the effectiveness of marine reserves for the conservation of pelagic fishes. Evol. Appl. 10, 444–461. doi: 10.1111/eva.12460
Meyer, C. G., Papastamatiou, Y. P., and Holland, K. N. (2010). A multiple instrument approach to quantifying the movement patterns and habitat use of tiger (Galeocerdo cuvier) and Galapagos sharks (Carcharhinus galapagensis) at French Frigate Shoals. Hawaii Mar. Biol. 157, 1857–1868. doi: 10.1007/s00227-010-1457-x
Morato, T., Varkey, D. A., Damaso, C., Machete, M., Santos, M., Prieto, R., et al. (2008). Evidence of a seamount effect on aggregating visitors. Mar. Ecol. Prog. Ser. 357, 23–32. doi: 10.3354/meps07269
Nishida, T., Rademeyer, R., Ijima, H., Sato, K., Matsumoto, T., Kitakado, T., et al. (2012). Stock and Risk Assessments On Yellowfin Tuna (Thunnus albacares) in the Indian Ocean by AD Model Builder implemented Age-Structured Production Model (ASPM) and Kobe I + II software. Victoria: IOAT.
Nootmorn, P., Yakoh, A., and Kawises, K. (2005). “Reproductive biology of yellowfin tuna in the eastern indian ocean,” in Proceedings of the IOTC-2005-WPTT-14 (Victoria: IOAT).
Ochi, D., Matsumoto, T., Okamoto, H., and Kitakado, T. (2014). “Japanese longline CPUE for yellowfin tuna in the Indian Ocean up to 2013 standardized by generalized linear model,” in Proceedings of the IOTC Working Party of Tropical Tuna 2014 (Victoria: IOAT).
Okamoto, H. (2011). Preliminary Analysis of the Effect of Piracy Activity in the Northwestern Indian Ocean on the CPUE Trend on Bigeye and Yellowfin. Malé. Available online at: http://www.iotc.org/files/proceedings/2011/wptt/IOTC-2011-WPTT13-44.pdf (accessed November 11, 2019).
Pearce, J. (1996). A Review of the British Indian Ocean Territory Fisheries Conservation and Management Zone Tuna Fishery, 1991 – 1995. Available online at: http://www.oceandocs.org/bitstream/handle/1834/497/EC601-17.pdf?sequence=1 (accessed October 12, 2018).
Polacheck, T. (2006). Tuna longline catch rates in the Indian Ocean: did industrial fishing result in a 90% rapid decline in teh abundance of large predatory spcies? Mar. Policy 30, 470–482. doi: 10.1016/j.marpol.2005.06.016
R Development Core Team (2018). R: A Language and Environment for Statistical Computing. Vienna: R Foundation for Statical Computing.
Rattle, J. (2019). A Case Study on the Management of Yellowfin Tuna by the Indian Ocean Tuna Commission Blue Marine Foundation. Available online at: https://www.iotc.org/sites/default/files/documents/2019/06/IOTC-2019-S23-INF14_A_case_study_on_the_management_of_yellowfin_tuna_by_the_Indian_Ocean_Tuna_Commission.pdf (accessed January 14, 2020).
Richardson, A. J., Downes, K. J., Nolan, E. T., Brickle, P., Brown, J., Weber, N., et al. (2018). Residency and reproductive status of yellowfin tuna in a proposed large-scale pelagic marine protected area. Aquat. Conserv. Mar. Freshw. Ecosyst. 28, 1308–1316. doi: 10.1002/aqc.2936
Roberts, C. M., Halpern, B., Palumbi, S. R., and Warner, R. R. (2001). Designing marine reserve networks why small, isolated protected areas are not enough. Conserv. Sci. Pract. 2, 10–17. doi: 10.1111/j.1526-4629.2001.tb00012.x
Sabarros, P. S., Romanov, E. V., and Bach, P. (2017). Movements and Behaviour of Yellowfin and Bigeye Tuna Associated to Oceanic Structures in the Western Indian Ocean. Victoria: IOAT.
Saji, N. H., Goswami, B. N., Vinayachandran, P. N., and Yamagata, T. (1999). A dipole mode in the tropical Indian Ocean. Nature 401, 360–363. doi: 10.1038/43854
Schaefer, K. M., and Fuller, D. W. (2002). Movements, behavior, and habitat selection of bigeye tuna (Thunnus obesus) in the eastern equatorial Pacific, ascertained through archival tags. Fish. Bull. 100, 765–788.
Schaefer, K. M., Fuller, D. W., and Aldana, G. (2014). Movements, behavior, and habitat utilization of yellowfin tuna (Thunnus albacares) in waters surrounding the Revillagigedo Islands Archipelago Biosphere Reserve, Mexico. Fish. Oceanogr. 23, 65–82. doi: 10.1111/fog.12047
Schaefer, K. M., Fuller, D. W., and Block, B. A. (2007). Movements, behavior, and habitat utilization of yellowfin tuna (Thunnus albacares) in the northeastern Pacific Ocean, ascertained through archival tag data. Mar. Biol. 152, 503–525. doi: 10.1007/s00227-007-0689-x
Song, L. M., and Wu, Y. P. (2011). Standardizing CPUE of yellowfin tuna (Thunnus albacares) longline fishery in the tropical waters of the northwestern Indian Ocean using a deterministic habitat-based model. J. Oceanogr. 67, 541–550. doi: 10.1007/s10872-011-0055-y
Stevenson, S. L., Woolley, S. N. C., Barnett, J., and Dunstan, P. (2019). Testing the presence of marine protected areas against their ability to reduce pressures on biodiversity. Conserv. Biol. doi: 10.1111/cobi.13429 [Epub ahead of print].
Tewfik, A., Babcock, E. A., Gibson, J., Perez, V. R. B., and Strindberg, S. (2017). Benefits of a replenishment zone revealed through trends in focal species at Glover’s Atoll, Belize. Mar. Ecol. Prog. Ser. 580, 37–56. doi: 10.3354/meps12290
Walli, A., Teo, S. L. H., Boustany, A., Farwell, C. J., Williams, T., Dewar, H., et al. (2009). Seasonal movements, aggregations and diving behavior of Atlantic bluefin tuna (Thunnus thynnus) revealed with archival tags. PLoS One 4:e6151. doi: 10.1371/journal.pone.0006151
Walsh, W. A., Ito, R. Y., Kawamoto, K. E., and McCracken, M. (2005). Analysis of logbook accuracy for blue marlin (Makaira nigricans) in the Hawaii-based longline fishery with a generalized additive model and commercial sales data. Fish. Res. 75, 175–192. doi: 10.1016/j.fishres.2004.11.007
Walters, C. (2003). Folly and fantasy in the analysis of spatial catch rate data. Can. J. Fish. Aquat. Sci. 60, 1433–1436. doi: 10.1139/f03-152
Ward-Paige, C. A. (2017). A global overview of shark sanctuary regulations and their impact on shark fisheries. Mar. Policy 82, 87–97. doi: 10.1016/j.marpol.2017.05.004
White, T. D., Carlisle, A. B., Kroodsma, D. A., Block, B. A., Casagrandi, R., De Leo, G. A., et al. (2017). Assessing the effectiveness of a large marine protected area for reef shark conservation. Biol. Conserv. 207, 64–71. doi: 10.1016/j.biocon.2017.01.009
Wood, S. N. (2001). mgcv: GAMs and generalized ridge regression for R. R. News 1, 20–25. doi: 10.1159/000323281
Wood, S. N. (2003). Thin plate regression splines. J. R. Stat. Soc. Ser. B Stat. Methodol. 65, 95–114. doi: 10.1111/1467-9868.00374
Wood, S. N. (2006). Generalized Additive Models: An Introduction with R. Texts Stat. Sci., xvii. Boca Raton, FL: CRC Press. 392.
Worm, B., Lotze, H. K., and Myers, R. A. (2003). Predator diversity hotspots in the blue ocean. Proc. Natl. Acad. Sci. U.S.A. 100, 9884–9888. doi: 10.1073/pnas.1333941100
Wright, G., Gjerde, K. M., Johnson, D. E., Finkelstein, A., Ferreira, M. A., Dunn, D. C., et al. (2019). Marine spatial planning in areas beyond national jurisdiction. Mar. Policy (in press). doi: 10.1016/j.marpol.2018.12.003
Yesson, C., Clark, M. R., Taylor, M. L., and Rogers, A. D. (2011). The global distribution of seamounts based on 30 arc seconds bathymetry data. Deep. Res. Part I Oceanogr. Res. Pap. 58, 442–453. doi: 10.1016/j.dsr.2011.02.004
Zudaire, I., Murua, H., Grande, M., and Bodin, N. (2013). Reproductive potential of Yellowfin Tuna (Thunnus albacares) in the western Indian ocean. Fish. Bull. 111, 252–264. doi: 10.7755/FB.111.3.4
Keywords: British Indian Ocean Territory (BIOT), fisheries, generalized additive mixed models (GAMM), longline, marine protected area (MPA), Thunnus albacares, Thunnus obesus, tuna
Citation: Curnick DJ, Collen B, Koldewey HJ, Jones KE, Kemp KM and Ferretti F (2020) Interactions Between a Large Marine Protected Area, Pelagic Tuna and Associated Fisheries. Front. Mar. Sci. 7:318. doi: 10.3389/fmars.2020.00318
Received: 11 November 2019; Accepted: 17 April 2020;
Published: 14 May 2020.
Edited by:
Rowan Trebilco, CSIRO Oceans and Atmosphere (O&A), AustraliaReviewed by:
Skipton Woolley, Commonwealth Scientific and Industrial Research Organisation (CSIRO), AustraliaMaria José Juan-Jordá, Consultant, Madrid, Spain
Copyright © 2020 Curnick, Collen, Koldewey, Jones, Kemp and Ferretti. This is an open-access article distributed under the terms of the Creative Commons Attribution License (CC BY). The use, distribution or reproduction in other forums is permitted, provided the original author(s) and the copyright owner(s) are credited and that the original publication in this journal is cited, in accordance with accepted academic practice. No use, distribution or reproduction is permitted which does not comply with these terms.
*Correspondence: David J. Curnick, ZGF2aWQuY3Vybmlja0B6c2wub3Jn
†Deceased