 Helene Frigstad1,2*†
 Øyvind Kaste1,2
 Anne Deininger1,2
 Karsten Kvalsund3Guttorm Christensen4
 Richard G. J. Bellerby1,5Kai Sørensen1Marit Norli1
 Andrew L. King1†
- 1Norwegian Institute for Water Research, Oslo, Norway
- 2Centre for Coastal Research, University of Agder, Kristiansand, Norway
- 3Runde Environmental Centre, Runde, Norway
- 4Akvaplan-niva, Tromsø, Norway
- 5SKLEC-NIVA Centre for Marine and Coastal Research, State Key Laboratory of Estuarine and Coastal Research, East China Normal University, Shanghai, China
Coastal ecosystems are of high ecological and socioeconomic importance and are strongly influenced by processes from land, sea, and human activities. In this study, we present physical, chemical, and biological observations over two consecutive years from three study regions along the Norwegian coast that represent a broad latitudinal gradient in catchment and oceanographic conditions (∼59–69°N): outer Oslofjord/southern Norway, Runde/western Norway, and Malangen/northern Norway. The observations included river monitoring, coastal monitoring, and sensor-equipped ships of opportunity (“FerryBox”). The riverine discharge and transports were an order of magnitude higher, and the spatiotemporal extent of this freshwater influence was larger in the coastal region in southern Norway, compared to western and northern Norway. The southern Norway coastal waters had consistently high dissolved organic carbon (DOC) and chromophoric dissolved organic matter (cDOM) fluorescence year-round, connected to the large influence of local riverine input and likely also advected riverine run-off and mixing with water masses from the southern North Sea and Baltic Sea. Meanwhile, the western and northern study regions were more sheltered and characterized by more episodic riverine input of freshwater, DOC, cDOM, and nutrients. The timing of the spring phytoplankton bloom in all three regions generally preceded the periods of high riverine input, which suggested that while the winter nutrient reserve was sufficient to fuel the spring bloom, the input of nutrients during the spring flood could sustain the spring bloom or the input of suspended matter, and DOC/cDOM could result in light limitation of the bloom. This article summarizes the impact of riverine input on three diverse coastal systems in terms timing and duration, as well as the potential consequences for ecosystem function especially as related to rising terrestrial organic matter input into coastal regions over the last decades and the projected increase due to climate change.
Introduction
Coastal regions are among the most productive systems in the world and are important marine ecosystems as local hotspots of productivity and carbon burial (Cloern et al., 2014; Smith et al., 2015), as well as nursery grounds for heritage fisheries (Brattegard et al., 2011; Checkley et al., 2017). Over the past decades, terrestrially derived organic matter has been steadily increasing in boreal freshwaters as a response to complex interactions between increased precipitation, reduced sulfur deposition, and land use changes, and future projected warming and increase in precipitation are expected to increase dissolved organic matter (DOM) influx to coastal oceans (Monteith et al., 2007; de Wit et al., 2016). In the Arctic, similar increases in DOM may be expected due to thawing of permafrost, melting glaciers, and increased occurrence of episodic rainfall events (Peterson et al., 2002; Carmack et al., 2015). These changes are likely to have important consequences on riverine input into coastal ecosystems, and thus their structure and functioning, as increased DOM influx to aquatic environments can potentially lead to increased greenhouse gas emissions, reduced light availability and net primary productivity, increased bacterial productivity, and changes in community composition (Lapierre et al., 2013; Deininger et al., 2016; Sipler et al., 2017) and may further interact with eutrophication (Deininger and Frigstad, 2019). Terrestrial inputs of carbon and nutrients can also contribute to coastal ocean acidification (Wallace et al., 2014; Gledhill et al., 2015), resulting in short-term fluctuations in pH, saturation states for calcium carbonate, and oxygen levels.
Along the Norwegian coast, nearly all the major rivers discharge into fjords where short-term variability in riverine inputs results in high variability in salinity and concentrations of land-derived substances. The transport and concentrations of riverine inputs of freshwater, DOM, and nutrients vary depending on seasonal or shorter-term variability in catchment biogeochemical processes and climatic factors (Skarbovik et al., 2014; Kaste et al., 2018). Over the last decades, there has been an increase in suspended particulate concentrations in Skagerrak coastal waters (Frigstad et al., 2013), which has been related to the increased riverine loads and the reported “darkening” of coastal Skagerrak and the North Sea (Aksnes et al., 2009; Dupont and Aksnes, 2013; Frigstad et al., 2018). Simultaneously, there have been reports of changes in fish recruitment (Johannessen et al., 2012) and reductions in the distribution and lower growth depth of several species of macroalgae in Skagerrak and the North Sea (Moy and Christie, 2012; Sogn Andersen et al., 2019). However, there is still limited knowledge of how variability in riverine inputs affects coastal biogeochemistry and ecosystems along the Norwegian coastline at present conditions, which is needed to understand how future changes in riverine inputs will influence coastal systems.
The objective of this study was to improve the understanding of seasonal and interannual variability in riverine inputs and its effects on coastal systems, especially with relation to biogeochemistry and the phytoplankton spring bloom. To achieve this, riverine and coastal ocean observations were made at three study regions along the Norwegian coast from ∼59 to 69°N. Observations were collated from river monitoring, coastal monitoring, and ships of opportunity (“FerryBox”). The three study regions were the outer Oslofjord in southern Norway, Runde in western Norway, and Malangen in northern Norway. The observations show strong regional and seasonal variability across the study regions in terms of riverine input of freshwater, dissolved organic carbon (DOC), and nutrients, as well as in coastal hydrography, chromophoric DOM (cDOM) fluorescence, and phytoplankton biomass [chlorophyll a (chl a)].
Methods and Study Regions
Study Regions
This study compiles measurements from national monitoring programs and research activities over a 2-year period from January 2017 to December 2018 for three selected coastal systems: (A) the outer Oslofjord/southern Norway, (B) Runde/western Norway, and (C) Malangen/northern Norway. Station locations are shown in Figure 1, and an overview of stations and data sources are presented in Table 1. Each study region includes data from nearby riverine input, continuous and high-frequency sea surface observations covering a larger geographical region from sensor-equipped ships of opportunity called FerryBoxes, and conventional research vessel station-based observations on an approximately monthly frequency with sampling covering the full water column.
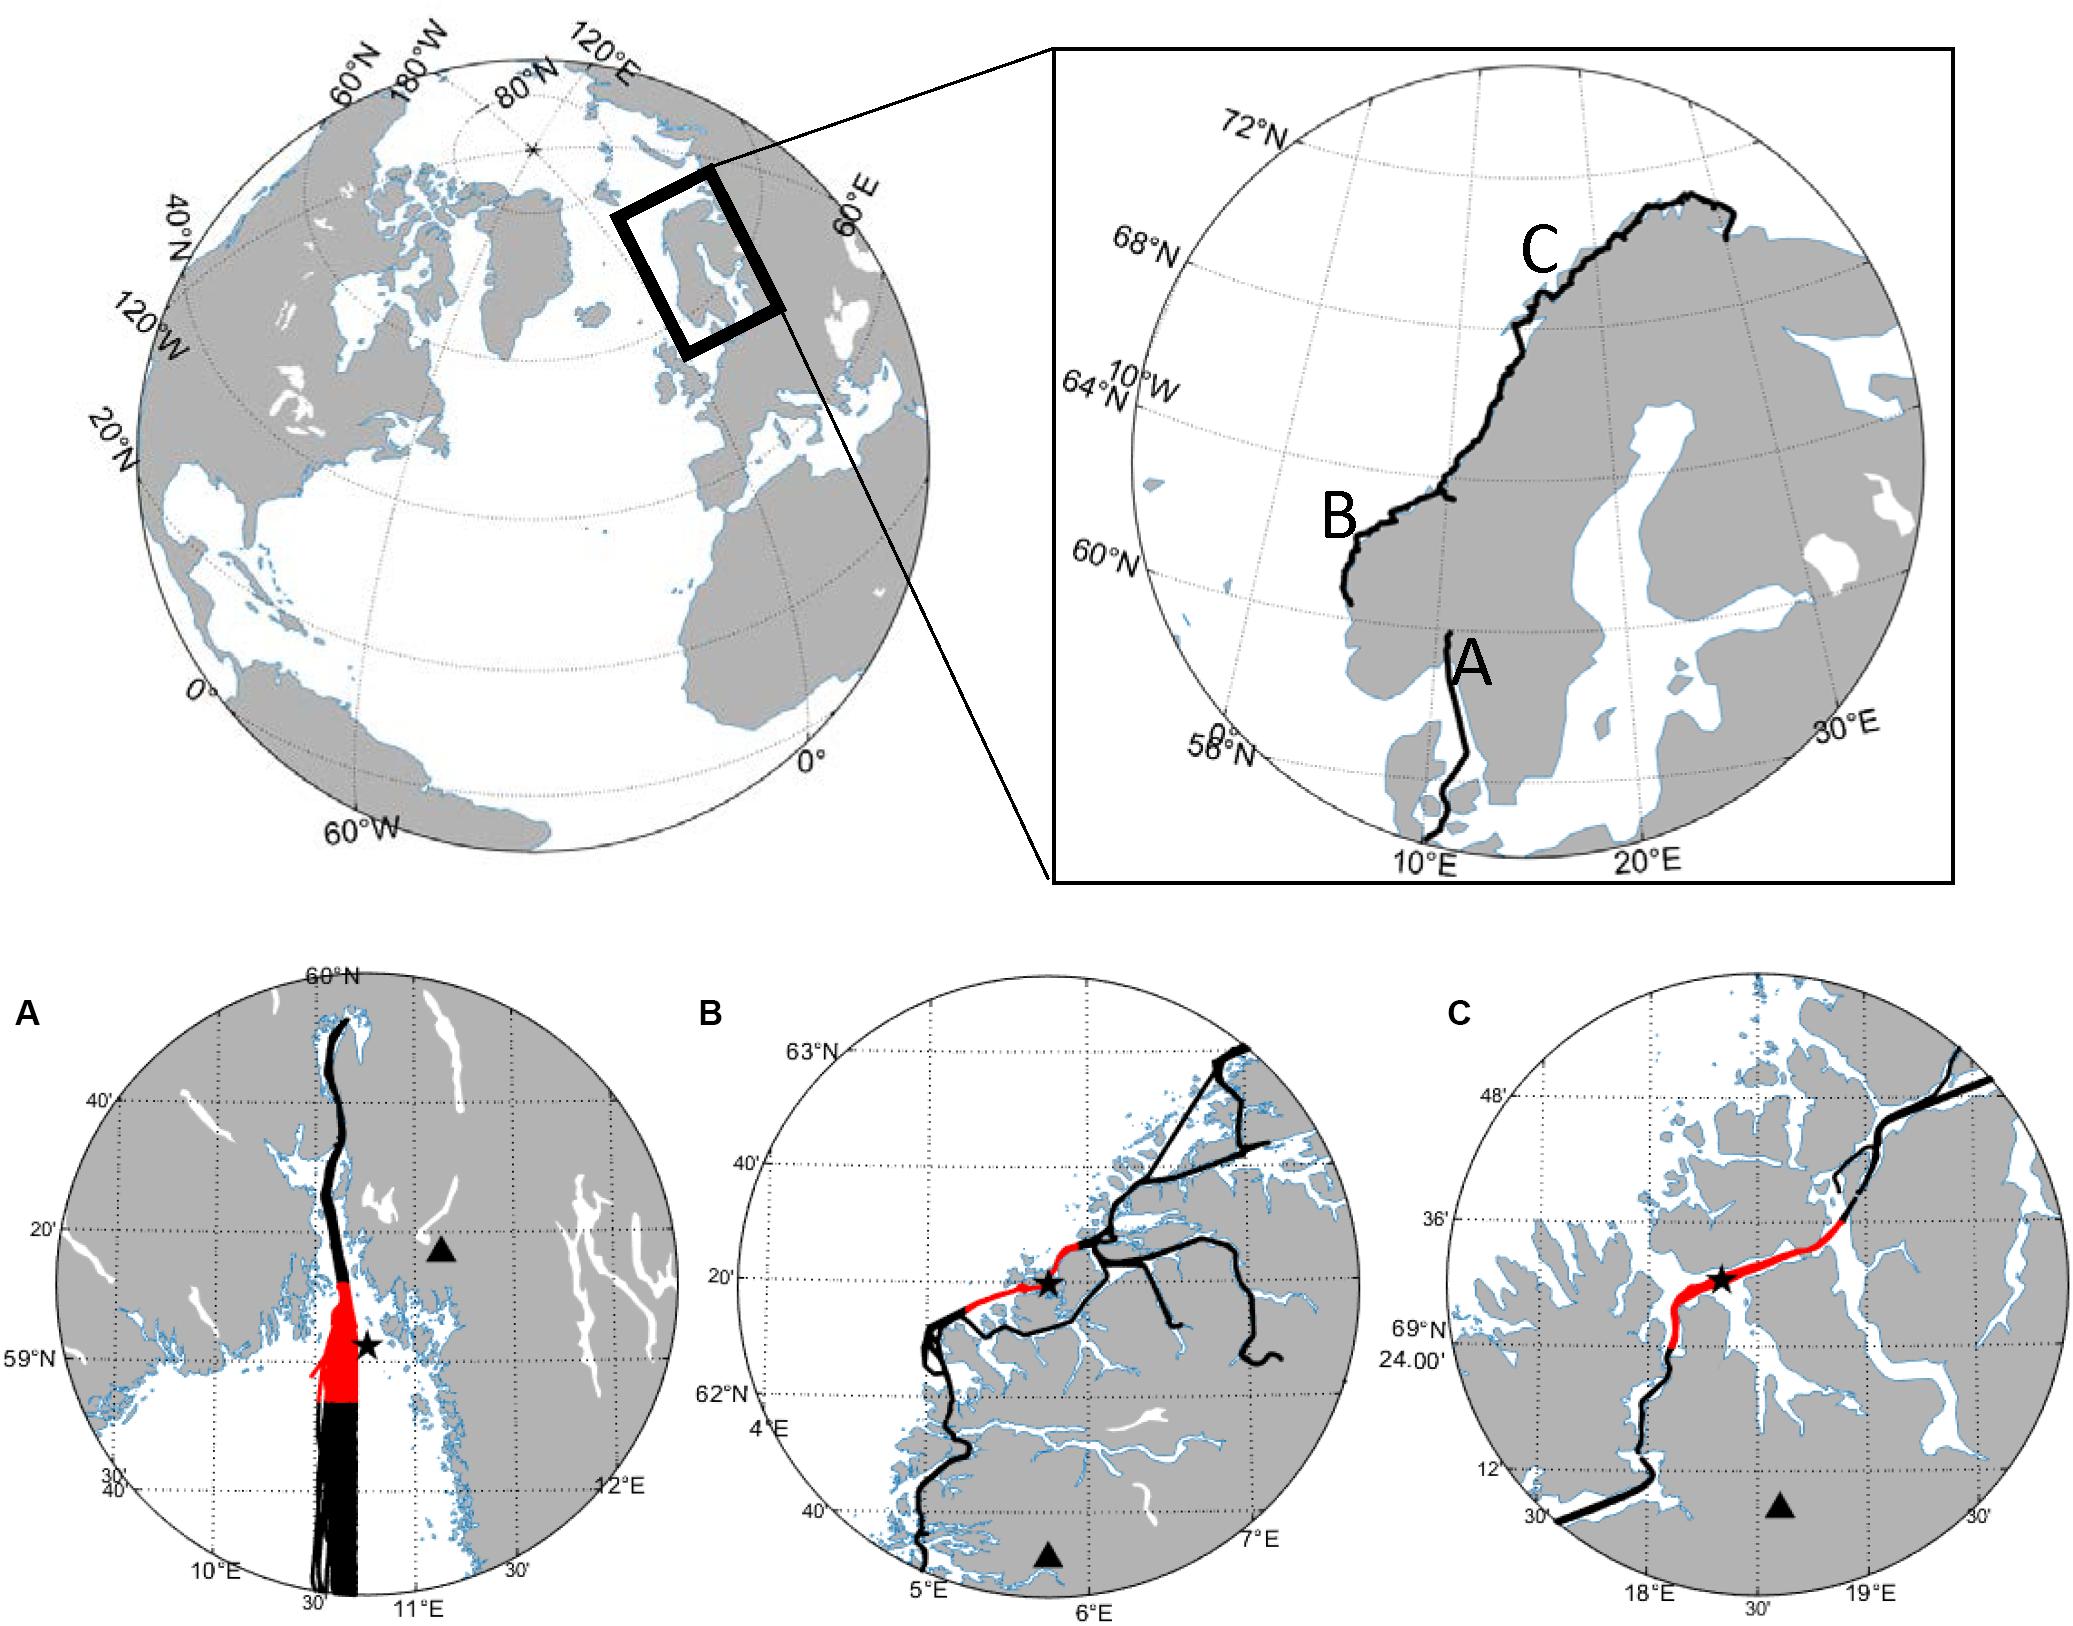
Figure 1. Overview of three study regions in (A) Outer Oslofjord/southern Norway, (B) Runde/western Norway, and (C) Malangen/northern Norway. Top panel shows location along Norwegian coastline with full FerryBox transects. Bottom panel shows zoomed-in view of the study sites, FerryBox transects (black line), part of FerryBox lines examined along with water column data (red line), the location of water column stations (star), and river monitoring gauging stations (triangle). The river monitoring gauging stations are present at river Glomma, Nausta, and Målselv for study regions (A–C), respectively.
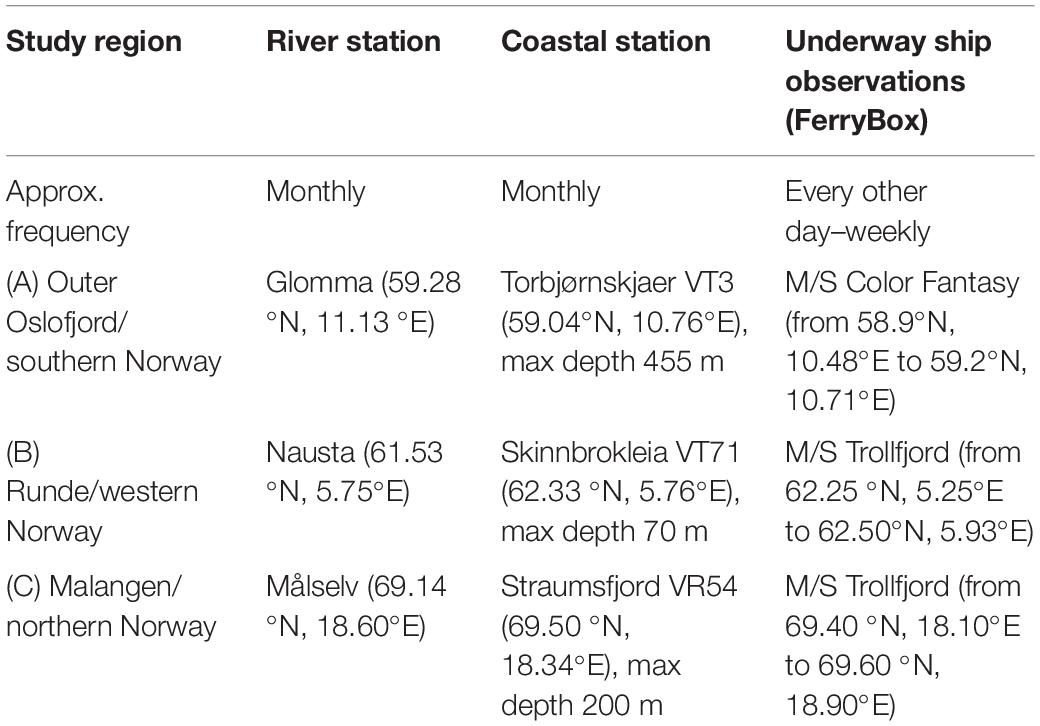
Table 1. Overview of study regions, with corresponding stations and relevant data sources.
The study regions represent a large latitudinal range from ∼59 to 69°N. The outer Oslofjord/southern Norway study region (seafloor depth ∼455 m) is in the northeastern relatively open part of the Skagerrak Sea where the Glomma river discharges into the region from the northeast. The Runde/western Norway (seafloor depth of ∼70 m) and Straumsfjord/northern Norway (seafloor depth of ∼200 m) study regions are both relatively sheltered from the Norwegian Coastal Current behind island archipelagos. Both the Nausta and Målselv rivers are located to the south of their respective study regions.
River Observations and Sampling
Daily water discharges were obtained from gauging stations operated by the Norwegian Water Resources and Energy Directorate: stations 2.605.0 Solbergfoss in the Glomma river, 84.11.0 Hovefoss in the Nausta river, and 196.35.0 Målselvfossen in the Målselv river (Figure 1). While Glomma and Målselv rivers are less than 25 km from the respective coastal stations, the Nausta river outflow is the most spatially decoupled from Runde/western Norway station (∼90 km south of the coastal station). However, data from six other rivers located within a radius of 20–100 km (mean 65 km) from the Runde/western Norway station (and with monthly data covering at least 1 year during the period 2016–2019) show that the water chemistry is relatively similar with respect to suspended particulate matter (SPM; mean deviation, -7%), DOC (mean deviation, −36%), total nitrogen (mean deviation, +11%), total phosphorus (mean deviation, −22%), and SiO2 (mean deviation, +27%) (Skarbøvik et al., 2017; Kaste et al., 2018; Kile et al., 2018). All rivers are located within a region characterized by relatively uniform landscape and climate conditions, which means that hydrological regimes and the catchment’s land cover characteristics are quite similar. It is therefore assumed that the Nausta river is representative of the Runde study region.
Discrete samples for analysis of water quality parameters were collected monthly from each river through the national “River Monitoring Program” (Kaste et al., 2018). In Glomma river, additional sampling was conducted in May and June to get a better representation of the high-flow period following snowmelt. The following variables, among others not presented here, were measured at each station, SPM, DOC, and nutrients (PO4, NO3, and SiO2), following the procedures described in Kaste et al. (2018). Suspended particulate matter was analyzed by filtering 500–1,000 mL water through 0.4 μm Nuclepore capillary filters, which were dried at 40–50°C for a minimum of 2 h, whereafter the tare was determined by micro weight [LOD (level of detection), 0.1 mg L–1]. Dissolved organic carbon was measured on samples filtered through Whatman GF/F filters (0.7-μm nominal pore size) and analyzed on a Phoenix 8000 TOC-TC analyzer (Teledyne Tekmar, Mason, United States) after oxidation with peroxydisulfate (LOD, 0.03 mg L–1). PO4 was analyzed on acidified samples by automated colorimetry after reaction with molybdate and antimony (LOD, 0.3 μg L–1). NO3 was analyzed by ion chromatography using a Dionex IC25 (Thermo Fisher Scientific GmbH, Dreieich, Germany) instrument (LOD, 0.7 μg L–1). SiO2 was analyzed on acidified samples by automated colorimetry after reaction with molybdate and ascorbic acid (LOD, 0.008 mg L–1).
Coastal Stations
Discrete water column samples were taken approximately monthly at three coastal stations (see Table 1 and Figure 1 for location). The coastal stations in the southern, western, and northern Norway study regions are all repeat stations that are part of the national monitoring program “Ecosystem Monitoring in Coastal Waters” (ØKOKYST) and are referred to as Torbjørnskjaer (station ID VT3; ∼20 km southwest of the Glomma river outflow), Skinnbrokleia (station ID VT71; ∼90 km north of the Nausta river outflow), and Straumsfjord (station ID VR54; ∼25 km north of the Målselv river outflow that discharges into the inner parts of the fjord), respectively.
Temperature, salinity, and oxygen were measured in situ at the coastal stations with conductivity–temperature–depth (CTD) profilers (SAIV SD204 equipped with a Rinko oxygen sensor or Sea-Bird SBE9), and there was good agreement between sensor measurements and water samples analyzed in the laboratory with a salinometer and by Winkler titration (data not shown, <0.1% deviation). Water samples were taken at 0, 5, 10, 20, and 30 m for DOC (filtrate that passed through GF/F filters, 0.7-μm nominal pore size, Whatman; rinsed with ∼1 L of seawater, samples preserved with 0.04 M H2SO4; analyzed by high-temperature catalytic oxidation using Elementar vario TOC cube) (Elementar analysensysteme GmbH, Langelsenbold, Germany), chl a (vacuum filtered onto GF/F filters; filters frozen for storage and analyzed via spectrophotometry using Perkin-Elmer Lambda 40P UV/VIS) (Perkin Elmer Noray, Oslo, Norway), and NH4 (samples preserved with 0.04 M H2SO4; kept cool and analyzed using Skalar San++ Autoanalyzer) (Skalar Analytical B. V., Breda, The Netherlands), in addition to other biogeochemical variables not presented here. All analyses were made using ISO/accredited techniques and oceanographic protocols (Strickland and Parsons, 1972), and further information can be found in the reports from the individual regions (Fagerli et al., 2019; Trannum et al., 2019; Velvin et al., 2019).
Underway Ship Observations
Sensors were equipped on an underway flow-through system (FerryBox) on ships of opportunity passenger vessels M/S Trollfjord (coastal Norway) and M/S Color Fantasy (Skagerrak, Kattegat, North Sea) that are part of the Norwegian Ships of Opportunity Program for marine and atmospheric research (NorSOOP)1. The underway ship observations in the Oslofjord/southern Norway region were made on M/S Color Fantasy along an approximately north–south transect ∼5–15 km west of the coastal station Torbjørnskjaer with a frequency of every other day. The underway ship observations in the Runde/western Norway and Malangen/northern Norway study regions were made on M/S Trollfjord approximately weekly, and both study regions were transected along an approximately southwest–northeast direction and crossed the respective coastal stations in each region.
Clean seawater inlets were custom installed at ∼5 m and directly pumped to a sensor package. The sensor package included SBE45 for temperature and salinity, in addition to an SBE38 directly at the inlet. Data were quality controlled based on a temperature differential between the SBE45 and SBE38 of less than 1°C and spike and range tests developed as part of the Joint European Research Infrastructure of Coastal Observatories (JERICO)2. The salinity and temperature sensors were periodically checked and calibrated using a traceable reference thermometer and discrete salinity samples measured using a laboratory salinometer.
The FerryBox system also included sensors for chl a fluorescence and cDOM fluorescence (TriOS GmbH MicroFlu). The chl a and cDOM sensors were calibrated by the manufacturer, and the chl a sensor was periodically checked using solid standards. The chl a sensor was also corrected for biofouling using a curvilinear regression technique and calibrated on a yearly basis with a typical algal species for the Norwegian coast and field-collected chl a samples. The cDOM sensor was calibrated by the manufacturer using quinine sulfate and checked regularly with solid-state standards, and arbitrary units are reported here.
Correlation Analyses
Correlation analyses were used to evaluate the association between mean monthly variables from the river, coastal stations (using data from 0 to 5 m), and FerryBox observations, using the function “cor” in the R statistical software (R Core Team, 2018). The non-parametric correlation method Kendall was chosen and using only sets of complete observations. Correlation matrices were visualized using the corrplot package in R (Wei and Simko, 2017), using hierarchical clustering and removing insignificant correlation coefficients with a p > 0.05.
Results
Study Region A: Outer Oslofjord/Southern Norway
Freshwater discharge and flux of DOC, SPM, and nutrients from the Glomma river exhibited a strong seasonal pattern with higher flow in the spring and early summer months (Figure 2A). Discharge in the Glomma river ranged from ∼0.9 × 10⁹ to 5.4 × 10⁹ m3 month–1, with peak flow occurring during the spring flood in May to June. The DOC (∼0.2 × 10⁷ to 2.7 × 10⁷ kg month–1), SPM (∼0.1 × 10⁷ to 6.9 × 10⁷ kg month–1), and nutrient (∼0.2 × 10⁶ to 1.7 × 10⁶ kg NO3 month–1; ∼0.2 × 10⁴ to 7.2 × 10⁴ kg PO4 month–1; ∼0.2 × 10⁷ to 2.1 × 10⁷ kg SiO2 month–1) transports generally followed the discharge from Glomma, with the largest flood event in May 2018, yielding transports of 2.8 × 10⁷ and 7 × 10⁷ kg month–1 for DOC and SPM, respectively (Figures 2B,C).
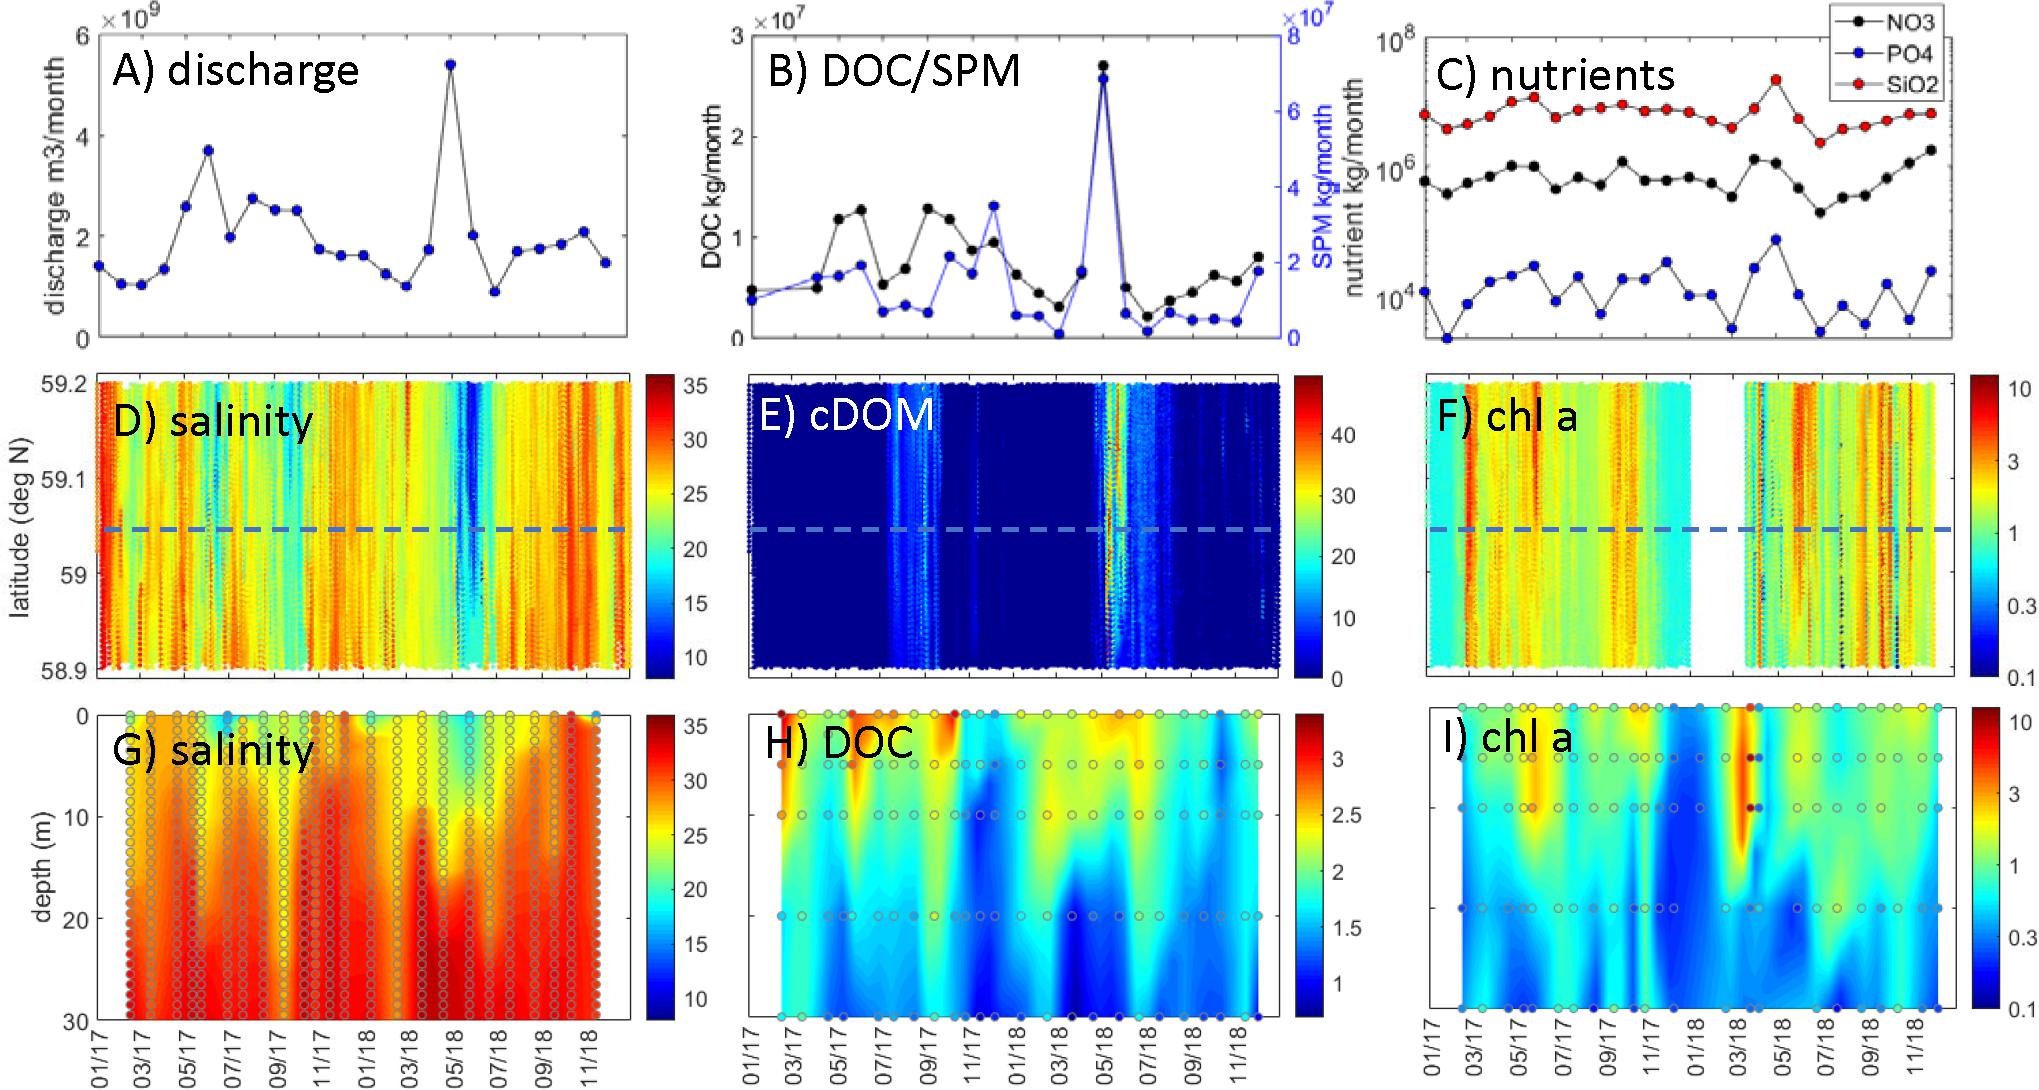
Figure 2. Outer Oslofjord/southern Norway observations. Glomma river: (A) discharge (m3 month–1), (B) DOC transport (kg month–1) and SPM transport (kg month–1), and (C) nutrient transport (kg month–1; black: NO3-N, blue: PO4-P, red: SiO2-Si). FerryBox observations within ∼5–15 km east of coastal station: (D) salinity, (E) cDOM fluorescence (arbitrary), and (F) chl a (μg L–1; log scale). Water column station data [comparable latitude indicated by dashed blue line in panels (D–F)]: (G) salinity, (H) DOC (mg L–1), and (I) chl a (μg L–1; log scale). Data in panels (D–I) were interpolated with actual data points superimposed.
The underway ship observations in the surface waters of the outer Oslofjord/southern Norway region were relatively low in salinity (∼10–15) during May to June of both years (Figure 2D), which corresponds with the periods of minimum salinity from the coastal station Torbjørnskjaer (Figure 2G). At the coastal station, there was a permanently stratified upper mixed layer with low salinities (15–20) to a depth of ∼10–20 m in spring/summer, with oceanic salinities below 30 m (Figure 3B). There was a large difference between summer and winter temperatures (∼4–20°C), with seasonal cooling in winter and warming in summer occurring in the top 100 m only (Figure 3A). The periods of minimum salinity in surface waters from coastal observations coincides with the periods of peak flow in Glomma (Figures 2A,D,G), which is also shown by the negative correlation between river flow and coastal salinities (both underway and coastal station) (Figure 4A).
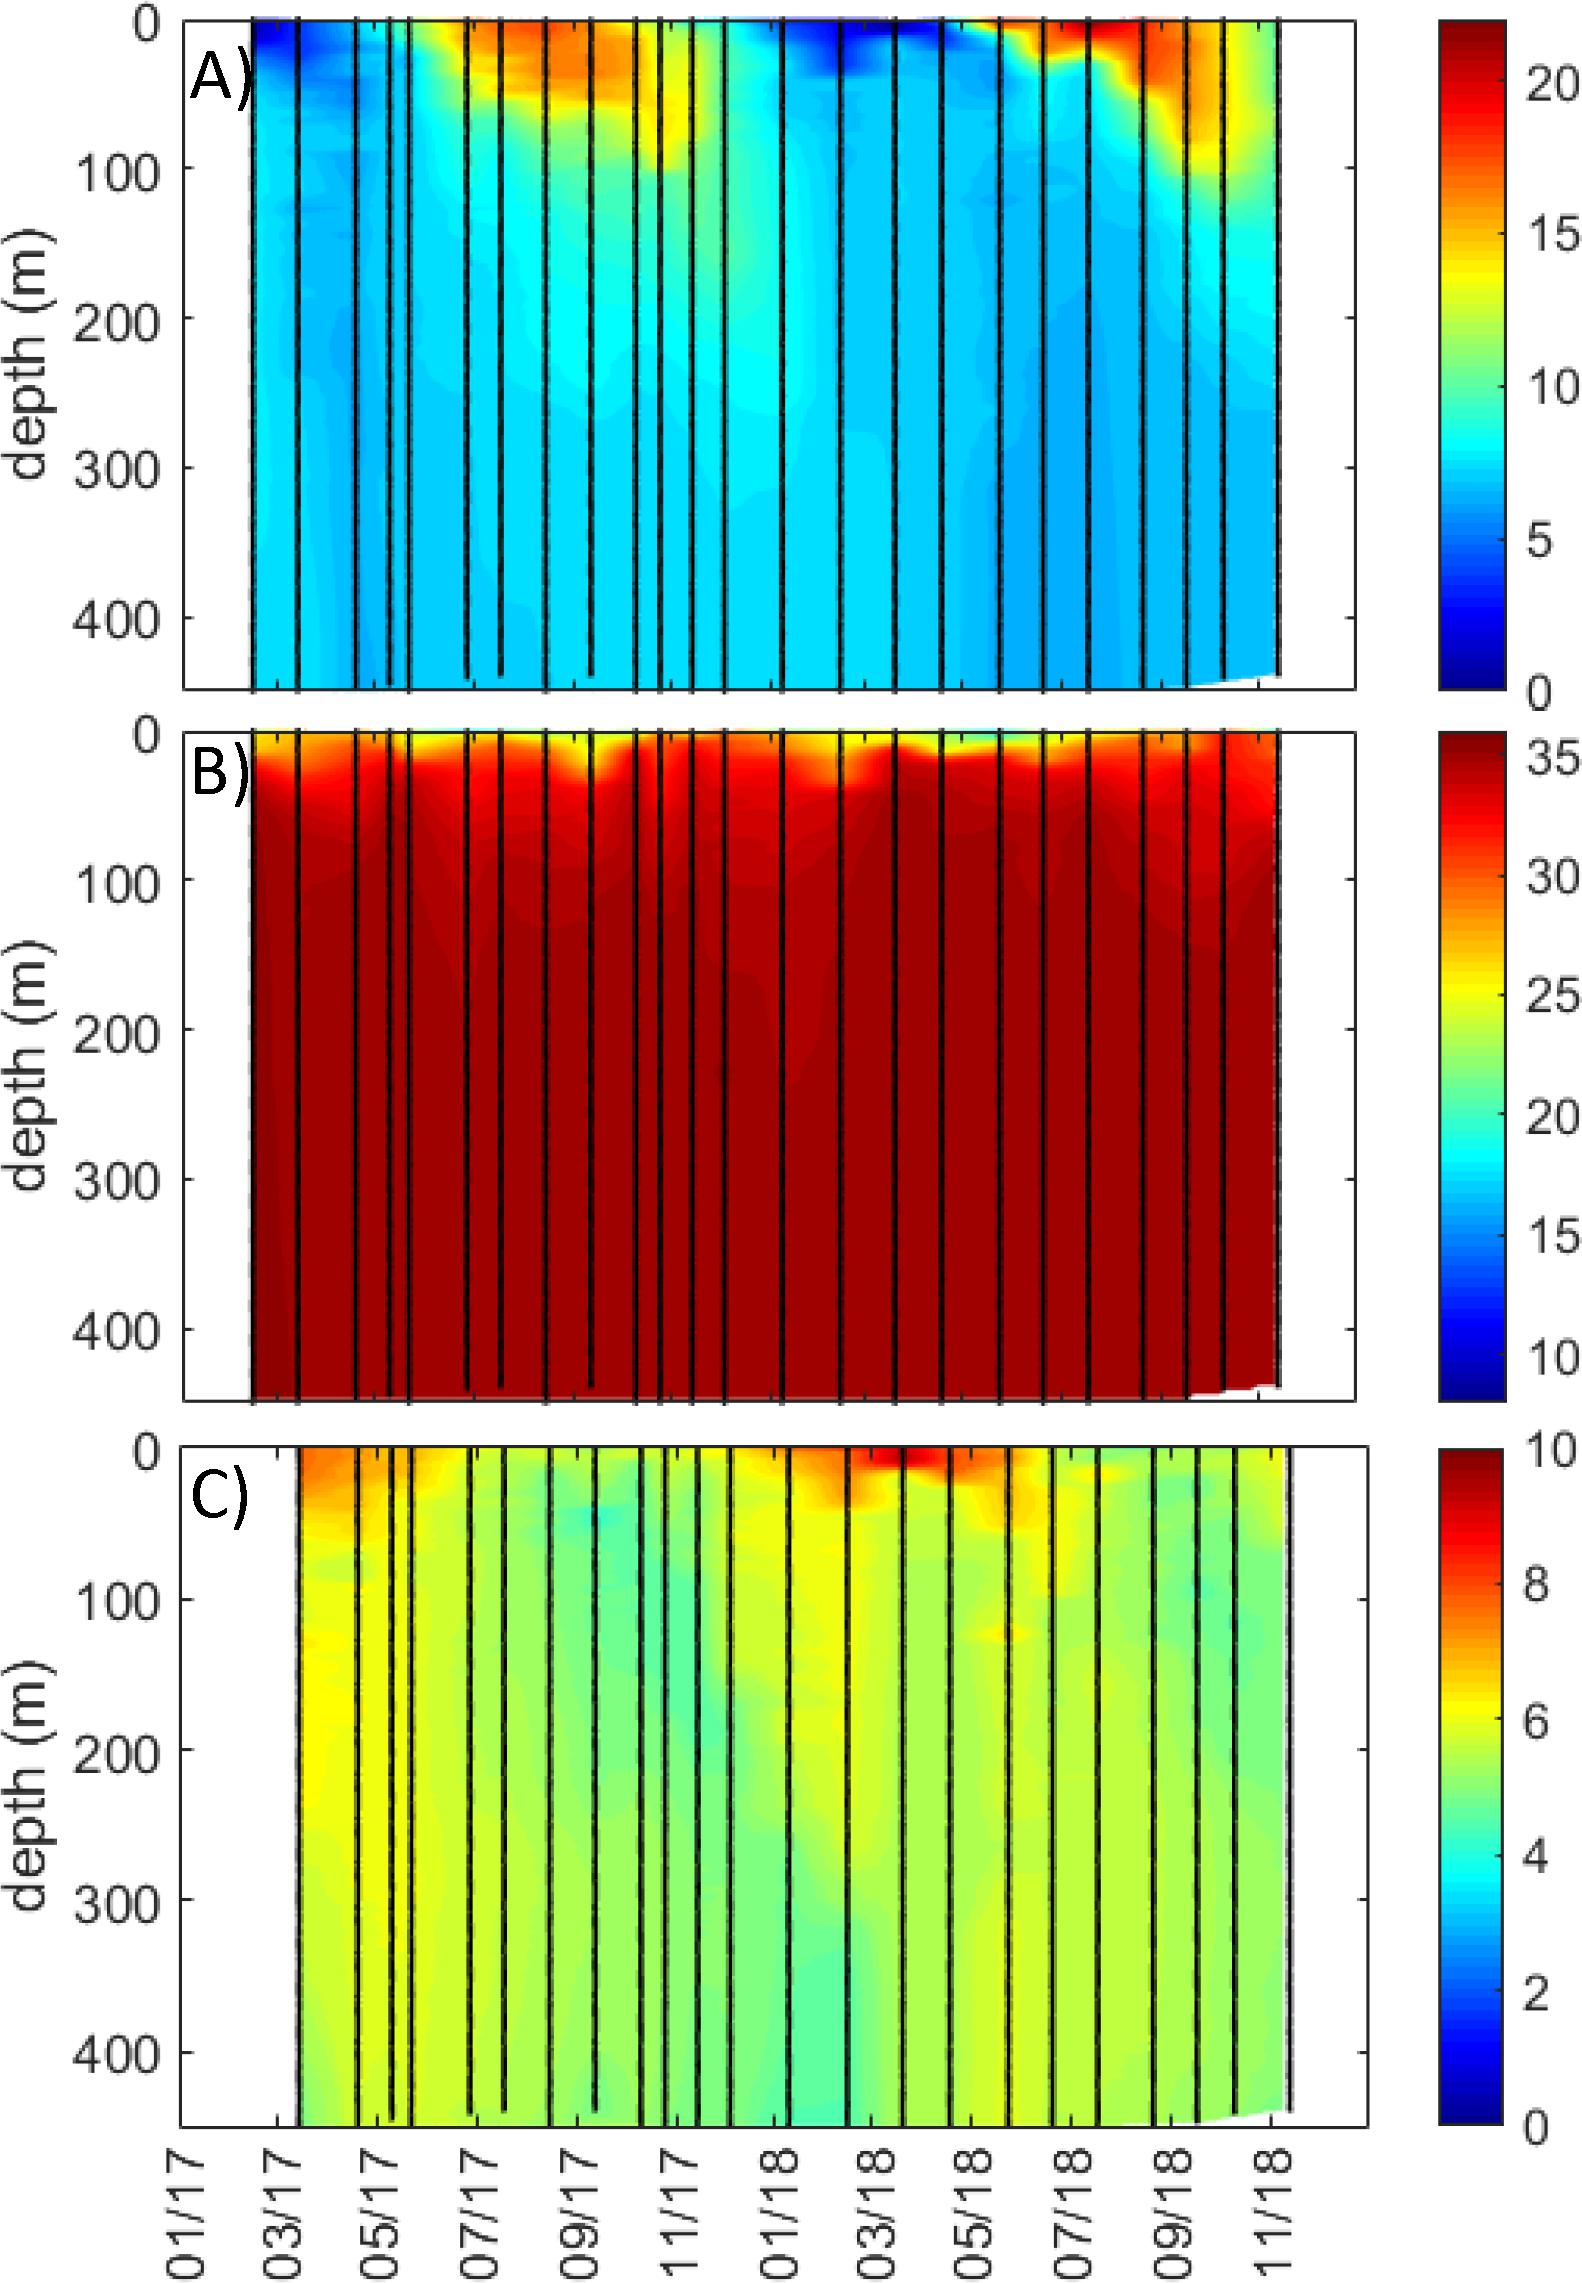
Figure 3. Full water column profiles (from 0 m to near bottom) for coastal station Torbjørnskjaer in Outer Oslofjord/southern Norway study region for (A) temperature (°C), (B) salinity, and (C) oxygen (mL L–1). Data are interpolated, with black symbols showing location of sampling.
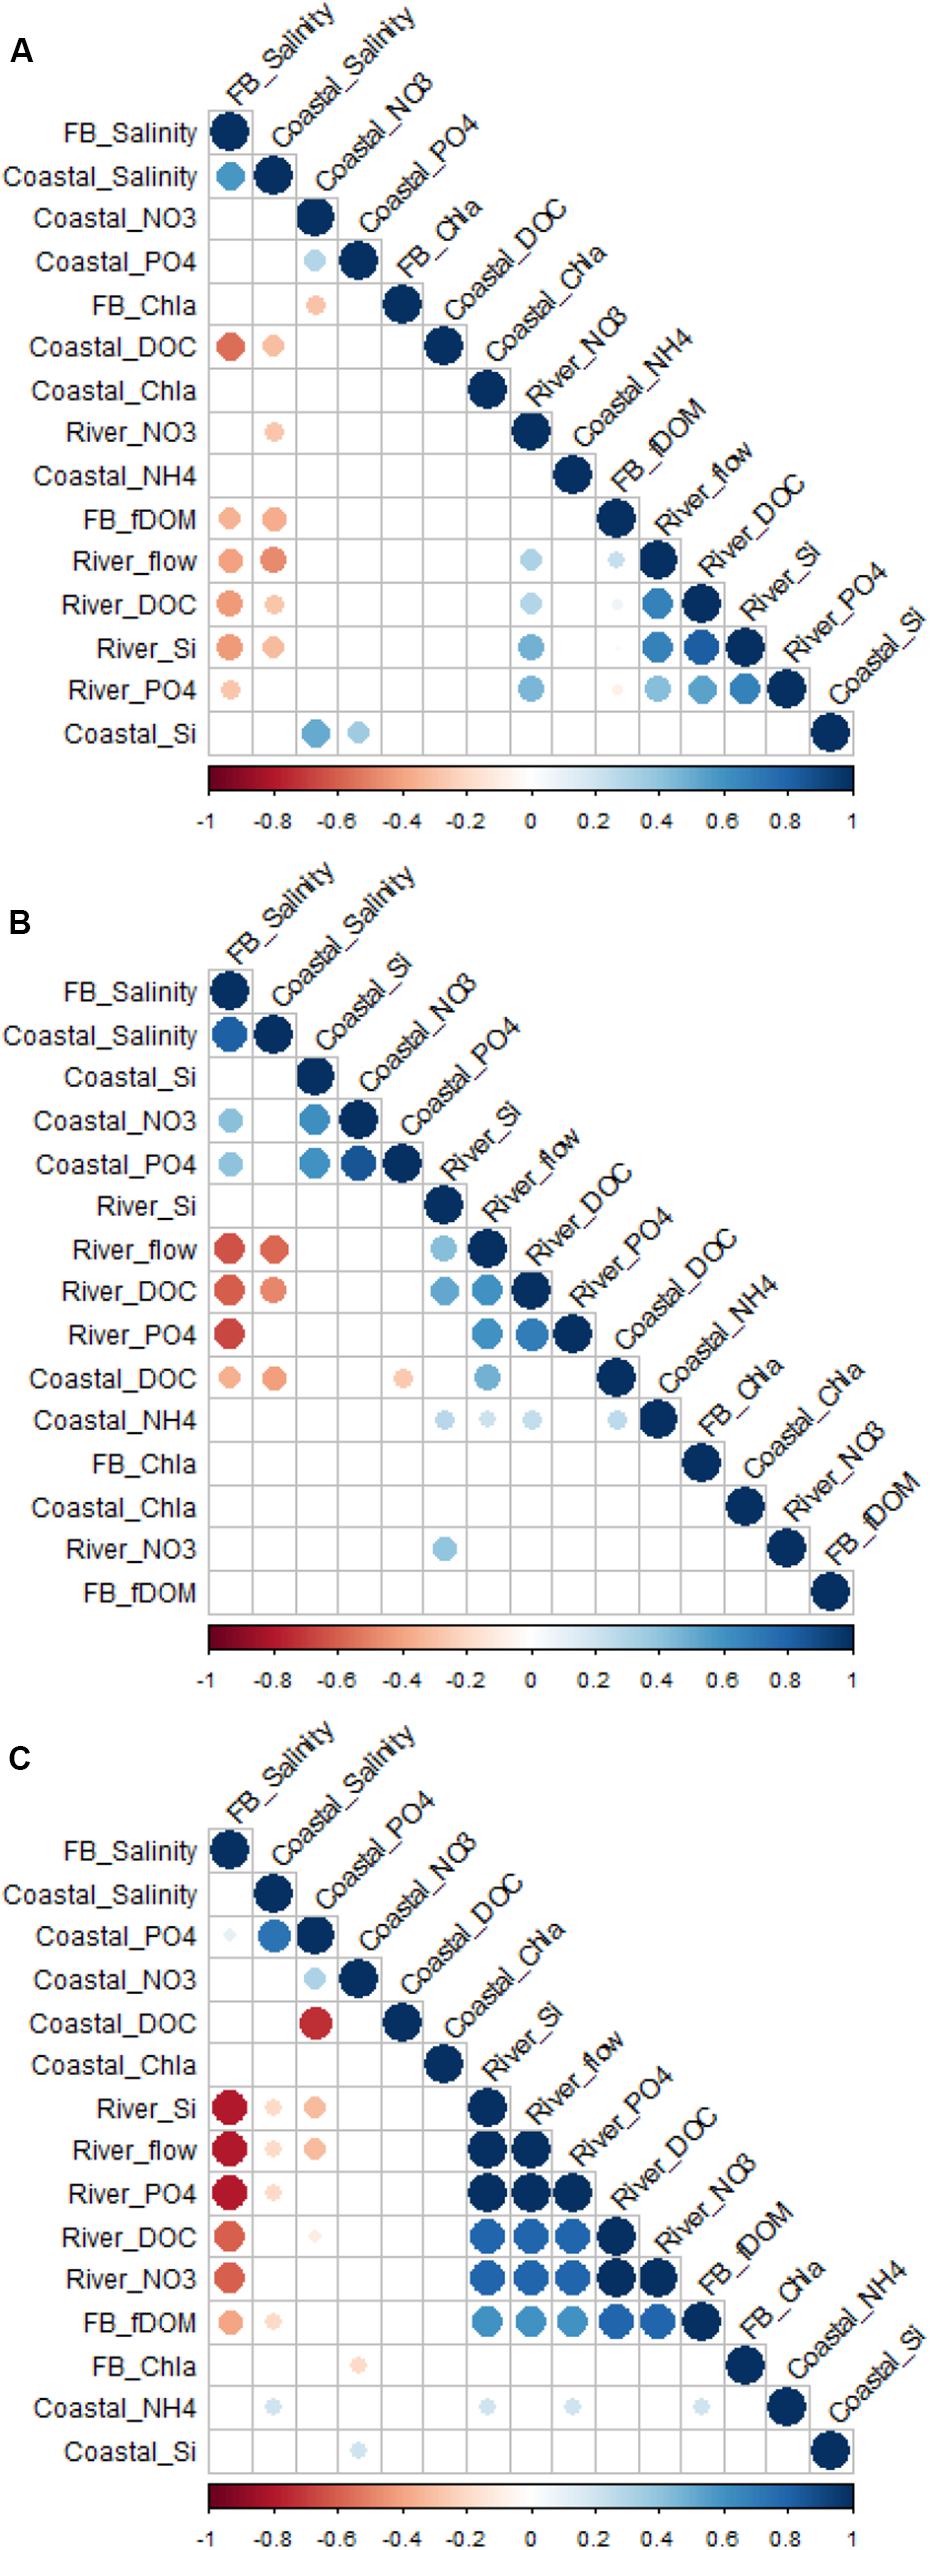
Figure 4. Correlogram of selected variables for river, coastal stations, and underway (shortened to “FB”) observations for (A) Outer Oslofjord/southern Norway, (B) Runde/western Norway, and (C) Malangen/northern Norway. Positive correlations are displayed in blue and negative correlations in red. Color intensity and the size of the circle are proportional to the correlation coefficients. Insignificant correlations coefficients (p > 0.05) are left blank. Note that variables are reordered according to correlation coefficient for each study region. See section “Correlation Analyses” for more details on method.
There was high cDOM fluorescence in the outer Oslofjord (∼30–40 arbitrary units; Figure 2E), with a large spatial and temporal extent during the flood event in May 2018, while the DOC concentrations at the coastal station were highest during spring/summer 2017 (2.5–3 mg L–1; Figure 2H). The DOC concentrations were generally highest in the lower salinity surface layer, with minimum concentrations during winter of both years. The relationship between surface DOC and cDOM and salinity is also shown by the strong negative correlation coefficients in Figure 4A; however, there was not a strong direct correlation between river DOC and coastal DOC concentrations.
The chl a fluorescence from underway observations showed several bloom episodes (between 3 and 10 μg L–1) over a large area in the Oslofjord/southern Norway region during spring/summer of both years (Figure 2F). The coastal station had the highest values in surface layers (0–10 m) during the spring bloom in April 2018 (>10 μg L–1; Figure 2I). There were also several smaller blooms (2–3 μg L–1) during the period from March to November of both 2017 and 2018, with a fall bloom generally in the period September to November (Figure 2I). There was generally not a strong relationship (Figure 4A) between chl a fluorescence in the outer Oslofjord and riverine nutrient transports (NO3, PO4, and SiO2); however, the flood event in 2018 was accompanied with maxima in nutrient transport during the study period and was followed by a bloom event in July 2018 (Figure 2F).
Study Region B: Runde/Western Norway
The Nausta river discharge (∼0.3 × 10⁸ to 1.6 × 10⁸ m3 month–1) and transports of DOC (∼0.4 × 10⁵ to 6.5 × 10⁵ kg month–1), SPM (∼0.1 × 10⁵ to 2.9 × 10⁵ kg month–1), and nutrients (∼0.02 × 10⁴ to 1.6 × 10⁴ kg NO3 month–1; ∼0.3 × 10² to 8.4 × 10² kg PO4 month–1; ∼0.05 × 10⁵ to 1.8 × 10⁵ kg SiO2 month–1) were highest during fall and winter months (Figures 5A–C). The peak flow from Nausta occurred during August to September 2018. The maxima in DOC and SPM transport occurred during the periods of high discharge, with a maximum in SPM during fall 2017 (∼3 × 10⁵ kg month–1) and DOC in 2018 (∼6 × 10⁵ kg month–1). The nutrient transport did not show the same maxima during periods of peak flow, with less variation between months; however, there was a minimum for nutrient transports during summer 2018.
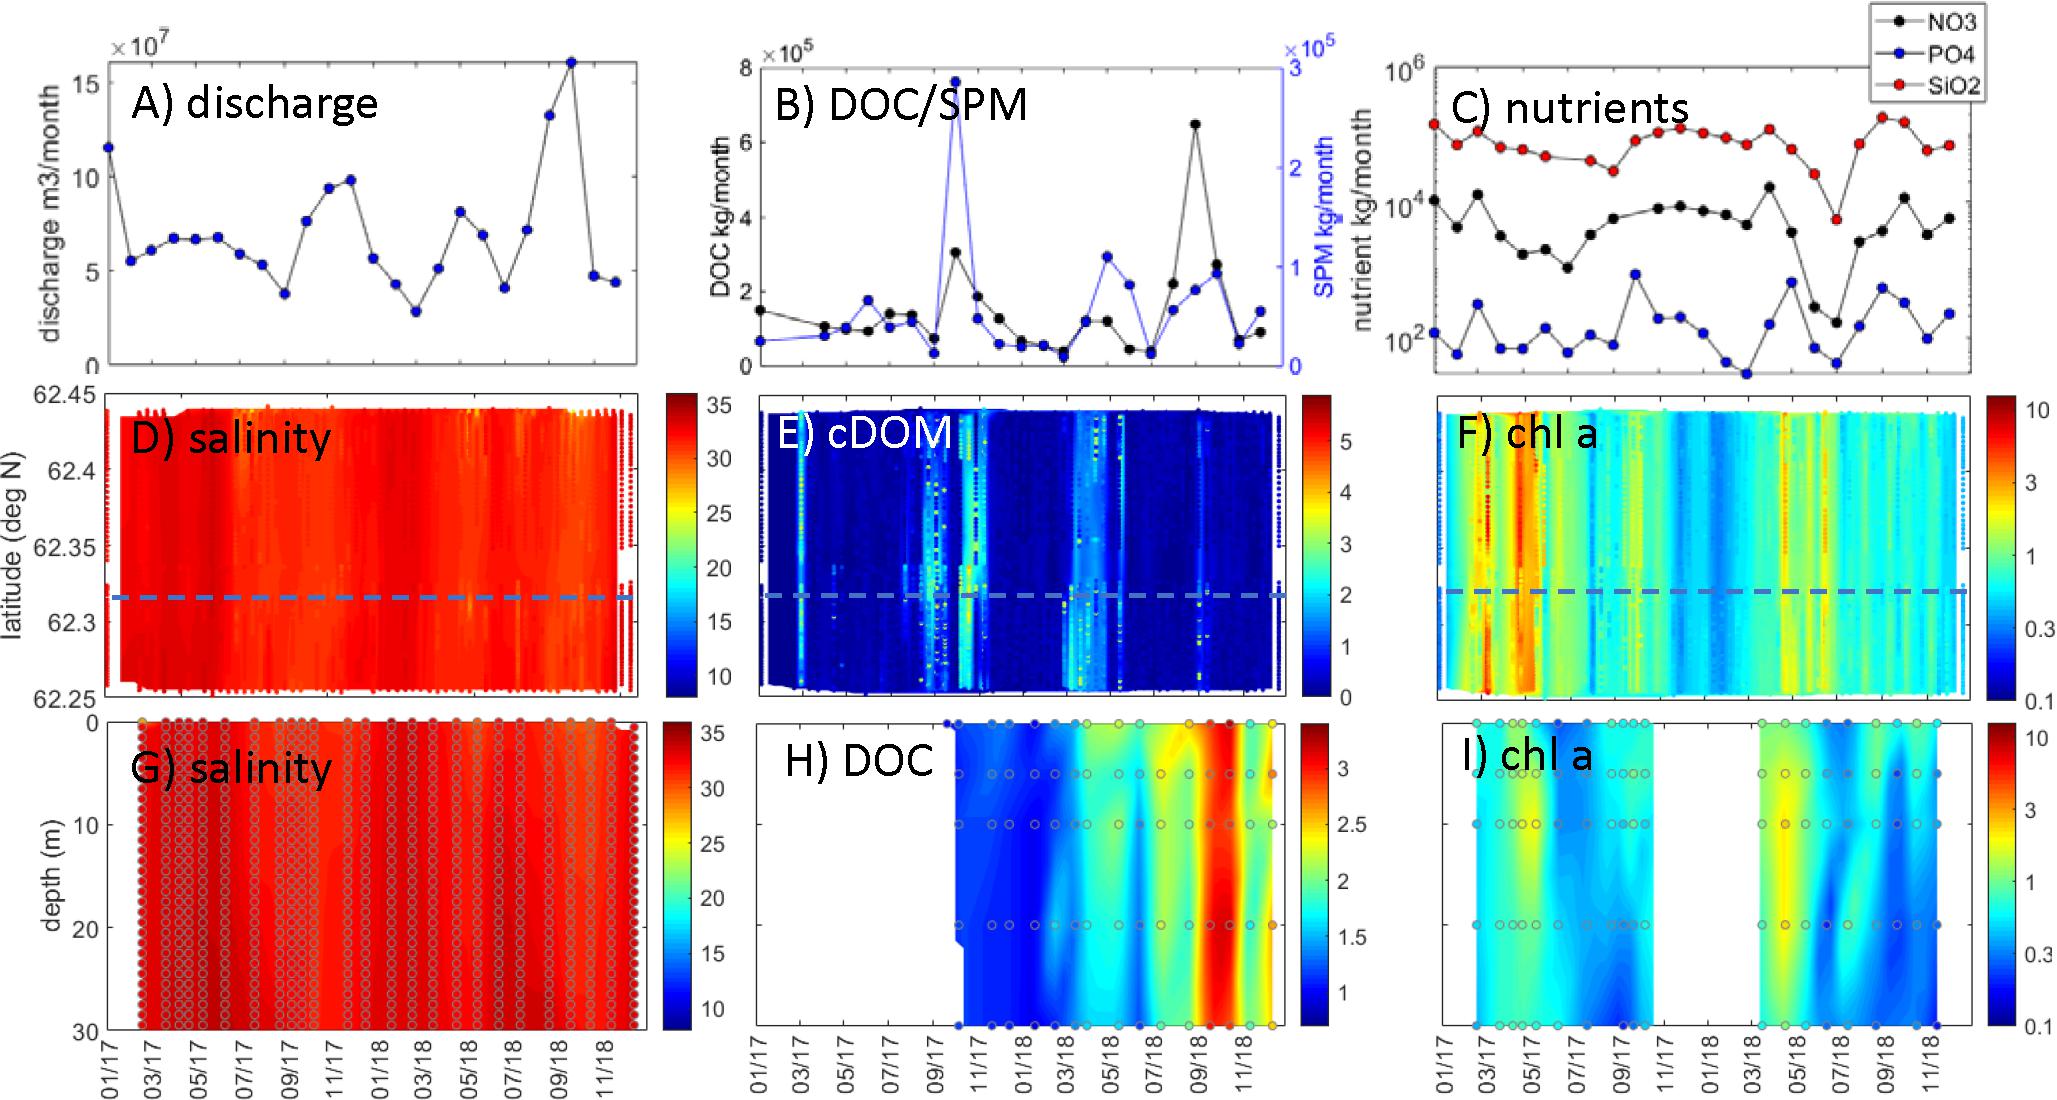
Figure 5. Runde/western Norway observations. Nausta river: (A) discharge (m3 month–1), (B) DOC transport (kg month–1) and SPM transport (kg month–1), and (C) nutrient transport (kg month–1; black: NO3-N, blue: PO4-P, red: SiO2-Si). FerryBox observations within < 1 km of coastal station: (D) salinity, (E) cDOM fluorescence (arbitrary), and (F) chl a (μg L–1; log scale). Water column station data [comparable latitude indicated by dashed blue line in panels (D–F)]: (G) salinity, (H) DOC (mg L–1), and (I) chl a (μg L–1; log scale). Data in panels (D–I) were interpolated with actual data points superimposed.
The underway ship observations did not show large seasonal or regional variability in surface salinities in the Runde/western Norway region (Figure 5D), and the coastal station Skinnbrokleia had fairly uniform salinities from 0 to 30 m (between 32 and 35 m; Figure 5G). The coastal station was seasonally stratified with a pronounced seasonal thermocline during summer months that deepened to around 40 m during late summer (Figure 6A). During winter, there were fairly uniform temperatures and salinities (∼4°C and 34–35 m) down to the bottom at approximately 70 m (Figures 6A,B). Even though there were less pronounced variations in salinity in the Runde region compared to the other coastal regions, there was a negative correlation between river flow and coastal surface salinities (Figure 4B).
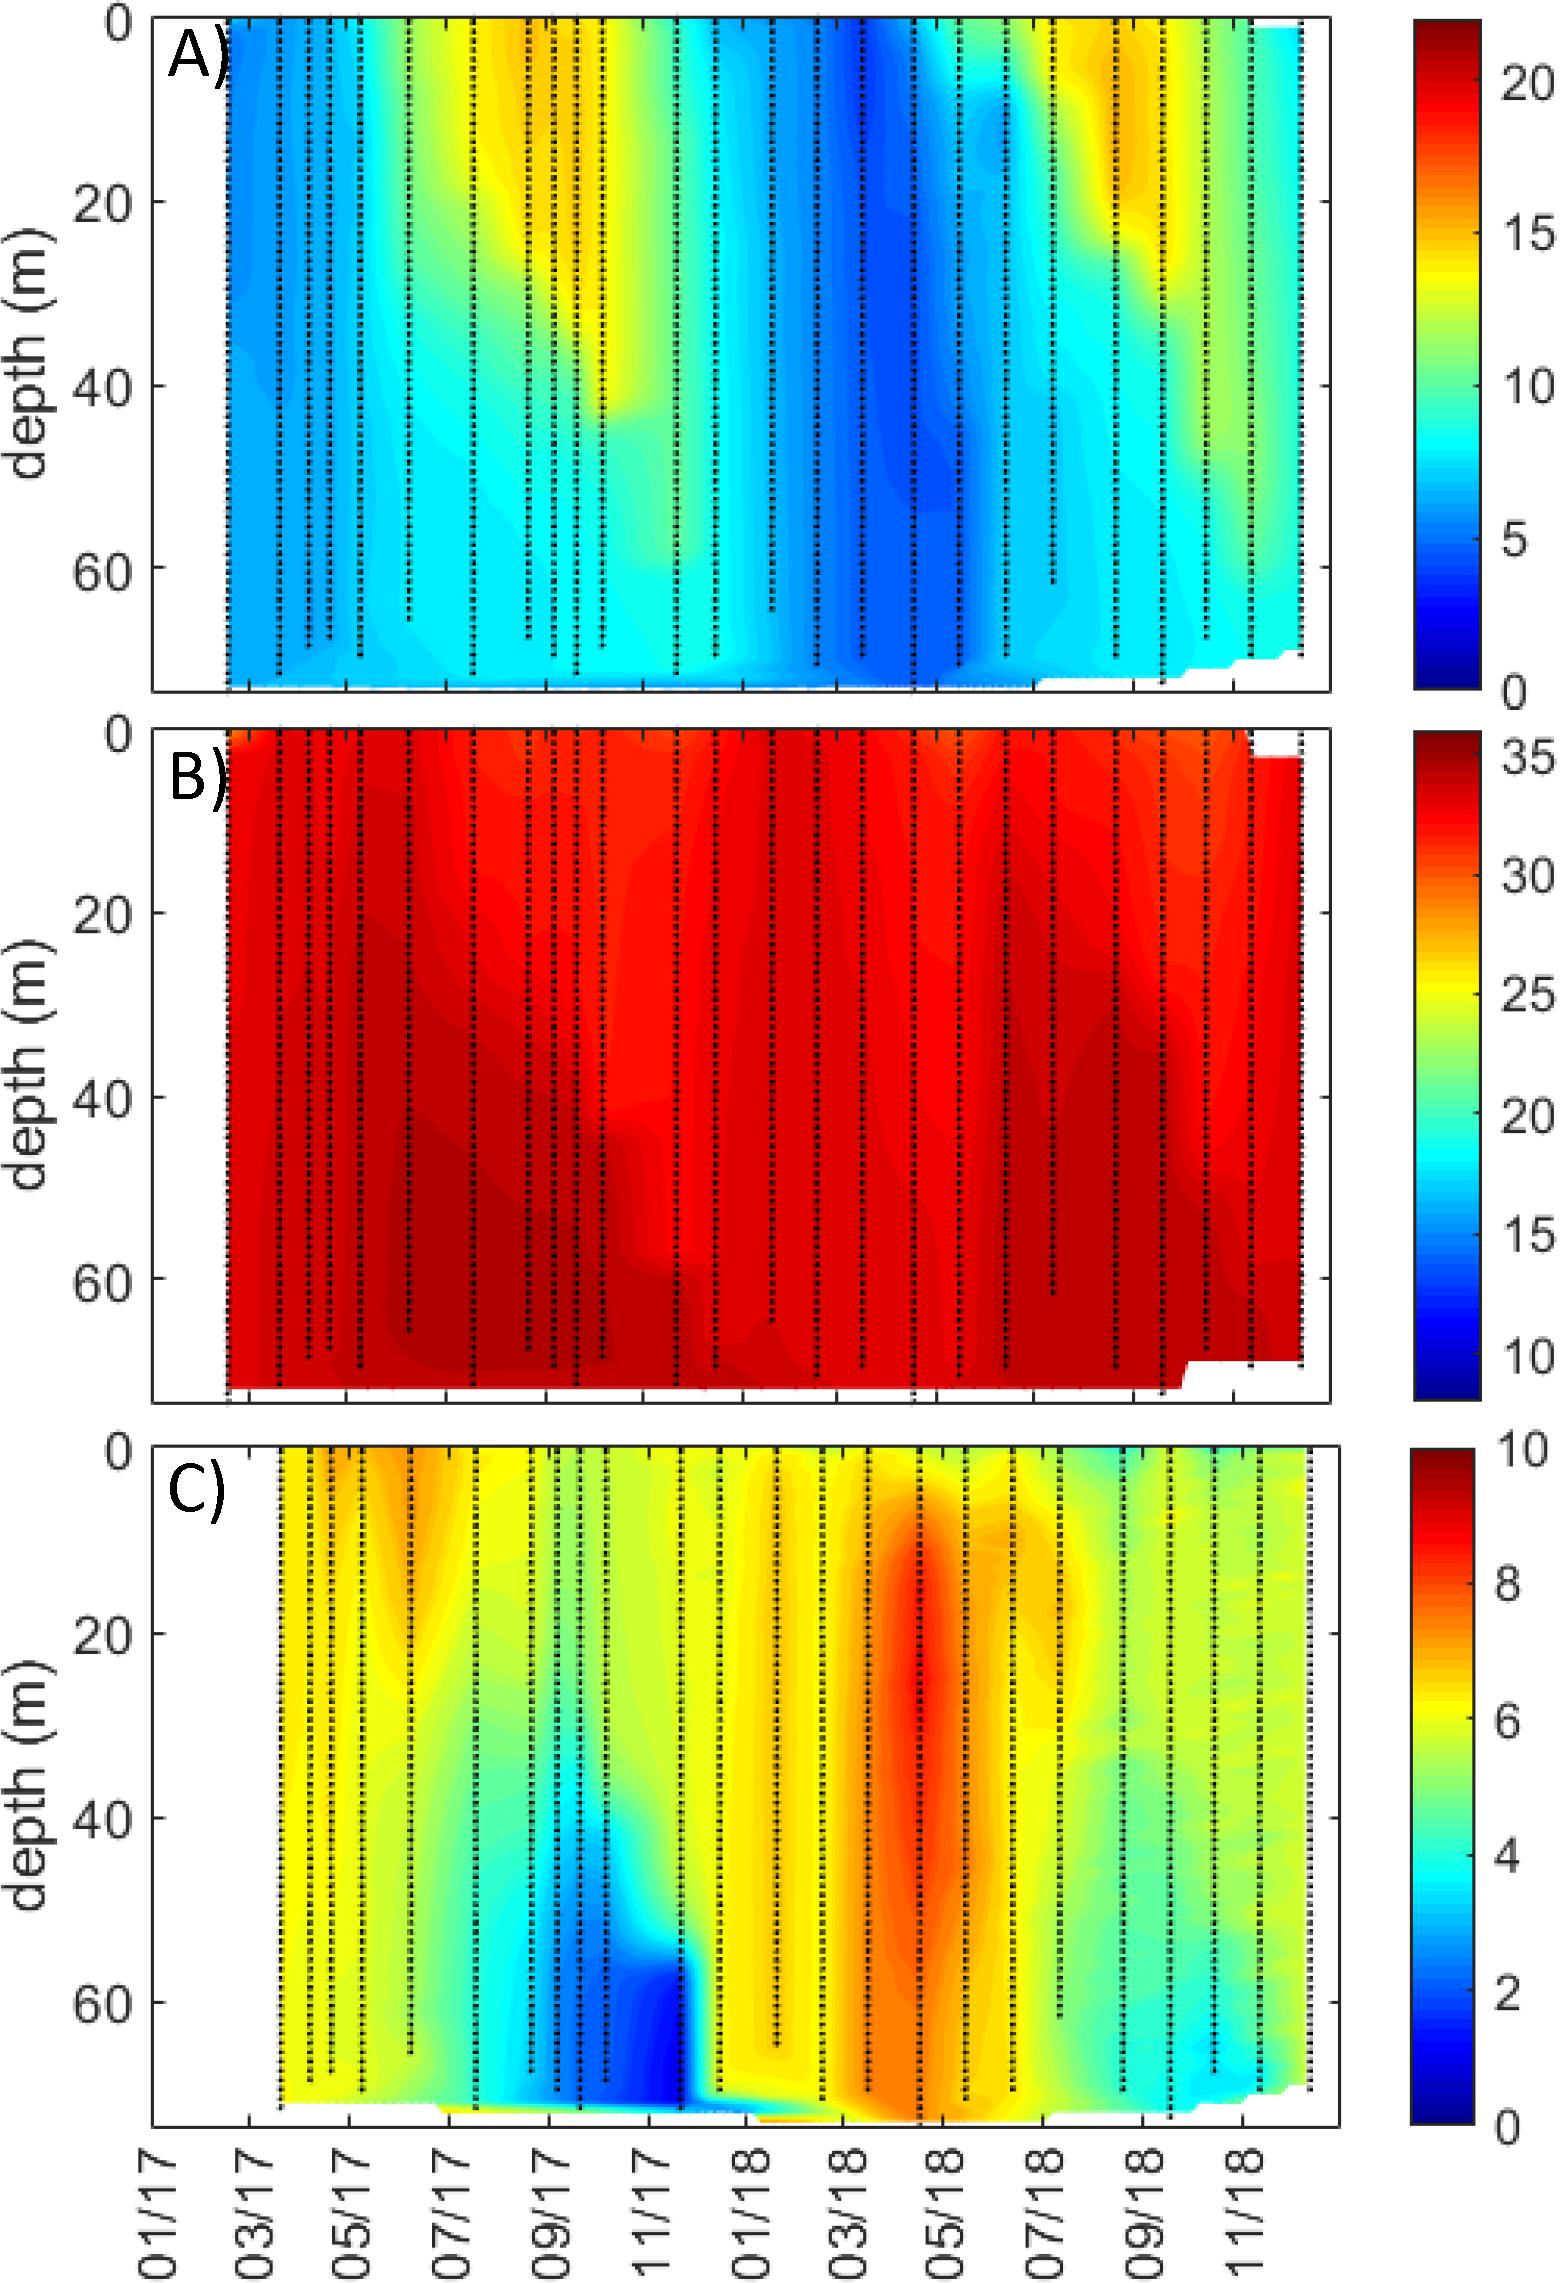
Figure 6. Full water column profiles (from 0 m to near bottom) for coastal station Skinnbrokleia in study region Runde/western Norway for (A) temperature (°C), (B) salinity, and (C) oxygen (mL L–1). Data are interpolated, with black symbols showing location of sampling.
There was slight increase in cDOM fluorescence (∼3–5 arbitrary units) from underway observations during periods of high discharge and DOC transport from Nausta river (Figure 5E). While DOC concentrations from the coastal station were missing for the first half of 2017, there was, however, a general increase in DOC that began in April 2018 with a maximum of ∼3 mg L–1 in September to November 2018 (Figure 5H), which corresponded to the period of peak flow and DOC transport from the Nausta river (Figures 5A,B). There was a negative correlation between surface DOC concentrations and coastal salinities; however, no correlations (neither negative nor positive) were found for underway cDOM fluorescence (Figure 4B).
There were spring blooms in May during both years, with chl a fluorescence between 3 and 10 μg L–1 from underway observations in the Runde region (Figure 5F). The coastal station showed chl a concentrations up to ∼2 μg L–1 uniformly distributed over the 0- to 30-m layer, with smaller secondary blooms during the period from August to September of both years (Figure 5I). There was generally not a strong relationship between nutrient transport from Nausta river and chl a fluorescence observed by the coastal observations (Figure 4B).
Study Region C: Malangen/Northern Norway
Freshwater discharge and transports of TOC, SPM, and nutrients from the Målselv river exhibited a strong seasonal pattern with higher flow in the late spring and summer months (Figure 7A). Discharge from Målselv river was moderate in terms of flow rate (0.4 × 10⁸ to 9.5 × 10⁸ m3 month–1) but showed the large seasonality with sixfold to ninefold increase in flow during June and July of both 2017 and 2018 (Figure 7A). The transport of DOC (0.03 × 10⁶ to 1.9 × 10⁶ kg month–1), SPM (1 × 10⁴ to 2.1 × 10⁷ kg month–1), and nutrients (∼0.3 × 10⁴ to 2.9 × 10⁴ kg NO3 month–1; ∼41 × 104 to 2.1 × 10⁴ kg PO4 month–1; ∼0.1 × 10⁶ to 3.0 × 10⁶ kg SiO2 month–1) closely followed the discharge with the majority of transport occurring during flood events (Figures 7B,C).
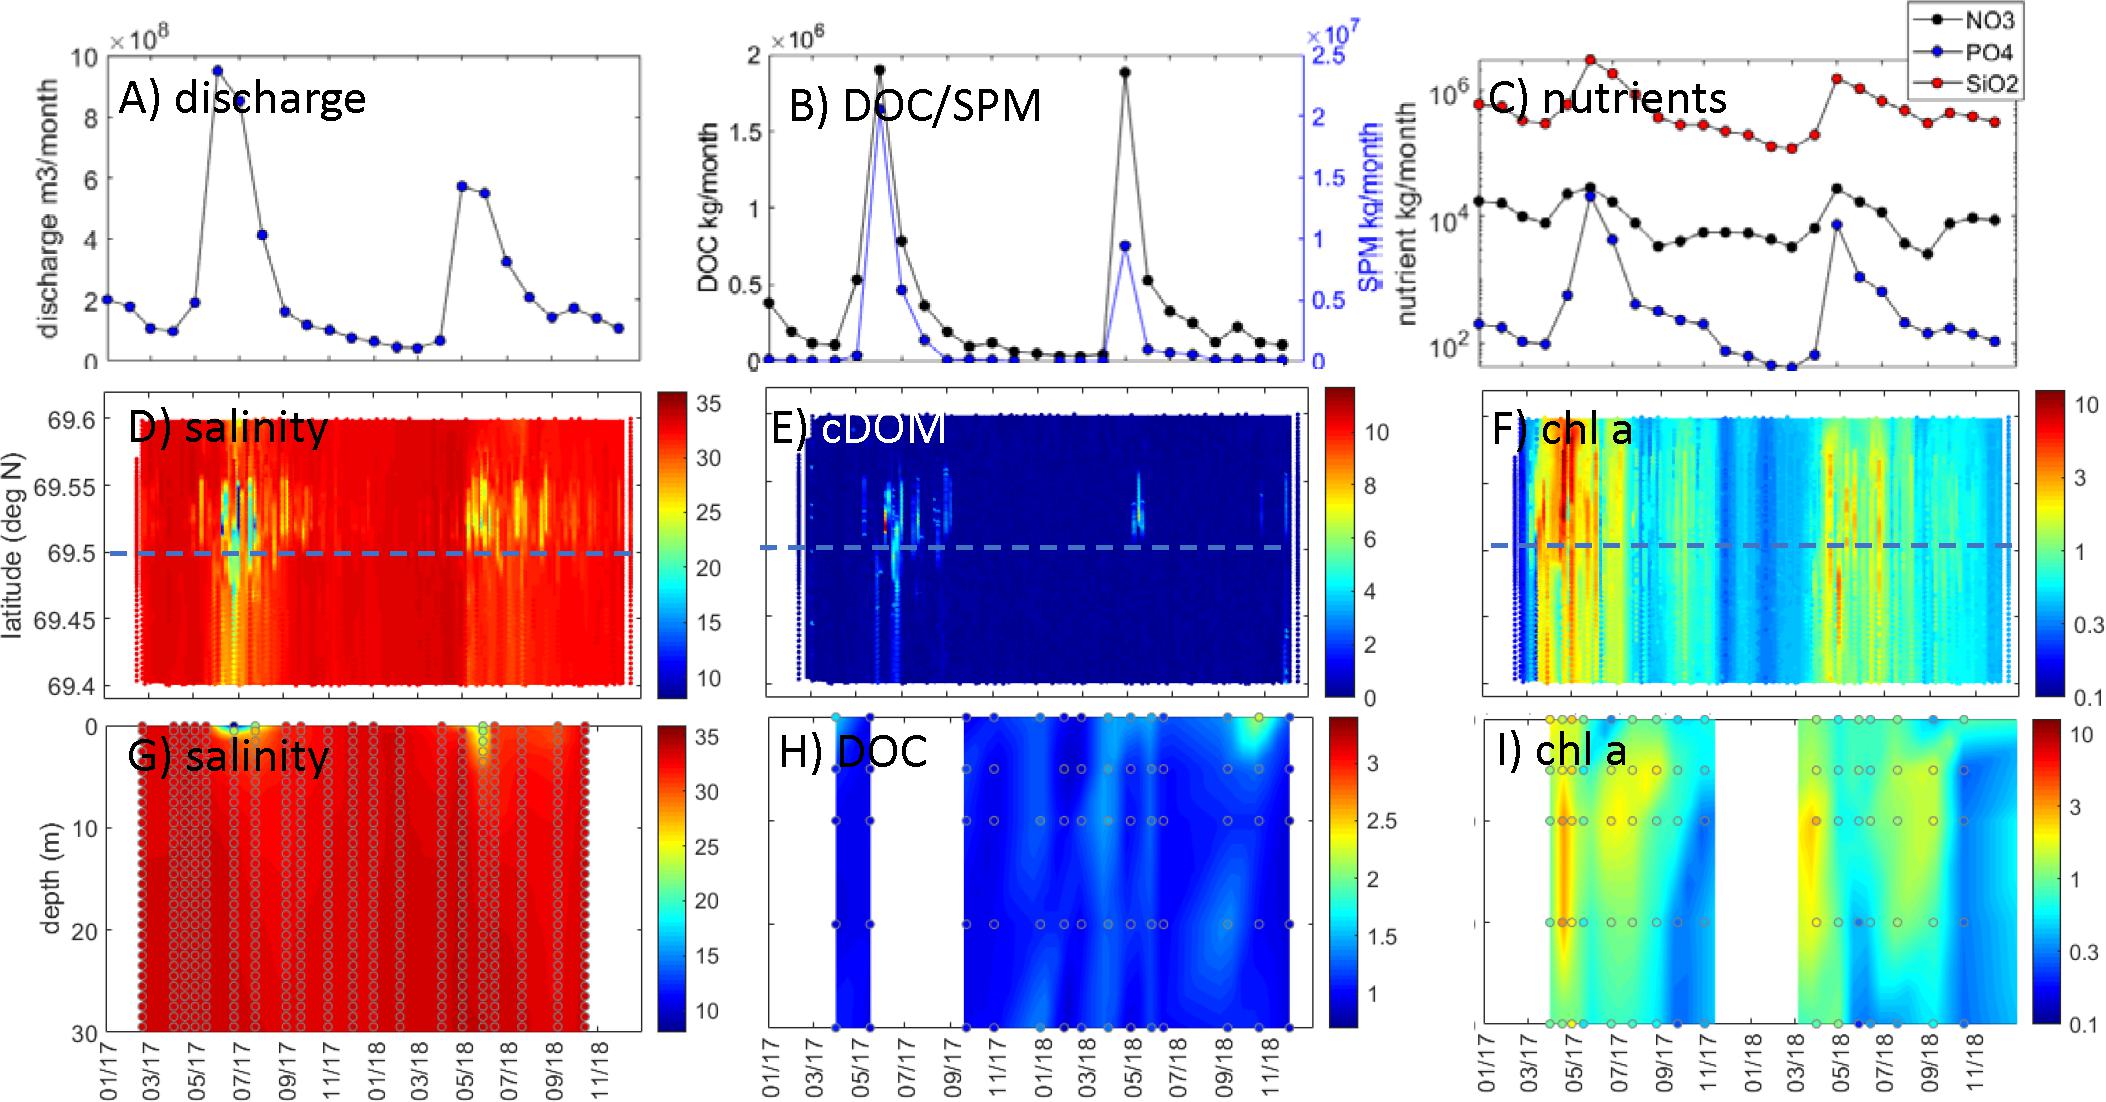
Figure 7. Malangen/northern Norway observations. Målselv river: (A) discharge (m3 month–1), (B) DOC transport (kg month–1) and SPM transport (kg month–1), and (C) nutrient transport (kg month–1; black: NO3-N, blue: PO4-P, red: SiO2-Si). FerryBox observations within <1 km of coastal station: (D) salinity, (E) cDOM fluorescence (arbitrary), and (F) chl a (μg L–1; log scale). Water column station data [comparable latitude indicated by dashed blue line in panels (D–F)]: (G) salinity, (H) DOC (mg L–1), and (I) chl a (μg L–1; log scale). Data in panels (D–I) were interpolated with actual data points superimposed.
Salinity observed by the underway ship observations in the Malangen/northern Norway region decreased at periods of high riverine discharge in Målselv river, especially in the northern parts of the transect (Figure 7D). At the coastal station Straumsfjorden, a shallow freshwater lens (<5 m) was observed in June/July of both years, and the influence of freshwater was limited to the top 10 m (Figure 7G). Except for these episodic low-salinity events in early summer, the whole water column appeared to be well-mixed with relatively high salinities (34, 35) and warming extending to depth during late fall (Figures 7G, 8A,B). The relationship between river flow and surface salinities is shown by the negative correlation in Figure 4C, which was higher for underway observations than for the coastal station.
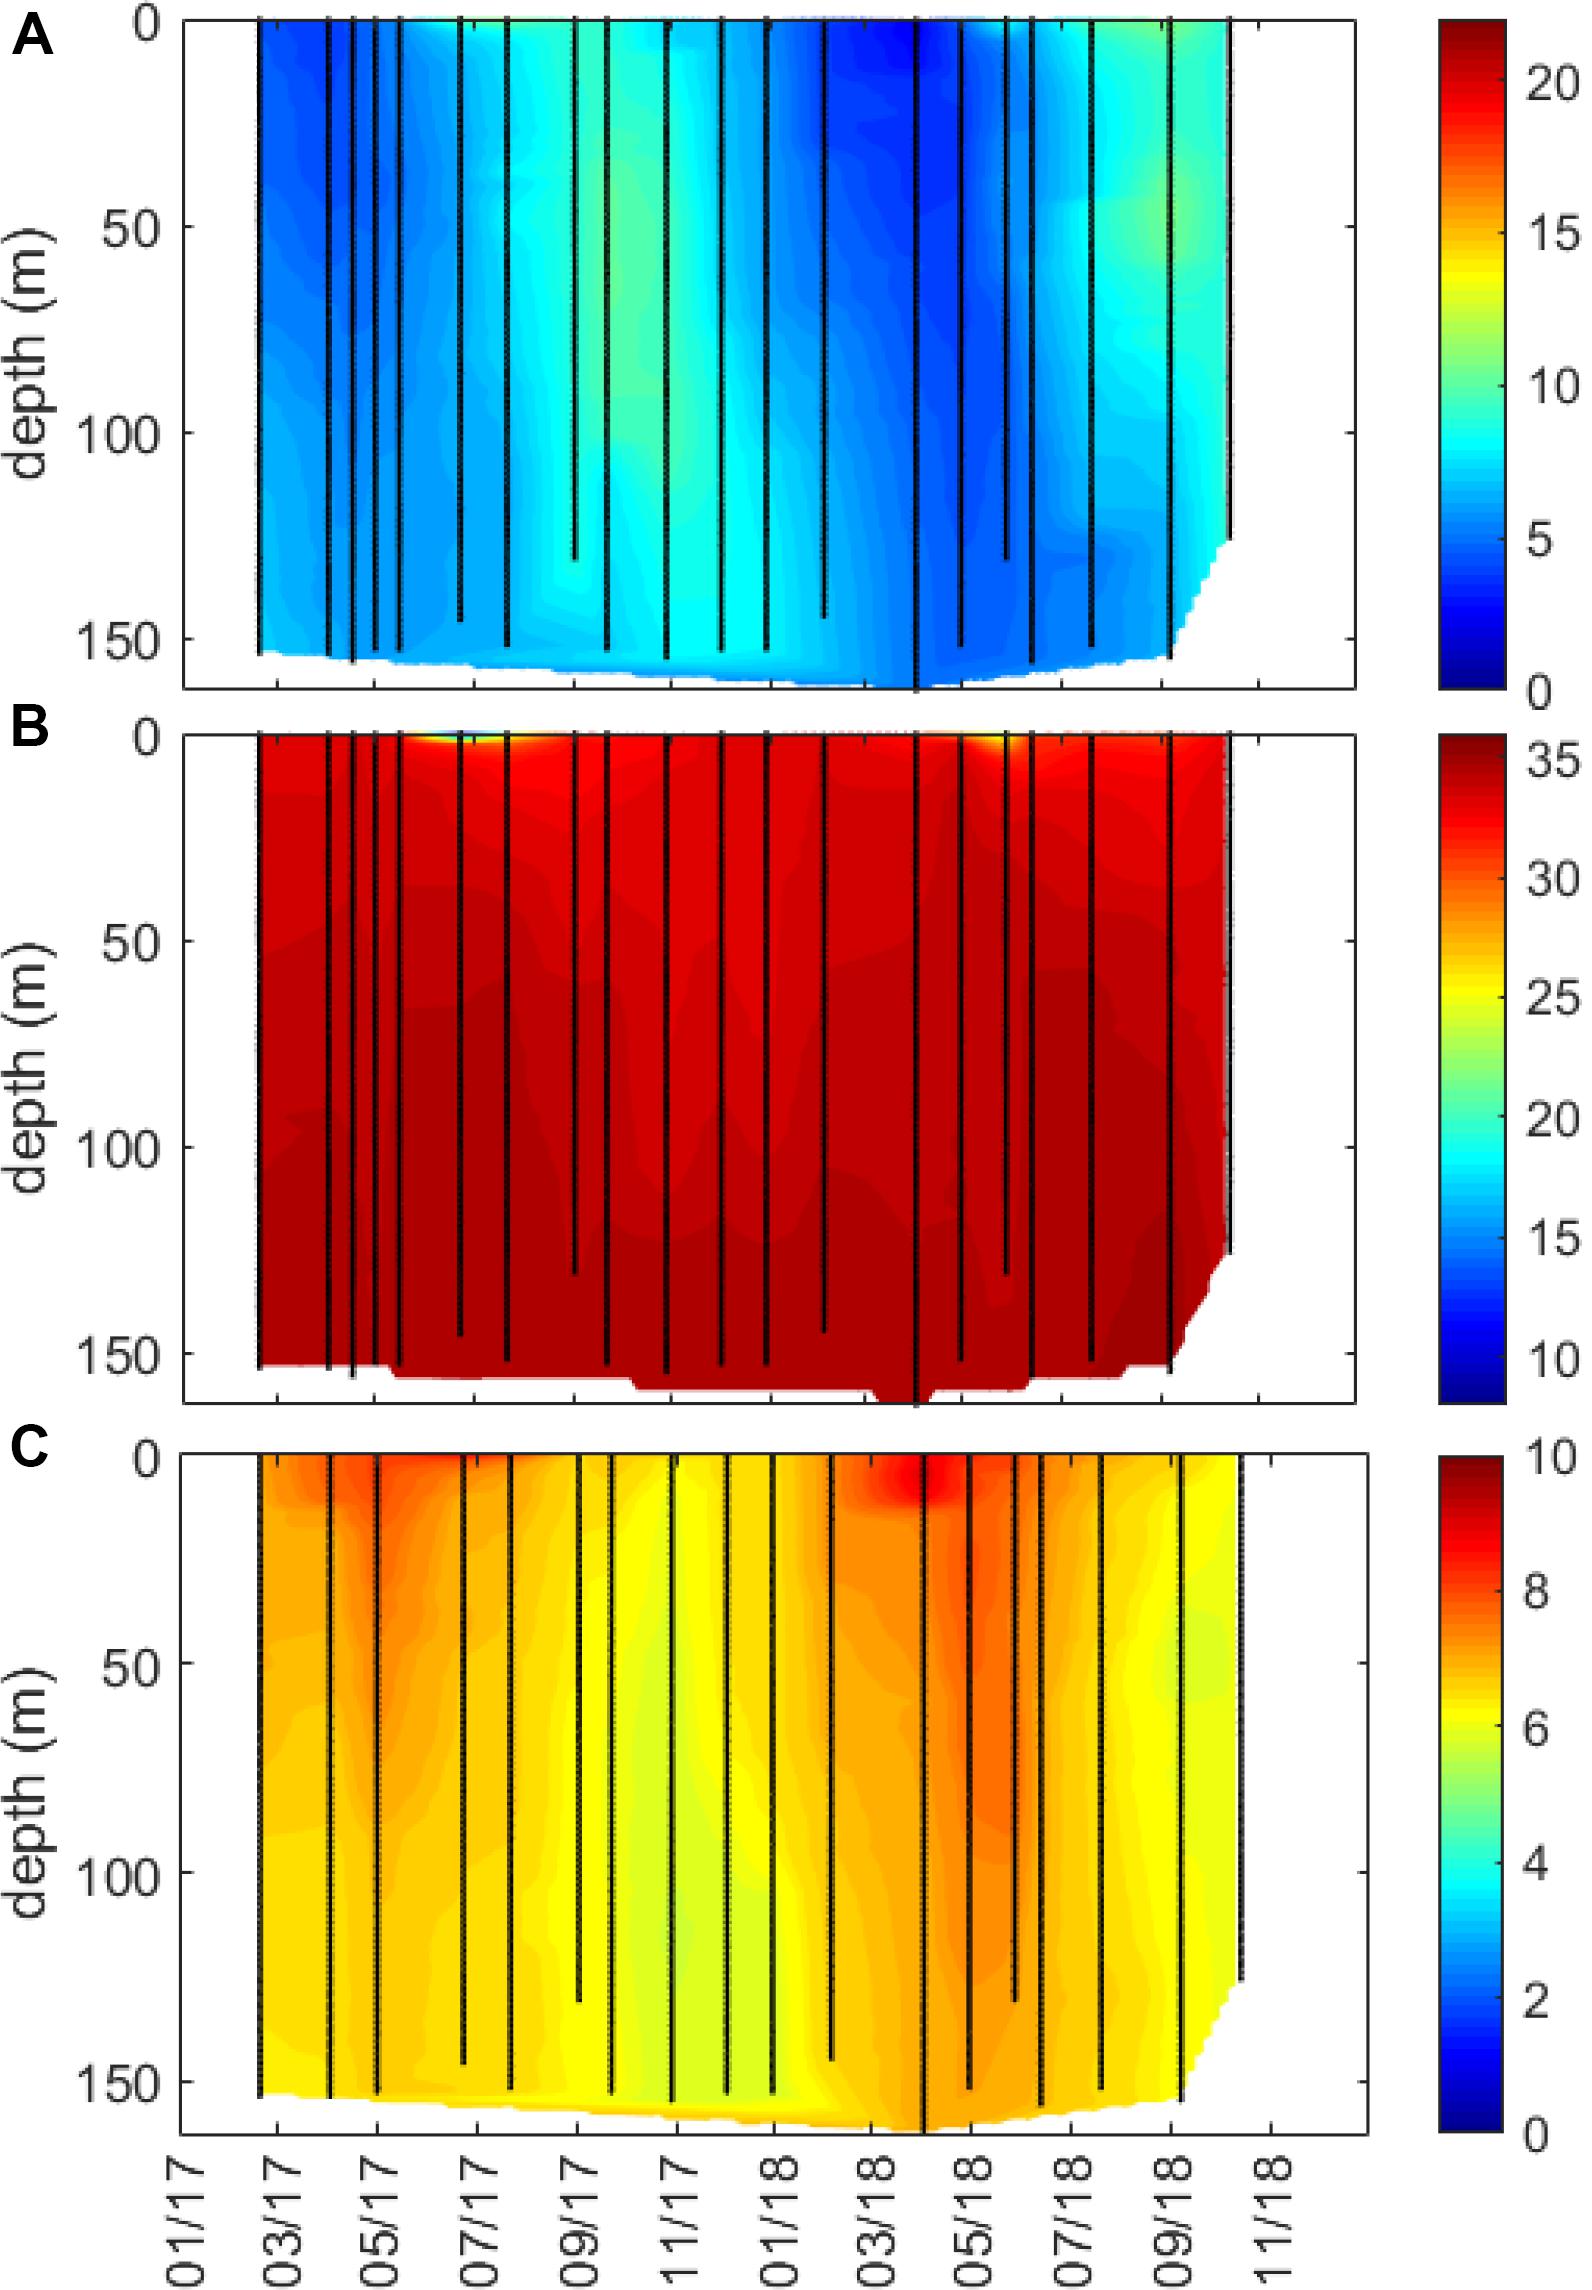
Figure 8. Full water column profiles (from 0 m to near bottom) for coastal station Straumsfjorden in study region Malangen/northern Norway for (A) temperature (°C), (B) salinity, and (C) oxygen (mL L–1). Data are interpolated, with black symbols showing location of sampling.
Correspondingly, cDOM fluorescence showed higher values (from 6 to 12 arbitrary units) during periods of high riverine flow and transport of DOC from Målselv river during June and July of both years (Figure 7E), especially in the region close to the coastal station. At the coastal, the highest DOC concentrations were observed in the surface (up to 2.2 mg L–1), with lower DOC concentrations (<1.5 mg L–1) below 10 m (Figure 7H). There was no DOC data from the coastal station during summer 2017; however, there was a slight increase during summer 2018 during the period of high riverine flow. There was a negative correlation between underway cDOM fluorescence and surface salinities; however, no correlation was found for the coastal DOC concentrations (Figure 4C).
There were pronounced phytoplankton blooms, as shown by high chl a fluorescence from underway observations from March to July of both years (Figure 7F). In 2017, the spring bloom was from March to April with chl a fluorescence up to ∼10 μg L–1, and a secondary bloom was observed in September/October with maximum chl a fluorescence in this time period of ∼1 to 2 μg L–1. At the coastal station, the spring bloom occurred in April/May of both years, with chl a approximately 3 μg L–1 between 10 and 20 m (Figure 7I). A secondary bloom was observed in July/September with a maximum chl a fluorescence of (∼1–2 μg L–1. The onset of the blooms preceded the periods of maximum nutrient transport from Målselv river by ∼1–3 months, and there were no significant correlations between riverine nutrient transports and coastal chl a fluorescence in coastal waters (Figure 4C).
Discussion
Variability in Riverine Inputs
Freshwater discharge and transports of TOC, SPM, and nutrients varied substantially between the three coastal regions during the study, with highest values observed for the Glomma river in the outer Oslofjord/southern Norway study region. Seasonal variability in riverine inputs, while evident in all three study regions, was most pronounced in terms of timing and change in magnitude (Figures 2, 5, 7). The maximum discharge from Glomma river was on the order of 4 × 10⁹ to 6 × 10⁹ m3 month–1, which was an order of magnitude higher than that of Nausta (Runde/western Norway) and Målselv (Malangen/northern Norway) rivers (108 m3 month–1) (Figures 2A, 5A, 7A). This comparably high discharge was primarily governed by precipitation patterns and catchment size (Kaste et al., 2018). Glomma river has the largest catchment area of 41,918 km2 in comparison to Nausta river (277 km2 catchment area) and Målselv river (3,239 km2).
The variability in discharge, both in terms of discharge rate and timing, was influenced in part by climatic differences between each catchment—the mean winter water temperatures (October–April) of Glomma, Nausta, and Målselv rivers are -5.4, -0.7, and -7.7°C, respectively. Both Glomma and Målselv rivers exhibited higher discharge in springtime, which was due to the snow accumulation in winter followed by snowmelt flood in springtime that is typical for high latitudes. Nausta river discharge was highest during fall/winter, which is the time of year when the climate is mild and wetter (in terms of frequency and amount of precipitation) and is typical for western Norway. This results in relatively low snow accumulation and more frequent winter floods (Skarbovik et al., 2014; Kaste et al., 2018). Dissolved organic carbon, SPM, and nutrients showed highest transports during the times of highest flow, which was in spring for Glomma and Målselv rivers and during fall for Nausta river. The magnitude of DOC, SPM, and nutrient transport was higher from Glomma river, which was likely to be related to both the catchment size and the comparably densely populated areas and higher agricultural activities in the catchment. The lower transport observed in Nausta and Målselv river catchments in western and northern Norway study regions was likely due to the smaller catchment size as well as lower and scattered settlement and limited agricultural activity; however, more intense aquaculture activities in both regions contribute significantly to nutrient input (Kaste et al., 2018).
Variability in Coastal Salinity and Water Column Structure
For all three study regions, there were significant negative correlations between river discharge and surface coastal waters salinity (both coastal stations and underway observations; Figure 4). This connectivity between riverine flow and coastal salinity differed between the study regions with a more permanent freshwater influence in the outer Oslofjord/southern region, compared to more episodic events related to periods of high riverine discharge.
The spatial and temporal extent of low salinity coastal waters was much larger in the outer Oslofjord/southern Norway region, as compared to Runde/western Norway and Malangen/northern Norway regions, and the salinity ∼25 halocline extended deeper than 10 m during flood events in the outer Oslofjord region, in addition to having lower-salinity waters in the surface layer year-round (Figures 2A,D,G, 3). The circulation in Skagerrak is complex, and there is a high degree of exchange with water masses from the Atlantic Ocean and the relatively fresh North Sea and Baltic Sea, in addition to freshwater discharges into the region (Saetre, 2007; Albretsen et al., 2012; Kristiansen and Aas, 2015). The low salinity observations in the outer Oslofjord/southern Norway study region were likely due to its exposure to both riverine freshwater input and advection of low-salinity water masses into the region. The Norwegian Coastal Current is formed in this region and flows northward along the Norwegian coastline to the Barents Sea (Saetre, 2007). Several large Norwegian rivers drain into the Oslofjord, of which the largest is the Glomma river. The surface layer (0–30 m) is heavily impacted by freshwater input (local and advected) with ∼1/3 from fresh Baltic Sea, German Bight, and riverine sources (Kristiansen and Aas, 2015), and is typically stratified from early spring to late fall (Fagerli et al., 2019). There was little variation in temperature, salinity, and oxygen below 50–100 m (Figures 3C, 6C, 8C), where the literature shows that greater than 70% of the water mass is Atlantic Ocean in origin (Saetre, 2007; Kristiansen and Aas, 2015). Compared to the southern Norway study region, the extent of freshwater influence in the Runde/western Norway and Malangen/northern Norway regions was more limited and restricted to periods of high riverine flow, and the salinity ∼25 halocline was confined to the upper 5 m in these two regions (Figures 5–8). The western and northern regions were more influenced by Atlantic water masses (>34.5) in the whole water column, related to the northward flow of the Norwegian Coastal Current along the Norwegian coast (Saetre, 2007). The Norwegian Coastal Current can flow into and influence inshore coastal areas and fjords along the Norwegian coastline, with the exchange rates driven both by internal factors (such as riverine run-off and estuarine circulation) and external factors, such as local and offshore winds and tides. The effect of prevailing winds along the coastline has been shown to be an important driver for water exchange in Norwegian fjords, with northerly winds causing upwelling of deep water along the Norwegian coast and a compensating outflow of surface waters from the fjord (Saetre et al., 1988; Aksnes et al., 1989). The tidal amplitude increases along the Norwegian coastline, with the effects in Skagerrak being small (∼50 cm), intermediate around Runde/western Norway (∼250 cm), and largest in Malangen/northern Norway (∼300 cm) (Saetre, 2007).
The western region around Runde consists of a system of islands and intersecting fjords in the southern Norwegian Sea, and the coastal station here is located in a sheltered location surrounded by islands and rock-reefs in a basin (approximately 70 m) with limited deep-water exchange with surrounding waters and periodically stagnant bottom waters (see discussion of oxygen conditions in deeper waters in Variability in cDOM Fluorescence and DOC; Trannum et al., 2019). Yet, this study region was the most marine (i.e., Atlantic water influenced) of the three study regions, with high salinity year-round (Figures 5D,G, 6B), and thermal stratification developing during summer and fall, and winter mixing extending to the bottom (Figure 6).
The northern study region of Malangen/northern Norway is a large and open fjord system in the northern Norwegian Sea with a deep sill, and the Straumsfjord coastal station is located mid-fjord at approximately 150-m depth. This region appears to be mostly marine with high salinities year-round, except for a shallow freshwater lens (<5 m) over a confined geographic region in June/July of both years (Figures 7D,G, 8B). The higher frequency observations afforded by the underway ship observations (approximately weekly) in comparison to the conventional coastal station observations (approximately monthly) were instrumental in catching these dynamic events (Supplementary Figure S1). Salinity measured during monthly cruises accounted for less than ∼40% of the variability in salinity as observed by the underway ship measurements during discharge events. Except for these episodic events, the region is fairly well mixed with warming extending to the bottom in late fall and no strong stratification developing in summer months (Figure 8; Velvin et al., 2019).
Variability in cDOM Fluorescence and DOC
In this study, DOC observations from the coastal stations and cDOM fluorescence from the underway ship observations were generally positively related to periods of high riverine flow and large transport of riverine DOC (Figure 4). In the southern and northern Norway study regions, DOC, and cDOM fluorescence were relatively high in low-salinity waters, which suggested dilution from a riverine source (Figure 9). This does not, however, rule out the contribution of water masses that are low in salinity and high in DOC (e.g., Baltic water influence on the outer Oslofjord/southern Norway study region).
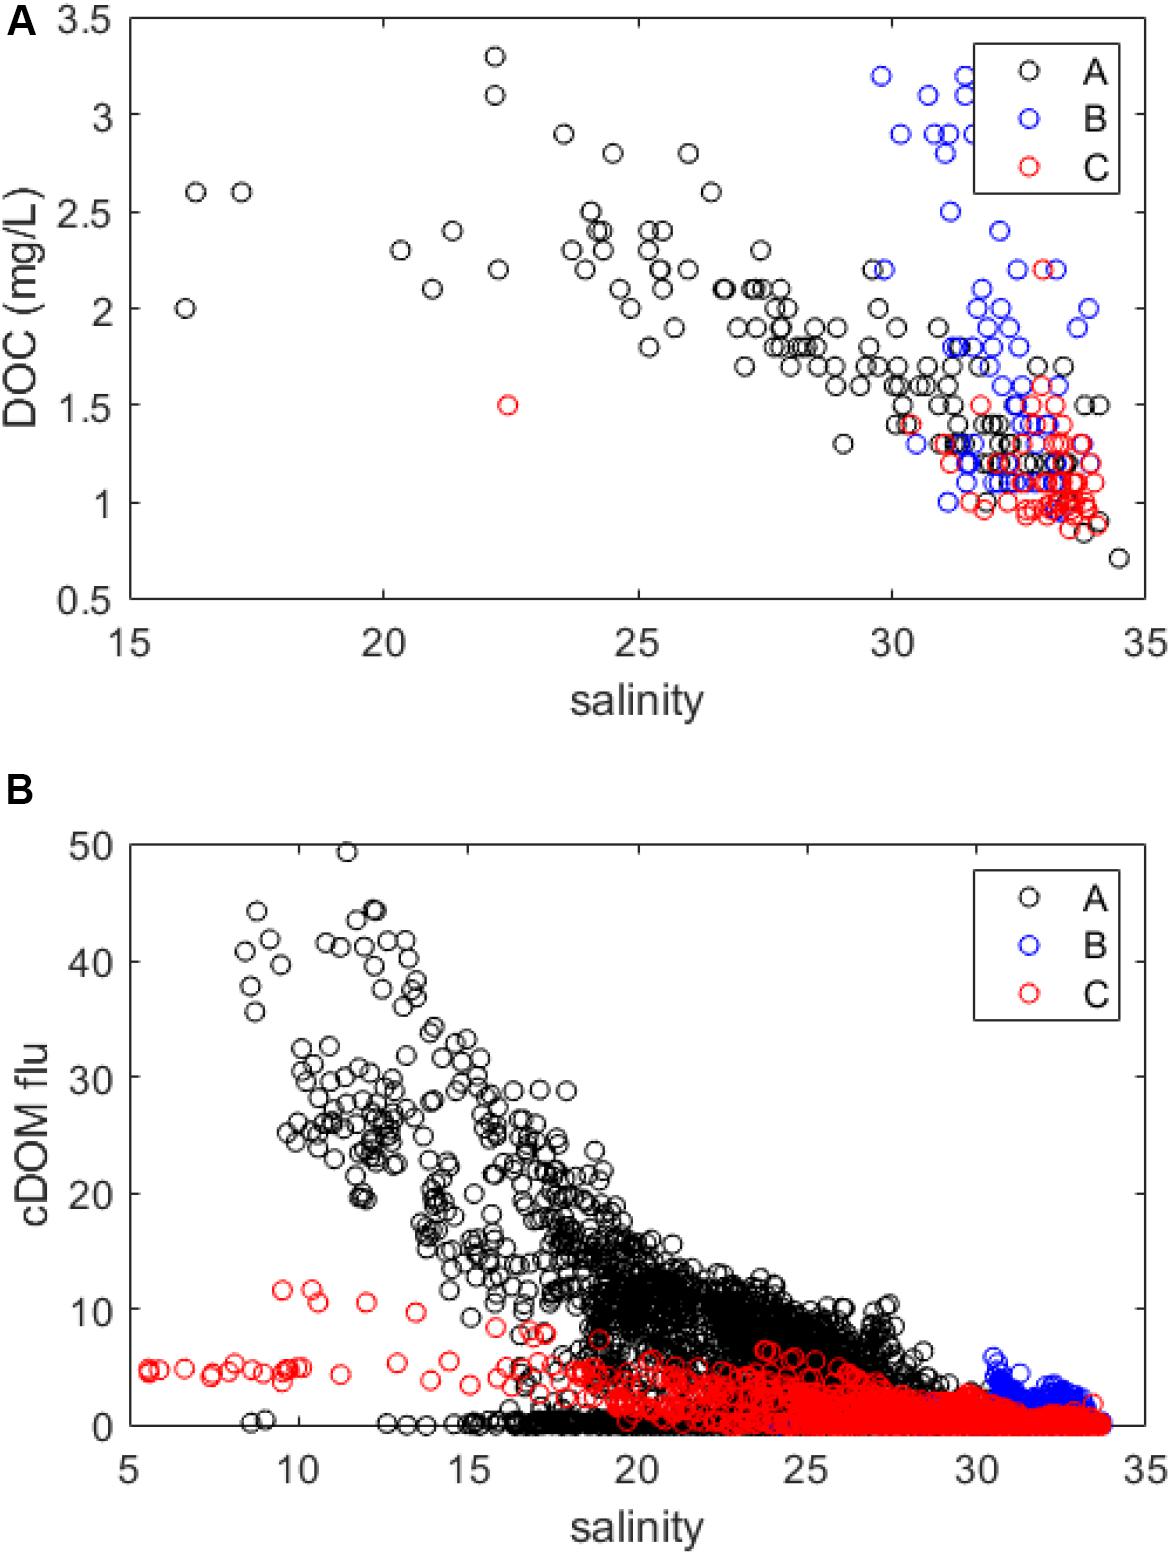
Figure 9. (A) Salinity versus DOC scatterplots for each of the coastal stations in the three study regions (data from 0 to 30 m) and (B) salinity versus cDOM fluorescence scatter plots for the underway ship observation transect in the three study regions (data from ∼5 m).
Dissolved organic carbon was consistently higher on an annual basis in the outer Oslofjord/southern Norway study region than in the other two study regions (Figures 2E,H). This finding is consistent with general observations of both the coastal waters of Skagerrak, but also North Sea region having high proportions of terrestrial and humic-like DOC (Obernosterer and Herndl, 2000; Kristiansen and Aas, 2015; Painter et al., 2018), causing higher light attenuation and shallower Secchi depths (Jerlov, 1968). As for the Skagerrak region, this darkening phenomenon can be first attributed to the terrestrial input from large rivers in the region that drain into the outer Oslofjord and Skagerrak region. Rivers in this area have been observed to generally transport higher organic matter due to larger fractions of forest (mainly conifers) and peatlands within their surrounding catchments. Further, surface waters in this region are also affected by mixing of high cDOM/DOC waters from the Baltic Sea (Harvey et al., 2015; Seidel et al., 2017) and waters originating from the southern/central North Sea (Kristiansen and Aas, 2015; Painter et al., 2018; Chaichana et al., 2019). In addition, the Skagerrak region also has higher phytoplankton biomass and productivity, contributing to additional marine DOC production (Hansell and Carlson, 2015).
Observations of cDOM and DOC in the western Norway study region were unique in that there were uniformly high DOC concentrations (>3 mg L–1) from the surface down to 30 m during September–October 2018 (Figure 5H), but was not evident from the underway ship cDOM fluorescence observations (Figure 5E). The high DOC observation was in high-salinity waters (∼30–35), and DOC was equally as high as DOC in salinity ∼20–25 water masses in the southern study region. This period coincided with low O2 and high NH4 in the water column (Supplementary Figures S2B, 6C) and also with high DOC transport from Nausta river (Figure 5B). While the connection between these observations is not clear, and more investigations are needed, low O2 and high NH4 observations and the deviation of salinity-DOC data from the western Norway study region (Figure 9A and Supplementary Figure S2) suggest that other processes could be involved, such as dissimilatory nitrate reduction to ammonium in bottom waters followed by mixing throughout the water column (Jørgensen, 1989). While high DOC values could be connected to phytoplankton bloom and decline (e.g., Thornton, 2014), phytoplankton biomass was not appreciable during the same time period (Figures 5F,I).
The episodic nature of the Malangen/northern Norway study region is reflected in the cDOM and DOC dynamics, with higher values corresponding to high discharge and transport of DOC from Målselv river (Figure 7). The northern Norwegian fjord systems (including Malangen) have been characterized as “multipulse systems,” with high short-term variability caused by physical and biological forcing, which includes advection into the fjord systems from the Norwegian Coastal Current driven by off-shore winds and physical forcing (Wassmann et al., 1996). The run-off from Målselv river is high in fine inorganic sediments, causing high light attenuation following the spring flood (G. Christensen, personal communication). The inorganic suspended particles can originate from glacial meltwater in the upper, mountainous part of the catchment, but the major parts are derived from fluvial deposits in the lower parts of the river, and inorganic particles can have a larger contribution to light absorption than cDOM in downstream fjord basins (Mascarenhas et al., 2017).
Variability in Phytoplankton Chlorophyll a
All three regions exhibited a spring-time bloom that is typical in mid-high latitude coastal systems (Wassmann et al., 1991) with the apparent onset of the spring bloom in March, March/April, and April in the southern, western, and northern study regions, respectively. The spring bloom was generally followed by a late-summer/fall bloom in August/September at all the study regions. Chlorophyll a was higher, and phytoplankton bloom events were more frequent and had a larger spatial extent in the outer Oslofjord/southern study region in comparison to the other two study regions.
The spring phytoplankton blooms generally preceded the period of peak riverine flow and inputs of nutrients, and there was no significant correlations between coastal chl a and riverine nutrient inputs (Figures 2, 5, 7A,C,F,I). This is generally often the case in boreal and subarctic waters in which spring blooms are promoted by deep penetration of light and low wind mixing in non-stratified waters (Townsend et al., 1992; Eilertsen, 1993; Wassmann et al., 1996). This was especially clear in the Malangen/northern Norway study region in which the spring bloom occurred in April each year, and the peak riverine flow and nutrient/DOC/SPM transports, as well as low salinity in coastal waters, was in May/June (Figure 7). The onset of the spring bloom was therefore probably initiated by favorable light conditions and driven by the nutrients in the winter reserve in this region. The supply of nutrients by mixing with the offshore coastal waters has been shown for other western Norwegian fjords, where the effects of the offshore wind direction and advection into the fjord were important for nutrient supply and production (Aksnes et al., 1989). However, the postspring bloom riverine influx of nutrients could provide a significant source of nutrients that sustains and prolongs the spring bloom or partially supports the fall bloom.
While peak riverine flow could potentially promote phytoplankton blooms through increasing water column stratification due to a larger salinity gradient and due to the abovementioned allochthonous nutrient supply, the large accompanying input of DOC and suspended matter as observed in all the study regions (Figures 2B, 5B, 7B) can reduce light availability for photosynthesis. For example, elevated DOM concentration contributes to light attenuation due to its chromophoric fraction (Stedmon et al., 2000; Foden et al., 2008) and potentially negatively affects visual predators and autotrophic production. Chlorophyll a in the northern study region is low during the high riverine flow/input periods in which a shallow section of the sea surface is highly turbid (data not shown) and fresh. The high DOC input during the spring flood events could also supply DOC that supports and can favor heterotrophic bacteria production in which heterotrophic bacteria can outcompete phytoplankton for nutrients (Thingstad et al., 2008; Thingstad and Cuevas, 2010; Larsen et al., 2015; Deininger et al., 2017). This has implications for autotrophic–heterotrophic carbon balance and therefore food web structure and dynamics, and whether coastal systems are net sources or sinks of carbon.
Conclusion
The diverse watershed characteristics from southern to northern Norway result in variability in riverine flow and transport of DOC and nutrients into coastal systems. These inputs were clearly observed in a 2-year period using traditional station-based measurements and underway ship of opportunity measurements. The use of ships of opportunity underway systems allowed for cost-efficient high-frequency measurements of coastal ecosystem dynamics. The dynamics of DOC, cDOM, and phytoplankton blooms in these coastal systems were likely influenced by riverine inputs, but occur together with other local mixing and biogeochemical process, as well as advected riverine run-off and water masses (e.g., North Sea and Baltic Sea water masses to the outer Oslofjord study region). There was generally an observed correspondence between riverine DOC transport and high cDOM/DOC in coastal waters, with a more persistent nature in the southern region and episodic nature in the northern Norway region. The spring blooms in all regions generally preceded the spring flood, which indicated that the winter nutrient reserve was more important for the initial spring bloom than the riverine input of nutrients, but this does not rule out the importance of riverine input of nutrients in sustaining the spring blooms or supporting the fall blooms. However, the timing of melting and peak riverine input in a warmer climate could occur earlier in the year and overlap with the spring bloom. Light attenuation associated with high TSM loads could negatively affect the success of the spring bloom and have bottom-up effects on the food web. Additional process-based and synoptic studies are clearly needed to understand the relative contribution of local versus external forcing on carbon and nutrient budgets and productivity in the Norwegian coastal sea and fjords.
These findings are in accordance with other arctic and boreal regions of the world that altogether demonstrate that local/regional heterogeneity needs to be taken into account for understanding the interaction between riverine and coastal systems. Arctic and boreal arctic rivers, for example, have been shown to be significant sources of nutrients and DOC to coastal waters; however, also here, the net impact on coastal zones is largely dependent on river-specific timing of high-flow conditions delivering land-derived material and freshwater, interannual variation, and seasonality effects on constituent fluxes, as well as human activities and upstream land use (Jickells, 1998; Amon et al., 2012; Holmes et al., 2012; Fleming-Lehtinen et al., 2014; Mattsson et al., 2015; Gareis and Lesack, 2017). Continuous and frequent measurements are crucial for understanding and predicting whether and when coastal systems are comparably more influenced by riverine input, or by marine water masses, allowing for more representative characterization of differing hydrological periods, as well as possible changes in concentration–discharge relations (Gareis and Lesack, 2017).
Coastal ecosystems are among the most impacted oceanic regions due to their proximity to human activity both in catchments and the sea, and are critical regions of high productivity that significantly contribute to oceanic primary production, carbon burial, and fisheries. Understanding and predicting the effects of climate change and anthropogenic impacts in coastal systems are challenging because of the dynamic nature of these systems and unique local and external process that influence these systems as described here. Given the (projected) increase in terrestrial organic matter input into coastal regions and the large spatial and temporal variability shown in this study, as well as the myriad of riverine input-related ecosystem impacts, there is therefore a strong need for continued collaborative and cooperative research and monitoring activities related to catchment and coastal observations, experiments, and modeling. These efforts will help to disentangle the processes responsible for climate change effects on oceanic and terrestrial systems, including the links to light quantity/quality, food web structure and function, eutrophication, deoxygenation, and coastal ocean acidification.
Data Availability Statement
The datasets generated for this study are available on request to the corresponding author.
Author Contributions
HF and AK contributed to conception and design of the study, and wrote the manuscript. RB, AD, GC, ØK, KK, MN, and KS commented on versions of the drafts. All authors contributed to collecting and analyzing sample data, sensor data, and river data manuscript revision, read, and approved the submitted version.
Funding
River station data were part of the national “Norwegian River Monitoring Program”, financed by the Norwegian Environment Agency. Coastal station data were part of the Norwegian national monitoring program “Ecosystem Monitoring of Coastal waters—ØKOKYST,” financed by the Norwegian Environment Agency and NIVA’s Land-Ocean interactions Strategic Institute Initiative. FerryBox ship of opportunity observations were financed by the Norwegian Environment Agency, NIVA’s Land-Ocean Interactions Strategic Institute Initiative, European Commission’s Horizon 2020 project Research and Innovation Program project JERICO-NEXT under grant agreement No. 654410, and Research Council of Norway NorSOOP grant no. 269922.
Conflict of Interest
The authors declare that the research was conducted in the absence of any commercial or financial relationships that could be construed as a potential conflict of interest.
Acknowledgments
We are grateful for constructive input provided by reviewers which improved the manuscript. Liv-Bente Skancke and James Edward Sample assisted with collating river observations and calculating fluxes. Pierre Jaccard, Caroline Mengeot, Sabine Marty, Louise Valestrand, and Andre Staalstrøm assisted with underway ship and coastal station observations.
Supplementary Material
The Supplementary Material for this article can be found online at: https://www.frontiersin.org/articles/10.3389/fmars.2020.00332/full#supplementary-material
FIGURE S1 | Comparison of salinity measured by underway ship observations (“FerryBox”) at the locations closest to the coastal stations (black dots) and CTD measured salinity at 5 m depth (red open circles) at the Malangen/northern Norway study site.
FIGURE S2 | Depth profiles from 0 to 30 m of NH4-N (μg L–1) for coastal stations in study region: (A) Outer Oslofjord/southern Norway, (B) Runde/western Norway, and (C) Malangen/northern Norway. Data are interpolated with actual data points superimposed.
Footnotes
References
Aksnes, D. L., Aure, J., Kaartvedt, S., Magnesen, T., and Richard, J. (1989). Significance of Advection for the Carrying Capacities of Fjord Populations. Marine Ecology Progress Series 50, 263–274. doi: 10.3354/meps050263
Aksnes, D. L., Dupont, N., Staby, A., Fiksen, O., Kaartvedt, S., and Aure, J. (2009). Coastal water darkening and implications for mesopelagic regime shifts in Norwegian fjords. Marine Ecology Progress Series 387, 39–49. doi: 10.3354/meps08120
Albretsen, J., Aure, J., Saetre, R., and Danielssen, D. S. (2012). Climatic variability in the Skagerrak and coastal waters of Norway. Ices Journal of Marine Science 69, 758–763. doi: 10.1093/icesjms/fsr187
Amon, R., Rinehart, A., Duan, S., Louchouarn, P., Prokushkin, A., Guggenberger, G., et al. (2012). Dissolved organic matter sources in large Arctic rivers. Geochimica et Cosmochimica Acta 94, 217–237. doi: 10.1016/j.gca.2012.07.015
Brattegard, T., Hoisaeter, T., Sjotun, K., Fenchel, T., and Uiblein, F. (2011). Norwegian fjords: From natural history to ecosystem ecology and beyond. Marine Biology Research 7, 421–424. doi: 10.1080/17451000.2011.561355
Carmack, E., Winsor, P., and Williams, W. (2015). The contiguous panarctic Riverine Coastal Domain: A unifying concept. Progress in Oceanography 139, 13–23. doi: 10.1016/j.pocean.2015.07.014
Chaichana, S., Jickells, T., and Johnson, M. (2019). Interannual variability in the summer dissolved organic matter inventory of the North Sea: implications for the continental shelf pump. Biogeosciences 16, 1073–1096. doi: 10.5194/bg-16-1073-2019
Checkley, D. M., Asch, R. G., and Rykaczewski, R. R. (2017). Climate, Anchovy, and Sardine. Annual Review of Marine Science 9, 469–493. doi: 10.1146/annurev-marine-122414-033819
Cloern, J. E., Foster, S. Q., and Kleckner, A. E. (2014). Phytoplankton primary production in the world’s estuarine-coastal ecosystems. Biogeosciences 11, 2477–2501. doi: 10.5194/bg-11-2477-2014
de Wit, H. A., Valinia, S., Weyhenmeyer, G. A., Futter, M. N., Kortelainen, P., Austnes, K., et al. (2016). Current Browning of Surface Waters Will Be Further Promoted by Wetter Climate. Environmental Science & Technology Letters 3, 430–435. doi: 10.1021/acs.estlett.6b00396
Deininger, A., Faithfull, C. L., and Bergstrom, A. K. (2017). Phytoplankton response to whole lake inorganic N fertilization along a gradient in dissolved organic carbon. Ecology 98, 982–994. doi: 10.1002/ecy.1758
Deininger, A., Faithfull, C. L., Lange, K., Bayer, T., Vidussi, F., and Liess, A. (2016). Simulated terrestrial runoff triggered a phytoplankton succession and changed seston stoichiometry in coastal lagoon mesocosms. Marine Environmental Research 119, 40–50. doi: 10.1016/j.marenvres.2016.05.001
Deininger, A., and Frigstad, H. (2019). Reevaluating the Role of Organic Matter Sources for Coastal Eutrophication, Oligotrophication, and Ecosystem Health. Frontiers in Marine Science 6:210. doi: 10.3389/fmars.2019.00210
Dupont, N., and Aksnes, D. L. (2013). Centennial changes in water clarity of the Baltic Sea and the North Sea. Estuarine Coastal and Shelf Science 131, 282–289. doi: 10.1016/j.ecss.2013.08.010
Fagerli, C. W., Staalstrom, A., Trannum, H. C., Gitmark, J. K., Eikrem, W., Marty, S., et al. (2019). ØKOKYST – DP Skagerrak. 2018 report. M-1336. Hauppauge, NY: NIVA.
Fleming-Lehtinen, V., Räike, A., Kortelainen, P., Kauppila, P., and Thomas, D. N. (2014). Organic carbon concentration in the northern coastal Baltic Sea between 1975 and 2011. Estuaries Coast 38, 466–481. doi: 10.1007/s12237-014-9829-y
Foden, J., Sivyer, D. B., Mills, D. K., and Devlin, M. J. (2008). Spatial and temporal distribution of chromophoric dissolved organic matter (CDOM) fluorescence and its contribution to light attenuation in UK waterbodies. Estuarine Coastal and Shelf Science 79, 707–717. doi: 10.1016/j.ecss.2008.06.015
Frigstad, H., Andersen, T., Hessen, D. O., Jeansson, E., Skogen, M., Naustvoll, L. J., et al. (2013). Long-term trends in carbon, nutrients and stoichiometry in Norwegian coastal waters: Evidence of a regime shift. Progress in Oceanography 111, 113–124. doi: 10.1016/j.pocean.2013.01.006
Frigstad, H., Andersen, G. S., Trannum, H. C., Naustvoll, L. J., Kaste, Ø, and Hjermann, D. Ø (2018). Synthesis of climate relevant results from selected monitoring programs in the coastal zone. Part 2: Quantitative analyses. Oslo: Norwegian Institute for Water Research.
Gareis, J. A., and Lesack, L. F. (2017). Fluxes of particulates and nutrients during hydrologically defined seasonal periods in an ice-affected great Arctic river, the Mackenzie. Water Resources Research 53, 6109–6132. doi: 10.1002/2017WR020623
Gledhill, D. K., White, M. M., Salisbury, J., Thomas, H., Mlsna, I., Liebman, M., et al. (2015). Ocean and Coastal Acidification off New England and Nova Scotia. Oceanography 28, 182–197. doi: 10.5670/oceanog.2015.41
Hansell, A. H., and Carlson, C. A. (eds) (2015). Biogeochemistry of marine dissolved organic matter, 2nd Edn. Amsterdam: Elsevier.
Harvey, E. T., Kratzer, S., and Andersson, A. (2015). Relationships between colored dissolved organic matter and dissolved organic carbon in different coastal gradients of the Baltic Sea. Ambio 44, S392–S401. doi: 10.1007/s13280-015-0658-4
Holmes, R. M., McClelland, J. W., Peterson, B. J., Tank, S. E., Bulygina, E., Eglinton, T. I., et al. (2012). Seasonal and annual fluxes of nutrients and organic matter from large rivers to the Arctic Ocean and surrounding seas. Estuaries and Coasts 35, 369–382. doi: 10.1007/s12237-011-9386-6
Jickells, T. D. (1998). Nutrient biogeochemistry of the coastal zone. Science 281, 217–222. doi: 10.1126/science.281.5374.217
Johannessen, T., Dahl, E., Falkenhaug, T., and Naustvoll, L. J. (2012). Concurrent recruitment failure in gadoids and changes in the plankton community along the Norwegian Skagerrak coast after 2002. Ices Journal of Marine Science 69, 795–801. doi: 10.1093/icesjms/fsr194
Jørgensen, K. S. (1989). Annual pattern of denitrification and nitrate ammonification in estuarine sediment. Appl. Environ. Microbiol. 55, 1841–1847. doi: 10.1128/AEM.55.7.1841-1847.1989
Kaste, Ø, Skarbøvik, E., Greipsland, I., Gundersen, C., Austnes, K., Skancke, L. B., et al. (2018). The Norwegian river monitoring prgramme - water quality status and trends 2017. Mission Report Number:M-1168. Denmark: NIVA.
Kile, M. R., Ranneklev, S. B., Persson, J., and Myrvold, K. M. (2018). Classification of ecological and chemical status in Norwegian rivers according to the Water Framework Directive. River Monitoring Programme 2017. Norwegian Envionment Agency, report M-1167, NIVA report. Denmark: NIVA.
Kristiansen, T., and Aas, E. (2015). Water type quantification in the Skagerrak, the Kattegat and off the Jutland west coast. Oceanologia 57, 177–195. doi: 10.1016/j.oceano.2014.11.002
Lapierre, J. F., Guillemette, F., Berggren, M., and del Giorgio, P. A. (2013). Increases in terrestrially derived carbon stimulate organic carbon processing and CO2 emissions in boreal aquatic ecosystems. Nature Communications 4, 2972. doi: 10.1038/ncomms3972
Larsen, A., Egge, J. K., Nejstgaard, J. C., Capua, I. Di, Thyrhaug, R., Bratbak, G., et al. (2015). Contrasting response to nutrient manipulation in Arctic mesocosms are reproduced by a minimum microbial food web model. Limnology and Oceanography 60, 360–374. doi: 10.1002/lno.10025
Mascarenhas, V. J., Voss, D., Wollschlaeger, J., and Zielinski, O. (2017). Fjord light regime: Bio-optical variability, absorption budget, and hyperspectral light availability in Sognefjord and Trondheimsfjord, Norway. Journal of Geophysical Research-Oceans 122, 3828–3847. doi: 10.1002/2016JC012610
Mattsson, T., Kortelainen, P., Räike, A., Lepistö, A., and Thomas, D. N. (2015). Spatial and temporal variability of organic C and N concentrations and export from 30 boreal rivers induced by land use and climate. Sci Tot Environ 508, 145–154. doi: 10.1016/j.scitotenv.2014.11.091
Monteith, D. T., Stoddard, J. L., Evans, C. D., de Wit, H. A., Forsius, M., Hogasen, T., et al. (2007). Dissolved organic carbon trends resulting from changes in atmospheric deposition chemistry. Nature 450, 537–U539. doi: 10.1038/nature06316
Moy, F. E., and Christie, H. (2012). Large-scale shift from sugar kelp (Saccharina latissima) to ephemeral algae along the south and west coast of Norway. Marine Biology Research 8, 309–321. doi: 10.1080/17451000.2011.637561
Obernosterer, I., and Herndl, G. J. (2000). Differences in the optical and biological reactivity of the humic and nonhumic dissolved organic carbon component in two contrasting coastal marine environments. Limnology and Oceanography 45, 1120–1129. doi: 10.4319/lo.2000.45.5.1120
Painter, S. C., Lapworth, D. J., Woodward, E. M. S., Kroeger, S., Evans, C. D., Mayor, D. J., et al. (2018). Terrestrial dissolved organic matter distribution in the North Sea. Science of the Total Environment 630, 630–647. doi: 10.1016/j.scitotenv.2018.02.237
Peterson, B. J., Holmes, R. M., McClelland, J. W., Vorosmarty, C. J., Lammers, R. B., Shiklomanov, A. I., et al. (2002). Increasing river discharge to the Arctic Ocean. Science 298, 2171–2173. doi: 10.1126/science.1077445
R Core Team. (2018). R: A language and environment for statistical computing. Vienna: R Foundation for Statistical Computing.
Seidel, M., Manecki, M., Herlemann, D. P. R., Deutsch, B., Schulz-Bull, D., Jurgens, K., et al. (2017). Composition and Transformation of Dissolved Organic Matter in the Baltic Sea. Frontiers in Earth Science 5:31. doi: 10.3389/feart.2017.00031
Sipler, R. E., Kellogg, C. T. E., Connelly, T. L., Roberts, Q. N., Yager, P. L., and Bronk, D. A. (2017). Microbial Community Response to Terrestrially Derived Dissolved Organic Matter in the Coastal Arctic. Frontiers in Microbiology 8:1018. doi: 10.3389/fmicb.2017.01018
Skarbovik, E., Stalnacke, P., Kaste, O., and Austnes, K. (2014). Trends in nutrients and metals in Norwegian rivers and point sources 1990-2009. Hydrology Research 45, 441–454. doi: 10.2166/nh.2013.233
Skarbøvik, E., Allan, I., Sample, J. E., Greipsland, I., Selvik, J. R., Skancke, L. B., et al. (2017). Riverine inputs and direct discharges to Norwegian coastal waters – 2016. NIVA Report 7217-2017, Norwegian Environment Agency report M- 862. Hauppauge, NY: NIVA.
Smith, R. W., Bianchi, T. S., Allison, M., Savage, C., and Galy, V. (2015). High rates of organic carbon burial in fjord sediments globally. Nature Geoscience 8, 450–U446. doi: 10.1038/ngeo2421
Sogn Andersen, G., Steen, H., Christie, H., and Moy, F. E. (2019). In a squeeze: Epibiosis may affect the distribution of kelp forests. Journal of Ecology and Evolution 9, 2883–2897. doi: 10.1002/ece3.4967
Stedmon, C. A., Markager, S., and Kaas, H. (2000). Optical properties and signatures of chromophoric dissolved organic matter (CDOM) in Danish coastal waters. Estuarine Coastal and Shelf Science 51, 267–278. doi: 10.1006/ecss.2000.0645
Strickland, J. D., and Parsons, T. R. (1972). A practical handbook of seawater analysis. Journal of the Fisheries Research Board of Canada 167, 310.
Saetre, R., Aure, J., and Ljoen, R. (1988). Wind Effects on the Lateral Extension of the Norwegian Coastal Water. Continental Shelf Research 8, 239. doi: 10.1016/0278-4343(88)90031-3
Thingstad, T. F., Bellerby, R. G. J., Bratbak, G., Borsheim, K. Y., Egge, J. K., Heldal, M., et al. (2008). Counterintuitive carbon-to-nutrient coupling in an Arctic pelagic ecosystem. Nature 455, 387–U337. doi: 10.1038/nature07235
Thingstad, T. F., and Cuevas, L. A. (2010). Nutrient pathways through the microbial food web: principles and predictability discussed, based on five different experiments. Aquatic Microbial Ecology 61, 238–260. doi: 10.3354/ame01452
Thornton, D. C. O. (2014). Dissolved organic matter (DOM) release by phytoplankton in the contemporary and future ocean. European Journal of Phycology 49, 20–46. doi: 10.1080/09670262.2013.875596
Townsend, D. W., Keller, M. D., Sieracki, M. E., and Ackleson, S. G. (1992). Spring Phytoplankton Blooms in the Absence of Vertical Water Column Stratification. Nature 360, 59–62. doi: 10.1038/360059a0
Trannum, H. C., Fagerli, C. W., Golmen, L., Eikrem, W., and Staalstrom, A. (2019). ØKOKYST – DP Norskehavet Sør (I). 2018 report. M-1339. Hauppauge, NY: NIVA.
Velvin, R., Christensen, G. N., Mannvik, H.-P., Aasen, A. T., Dahl-Hansen, G., Ivarjord, T., et al. (2019). ØKOKYST - DP Norskehavet Nord (I). Report 2018. M-1341. Hauppauge, NY: NIVA.
Wallace, R. B., Baumann, H., Grear, J. S., Aller, R. C., and Gobler, C. J. (2014). Coastal ocean acidification: The other eutrophication problem. Estuarine Coastal and Shelf Science 148, 1–13. doi: 10.1016/j.ecss.2014.05.027
Wassmann, P., Peinert, R., and Smetacek, V. (1991). Patterns of Production and Sedimentation in the Boreal and Polar Northeast Atlantic. Polar Research 10, 209–228. doi: 10.1111/j.1751-8369.1991.tb00647.x
Wassmann, P., Svendsen, H., Keck, A., and Reigstad, M. (1996). Selected aspects of the physical oceanography and particle fluxes in fjords of northern Norway. Journal of Marine Systems 8, 53–71. doi: 10.1016/0924-7963(95)00037-2
Wei, T., and Simko, V. (2017). R package “corrplot”: Visualization of a Correlation Matrix (Version 0.84). Available online at: https://github.com/taiyun/corrplot (accessed April 15, 2020).
Keywords: riverine run-off, coastal systems, Norwegian Coastal Current, dissolved organic carbon (DOC), chromophoric DOC (cDOM), coastal darkening, chlorophyll a, environmental monitoring
Citation: Frigstad H, Kaste Ø, Deininger A, Kvalsund K, Christensen G, Bellerby RGJ, SØrensen K, Norli M and King AL (2020) Influence of Riverine Input on Norwegian Coastal Systems. Front. Mar. Sci. 7:332. doi: 10.3389/fmars.2020.00332
Received: 16 December 2019; Accepted: 22 April 2020;
Published: 04 June 2020.
Edited by:
Joanne O’Callaghan, National Institute of Water and Atmospheric Research (NIWA), New ZealandReviewed by:
Raghab Ray, Atmosphere and Ocean Research Institute, University of Tokyo, JapanLígia Pinto, Instituto Superior Técnico, Portugal
Copyright © 2020 Frigstad, Kaste, Deininger, Kvalsund, Christensen, Bellerby, Sørensen, Norli and King. This is an open-access article distributed under the terms of the Creative Commons Attribution License (CC BY). The use, distribution or reproduction in other forums is permitted, provided the original author(s) and the copyright owner(s) are credited and that the original publication in this journal is cited, in accordance with accepted academic practice. No use, distribution or reproduction is permitted which does not comply with these terms.
*Correspondence: Helene Frigstad, aGVsZW5lLmZyaWdzdGFkQG5pdmEubm8=
†These authors have contributed equally to this work