 Timothy Culwick
 Jeremy Phillips
 Claire Goodwin
 Emily J. Rayfield
 Katharine R. Hendry
- 1School of Earth Sciences, Faculty of Science, University of Bristol, Bristol, United Kingdom
- 2Huntsman Marine Science Centre, Saint Andrews, NB, Canada
- 3Department of Biological Sciences, University of New Brunswick, Fredericton, NB, Canada
Understanding the distribution and density of sponge grounds in the deep sea is key to appreciating the ecological importance, vulnerability, and role in ocean biogeochemistry of these important habitats. A novel combination of clustering analysis and fluid flow finite element modeling was used to study the distribution of four sponge grounds from the Labrador Sea, which were chosen for their distinct assemblages of sponges. Significant small-scale clustering patterns of sponges were found within each sponge ground, measured using the Ripley K function. A new approach using finite element modeling of fluid flow was then applied to understand the drivers of the observed sponge distribution, with detailed numerical experiments providing insights into the flow patterns that could not be obtained from field measurements. Simulations using idealized sponge shapes suggested that sponge wakes could interact and influence the mean flow conditions at the spacings observed within the sponge grounds. Simulations of flow over topographic models of the sponge grounds showed that these interacting wakes generated a boundary layer of slowed flow, which may be beneficial to sponge development. The boundary layer may be acting as a protective layer, affecting larval recruitment, increasing particle fall out, and increasing the effective radius of pumping. This observation has important implications for the impact of anthropogenic damage on sponge grounds, which changes the sponge distribution and may reduce the boundary layer thickness, affecting potential recovery rates. This study illustrates the power of incorporating mathematical modeling with field observations in the deep sea to increase our understanding of anthropogenic and climate change impacts on sponge ground ecosystem structure and function.
Introduction
Sponges (Phylum Porifera) are an often overlooked as important components of benthic marine ecosystems. They are known to perform several functional roles notably as reef building organisms in both the shallow and deep-sea (Miller et al., 2012; Knudby et al., 2013; Roberts et al., 2018). Sponge grounds support areas of high biodiversity (Klitgaard and Tendal, 2004; Murillo et al., 2012; Hawkes et al., 2019), act as nurseries for many fish species (Klitgaard, 1995; Freese and Wing, 2003), and can influence primary production by controlling nutrient availability (Bell, 2008; Maldonado et al., 2012; Murillo et al., 2012; Kutti et al., 2013; Maldonado, 2016). This ecological importance is complimented by their economic potential from bioengineering (Wu et al., 2019) and novel chemicals for pharmaceutical applications (Koopmans et al., 2009; Anjum et al., 2016). However, despite their ecological and socioeconomic importance, sponges are vulnerable to anthropogenic stressors such as trawl fishing (Kenchington et al., 2014; Pusceddu et al., 2014; Victorero et al., 2018) and oil and gas activities (Vad et al., 2018). Sponge ground locations and densities need to be known, in order to quantify their distribution and function, and—ultimately—protect the critical habitats that they form. In the deep-sea, observational data are very limited due to the difficulties in conducting science at depth, such as the cost and limited field-of-view of remotely operated vehicles (Henry and Roberts, 2014a, b; Howell et al., 2014). Computational models can be used to interpolate and quantitatively predict sponge distribution, helping to circumvent the challenges involved in understanding the factors that control sponge distribution. The large (basin) scale distribution of sponge grounds in the North Atlantic has been studied. However, sponge distribution and density within deep-sea sponge grounds has been understudied and remains poorly constrained (Klitgaard and Tendal, 2004; Cathalot et al., 2015; Kazanidis et al., 2019).
Studies on sponge density and distribution in shallow water environments have been carried out using standard ecology survey techniques, with multiple studies across environments and latitudes (Wilkinson and Evans, 1989; Roberts and Davis, 1996; Xavier and van Soest, 2012). However, the major drivers of these distribution patterns such as wave damage, water opacity, and light levels do not operate in the deep-sea. Empirical analysis of localized distribution in deep-sea sponge grounds is very limited with most data being purely observational or on species occurrence only (Henry and Roberts, 2014a). Studies of sponge density have been carried out in the Faroe-Shetland Channel where fisheries pressure and substrate type (sand, gravel, cobble) were statistically significant factors (Kazanidis et al., 2019). However, a host of other chemical oceanographic variables (silicic acid, temperature, etc.) also exhibited strong controls over sponge density (Kazanidis et al., 2019). The influence of multiple forcing mechanisms results in significant challenges in scaling-up from a small number of observational data points to whole-basin sponge ground densities using oceanographic variables (Howell et al., 2016). Creating mathematical simulations of current conditions in the deep sea allows us to explore whether the observed distribution of sponges is related to prevailing currents. This in turn provides possible explanation of the patterns seen which could be scaled up to infer large-scale distributions. The simulations of the observed sponge grounds also allow a more detailed investigation of the small-scale flow patterns that would not be possible to measure the field, with the potential to increase our understanding of this important and understudied habitat.
Patterns of deep-sea sponge distribution and density have been attributed to several factors in large scale biogeographic studies. The primary drivers of sponge distribution are thought to be silicic acid concentration (Beazley et al., 2015; Howell et al., 2016) temperature, depth (Rice et al., 1990; Bett, 2001; Murillo et al., 2012), and particulate carbon availability (Barthel et al., 1996; Howell et al., 2016), in addition to topography, internal waves, and current speeds which control flow conditions at the seafloor (Klitgaard and Tendal, 2004; Howell et al., 2016). It would be logical to assume these factors would also play a role at the smaller scale and that sponge distribution would potentially be optimized to improve their localized conditions (Kutti et al., 2013). The arrangement of organisms can affect the flow around individuals, either spacing themselves the maximum distance from each other to receive the greatest unprocessed flow potential, or clustering to slow the flow for potentially greater particle dropout or protection from damage. These patterns in distribution are seen abundantly in nature such as in corals (Chindapol et al., 2013; Cresswell et al., 2017) and terrestrially in trees (Holtmeier and Broll, 2017).
Here, we will investigate whether the patterns of density and distribution at small spatial scales in four different sponge grounds in the Labrador Sea are linked to the prevailing flow conditions, and will explore possible explanations for the patterns observed. We discuss the implications and possible explanations of our results, as well as their potential impacts on the greater understanding of the role and sensitivity of sponge grounds in the deep-sea.
Materials and Methods
Sponge Ground Imaging
Sponge ground images were recorded on the DY081 RRS Discovery cruise summer 2017 at three locations: Orphan Knoll, Nuuk, and Southwest Greenland (SWGL) (Figure 1) each chosen due to their differing water mass interactions. High-definition video was recorded via Remotely Operated Vehicle (UK National Marine Facilities ROV Isis) using a fixed view Scorpio camera. Images were recorded from a typical height of 1 m above the sea floor, with the field of view varying in width between 1 and 3 m. Lasers were attached to the Scorpio camera at 10 cm spacing so scale could be accurately resolved from images. The study areas were randomly selected within each location. A single study area was chosen for Nuuk (Figures 1, 2A) and SWGL Localities (Figures 1, 2B), which were uniform in depth and have no dominant species. Two study areas were assigned at Orphan Knoll, due to the presence of two distinct sponge grounds at separate depths characterized by different dominant groups. These are (i) a Geodia dominated sponge ground (GOK; Figures 1, 2C) and (ii) a hexactinellid dominated sponge ground (HOK; Figures 1, 2D) at greater depth. Still images were the taken from the video at 2 s intervals which was sufficient to ensure that typically 30 individual, overlapping images were available to create a digital surface model of between 3 and 5 m in length.
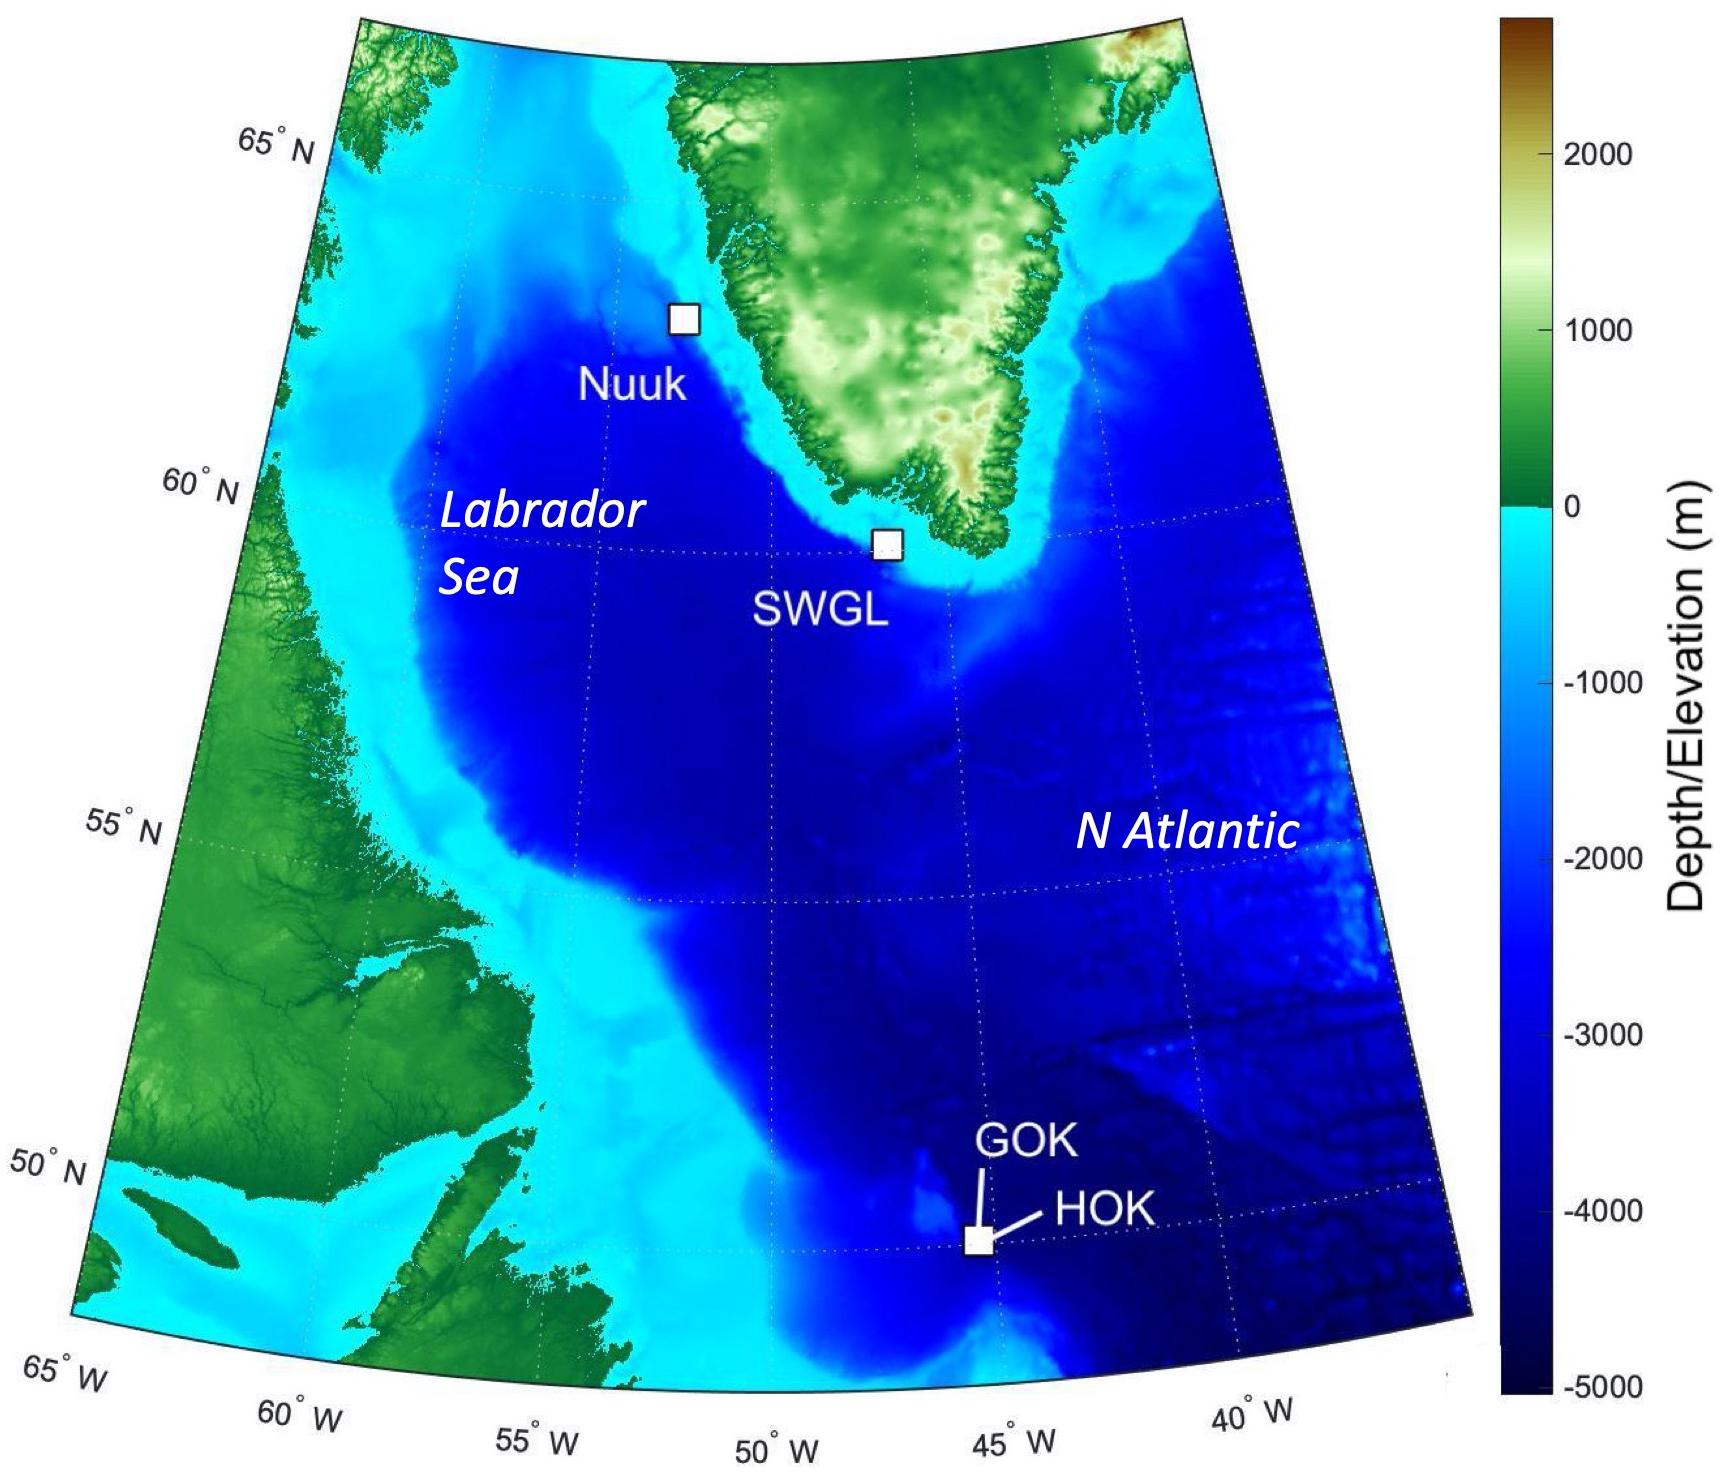
Figure 1. Overview map showing the position and depth of the four localities Nuuk, Southwest Greenland (SWGL), Geodia dominated sponge ground at Orphan Knoll (GOK), and hexactinellid dominated sponge ground at Orphan Knoll (HOK) from the DY081 Cruise in the Labrador Sea. Bathymetry used is from ETOPO1 model from https://www.ngdc.noaa.gov/mgg/global/.
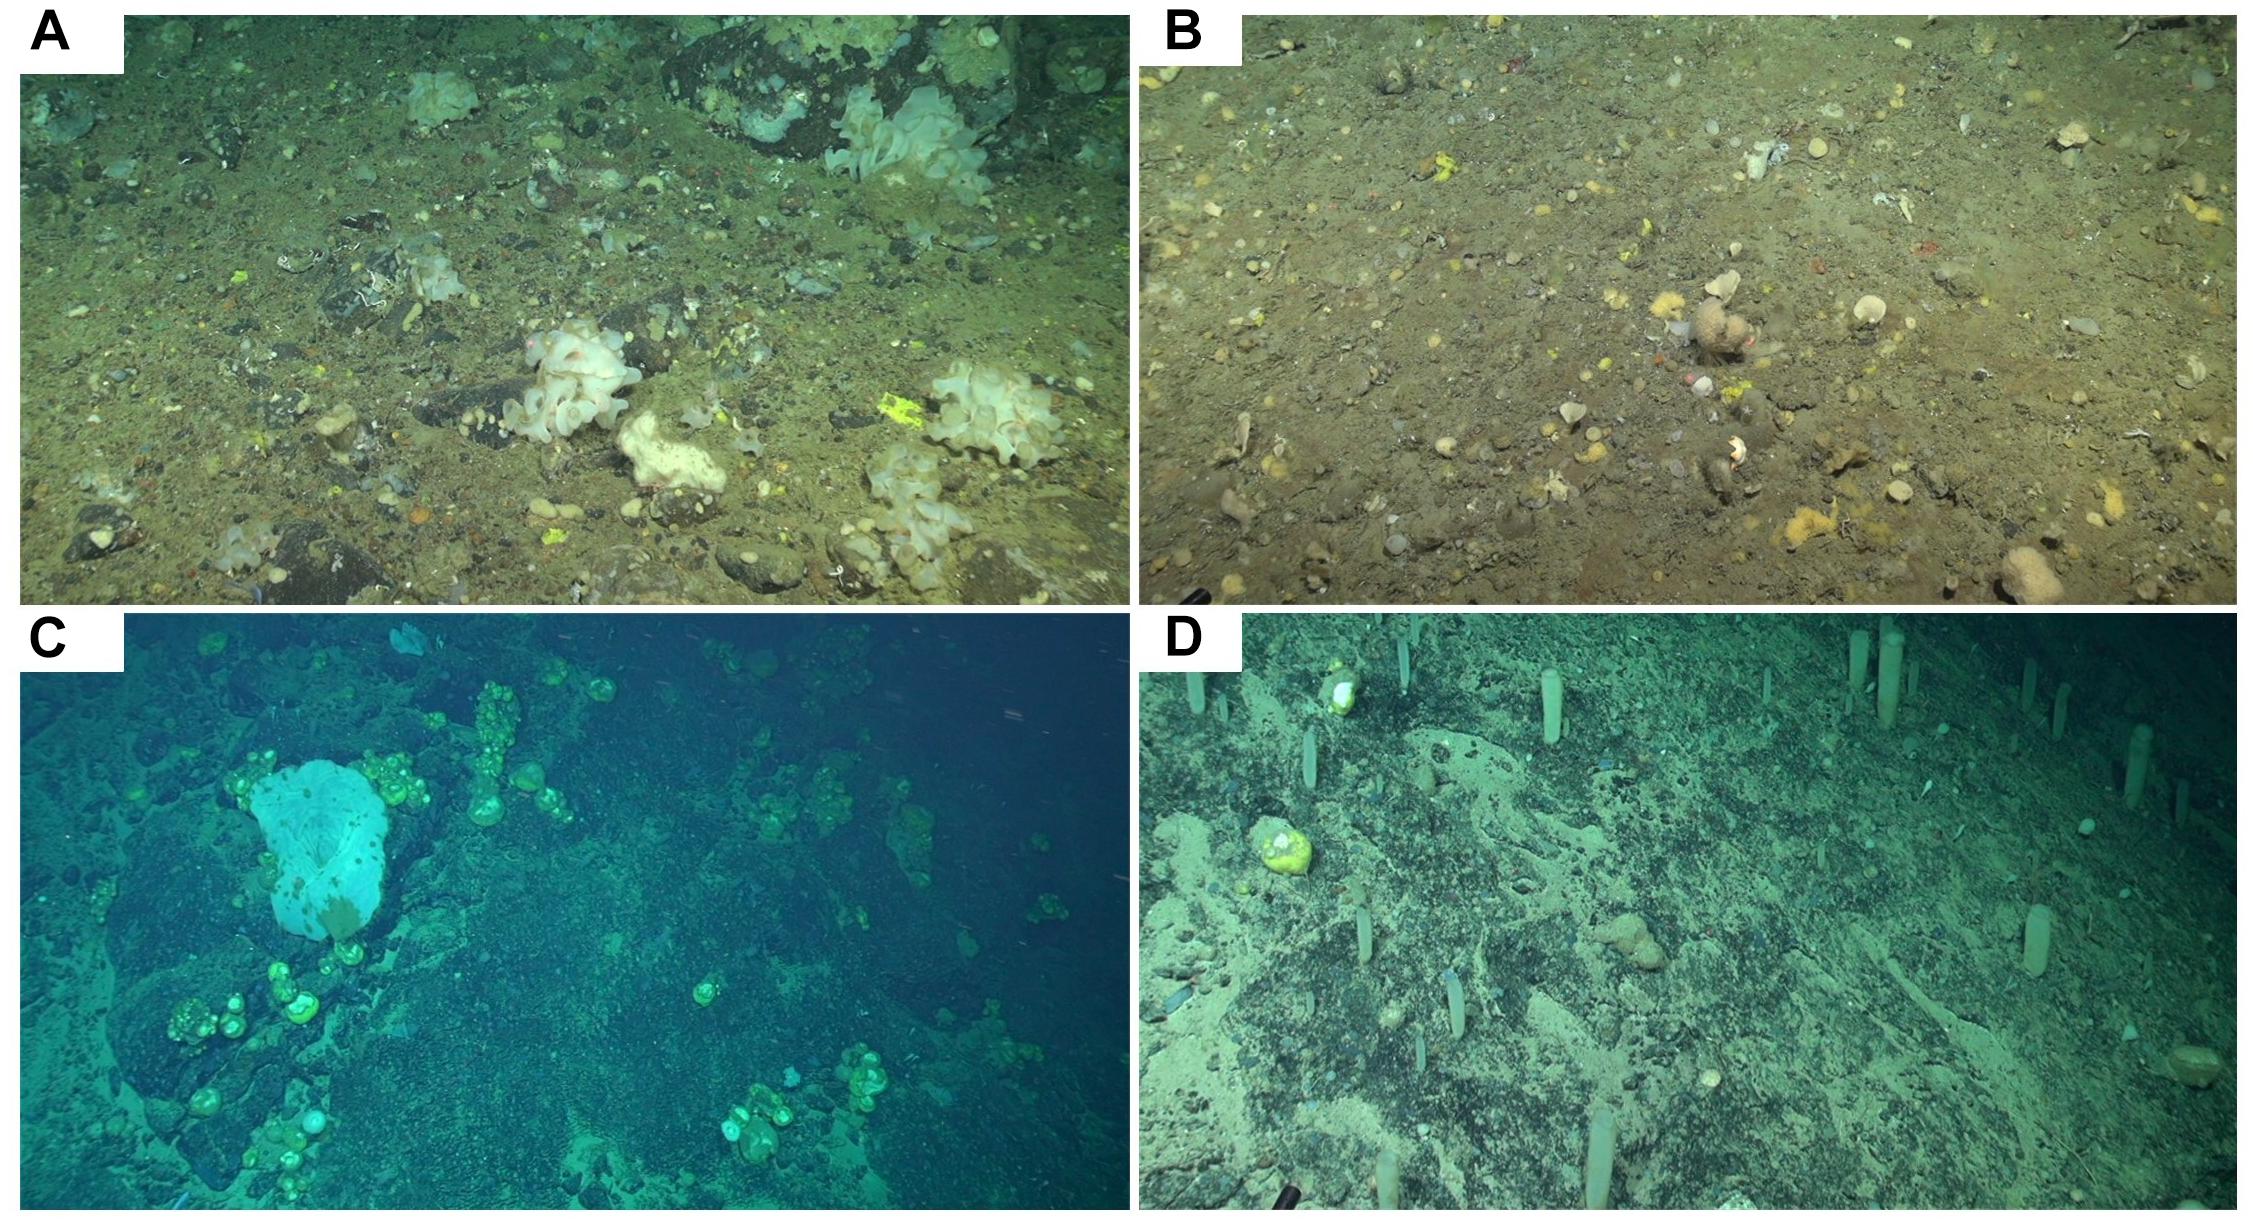
Figure 2. ROV Image of the four study areas from the DY081 Cruise (A) Nuuk, (B) SWGL, (C) GOK, and (D) HOK. Red laser scale makers are 10 cm apart.
Digital Surface Model
Surface mesh models were created from sets of images for each study area using photogrammetry. Agisoft PhotoScan software was used to align the images and create a 3D surface mesh using structure-form-motion algorithms (Westoby et al., 2012); the SGM algorithm (Hirschmüller, 2005) and scale invariant feature transform (SIFT) operator (Lowe, 2004). A scaled 3D surface mesh was exported as a.stl file and a 2D point cloud map of sponge locations exported as a point pattern dataset. The 3D surface mesh was converted using AutoCAD Software to AutoCAD Drawing format to use as a solid boundary in COMSOL Multiphysics flow modeling simulations.
Clustering Analysis
A point pattern map for each locality was input into RStudio, such that each point represents the position of an individual sponge. Multi-distance spatial cluster analysis was carried out using Ripleys K functions (Ripley, 1976, 1977, 1981). The K-function is defined by:
Where dij is the Euclidean distance between ith and jth points in a dataset of n points, t is the search radius, λ is the average density of points (generally estimated as n/A, where I is the area which contains all the points), and πt2is the indicator function (1 if its operand is true, otherwise 0). K(d) approximates πt2 if the points are homogenous with the region. This radial spatial analysis can become unrepresentative when applied close to the edges of the domain, because of the truncation of information at the edge. We used periodic boundary conditions (such that an edge of the domain is joined to its opposite edge and analysis treats this as a continuous surface) to eliminate the edge effect, which may have been significant given the narrow transects. Upper and lower bounds of confidence of statistical significance were produced using Monte Carlo simulations. Monte Carlo simulations randomly generate a distribution of points equal to the number of input points. Multiple simulations were run and used to ensure clustering patterns were not due to random variation (at the 95% confidence level).
Fluid Flow Finite Element Analysis
We modeled the flow around idealized sponge shapes and around the 3D surface models of the sponge ground study areas using the finite-element package Comsol Multiphysics 5.1. The dimensions of the idealized sponge shapes were based on average sponge sizes of geodia and Euplectella species collected on the DY081 Cruise. The flow field was described using the Reynolds-averaged Navier–Stokes (RANS) equations coupled with the K-epsilon (K-ε) Turbulence model (Hanjaliæ and Launder, 1972). The flow was computed using the 3D surface meshes generated from photogrammetry, with a no-slip basal boundary condition, open boundaries (zero viscous stress condition) for those perpendicular to flow, downstream and upper boundaries, and a uniform inflow velocity at the upstream end. Initial flow conditions within the model area for the simulation calculations were set as a steady flow equal in velocity to that of the inflow. Surface models were orientated so the simulated flow matched the observed current direction over the sea floor recorded at the time of the ROV survey.
A mesh was created using free tetrahedral elements for the geometries using the finite element mesher by Comsol. A coarse mesh was used to enable an efficient exploration of model parameter space, with some simulations being run at finer mesh resolution to ensure grid scale independence for the simulation results. The inbuilt material properties for water were used with fixed solid geometry for the idealized simulations. In all cases, three-dimensional, incompressible (constant density) flow of water was simulated with idealized structures and sea floor reconstructions were held stationary.
Inlet and initial flow speed were varied between 0.1 and 1 m/s in 0.1 m/s intervals (Reynolds numbers for all simulation fall between approximately 1.53 × 10⁵ and 7.5 × 10⁶). The volumetric flow rate used was matched to the mean bottom flow rates observed using the sonde on the DY081 RRS Discovery cruise (Hendry, 2017) and the range based on year-round observations from Orphan Knoll (Greenan et al., 2010). A stationary solver was used to compute the steady-state flow patterns and a Turbulent flow k-ε model was used to solve the RANS equations and conservation of mass.
An initial simulation of three-dimensional flow around a sphere was used to benchmark the main Comsol simulations. The benchmarking method laid out in Nita and Allaire (2017) was used with drag coefficients for the flow around the sphere being in the range of 0.46–0.5 to verify the robustness of the numerical method used. Results were visualized as two-dimensional cross sections of flow velocity magnitude and wake length, and diameters were plotted against height and diameter for the idealized simulations.
Results
Clustering Analysis
All study areas exhibited non-random (p < 0.05) sponge distribution patterns, with variation in the presentation of distribution between sites (Figure 3). The SWGL (Figure 3D) and GOK (Figure 3C) sites exhibited similar patterns of distribution. Individual sponges cluster together at distances of 0.1–1.2 m and the distribution becomes more uniform at distances greater than 1.4 m indicating that they form dense, sparse clusters. The HOK (Figure 3A) site shows a very strong clustering pattern within the study area, although there is a random distribution at distances less than 0.25 m. The Nuuk (Figure 3B) study site in contrast exhibits a consistent non-random but weak dispersion patterning.
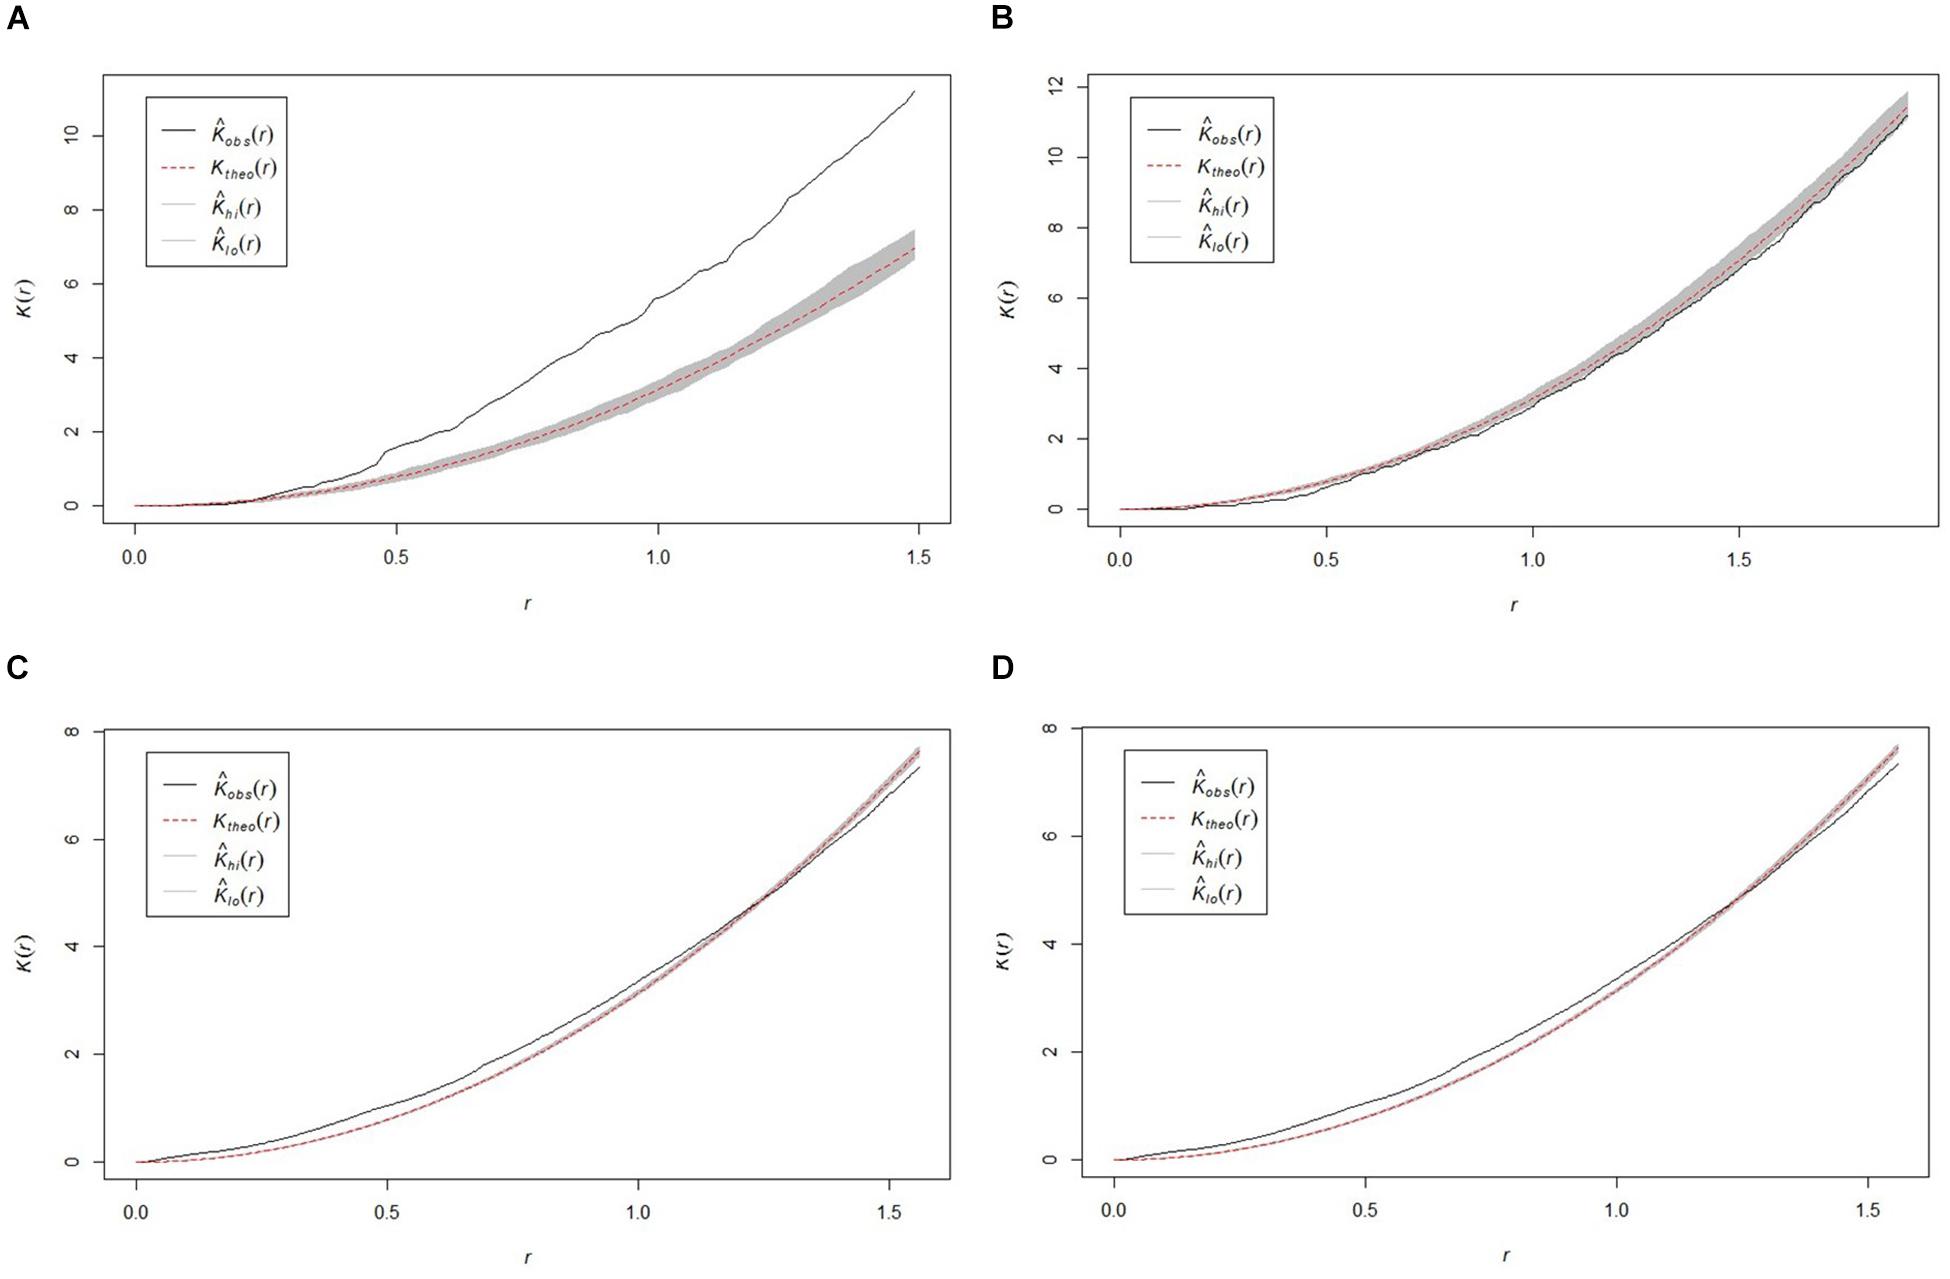
Figure 3. Plots of the Ripley K function clustering analysis (K) for the four study areas (A) HOK study area, (B) Nuuk study area, (C) GOK study area, and (D) SWGL study area. Observed value for K [Kobs(r)] theoretical random distribution value for K [Ktheo(r)] < 95% confidence limit of random distribution between upper confidence bound [KHi(r)] and lower confidence bound [Klo(r)].
Models of Flow Around Idealized Sponge Morphologies
We initially used two simplified shapes to represent sponge morphology: a sphere and an ellipsoid. For both the spherical structure (Figure 4) and the ellipsoidal structure (Figure 5), the same patterns of wake (downstream regions of reduced flow velocity) are produced. There is a direct correlation between structure height and length of the initial wake, as well as the diameter of the wake and diameter of the structure (Figure 6). Wake length and diameter are mostly unaffected by flow speed with the changes of flow speeds within the wake being directly proportional to the changes to the ambient flow speed (Figure 6). The length of the effective slowing due to the wake is approximately 10 times the height of the structure, which is similar to wake lengths of submerged hemispherical objects (Shamloo et al., 2001). Beyond this wake region, the near-wall flow velocities are similar to those upstream. A second feature of both models is the presence of an area of lower velocity upstream and around the sides of the sponge structure caused by flow separation, which increases in size at high velocities (Figures 4, 5). These initial tests indicate that, for the sponge spacings (up to 1.4/m2) and heights (up to 0.5 m) in the four study areas, we expect the wakes of the sponges to be interacting and influencing the flow conditions.
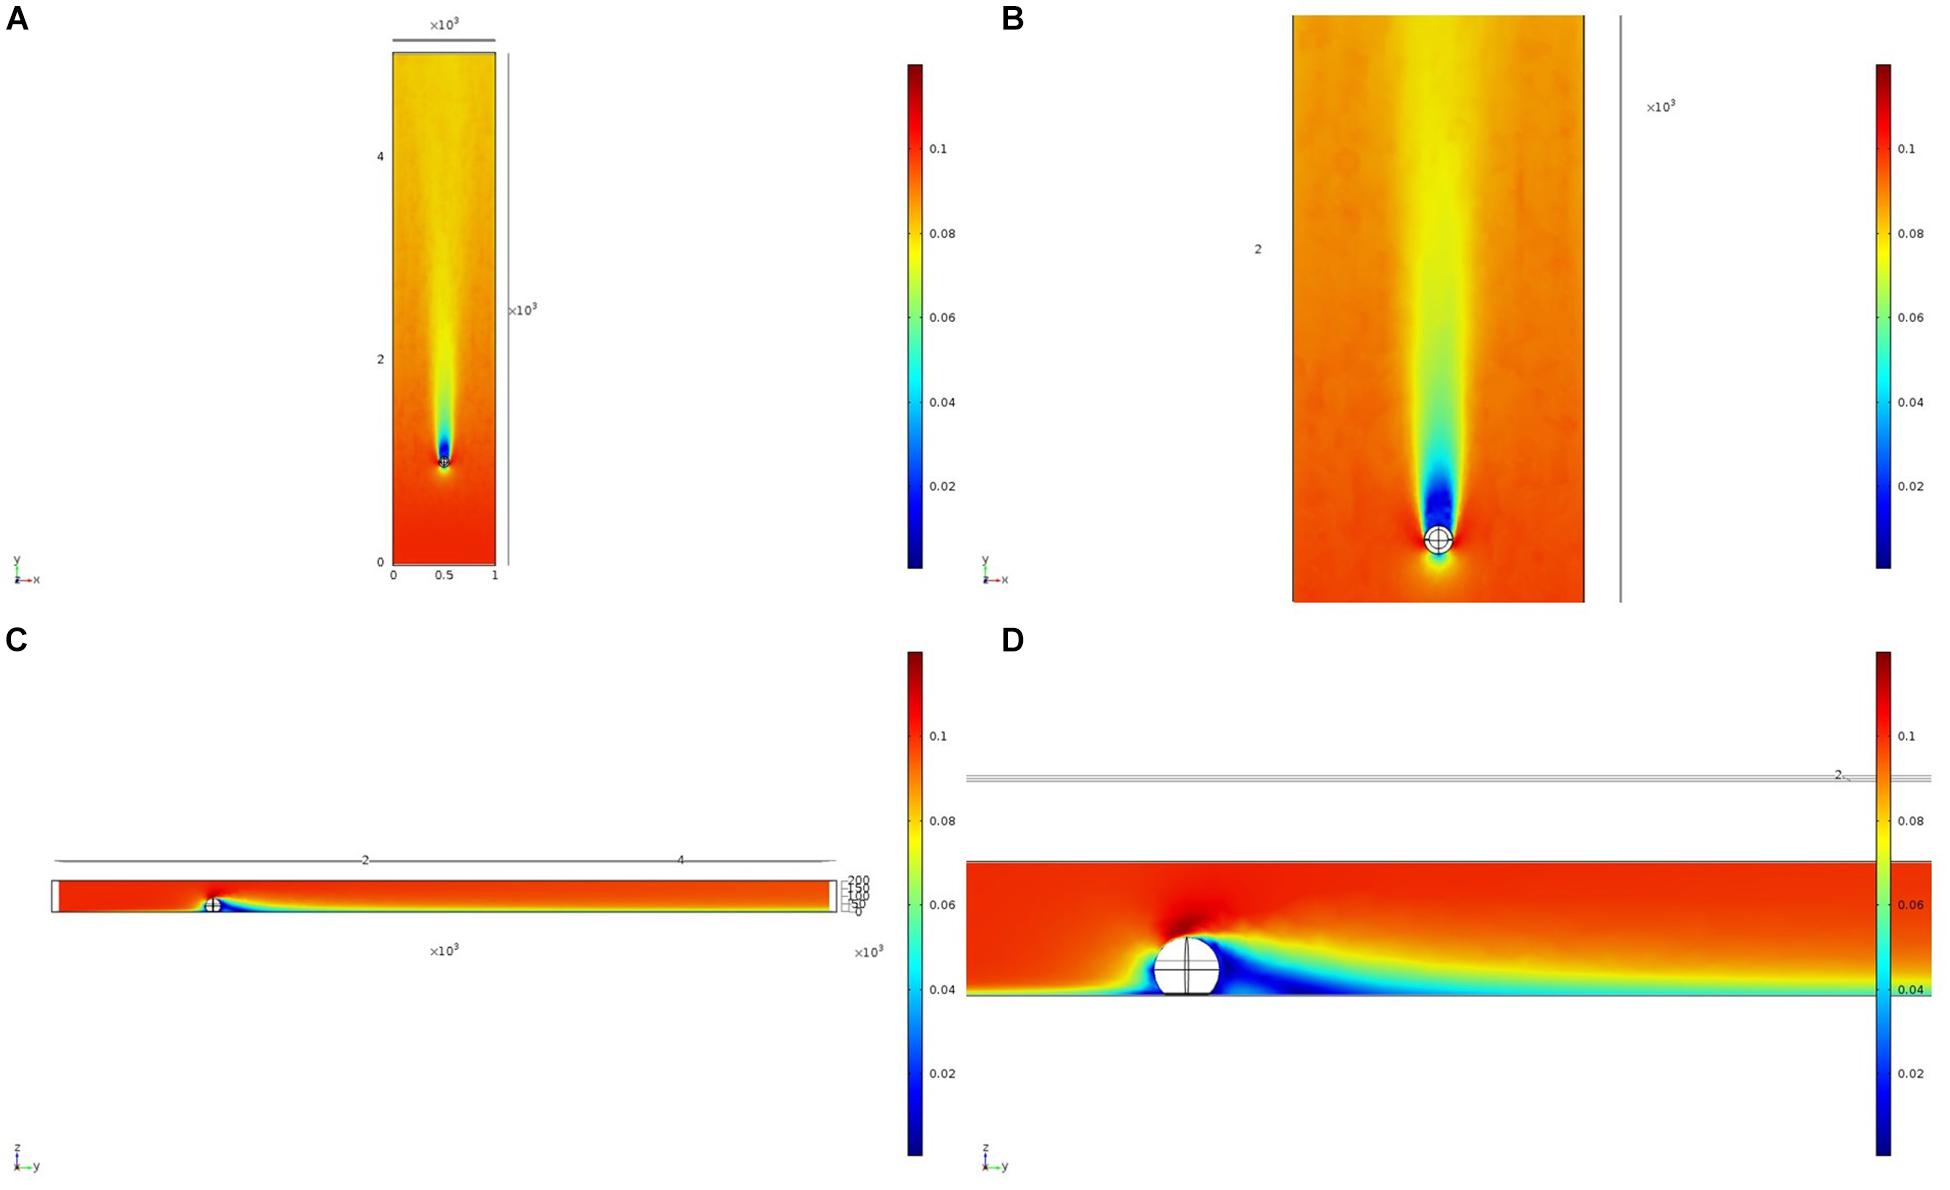
Figure 4. Results of the fluid flow finite element analysis simulation for an idealized sphere, visualized as two-dimensional plots [horizontal (A,B) and vertical (C,D) cross sections] of flow velocity magnitude (false-color scales m/s). Scale in mm with ambient flow of 0.1 m/s along the y-axis. (B,D) Zoom in on the wake close to the sphere.
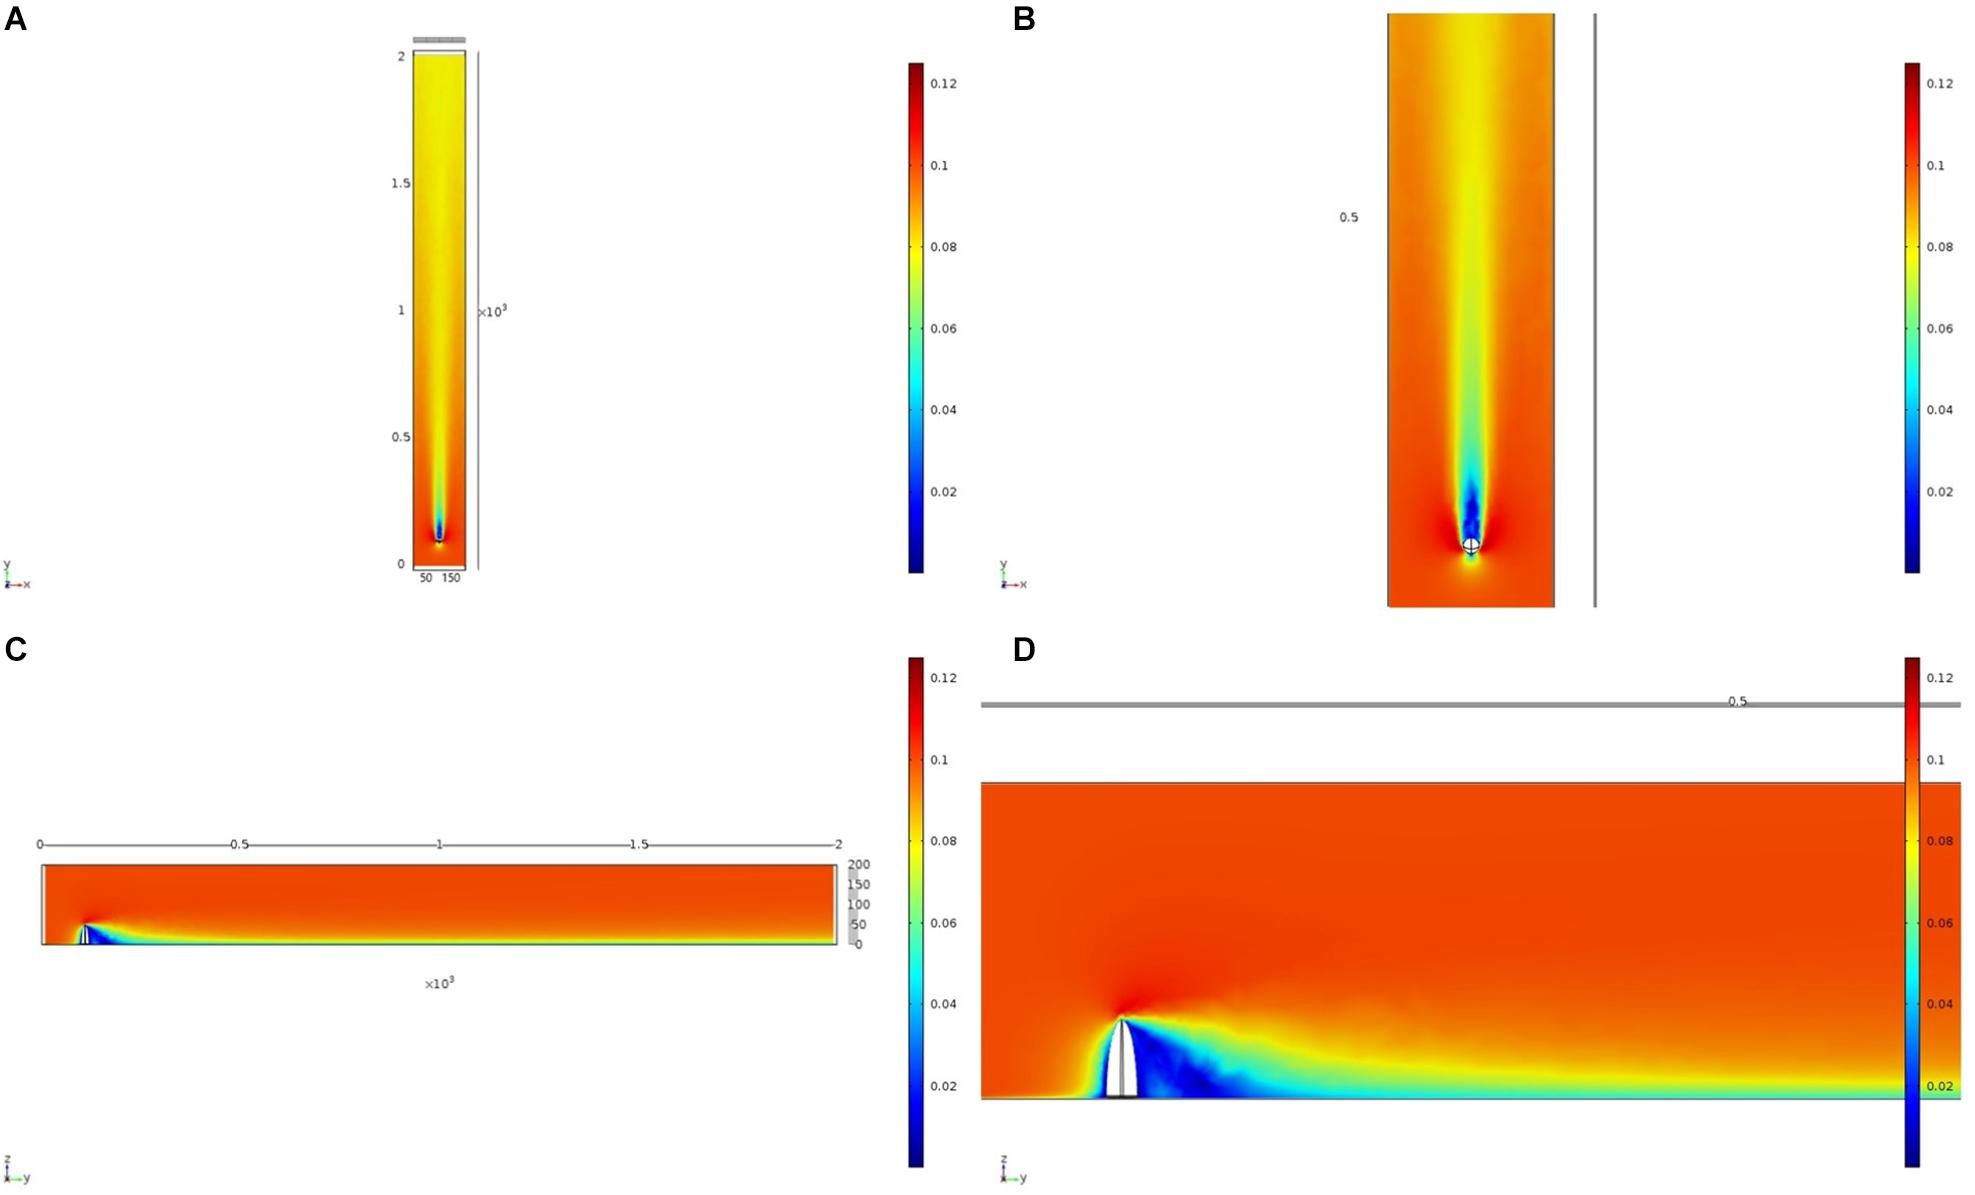
Figure 5. Results of the fluid flow finite element analysis simulation for an idealized ellipsoid, visualized as two-dimensional plots [horizontal (A,B) and vertical (C,D) cross sections] of flow velocity magnitude (false-color scales m/s). Scale in mm with ambient flow of 0.1 m/s along the y-axis. (B,D) Zoom in on the wake close to the ellipsoid.
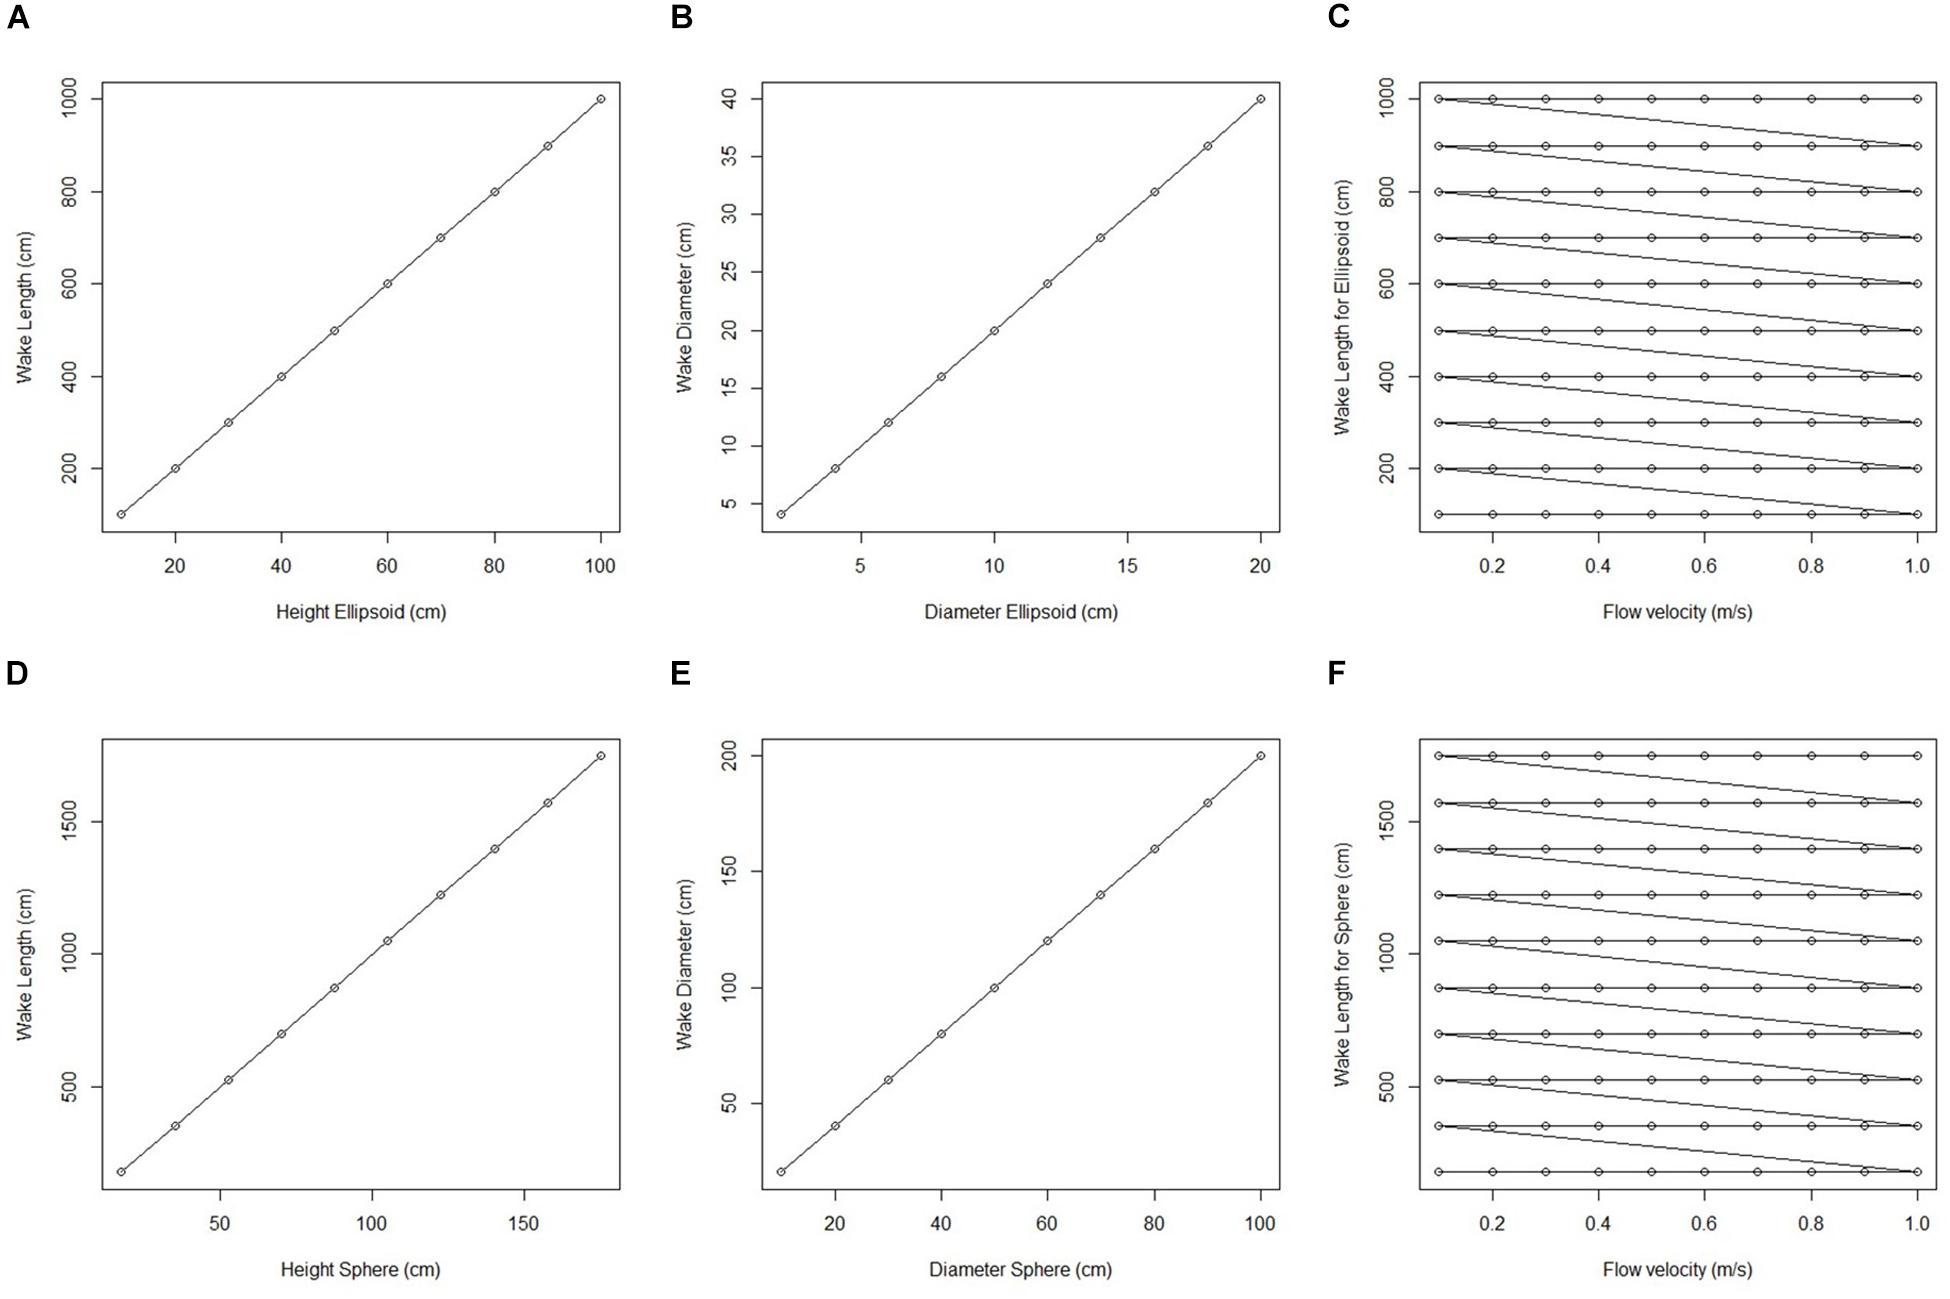
Figure 6. Plots of wake dimension, object dimension and flow speed taken from fluid flow finite element analysis simulation for an idealized sphere and ellipsoid. (A) Wake length (cm) plotted against ellipsoid hight (cm). (B) Wake diameter (cm) plotted against ellipsoid diameter (cm). (C) Wake length for all ellipsoid simulations (cm) plotted against corresponding flow velocity (m/s). (D) Wake length (cm) plotted against sphere height (cm). (E) Wake diameter (cm) plotted against sphere diameter (cm). (F) Wake length for all sphere simulations (cm) plotted against corresponding flow velocity (m/s).
Models of Flow at the Study Area
For each of the study areas, we ran simulations with sponges in situ and removed. Individual sponges created wakes that were significantly deeper than the boundary layer resulting from flow over the sea floor topography. The structures in the Nuuk study area (Figure 7) produced a boundary layer of similar height to that of the seafloor topography boundary layer but with a significantly slower velocity, which appears reduced by approximately 50% from the same point within the boundary layer. The area of wake influence from each sponge structure extends horizontally in a narrow cone pattern but the distance between each structure is such that a coherent and continuous boundary layer is produced, with properties set by the sponge height and spacing. Both SWGL (Figure 8) and HOK (Figure 9) sites show similar flow patterns as the Nuuk site but with slightly thinner boundary layers. Both SWGL and HOK have clusters of sponge structures sitting within small depressions causing the sheltering effect of the topography to make a greater contribution to the overall flow pattern. The GOK site (Figure 10) differs due to the prominence of a single large sponge > 0.5 m in diameter and height. The flow patterns around the large sponge result in a significantly sheltered area where smaller sponges are clustering. There are other small clusters of medium-sized sponges causing localized areas of low flow. However, an extensive coherent boundary layer is not observed.
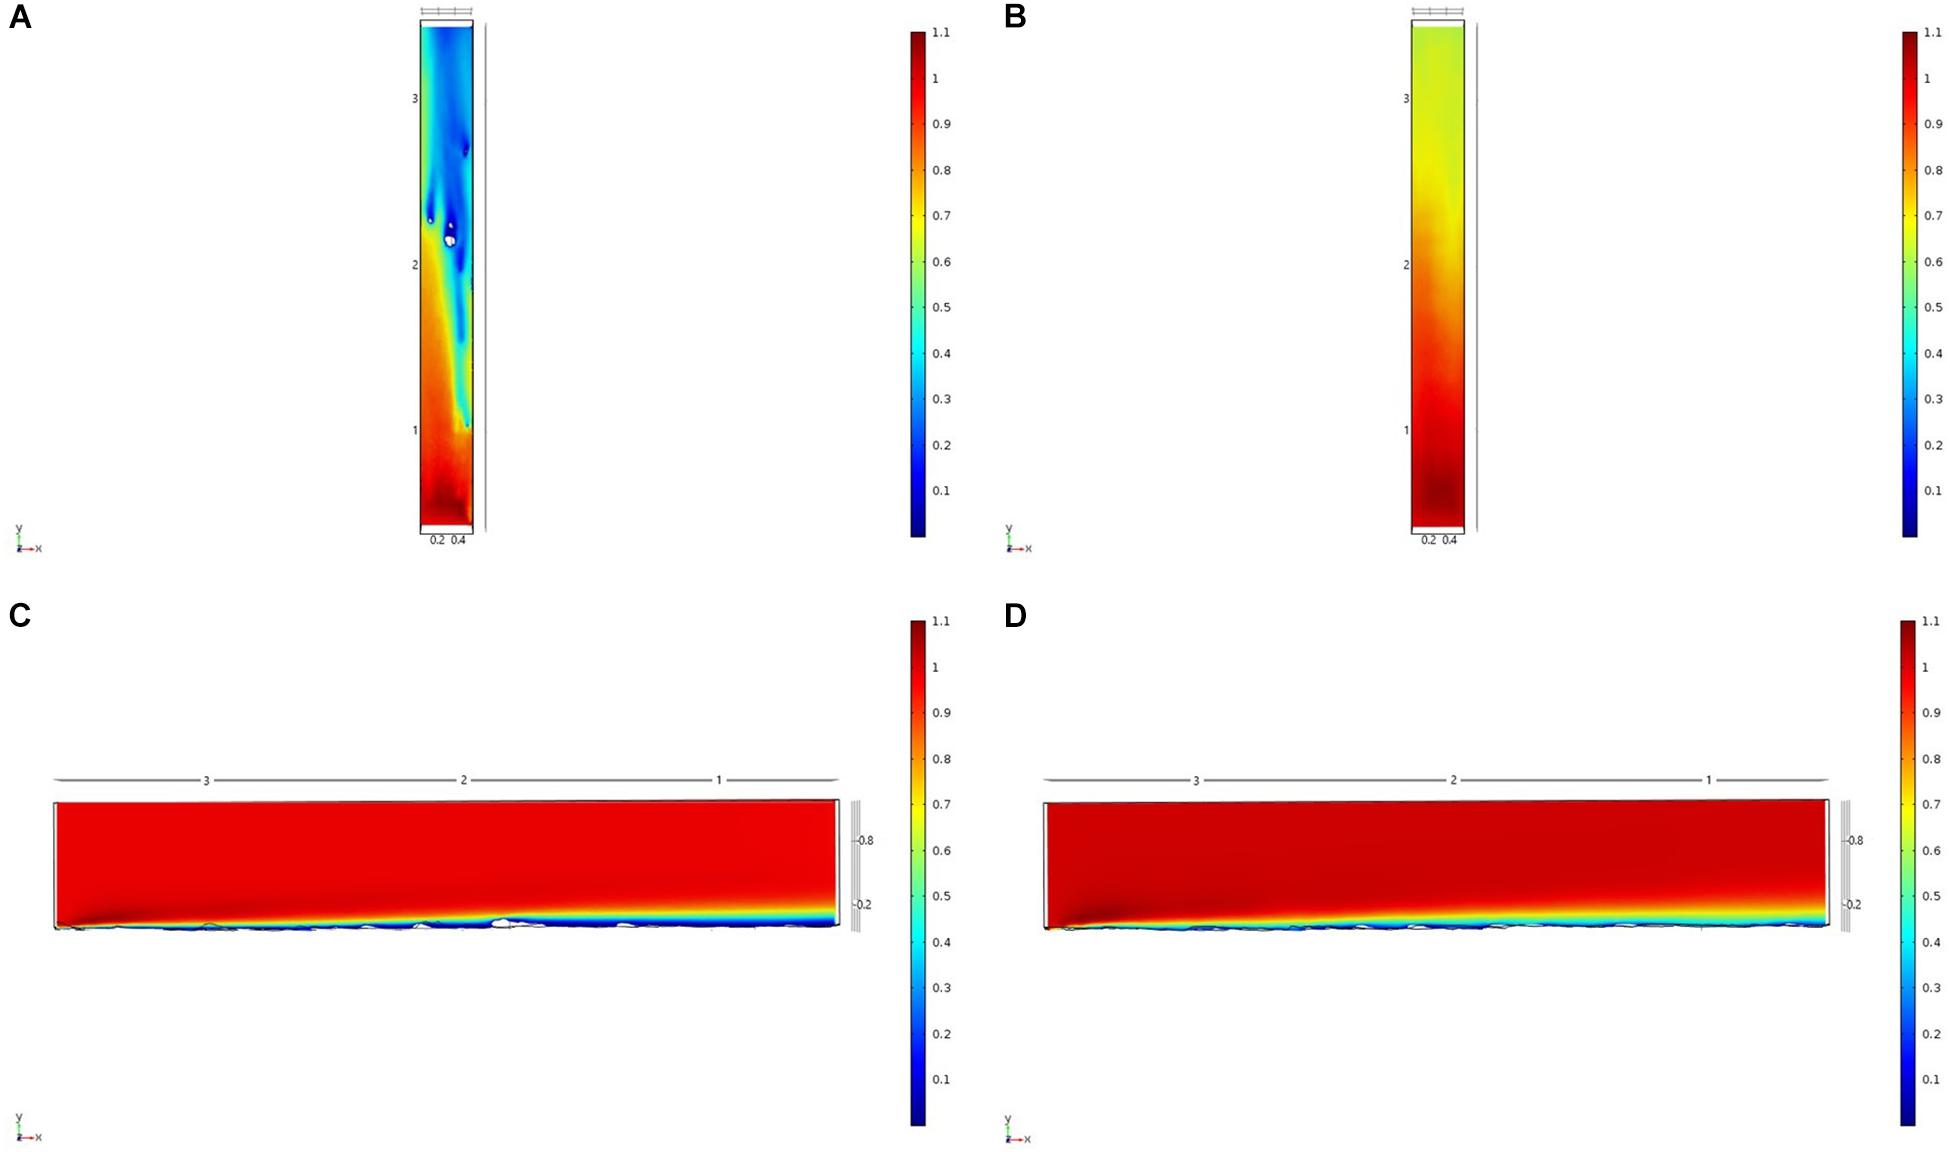
Figure 7. Results of the fluid flow finite element analysis simulation for surface models for Nuuk Study area visualized as two-dimensional plots (horizontal and vertical cross sections) of flow velocity magnitude (false-color scales m/s). (A,C) Surface model with sponges present (B,D) surface model with sponge structures removed. Scale in m with ambient flow of 1 m/s along the y-axis.
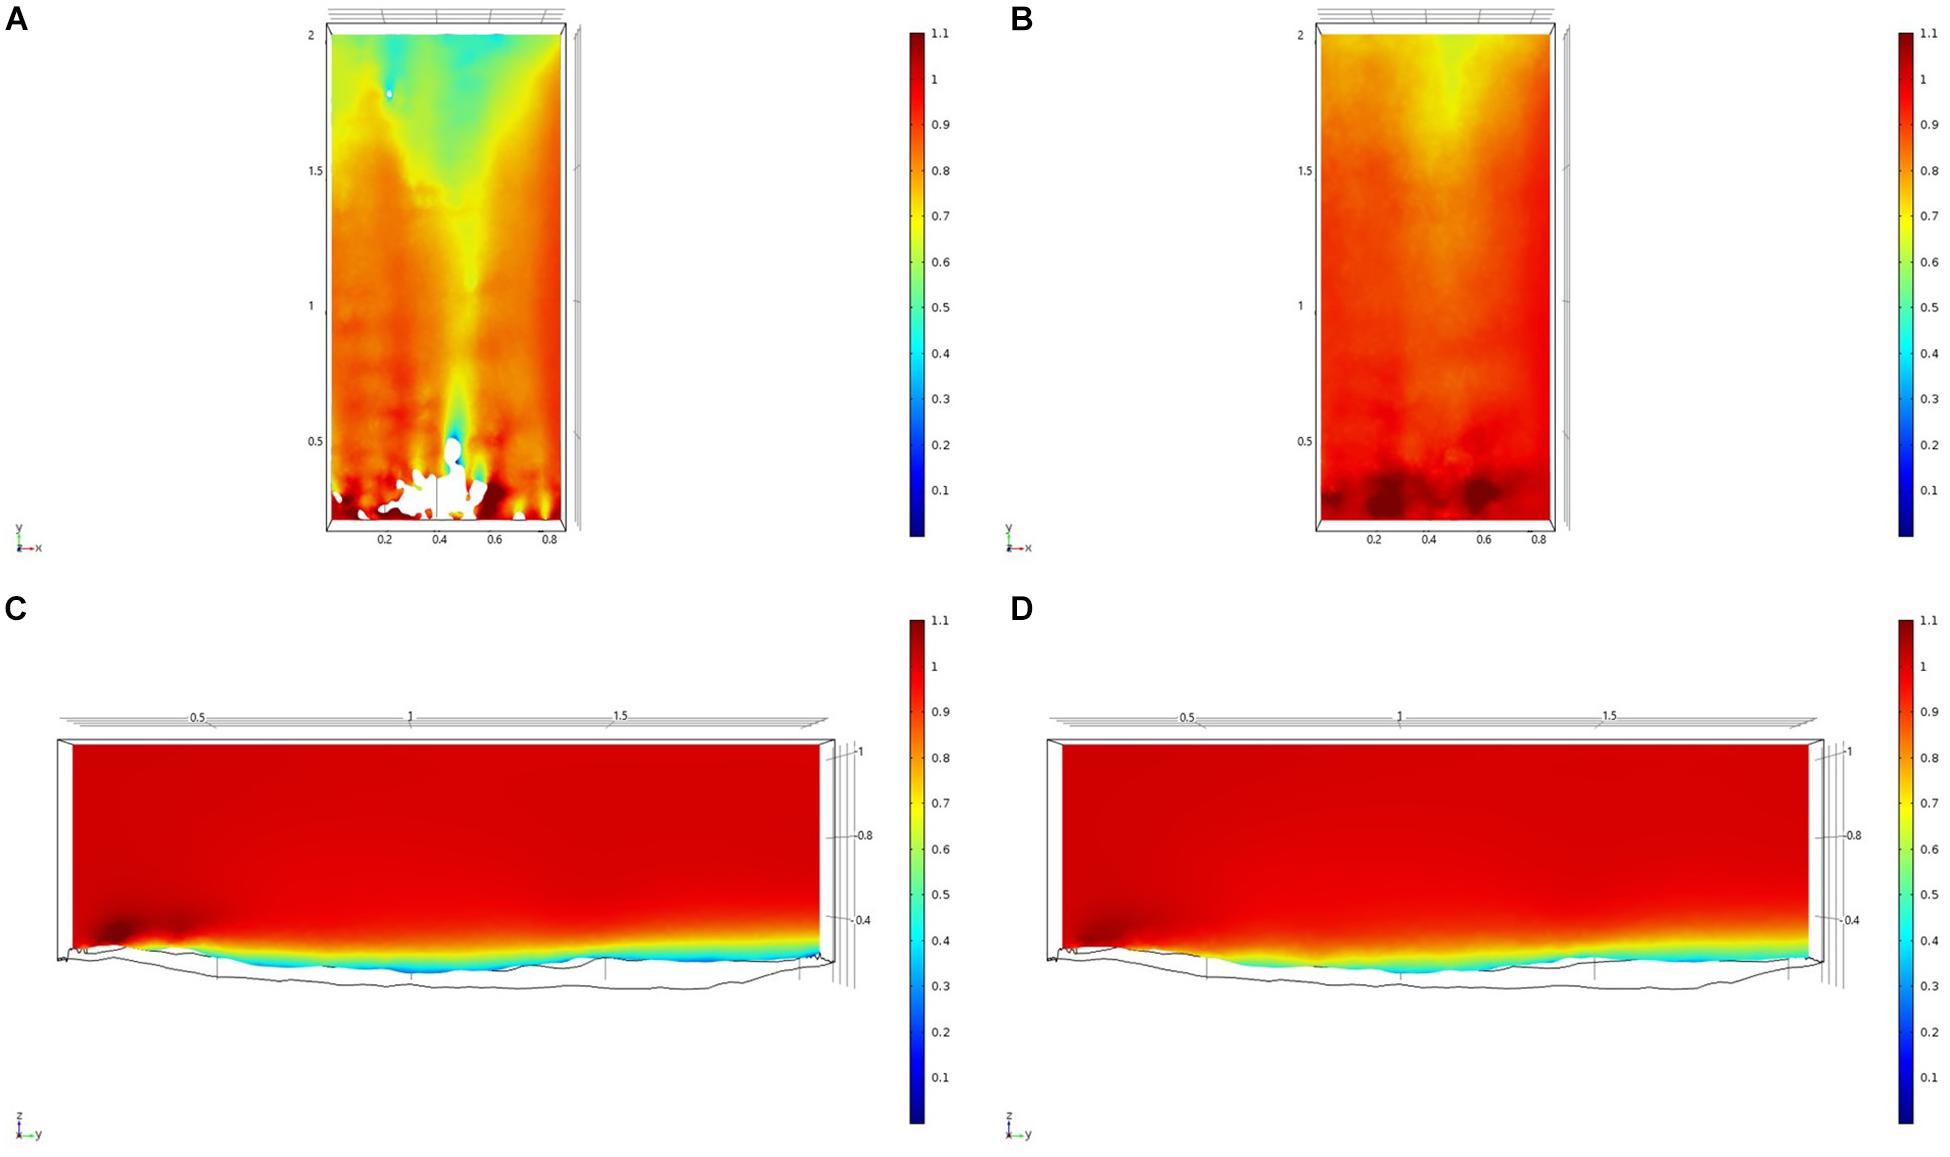
Figure 8. Results of the fluid flow finite element analysis simulation for surface models for SWGL Study area visualized as two-dimensional plots (horizontal and vertical cross sections) of flow velocity magnitude (false-color scales m/s). (A,C) Surface model with sponges present. (B,D) Surface model with sponge structures removed. Scale in m with ambient flow of 1 m/s along the y-axis.
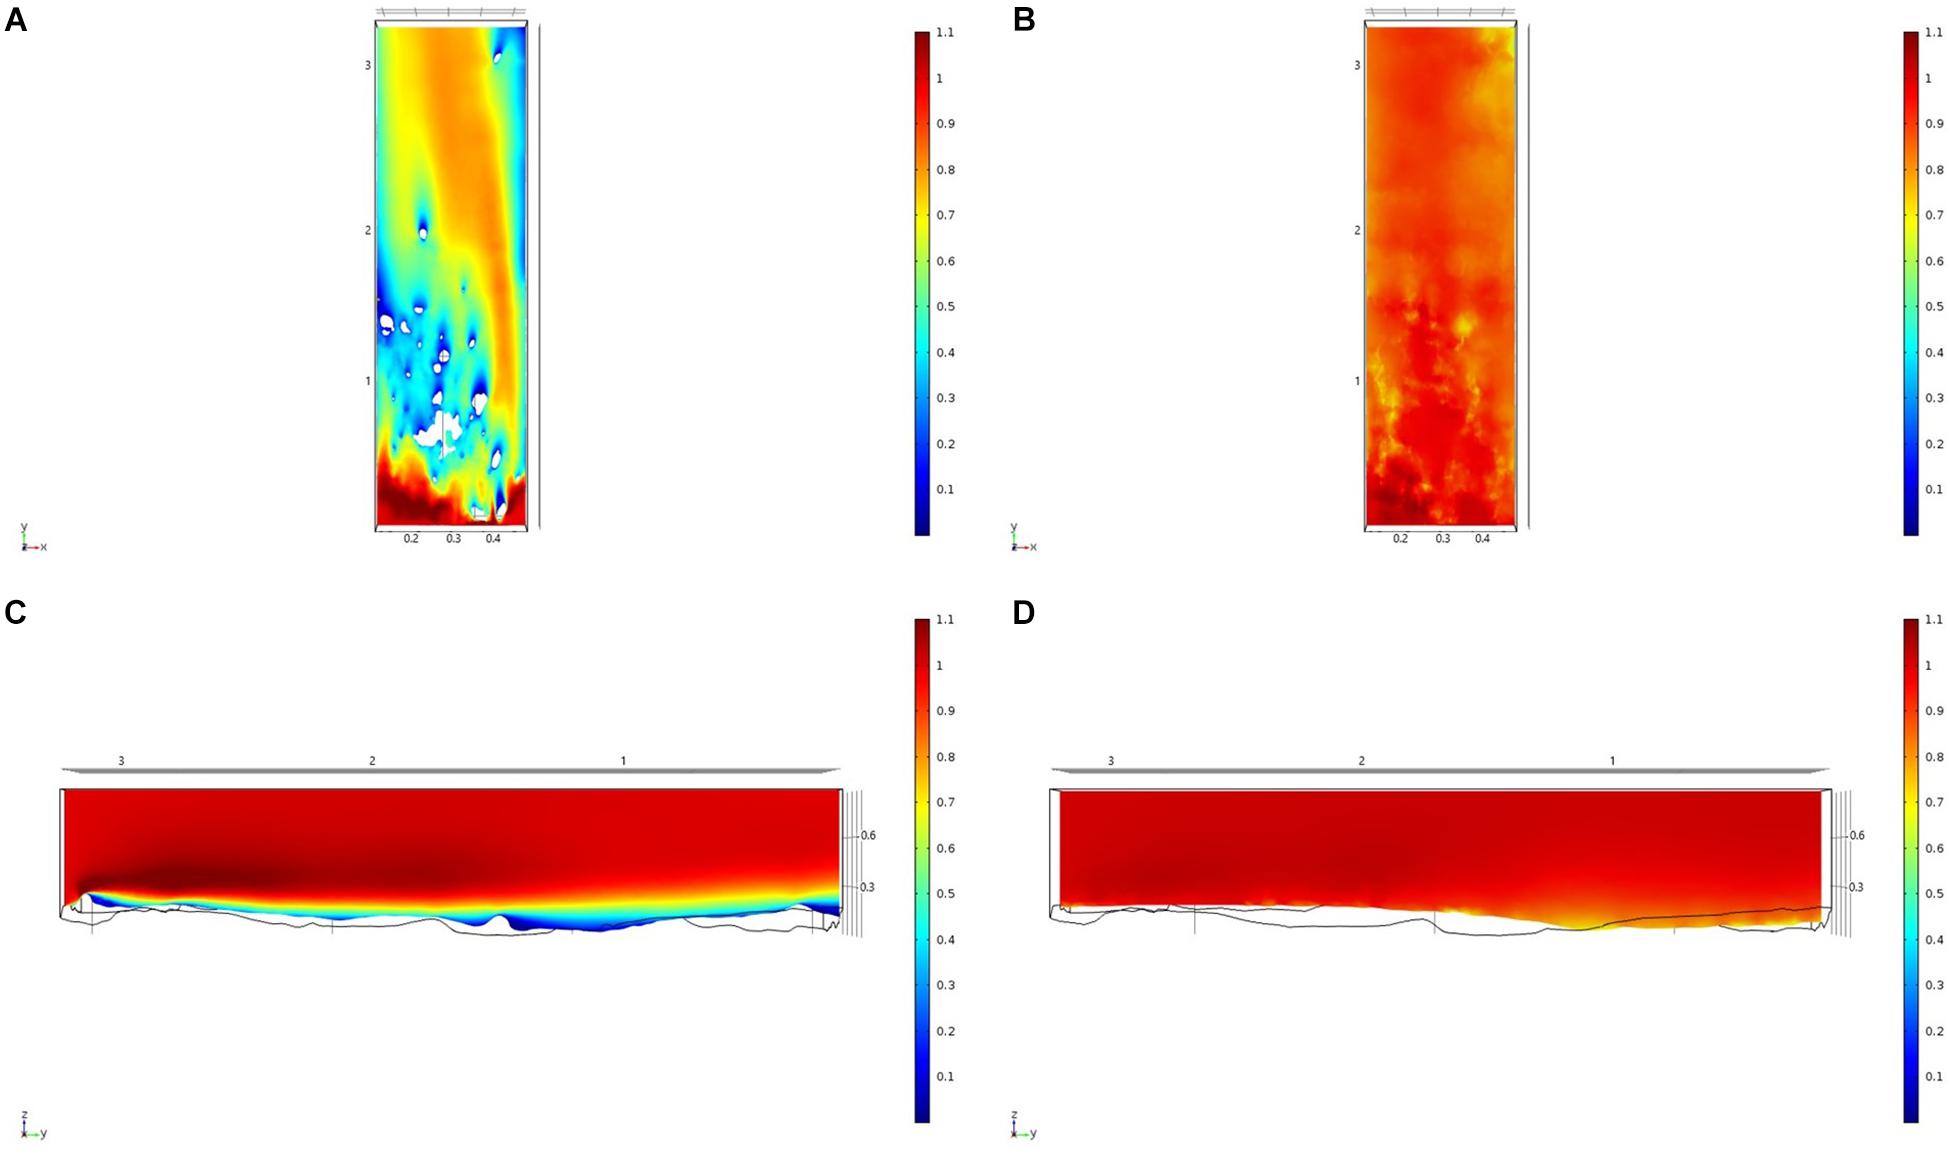
Figure 9. Results of the fluid flow finite element analysis simulation for surface models for HOK Study area visualized as two-dimensional plots (horizontal and vertical cross sections) of flow velocity magnitude (false-color scales m/s). (A,C) Surface model with sponges present. (B,D) Surface model with sponge structures removed. Scale in m with ambient flow of 1 m/s along the y-axis.
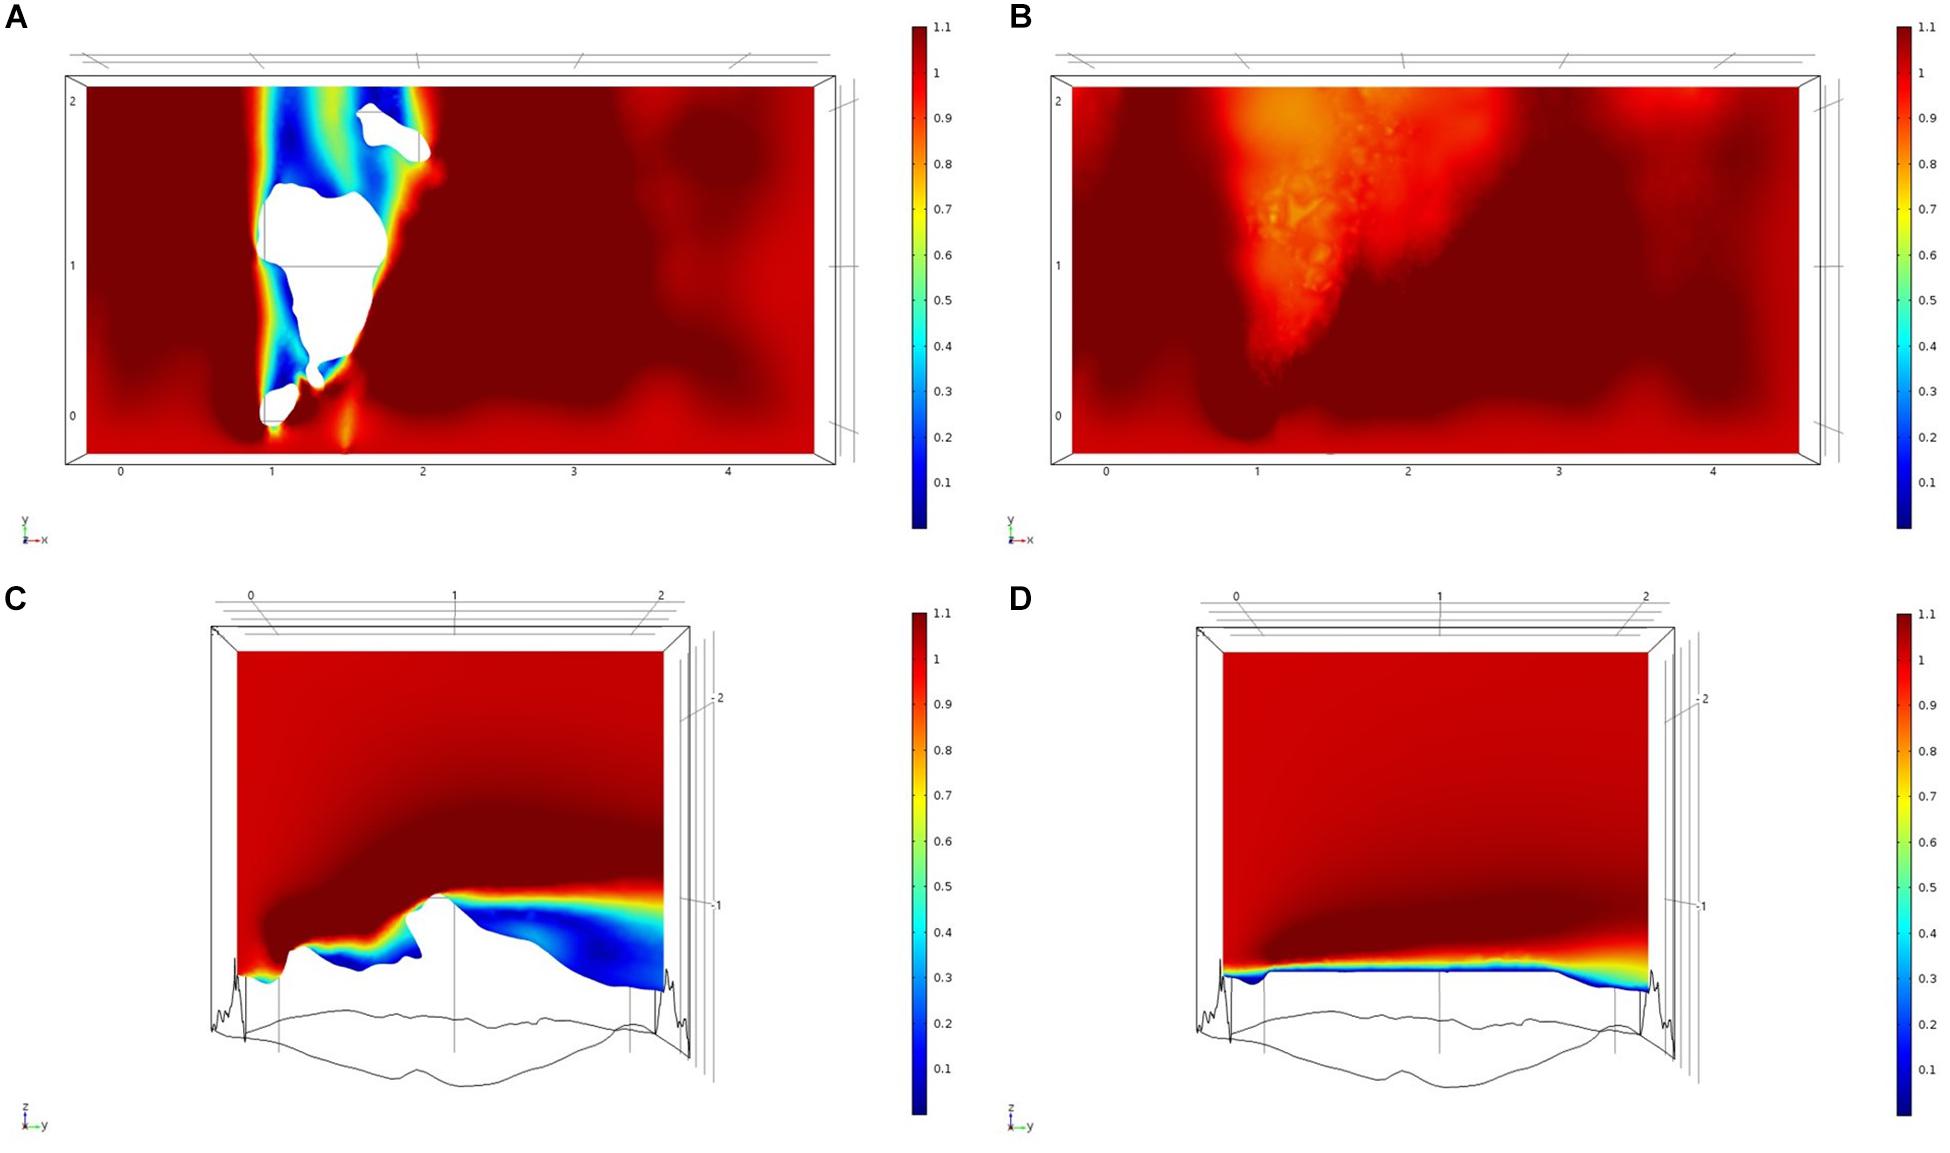
Figure 10. Results of the fluid flow finite element analysis simulation for surface models for GOK Study area visualized as two-dimensional plots (horizontal and vertical cross sections) of flow velocity magnitude (false-color scales m/s). (A,C) Surface model with sponges present. (B,D) Surface model with sponge structures removed. Scale in m with ambient flow of 1 m/s along the y-axis.
Discussion
Do Sponges Cluster?
Patterns of distributions within sponge grounds have been noted before, but there has not been an analysis to date of the clustering patterns themselves (Kutti et al., 2013; McIntyre et al., 2016). Clustering analysis gives a more robust approach to studying these patterns, by removing observational bias and allowing robust statistical tests to be performed to validate observations and hypotheses (Baddeley et al., 2014). As the sponge grounds chosen as study sites are defined by distinct assemblages of sponges, it is interesting but not surprising that different functional groups follow distinct clustering patterns. The ability to scale up the distributions described here are limited due to the small study area. Their size is limited by the diameter of the areas surveyed by the ROV (Hendry, 2017; Hendry et al., 2019). However, our flow-modeling method could be extended to a broader geographical area, and combined with localized environmental data and predictions, to make inferences about environmental driving factors for sponge distribution in sponge grounds on wider spatial and temporal scales. Uniquely, a modeling approach also allows us to simulate a great range of environmental conditions and therefore can be used as a predictive tool for both potential hypotheses and expected optimal conditions.
Why Are Sponges Clustering?
The variability and the driving factors behind these distributions could be wide-ranging, from dispersion of gametes (Abelson and Denny, 1997) to food availability (Robertson et al., 2017). One factor that can be studied within limited geographical areas is localized flow around the sponges. Is this driving distribution patterns in deep-sea sponge grounds? This new application of modeling techniques to localized flow around sponge allows us to address such questions, previously not possible from observational approaches, especially in deep-sea environments.
We need to quantify the pattern of flow around a single structure to understand how fluid flow could be affecting the distribution of individuals within a sponge ground. The creation of both idealized single organism models and study area models give us a better understanding of this flow. The idealized models give us the predicted size and length of the wake given average heights of the sponges. In our study areas, the length of the wake is greater than the spacing between individuals in the sponge grounds, so the wake effect of other sponges is predicted to influence organism structures. The wake length-scales found in this study suggest that sponges that appear isolated may be influenced by the wake of other individuals to a greater extent than previously expected.
When the flow around the sponge structures within each study area is modeled and compared with the same seafloor surface without these structures, a significantly thickened boundary layer is observed as predicted by the idealized models (Figures 4, 5). This slowing effect is due to the overlapping of the wakes of each individual sponge to create a relatively uniform area of slowed flow. Directly linking the slowed boundary layer as the driver behind patterns of distribution is difficult and would require many more and varied study sites. However, the observation of this slowed boundary layer and its potential effect as a factor in sponge distribution is important in its own right. Are the sponges distributing themselves to benefit from the slowed flow in this layer and, if so, what advantage does it provide?
Advantages of Manipulating the Boundary Layer
The effects of flow on an individual sponge organism broadly fall into three categories: gamete dispersion (Abelson and Denny, 1997), nutrient supply (Kahn et al., 2018), and mechanical forcing (Palumbi, 1986). The presence of a slowed boundary layer whose thickness is governed by the velocity of the flow and roughness of the surface has the effect of reducing any mechanical forcing. This lowering in the forces applied to a sponge will reduce the likelihood of damage or attachment failure due to high flow. Average flow velocities in deep sea sponge grounds are low in our study sites (∼0.1 m/s) (Hendry, 2017; Hendry et al., 2019) so this protective effect is likely negligible. However, records of much higher flow velocities during storm events > 1 m/s are recorded the depths of these study areas (Greenan et al., 2010). The high mechanical forcing at these velocities would mean the slowed boundary layer would offer significant protection for both sponges and other organisms associated with sponge grounds (Klitgaard, 1995; Freese and Wing, 2003; Miller et al., 2012).
The most obvious impact of a reduced flow around the sponge on nutrient supply appears to be deleterious: reduced flow would result in a reduced supply of particulate and dissolved organic and inorganic (e.g., dissolved silicon) nutrients to the organism. However, flow speed and nutrient supply may be a more nuanced association due to particulate fallout rate and the active pumping effect of the sponges themselves. The slowing of the boundary layer may result in a greater proportion of the particulates carried by the flow above to be deposited around the sponges. The flow above the boundary layer is not slowed so the vertical supply of particulates to the sponges may increase even if the flow acting on the sponges themselves is reduced. Imposing a sediment flux into the model would be interesting to investigate as a next step in the development of this research.
The reduction in flow speed at the sea floor due to the boundary layer could potentially lead to an increase in larvae deposition and recruitment (Abelson and Denny, 1997). The deposition and retention of larvae in the sponge ground should increase with lower flow speeds, and larvae attachment rates should also increase due to reduced flow stress (Mariani et al., 2006; Guillas et al., 2019). An increase in larvae deposition and retention impacts the recruitment of new individuals within the sponge grounds and should increase its ability to grow and recover from damage.
The importance of ambient flow rate compared to pumping rates for sponges is challenging to determine (Leys et al., 2011; Ludeman et al., 2017). Sponges appear to stop pumping at higher flows but whether this is to protect the canal system from being clogged and damaged (Ludeman et al., 2017; Strehlow et al., 2017), because it is unnecessary for flow though the sponge (Leys et al., 2011), or due to another underlying mechanism, is currently unclear. Regardless, the presence of a slowed boundary layer is influential for each of these mechanisms. A slowed boundary layer may be advantageous as the sponge may be able to pump for longer before it must shut down for protection, or disadvantageous due to higher energy expenditure.
A noticeable feature of the idealized model is the boundary effect of the structures themselves (Figures 4, 5). A future avenue of exploration would be to investigate how this impacts the potential radius of intake around the sponge due to pumping. At what point does the pumping rate become negligible compared to the dividing flow and increased turbulence around the structure, effectively isolating it from the surrounding flow? Does this result in a slower rate of flow becoming advantageous, as the pumping rate with lower turbulence would be more effective and could draw in particulates that would otherwise be lost to the current? Modeling would be particularly useful in investigating the behavior of particles and turbulent currents around sponges, both of which are challenging to measure or observe in situ because of interference from any recording device on the flow.
Regardless of the mechanism by which a slowed boundary layer is created, its presence has additional and important consequences for other organisms associated with sponge grounds (Freese and Wing, 2003; Miller et al., 2012). It also has potential corollaries for conserving sponge grounds under threat of damage by anthropogenic activities. Removal of the sponge structures (e.g., by trawling) would result in the boundary layer velocities not being reduced as much, which—if this feature is beneficial—will have implications for any future recruitment of larvae and recovery of sponges, and so the sponge ground habitat itself.
Conclusion
This study shows that there are significant small-scale patterns in distribution of sponges within sponge grounds in the Labrador Sea. Further, we have developed a new approach to studying the drivers of these observed patterns using fluid flow modeling. The models produced allowed detailed quantitative experiments to be conducted, producing data that would be impossible to obtain from field observations alone. By applying these models to sponge structures taken from four study areas in the North Atlantic, we identified a slowed boundary layer caused by sponge aggregations that may account for some of the distribution patterns. This slowed boundary layer may be acting as a protective layer, increasing larval recruitment or promoting increased particulate organic matter uptake due to increases in both particulate fallout from flow and effective radius of pumping. These observations increase the importance of protecting sponge grounds from anthropogenic damage as the removal of this slowed layer coupled with the relatively slow growth rates of sponges in the deep-sea and decreased larval recruitment could result in the inability of sponge ground to recover once damaged. This study highlights the importance of coupling mathematical modeling with field observations in the deep sea to provide a much greater understanding of anthropogenic and climate change impacts on sponge ground ecosystem structure and function, and biogeochemical cycling by sponges.
Data Availability Statement
The datasets generated for this study are available on request to the corresponding author.
Author Contributions
TC, JP, and KH conceived the study. TC carried out the study, wrote the manuscript, and prepared the figures. All authors analyzed the data, revised drafts of the manuscript, and gave final approval for the publication.
Funding
Funding was from the European Research Council (ERC Starting Grant 678371 ICY-LAB). JP acknowledges funding through a University of Bristol Research Fellowship.
Conflict of Interest
The authors declare that the research was conducted in the absence of any commercial or financial relationships that could be construed as a potential conflict of interest.
Acknowledgments
We would like to thank Mark Woodhouse, Veerle Huvenne, and Kerry-Louise Howell for their discussion and assistance.
References
Abelson, A., and Denny, M. (1997). SETTLEMENT OF MARINE ORGANISMS IN FLOW. Annu. Rev. Ecol. Syst. 28, 317–339. doi: 10.1146/annurev.ecolsys.28.1.317
Anjum, K., Abbas, S. Q., Shah, S. A. A., Akhter, N., Batool, S., and Hassan, S. S. U. (2016). Marine sponges as a drug treasure. Biomol. Ther. 24, 347–362. doi: 10.4062/biomolther.2016.067
Baddeley, A., Diggle, P. J., Hardegen, A., Lawrence, T., Milne, R. K., and Gopalan Nair, A. (2014). On tests of spatial pattern based on simulation envelopes. Ecol. Monogr. 84, 477–489. doi: 10.1890/13-2042.1
Barthel, D., Tendal, O. S., and Thiel, H. (1996). A wandering population of the hexactineliid sponge pheronema carpenteri on the continental slope off morocco, Northwest Africa. Mar. Ecol. 17, 603–616. doi: 10.1111/j.1439-0485.1996.tb00420.x
Beazley, L., Kenchington, E., Yashayaev, I., and Murillo, F. J. (2015). Drivers of epibenthic megafaunal composition in the sponge grounds of the Sackville Spur, northwest Atlantic. Deep Sea Res. I Oceanogr. Res. Pap. 98, 102–114. doi: 10.1016/J.DSR.2014.11.016
Bell, J. J. (2008). The functional roles of marine sponges. Estuar. Coast. Shelf Sci. 79, 341–353. doi: 10.1016/J.ECSS.2008.05.002
Bett, B. J. (2001). UK Atlantic Margin Environmental Survey: introduction and overview of bathyal benthic ecology. Cont. Shelf Res. 21, 917–956. doi: 10.1016/S0278-4343(00)00119-9
Cathalot, C., Van Oevelen, D., Cox, T. J. S., Kutti, T., Lavaleye, M., Duineveld, G., et al. (2015). Cold-water coral reefs and adjacent sponge grounds: hotspots of benthic respiration and organic carbon cycling in the deep sea. Front. Mar. Sci. 2:37. doi: 10.3389/fmars.2015.00037
Chindapol, N., Kaandorp, J. A., Cronemberger, C., Mass, T., and Genin, A. (2013). Modelling growth and form of the scleractinian coral Pocillopora verrucosa and the influence of hydrodynamics. PLoS Comput. Biol. 9:e1002849. doi: 10.1371/journal.pcbi.1002849
Cresswell, A. K., Thomson, D. P., Trevenen, E. J., and Renton, M. (2017). “A functional-structural coral model,” in Proceedings of the MODSIM2017: 22nd International Congress on Modelling and Simulation, (Sydney: Modelling and Simulation Society of Australia and New Zealand Inc), 237–243.
Freese, J. L., and Wing, B. L. (2003). Juvenile red rockfish, Sebastes sp., associations with sponges in the Gulf of Alaska. Mar. Fish. Rev. 65, 38–42.
Greenan, B. J. W., Yashayaev, I., Head, E. J. H., Harrison, W. G., Azetsu-Scott, K., Li, W. K. W., et al. (2010). “Interdisciplinary oceanographic observations of Orphan Knoll,” in Proceedings of the NAFO Sci. Counc. Meet. 10/19, Dartmouth.
Guillas, K. C., Kahn, A. S., Grant, N., Archer, S. K., Dunham, A., and Leys, S. P. (2019). Settlement of juvenile glass sponges and other invertebrate cryptofauna on the Hecate Strait glass sponge reefs. Invertebr. Biol. 138:e12266. doi: 10.1111/ivb.12266
Hanjaliæ, K., and Launder, B. E. (1972). A Reynolds stress model of turbulence and its application to thin shear flows. J. Fluid Mech. 52, 609–638. doi: 10.1017/S002211207200268X
Hawkes, N., Korabik, M., Beazley, L., Rapp, H. T., Xavier, J. R., and Kenchington, E. (2019). Glass sponge grounds on the Scotian Shelf and their associated biodiversity. Mar. Ecol. Prog. Ser. 614, 91–109. doi: 10.3354/meps12903
Hendry, K. (2017). RRS Discovery DY081 - Cruise Summary Report. Available online at: https://www.bodc.ac.uk/resources/inventories/cruise_inventory/report/16378/ (accessed April 9, 2018).
Hendry, K. R., Huvenne, V. A. I., Robinson, L. F., Annett, A., Badger, M., Jacobel, A. W., et al. (2019). The biogeochemical impact of glacial meltwater from Southwest Greenland. Prog. Oceanogr. 176:102126. doi: 10.1016/j.pocean.2019.102126
Henry, L.-A., and Roberts, J. M. (2014a). Applying the OSPAR Habitat Definition of Deep-Sea Sponge Aggregations to Verify Suspected Records of the Habitat in UK Waters. JNCC Report 508. Peterborough: JNCC.
Henry, L. A., and Roberts, J. M. (2014b). Recommendations for best practice in deep-sea habitat classification: Bullimore et al. as a case study. ICES J. Mar. Sci. 71, 895–898. doi: 10.1093/icesjms/fst175
Hirschmüller, H. (2005). “Accurate and efficient stereo processing by semi-global matching and mutua information,” in Proceedings - 2005 IEEE Computer Society Conference on Computer Vision and Pattern Recognition, CVPR 2005, (Piscataway, NJ: IEEE Computer Society), 807–814.
Holtmeier, F., and Broll, G. (2017). Feedback effects of clonal groups and tree clusters on site conditions at the treeline: implications for treeline dynamics. Clim. Res. 73, 85–96. doi: 10.3354/cr01431
Howell, K. L., Bullimore, R. D., and Foster, N. L. (2014). Quality assurance in the identification of deep-sea taxa from video and image analysis: response to Henry and Roberts. ICES J. Mar. Sci. 71, 899–906. doi: 10.1093/icesjms/fsu052
Howell, K.-L., Piechaud, N., Downie, A.-L., and Kenny, A. (2016). The distribution of deep-sea sponge aggregations in the North Atlantic and implications for their effective spatial management. Deep Sea Res. I Oceanogr. Res. Pap. 115, 309–320. doi: 10.1016/J.DSR.2016.07.005
Kahn, A. S., Chu, J. W. F., and Leys, S. P. (2018). Trophic ecology of glass sponge reefs in the Strait of Georgia, British Columbia. Sci. Rep. 8:756. doi: 10.1038/s41598-017-19107-x
Kazanidis, G., Vad, J., Henry, L.-A., Neat, F., Berx, B., Georgoulas, K., et al. (2019). Distribution of deep-sea sponge aggregations in an area of multisectoral activities and changing oceanic conditions. Front. Mar. Sci. 6:163. doi: 10.3389/fmars.2019.00163
Kenchington, E., Murillo, F. J., Lirette, C., Sacau, M., Koen-Alonso, M., Kenny, A., et al. (2014). Kernel density surface modelling as a means to identify significant concentrations of vulnerable marine ecosystem indicators. PLoS One 9:e109365. doi: 10.1371/journal.pone.0109365
Klitgaard, A. B. (1995). The fauna associated with outer shelf and upper slope sponges (porifera, demospongiae) at the faroe islands, northeastern Atlantic. Sarsia 80, 1–22. doi: 10.1080/00364827.1995.10413574
Klitgaard, A. B., and Tendal, O. S. (2004). Distribution and species composition of mass occurrences of large-sized sponges in the northeast Atlantic. Prog. Oceanogr. 61, 57–98. doi: 10.1016/j.pocean.2004.06.002
Knudby, A., Kenchington, E., and Murillo, F. J. (2013). Modeling the distribution of geodia sponges and sponge grounds in the Northwest Atlantic. PLoS One 8:e82306. doi: 10.1371/journal.pone.0082306
Koopmans, M., Martens, D., and Wijffels, R. H. (2009). Towards commercial production of sponge medicines. Mar. Drugs 7, 787–802. doi: 10.3390/md7040787
Kutti, T., Bannister, R. J., and Fosså, J. H. (2013). Community structure and ecological function of deep-water sponge grounds in the Traenadypet MPA—Northern Norwegian continental shelf. Cont. Shelf Res. 69, 21–30. doi: 10.1016/J.CSR.2013.09.011
Leys, S. P., Yahel, G., Reidenbach, M. A., Tunnicliffe, V., Shavit, U., and Reiswig, H. M. (2011). The sponge pump: the role of current induced flow in the design of the sponge body plan. PLoS One 6:e27787. doi: 10.1371/journal.pone.0027787
Lowe, D. G. (2004). Distinctive image features from scale-invariant keypoints. Int. J. Comput. Vis. 60, 91–110. doi: 10.1023/B:VISI.0000029664.99615.94
Ludeman, D. A., Reidenbach, M. A., and Leys, S. P. (2017). The energetic cost of filtration by demosponges and their behavioural response to ambient currents. J. Exp. Biol. 220, 995–1007. doi: 10.1242/jeb.146076
Maldonado, M. (2016). Sponge waste that fuels marine oligotrophic food webs: a re-assessment of its origin and nature. Mar. Ecol. 37, 477–491. doi: 10.1111/maec.12256
Maldonado, M., Ribes, M., and van Duyl, F. C. (2012). Nutrient Fluxes Through Sponges. Biology, Budgets, and Ecological Implications, 1st Edn. Amsterdam: Elsevier Ltd.
Mariani, S., Uriz, M.-J., Turon, X., and Alcoverro, T. (2006). International association for ecology dispersal strategies in sponge larvae: integrating the life history of larvae and the hydrologic component. Source Oecol. 149, 174–184. doi: 10.1007/s00442-006-0429-9
McIntyre, F. D., Drewery, J., Eerkes-Medrano, D., and Neat, F. C. (2016). Distribution and diversity of deep-sea sponge grounds on the Rosemary Bank Seamount, NE Atlantic. Mar. Biol. 163, 1–11. doi: 10.1007/s00227-016-2913-z
Miller, R. J., Hocevar, J., Stone, R. P., and Fedorov, D. V. (2012). Structure-forming corals and sponges and their use as fish habitat in bering sea submarine canyons. PLoS One 7:e33885. doi: 10.1371/journal.pone.0033885
Murillo, F. J., Muñoz, P. D., Cristobo, J., Ríos, P., González, C., Kenchington, E., et al. (2012). Deep-sea sponge grounds of the Flemish Cap, Flemish Pass and the Grand Banks of Newfoundland (Northwest Atlantic Ocean): distribution and species composition. Mar. Biol. Res. 8, 842–854. doi: 10.1080/17451000.2012.682583
Nita, B. G., and Allaire, R. (2017). On the three dimensional interaction between flexible fibers and fluid flow. Fluids 2:4. doi: 10.3390/FLUIDS2010004
Palumbi, S. R. (1986). How body plans limit acclimation: responses of a demosponge to wave force. Ecology 67, 208–214. doi: 10.2307/1938520
Pusceddu, A., Bianchelli, S., Martín, J., Puig, P., Palanques, A., Masqué, P., et al. (2014). Chronic and intensive bottom trawling impairs deep-sea biodiversity and ecosystem functioning. Proc. Natl. Acad. Sci. U.S.A. 111, 8861–8866. doi: 10.1073/pnas.1405454111
Rice, A. L., Thurston, M. H., and New, A. L. (1990). Dense aggregations of a hexactinellid sponge, Pheronema carpenteri, in the Porcupine Seabight (northeast Atlantic Ocean), and possible causes. Prog. Oceanogr. 24, 179–196. doi: 10.1016/0079-6611(90)90029-2
Ripley, B. D. (1976). The second-order analysis of stationary point processes. J. Appl. Probab. 13, 255–266. doi: 10.2307/3212829
Roberts, D. E., and Davis, A. R. (1996). Patterns in sponge (Porifera) assemblages on temperate coastal reefs off Sydney, Australia. Mar. Freshw. Res. 47, 897–906. doi: 10.1071/MF9960897
Roberts, E. M., Mienis, F., Rapp, H. T., Hanz, U., Meyer, H. K., and Davies, A. J. (2018). Oceanographic setting and short-timescale environmental variability at an Arctic seamount sponge ground. Deep Sea Res. I Oceanogr. Res. Pap. 138, 98–113. doi: 10.1016/J.DSR.2018.06.007
Robertson, L. M., Hamel, J.-F., and Mercier, A. (2017). Feeding in deep-sea demosponges: influence of abiotic and biotic factors. Deep Sea Res. I Oceanogr. Res. Pap. 127, 49–56. doi: 10.1016/J.DSR.2017.07.006
Shamloo, H., Rajaratnam, N., and Katopodis, C. (2001). Hydraulics of simple habitat structures. J. Hydraul. Res. 39, 351–366. doi: 10.1080/00221680109499840
Strehlow, B. W., Pineda, M., Duckworth, A., Kendrick, G. A., Renton, M., Azmi, M., et al. (2017). Sediment tolerance mechanisms identified in sponges using advanced imaging techniques. PEER J. 5, 1–26. doi: 10.7717/peerj.3904
Vad, J., Kazanidis, G., Henry, L.-A., Jones, D. O. B., Tendal, O. S., Christiansen, S., et al. (2018). Potential impacts of offshore oil and gas activities on deep-sea sponges and the habitats they form. Adv. Mar. Biol. 79, 33–60. doi: 10.1016/bs.amb.2018.01.001
Victorero, L., Watling, L., Deng Palomares, M. L., and Nouvian, C. (2018). Out of sight, but within reach: a global history of bottom-trawled deep-sea fisheries from > 400 m depth. Front. Mar. Sci. 5:98. doi: 10.3389/fmars.2018.00098
Westoby, M. J., Brasington, J., Glasser, N. F., Hambrey, M. J., and Reynolds, J. M. (2012). “Structure-from-Motion” photogrammetry: a low-cost, effective tool for geoscience applications. Geomorphology 179, 300–314. doi: 10.1016/j.geomorph.2012.08.021
Wilkinson, C. R., and Evans, E. (1989). Sponge distribution across Davies Reef, Great Barrier Reef, relative to location, depth, and water movement. Coral Reefs 8, 1–7. doi: 10.1007/BF00304685
Wu, C.-S., Wu, D.-Y., and Wang, S.-S. (2019). Bio-based polymer nanofiber with siliceous sponge spicules prepared by electrospinning: preparation, characterisation, and functionalisation. Mater. Sci. Eng. C 108:110506. doi: 10.1016/j.msec.2019.110506
Keywords: Sponges (Porifera), ecological function, finite element analysis, computational fluid dynamics, Labrador Sea, deep-sea ecosystems, sponge grounds
Citation: Culwick T, Phillips J, Goodwin C, Rayfield EJ and Hendry KR (2020) Sponge Density and Distribution Constrained by Fluid Forcing in the Deep Sea. Front. Mar. Sci. 7:395. doi: 10.3389/fmars.2020.00395
Received: 23 February 2020; Accepted: 07 May 2020;
Published: 04 June 2020.
Edited by:
Shirley A. Pomponi, Florida Atlantic University, United StatesReviewed by:
Ian David Tuck, National Institute of Water and Atmospheric Research (NIWA), New ZealandTravis William Washburn, University of Hawai‘i at Mānoa, United States
Copyright © 2020 Culwick, Phillips, Goodwin, Rayfield and Hendry. This is an open-access article distributed under the terms of the Creative Commons Attribution License (CC BY). The use, distribution or reproduction in other forums is permitted, provided the original author(s) and the copyright owner(s) are credited and that the original publication in this journal is cited, in accordance with accepted academic practice. No use, distribution or reproduction is permitted which does not comply with these terms.
*Correspondence: Timothy Culwick, dGltb3RoeS5jdWx3aWNrQGJyaXN0b2wuYWMudWs=