 Ellen M. Ditria1*
 Sebastian Lopez-Marcano1
 Michael Sievers1
 Eric L. Jinks1Christopher J. Brown2
 Rod M. Connolly1
- 1Australian Rivers Institute – Coast & Estuaries, School of Environment and Science, Griffith University, Gold Coast, QLD, Australia
- 2Australian Rivers Institute – Coast & Estuaries, School of Environment and Science, Griffith University, Nathan, QLD, Australia
Aquatic ecologists routinely count animals to provide critical information for conservation and management. Increased accessibility to underwater recording equipment such as action cameras and unmanned underwater devices has allowed footage to be captured efficiently and safely, without the logistical difficulties manual data collection often presents. It has, however, led to immense volumes of data being collected that require manual processing and thus significant time, labor, and money. The use of deep learning to automate image processing has substantial benefits but has rarely been adopted within the field of aquatic ecology. To test its efficacy and utility, we compared the accuracy and speed of deep learning techniques against human counterparts for quantifying fish abundance in underwater images and video footage. We collected footage of fish assemblages in seagrass meadows in Queensland, Australia. We produced three models using an object detection framework to detect the target species, an ecologically important fish, luderick (Girella tricuspidata). Our models were trained on three randomized 80:20 ratios of training:validation datasets from a total of 6,080 annotations. The computer accurately determined abundance from videos with high performance using unseen footage from the same estuary as the training data (F1 = 92.4%, mAP50 = 92.5%) and from novel footage collected from a different estuary (F1 = 92.3%, mAP50 = 93.4%). The computer’s performance in determining abundance was 7.1% better than human marine experts and 13.4% better than citizen scientists in single image test datasets, and 1.5 and 7.8% higher in video datasets, respectively. We show that deep learning can be a more accurate tool than humans at determining abundance and that results are consistent and transferable across survey locations. Deep learning methods provide a faster, cheaper, and more accurate alternative to manual data analysis methods currently used to monitor and assess animal abundance and have much to offer the field of aquatic ecology.
Introduction
The foundation for all key questions in animal ecology revolves around the abundance, distribution, and behavior of animals. Collecting robust, accurate, and unbiased information is therefore vital to understanding ecological theories and applications. Some types of data collection methods that are commonly used in animal ecology, such as tagging, manual visual surveys, netting, and trawling, can be replaced or supplemented with camera data.
In particular circumstances, the development and availability of these devices can provide a more accurate and cheaper method to collect data, with reduced risk to the operator (Hodgson et al., 2013). Under these circumstances, they can increase sampling accuracy as well as replicability and reproducibility (Weinstein, 2017), which form the basis of a sound scientific study (Leek and Peng, 2015). However, the amount of data now being generated can be overwhelming. The solution has become the new problem.
Much like the physical collection of data, manual processing of data is often labor-intensive, time-consuming, and extremely costly (Weinstein, 2017). This has led to invaluable data collected over large temporal and spatial scales laying unused in storage libraries. In Australia, for example, the Integrated Marine Observing System (IMOS) collects millions of images of coral reefs every year, yet despite affiliations and partnerships with a range of universities and management agencies, less than 5% of these are analyzed by experts (Moniruzzaman et al., 2017). This apparently never-ending stream of data brings a new challenge for ecologists, to find or develop the analytical tools needed to extract information from the immense volumes of incoming images and video content (Valletta et al., 2017).
Fortunately, recent advances in machine learning technologies have provided one tool to help combat this problem, deep learning. Deep learning is a subset of machine learning consisting of a number of computational layers that process data that are difficult to model analytically, such as raw images and video footage (LeCun et al., 2015). Although these multi-layered networks are not a new technology (Rawat and Wang, 2017), the relatively recent advances in computing power have spurred an increase in their application for analyzing image-based data. In deep learning networks, data are fed into an input layer, while an output layer is sorted into categories predetermined by manual training, in a process known as supervised learning (Rawat and Wang, 2017).
Although deep learning techniques are being implemented enthusiastically in terrestrial ecology, it is currently an under-exploited tool in aquatic environments (Moniruzzaman et al., 2017; Xu et al., 2019). As the global challenges in marine science and management increase (Halpern et al., 2015), it is critical for marine science to realize the potential automated analysis offers (Malde et al., 2019). Relative to terrestrial environments, however, obtaining useable footage in marine environments to achieve acceptable computational performance presents a unique set of challenges. For example, there are often high levels of environmental complexities in marine environments which can interfere with clear footage, including variable water clarity, complex background structures, decreased light at depth, and obstruction due to schooling fish (Mandal et al., 2018; Salman et al., 2019). Although these factors may affect the quality of images and videos, deep learning methods have proven successful in a range of marine applications (Galloway et al., 2017; Arellano-Verdejo et al., 2019).
Efforts to use deep learning methods in marine environments currently revolve around the automated classification of specific species. Attempts to classify tropical reef fish have achieved high levels of performance and have also outperformed humans in species recognition (Villon et al., 2018). There have also been suggestions from classification studies on freshwater fish to incorporate other strategies for increasing performance, including taxonomic family and order (Dos Santos and Gonçalves, 2019). Although all marine environments have challenging conditions, the tropical reef studies by Villon et al. (2018) and Salman et al. (2019) typically operate with high visibility, high fish abundance, and highly variable inter-specific morphology, which makes distinguishing different species easier (Xu and Matzner, 2018). Conversely, coastal and estuarine systems often suffer poor visibility due to complex topography, anthropogenic eutrophication, and sediment-induced turbidity (Lehtiniemi et al., 2005; Baker and Sheaves, 2006; Lowe et al., 2015).
Although classification enables the determination of species, its usefulness for answering broad ecological questions is rather limited. Object detection allows us to classify both what is in a frame and where it is and therefore enables us to determine both the species in an area and their abundance (e.g., Maire et al., 2015; Salberg, 2015; Gray et al., 2019b).
Here, we use fish inhabiting subtropical seagrass meadows as a case study to explore the viability of computer vision and deep learning as a suitable, non-invasive technique using remotely collected data in a variable marine environment. Seagrass meadows provide critical ecosystem services such as carbon sequestration, nutrient cycling, shoreline stabilization, and enhanced biodiversity (Waycott et al., 2009; Sievers et al., 2019). However, many seagrass meadows are being lost and degraded due to a range of anthropogenic stressors, such as overfishing, eutrophication, and physical disturbances (Orth et al., 2006). Due to their background complexity, constant movement, and ability to obscure fish, it may prove to be a difficult habitat to implement a deep learning solution. Luderick (Girella tricuspidata) is a common herbivorous fish found along the east coast of Australia and is abundant in coastal and estuarine systems, including seagrass meadows (Ferguson et al., 2013). Unlike most herbivorous fish in seagrass meadows, this species grazes on both the epiphytic algae that grows on seagrass and the seagrass itself, making it of interest ecologically (Gollan and Wright, 2006). Using this ecologically important ecosystem, we specifically aim to deduce whether deep learning techniques can be used to determine: (1) the accurate object detection of a target species, (2) the flexibility of algorithms in analyzing data across locations, and (3) the comparative performance between computers and humans in determining abundance from images and video footage. As far as we are aware, this is the first time that humans and deep learning algorithms have been compared in their ability to quantify abundance from underwater video footage or that object detection and computer vision methods have been used in estuarine systems.
Materials and Methods
Training Dataset
We used submerged action cameras (Haldex Sports Action Cam HD 1080p) to collect video footage of luderick in the Tweed River Estuary in southeast Queensland (−28.169438, 153.547594), between February and July 2019. Each sampling day, six cameras were deployed for 1 h over a variety of seagrass patches; the angle and placement of cameras was varied among deployment to ensure a variety of backgrounds and fish angles. Videos were trimmed for training to contain only footage of luderick and split into five frames per second.
Convolutional Neural Network
The object detection framework we used is an implementation of Mask R-CNN developed by Massa and Girshick (2018). Mask R-CNN works by classifying and localizing the region of interest (RoI). It extends previous frameworks in that it can predict a segmentation mask on the RoI, and currently, it has the highest performance output for deep learning models (He et al., 2017; Dai et al., 2019). To develop our model, we used a ResNet50 configuration, pre-trained on the ImageNet-1k dataset. This configuration provides an acceptable balance between training time and performance (Massa and Girshick, 2018). We conducted the model training, testing, and prediction tasks on a Microsoft Azure Data Science Virtual Machine powered by an NVIDIA V100 GPU. Data preparation and annotation tasks were carried out using software developed at Griffith University. While deep learning has begun to be adopted for ecological data analysis in the last 2 years, its use in the environmental sciences requires substantial software engineering knowledge, as unfortunately there is not yet an accessible software package for ecologists (Piechaud et al., 2019). The development of this interface for manual annotation, that can be retrained for different species, takes strides toward an end-to-end, user-friendly application tailored for ecologists. A trained team in fish identification manually drew segmentation masks around luderick (i.e., our RoI, Figure 1) and annotated 6,080 fish for the training dataset. Luderick were annotated if they could be positively identified at any time within the video the image came from.
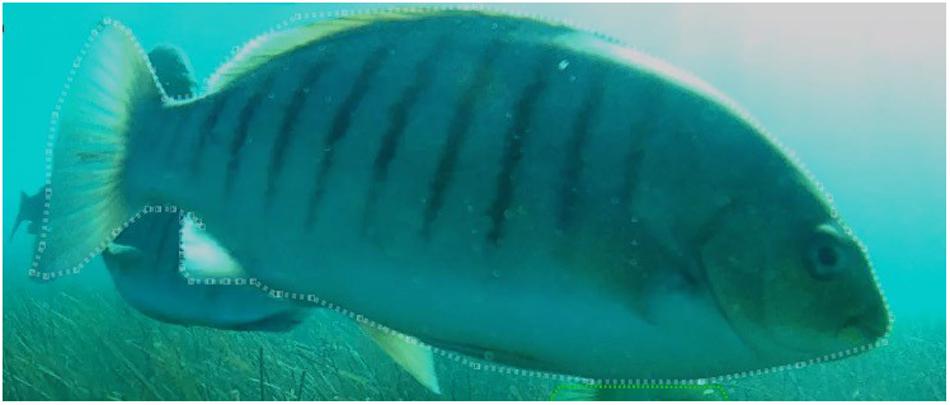
Figure 1. Training dataset image demonstrating manual segmentation mask (white dashed line around fish) denoting the region of interest (RoI); Girella tricuspidata at Tweed Estuary, NSW, Australia.
The utility of the model depends on how accurately the computer identifies the presence of luderick, which we quantified in two ways based on the interactions between precision (P) and recall (R). Precision is how rigorous the model is at identifying the presence of luderick, and recall is the number of the total positives the model captured (Everingham et al., 2010). Generally, an increase in recall results in decreased precision and vice versa and was calculated as follows:
Firstly, the computer’s ability to fit a segmentation mask around the RoI was determined by the mean average precision value (mAP) (Everingham et al., 2010):
We used the mAP50 value in this study, which equates to how well the model overlapped a segmentation mask around at least 50% of the ground truth outline of the fish. The higher the value, the more accurate the model was at overlapping the segmentation mask. Secondly, the success of our model in answering ecological questions on abundance was determined by an F1 score. The F1 score takes into consideration the maximum number of fish calculated per video (MaxN), as well as the ratio of false positives and false negative answers given, to assess the performance of each method’s ability to correctly assess abundance:
We used the F1 score and mAP50 values to assess the performance of the computer model.
All predictions were made with a confidence threshold of 90%, that is, the algorithm was at least 90% sure that it was identifying a luderick to minimize the occurrence of false negatives. This threshold was chosen as it typically maximized F1 performance by filtering out false positives.
Model Validation and Performance Curve
Models were trained using a random 80% sample of the annotated dataset, with the remaining 20% used to form a validation dataset (Alexandropoulos et al., 2019). Training performance was then measured against the validation set to monitor for overfitting. Overfitting is a phenomenon when the computer becomes dependent on, and memorizes the training data, failing to perform well when tested on data it has not encountered previously (Chicco, 2017). We minimized overfitting by using the early-stopping technique (Prechelt, 1998). In our case, this was achieved by assessing the mAP50 on the validation set at intervals of 2,500 iterations and determined where the performance began to drop (Chicco, 2017).
The same computer algorithm was used to train three different models on three different randomized 80/20 subsets of the whole training data set to account for variation in the training and validation split. These models were subsequently used to compare the unseen and novel test dataset, and in the human versus computer test.
We generated a performance curve to confirm that variation among models was sufficiently low to ensure consistency in performance across the three models. Random subsets of still images were selected from the training dataset. These subsets of data increased in volume to determine the performance of the model as training data increase. As the volume of training data increased, the risk of overfitting decreased, so the number of training iterations was adjusted to maintain optimum performance.
Manual annotation cost can be a significant factor to consider when training CNN networks and can also be monitored by using the performance curve. Time stamps were added to the training software to record the speed at which training data were annotated to infer total annotation time of the training data by humans. We used these data to determine how much training is required by this model to produce high accuracy and thus also the effort needed to produce a consistent and reliable ecological tool.
Model Performance
The 80/20 validation test is an established method in machine learning to assess the expected performance of the final model (Alexandropoulos et al., 2019). However, using deep learning to answer ecological questions requires another testing procedure to accurately reflect the usability of the model when analyzing new data. We therefore also tested the model against annotations from two types of new footage not used for the training dataset. We used unseen footage from the same location in the Tweed River Estuary (“Unseen”), as well as from a novel location (“Novel”), being seagrass meadows in a separate estuary system in Tallebudgera Creek (−28.109721, 153.448975). A t-test was used to compare the performance of the three models between the unseen test-set from Tweed Estuary and the novel test-set from Tallebudgera.
Human vs. Computer
Creating an automated data analysis system aims to lessen the manual workload of humans by creating a faster, yet accurate, alternative. Therefore, it is crucial to not only know how well the model performs but also assess its capabilities in speed and accuracy, compared to current human methods. This “human versus computer” method analysis compared citizen scientists and experts against the computer: (1) Citizen scientists were undergraduate marine science students and interested members of the public (n = 20); (2) Experts were fish scientists with a Ph.D. or currently studying for one (n = 7); and (3) The computer models (n = 3). We compared these groups using both video footage (n = 31) and images (n = 50) and analyzed differences in test speed and performance. Both the image sets and videos were run through the three deep learning models to account for variation in performance in the 80% of training data used to train the models. The number of false negatives, false positives, proportion of accurate answers (observed answers divided by ground truth) as well as the overall F1 score were recorded. Citizen scientist and experts were provided with a package that contained a link to the video test uploaded to YouTube, the image set sent as a zip file, instruction sheet, example images of the target species, and datasheets. This process was set up to minimize bias in training the human subjects that may have occurred if the test was explained verbally. Humans were instructed to only record the target species if they could visually identify the luderick with confidence. Participants were required to estimate the MaxN of luderick in any single frame per video and per still image, simulating the most popular manual method currently used in analyzing videos (e.g., Gilby et al., 2017). Start and end time of each test was also recorded to compare how quickly the participants completed the task, compared to the deep learning algorithm. The still image dataset was randomly selected from the “unseen” test video footage and used as the ground truth for images. The video footage was expertly annotated at five frames per second and used as the ground truth for videos. Luderick were only annotated if they could be positively identified at least at one instance in the video. This enabled us to quantitatively compare the human and computer accuracy in determining MaxN, assessed using the overall F1 score for each test. While MaxN was used by the humans and models to determine the target abundance, the rate at which each analysis method incorrectly identified false negatives and false positives is also important, since these errors can potentially cancel each other out to give an “accurate” MaxN count. We therefore present these individual components of the F1 calculation.
Results
Performance Curve
Based on the computer algorithm curve, F1 performance began to plateau earlier than mAP50 (Figure 2). F1 varied only 0.9% from 2,000 annotations to 6,000 annotations compared to an increase of 3.1% by mAP50 at the same annotations. At lower volumes of training annotations (between 0 and 1,000), the performance of both mAP50 and F1 fluctuated. Even with our streamlined process for annotation, the average time for an operator to annotate one fish was 13.5 s, and the total time to annotate all 6,080 images was in the order of 23 h (not including breaks).
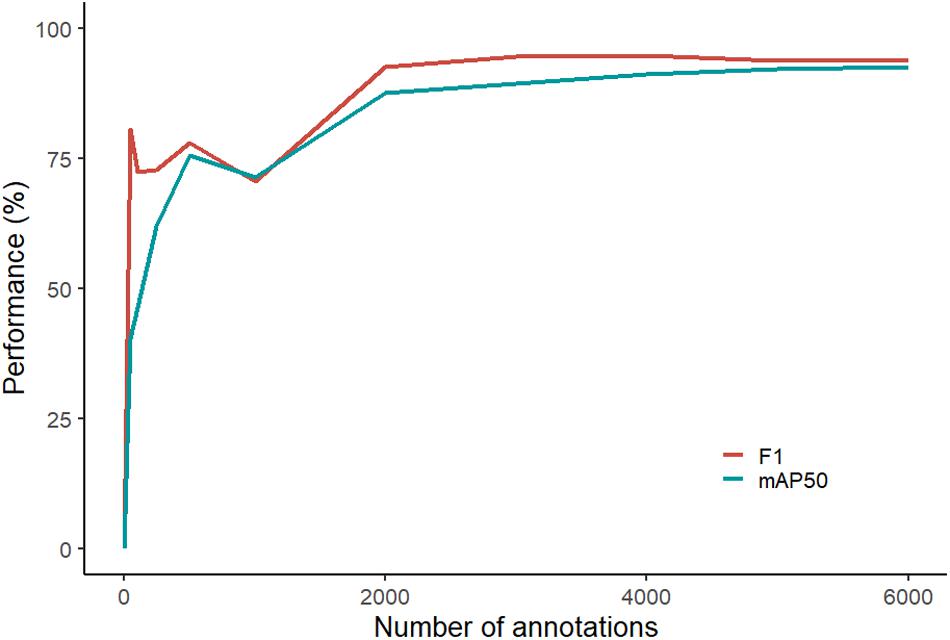
Figure 2. Performance curve showing the computer’s ability to fit a segmentation mask around the luderick (performance scored by mAP50) and in accurately identifying abundance (performance scored by F1).
Model Performance
Performance was high for both the unseen and novel test sets (mAP and F1 both >92%). Based on F1 scores, the computer performed equally well (t-test; t = −0.01, p = 0.99) on the unseen (92.4%) and novel (92.3%; Figure 3). Similarly, the difference in performance for mAP50 was non-significant (t = 1.4, p = 0.29) on the unseen (92.5%) and novel (93.4%) test-sets.
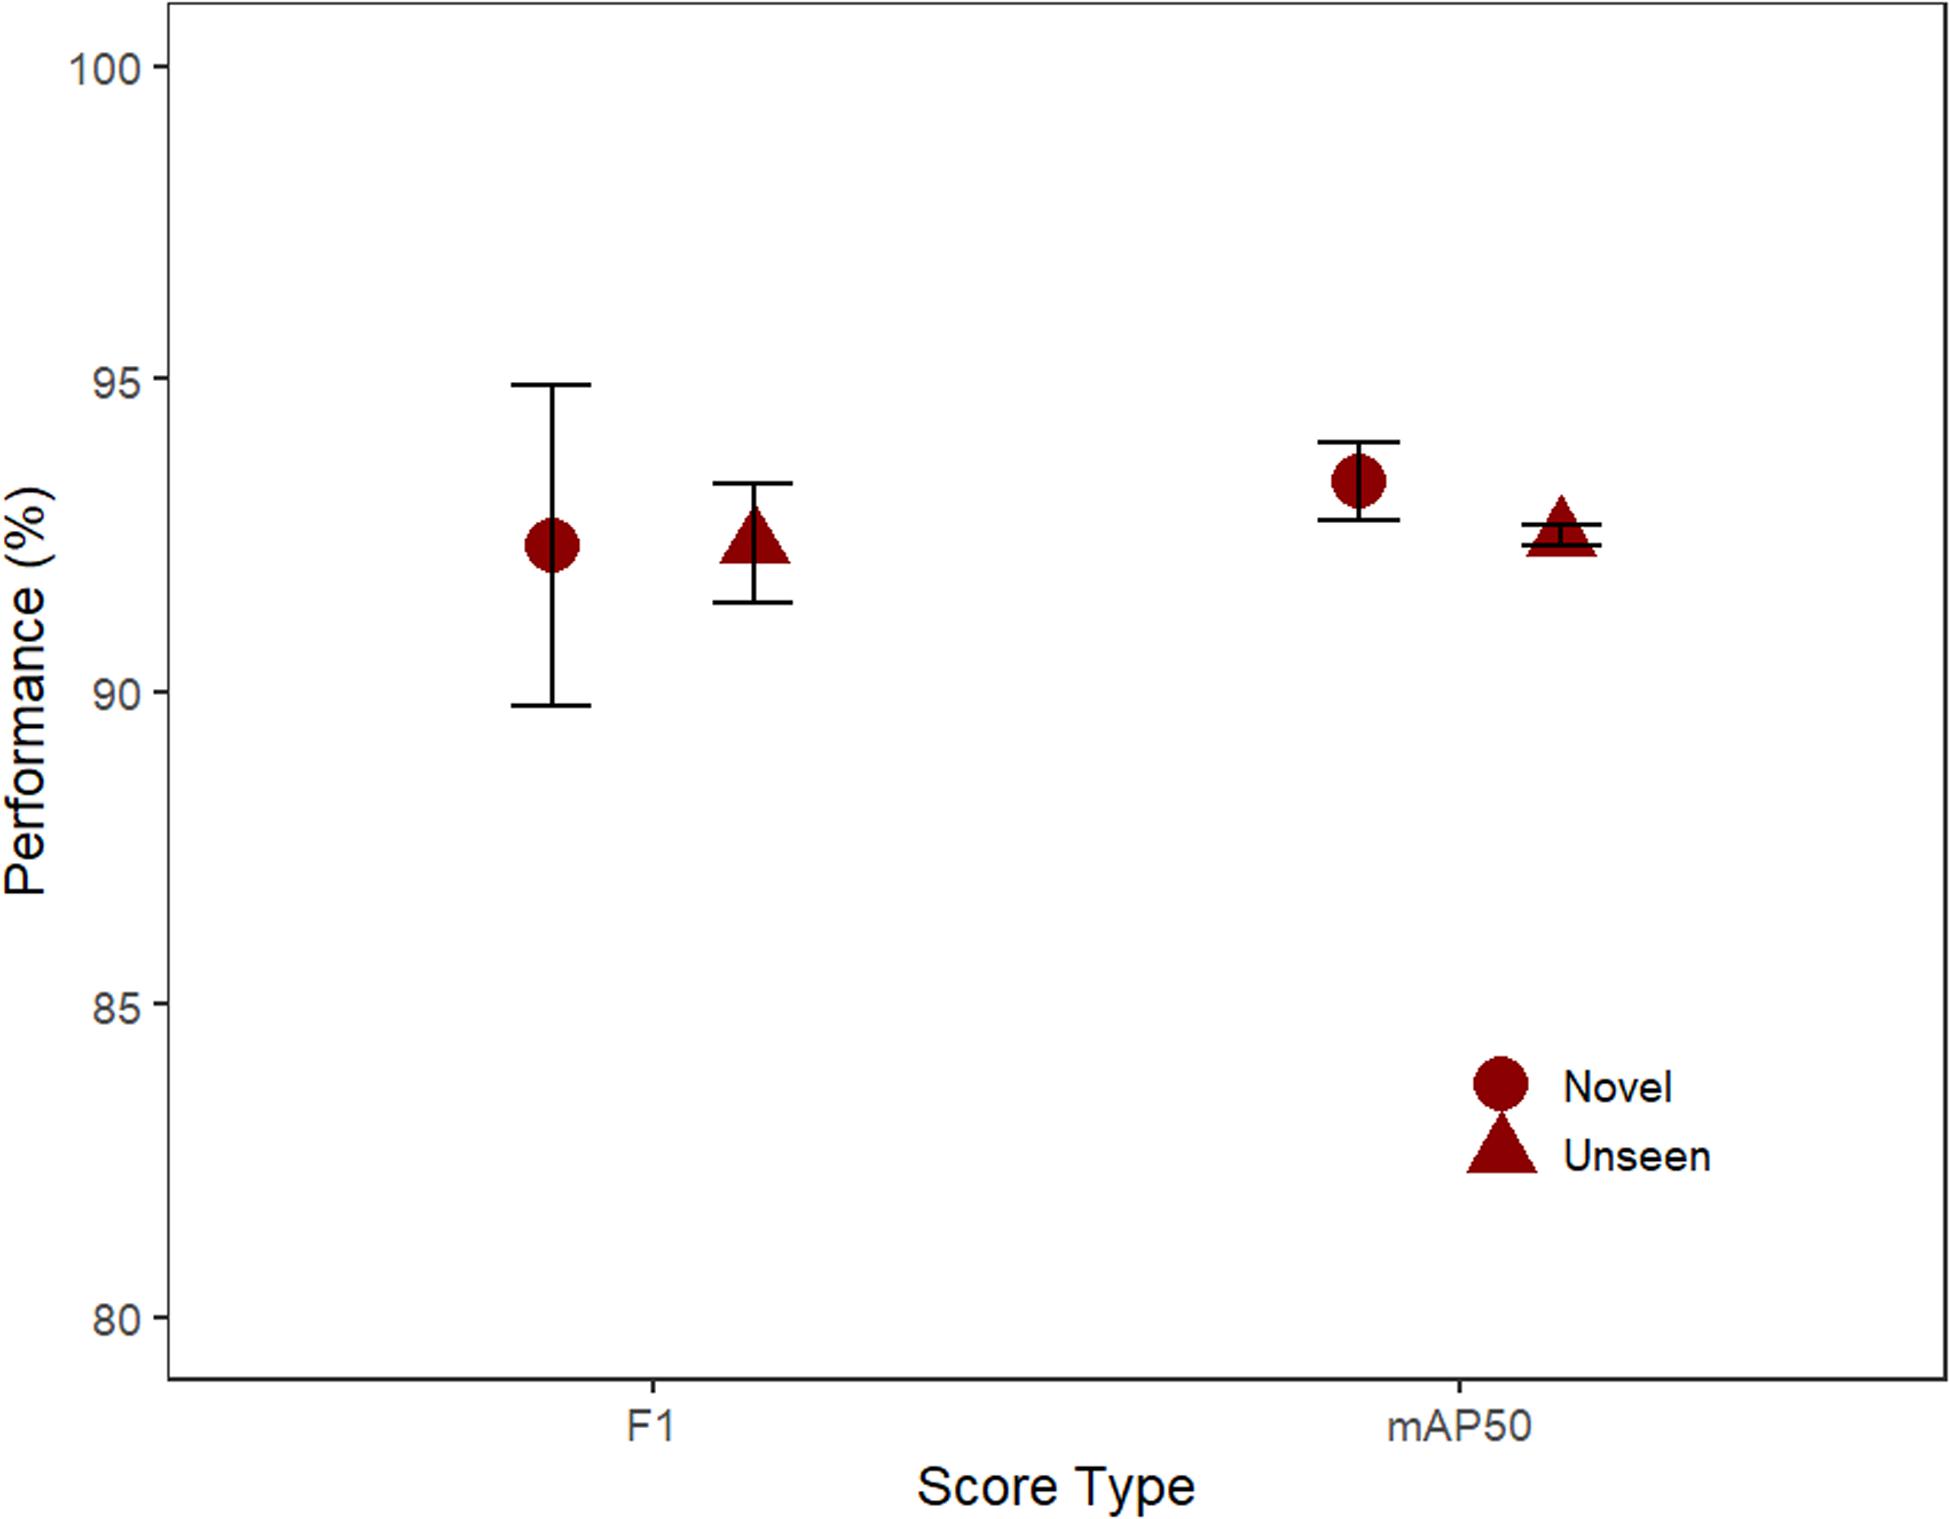
Figure 3. The performance of the three model’s F1 and mAP50 scores (mean, SE) for the unseen test footage from the same location and novel footage (Unseen: 32 videos, Novel: 32 videos).
Human vs. Machine
The computer algorithm achieved the highest mean F1 score in both the image (95.4%) and the video-based tests (86.8%), when compared with the experts and citizen scientists. The computer also had fewer false positives (incorrectly identifying another species as luderick) and false negatives (incorrectly ignoring a luderick) in the image test. The computer models also had the lowest rate of false positives in the video-based test when compared to both human groups, but had the highest rate of false negatives. The computer performed the task far faster than both human groups. Experts on average performed better (F1) than the citizen scientists in both tests and had higher accuracy scores (Table 1).
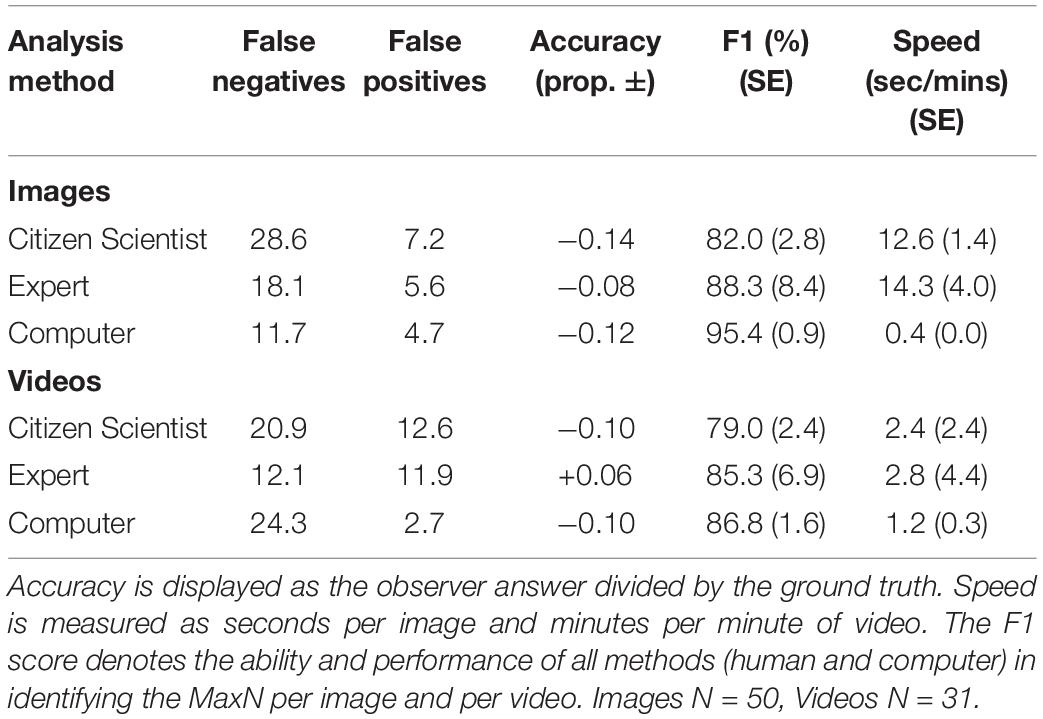
Table 1. Summary of performance measures comparing averaged scores from computer versus humans (citizen scientists and experts).
F1 scores were most variable for the citizen scientist group, with the difference between the lowest and the highest score for the image and video tests being 40.1 and 35.1%, respectively. The computer achieved the lowest variance, with these values only 3.1% for the video test and 1.7% for the image test (Figure 4).
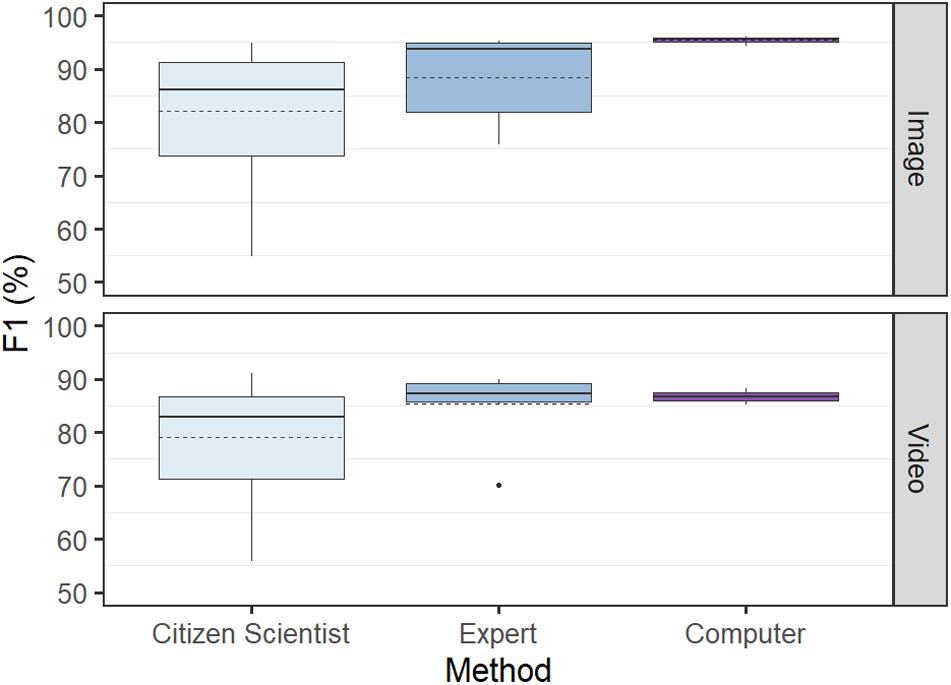
Figure 4. Overall test performance in determining abundance (F1) by computer versus humans (citizen scientists and experts) based on identical tests using 50 images and 31 videos. The citizen scientist group had the highest variance and lowest performance, while the computer had the lowest variance and highest performance. Solid line denotes median, and dashed line denotes mean.
Discussion
Our object detection models achieved high performance on a previously unseen dataset and maintained this performance on footage collected in a novel location. It outperformed both classes of humans (citizen scientists and experts) in speed and performance, with high consistency (i.e., low variability).
We clearly show that our model is fully capable of accurately performing the same on novel footage from locations beyond the data used for training. Few previous demonstrations of the utility of deep learning have tested algorithms under these novel conditions, but it is a factor which should be considered to determine how transferable the model is to environmental scientists. While our results suggest the algorithm is robust and flexible under different environmental conditions which vary with tides, water clarity, ambient light, and differences in non-target fish species and backgrounds, further work to quantify these differences would be needed before conclusive statements can be made. In a study conducted by Xia et al. (2018) on sea cucumbers, a novel test dataset comprised of internet images demonstrated an accuracy of 76.3%. This performance was significantly lower than the test dataset the model was trained on which achieved an accuracy of 97.6%. Similarly, Xu and Matzner (2018) attempted to monitor the effects of water turbines on local fish species at three different sites, but their model only generated a 53.9% accuracy. All three sites exhibited their own unique challenges to underwater data collection, including occlusion due to bubbles from fast-flowing water and debris, that made fish detection difficult even for a human observer. Their study demonstrates the aforementioned environmental challenges marine scientist face in using computer vision. One potential reason that our models produced high-performance results for the novel location could be the broad variation in environmental conditions and camera angles in the training data. Future work on this topic could extend the novel test to include an even wider array of novel locations and compare a series of novel sites that range from very similar environmental conditions to less similar conditions to determine when and why the deep learning algorithms lose efficacy.
The computer’s high performance, speed, and low variance compared to humans suggest that it is a suitable model to replace manual efforts to determine MaxN in marine environments. Deep learning may be the solution for researchers to avoid analytical bottlenecks (Gray et al., 2019a) as the computer performed the image-based test considerably faster on average than humans. The image test results are consistent with other deep learning related models comparing human and computer performance. Villon et al. (2018) trained a classification model which outperformed humans by approximately 5% in classifying still images of nine coral reef fish species. Similar results were found by Torney et al. (2019) using object detection to accurately survey wildebeest abundance in Tanzania at a rate of approximately 500 images per hour. Torney et al. (2019) calculated that computer analysis could reduce analysis of surveys from around 3 to 6 weeks done manually by up to four wildlife experts, down to just 24 h using a deep learning algorithm. Additionally, they found accuracy was not compromised, with the abundance estimate from deep learning within 1% of that from expert manual analysis. Like humans, the computer is reliant on the quality of the image it receives. Deep learning methods tend to decrease in performance when the picture quality is blurred or subject to excessive noise (Salman et al., 2016). In low light or high turbidity situations, image processing to improve the quality of the picture (such as canceling noise and improving contrast) can improve the performance of the model (Salman et al., 2016).
Previous studies comparing humans versus computers have predominantly used images rather than videos. When analyzing video footage, there is an assumption that humans have the comparative advantage when addressing uncertainty and ambiguity (Jarrahi, 2018). Fish that could not be positively identified early in the video may be identifiable later and vice versa. Humans can move back and forward within the video to correctly identify each fish when calculating MaxN, an ability our deep learning model lacks. The results show that even when humans seem to have the spatio-temporal advantage, the computer model still outperforms both the experts and citizen scientists. In our setup, inference time for video footage by the computer was about half that of humans. Analytical time could be further reduced by using multiple GPUs or by implementing parallel processing using multiple virtual machines.
Quantifying population trends is critical to understanding ecosystem health, so ecologists need measurements of population size that are consistent. We found less variation in computer measurements than for human observers. Human errors in observations are attributable to individual observer biases (Yoccoz et al., 2001) and can be standardized by having a single observer across all datasets. However, analyzing all data with a single observer is unrealistic because of the large volumes of data generated by video monitoring (Weinstein, 2017). Observer effects can alternatively be partitioned statistically by including each observer as a random factor in the statistical model. Nevertheless, the level of standardization achieved by deep learning methods, both within and among datasets, will improve the accuracy of population trend estimates.
Although recent advances in deep learning can make image analysis for animal ecology more efficient, there are still some ecological and environmental limitations. Ecological limitations include the difficulty in detection of small, rare, or elusive species, and therefore, abundance may not be able to be estimated in situ. Nevertheless, even plankton classification using deep learning has been attempted (Li and Cui, 2016; Py et al., 2016). This approach may be used to calculate the relative abundance of these microscopic organisms and therefore estimate a wild population density. This may be particularly useful in predicting and monitoring outbreaks of nuisance species such as crown-of-thorns sea stars (Hock et al., 2014) or stinging sea jellies (Llewellyn et al., 2016). Another key ecological issue when using computer vision is low sampling resolution due to the limited field of view from cameras, limiting the accuracy of determining abundance. Campbell et al. (2018) discovered that using cameras with a 360-degree field-of-view improved the accuracy of fish counts compared with single-camera MaxN counts. In future, it would be useful to combine deep learning with a 360-degree camera aspect when assessing abundance. The current limitations in computer vision imply that this technology is not suitable for all facets of animal ecology. Environmental conditions such as water clarity and light availability currently dictate the useability of footage in marine environments which subsequently affects the performance of the model (Salman et al., 2019). In addition, light penetration can be limited in many aquatic environments, drastically reducing the utility of cameras across all habitat types or during all sampling times.
The performance curves for our models suggest that they may be just as useful in determining fish abundance with fewer annotations than our full training set of 6,080 annotations. Therefore, less time was needed for training the algorithm as the accuracy of the model’s ability to predict the whole fish (mAP50) is not needed to determine abundance. As our model took approximately 60 h to train, running a performance curve while training we can see that the time to reach optimum performance could be two-thirds quicker at 20 h. Creating a performance curve is a useful step when calculating the cost-benefits of implementing a high performing model as well as monitoring algorithm issues such as overfitting. However, this does not take into account the time for human to be trained on which species to annotate. Fish identification experts may not need additional training while citizen scientists may. However, studies have shown that citizen scientist annotated data for deep learning can be as reliable as expertly annotated data (Snow et al., 2008) providing an additional low-cost solution for model training.
Deep learning methodologies provide a useful tool for consistent monitoring and estimations of abundance in marine environments, surpassing the overall performance of manual, human efforts in a fraction of the time. As this field advances, future ecological applications can include automation in estimating fish size (Costa et al., 2006), estimating abundance for multiple species simultaneously (Mandal et al., 2018), studying animal behavior (Valletta et al., 2017; Norouzzadeh et al., 2018), and monitoring pest species populations (Clement et al., 2005). Future technological advances in the application of interconnected devices and computer-to-computer information transfer may also provide ecologists with fully automated management systems via remote sensors connected to machine learning algorithms to achieve continuous environmental information at high temporal resolution (Allan et al., 2018). Given the significant advantages that these algorithms can provide, deep learning can indeed be a highly successful and complementary tool for marine animal ecology in the future.
Data Availability Statement
The datasets generated for this study are available on request to the corresponding author.
Ethics Statement
The studies involving human participants were reviewed and approved by the Griffith University Human Research Ethics Review. The patients/participants provided their written informed consent to participate in this study.
Author Contributions
ED and RC designed the study. ED and SL-M conducted the fieldwork. ED and EJ developed the deep learning architecture and user interface. ED drafted the manuscript. All authors commented on the manuscript and provided intellectual input throughout the project.
Funding
CB was supported by a Discovery Early Career Researcher Award (DE160101207) from the Australian Research Council. CB and RC were supported by a Discovery Project from the Australian Research Council (DP180103124). This work benefited from the support of the Global Wetlands Project.
Conflict of Interest
The authors declare that the research was conducted in the absence of any commercial or financial relationships that could be construed as a potential conflict of interest.
Acknowledgments
We thank the many fish experts and citizen scientists who participated in the study. This manuscript has been released as a pre-print at bioRxiv (Ditria et al., 2019).
References
Alexandropoulos, S.-A. N., Aridas, C. K., Kotsiantis, S. B., and Vrahatis, M. N. (2019). “Multi-objective evolutionary optimization algorithms for machine learning: a recent survey,” in Approximation and Optimization, eds I. C. Demetriou and P. M. Pardalos (Cham: Springer), 35–55. doi: 10.1007/978-3-030-12767-1_4
Allan, B. M., Nimmo, D. G., Ierodiaconou, D., Vanderwal, J., Koh, L. P., and Ritchie, E. G. (2018). Futurecasting ecological research: the rise of technoecology. Ecosphere 9:e02163. doi: 10.1002/ecs2.2163
Arellano-Verdejo, J., Lazcano-Hernandez, H. E., and Cabanillas-Terán, N. (2019). ERISNet: deep neural network for sargassum detection along the coastline of the mexican caribbean. PeerJ 7:6842. doi: 10.7717/peerj.6842
Baker, R., and Sheaves, M. (2006). Visual surveys reveal high densities of large piscivores in shallow estuarine nurseries. Mar. Ecol. Prog. Ser. 323, 75–82. doi: 10.3354/meps323075
Campbell, M. D., Salisbury, J., Caillouet, R., Driggers, W. B., and Kilfoil, J. (2018). Camera field-of-view and fish abundance estimation: A comparison of individual-based model output and empirical data. J./ Exp. Mar. Biol. Ecol. 501, 46–53. doi: 10.1016/j.jembe.2018.01.004
Chicco, D. (2017). Ten quick tips for machine learning in computational biology. BioData Min. 10:35. doi: 10.1186/s13040-017-0155-3
Clement, R., Dunbabin, M., and Wyeth, G. (2005). “Toward robust image detection of crown-of-thorns starfish for autonomous population monitoring,” in Proceedings of the Australasian Conference on Robotics and Automation 2005, Sydney NSW: Australian Robotics and Automation Association Inc.
Costa, C., Loy, A., Cataudella, S., Davis, D., and Scardi, M. (2006). Extracting fish size using dual underwater cameras. Aquac. Eng. 35, 218–227. doi: 10.1016/j.aquaeng.2006.02.003
Dai, Z., Carver, E., Liu, C., Lee, J., Feldman, A., Zong, W., et al. (2019). Segmentation of the prostatic gland and the intraprostatic lesions on multiparametic MRI using mask-RCNN. arXiv [Preprint]. doi: 10.1016/j.adro.2020.01.005
Ditria, E. M., Lopez-Marcano, S., Sievers, M. K., Jinks, E. L., Brown, C. J., and Connolly, R. M. (2019). Automating the analysis of fish abundance using object detection: optimising animal ecology with deep learning. bioRxiv [Preprint]. doi: 10.1101/805796
Dos Santos, A. A., and Gonçalves, W. N. (2019). Improving Pantanal fish species recognition through taxonomic ranks in convolutional neural networks. Ecol. Inform. 53:100977. doi: 10.1016/j.ecoinf.2019.100977
Everingham, M., Van Gool, L., Williams, C. K., Winn, J., and Zisserman, A. (2010). The pascal visual object classes (voc) challenge. Int. J. Comput. Vis. 88, 303–338. doi: 10.1007/s11263-009-0275-4
Ferguson, A. M., Harvey, E. S., Taylor, M. D., and Knott, N. A. (2013). A herbivore knows its patch: luderick, Girella tricuspidata, exhibit strong site fidelity on shallow subtidal reefs in a temperate marine park. PLoS One 8:e65838. doi: 10.1371/journal.pone.0065838
Galloway, A., Taylor, G. W., Ramsay, A., and Moussa, M. (2017). “The ciona17 dataset for semantic segmentation of invasive species in a marine aquaculture environment,” in Proceedings of the 14th Conference on Computer and Robot Vision (CRV), Edmonton, AB: IEEE.
Gilby, B. L., Olds, A. D., Connolly, R. M., Yabsley, N. A., Maxwell, P. S., Tibbetts, I. R., et al. (2017). Umbrellas can work under water: using threatened species as indicator and management surrogates can improve coastal conservation. Estuar. Coast. Shelf Sci. 199, 132–140. doi: 10.1016/j.ecss.2017.10.003
Gollan, J. R., and Wright, J. T. (2006). Limited grazing pressure by native herbivores on the invasive seaweed Caulerpa taxifolia in a temperate Australian estuary. Mar. Freshw. Res. 57, 685–694.
Gray, P. C., Bierlich, K. C., Mantell, S. A., Friedlaender, A. S., Goldbogen, J. A., and Johnston, D. W. (2019a). Drones and convolutional neural networks facilitate automated and accurate cetacean species identification and photogrammetry. Methods Ecol. Evol. 10, 1490–1500. doi: 10.1111/2041-210x.13246
Gray, P. C., Fleishman, A. B., Klein, D. J., Mckown, M. W., Bézy, V. S., Lohmann, K. J., et al. (2019b). A convolutional neural network for detecting sea turtles in drone imagery. Methods Ecol. Evol. 10, 345–355.
Halpern, B. S., Frazier, M., Potapenko, J., Casey, K. S., Koenig, K., Longo, C., et al. (2015). Spatial and temporal changes in cumulative human impacts on the world’s ocean. Nat. Commun. 6:7615.
He, K., Gkioxari, G., Dollár, P., and Girshick, R. (2017). “Mask r-cnn,” in Proceedings of the IEEE international Conference on Computer Vision, Honolulu, HI, 2961–2969.
Hock, K., Wolff, N. H., Condie, S. A., Anthony, K. R., and Mumby, P. J. (2014). Connectivity networks reveal the risks of crown-of-thorns starfish outbreaks on the great barrier reef. J. Appl. Ecol. 51, 1188–1196. doi: 10.1111/1365-2664.12320
Hodgson, A., Kelly, N., and Peel, D. (2013). Unmanned aerial vehicles (UAVs) for surveying marine fauna: a dugong case study. PLoS One 8:e79556. doi: 10.1371/journal.pone.0079556
Jarrahi, M. H. (2018). Artificial intelligence and the future of work: human-AI symbiosis in organizational decision making. Bus. Horiz. 61, 577–586. doi: 10.1016/j.bushor.2018.03.007
Leek, J. T., and Peng, R. D. (2015). Opinion: reproducible research can still be wrong: adopting a prevention approach. Proc. Natl. Acad. Sci. U.S.A. 112, 1645–1646. doi: 10.1073/pnas.1421412111
Lehtiniemi, M., Engström-Öst, J., and Viitasalo, M. (2005). Turbidity decreases anti-predator behaviour in pike larvae. Esox lucius. Environ. Biol. Fish. 73, 1–8. doi: 10.1007/s10641-004-5568-4
Li, X., and Cui, Z. (2016). “Deep residual(networks)for plankton classification,” in Proceedings of the OCEANS 2016 MTS/IEEE Monterey, Monterey, CA: IEEE, 1–4.
Llewellyn, L., Bainbridge, S., Page, G., O’callaghan, M., and Kingsford, M. (2016). StingerCam: a tool for ecologists and stakeholders to detect the presence of venomous tropical jellyfish. Limnol. Oceanogr. Methods 14, 649–657. doi: 10.1002/lom3.10119
Lowe, M., Morrison, M., and Taylor, R. (2015). Harmful effects of sediment-induced turbidity on juvenile fish in estuaries. Mar. Ecol. Prog. Ser. 539, 241–254. doi: 10.3354/meps11496
Maire, F., Alvarez, L. M., and Hodgson, A. (2015). “Automating marine mammal detection in aerial images captured during wildlife surveys: a deep learning approach,” in Proceedings of the Australasian Joint Conference on Artificial Intelligence, Berlin: Springer, 379–385. doi: 10.1007/978-3-319-26350-2_33
Malde, K., Handegard, N. O., Eikvil, L., and Salberg, A.-B. (2019). Machine intelligence and the data-driven future of marine science. ICES J. Mar. Sci. fsz057.
Mandal, R., Connolly, R. M., Schlacher, T. A., and Stantic, B. (2018). “Assessing fish abundance from underwater video using deep neural networks,” in Proceedings of the 2018 International Joint Conference on Neural Networks (IJCNN), Rio de Janeiro, 1–6.
Massa, F., and Girshick, R. (2018). Maskrcnn-Benchmark: Fast, Modular Reference Implementation of Instance Segmentation and Object Detection algorithms in PyTorch. Available: https://github.com/facebookresearch/maskrcnn-benchmark (accessed 03/06 2019).
Moniruzzaman, M., Islam, S. M. S., Bennamoun, M., and Lavery, P. (2017). “Deep learning on underwater marine object detection: a survey,” in Proceedings of the International Conference on Advanced Concepts for Intelligent Vision Systems, Antwerp, 150–160. doi: 10.1007/978-3-319-70353-4_13
Norouzzadeh, M. S., Nguyen, A., Kosmala, M., Swanson, A., Palmer, M. S., Packer, C., et al. (2018). Automatically identifying, counting, and describing wild animals in camera-trap images with deep learning. Proc. Natl. Acad. Sci. U.S.A. 115, E5716–E5725.
Orth, R. J., Carruthers, T. J., Dennison, W. C., Duarte, C. M., Fourqurean, J. W., Heck, K. L., et al. (2006). A global crisis for seagrass ecosystems. Bioscience 56, 987–996.
Piechaud, N., Hunt, C., Culverhouse, P. F., Foster, N. L., and Howell, K. L. (2019). Automated identification of benthic epifauna with computer vision. Mar. Ecol. Prog. Ser. 615, 15–30. doi: 10.3354/meps12925
Prechelt, L. (1998). “Early stopping-but when?,” in Neural Networks: Tricks of the Trade, eds K.-R. Müller and G. Orr (Berlin: Springer), 55–69. doi: 10.1007/3-540-49430-8_3
Py, O., Hong, H., and Zhongzhi, S. (2016). “Plankton classification with deep convolutional neural networks,” in Proceedings of the 2016 IEEE Information Technology, Networking, Electronic and Automation Control Conference, Chongqing: IEEE, 132–136.
Rawat, W., and Wang, Z. (2017). Deep convolutional neural networks for image classification: a comprehensive review. Neural Comput. 29, 2352–2449. doi: 10.1162/neco_a_00990
Salberg, A.-B. (2015). “Detection of seals in remote sensing images using features extracted from deep convolutional neural networks.,” in Proceedings of the IEEE International Geoscience and Remote Sensing Symposium (IGARSS), Milan, 1893–1896.
Salman, A., Jalal, A., Shafait, F., Mian, A., Shortis, M., Seager, J., et al. (2016). Fish species classification in unconstrained underwater environments based on deep learning. Limnol. Oceanogr. Methods 14, 570–585. doi: 10.1002/lom3.10113
Salman, A., Siddiqui, S. A., Shafait, F., Mian, A., Shortis, M. R., Khurshid, K., et al. (2019). Automatic fish detection in underwater videos by a deep neural network-based hybrid motion learning system. ICES J. Mar. Sci. fsz025.
Sievers, M., Brown, C. J., Tulloch, V. J., Pearson, R. M., Haig, J. A., Turschwell, M. P., et al. (2019). The role of vegetated coastal wetlands for marine megafauna conservation. Trends Ecol. Evol. 34, 807–817. doi: 10.1016/j.tree.2019.04.004
Snow, R., O’connor, B., Jurafsky, D., and Ng, A. Y. (2008). “Cheap and fast—but is it good?: evaluating non-expert annotations for natural language tasks,” in Proceedings of the Conference on Empirical methods in Natural Language Processing, Stroudsburg, PA: Association for Computational Linguistics, 254–263.
Torney, C. J., Lloyd-Jones, D. J., Chevallier, M., Moyer, D. C., Maliti, H. T., Mwita, M., et al. (2019). A comparison of deep learning and citizen science techniques for counting wildlife in aerial survey images. Methods Ecol. Evol. 10, 779–787. doi: 10.1111/2041-210x.13165
Valletta, J. J., Torney, C., Kings, M., Thornton, A., and Madden, J. (2017). Applications of machine learning in animal behaviour studies. Anim. Behav. 124, 203–220. doi: 10.1016/j.anbehav.2016.12.005
Villon, S., Mouillot, D., Chaumont, M., Darling, E. S., Subsol, G., Claverie, T., et al. (2018). A Deep learning method for accurate and fast identification of coral reef fishes in underwater images. Ecol. Inform. 48, 238–244. doi: 10.1016/j.ecoinf.2018.09.007
Waycott, M., Duarte, C. M., Carruthers, T. J., Orth, R. J., Dennison, W. C., Olyarnik, S., et al. (2009). Accelerating loss of seagrasses across the globe threatens coastal ecosystems. Proc. Natl.Acad. Sci. U.S.A. 106, 12377–12381. doi: 10.1073/pnas.0905620106
Weinstein, B. G. (2017). A computer vision for animal ecology. J. Anim. Ecol. 87, 533–545. doi: 10.1111/1365-2656.12780
Xia, C., Fu, L., Liu, H., and Chen, L. (2018). “In Situ Sea Cucumber Detection Based on Deep Learning Approach,” in Proceedings of the 2018 OCEANS-MTS/IEEE Kobe Techno-Oceans (OTO), Piscataway, NJ: IEEE, 1–4.
Xu, L., Bennamoun, M., An, S., Sohel, F., and Boussaid, F. (2019). “Deep learning for marine species recognition,” in Advances in Computational Intelligence, eds V. Balas, S. Roy, D. Sharma, and P. Samui (Berlin: Springer), 129–145. doi: 10.1007/978-3-030-11479-4_7
Xu, W., and Matzner, S. (2018). Underwater fish detection using deep learning for water power applications. arXiv [Preprint] Avaliable at: https://arxiv.org/abs/1811.01494 (accessed April 26, 2019).
Keywords: automation, deep learning, object detection, computer vision, fish abundance, monitoring tools
Citation: Ditria EM, Lopez-Marcano S, Sievers M, Jinks EL, Brown CJ and Connolly RM (2020) Automating the Analysis of Fish Abundance Using Object Detection: Optimizing Animal Ecology With Deep Learning. Front. Mar. Sci. 7:429. doi: 10.3389/fmars.2020.00429
Received: 27 February 2020; Accepted: 15 May 2020;
Published: 05 June 2020.
Edited by:
Emanuele Di Lorenzo, Georgia Institute of Technology, United StatesReviewed by:
Lida Teneva, Independent Researcher, Sacramento, United StatesErin L. Meyer-Gutbrod, University of California, Santa Barbara, United States
Copyright © 2020 Ditria, Lopez-Marcano, Sievers, Jinks, Brown and Connolly. This is an open-access article distributed under the terms of the Creative Commons Attribution License (CC BY). The use, distribution or reproduction in other forums is permitted, provided the original author(s) and the copyright owner(s) are credited and that the original publication in this journal is cited, in accordance with accepted academic practice. No use, distribution or reproduction is permitted which does not comply with these terms.
*Correspondence: Ellen M. Ditria, ZWxsZW4uZGl0cmlhQGdyaWZmaXRodW5pLmVkdS5hdQ==