 Miao Zhang
 Ying Wu
 Fuqiang Wang
 Dongfeng Xu
 Sumei Liu
 Meng Zhou4
- 1State Key Laboratory of Estuarine and Coastal Research, Faculty of Earth Sciences, East China Normal University, Shanghai, China
- 2State Key Laboratory of Satellite Ocean Environment Dynamics, Second Institute of Oceanography, State Oceanic Administration, Hangzhou, China
- 3Key Laboratory of Marine Chemistry Theory and Technology, College of Chemistry and Chemical Engineering, Ministry of Education, Ocean University of China, Qingdao, China
- 4Ocean Research Institute, School of Oceanography, Shanghai Jiao Tong University, Shanghai, China
Mesoscale eddies frequently observed in the northern slope region of the South China Sea (SCS) significantly modulate the biological and biogeochemical behavior of organic carbon (OC). There have been few comparative studies on biological and biogeochemical processes in a pair of anticyclonic eddies (ACEs) and cyclonic eddies (CEs) in continental slope. In our research, an ACE–CE pair was observed in June 2015 on the northern slope of the SCS. The surface dissolved OC (DOC) was approximately 3 μmol L–1 higher in the ACE than that of the CE, and particulate OC (POC) was approximately 3.9 μmol L–1 higher in the CE than in the ACE. Along the transect across the ACE and CE, the concentrations of DOC and fluorescent dissolved organic matter (FDOM) were coincident with the downwelling and upwelling in the eddies. In the euphotic layer, the total OC (TOC) stock in the ACE was higher than that of the CE with a lower POC/TOC ratio. There was net consumption of both DOC and POC in the upper 120 m in the ACE; however, net POC production was observed within the CE. The results also indicated that the production of fresh OC was higher in the CE while carbon export was higher in ACE. The vertical export rates of DOC and POC at 120 m in the ACE were approximately 70.2 and 1.69 mmol C m–2 day–1. Summarizing these measurements, the horizontal export of TOC across the slope to the SCS basin transported by dual eddies was estimated more than 22.1 × 10⁹ g C. This estimate implies that mesoscale eddies can contribute significantly to carbon sequestration in the SCS.
Introduction
It has been reported that the CO2 sink in global marginal seas is approximately 0.36 Pg C year–1, contributing 21% of the global ocean net sea-air CO2 flux (Takahashi et al., 2009; Dai et al., 2013). In continental slope regions, a number of physical processes, such as eddies, upwelling, cross-slope currents, and gravity currents near the benthic layer, play significant roles in burials of organic carbon (OC) produced on shelf regions and transport of OC to fuel ecosystems in basin areas. The particular carbon flux at slope regions is approximately 10 times that of the deep sea at the same depth (Walsh, 1991). Thus, the control mechanism of OC inventory and fluxes in slope regions is one of important keys to estimate global OC budgets (Hedges and Keil, 1995; de Haas et al., 2002).
Mesoscale eddies are ubiquitous and highly energetic in the ocean that significantly modulate biological and biogeochemical processes in marginal seas (Hu et al., 2014; Sarma et al., 2019b). In a cyclonic eddy (CE), nutrient-rich deep water is carried up to the surface with upwelling. Oschlies (2002) estimated that the typical simulated eddy-induced nitrate supply was 0.05 mol m–2 year–1, which accounted for approximately one-third of the total flux of nitrate into the euphotic zone in the subtropics and mid-latitudes. Higher concentrations of chlorophyll-a and nutrients, as well as OC production, were typically observed in a CE than those of an anticyclonic eddy (ACE) (Sarma et al., 2019b). Higher production of dissolved OC (DOC) was also reported in either an early-stage or decaying-stage ACE ecosystem (Lasternas et al., 2012; Chen et al., 2015). The surface water of ACEs containing high DOC and particulate OC (POC) were transported into deeper layers. At the depth decomposition of POC and consumption of DOC greatly affect OC composition, contributing to the oceanic carbon pool and carbon pump (Kolasinski et al., 2012; Lasternas et al., 2012). Recently, observations in Bay of Bengal indicated that mesoscale eddies could change patterns of carbon sources and sinks by vertical and horizontal water mixings (Sarma et al., 2019a). Many previous studies focused on the exchange of sea-air CO2 and inorganic carbon fluxes in the ocean (Dai et al., 2013; Jiao et al., 2014; Cao et al., 2019; Li et al., 2020), but the quantification of the production and consumption of OC within eddies remains controversial. Though eddy-driven POC export is often observed with sediment traps (Zhou et al., 2013; Jiao et al., 2014), the impact of eddies on DOC export is rarely addressed.
The South China Sea (SCS) is one of the largest semiclosed marginal seas bounded by China and Southeastern Asian countries with a narrow and steep continental slope in the north. The distributions of carbon sources and sinks in the SCS are diverse in different seasons. The northern slope and basin of the SCS is a source of atmospheric CO2 in the warm season, while this region behaves as a sink in the cold season. In total, over one year, the northern SCS is a weak sink of atmospheric CO2 (Zhai et al., 2013). The currents in the northern SCS are significantly influenced by the topography and monsoon, which produce upwelling along the coast and mesoscale eddies in the slope region (Wong et al., 2015; Liu et al., 2018a). Mesoscale eddies play vital roles in the SCS (Zhang et al., 2016; He et al., 2018), with a frequency of more than 30 mesoscales per year approximately of which 52% are CEs (Xiu et al., 2010). Chen et al. (2007) and Hu et al. (2014) illustrated that the estimated integrated primary production in the SCS was significantly higher in CEs and lower in ACEs than in non-eddy waters, which was coincident with the model results (Xiu and Chai, 2011). However, studies of OC export within eddies on the northern slope of the SCS are deficient, and more in situ observations are required. Here, we first evaluated the impact of eddies on OC in a pair of CE and ACE on the northern slope of the SCS. The vertical and horizontal OC fluxes were quantified, and the consumption and transformation of DOC and POC within the eddies were explored. We present and validate that the OC export to the mesopelagic zone in the SCS could be underestimated if mesoscale processes are ignored.
Sampling and Methods
Sample Collection
The study area was on the northern slope of the SCS (18°55′N–20°59′N; 114°14′E–116°42′E; Figure 1), and the cruise was conducted in the summer season between 13 and 29 June 2015. Hydrographic measurements and water samples were undertaken with a SBE911 plus dual conductivity-temperature-depth (CTD) sensor unit and SBE 32 Water Sampler (Seabird Scientific, Bellevue, WA, United States), which recorded temperature, salinity, pressure, density (σt), photosynthetic available radiation (PAR), and other variables. Dissolved oxygen (DO) was measured immediately after sample collection with a DO analyzer (Jenco, San Diego, CA, United States, Model 9173). The DO analyzer was calibrated with traditional iodometric method, and the r2 between the two methods is 0.90 with the slope 0.97. Apparent oxygen utilization (AOU) was calculated as the difference between oxygen saturation and the observed oxygen concentration (Garcia and Gordon, 1992). Euphotic layer depth was defined as the depth at which only 1% of the surface PAR remained (Kirk, 1994).
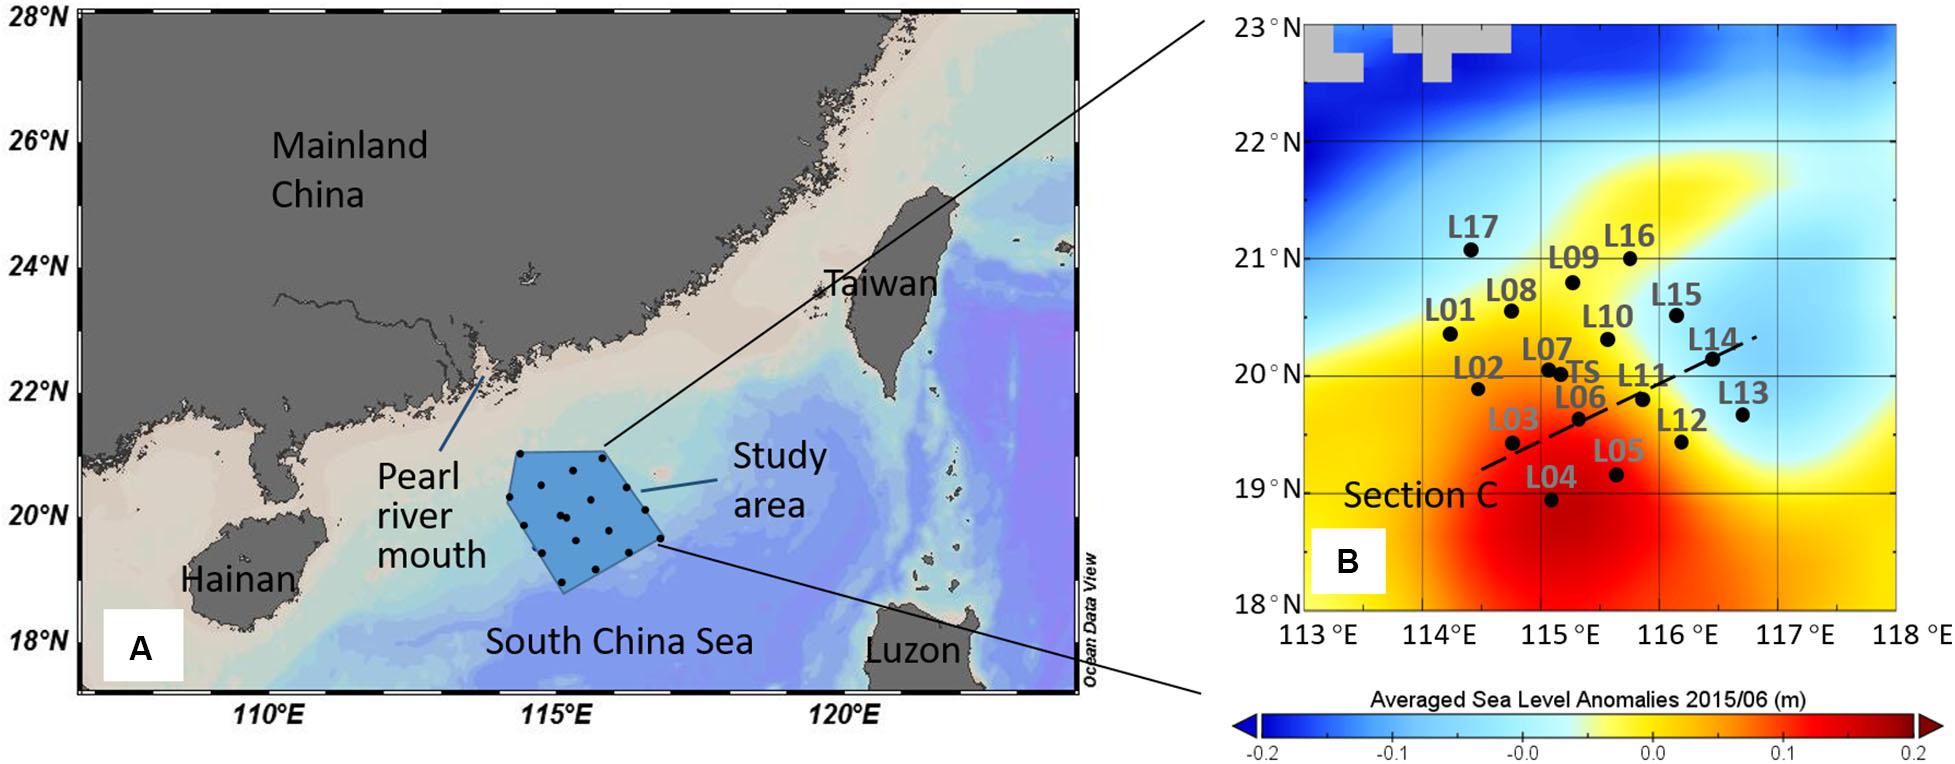
Figure 1. Study area in the South China Sea (A) and sampling stations in June 2015 (B). The color in (B) represented the averaged sea level anomalies in June 2015 (AVISO).
Seawater samples were retrieved with acid-cleaned Niskin bottles attached to the SBE32. All filtration was completed within 3 h to avoid alteration of microbes. DOC samples were filtered using nylon syringe filters with 0.45 μm pore size into 20 mL glass ampoules, which had been combusted at 450°C for 5 h. Fluorescent dissolved organic matter (FDOM) samples were filtered similarly to DOC samples but using PES syringe filters (Millipore, 0.22 μm pore size). POC samples were filtered through precombusted GF/F (Whatman, diameter 25 mm) filter with 0.7 μm pore size. The filter papers were folded and stored in foil. All the filtered samples were then stored in the dark at −20°C.
Sample Analysis
DOC samples were measured using a high-temperature catalytic oxidation method (Sugimura and Suzuki, 1988) with a Shimadzu TOC L-CPH analyzer. A five-point standard curve (R2 ≥ 0.999) was applied by measuring the solution of potassium hydrogen phthalate which was made freshly every day. Each DOC sample was determined three to five times until standard variation < 2%. Deep sea water provided by Dr. Dennis Hansell’s laboratory at the University of Miami was used for quality assessment. All the DOC concentrations of the deep sea water corresponded to the reference concentration (41–44 μmol L–1).
Fluorescent spectra were determined by a fluorescent spectrophotometer (HITACHI F-4500) with a 1 cm quartz cuvette. Emission (Em) spectra were scanned from wavelength of 300–550 nm with an interval of 1 nm, while excitation (Ex) spectra were recorded every 6 nm from 274 to 478 nm. The slit widths of both Ex and Em were 5 nm. The excitation emission matrix spectra (EEMs) were corrected by subtracting the Milli-Q water EEMs regarded as blank, which were scanned every day. EEMs were also Raman normalized with Milli-Q water EEMs that were scanned every time. Inner filters were ignored due to the low absorbance of open ocean samples (Kothawala et al., 2013). The components were identified from EEMs using the parallel factor (PARAFAC) analysis model with MATLAB 2014 as well as the DOMFluor toolbox (Stedmon and Bro, 2008; Murphy et al., 2013).
Before POC was measured, the filter paper with samples were dried and further processed with fuming acid to remove inorganic carbon. After acidification, POC was measured with elemental analysis isotope ratio mass spectrometry (EAIR/MS).
Results
Hydrologic Background and Mesoscale Eddy Characterization in the Northern Slope of the SCS
The current circulation in the northern slope of the SCS is influenced by monsoon, topography, and the Kuroshio. The potential temperature (θ) and salinity (S) properties of the seawaters at sampling stations are shown in Supplementary Figure S1. The red curve representing the SCS basin water was obtained by Argo at (13.46°N, 113.71°E) in June 2015, and the blue curve representing west Pacific Ocean water was obtained at (18.69°N, 130.35°E) in June 2015 (data from http://www.argo.org.cn/). The seawater characteristics at sampling stations in the northern slope region in June 2015 were relatively similar to those of the typical SCS basin water rather than those of the west Pacific Ocean water. The intruding water from Kuroshio Current had a minimal impact on the SCS slope water in summer, which was consistent with a weak intrusion of Kuroshio water in the Luzon Strait due to southwesterly winds (Xue et al., 2004). Because there was no heavy rain during the observation time, water with low salinity (<32) was observed in the study area and was possibly caused by the dilution of fresh coastal waters.
During the observation period, a pair of mesoscale eddies appeared on the slope: a CE in the east of the study area and an ACE in the west (Figure 1B). The CE and ACE could influence the study area during our investigation period (Supplementary Table S1). The CE moved westward and pushed the ACE off to the southwest (Hu and Zhou, 2019). A northwest-to-southeast corridor crossed the middle of the area carrying the high-temperature, low-salinity, low-density, and low-AOU surface water (Figure 2). Waters from the Pearl River plume were first transported eastward, turned southwestward into the study area, and then eventually entered the corridor and into the SCS basin, which induced a large phytoplankton bloom of 500 km long and 100 km wide on the slope (He et al., 2016; Hu and Zhou, 2019). Because of the impact of upwelling within the CE and riverine input, the water masses within the upper layer on the SCS slope region in June 2015 consisted of shelf water, SCS surface water, and SCS subsurface water, a three-endmember of mixing model could be used to derive the contribution of each water mass.
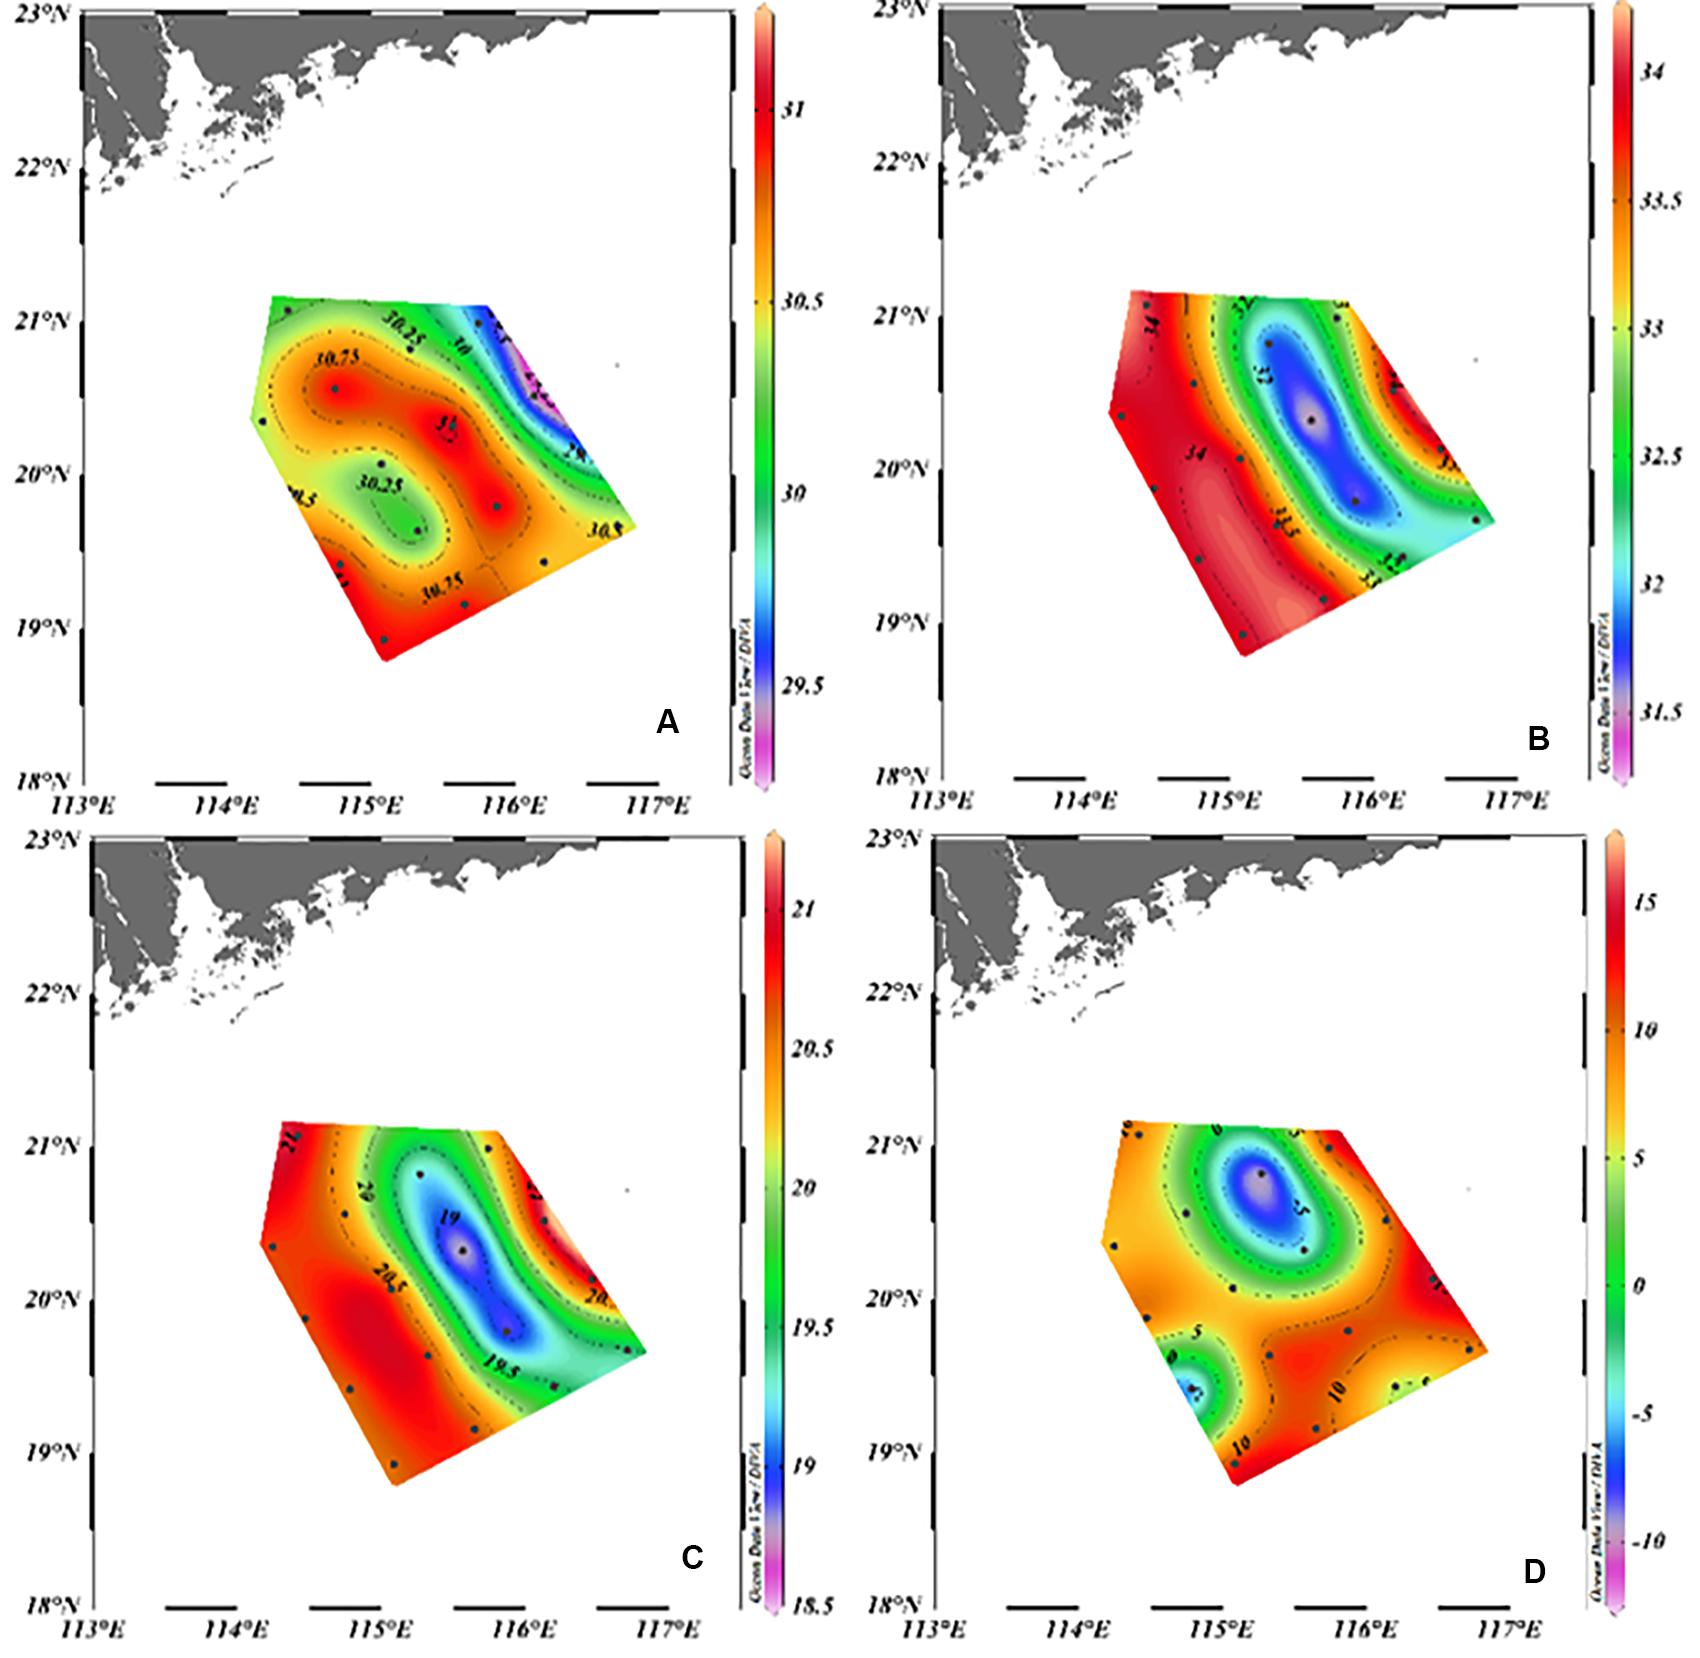
Figure 2. The surface distribution of temperature (°C) (A), salinity (B), σt (C), and AOU (μmol L–1) (D) in June 2015.
Components and Characteristics of Fluorescent DOM
The split-half model validation indicated that a five-component model, including three humic-like components (C1, C2, C3) and two protein-like components (C4 and C5) (Supplementary Figure S2), was the most appropriate representation of the data. PARAFAC model results were tested against the OpenFluor database to determine which components were matched in the published literature (Murphy et al., 2014). C1 had Ex/Em maxima of <270, 310/380 nm, with similar characteristics to fluorophore M (Coble, 1996). C1 was previously considered a marine or terrestrial humic-like component that could be from microbial-derived substances or byproducts of photobleaching of C2 (Tanaka et al., 2014; Li et al., 2015). C2 (Max Ex/Em ≤270, 350/435 nm) was generally categorized as terrestrially derived materials (Guéguen et al., 2014; Osburn et al., 2015), with similar characteristics of fluorophore C (Coble, 1996). C3, which was characterized as fluorophore A, had a broad excitation peak with maxima of approximately <250 and 400 nm and an emission maximum of 490 nm (Coble, 1996). C3 is a widespread component in aquatic environments, and has been reported as terrestrial humic substance composed of high-molecular-weight and aromatic organic compounds (Murphy et al., 2014; Catalá et al., 2015; Osburn et al., 2016). C4 (max Ex/Em = 280/350 nm) and C5 (max Ex/Em ≤270/320 nm) were categorized as a mixture of traditional protein-like peaks T and B (Coble, 1996), which were considered tryptophan- and tyrosine-like fluorophores, respectively (Osburn and Stedmon, 2011; Painter et al., 2018).
The percent of humic-like components (C1, C2, C3) increased from the surface to bottom while protein-like materials (C4, C5) decreased because of degradation. The ratio of total protein and total humic components was calculated as ΣP/ΣH = (C4+C5)/(C1+C2+C3), which represented the contribution of bioavailable organic matter to total DOM (Coble, 2007). A/C was defined as the ratio between the intensity of peak A (C3 in this paper) and peak C (C2 in this paper) indicating the degree of photodegradation. Higher A/C values indicated more organic matter was degraded by photobleaching (Coble, 1996). M/C indicated the contribution of marine sources to the total DOM and was calculated by the ratio of peak M (C1 in this paper) to peak C (C2 in this paper) (Helms et al., 2013).
Distribution of Dissolved and Particulate Organic Matter in the Northern Slope of the SCS
The surface (0–5 m) DOC and POC concentrations in summer at the northern slope of the SCS were 66–91 and 2.4–14.0 μmol L–1,respectively, with average concentrations of 80 ± 8 and 6.2 ± 3.4 μmol L–1 (Figure 3), which was comparable with the results of previous studies (Hung et al., 2007; Meng et al., 2017). High concentrations in summer were observed in the region intruded by the cross-shelf transport of coastal water (L09, L10, L11) (Figure 3). The surface DOC in the shelf water was 91 ± 0.6 μmol L–1, and the POC was 10.8 ± 2.7 μmol L–1, which were much higher than the surface DOC and POC in other areas. The average surface DOC concentration in the ACE (79 ± 5.6 μmol L–1) was greater than that within the CE (76 ± 9.3 μmol L–1) (Figure 3A). POC demonstrated the inverse behavior and was higher in the CE (7.0 ± 2.7 μmol L–1) than in the ACE (3.1 ± 0.4 μmol L–1) (Figure 3B).
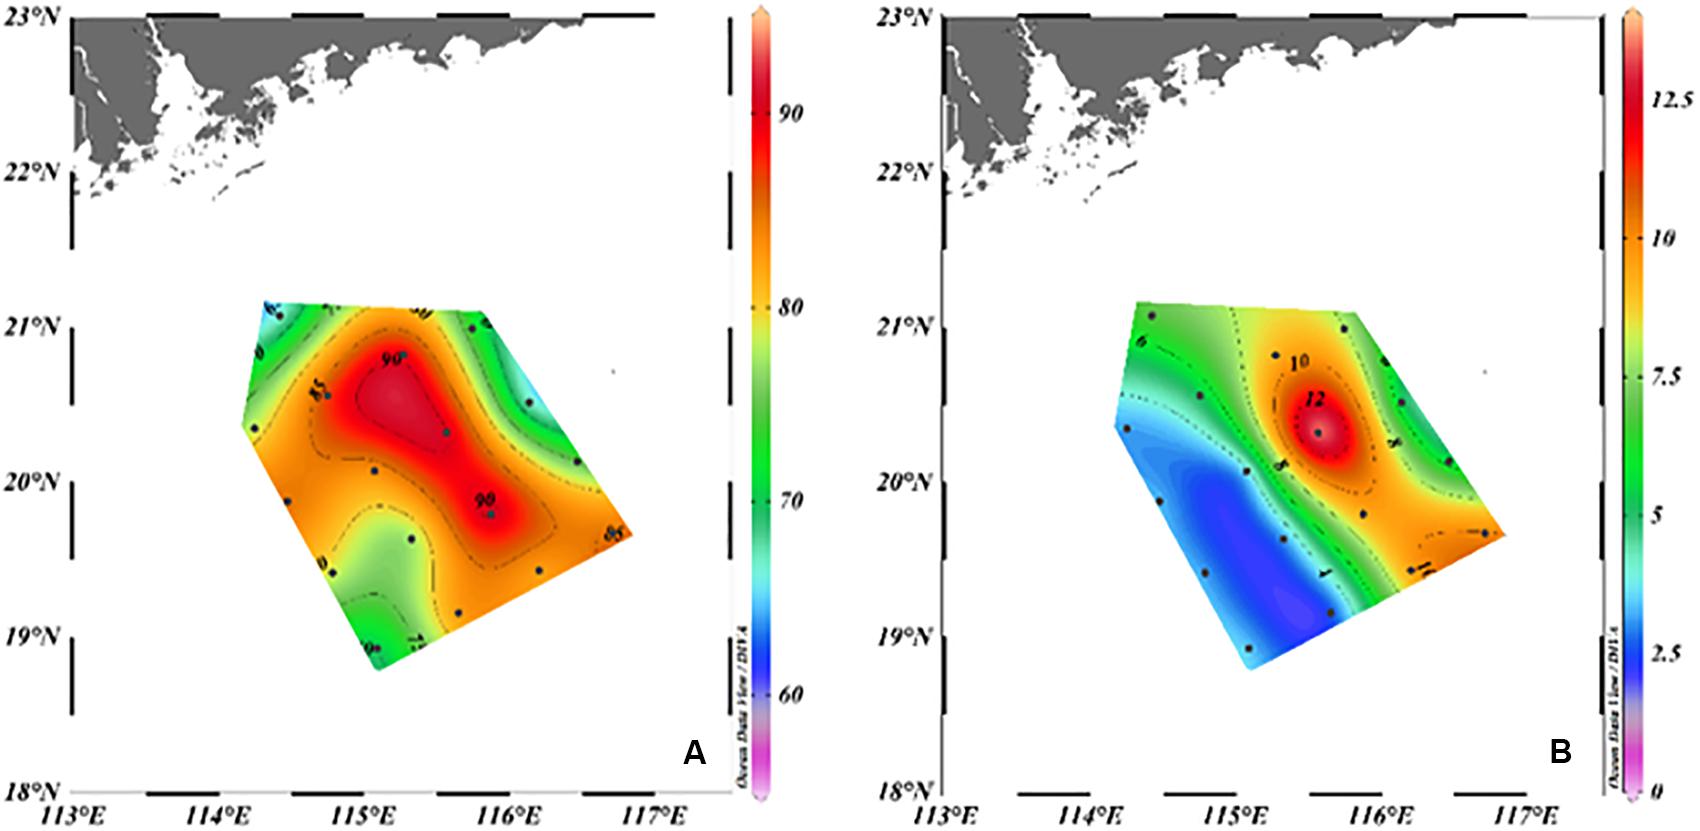
Figure 3. Surface distribution of DOC (μmol L–1) (A) and POC (μmol L–1) (B) in June 2015.
In the study area, Section C stretched across the eddy system (Figure 1B), which provided the chance to study the different behaviors of DOC and POC. Stations L02, L03, L04, L05, L06, and L07 were located in the ACE (downwelling), while stations L13, L14, and L15 were in the CE (upwelling). Stations L10, L11, and L12 were located on the rim shared by the two eddies (Figure 1B). Temperature and σt were impacted by the eddies in section C (Supplementary Figures S3a,c). The impact of the CE and ACE on salinity, however, was not conspicuous, as this variable could be more sensitive to the intrusion of shelf fresh water (Supplementary Figure S3b). The distributions of AOU, DOC, C4, C5, ΣP/ΣH, A/C, and M/C in the upper 450 m of section C were disturbed by physical processes, with lowered contours in the west and uplifted contours in the east (Figures 4A–G), which was coincident with the downwelling and upwelling within the ACE and CE in section C. The congruence could indicate the impacts of the ACE and CE on the distribution of DOC and FDOM. POC, which may be more influenced by in situ production than by eddies, was more abundant on the edge of the ACE-CE system (Figure 4H) due to the bloom caused by the cross shelf transport in summer (He et al., 2016).
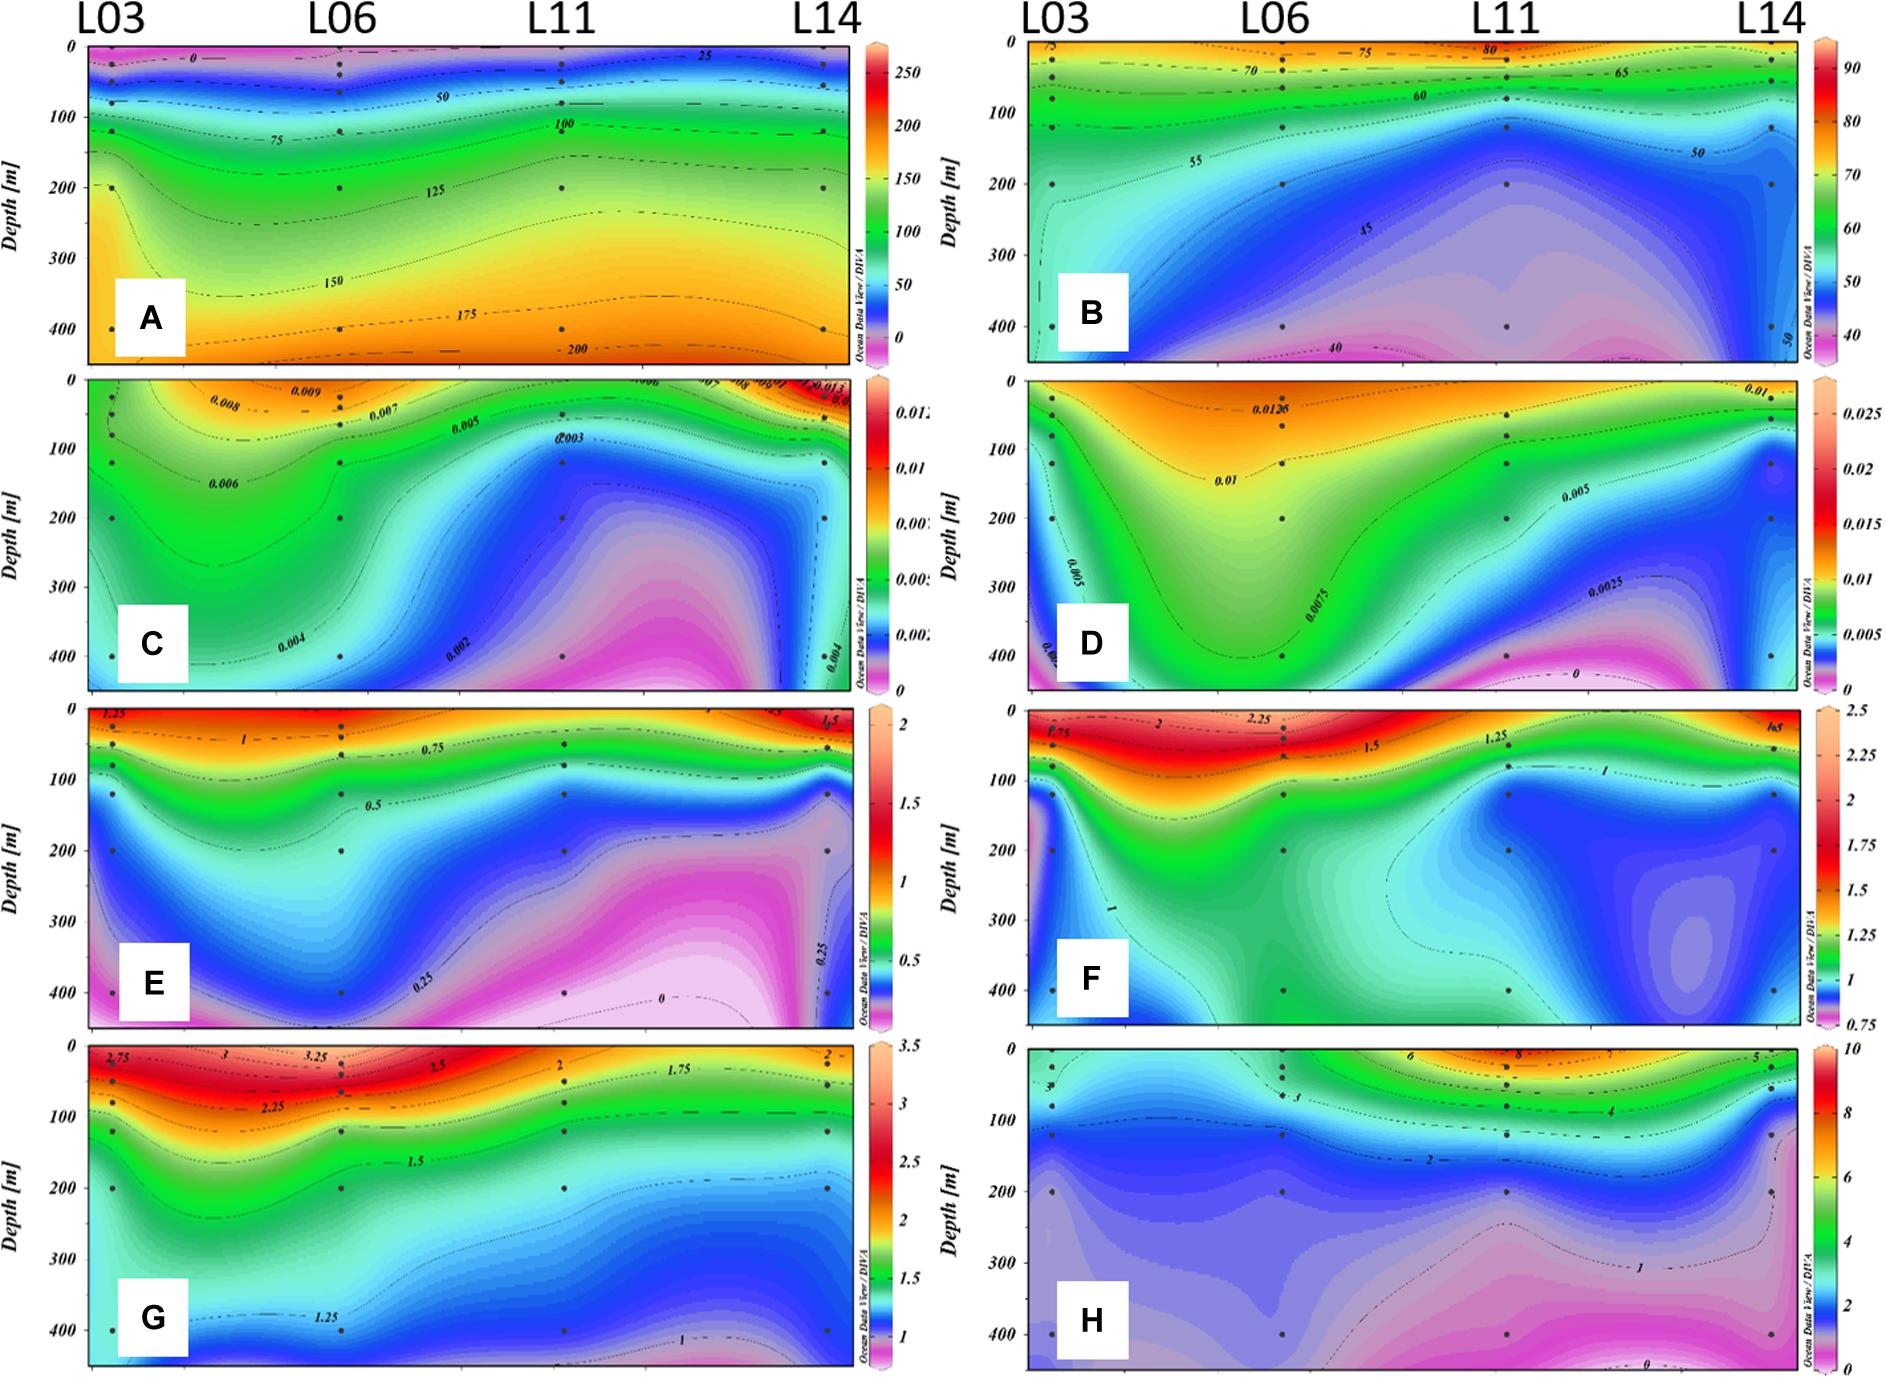
Figure 4. Distribution of AOU (μmol L–1) (a), DOC (μmol L–1) (b), C4 (R.U.) (c), C5 (R.U.) (d), ΣP/ΣH (e), A/C (f), M/C (g), and POC (μmol L–1) (h) of section C in June 2015.
During the observation period in 2015, stations L05 and L06 were located in the center of the ACE (downwelling), and stations L14 and L15 were close to the center of the CE (upwelling) (Figure 1B). AOU increased from the surface to the deep layer (Figures 4A, 5A) and was higher in the CE than in the ACE in the upper 450 m (Figure 5A). Increased primary production was observed within the CE because of the addition of nutrients (Xiu and Chai, 2011; Kolasinski et al., 2012). Because of the supplement of oxygen by photosynthesis, the AOU could be decreased. The high AOU within the CE in the SCS, however, might have been caused by the addition of AOU from the deep layer carried by upwelling, indicating that the AOU was more influenced by vertical water mixing than biological and biochemical processes in summer. The DOC concentration was higher at the surface than that at deep and was higher in the ACE than in the CE (Figures 4B, 5B). On the one hand, newly produced DOC by photosynthesis in the euphotic layer could be accumulated by downwelling. On the other hand, DOC in upwelling areas could be diluted by deep water with low DOC concentrations. C4 and C5 are protein-like fluorescent DOM components that are fresher and more bioavailable than humic components. C4 and C5 could be produced by primary production in the euphotic layer and be degraded progressively with depth. ΣP/ΣH indicated the proportion of protein-like components in DOM was highest in the surface, and decreased with depth. Similar to the DOC distribution, C4, C5, and ΣP/ΣH were higher in the downwelling area than in the upwelling area (Figures 5C–E). Photo degradation was more intense in the ocean surface layer with high A/C, with higher values in the ACE than in the CE (Figure 5F). Surface water converged in the ACE, resided longer, and experienced more exhaustive photobleaching. A high M/C could indicate high contribution of in situ production, which was observed higher value in the ACE than in the CE (Figure 5G). The contradiction could be explained by the accumulation of fresh products in the upper layer of the ACE. Because of the obvious impact of biological production, mesoscale eddies have a relatively low impact on the distribution of POC (Figure 5H).
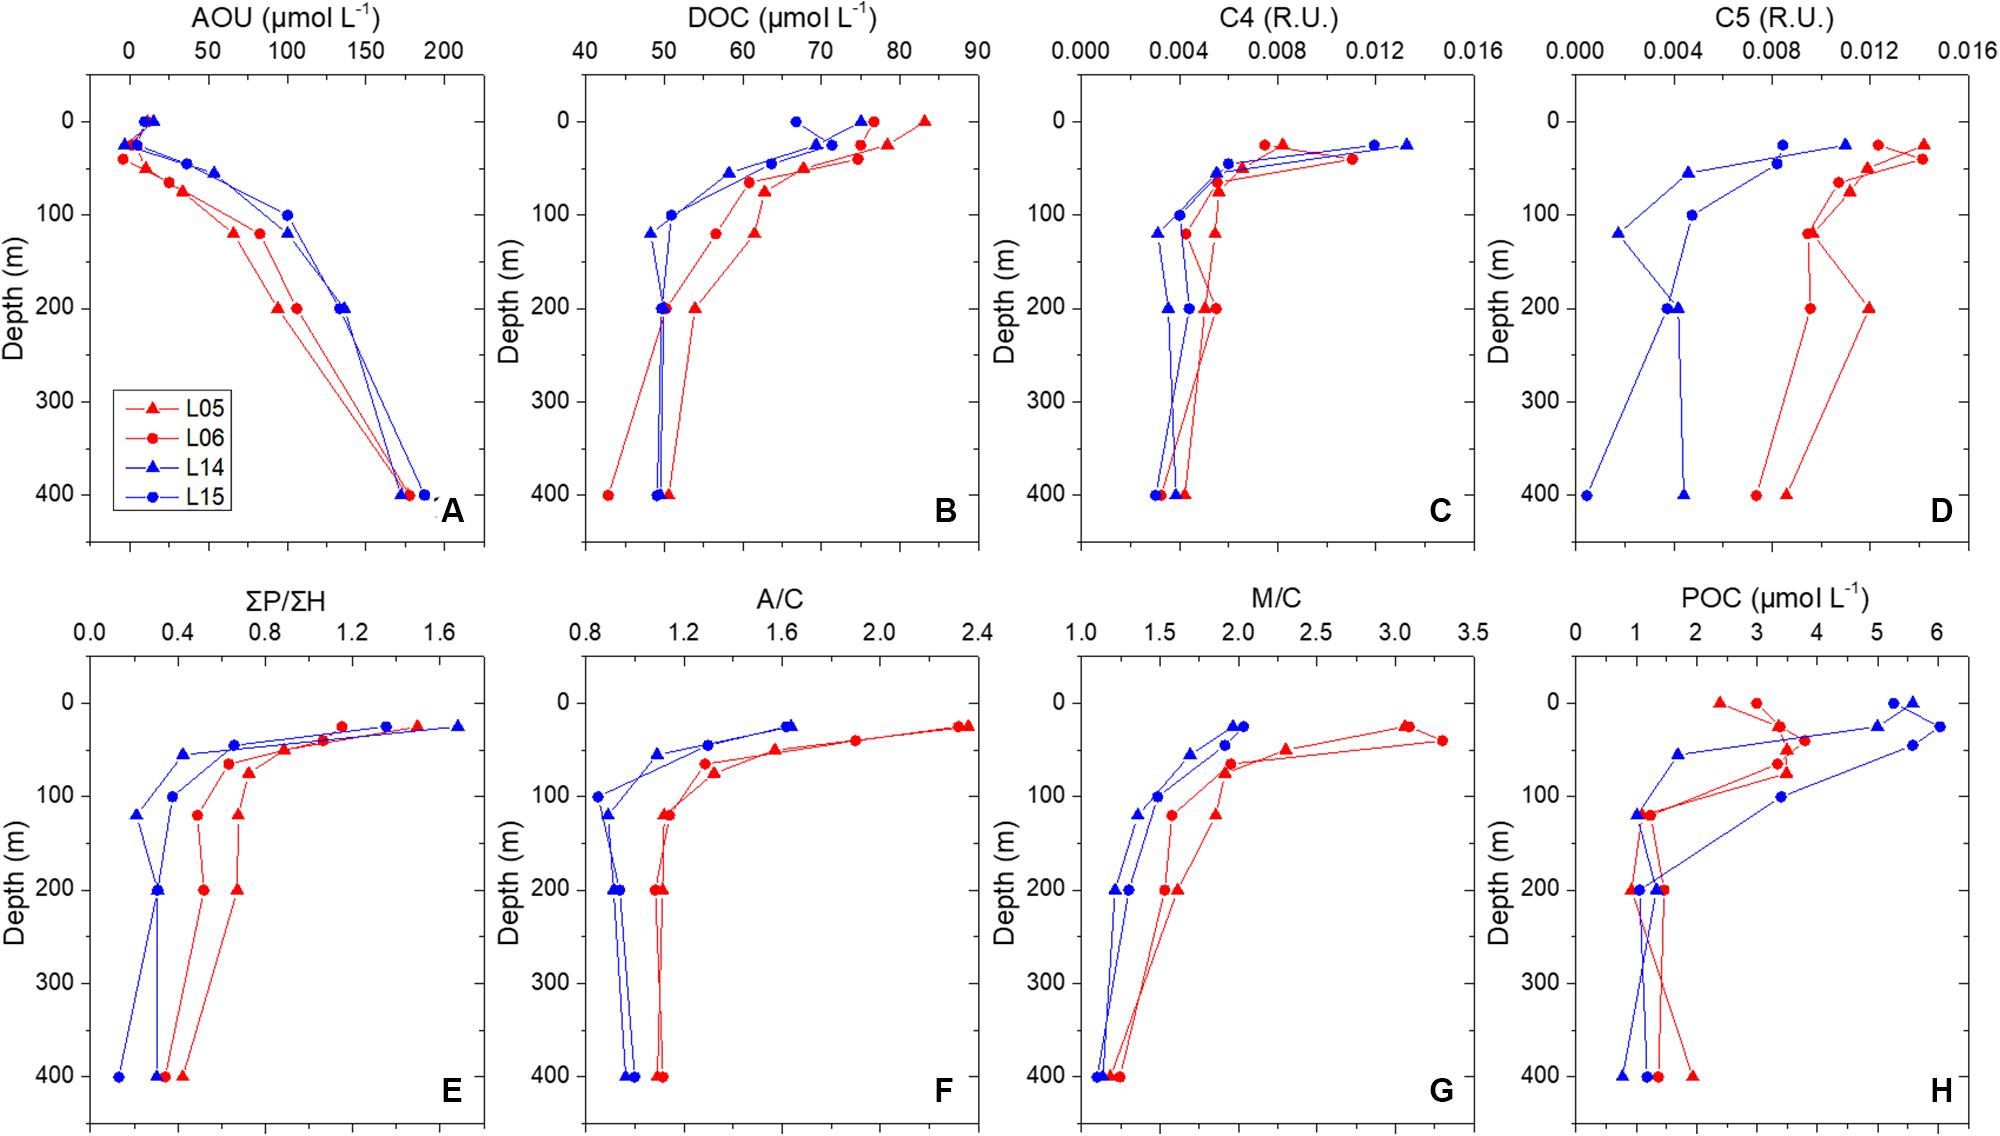
Figure 5. Vertical profile of AOU (μmol L–1) (A), DOC (μmol L–1) (B), C4 (R.U.) (C), C5 (R.U.) (D), ΣP/ΣH (E), A/C (F), M/C (G), and POC (μmol L–1) (H) in ACE (red lines) and CE (blue lines) in summer 2015.
Discussion
Impact of the ACE and CE on the Organic Carbon Inventory in the Euphotic Layer
The euphotic layer depths in the northern SCS were 83, 65, and 61 m in spring, summer, and autumn, respectively. The inventory of total OC (TOC, TOC = DOC+POC) in the euphotic zone was 62.2 ± 10.8 g m–2, while the contribution of POC was 6.81% of TOC.
During the observation period, the euphotic layer depth within the ACE was approximately 79 m, which was deeper than 62 m in the CE (Table 1). In the corridor area between these two eddies (transect including stations L10, L11, L12), phytoplankton bloomed. In the bloom, the euphotic layer was shallow approximately 51 m, which was possibly impacted by high concentrations of suspended particular matter from the coast preventing light penetration as well as the inverse wells of the ACE and CE. Similar results were reported in the Bay of Bengal, where the depth of the seasonal thermocline defined as the depth of the 20°C isotherm shoaled in the CE, but deepened in the ACE relative to non-eddy conditions due to the convergence and divergence associated with the ACE and CE, respectively (Sarma et al., 2019a).
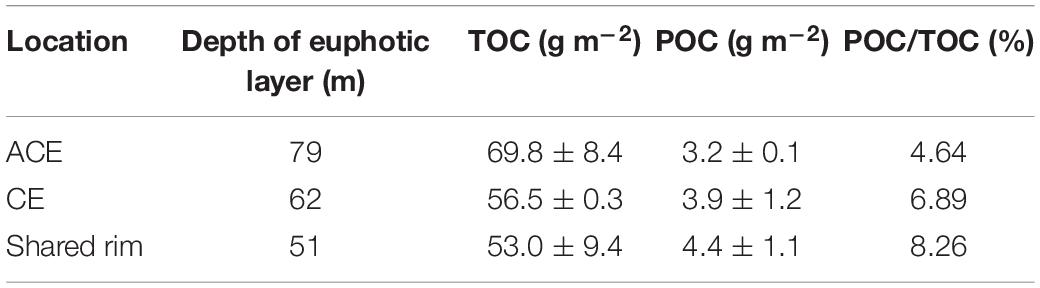
Table 1. Inventory of organic carbon in euphotic zone in summer 2015 of northern slope of SCS.
The inventory of TOC inside the ACE was 69.8 ± 8.4 g m–2, which was 1.23 and 1.32 times greater than the TOC inventories in the CE and in the corridor, respectively. However, the POC inventory in the ACE was lower than those of the CE and areas outside the eddies. POC inventories and ratios of POC to TOC can be related to the high OC production driven by nutrient addition with upwelling in the CE (Table 1). In the corridor of cross-slope-transport, the POC stock was most abundant, with the highest POC/TOC ratio (8.26), which was caused by the blooms and biota in coastal waters.
The Production and Consumption of Organic Matter in Eddies
The water in upper layer during June 2015 was composed of three water masses, shelf water (SHW), SCS surface water (SUR), and SCS subsurface water (SUB) based on θ-S characteristics (Supplementary Figure S4). To calculate the OC influenced by in situ biochemical processes, a three-endmember-mixing model was applied to derive the conservative components of DOC and POC in the study area in 2015 so that the OC produced by in situ biochemical processes can be delineated. The mixing model was based on the equilibrium equations of salinity and temperature:
where θ and S on the right of the formulas represent the in situ temperature and salinity, respectively. fshw, fsur, and fsub represent the fractions of shelf water, SCS surface water, and SCS subsurface water, respectively. Science the DOC and POC was correalted with temperature and salinity significantly (p < 0.01) (Supplementary Figure S5), conservative DOC (DOC0) and POC (POC0) were calculated by:
where DOCshw, DOCsur, and DOCsub represent the DOC concentrations of the three endmember water masses. Similarly, POCshw, POCsur, and POCsub represent the POC concentrations of three endmember water masses. The differences between in situ measured DOC (POC) and DOC0 (POC0) were DOC (POC) modulated by biochemical processes, marked as ΔDOC (ΔPOC):
If ΔDOC and ΔPOC were positive, net productions of DOC and POC were observed; conversely, net consumptions were observed.
Water masses with salinity < 32 are considered as the shelf water. Because of intrusion of the shelf water in the study area in 2015, the endmember temperature and salinity of the shelf water were the 30.6 ± 0.3°C and 31.7 ± 0.2, respectively (Supplementary Table S2). The DOC and POC endmembers in the shelf water were 91 ± 0.6 and 10.8 ± 2.7 μmol L–1, respectively. Except for those stations impacted by the shelf water, the average surface values of DOC and POC at other sampling stations were considered the endmember values of the SCS surface water because there is a lack of the west Pacific water during our study period. The temperature and salinity in the SCS surface water were 18.4 ± 1.4°C and 34.6 ± 0.0, respectively, and the DOC and POC were 76.7 ± 6.3 and 4.5 ± 2.2 μmol L–1, respectively. The water mass with the maximum salinity was regarded as the SCS subsurface water and had an average temperature and salinity of 18.4 ± 1.4°C and 34.2 ± 0.0, respectively. The average DOC and POC in the SCS subsurface water were 54.2 ± 4.4 and 1.90 ± 0.96 μmol L–1, respectively. σt was conservative to the water masses. The relative standard deviation between the model calculated σt0 and in situ-measured σt was less than ±5%, which means that three-endmember mixing model was reasonable.
The surface water was mainly a mixture of shelf water and SCS surface water in 2015 (Supplementary Figures S6a1,b1,c1). Because the bottom depth was only 80 m at Station L17, measurements were not used in the mixing model. The surface water in the ACE was almost completely constituted by the SCS surface water (Supplementary Figure S6b1). There was a small proportion of subsurface water in the eastern part of our study area, where the CE was observed (Supplementary Figure S6c1). In section C, the shelf water was distributed only in the upper 55 m (Supplementary Figure S6a2). In the upper 100 m, there was more SCS surface water in the ACE than in the CE, while there was more subsurface water in the CE than in the ACE (Supplementary Figures S6b2,c2), confirming the impacts of downwelling and upwelling in ACEs and CEs.
Both production and consumption existed in the upper layer (∼120 m) in 2015 (Figure 6). The dashed gray line in Figure 6 is the 1:1 line, indicating that the amount of OC produced was equal to the amount of carbon consumed. Above the gray line, the measured DOC (POC) was higher than the modeled DOC0 (POC0), which represented in situ net production (ΔDOC, ΔPOC > 0). The measured DOC (POC) was less than the modeled DOC0 (POC0) below the gray line, indicating there was net consumption at some stations (ΔDOC, ΔPOC < 0). Biochemically modulated DOC and POC were obviously impacted by physical processes in the eddies, especially on the surface. Net production and net consumption of DOC (Figure 6A1) were observed on the surface in the ACE (red triangles) and CE (blue triangles), respectively, while net consumption and net production of POC (Figure 6B1) were observed in the ACE and CE. The discrimination of biochemically modulated oraganic matter in the ACE and CE was not as apparent in the subsurface than in surface. There was net consumption of both DOC and POC at more stations in the ACE (Figures 6A2,B2), with integrated ΔDOC and ΔPOC in the upper 120 m of −173.7 and −51.1 mmol m–2, respectively. In the CE, samples with negative ΔDOC (Figure 6A2) and positive ΔPOC (Figure 6B2) were observed at more stations. The integrated ΔDOC in the upper 120 m was −234.2 mmol m–2, indicating that there was more removal than production of DOC in the upwelling area. The integrated ΔPOC in the CE of 45.5 mmol m–2, and POC was produced more in CE. The net removal of DOC has been reported in the Pearl River estuary and Arctic shelf, possibly resulting from the substantial portion of bioavailable DOC and insufficient marine in situ productivity (Alling et al., 2010; He et al., 2010). Wu et al. (2017) and Meng et al. (2017), however, illustrated net DOC production of 2.8 ± 3.0 and 3.1 ± 1.3 μmol L–1 in the river plume and coastal upwelling zone, respectively. The different results could be caused by differences in the coastal water fraction and the stage of the eddies (Halewood et al., 2012; Lasternas et al., 2013). The loss of OC could be due to photochemical oxidation and microbial degradation (Bauer et al., 2013 and the references therein). The ACE could increase the depth of the euphotic layer, resulting in increased photodegradation of OC. Eddies could also adjust the microbial species composition in the upper layer because of changes in nutrients and organic matter characteristics (Doblin et al., 2016; McGillicuddy, 2016). The net consumption of DOC in the CE was likely to result from the utilization of microbes from the deep layer. The correlation between ΔDOC and ΔDIC (dissolved inorganic carbon) indicated the contribution of OC to the CO2 pool (Meador and Aluwihare, 2014; Wu et al., 2017). In June 2015, the net consumption of DOC in the ACE and the CE implied a potential CO2 source of northern slope of the SCS, which might have resulted from the carbon dynamics within mesoscale eddies.
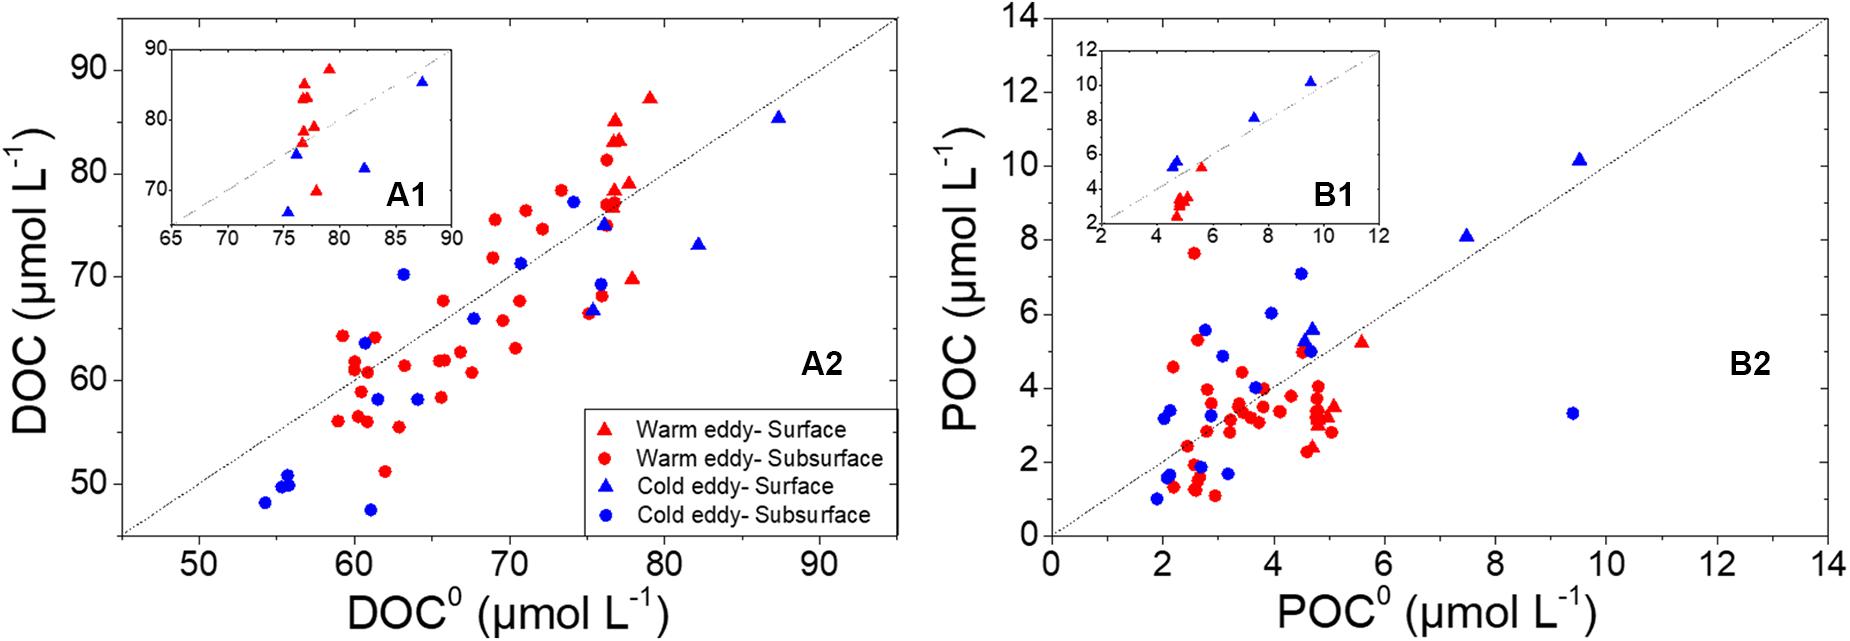
Figure 6. Measured DOC vs. modeled DOC0 (A) and measured POC vs. modeled POC0 (B) derived from the mixing model. Triangles represent samples of surface, while circles represent subsurface samples. Marks in red represent samples in warm eddy and in blue represent samples influenced by cold eddy. The gray dashed line means that the modeled value was equal to measured value.
Upwelling could transport relatively nutrient-rich water from the deep layer, acting as a supplement to oligotrophic surface water (Siegel et al., 2011; Sarma et al., 2019b). On the one hand, nutrients could stimulate the primary production of phytoplankton, increasing the production of fresh OC, especially POC (Romankevich, 2013). On the other hand, bacteria could be excited by nutrients, especially in the oligotrophic zone, resulting in the increased transformation of OC (Zweifel et al., 1993; Räsänen et al., 2014). Biochemically modulated dissolved inorganic nitrogen (ΔDIN), dissolved inorganic phosphorus (ΔDIP), and dissolved inorganic silica (ΔDISi) were derived with the same three endmember mixing model. In the ACE and CE, the correlations between OC and nutrients were negative (Table 2), indicating that inorganic nutrient consumption had a greater impact on the production of OC. In addition, the degradation of DOC and POC may induce the reproduction of inorganic nutrients (Han et al., 2012; Wu et al., 2017). In the ACE, ΔDOC had no significant relationship with nutrients, indicating that ΔDOC accumulation was caused by processes with limited nutrient participation. There was no nutrient addition to the surface layer within the ACE; thus, the production of POC was limited, and POC degradation was high. In the CE, however, nutrients stimulated primary productivity, and net POC production existed.
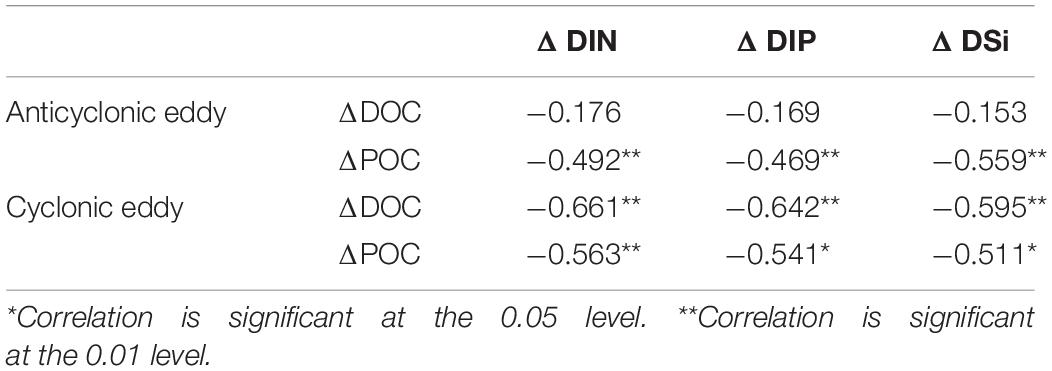
Table 2. Correlation between biochemical modulated organic carbon and nutrient.
The flux of net OC could be calculated by ΔDOC or ΔPOC × Eddy area × N, where N is the number of eddies per year. In the SCS, approximately 32.8 ± 3.4 eddies are observed by satellite each year, 52% of which are CEs and 48% of which are ACEs, and the average radius of the eddies is 87.4 km (Xiu et al., 2010). The fluxes of net DOC consumption in the ACE and CE were 0.79 and 1.15 Tg C year–1, respectively, which were much higher than the river input (0.46 ± 0.3 Tg C year–1) (Liu et al., 2018b). The net POC consumption in the ACE was 0.23 Tg C year–1, while the net production in the CE was 0.22 Tg C year–1, resulting in a relative equilibrium of POC. However, the frequency and intensity of mesoscale eddies in the SCS are various in different seasons, which could change the production and consumption of OC. Thus, the dynamic of DOC and POC in eddies occurring in spring, autumn, and winter remains to be estimated.
Vertical and Horizontal Export of Organic Carbon Driven by Mesoscale Eddies in the Slope Region
Downwelling in the ACE could enhance carbon export in the ocean. Zhou et al. (2013) estimated the POC flux in ACEs of the SCS using 234Th, reporting that the flux was 1.6-fold higher in the eddy region than in the non-eddy region. The carbon export rates were calculated with the advection-diffusion equations (8) and (9):
where w was vertical velocity, which was reported to be (4.4–31.7) × 10–4 cm s–1 in the core of the ACE and (5.8–14.7) × 10–4 cm s–1 in the CE at the depth of 120 m (Yang and Liu, 2003; Yuan et al., 2007; Hu et al., 2011; He et al., 2015). Kz is the vertical eddy diffusivity coefficient, which could be considered 1 × 10⁻⁴ m2 s–1 (Cai et al., 2003). [DOC] and [POC] represent the DOC and POC concentrations, respectively, while z is the water depth. In the CE, carbon was transported upward on average because of upwelling in the center, with a DOC transport rate of 43.2 ± 0.941 mmol C m–2 day–1 and a POC transport rate of 1.60 ± 1.01 mmol C m–2 day–1 (Figure 7). The DOC and POC export rates at 120 m in the ACE core were 70.2 ± 3.61 and 1.69 ± 0.182 mmol C m–2 day–1, respectively (Figure 7). The POC export at 100 m in the ACE was comparable to that calculated by 210Po–210Pb disequilibria (unpublished data) in summer in the northern slope region, which accounted for 5.45% of the average primary production in the study area (unpublished data). Cai et al. (2015) have reported the POC export flux at 100 m based on 234Th/238U disequilibrium was 2.0–6.4 mmol C m–2 day–1 in the northern slope region of SCS in summer, which was a little higher than that transported by ACE. In total, the mesoscale eddies modulated the export of DOC and POC by accelerating transport downward at a rate of 27.0 and 0.09 mmol C m–2 day–1. The intense vertical mixing induced by the mesoscale eddies greatly increased the carbon export rate was much higher than that in the same depth (∼100 m) in the SCS basin (non-eddy region) with export rate of 0.27–1.3 mmol C m–2 day–1 for DOC and 0.06–0.19 mmol C m–2 day–1 for POC (Hung et al., 2007), indicating a considerable contribution of mesoscale eddies, especially the ACE, on carbon export from upper to deep layers.
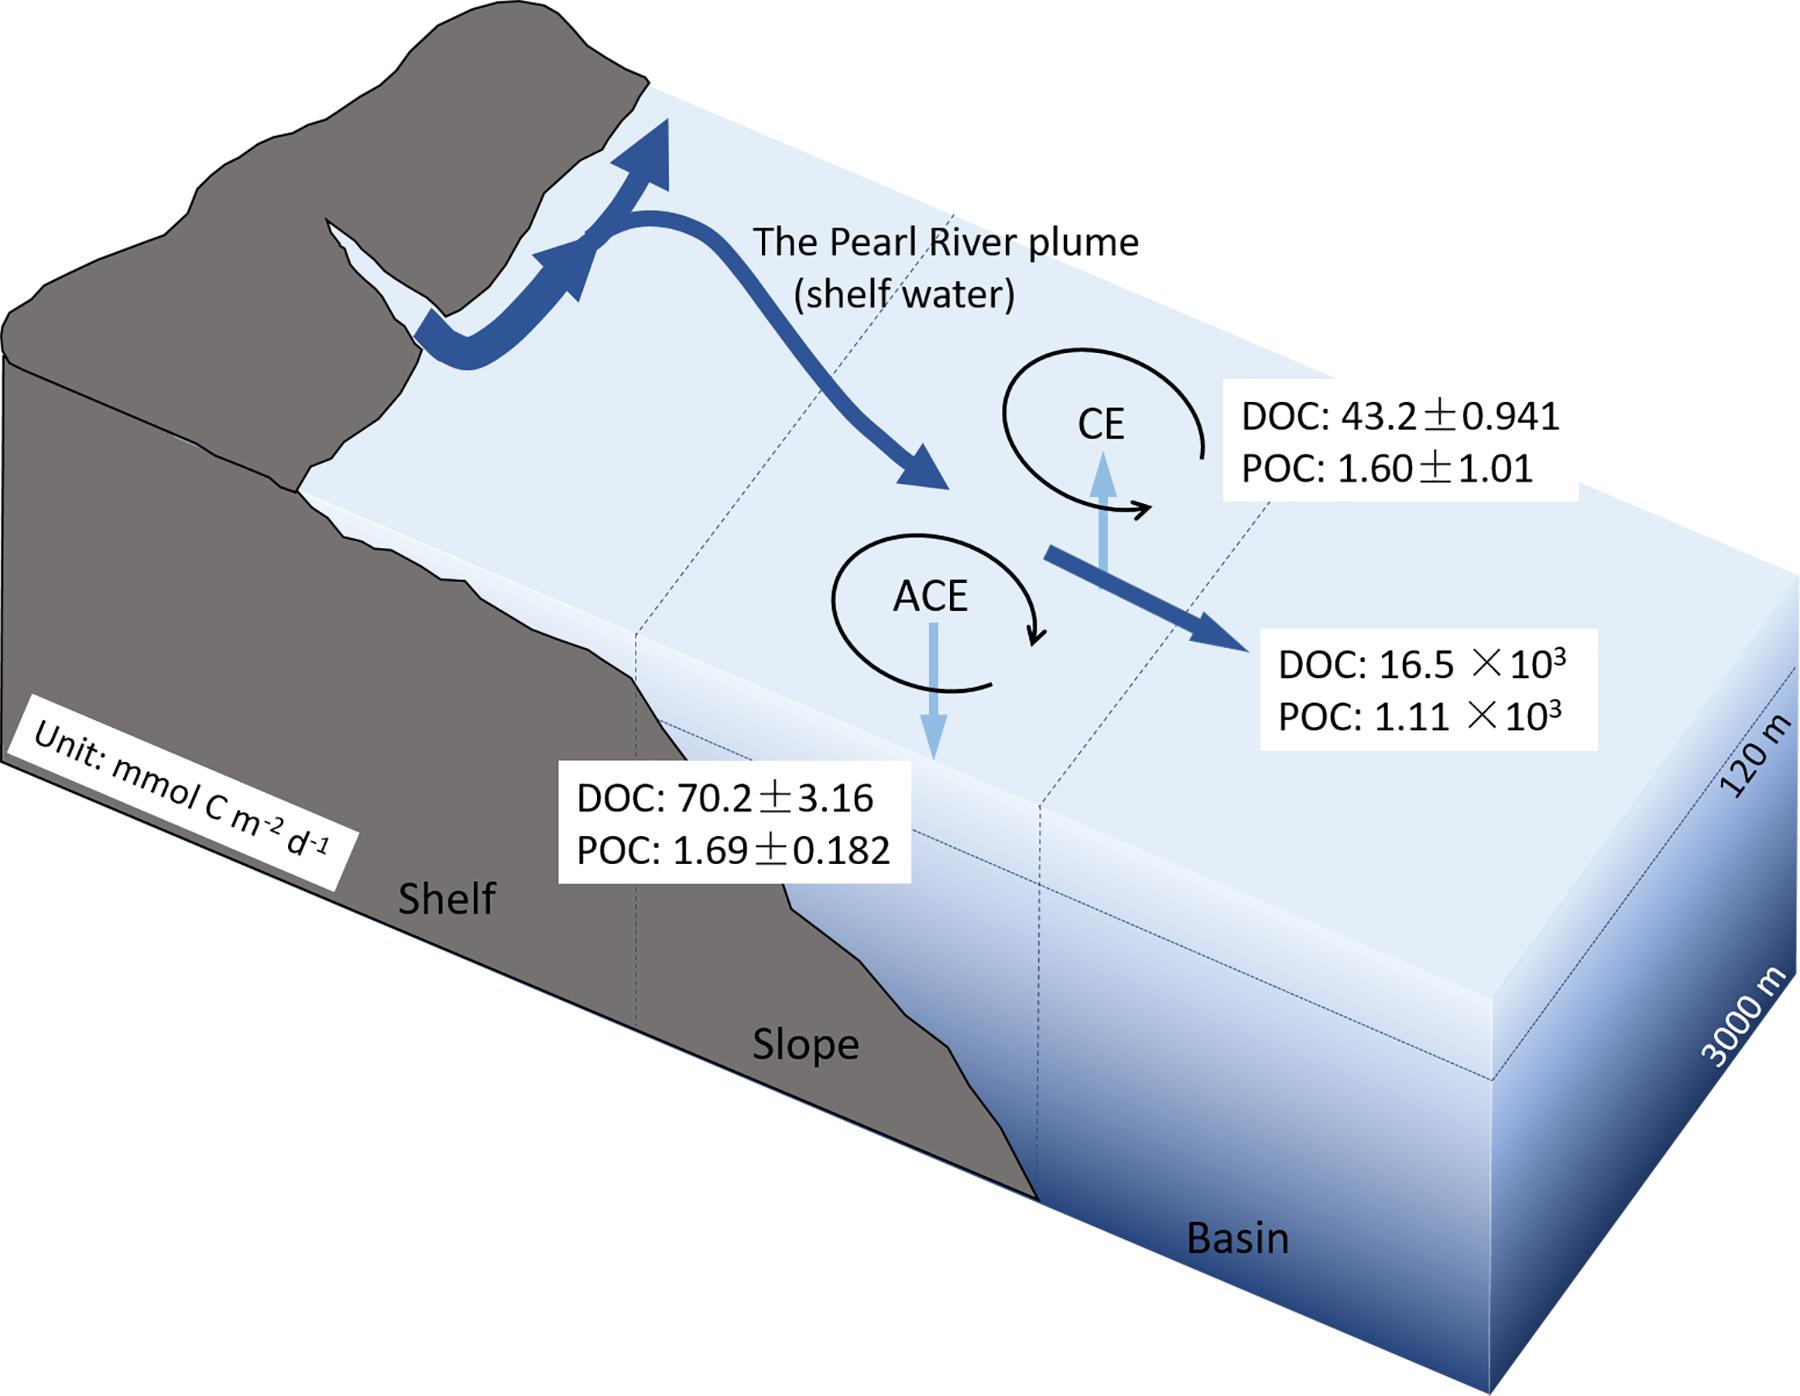
Figure 7. The conceptual diagram of the vertical and horizontal export rate of organic carbon in the northern slope of the SCS driven by dual eddies. ACE, anticyclonic eddy; CE, cyclonic eddy.
The horizontal cross-slope currents are related to the mesoscale processes. Two drifters with a drogue centered at the depth of 15 m were deployed during our study period on the northern slope of the SCS (Chen et al., 2016). The currents measured by these two drifters are southeastward approximately 136.2° and 145.6° with speeds of 0.2 and 0.3 cm s–1, respectively. The horizontal export fluxes of DOC and POC were 16.5 × 10³ and 1.11 × 10³ mmol C m–2 day–1. The sedimentation POC flux in the northern SCS was 0.8–21 mmol C m–2 day–1 determined by different methods (such as 234Th/238U disequilibrium, 210Po/210Pb disequilibrium, 210Pb/226Ra disequilibrium, and sediment traps) (Ho et al., 2009; Yang et al., 2009; Wei et al., 2011; Cai et al., 2015), which contributed much less to POC dynamics compared to the horizontal export driven by the ACE–CE eddy-pair in our study. He et al. (2016) reported that the cross-slope corridor with a phytoplankton bloom was approximately 500 km long and 100 km wide, and lasted more than 19 days. The three-endmember mixing model illustrated a coastal water depth of approximately 55 m. Based on the bloom sizes and coastal water layer depth, the DOC and POC horizontally transported could be calculate as [DOC] or [POC] × wh × Sa × t. The wh was the velocity of the horizontal cross-slope currents. The Sa was the section area of the currents, which was calculated by depth (55 m) multiplied by width (100 km). The t was the lifetime (19 days) of the cross-slope flows. The DOC and POC fluxes are estimated approximately equal to 20.7 × 10⁹ and 1.40 × 10⁹ g C, respectively (Figure 7), equivalenting to 4.5 and 0.07% of riverine DOC and POC fluxes (Huang et al., 2017 and the references therein). Meng et al. (2017) illustrated DOC transport via intensified downwelling of 3.1 × 10¹² g C over a large shelf area between December and February, with downwelling over a widened shelf from 114.5° E to 118.5° E. The corridor between a pair of ACE and CE played a considerable role in the transport of OC from the shelf to the basin region, acting as an important contribution to carbon sequestration in the basin of the SCS.
Conclusion
In June 2015, physical, biogeochemical, and biological processes in a CE and SCE pair were studied on the northern slope region of the SCS. The surface DOC within ACE was 3 μmol L–1 higher than that of CE, while the POC in the ACE was 3.9 μmol L–1 lower than that of the CE. In the upper 450 m, DOC distributions were affected by eddies. The contours of DOC are depressed due to downwelling in the ACE and uplifted due to upwelling in the CE. The euphotic depth was deeper and TOC inventory was higher in the ACE which could be the results from current convergence and downwelling. The ratio of POC to TOC was higher in the CE than that of ACE, which could be driven by new production enhanced by upwelled nutrient addition.
The results of the three-endmember-mixing model indicated that the ACE induced net consumption of DOC and POC in the upper layer, while net POC production was observed in the CE, indicating that nutrient addition by upwelling within the CE promoted primary productivity. The net consumption of TOC indicated a potential CO2 source within mesoscale ACEs in the northern slope of the SCS during summer.
Because of the vertical mixing within eddies, the DOC and POC export at 120 m in eddies were approximately 27.0 and 0.09 mmol C m–2 day–1, respectively, which was much higher than the export at the same depth in the basin areas of the SCS. More than 22.1 × 10⁹ g C of OC was exported from the slope to the basin within 19 days through the cross-slope-current in the corridor between these two eddies, demonstrating the slope ecosystem significantly contributed to carbon sequestration in the deep basin. The vertical and horizontal carbon exports in the slope system could be underestimated if the impact of mesoscale eddies was neglected, which deserves more comprehensive study in the future.
Data Availability Statement
The datasets generated for this study are available on request to the corresponding author.
Author Contributions
MZ contributed to the research design, sample collection, sample analysis, and manuscript writing. YW participated in research design and manuscript writing. FW contributed to research design and sample collection. DX provided the physical parameters. SL provided nutrients data. MZ participated in research design.
Funding
This study was supported by the National Program on Key Basic Research Project from the Ministry of Science and Technology of China (No. 2014CB441502) and NSFC Foundation (41876074).
Conflict of Interest
The authors declare that the research was conducted in the absence of any commercial or financial relationships that could be construed as a potential conflict of interest.
Acknowledgments
We are grateful to our colleagues of biogeochemistry group from the State Key Laboratory of Estuarine and Coastal Research at East China Normal University and captain/crew of R/V Nanfeng who participated in the field work.
Supplementary Material
The Supplementary Material for this article can be found online at: https://www.frontiersin.org/articles/10.3389/fmars.2020.00444/full#supplementary-material
References
Alling, V., Sanchez-Garcia, L., Porcelli, D., Pugach, S., Vonk, J. E., van Dongen, B., et al. (2010). Nonconservative behavior of dissolved organic carbon across the Laptev and East Siberian seas. Glob. Biogeochem. Cycles 24:GB4033.
Bauer, J. E., Cai, W.-J., Raymond, P. A., Bianchi, T. S., Hopkinson, C. S., and Regnier, P. A. G. (2013). The changing carbon cycle of the coastal ocean. Nature 504, 61–70. doi: 10.1038/nature12857
Cai, P., Zhao, D., Wang, L., Huang, B., and Dai, M. (2015). Role of particle stock and phytoplankton community structure in regulating particulate organic carbon export in a large marginal sea. J. Geophys. Res. Oceans 120, 2063–2095. doi: 10.1002/2014jc010432
Cai, S., Huang, Q., and Long, X. (2003). Three-dimensional numerical model study of the residual current in the South China Sea. Oceanol. Acta 26, 597–607. doi: 10.1016/s0399-1784(03)00053-7
Cao, Z., Yang, W., Zhao, Y., Guo, X., Yin, Z., Du, C., et al. (2019). Diagnosis of CO2 dynamics and fluxes in global coastal oceans. Natl. Sci. Rev. 7, 786–797. doi: 10.1093/nsr/nwz105
Catalá, T. S., Reche, I., Fuentes-Lema, A., Romera-Castillo, C., Nieto-Cid, M., Ortega-Retuerta, E., et al. (2015). Turnover time of fluorescent dissolved organic matter in the dark global ocean. Nat. Commun. 6:5986.
Chen, Y.-L. L., Chen, H.-Y., Lin, I. I., Lee, M.-A., and Chang, J. (2007). Effects of cold eddy on phytoplankton production and assemblages in Luzon Strait bordering the South China Sea. J. Oceanogr. 63, 671–683. doi: 10.1007/s10872-007-0059-9
Chen, Y.-l.L, Chen, H.-Y., Jan, S., Lin, Y.-H., Kuo, T.-H., and Hung, J.-J. (2015). Biologically active warm-core anticyclonic eddies in the marginal seas of the western Pacific Ocean. Deep Sea Res. Part I Oceanogr. Res. Pap. 106, 68–84. doi: 10.1016/j.dsr.2015.10.006
Chen, Z., Yang, C., Xu, D., and Xu, M. (2016). Observed hydrographical features and circulation with influences of cyclonic-anticyclonic eddy-pair in the northern slope of the South China Sea during June 2015. J. Mar. Sci. 34, 10–19.
Coble, P. G. (1996). Characterization of marine and terrestrial DOM in seawater using excitation-emission matrix spectroscopy. Mar. Chem. 51, 325–346. doi: 10.1016/0304-4203(95)00062-3
Coble, P. G. (2007). Marine optical biogeochemistry: the chemistry of ocean color. Chem. Rev. 107, 402–418. doi: 10.1021/cr050350%2B
Dai, M., Cao, Z., Guo, X., Zhai, W., Liu, Z., Yin, Z., et al. (2013). Why are some marginal seas sources of atmospheric CO2? Geophys. Res. Lett. 40, 2154–2158. doi: 10.1002/grl.50390
de Haas, H., van Weering, T. C. E., and de Stigter, H. (2002). Organic carbon in shelf seas: sinks or sources, processes and products. Continent. Shelf Res. 22, 691–717. doi: 10.1016/s0278-4343(01)00093-0
Doblin, M. A., Petrou, K., Sinutok, S., Seymour, J. R., Messer, L. F., Brown, M. V., et al. (2016). Nutrient uplift in a cyclonic eddy increases diversity, primary productivity and iron demand of microbial communities relative to a western boundary current. PeerJ 4:e1973. doi: 10.7717/peerj.1973
Garcia, H. E., and Gordon, L. I. (1992). Oxygen solubility in seawater: better fitting equations. Limnol. Ceanogr. 37, 1307–1312. doi: 10.4319/lo.1992.37.6.1307
Guéguen, C., Cuss, C. W., Cassels, C. J., and Carmack, E. C. (2014). Absorption and fluorescence of dissolved organic matter in the waters of the Canadian Arctic Archipelago, Baffin Bay, and the Labrador Sea. J. Geophys. Res. Oceans 119, 2034–2047. doi: 10.1002/2013jc009173
Halewood, E. R., Carlson, C. A., Brzezinski, M. A., Reed, D. C., and Goodman, J. (2012). Annual cycle of organic matter partitioning and its availability to bacteria across the Santa Barbara Channel continental shelf. Aquat. Microb. Ecol. 67, 189–209. doi: 10.3354/ame01586
Han, A., Dai, M., Kao, S.-J., Gan, J., Li, Q., Wang, L., et al. (2012). Nutrient dynamics and biological consumption in a large continental shelf system under the influence of both a river plume and coastal upwelling. Limnol. Ceanogr. 57, 486–502. doi: 10.4319/lo.2012.57.2.0486
He, B., Dai, M., Zhai, W., Wang, L., Wang, K., Chen, J., et al. (2010). Distribution, degradation and dynamics of dissolved organic carbon and its major compound classes in the Pearl River estuary, China. Mar. Chem. 119, 52–64. doi: 10.1016/j.marchem.2009.12.006
He, Q., Zhan, H., Cai, S., He, Y., Huang, G., and Zhan, W. (2018). A new assessment of mesoscale eddies in the South China Sea: surface features, three−dimensional structures, and thermohaline transports. J. Geophys. Res. Oceans 123, 4906–4929. doi: 10.1029/2018jc014054
He, X., Xu, D., Bai, Y., Pan, D., Chen, C.-T. A., Chen, X., et al. (2016). Eddy-entrained Pearl River plume into the oligotrophic basin of the South China Sea. Continent. Shelf Res. 124, 117–124. doi: 10.1016/j.csr.2016.06.003
He, Y., Cai, S., Wang, D., and He, J. (2015). A model study of Luzon cold eddies in the northern South China Sea. Deep Sea Res. Part I Oceanogr. Res. Pap. 97, 107–123. doi: 10.1016/j.dsr.2014.12.007
Hedges, J. I., and Keil, R. G. (1995). Sedimentary organic matter preservation: an assessment and speculative synthesis. Mar. Chem. 49, 81–115. doi: 10.1016/0304-4203(95)00008-f
Helms, J. R., Stubbins, A., Perdue, E. M., Green, N. W., Chen, H., and Mopper, K. (2013). Photochemical bleaching of oceanic dissolved organic matter and its effect on absorption spectral slope and fluorescence. Mar. Chem. 155, 81–91. doi: 10.1016/j.marchem.2013.05.015
Ho, T.-Y., You, C.-F., Chou, W.-C., Pai, S.-C., Wen, L.-S., and Sheu, D. D. (2009). Cadmium and phosphorus cycling in the water column of the South China Sea: the roles of biotic and abiotic particles. Mar. Chem. 115, 125–133. doi: 10.1016/j.marchem.2009.07.005
Hu, J., Gan, J., Sun, Z., Zhu, J., and Dai, M. (2011). Observed three-dimensional structure of a cold eddy in the southwestern South China Sea. J. Geophys. Res. 116:C06810.
Hu, Z., Tan, Y., Song, X., Zhou, L., Lian, X., Huang, L., et al. (2014). Influence of mesoscale eddies on primary production in the South China Sea during spring inter-monsoon period. Acta Oceanol. Sin. 33, 118–128. doi: 10.1007/s13131-014-0431-8
Hu, Z. Y., and Zhou, M. (2019). Lagrangian analysis of surface transport patterns in the northern south China sea. Deep Sea Res. Part II Top. Stud. Oceanogr. 167, 4–13. doi: 10.1016/j.dsr2.2019.06.020
Huang, T. H., Chen, C. T. A., Tseng, H. C., Lou, J. Y., Wang, S. L., Yang, L., et al. (2017). Riverine carbon fluxes to the South China Sea. J. Geophys. Res. Biogeosci. 122, 1239–1259. doi: 10.1002/2016jg003701
Hung, J. J., Wang, S. M., and Chen, Y. L. (2007). Biogeochemical controls on distributions and fluxes of dissolved and particulate organic carbon in the Northern South China Sea. Deep Sea Res. Part II Top. Stud. Oceanogr. 54, 1486–1503. doi: 10.1016/j.dsr2.2007.05.006
Jiao, N., Zhang, Y., Zhou, K., Li, Q., Dai, M., Liu, J., et al. (2014). Revisiting the CO2 “source” problem in upwelling areas -a comparative study on eddy upwellings in the South China Sea. Biogeosciences 11, 2465–2475. doi: 10.5194/bg-11-2465-2014
Kirk, J. T. (1994). Light and Photosynthesis in Aquatic Ecosystems. Cambridge: Cambridge University Press.
Kolasinski, J., Kaehler, S., and Jaquemet, S. (2012). Distribution and sources of particulate organic matter in a mesoscale eddy dipole in the Mozambique Channel (south-western Indian Ocean): insight from C and N stable isotopes. J. Mar. Syst. 96, 122–131. doi: 10.1016/j.jmarsys.2012.02.015
Kothawala, D. N., Murphy, K. R., Stedmon, C. A., Weyhenmeyer, G. A., and Tranvik, L. J. (2013). Inner filter correction of dissolved organic matter fluorescence. Limnol. Oceanogr. Methods 11, 616–630. doi: 10.4319/lom.2013.11.616
Lasternas, S., Piedeleu, M., Sangrà, P., Duarte, C., and Agustí, S. (2013). Forcing of dissolved organic carbon release by phytoplankton by anticyclonic mesoscale eddies in the subtropical NE Atlantic Ocean. Biogeosciences 10, 2129–2143. doi: 10.5194/bg-10-2129-2013
Lasternas, S., Piedeleu, M., Sangrà, P., Duarte, C. M., and Agustí, S. (2012). Carbon fluxes forced by anticyclonic mesoscale eddies generated by islands at the subtropical NE Atlantic Ocean. Biogeosci. Discuss. 9, 10241–10283. doi: 10.5194/bgd-9-10241-2012
Li, P., Chen, L., Zhang, W., and Huang, Q. (2015). Spatiotemporal distribution, sources, and photobleaching imprint of dissolved organic matter in the Yangtze estuary and its adjacent sea using fluorescence and parallel factor analysis. PLoS One 10:e0130852. doi: 10.1371/journal.pone.0130852
Li, Q., Guo, X., Zhai, W., Xu, Y., and Dai, M. (2020). Partial pressure of CO2 and air-sea CO2 fluxes in the South China Sea: synthesis of an 18-year dataset. Prog. Oceanogr. 182:102272. doi: 10.1016/j.pocean.2020.102272
Liu, J., Dai, J., Xu, D., Wang, J., and Yuan, Y. (2018a). Seasonal and interannual variability in coastal circulations in the Northern South China Sea. Water 10:520. doi: 10.3390/w10040520
Liu, Q., Guo, X., Yin, Z., Zhou, K., Roberts, E. G., and Dai, M. (2018b). Carbon fluxes in the China Seas: an overview and perspective. Sci. China Earth Sci. 61, 1564–1582. doi: 10.1007/s11430-017-9267-4
McGillicuddy, D. J. Jr. (2016). Mechanisms of physical-biological-biogeochemical interaction at the oceanic mesoscale. Annu. Rev. Mar. Sci. 8, 125–159. doi: 10.1146/annurev-marine-010814-015606
Meador, T. B., and Aluwihare, L. I. (2014). Production of dissolved organic carbon enriched in deoxy sugars representing an additional sink for biological C drawdown in the Amazon River plume. Glob. Biogeochem. Cycles 28, 1149–1161. doi: 10.1002/2013gb004778
Meng, F., Dai, M., Cao, Z., Wu, K., Zhao, X., Li, X., et al. (2017). Seasonal dynamics of dissolved organic carbon under complex circulation schemes on a large continental shelf: the Northern South China Sea. J. Geophys. Res. Oceans 122, 9415–9428. doi: 10.1002/2017jc013325
Murphy, K. R., Stedmon, C. A., Graeber, D., and Bro, R. (2013). Fluorescence spectroscopy and multi-way techniques, PARAFAC. Anal. Methods 5, 6557–6566.
Murphy, K. R., Stedmon, C. A., Wenig, P., and Bro, R. (2014). OpenFluor–an online spectral library of auto-fluorescence by organic compounds in the environment. Anal. Methods 6, 658–661. doi: 10.1039/c3ay41935e
Osburn, C. L., Handsel, L. T., Peierls, B. L., and Paerl, H. W. (2016). Predicting sources of dissolved organic nitrogen to an estuary from an agro-urban coastal watershed. Environ. Sci. Technol. 50, 8473–8484. doi: 10.1021/acs.est.6b00053
Osburn, C. L., Mikan, M. P., Etheridge, J. R., Burchell, M. R., and Birgand, F. (2015). Seasonal variation in the quality of dissolved and particulate organic matter exchanged between a salt marsh and its adjacent estuary. J. Geophys. Res. Biogeosci. 120, 1430–1449. doi: 10.1002/2014jg002897
Osburn, C. L., and Stedmon, C. A. (2011). Linking the chemical and optical properties of dissolved organic matter in the Baltic–North Sea transition zone to differentiate three allochthonous inputs. Mar. Chem. 126, 281–294. doi: 10.1016/j.marchem.2011.06.007
Painter, S. C., Lapworth, D. J., Woodward, E. M. S., Kroeger, S., Evans, C. D., Mayor, D. J., et al. (2018). Terrestrial dissolved organic matter distribution in the North Sea. Sci. Tot. Environ. 630, 630–647.
Räsänen, N., Kankaala, P., Tahvanainen, T., Akkanen, J., and Saarnio, S. (2014). Short-term effects of phosphorus addition and pH rise on bacterial utilization and biodegradation of dissolved organic carbon (DOC) from boreal mires. Aquat. Ecol. 48, 435–446. doi: 10.1007/s10452-014-9496-x
Romankevich, E. A. (2013). Geochemistry of Organic Matter in the Ocean. Berlin: Springer Science & Business Media.
Sarma, V., Kumar, G. S., Yadav, K., Dalabehera, H. B., Rao, D. N., Behera, S., et al. (2019a). Impact of eddies on dissolved inorganic carbon components in the Bay of Bengal. Deep Sea Res. Part I Oceanogr. Res. Pap. 147, 111–120. doi: 10.1016/j.dsr.2019.04.005
Sarma, V., Yadav, K., and Behera, S. (2019b). Role of eddies on organic matter production and f-ratios in the Bay of Bengal. Mar. Chem. 210, 13–23. doi: 10.1016/j.marchem.2019.01.006
Siegel, D. A., Peterson, P., McGillicuddy, D. J., Maritorena, S., and Nelson, N. B. (2011). Bio-optical footprints created by mesoscale eddies in the Sargasso Sea. Geophys. Res. Lett. 38:L13608.
Stedmon, C. A., and Bro, R. (2008). Characterizing dissolved organic matter fluorescence with parallel factor analysis: a tutorial. Limnol. Oceanogr. Methods 6, 572–579. doi: 10.4319/lom.2008.6.572b
Sugimura, Y., and Suzuki, Y. (1988). A high-temperature catalytic oxidation method for the determination of non-volatile dissolved organic carbon in seawater by direct injection of a liquid sample. Mar. Chem. 24, 105–131. doi: 10.1016/0304-4203(88)90043-6
Takahashi, T., Sutherland, S. C., Wanninkhof, R., Sweeney, C., Feely, R. A., Chipman, D. W., et al. (2009). Climatological mean and decadal change in surface ocean pCO2, and net sea–air CO2 flux over the global oceans. Deep Sea Res. Part II Top. Stud. Oceanogr. 56, 554–577. doi: 10.1016/j.dsr2.2008.12.009
Tanaka, K., Kuma, K., Hamasaki, K., and Yamashita, Y. (2014). Accumulation of humic-like fluorescent dissolved organic matter in the Japan Sea. Sci. Rep. 4:5292.
Walsh, J. J. (1991). Importance of continental margins in the marine biogeochemical cycling of carbon and nitrogen. Nature 350, 53–55. doi: 10.1038/350053a0
Wei, C. L., Lin, S. Y., Sheu, D. D. D., Chou, W. C., Yi, M. C., Santschi, P. H., et al. (2011). Particle-reactive radionuclides (234Th, 210Pb, 210Po) as tracers for the estimation of export production in the South China Sea. Biogeosci. Discuss. 8, 9671–9707. doi: 10.5194/bgd-8-9671-2011
Wong, G. T. F., Ku, T.-L., Liu, H., and Mulholland, M. (2015). The oceanography of the Northern south China Sea Shelf-Sea (NoSoCS) and its adjacent waters—overview and highlights11deep-sea research II: special issue on “Oceanography of the Northern South China Sea Shelf-sea (NoSoCS) and its adjacent waters”. Deep Sea Res. Part II Top. Stud. Oceanogr. 117, 3–9. doi: 10.1016/j.dsr2.2015.04.026
Wu, K., Dai, M., Li, X., Meng, F., Chen, J., and Lin, J. (2017). Dynamics and production of dissolved organic carbon in a large continental shelf system under the influence of both river plume and coastal upwelling. Limnol. Oceanogr. 62, 973–988. doi: 10.1002/lno.10479
Xiu, P., and Chai, F. (2011). Modeled biogeochemical responses to mesoscale eddies in the South China Sea. J. Geophys. Res. Oceans 116:C10006.
Xiu, P., Chai, F., Shi, L., Xue, H., and Chao, Y. (2010). A census of eddy activities in the South China Sea during 1993–2007. J. Geophys. Res. Oceans 115:C03012.
Xue, H., Chai, F., Pettigrew, N., Xu, D., Shi, M., and Xu, J. (2004). Kuroshio intrusion and the circulation in the South China Sea. J. Geophys. Res. Oceans 109:C01724.
Yang, H., and Liu, Q. (2003). Forced rossby wave in the northern South China Sea. Deep Sea Res. Part I Oceanogr. Res. Pap. 50, 917–926. doi: 10.1016/s0967-0637(03)00074-8
Yang, W., Huang, Y., Chen, M., Qiu, Y., Peng, A., and Zhang, L. (2009). Export and remineralization of POM in the Southern Ocean and the South China Sea estimated from 210Po/210Pb disequilibria. Sci. Bull. 54, 2118–2123. doi: 10.1007/s11434-009-0043-4
Yuan, Y., Liao, G., and Xu, X. (2007). Three dimensional diagnostic modeling study of the South China Sea circulation before onset of summer monsoon in 1998. J. Oceanogr. 63, 77–100. doi: 10.1007/s10872-007-0007-8
Zhai, W. D., Dai, M. H., Chen, B. S., Guo, X. H., Li, Q., Shang, S. L., et al. (2013). Seasonal variations of sea–air CO2 fluxes in the largest tropical marginal sea (South China Sea) based on multiple-year underway measurements. Biogeosciences 10, 7775–7791. doi: 10.5194/bg-10-7775-2013
Zhang, Z., Tian, J., Qiu, B., Zhao, W., Chang, P., Wu, D., et al. (2016). Observed 3D structure, generation, and dissipation of oceanic mesoscale eddies in the South China Sea. Sci. Rep. 6:24349.
Zhou, K., Dai, M., Kao, S.-J., Wang, L., Xiu, P., Chai, F., et al. (2013). Apparent enhancement of 234Th-based particle export associated with anticyclonic eddies. Earth Planet. Sci. Lett. 381, 198–209. doi: 10.1016/j.epsl.2013.07.039
Keywords: slope region, South China Sea, anticyclonic eddy, cyclonic eddy, organic carbon export
Citation: Zhang M, Wu Y, Wang F, Xu D, Liu S and Zhou M (2020) Hotspot of Organic Carbon Export Driven by Mesoscale Eddies in the Slope Region of the Northern South China Sea. Front. Mar. Sci. 7:444. doi: 10.3389/fmars.2020.00444
Received: 20 January 2020; Accepted: 20 May 2020;
Published: 23 June 2020.
Edited by:
Selvaraj Kandasamy, Xiamen University, ChinaReviewed by:
Peng Xiu, South China Sea Institute of Oceanology (CAS), ChinaZhifei Liu, Tongji University, China
Copyright © 2020 Zhang, Wu, Wang, Xu, Liu and Zhou. This is an open-access article distributed under the terms of the Creative Commons Attribution License (CC BY). The use, distribution or reproduction in other forums is permitted, provided the original author(s) and the copyright owner(s) are credited and that the original publication in this journal is cited, in accordance with accepted academic practice. No use, distribution or reproduction is permitted which does not comply with these terms.
*Correspondence: Ying Wu, d3V5aW5nQHNrbGVjLmVjbnUuZWR1LmNu