 Jia Jin Marc Chang
 Yin Cheong Aden Ip
 Andrew G. Bauman
 Danwei Huang1,2*
- 1Department of Biological Sciences, National University of Singapore, Singapore, Singapore
- 2Tropical Marine Science Institute, National University of Singapore, Singapore, Singapore
Autonomous Reef Monitoring Structure (ARMS) are standardized devices for sampling biodiversity in complex marine benthic habitats such as coral reefs. When coupled with DNA sequencing, these devices greatly expand our ability to document marine biodiversity. Unfortunately, the existing workflow for processing macrofaunal samples (>2-mm) in the ARMS pipeline—which involves Sanger sequencing—is expensive, laborious, and thus prohibitive for ARMS researchers. Here, we propose a faster, more cost-effective alternative by demonstrating a successful application of the MinION-based barcoding approach on the >2 mm-size fraction of ARMS samples. All data were available within 3.5–4 h, and sequencing costs relatively low at approximately US$3 per MinION barcode. We sequenced the 313-bp fragment of the cytochrome c oxidase subunit I (COI) for 725 samples on both MinION and Illumina platforms, and retrieved 507–584 overlapping barcodes. MinION barcodes were highly accurate (∼99.9%) when compared with Illumina reference barcodes. Molecular operational taxonomic units inferred between MinION and Illumina barcodes were consistently stable, and match ratios demonstrated highly congruent clustering patterns (≥0.96). Our method would make ARMS more accessible to researchers, and greatly expedite the processing of macrofaunal samples; it can also be easily applied to other small-to-moderate DNA barcoding projects (<10,000 specimens) for rapid species identification and discovery.
Introduction
An estimated 80% of living species remain unknown to science, including up to 90% of the world’s marine species (Mora et al., 2011; Appeltans et al., 2012; Wilson, 2017). In the context of accelerating global change, there is an urgent need to more rapidly discover and assess species diversity, given that rates of species losses are predicted to occur faster than we can document them (Costello and Wilson, 2011). Fostered by the need to expedite species discovery, marine researchers have proposed the use of the Autonomous Reef Monitoring Structure (ARMS), a standardized sampling tool that enables comprehensive documentation of marine biodiversity beyond standard indicator species (Plaisance et al., 2011a; Leray and Knowlton, 2015). Briefly, ARMS are designed to mimic the structural complexity of coral reefs and are commonly deployed on the marine benthos for a length of time to allow marine organisms to colonize before subsequent retrieval (Knowlton et al., 2010). All organisms on the units are then DNA-sequenced for species identification and quantification (Leray and Knowlton, 2015). Globally, approximately 1,700 ARMS units have been deployed under the Global ARMS Program1, an initiative helmed by the Smithsonian National Museum of Natural History that encourages the deployment of ARMS around the world with the aim of consolidating and making all ARMS-related data available. Notably, ARMS have become a widely utilized method for assessing benthic diversity in many shallow marine systems (Plaisance et al., 2011a, b; Leray and Knowlton, 2015; Al-Rshaidat et al., 2016; Hurley et al., 2016; Pearman et al., 2016, 2018, 2019; Pennesi and Danovaro, 2017; Ransome et al., 2017; Carvalho et al., 2019; David et al., 2019; Hazeri et al., 2019).
One of the most common criticisms of utilizing ARMS is the high sequencing costs (Danovaro et al., 2016). A standard ARMS sequencing workflow (see Leray and Knowlton, 2015) involves removing all fauna from ARMS and sorting into either sessile or motile fractions, with the motile fraction being further subdivided into three distinct size ranges (i.e., >2-mm, 500-μm–2-mm, 106–500-μm; Figure 1). Specimens sorted into the largest size range (>2-mm) of the motile fraction are barcoded via Sanger sequencing while the other fractions undergo metabarcoding (Figure 1). While the former is done to retain sample-sequence association for the >2-mm size fraction (Leray and Knowlton, 2015), it has never been clear why Sanger sequencing was chosen over more advanced barcoding methods [i.e., next-generation sequencing (NGS); Shokralla et al., 2014; Meier et al., 2016], especially given that other size fractions already undergo NGS metabarcoding (Leray and Knowlton, 2015). Additionally, NGS has already proven to have near-perfect accuracy (≥99%) when benchmarked against Sanger sequencing (Baudhuin et al., 2015; Beck et al., 2016). Sequencing, however, typically requires access to a well-equipped molecular laboratory (Glenn, 2011; Quail et al., 2012), and Sanger costs remain high at US$18 per sample (Meier et al., 2016), making ARMS sequencing an expensive endeavor. Consequently, researchers have resorted to using imaging techniques and morphological examination of the ARMS plates as an alternative to assessing biodiversity (Hurley et al., 2016; David et al., 2019), despite morphology-based approaches being less cost-effective (Hayes et al., 2005). Sanger sequencing costs may also be the reason there is a decreasing representation of >2-mm size fractions (Supplementary Table S1), suggesting that a considerable component of marine fauna remains potentially undiscovered. Fortunately, sequencing technologies are rapidly improving, and the rise of third-generation sequencers aimed at democratizing sequencing to the masses (Mikheyev and Tin, 2014) are now challenging the dominance of second-generation mainstays like Illumina. One such innovation is the MinION sequencer, and it offers a potential solution to making research into the >2-mm size fraction more accessible for ARMS researchers.
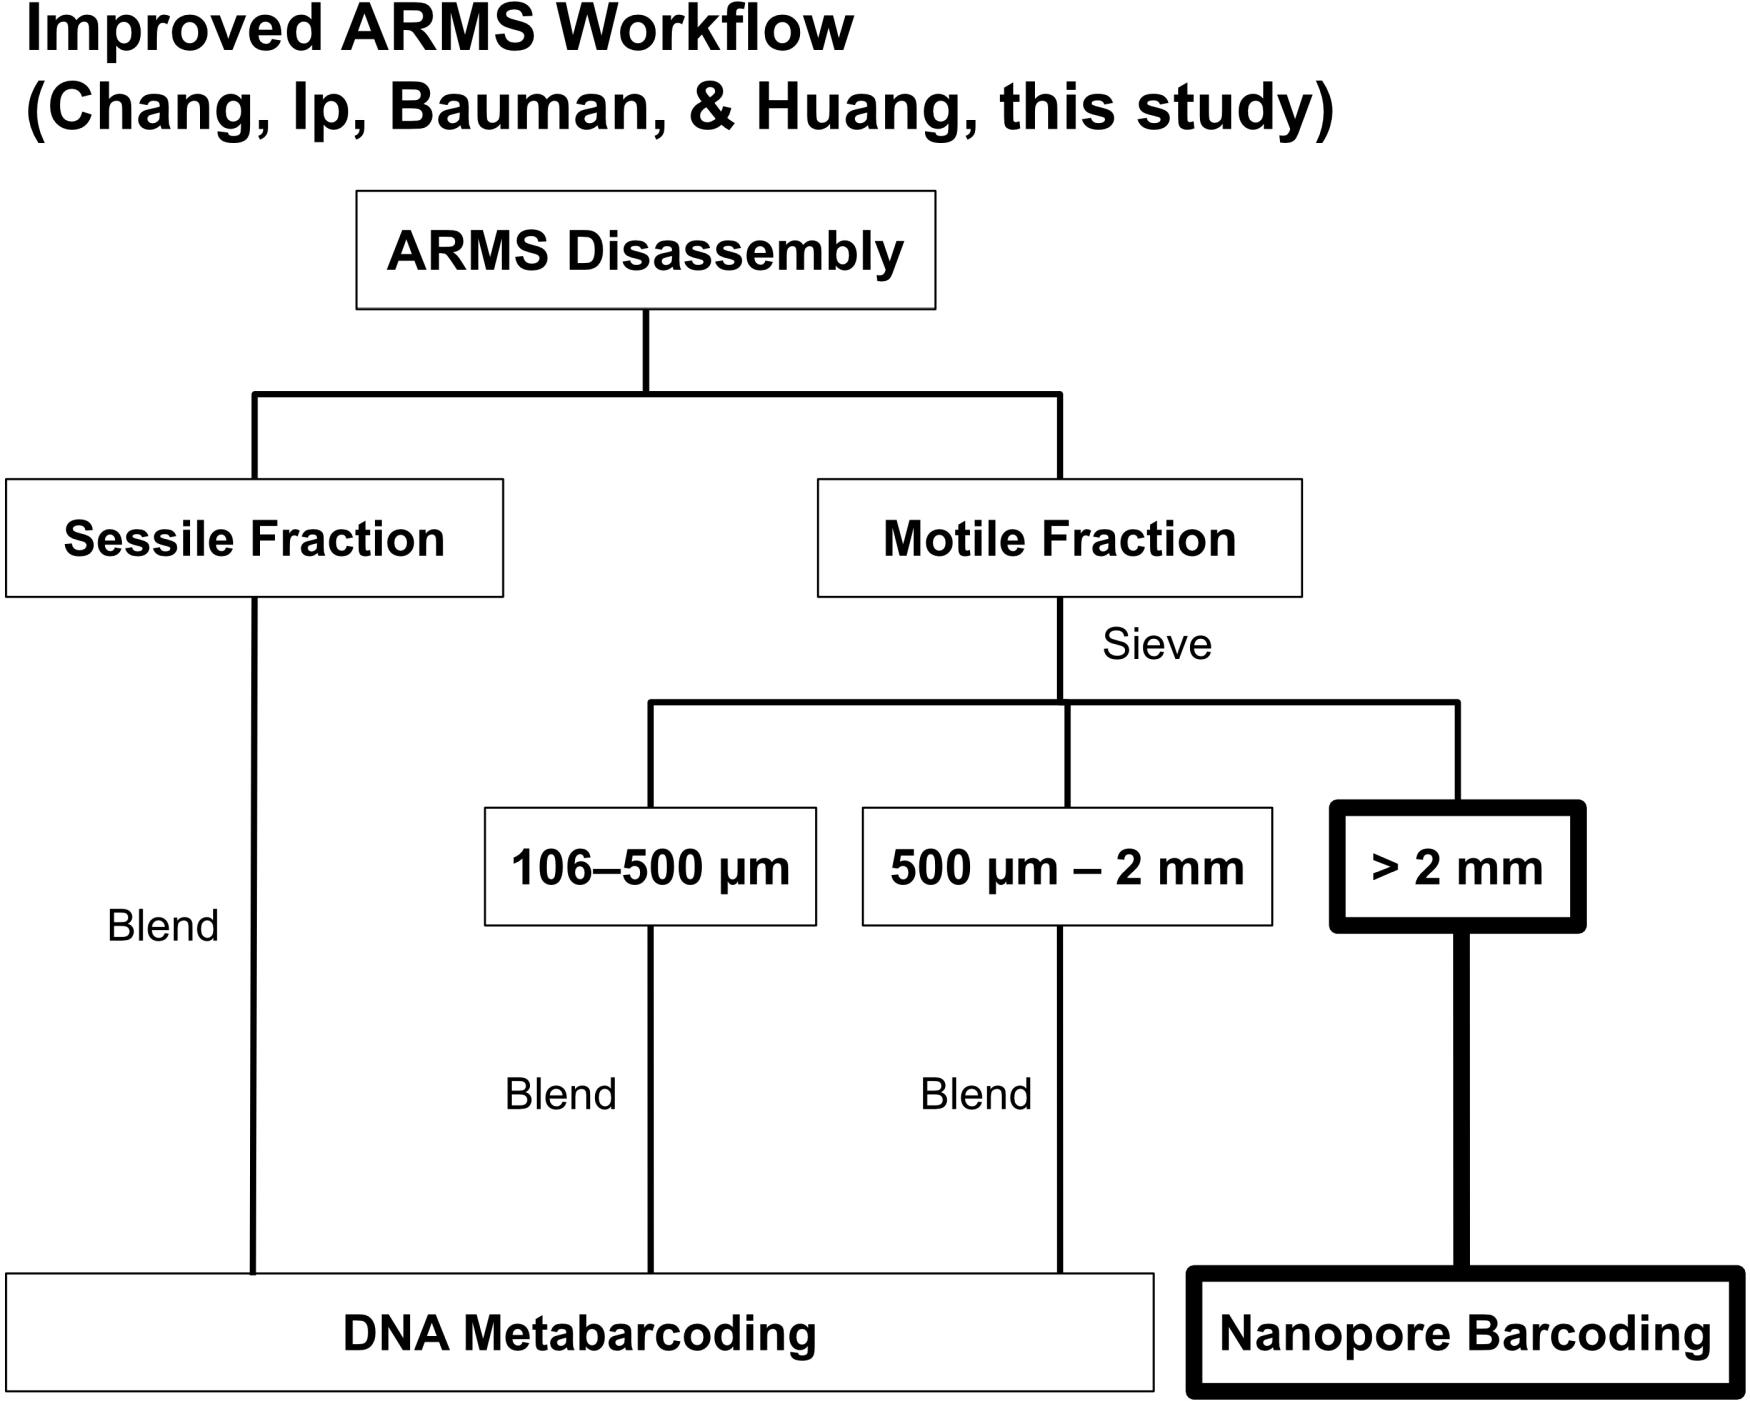
Figure 1. The ARMS processing workflow by Leray and Knowlton (2015). We replaced Sanger sequencing of >2-mm specimens with nanopore barcoding highlighted in bold.
The MinION is a small handheld sequencer that was introduced in 2014 by Oxford Nanopore Technologies (ONT). MinION’s release was significant for nucleic acid sequencing for several reasons: (1) its lower entry and per base sequencing cost, compared to second-generation sequencing technologies, (2) its ability to perform long-read sequencing, which is ideal for genome assemblies, (3) its compact size and portability, and (4) its ability to generate data real-time (Mikheyev and Tin, 2014). However, despite these promising advantages, nanopore sequencing remains hampered by its fairly high raw read error rate. For example, raw MinION read accuracies were 65–88% in its initial launch phase (Lu et al., 2016), but ongoing improvements in flow cell chemistry have increased the average read accuracy to ∼90% for the R9.4 flow cells (Tyler et al., 2018; Wick et al., 2019). Further, new error-correction pipelines for barcoding have since emerged, including the miniBarcoder (Srivathsan et al., 2018, 2019), minibar (Krehenwinkel et al., 2019a), ONTrack (Maestri et al., 2019), and SAIGA (Seah et al., 2020), which allow users to capitalize on nanopore sequencing advantages while keeping error rates low.
Given the recent advances in sequencing technology, we propose that the MinION-based barcoding approach can also be applied to ARMS research, specifically to process >2-mm samples in place of Sanger sequencing. We demonstrate this through application of the miniBarcoder pipeline (Srivathsan et al., 2018) on >2-mm samples collected from ARMS units deployed in Singapore. This pipeline was chosen because its utility has been thoroughly demonstrated on insects (Srivathsan et al., 2018, 2019) and seafood (Ho et al., 2020), and here we extend its applicability to a more taxonomically diverse sample set. We posit that the MinION method is more cost-efficient and will enable a much faster ‘sample-to-sequence’ workflow for ARMS researchers, with the added advantage of scalability depending on individual project requirements. This makes MinION-based barcoding a highly useful tool for any small-to-moderate (<10,000 samples) specimen-rich biodiversity barcoding endeavors.
Materials and Methods
Deployment, Retrieval, and Processing of ARMS Units
Four sets of three ARMS units were deployed across four sites in the Southern Islands of Singapore for 2 years from July 2016 to July 2018. The ARMS units were processed according to Leray and Knowlton (2015). Collections were authorized by the National Parks Board (permit number NP/RP15-088). The >2-mm samples were vouchered individually and classified by morpho-phylum during the disassembly and sorting phase. Classifications were recorded for downstream congruence checks with molecular data (see below). Samples were handled according to NUS Institutional Animal Care and Use Committee (IACUC) guidelines (IACUC Protocol B15-1403).
DNA Extraction and Gene Amplification
Genomic extractions were performed using the abGenixTM automated DNA and RNA extraction system (AITbiotech Pte Ltd, Singapore), using the Animal Tissue Genomic DNA Extraction kit according to manufacturer’s instructions. All samples were processed separately.
We targeted the 313-bp region of cytochrome c oxidase subunit I (COI) gene because mini-barcodes were shown to perform just as well as the full-length barcodes for species-level identifications, and that loss in length for >200-bp barcodes did not result in demonstrable loss of information (Yeo et al., 2020). We did not adopt the conventional barcoding primers (i.e., LCO1490/HCO2198; Folmer et al., 1994) because of its known poor amplification success with marine fauna (Leray et al., 2013; Lobo et al., 2013; Ip et al., 2019). The MinION sequencing platform was benchmarked against Illumina NGS technology as the latter has already been validated to be just as accurate as Sanger sequencing (Baudhuin et al., 2015; Beck et al., 2016). We thus reasoned it was unnecessary to generate Sanger barcodes for comparison. PCR amplification was done using the mlCOIintF: 5′-GGWACWGGWTGAACWGTWTAYCCYCC-3′ (Leray et al., 2013) and LoboR1: 5′-TAAACYTCWGGRTGWCCRAARAAYCA-3′ (Lobo et al., 2013) primer combination. This primer set was chosen over conventional metabarcoding primer pair, mlCOIintF, and jgHCO2198 (Geller et al., 2013; see also Wangensteen et al., 2018), as the inclusion of inosine bases in the latter primer raised cost (Meier et al., 2016). We thus opted for the LoboR1 primer as the substitution of inosine bases with wobble bases decreased the primer cost by 4×. Furthermore, this primer pair had also achieved ≥95% amplification success in an earlier study by Ip et al. (2019), making it a suitable alternative primer to pair with mlCOIintF for barcoding marine fauna.
Our Leray-Lobo PCR primers were tagged with 8-bp barcode tags on the 5′ end to allow for downstream demultiplexing (Meier et al., 2016). Multiplexing was performed at the sample level, and both the forward and reverse tags were unique to each specimen. Each PCR reaction comprised 2 uL of template DNA, 2 uL each of 10 uM primer, 1 uL of magnesium chloride, 1 uL of bovine serum albumin (1 mg/mL), 12.5 uL of GoTaq Green Master Mix (Promega), and topped up to 25 uL with sterile water. The thermal cycling profile used was as follows: 94°C for 60 s; 5 cycles of 94°C for 30 s, 48°C for 120 s, 72°C for 60 s, followed by 30 cycles of 94°C for 30 s, 54°C for 120 s, 72°C for 60 s, and a final extension for 5 min at 72°C. A subset of products were run on 2% agarose gels stained with GelRed (Cambridge Bioscience) to ensure amplification success, while all negative controls were screened to ensure they were clean.
We then pooled a total of 767 PCR products into nine separate pools. Pooling was done by plate as we had up to 96 unique barcode tag combinations (i.e., one library per pool, for a total of nine pools for each sequencing platform). The amplicon pools were then cleaned separately using 1.1× Sera-MagTM Magnetic SpeedBeadsTM (GE Healthcare Life Sciences) in 18% polyethylene glycol-8000 (PEG-8000) buffer (1 M NaCl, 10 nM Tris-HCl, 1 nM EDTA, pH 8). The same purified amplicon pools were then used for both Illumina and MinION sequencing to allow for direct comparison of sequencing accuracy between platforms. Illumina sequencing technology, especially MiSeq, is known to be highly accurate (Loman et al., 2012; Fox et al., 2014), thereby serving as a suitable reference baseline to determine accuracy of MinION barcodes.
MinION Barcoding
We prepared two different sets of amplicon pools for MinION sequencing. The first set comprised a single library pool with 96 amplicons, while the eight remaining libraries made up the second set. The first run was intended as a pilot test, and we only proceeded with the second run after confirming that the first run was successful. Future studies that employ MinION-based barcoding for ARMS with similar sample sizes should note that one flowcell would suffice. About 300 ng and 700 ng of starting material were used for the first and second sets, respectively. MinION libraries were prepared using the Ligation Sequencing Kit (SQK-LSK109), with the following modifications: (1) end-repair and dA-tailing reactions were incubated in a thermocycler at 20°C for 30 min, followed by 65°C for 30 min, and (2) ligation reactions were incubated in the thermocycler for 15 min at 20°C. An additional multiplexing step was performed at the library-level for the second set using the Native Barcoding Expansion (1-12; EXP-NDB-104), using the same modifications described above. To improve library preparation efficiency, we extended the time taken for end-repair and adapter ligation as preliminary trials using the manufacturer’s protocol resulted in library failure, with little to no sequencing occurring even as numerous pores were available. Library preparation took approximately 2 h for the first set and 4–5 h for the second set. Sequencing was performed on two separate R9.4.1. flow cells on MinKNOW for Ubuntu 18 (v4.0.5), and each instance was run for 24 h.
Illumina Barcoding
For Illumina-based validation, we prepared PCR-free libraries using NEBNext Ultra II DNA library prep kit (New England Biolabs), but with TruSeq DNA Single Indexes (Set B, Illumina), following the manufacturers’ instructions up till the adapter ligation step. Libraries were then cleaned using 1.1× Sera-Mag PEG suspension before final pooling in equimolar ratios and subsequent sequencing over one lane of Illumina MiSeq platform (251 × 251-bp) at the Genome Institute of Singapore.
Bioinformatics Pipeline
For MinION reads, the raw fast5 files were uploaded onto a computer cluster for basecalling (guppy version 3.1.5+781ed57). For both datasets, no quality filtering criteria (–min_score 0) was applied during the basecalling process. For the second flow cell, guppy_barcoder was used to further demultiplex basecalled reads by native barcodes. The MinION reads were then analyzed using the miniBarcoder.py script (Srivathsan et al., 2018). We performed the recommended full search (-D 0) on the dataset using the unique tag mode (-m 1), which permitted only 1-bp mismatch between tags (Srivathsan et al., 2018). Because our tags were shorter, we also performed two different variations of the unique tag search; (i) ‘full,’ and (ii) ‘half’ (see Supplementary Table S2). The latter setting was run to minimize the likelihood of erroneous demultiplexing by preventing binning of reads that had only mutant tags. Any resulting MAFFT barcode that had <10× read coverage and >1% of ambiguous bases called as Ns were also removed. For generating RACON barcodes, we mapped the raw reads back onto the MAFFT barcode using GraphMap v0.5.2 (Sović et al., 2016), and then generated a consensus barcode using RACON v1.3.3 (Vaser et al., 2017). We adhered to the max error rate of 0.15 in GraphMap that was suggested for 1D reads (Srivathsan et al., 2019). Both MAFFT and RACON barcodes were then subjected to amino acid correction (Srivathsan et al., 2018), using publicly available sequences on GenBank (nt database downloaded 16th July 2019) to yield MAFFT+AA and RACON+AA barcodes, respectively. As our sample set consisted of fauna from different phyla, the appropriate genetic code (option -g) needed to be applied in the correction process. We used code 2 for vertebrate, code 4 for Cnidaria, code 5 for invertebrate, and code 9 for echinoderm and flatworm samples. We also varied the namino option (Srivathsan et al., 2019) from 1 to 3; this setting determines the number of flanking amino acids to be used in the correction process. The final step was to align the MAFFT+AA and RACON+AA barcodes and perform strict consensus calling using the consolidate.py script to derive what Srivathsan et al. (2018, 2019) refer to as “consolidated barcodes.”
For Illumina-based barcoding, we ran a modified bioinformatics pipeline from Sze et al. (2018) and Leveque et al. (2019). Briefly, paired-end reads were merged using PEAR v0.9.11 (Zhang et al., 2014), and OBITools v1.2.11 (Boyer et al., 2016) was used for demultiplexing and further downstream processing of assembled reads. All the steps were similar, except that instead of running obisplit after obiuniq to distribute reads to samples, we used obisubset. Both obisplit and obisubset perform similar functions, but we chose to use the latter module as it was designed specifically to be applied post-obiuniq (Boyer et al., 2016). We applied the following quality filtering criteria to consider the derived Illumina barcodes as valid: (1) total reads assigned to a sample needed a minimum 10× coverage, and (2) if there were secondary reads assigned to that sample, the dominant read needed to be at least five times more abundant than the next most dominant sequence (Srivathsan et al., 2018). A translation check was then performed on Geneious R11 v11.1.5 (Kearse et al., 2012); this was to ensure our Illumina reference sequences were of mitochondrial origin.
MinION Barcode Accuracy and Clustering Congruence
As the primary aim of this paper was to showcase the feasibility of MinION-based barcoding in ARMS research, we focused our analysis on demonstrating the reliability of error-corrected MinION barcodes rather than drawing any ecological- or community-level inferences from our results.
Both the MinION and Illumina barcodes were screened for contamination using BLASTn (Camacho et al., 2009) against the same nt database used previously for error-correction of MinION barcodes. BLAST hits that had at least 70% BLAST match to the database and a minimum 250-bp overlap were parsed through readsidentifier v1.0 (Srivathsan et al., 2015). We used the MAFFT dataset as it was the largest barcode dataset, and retrospectively filtered the other datasets for contaminants. For our contamination check, we used the morpho-phylum classifications made during the sample vouchering process to match against taxonomic output from readsidentifier. Samples that failed this congruence check were followed-up with voucher examinations to check for potential wrong morpho-phylum assignments (i.e., pre-sorting error). If pre-sorting error was deemed unlikely, the barcode was subsequently removed from the dataset. Any barcode that matched a non-metazoan sequence (e.g., bacteria) was also excluded.
We assessed sequencing accuracy of our clean MinION barcodes with the Illumina reference barcodes using the assess_corrbarcodes_wref.py and assess_uncorrbarcodes_wref.py scripts; accuracy is defined as the number of perfect matches over the total number of bases compared (Srivathsan et al., 2018, 2019). Any MinION barcode that differed from its Illumina reference by >3% was deemed erroneous and removed; this was because the same amplicon pools were used, and hence, derived barcodes should be identical regardless of platform used. Any differences, if any, could indicate erroneous binning of MinION reads into the wrong sample (i.e., demultiplexing error).
We then determined whether the two sequencing approaches differed in the number of molecular operational taxonomic units (MOTUs) attained. Overlapping Illumina and MinION barcodes from each dataset were separately aligned on MAFFT v7.407 (Katoh and Standley, 2013) under default parameters. Objective clustering was carried out with gaps treated as missing data, grouping sequences into MOTUs based on uncorrected p-distances, testing thresholds of 2–4% (Meier et al., 2006; Srivathsan and Meier, 2012). We then performed a match ratio check to investigate if MinION clustered in the same way as Illumina barcodes (Ahrens et al., 2016; Srivathsan et al., 2019; Yeo et al., 2020).
Macrofaunal Biodiversity of ARMS
We evaluated barcode accuracy and MOTU congruence performance across the MinION-generated datasets to select the best-performing consolidated barcode dataset for biodiversity analysis. Objective clustering was performed on the chosen dataset (in full) at 3% clustering threshold, with resultant MOTUs subjected to BLASTn. Only BLAST hits that had at least 80% match to the nt database, and had a minimum overlap of 250-bp parsed through readsidentifier to obtain taxonomic identities. We then performed a morphological examination of randomly selected MOTUs to check if identities and MOTU members made sense.
Sequencing Costs
We also calculated the sequencing costs associated with both MinION and Illumina to examine how they compared with the Sanger method. Our calculations did not consider the entry cost of sequencing hardware (i.e., the price of a MinION sequencer or Illumina MiSeq), which we assumed were readily accessible. For MinION sequencing, we assumed that reagents and flow cells were purchased separately because this provides a more meaningful gauge as the MinION starter pack is usually a one-time purchase for most users. For Illumina sequencing, we used publicly available sequencing costs2.
Results
Macrofaunal Fraction of ARMS
We obtained 725 specimens, representing seven different phyla, from 12 ARMS units across four reef sites in Singapore. Samples were largely dominated by arthropods (314 samples), followed by molluscs (148 samples) and annelids (147 samples; Figure 2). In sum, 767 amplicons, comprising 725 specimens and 42 negative controls were sequenced on both Illumina and MinION platforms.
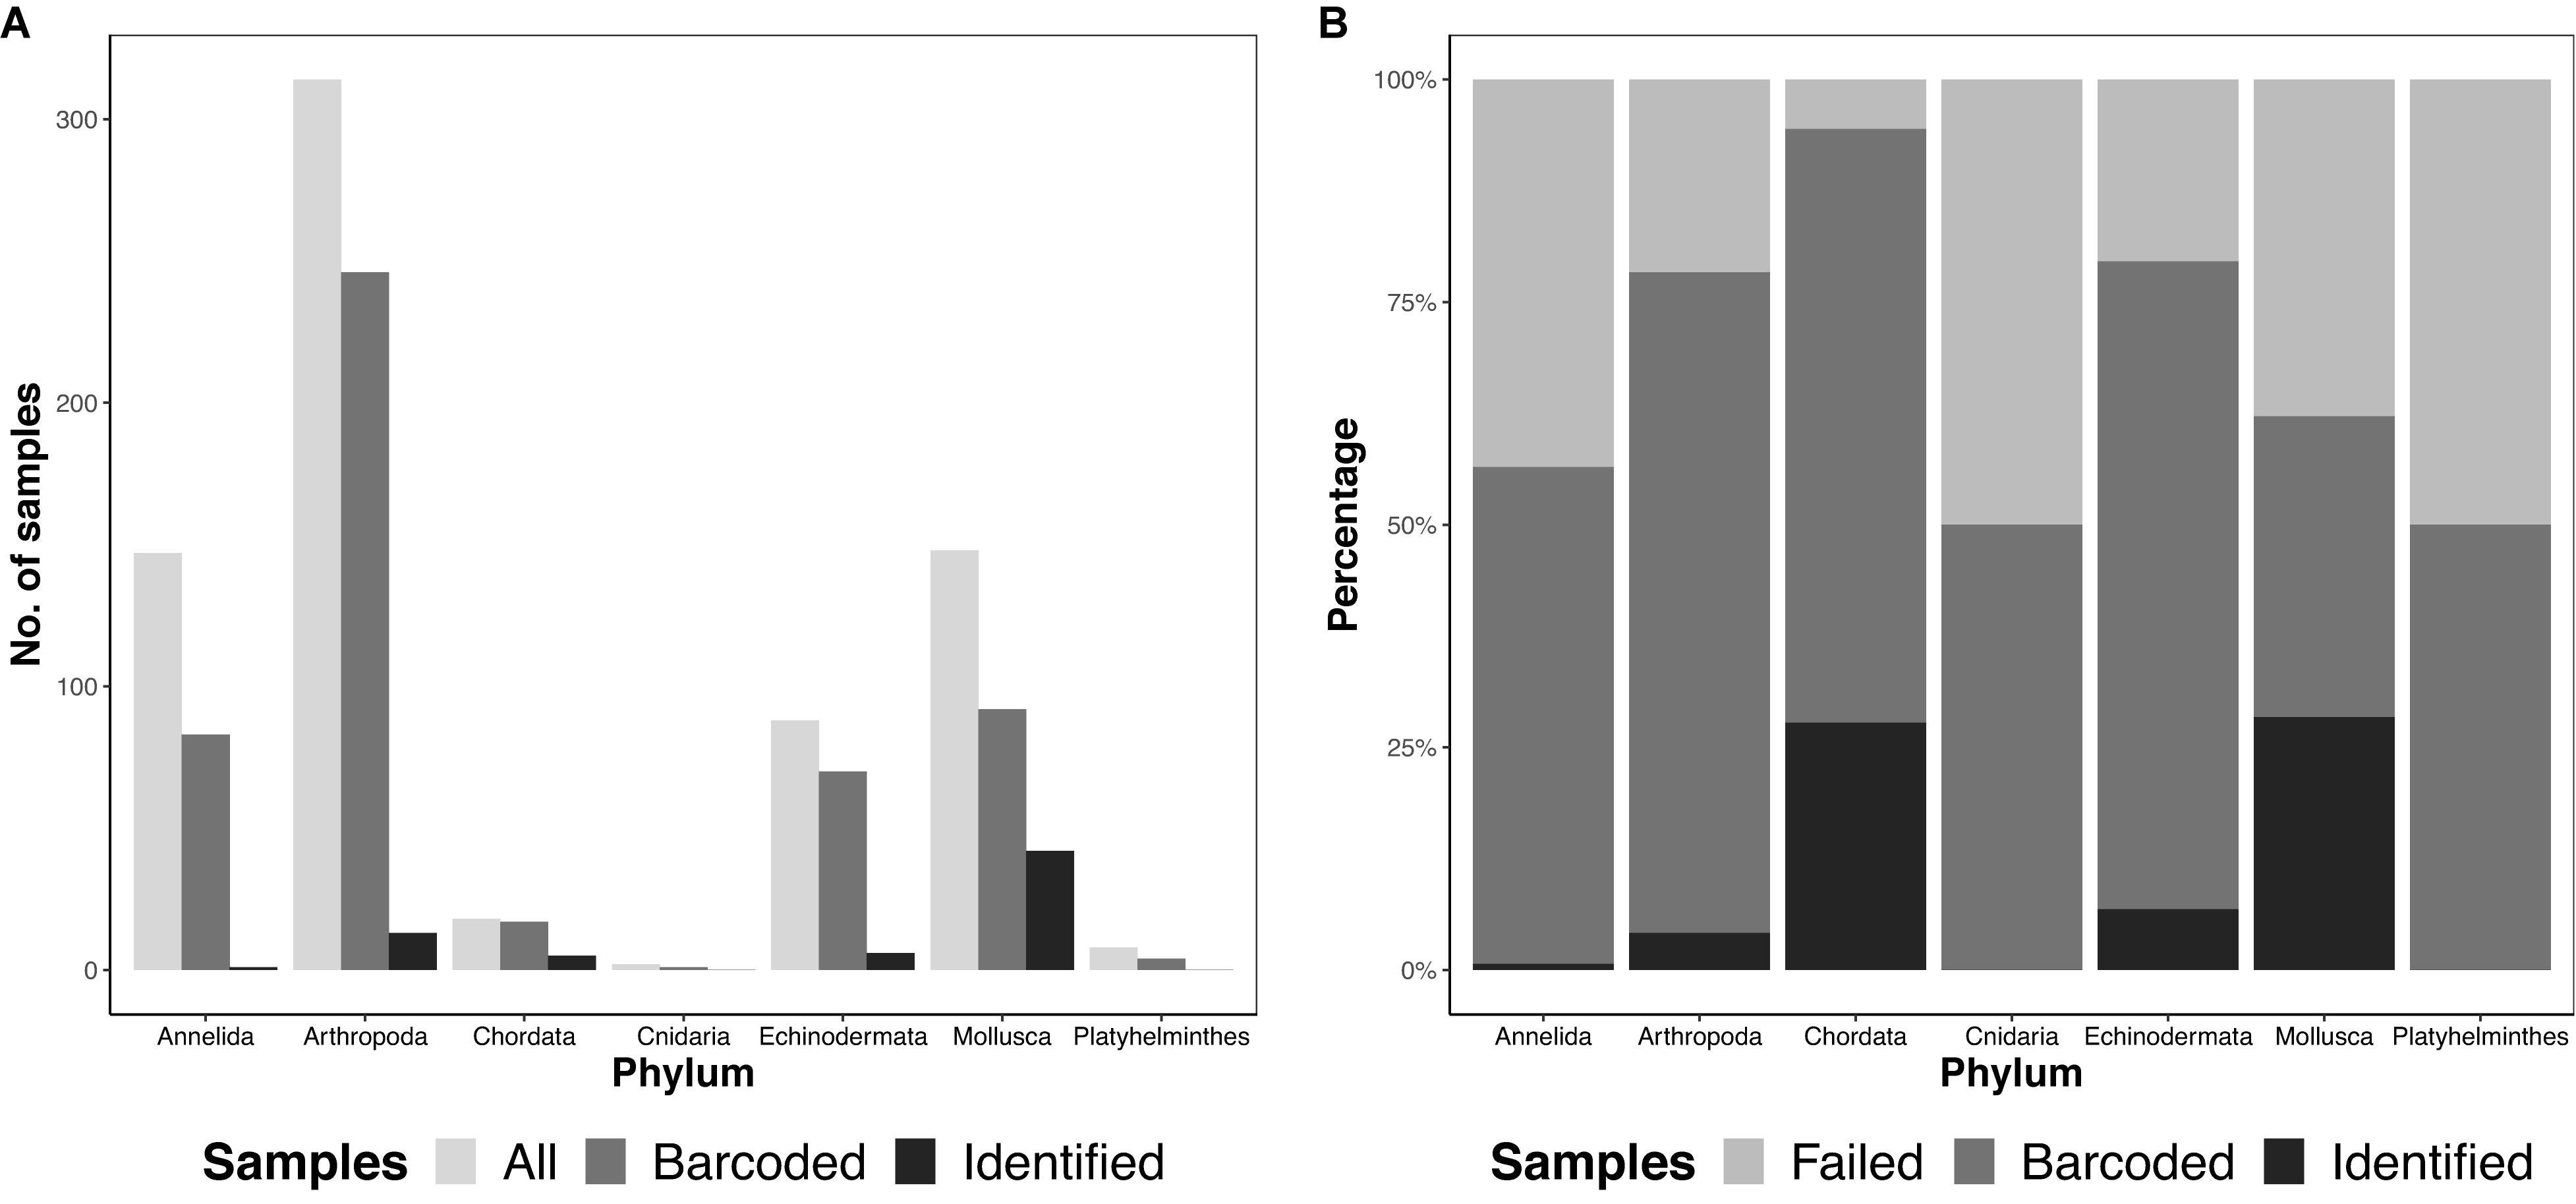
Figure 2. Total diversity obtained from ARMS across the different phyla (A) by abundance, showing the total number of samples obtained (“All”), number of barcodes obtained at the consolidated stage, namino = 1 setting (“Barcoded”), and number of consolidated barcodes with species-level identification at ≥97% (“Identified”), and (B) by proportion, showing “Barcoded,” “Identified” and samples that did not amplify (“Failed”).
MinION Barcoding
The first MinION flow cell generated 17,912,094 reads. As processing the entire dataset was computationally intensive, we subsampled the data at the 15-min mark of sequencing to obtain the first 280,000 reads. The second flow cell had terminated prematurely after 3 h and generated 958,112 reads. This was probably caused by the presence of contaminants (likely residual ethanol from the bead clean up) that interfered with library preparation efficiency. Given that Srivathsan et al. (2018) obtained 98% of their barcodes (for ∼500 samples) at 100× coverage within 2 h of sequencing, we proceeded with downstream analysis for our own run as a 3 h run was expected to be sufficient for our marginally larger sample size. The combined dataset comprised 1,238,112 raw reads, of which 1,091,301 reads remained after guppy_barcoder (Table 1).
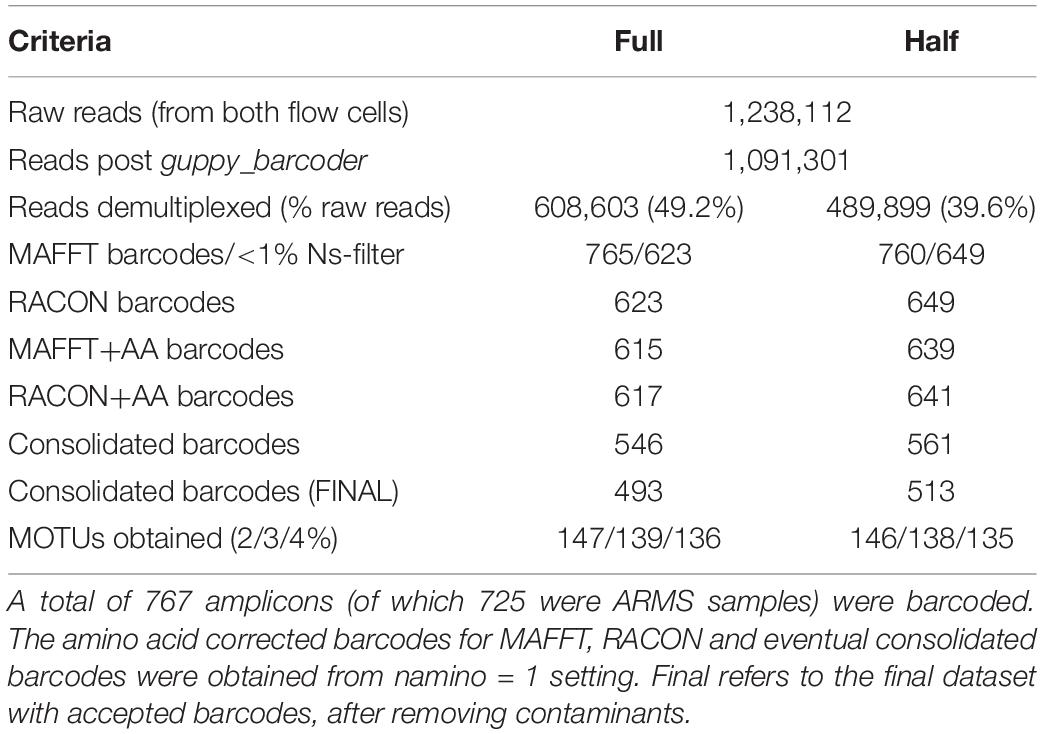
Table 1. Reads and barcodes obtained across the different datasets.
We achieved 39 or 49% demultiplexing success depending on the criteria used (Table 1), with the ‘full’ and ‘half’ dataset capturing 608,603 and 489,899 reads, respectively. Despite these differences, we obtained ∼760 preliminary MAFFT barcodes across both datasets. Although the ‘full’ dataset yielded more preliminary MAFFT barcodes, it retained ∼20 fewer barcodes compared to the ‘half’ dataset after filtering for >1% ambiguous bases. We then ran the entire miniBarcoder pipeline for all datasets, and found that while the ‘half’ dataset consistently had more barcodes than the ‘full’ dataset, MOTUs obtained were found to be highly similar (Table 1). We present results based on the ‘half’ dataset as it was the larger barcode dataset.
We obtained 649 MAFFT and RACON barcodes from the ‘half’ dataset, with read coverage per sample ranging from 27 to 4,181 (Supplementary Figure S1). After amino acid correction, 639 MAFFT+AA barcodes and 641 RACON+AA barcodes remained; these corrected barcodes were then consolidated to obtain 561 consolidated barcodes (Table 1). All three types of error-corrected barcodes still retained a low number of ambiguities (coded as Ns), with MAFFT+AA barcodes having the most, and consolidated barcodes having the least ambiguities (Figure 3). Overall, MinION barcoding success was 77.4% (561 out of 725 specimens). None of the 42 negative controls passed the Ns-filter stage of the MAFFT barcode step. Of the 561 consolidated barcodes, a further 48 barcodes were removed because they failed the morpho-phylum and barcode congruence check. Failure was attributed to cross-contamination after confirmatory checks with the vouchers. Notably, the same 48 samples failed on the Illumina platform. No barcode was found to have top BLAST hit to non-metazoan sequences. We retained 513–514 consolidated barcodes for further analysis.
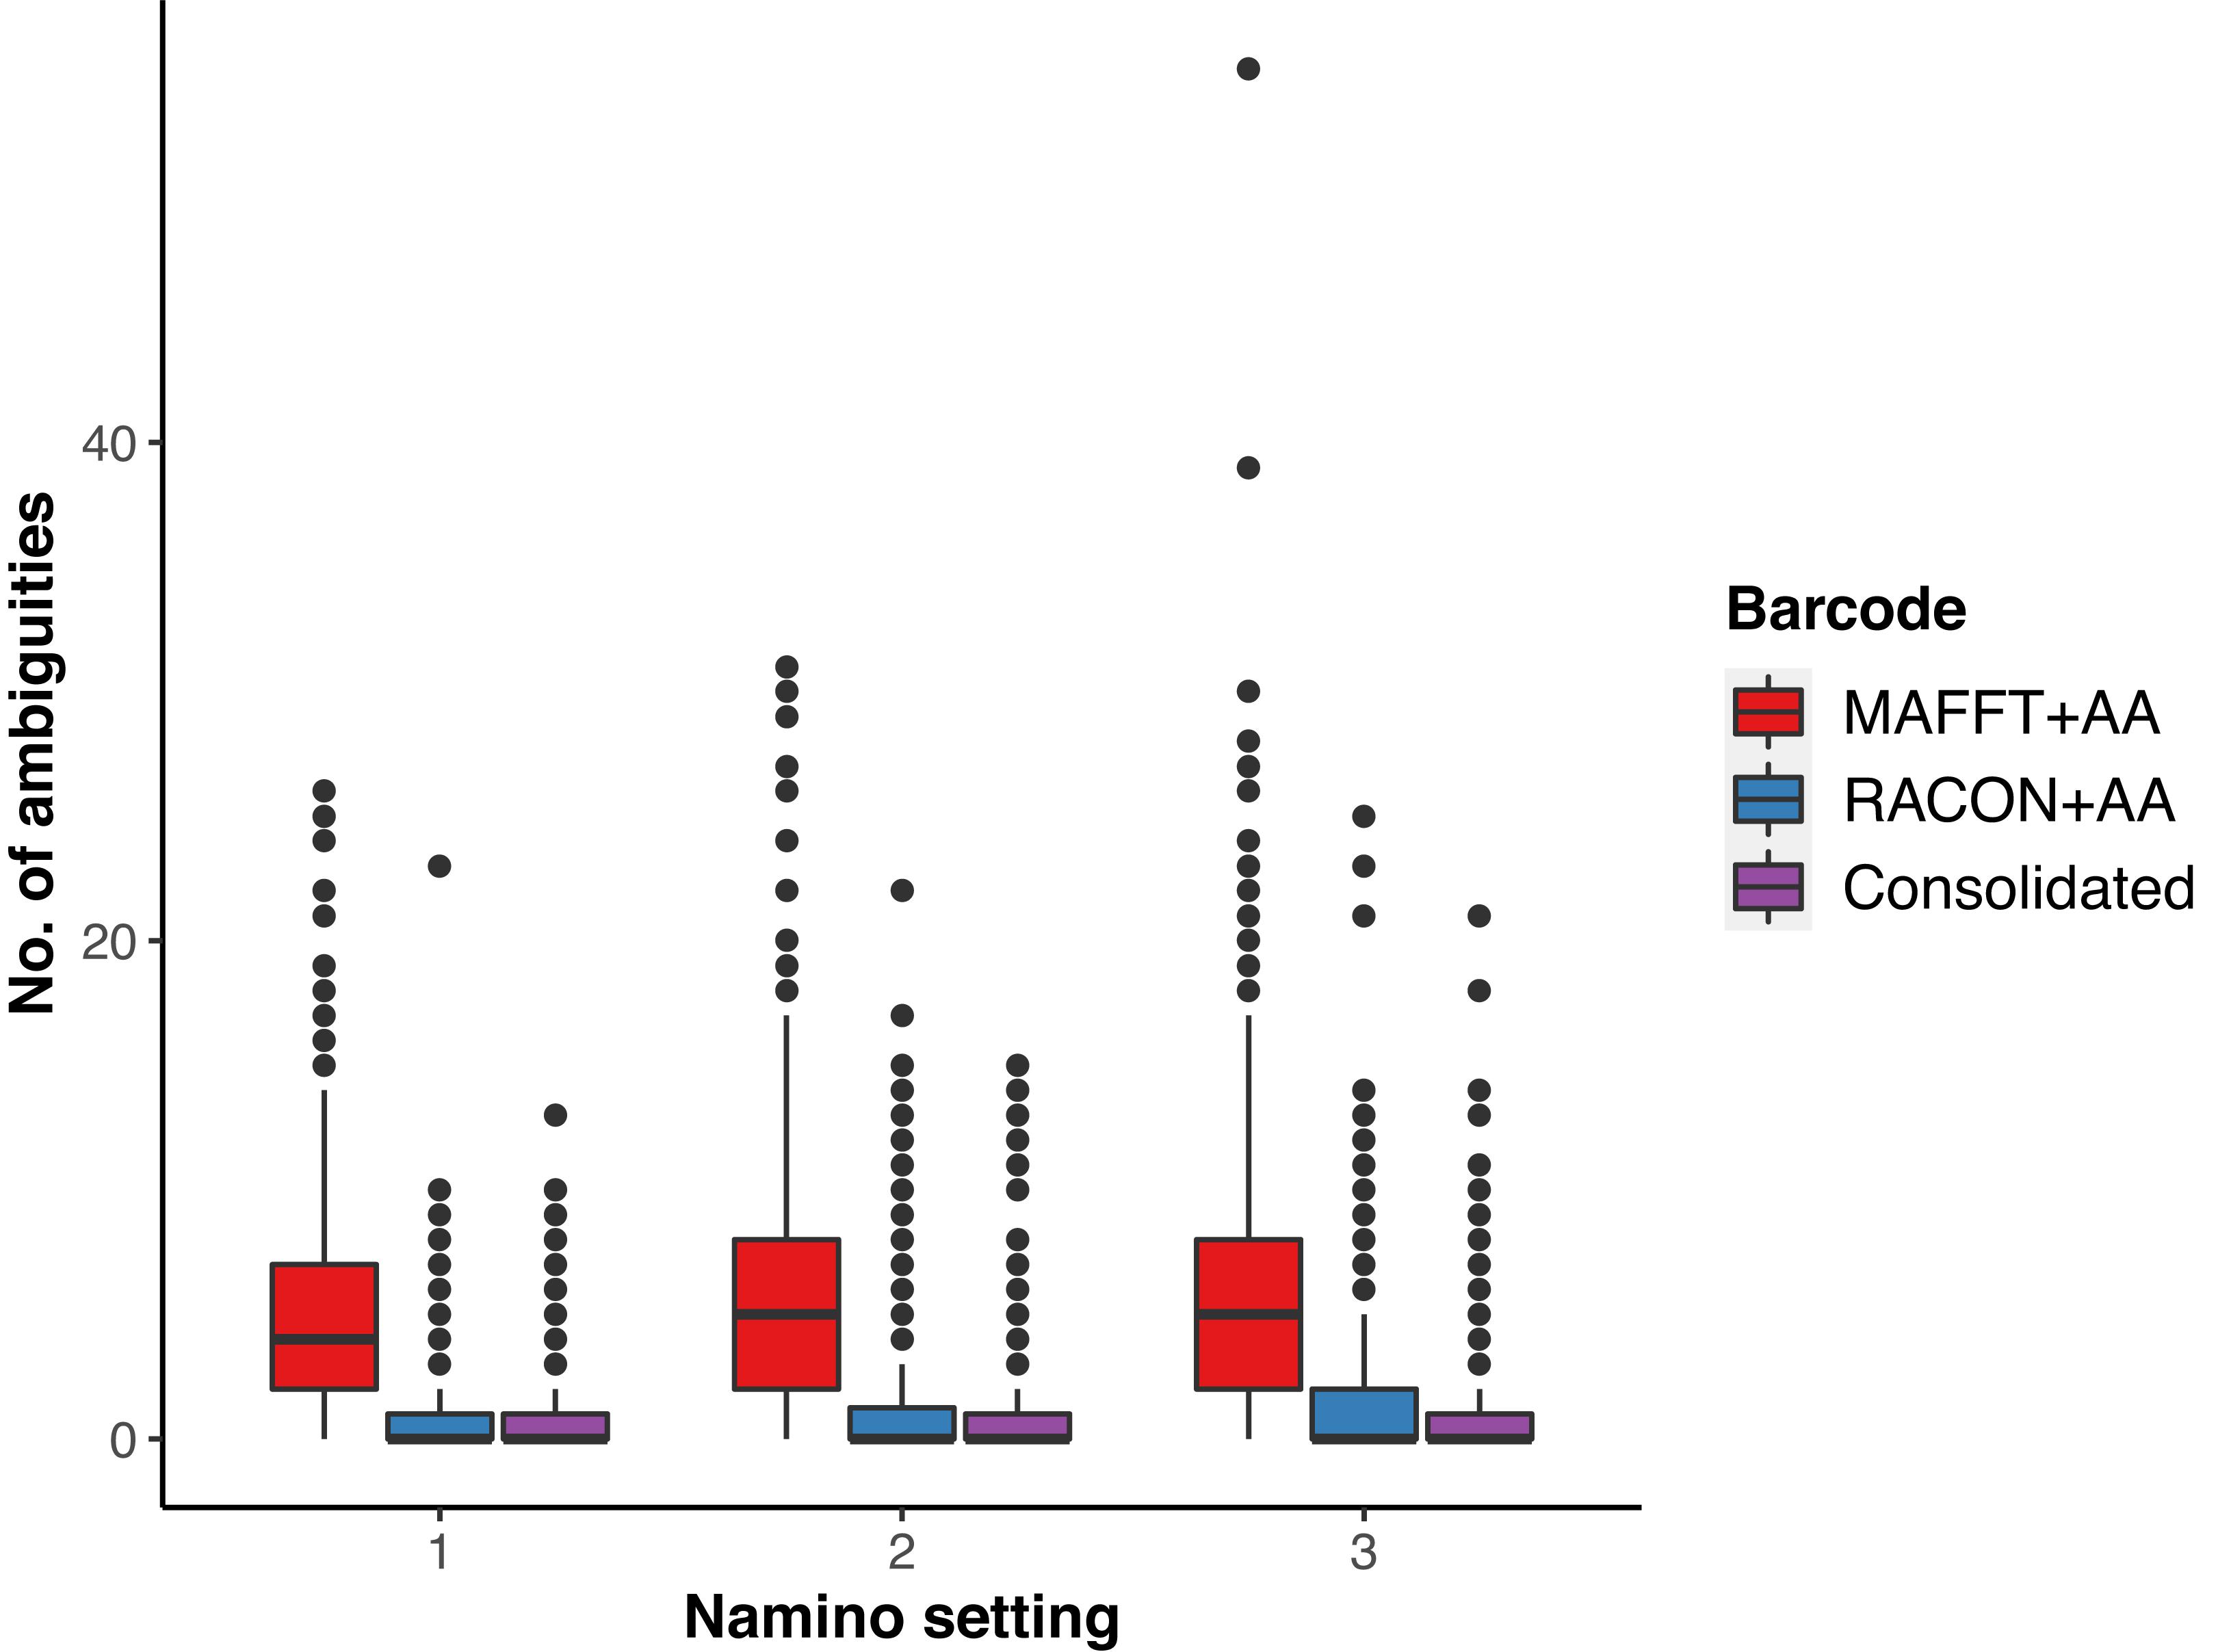
Figure 3. Ambiguities remaining in the three types of error-corrected MinION barcodes: MAFFTT+AA (red), RACON+AA (blue), and consolidated (purple) across varying namino settings (1–3).
Comparing MinION and Illumina Barcodes
For our Illumina reference barcodes, 21,854,748 reads were generated on one MiSeq lane; 645 barcodes remained after applying sequencing filters. Five barcodes failed the translation check and were removed; 640 Illumina reference barcodes remained.
In terms of sequencing accuracy, we found all MinION datasets had near-perfect barcode accuracy when compared with Illumina barcodes, scoring at least 99.95% for accuracy; with the MAFFT dataset achieving 100% accuracy (Table 2). In addition, no MinION barcode had >3% mismatch when evaluated against the Illumina reference. MAFFT barcodes generally had few to no mismatches, while RACON barcodes were marginally less accurate than MAFFT barcodes (Table 2). The uncorrected barcode datasets scored higher on accuracy, but a fair proportion of them (>100 samples for each barcode dataset) had internal gaps. The error-correction pipeline was able to resolve this issue such that only 6–13 samples had gaps. It was the consolidated datasets that yielded the most barcodes with no gaps and the fewest mismatches (Table 2).
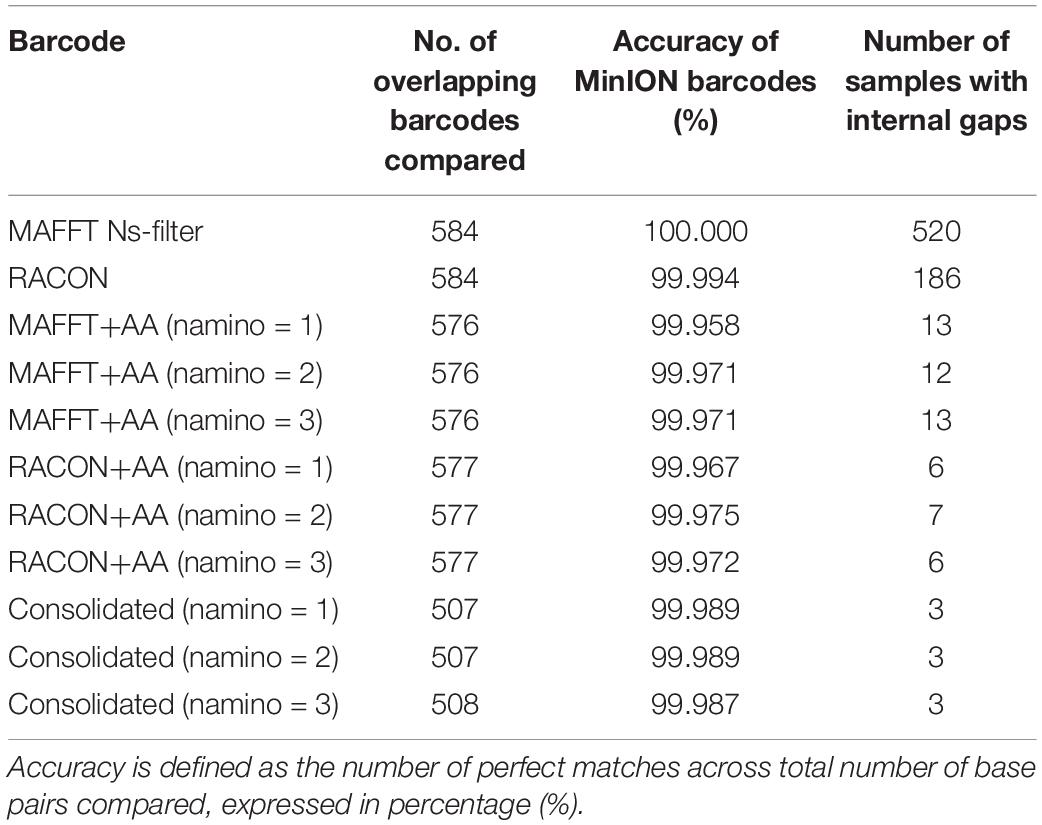
Table 2. Accuracy and gaps observed when MinION barcodes from the ‘half’ dataset were compared with Illumina barcodes.
The MOTUs obtained from objective clustering for MinION and Illumina barcode datasets were highly congruent, differing by up to just four MOTUs depending on the dataset (Table 3). MOTUs obtained were also fairly stable across the 2–4% p-distance thresholds tested for both sequencing datasets. Match ratios were also very high (≥0.96) across the datasets (Table 3). Again, the consolidated barcodes performed the best, with the same number of MOTUs obtained, and perfect match ratios.
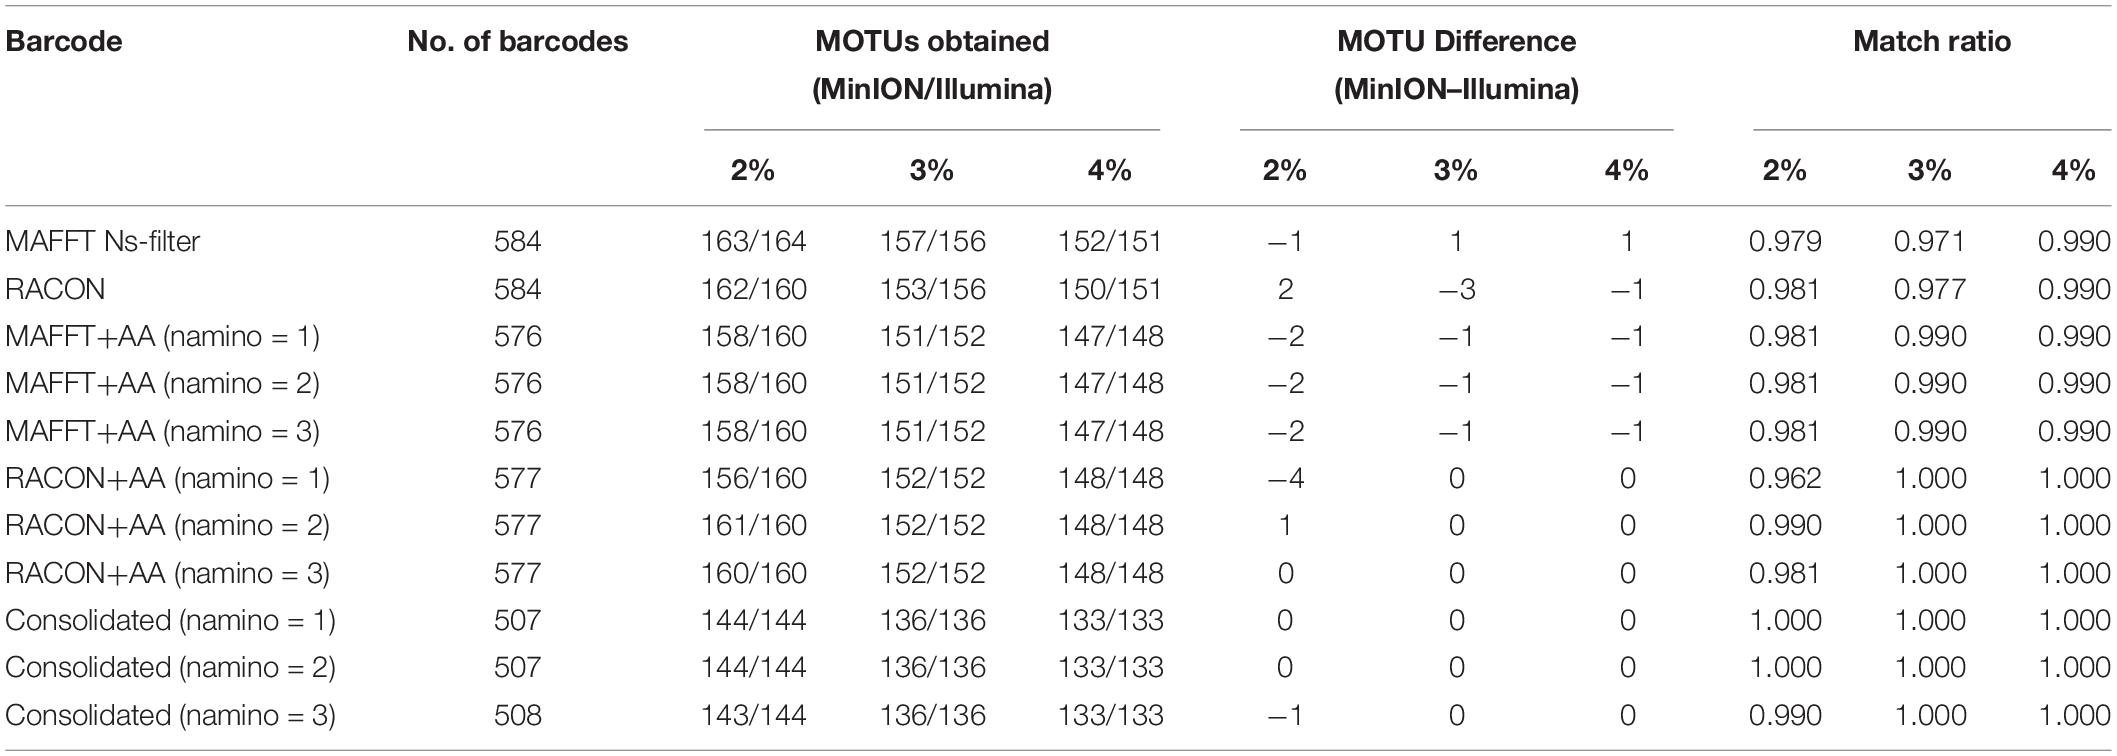
Table 3. The number of molecular operational taxonomic units (MOTUs) obtained for each overlapping dataset at 2–4% threshold, and the differences in MOTUs between MinION (‘half” dataset) and Illumina datasets.
We ultimately selected the consolidated barcodes (namino = 1) dataset for biological analysis, taking into consideration that it was highly accurate (99.989%), had the least samples with internal gaps, no differences in MOTUs obtained when compared to Illumina references, and had perfect match ratios across different clustering thresholds (Tables 2, 3). While the namino = 2 consolidated barcode dataset performed similarly well, the namino = 1 dataset was chosen because it contained less ambiguities (Figure 3). We obtained 513 clean MinION barcodes with the namino = 1 consolidated barcode dataset, representing 138 MOTUs at 3% objective clustering threshold (Table 1). Only 26 of the 138 MOTUs could be delimited to species at ≥97% sequence similarity, of which 16 had species-level identification. Molluscan samples (six MOTUs) had the highest identification success to species-level, followed by Arthropoda (five MOTUs; Figure 2). A similar pattern of identification success was noted previously by Ip et al. (2019).
Sequencing Costs
Overall, the per sample costs for both Illumina and MinION sequencing was found to be six-fold cheaper than the Sanger method (Table 4), costing an estimated US$3 per barcode. MinION barcodes were marginally more expensive than Illumina barcodes (US$3.27 vs. US$3.15) in this study. The higher cost was attributable to the additional flow cell and reagents used in this study; had we not used them, the MinION barcodes would have cost US$1.91 (Table 4).
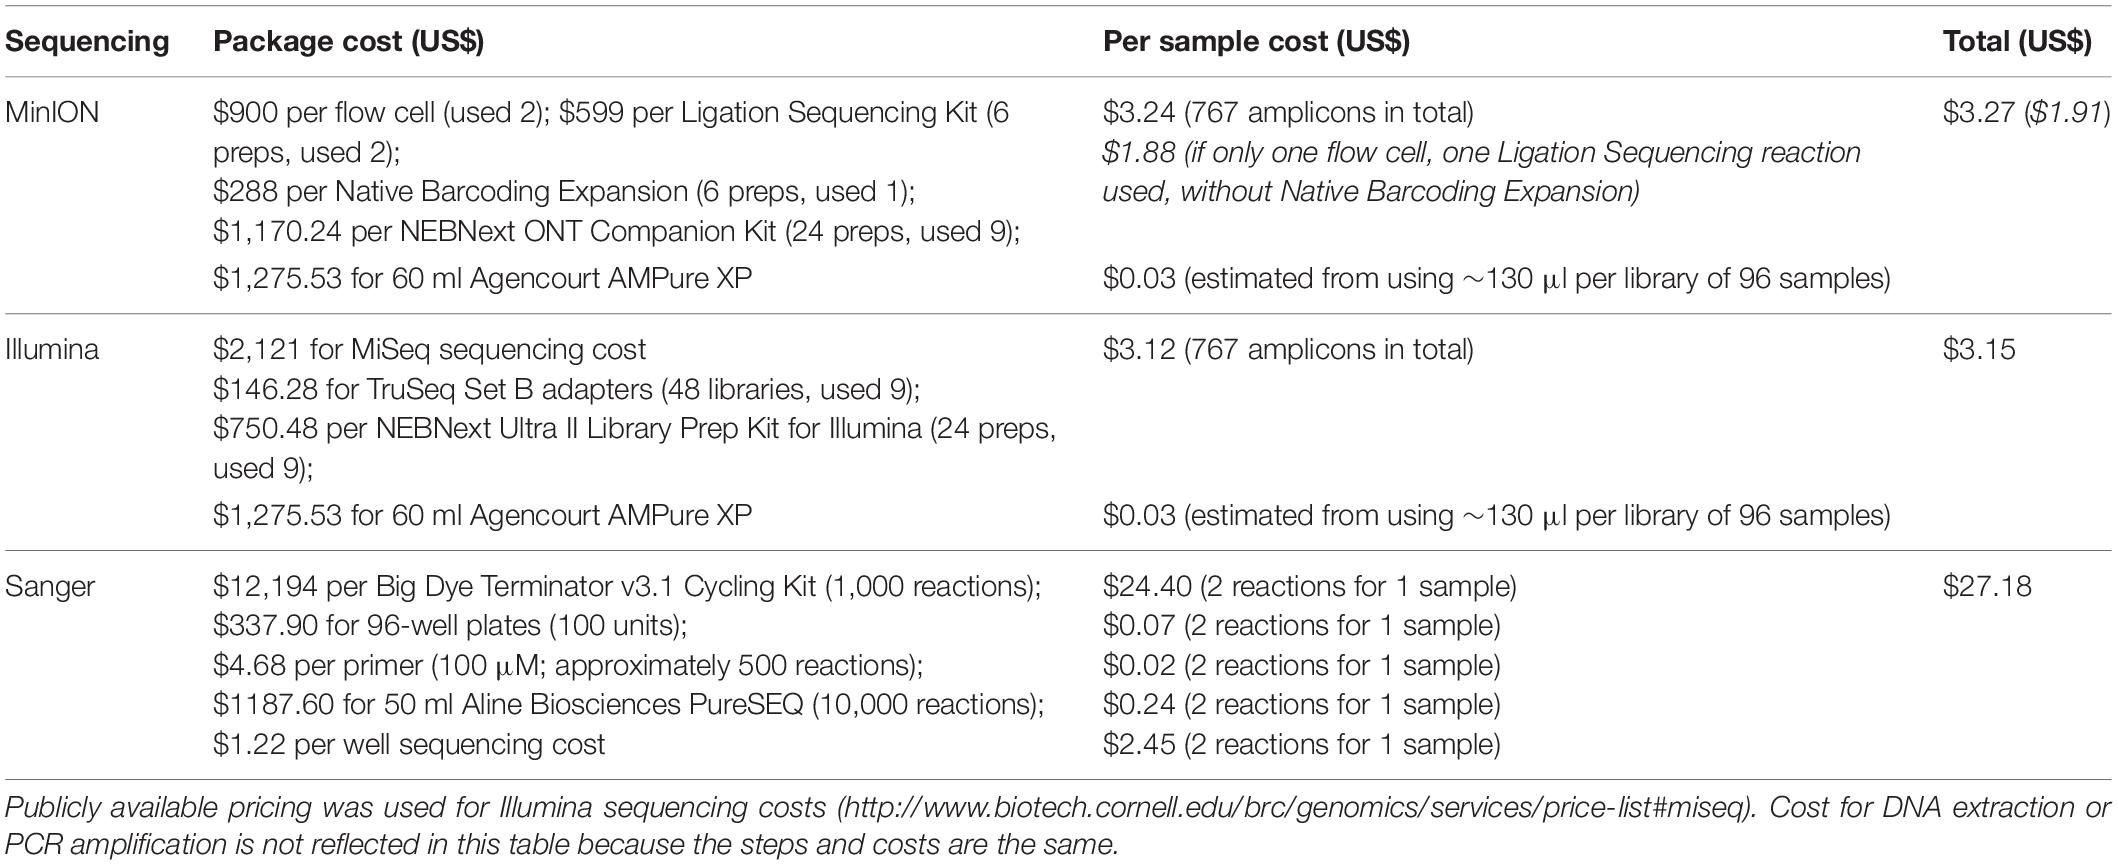
Table 4. Cost comparison between MinION, Illumina and Sanger sequencing for this study.
Discussion
Cost- and Time-Savings With MinION-Based Barcoding
We here demonstrate a successful application of the MinION-based barcoding pipeline to process >2-mm samples from ARMS units deployed on tropical coral reefs. Our strategy is advantageous to researchers using ARMS due to cost and time savings, as well as the low outlay of sequencing equipment. We expect that this improved barcoding strategy will help sustain or generate newfound interest in the >2-mm sized fraction of ARMS, given its declining representation in recent years (Supplementary Table S1).
Most importantly, the costs involved in MinION sequencing are inversely related to the sample size, and what makes MinION barcoding so suited for ARMS is that sample sizes are just right for MinION barcoding to be fast and cost-effective. The abundance of >2-mm organisms from past studies ranged from several hundred (Plaisance et al., 2011a; Al-Rshaidat et al., 2016; Pearman et al., 2018) to the thousands (Plaisance et al., 2011b; Leray and Knowlton, 2015; Supplementary Table S1). Previously, such sample sizes would have been too small to be multiplexed cost-effectively on an Illumina or PacBio flow cell—one would need >10,000 specimens with Illumina NGS barcoding for US$1 barcodes (Meier et al., 2016; Srivathsan et al., 2018)—but large enough that Sanger sequencing becomes laborious and cost-prohibitive. MinION-barcoding thus becomes ideal for ARMS researchers (or any other barcoding project) because it caters to projects with small to moderate sample sizes. For example, Srivathsan et al. (2019) demonstrated sequencing costs as low as <US$0.35 per sample for ∼3,500 specimens on a single flow cell. In this study, our total amplicon size (767) using the MinION barcode costs more at US$3 per sample, but would be considerably cheaper (US$1.91 per sample) had we used a single flow cell (Table 4). Nevertheless, MinION barcoding (and even Illumina barcoding) remains considerably cheaper than Sanger barcoding (≥US$18 per barcode; Table 4; Meier et al., 2016). Furthermore, the ability to multiplex numerous samples on a flow cell saves considerable time. In this study, we obtained ∼700 preliminary barcodes in 3.5 h, whereas the Sanger method for the equivalent sample size would take ∼18 h. This is attributable to the laborious preparatory bench work of the latter, where sample pooling is not possible, and samples have to be processed in batches. By employing a multiplexing strategy in MinION barcoding as described here and in Srivathsan et al. (2018, 2019), all the amplicons can be processed into a single library at one time. Overall, MinION barcoding is cheaper and faster for processing a larger number of samples than the present Sanger workflow for the ARMS > 2-mm fraction.
Relatedly, the MinION hardware is also comparatively cheaper to obtain than most sequencers (e.g., ABI capillary or Illumina), with a starter pack costing approximately US$1,000. Most molecular laboratories would already have access to basic laboratory equipment (e.g., thermocyclers), so there is no additional hardware required to perform MinION barcoding. Moreover, the minimal computational prerequisites for the miniBarcoder pipeline further enhance the attractiveness of MinION barcoding. We completed the entire analysis pipeline on a 4-core computer (32 Gb RAM) within 1 week, meaning that a conventional laptop or desktop is sufficient. Additionally, the plug-and-play nature of the software makes it intuitive for users, who need only basic proficiency in the Ubuntu environment.
MinION Barcodes Are Viable
Furthermore, the miniBarcoder pipeline affords flexibility while remaining scientifically robust. First, the miniBarcoder pipeline was able to accommodate our use of shorter tags (8-bp vs. 13-bp); the fact that none of our MinION barcodes differed by >3% from their Illumina references suggests high demultiplexing success, and that any failures in morpho-phylum and barcode congruence checks on both platforms were due to wet-lab errors. Notably, our second flow cell had two levels of multiplexing; the first at the sample level via tagged primers, and the second at the library level via ONT native barcodes, which may increase margins for demultiplexing error, but we did not observe this occurring with our dataset, further demonstrating high demultiplexing fidelity. Second, we successfully used different settings during the unique tag search to increase barcode recovery (Supplementary Table S2). Despite lower demultiplexing success, we recovered a higher number of MAFFT N-filtered barcodes from the ‘half’ rather than ‘full’ dataset (Table 1). We posit that accepting mutant tags introduced more erroneous reads per sample in the ‘full’ dataset, which increased the number of ambiguous bases during the majority consensus calling step when generating preliminary MAFFT barcodes and led to their subsequent removal. This suggests that read quality rather than number of demultiplexed reads is more important for recovering barcodes. We thus recommend that users toggle between settings to maximize barcode retrieval. Such tests do not take long and would translate to cost savings by reducing the need for re-sequencing. Third, we successfully applied the barcoding pipeline to a broad spectrum of >2-mm specimens, representing seven different phyla (Figure 2), and managed to recover 513 consolidated MinION barcodes. This was possible through the careful application of the appropriate mitochondrial genetic code in the error-correction step. Our amplification and identification success rates were similar to a previous barcoding study by Ip et al. (2019), which employed a combination of Sanger and Illumina barcoding, further exemplifying that MinION barcodes are viable and that performance success is defined more by primer choice rather than sequencing platform.
In order for MinION barcoding to perform optimally, successful library preparation is key. We found that extending the incubation times for end-repair and adapter ligation (see the section “MinION Barcoding”) improved library preparation success, a step that was also performed by Seah et al. (2020), albeit with slightly different lengths of time. This appears to be library-dependent as Srivathsan et al. (2019) did not require any modifications. ARMS researchers can adopt our incubation settings or conduct their own optimization runs, which would extend the time needed for library preparation, but that extra time is negligible compared to the time and labor saved in lieu of Sanger sequencing. Another crucial factor to note is input library quality, as nanopore sequencing is sensitive to contaminants. In particular, the premature termination of our second run was probably caused by the presence of contaminants, likely due to residual ethanol from the bead wash step. We suggest that a short (1–2 min) vacuum-drying step would safeguard against residual ethanol contamination, but also caution that over-drying could be as detrimental as under-drying. Researchers concerned about potential contaminants in their input DNA can opt for prior cleanup (at the expense of some DNA loss) with specialized kits like DNA Clean and Concentrator (Zymo Research; e.g., Quek et al., 2019, 2020) to enhance library preparation success.
MinION-in-ARMS: (Meta)Barcoding and Beyond
We here describe an improved workflow for barcoding the >2-mm sized fraction with the MinION sequencer (Figure 1). There are, however, other size-fractions involved (106–500-μm, and 500-μm–2-mm) in ARMS and it presently remains untested whether MinION sequencing can be applied to metabarcoding of the other size fractions. The miniBarcoder has been successfully applied to mixed food items, essentially small-scaled metabarcoding samples, but the reads had to be first parsed by identity and then manually grouped before consensus calling to obtain MAFFT barcodes (Ho et al., 2020). It remains unclear how the miniBarcoder pipeline would fare when scaling up to metabarcoding ARMS samples, where the entire tree of life is represented. Presently, there is no established nanopore metabarcoding pipeline for metazoans. Further work should thus also assess how other nanopore barcoding workflows such as ONTrack (Maestri et al., 2019) or existing Illumina-based metabarcoding pipelines such as DAD2 (Callahan et al., 2016) and UNOISE2 (Edgar, 2016) perform with nanopore metabarcoding reads. Specifically, it is necessary to evaluate if these programs can take into account the sequencing error rate and still differentiate truly biologically divergent metabarcoding reads (Krehenwinkel et al., 2019b). Fortunately, nanopore sequencing chemistry continues to improve, and it would be interesting to investigate how the recently released R10.3 flow cell, which purportedly produces more accurate reads, fares in MinION sequencing. The release of higher-throughput sequencers like GridION and PromethION also opens up exciting possibilities for deeper sequencing, that when accompanied with more accurate sequencing chemistry, may allow for nanopore metabarcoding in the near future.
Autonomous Reef Monitoring Structure research presents a curious situation, and is possibly one of the rare few DNA sequencing projects where the different sub-groups undergo different types of sequencing. The >2-mm sized fraction is the only group to undergo DNA barcoding, and is the only group where individual specimens are photographed (Leray and Knowlton, 2015). In that regard, we ultimately opted for a MinION barcoding approach for the >2-mm size fraction over bulk-sample metabarcoding (as with the other size fractions) in order to remain true to the intended design of ARMS, which is to retain sequence-to-sample association (Leray and Knowlton, 2015). Such an approach will be helpful for the confirmation of previous species records, as demonstrated in other studies (Huang et al., 2014; Poquita-Du et al., 2017, 2019; Yip et al., 2018; Ng et al., 2019; Oh et al., 2019) and voucher-sequence matching would facilitate downstream integrative taxonomic work to either resolve cryptic species complexes (Bickford et al., 2007; Chang et al., 2018; Chan et al., 2019), or even describe new species (Srivathsan et al., 2019). The fact that our samples remain largely unidentifiable (only 12% of MOTUs could be identified to species at ≥97% sequence similarity) further impresses the need for postliminary taxonomic work to establish species-level identity—whether they are existing or new species—and add new information to DNA barcode repositories (e.g., Kutty et al., 2018; Ip et al., 2019). We emphasize that many of our samples remain unidentified due to lack of robust online database matches rather than the ambiguities that persist in the MinION barcodes after error-correction (Figure 3); the latter of which has been demonstrated to be of minor concern (Srivathsan et al., 2018, 2019; Ho et al., 2020). The improved sequencing chemistry in R10.3 flowcells would hopefully improve MinION barcode quality, and in turn, encourage more widespread adoption of the method. The need to better integrate sequence data and anchor it to taxonomy is a main reason why we do not subject the >2-mm size fraction to bulk metabarcoding. The proposed MinION-barcoding approach thus offers a new window of opportunity to process the macrofaunal section faster, while leaving room for subsequent integrative taxonomic work because sequence-to-sample information is retained.
Conclusion
We here proposed MinION-based barcoding as an alternative sequencing approach to the initial pipeline (Leray and Knowlton, 2015) for rapid processing of the >2-mm size fraction involving hundreds to thousands of specimens. We have demonstrated that MinION-based barcoding is viable and highly accurate, by comparing our MinION barcodes to Illumina references generated from the same library pools. The few ambiguities that persist in the error-corrected MinION barcodes do not compromise biological inferences. MinION barcodes also exhibit congruent clustering patterns with reference barcodes, are cheaper than the existing Sanger barcodes, and an entire dataset of ∼700 barcodes can be easily obtained in under 4 h. We conclude that this method would most certainly streamline the workflow for processing ARMS samples, while still retaining the much needed sample-to-sequence information that is valuable for follow-up integrative taxonomic work. Beyond ARMS, MinION barcoding can also be easily applied in other small-to-moderate DNA barcoding projects (<10,000 specimens) for rapid species identification and discovery. We encourage researchers working on such small-to-moderate biodiversity barcoding endeavors to not only incorporate MinION-based barcoding into their research, but to also continually innovate and find ways to improve existing workflows. The faster we are able to generate barcodes, the sooner the integrative taxonomic work and ecological analyses of marine biodiversity can begin.
Data Availability Statement
Basecalled fastq files, demultiplex sheets, Illumina reference file and consolidated MinION barcodes are available at Zenodo (https://doi.org/10.5281/zenodo.3816816). Basecalled fastq files can also be found on the NCBI Sequence Read Archive under BioProject PRJNA631514 (Accession Nos. SRX8336250 and SRX8336251).
Ethics Statement
The animal study was reviewed and approved by NUS Institutional Animal Care and Use Committee (IACUC) guidelines (IACUC Protocol B15-1403).
Author Contributions
All authors collectively conceived the idea for the study and led the fieldwork. YI and JC vouchered the specimens, assisted by DH. YI performed the DNA extractions, gene amplifications, Illumina library preparation, and data analysis. JC performed the MinION sequencing and data analysis. JC wrote the manuscript, with help from the other authors. All authors approved the final version of the manuscript for publication.
Funding
Funding for this research was provided by the Singapore Ministry of Education Academic Research Fund Tier 1 (R-154-000-A63-114), the National Research Foundation, Prime Minister’s Office, Singapore under its Marine Science R&D Programme (MSRDP-P03), and an AXA postdoctoral fellowship to AB (R-154-000-649-507).
Conflict of Interest
The authors declare that the research was conducted in the absence of any commercial or financial relationships that could be construed as a potential conflict of interest.
Acknowledgments
We are grateful to the following for their help with fieldwork and processing: Yong Kit Samuel Chan, Zheng Bin Randolph Quek, Sudhanshi Sanjeev Jain, Ren Min Oh, Jovena Chun Ling Seah, Zack Chen, Chin Soon Lionel Ng, Joy Shu Yee Wong, Sherlyn Sher Qing Lim, Zhi Ting Yip, and Jun Wei Phua. We also thank Amrita Srivathsan for her advice on the miniBarcoder pipeline, and National Supercomputing Centre, Singapore (https://www.nscc.sg), for use of their computational resources.
Supplementary Material
The Supplementary Material for this article can be found online at: https://www.frontiersin.org/articles/10.3389/fmars.2020.00448/full#supplementary-material
Footnotes
- ^ https://www.oceanarms.org/getting-involved
- ^ http://www.biotech.cornell.edu/brc/genomics/services/price-list#miseq
References
Ahrens, D., Fujisawa, T., Krammer, H.-J., Eberle, J., Fabrizi, S., and Vogler, A. P. (2016). Rarity and incomplete sampling in DNA-based species delimitation. Syst. Biol. 65, 478–494. doi: 10.1093/sysbio/syw002
Al-Rshaidat, M. M. D., Snider, A., Rosebraugh, S., Devine, A. M., Devine, T. D., Plaisance, L., et al. (2016). Deep COI sequencing of standardized benthic samples unveils overlooked diversity of Jordanian coral reefs in the northern Red Sea. Genome 59, 724–737. doi: 10.1139/gen-2015-0208
Appeltans, W., Ahyong, S. T., Anderson, G., Angel, M. V., Artois, T., Bailly, N., et al. (2012). The magnitude of global marine species diversity. Curr. Biol. 22, 2189–2202. doi: 10.1016/j.cub.2012.09.036
Baudhuin, L. M., Lagerstedt, S. A., Klee, E. W., Fadra, N., Oglesbee, D., and Ferber, M. J. (2015). Confirming variants in next-generation sequencing panel testing by sanger sequencing. J. Mol. Diagn. 17, 456–461. doi: 10.1016/j.jmoldx.2015.03.004
Beck, T. F., and Mullikin, J. C. Nisc Comparative Sequencing Program Biesecker, L. G. (2016). Systematic evaluation of sanger validation of next-generation sequencing variants. Clin. Chem. 62, 647–654. doi: 10.1373/clinchem.2015.249623
Bickford, D., Lohman, D. J., Sodhi, N. S., Ng, P. K. L., Meier, R., Winker, K., et al. (2007). Cryptic species as a window on diversity and conservation. Trends Ecol. Evol. 22, 148–155. doi: 10.1016/j.tree.2006.11.004
Boyer, F., Mercier, C., Bonin, A., Le Bras, Y., Taberlet, P., and Coissac, E. (2016). obitools: a unix-inspired software package for DNA metabarcoding. Mol. Ecol. Resour. 16, 176–182. doi: 10.1111/1755-0998.12428
Callahan, B. J., McMurdie, P. J., Rosen, M. J., Han, A. W., Johnson, A. J. A., and Holmes, S. P. (2016). DADA2: high-resolution sample inference from Illumina amplicon data. Nat. Methods 13, 581–583. doi: 10.1038/nmeth.3869
Camacho, C., Coulouris, G., Avagyan, V., Ma, N., Papadopoulos, J., Bealer, K., et al. (2009). BLAST : architecture and applications. BMC Bioinformatics 10:421. doi: 10.1186/1471-2105-10-421
Carvalho, S., Aylagas, E., Villalobos, R., Kattan, Y., Berumen, M., and Pearman, J. K. (2019). Beyond the visual: using metabarcoding to characterize the hidden reef cryptobiome. Proc. Biol. Sci. 286:20182697. doi: 10.1098/rspb.2018.2697
Chan, I. Z. W., Chang, J. J. M., Huang, D., and Todd, P. A. (2019). Colour pattern measurements successfully differentiate two cryptic Onchidiidae rafinesque, 1815 species. Mar. Biodivers. 49, 1743–1750. doi: 10.1007/s12526-019-00940-4
Chang, J. J. M., Tay, Y. C., Ang, H. P., Tun, K. P. P., Chou, L. M., Meier, R., et al. (2018). Molecular and anatomical analyses reveal that Peronia verruculata (Gastropoda: Onchidiidae) is a cryptic species complex. Contrib. Zool. 87, 149–165. doi: 10.1163/18759866-08703002
Costello, M. J., and Wilson, S. P. (2011). Predicting the number of known and unknown species in European seas using rates of description. Glob. Ecol. Biogeogr. 20, 319–330. doi: 10.1111/j.1466-8238.2010.00603.x
Danovaro, R., Carugati, L., Berzano, M., Cahill, A. E., Carvalho, S., Chenuil, A., et al. (2016). Implementing and innovating marine monitoring approaches for assessing marine environmental status. Front. Mar. Sci. 3:213. doi: 10.3389/fmars.2016.00213
David, R., Uyarra, M. C., Carvalho, S., Anlauf, H., Borja, A., Cahill, A. E., et al. (2019). Lessons from photo analyses of autonomous reef monitoring structures as tools to detect (bio-)geographical, spatial, and environmental effects. Mar. Pollut. Bull. 141, 420–429. doi: 10.1016/j.marpolbul.2019.02.066
Edgar, R. C. (2016). UNOISE2: improved error-correction for Illumina 16S and ITS amplicon sequencing. bioRxiv [Preprint]. doi: 10.1101/081257
Folmer, O., Black, M., Hoeh, W., Lutz, R., and Vrijenhoek, R. (1994). DNA primers for amplification of mitochondrial cytochrome c oxidase subunit I from diverse metazoan invertebrates. Mol. Mar. Biol. Biotechnol. 3, 294–299.
Fox, E. J., Reid-Bayliss, K. S., Emond, M. J., and Loeb, L. A. (2014). Accuracy of next generation sequencing platforms. Next Gener. Seq. Appl. 1:1000106. doi: 10.4172/jngsa.1000106
Geller, J., Meyer, C., Parker, M., and Hawk, H. (2013). Redesign of PCR primers for mitochondrial cytochrome c oxidase subunit I for marine invertebrates and application in all-taxa biotic surveys. Mol. Ecol. Resour. 13, 851–861. doi: 10.1111/1755-0998.12138
Glenn, T. C. (2011). Field guide to next-generation DNA sequencers. Mol. Ecol. Resour. 11, 759–769. doi: 10.1111/j.1755-0998.2011.03024.x
Hayes, K. R., Cannon, R., Neil, K., and Inglis, G. (2005). Sensitivity and cost considerations for the detection and eradication of marine pests in ports. Mar. Pollut. Bull. 50, 823–834. doi: 10.1016/j.marpolbul.2005.02.032
Hazeri, G., Rahayu, D. L., Subhan, B., Sembiring, A., Anggoro, A. W., Ghozali, A. T., et al. (2019). Latitudinal species diversity and density of cryptic crustacean (Brachyura and Anomura) in micro-habitat Autonomous Reef Monitoring Structures across Kepulauan Seribu, Indonesia. Biodiversitas 20, 1466–1474. doi: 10.13057/biodiv/d200540
Ho, J. K. I., Puniamoorthy, J., Srivathsan, A., and Meier, R. (2020). MinION sequencing of seafood in Singapore reveals creatively labelled flatfishes, confused roe, pig DNA in squid balls, and phantom crustaceans. Food Control 112:107144. doi: 10.1016/j.foodcont.2020.107144
Huang, D., Cranston, P. S., and Cheng, L. (2014). A complete species phylogeny of the marine midge Pontomyia (Diptera:Chironomidae) reveals a cosmopolitan species and a new synonym. Invertebr. Syst. 28:277. doi: 10.1071/is13059
Hurley, K. K. C., Timmers, M. A., Scott Godwin, L., Copus, J. M., Skillings, D. J., and Toonen, R. J. (2016). An assessment of shallow and mesophotic reef brachyuran crab assemblages on the south shore of O‘ahu, Hawai‘i. Coral Reefs 35, 103–112. doi: 10.1007/s00338-015-1382-z
Ip, Y. C. A., Tay, Y. C., Gan, S. X., Ang, H. P., Tun, K., Chou, L. M., et al. (2019). From marine park to future genomic observatory? Enhancing marine biodiversity assessments using a biocode approach. Biodivers. Data J. 7:e46833. doi: 10.3897/BDJ.7.e46833
Katoh, K., and Standley, D. M. (2013). MAFFT multiple sequence alignment software version 7: improvements in performance and usability. Mol. Biol. Evol. 30, 772–780. doi: 10.1093/molbev/mst010
Kearse, M., Moir, R., Wilson, A., Stones-Havas, S., Cheung, M., Sturrock, S., et al. (2012). Geneious Basic: an integrated and extendable desktop software platform for the organization and analysis of sequence data. Bioinformatics 28, 1647–1649. doi: 10.1093/bioinformatics/bts199
Knowlton, N., Brainard, R. E., Fisher, R., Moews, M., Plaisance, L., and Julian Caley, M. (2010). “Coral reef biodiversity,” in Life in the World’s Oceans: Diversity, Distribution, and Abundance, ed. A. D. McIntyre, (Hoboken, NJ: John Wiley & Sons), 65–78.
Krehenwinkel, H., Pomerantz, A., Henderson, J. B., Kennedy, S. R., Lim, J. Y., Swamy, V., et al. (2019a). Nanopore sequencing of long ribosomal DNA amplicons enables portable and simple biodiversity assessments with high phylogenetic resolution across broad taxonomic scale. Gigascience 8:giz006. doi: 10.1093/gigascience/giz006
Krehenwinkel, H., Pomerantz, A., and Prost, S. (2019b). Genetic biomonitoring and biodiversity assessment using portable sequencing technologies: current uses and future directions. Genes 10:858. doi: 10.3390/genes10110858
Kutty, S. N., Wang, W., Ang, Y. C., Tay, Y. C., Ho, J. K. I., and Meier, R. (2018). Next-Generation identification tools for Nee Soon freshwater swamp forest, Singapore. Gardens’. Bull. Singap. 70, 155–173. doi: 10.26492/gbs70(suppl.1).2018-08
Leray, M., and Knowlton, N. (2015). DNA barcoding and metabarcoding of standardized samples reveal patterns of marine benthic diversity. Proc. Natl. Acad. Sci. U.S.A. 112, 2076–2081. doi: 10.1073/pnas.1424997112
Leray, M., Yang, J. Y., Meyer, C. P., Mills, S. C., Agudelo, N., Ranwez, V., et al. (2013). A new versatile primer set targeting a short fragment of the mitochondrial COI region for metabarcoding metazoan diversity: application for characterizing coral reef fish gut contents. Front. Zool. 10:34. doi: 10.1186/1742-9994-10-34
Leveque, S., Afiq-Rosli, L., Ip, Y. C. A., Jain, S. S., and Huang, D. (2019). Searching for phylogenetic patterns of Symbiodiniaceae community structure among Indo-Pacific Merulinidae corals. PeerJ 7:e7669. doi: 10.7717/peerj.7669
Lobo, J., Costa, P. M., Teixeira, M. A. L., Ferreira, M. S. G., Costa, M. H., and Costa, F. O. (2013). Enhanced primers for amplification of DNA barcodes from a broad range of marine metazoans. BMC Ecol. 13:34. doi: 10.1186/1472-6785-13-34
Loman, N. J., Misra, R. V., Dallman, T. J., Constantinidou, C., Gharbia, S. E., Wain, J., et al. (2012). Performance comparison of benchtop high-throughput sequencing platforms. Nat. Biotechnol. 30, 434–439. doi: 10.1038/nbt.2198
Lu, H., Giordano, F., and Ning, Z. (2016). Oxford Nanopore MinION sequencing and genome assembly. Genomics Proteomics Bioinformatics 14, 265–279. doi: 10.1016/j.gpb.2016.05.004
Maestri, S., Cosentino, E., Paterno, M., Freitag, H., Garces, J. M., Marcolungo, L., et al. (2019). A rapid and accurate MinION-based workflow for tracking species biodiversity in the field. Genes 10:468. doi: 10.3390/genes10060468
Meier, R., Shiyang, K., Vaidya, G., and Ng, P. K. L. (2006). DNA barcoding and taxonomy in Diptera: a tale of high intraspecific variability and low identification success. Syst. Biol. 55, 715–728. doi: 10.1080/10635150600969864
Meier, R., Wong, W., Srivathsan, A., and Foo, M. (2016). $1 DNA barcodes for reconstructing complex phenomes and finding rare species in specimen-rich samples. Cladistics 32, 100–110. doi: 10.1111/cla.12115
Mikheyev, A. S., and Tin, M. M. Y. (2014). A first look at the Oxford Nanopore MinION sequencer. Mol. Ecol. Resour. 14, 1097–1102. doi: 10.1111/1755-0998.12324
Mora, C., Tittensor, D. P., Adl, S., Simpson, A. G. B., and Worm, B. (2011). How many species are there on Earth and in the ocean? PLoS Biol. 9:e1001127. doi: 10.1371/journal.pbio.1001127
Ng, C. S. L., Jain, S. S., Nguyen, N. T. H., Sam, S. Q., Kikuzawa, Y. P., Chou, L. M., et al. (2019). New genus and species record of reef coral Micromussa amakusensis in the southern South China Sea. Mar. Biodivers. Rec. 12:17. doi: 10.1186/s41200-019-0176-3
Oh, R. M., Neo, M. L., Yap, N. W. L., Jain, S. S., Tan, R., Chen, C. A., et al. (2019). Citizen science meets integrated taxonomy to uncover the diversity and distribution of Corallimorpharia in Singapore. Raffles Bull. Zool. 67, 306–321. doi: 10.26107/RBZ-2019-0022
Pearman, J. K., Anlauf, H., Irigoien, X., and Carvalho, S. (2016). Please mind the gap – Visual census and cryptic biodiversity assessment at central Red Sea coral reefs. Mar. Environ. Res. 118, 20–30. doi: 10.1016/j.marenvres.2016.04.011
Pearman, J. K., Aylagas, E., Voolstra, C. R., Anlauf, H., Villalobos, R., and Carvalho, S. (2019). Disentangling the complex microbial community of coral reefs using standardized autonomous reef monitoring structures (ARMS). Mol. Ecol. 28, 3496–3507. doi: 10.1111/mec.15167
Pearman, J. K., Leray, M., Villalobos, R., Machida, R. J., Berumen, M. L., Knowlton, N., et al. (2018). Cross-shelf investigation of coral reef cryptic benthic organisms reveals diversity patterns of the hidden majority. Sci. Rep. 8:8090. doi: 10.1038/s41598-018-26332-5
Pennesi, C., and Danovaro, R. (2017). Assessing marine environmental status through microphytobenthos assemblages colonizing the Autonomous Reef Monitoring Structures (ARMS) and their potential in coastal marine restoration. Mar. Pollut. Bull. 125, 56–65. doi: 10.1016/j.marpolbul.2017.08.001
Plaisance, L., Brainard, R., Julian Caley, M., and Knowlton, N. (2011a). Using DNA barcoding and standardized sampling to compare geographic and habitat differentiation of crustaceans: a Hawaiian islands example. Diversity 3, 581–591. doi: 10.3390/d3040581
Plaisance, L., Caley, M. J., Brainard, R. E., and Knowlton, N. (2011b). The diversity of coral reefs: what are we missing? PLoS One 6:e25026. doi: 10.1371/journal.pone.0025026
Poquita-Du, R., Ng, C. S. L., Loo, J. B., Afiq-Rosli, L., Tay, Y. C., Todd, P., et al. (2017). New evidence shows that Pocillopora “damicornis-like” corals in Singapore are actually Pocillopora acuta (Scleractinia: Pocilloporidae). Biodivers. Data J. 5:e11407. doi: 10.3897/bdj.5.e11407
Poquita-Du, R. C., Quek, Z. B. R., Jain, S. S., Schmidt-Roach, S., Tun, K., Heery, E. C., et al. (2019). Last species standing: loss of Pocilloporidae corals associated with coastal urbanization in a tropical city state. Mar. Biodivers. 49, 1727–1741. doi: 10.1007/s12526-019-00939-x
Quail, M. A., Smith, M., Coupland, P., Otto, T. D., Harris, S. R., Connor, T. R., et al. (2012). A tale of three next generation sequencing platforms: comparison of ion torrent, pacific biosciences and Illumina MiSeq sequencers. BMC Genomics 13:341. doi: 10.1186/1471-2164-13-341
Quek, R. Z. B., Jain, S. S., Neo, M. L., Rouse, G. W., and Huang, D. (2020). Transcriptome-based target-enrichment baits for stony corals (Cnidaria: Anthozoa: Scleractinia). Mol. Ecol. Resour. 20, 807–818. doi: 10.1111/1755-0998.13150
Quek, Z. B. R., Chang, J. J. M., Ip, Y. C. A., and Huang, D. (2019). Complete mitochondrial genome of the sea star Archaster typicus (Asteroidea: Archasteridae). Mitochondrial DNA B 4, 3130–3132. doi: 10.1080/23802359.2019.1666676
Ransome, E., Geller, J. B., Timmers, M., Leray, M., Mahardini, A., Sembiring, A., et al. (2017). The importance of standardization for biodiversity comparisons: a case study using autonomous reef monitoring structures (ARMS) and metabarcoding to measure cryptic diversity on Mo’orea coral reefs, French Polynesia. PLoS One 12:e0175066. doi: 10.1371/journal.pone.0175066
Seah, A., Lim, M. C. W., McAloose, D., Prost, S., and Seimon, T. A. (2020). MinION-based dna barcoding of preserved and non-invasively collected wildlife samples. Genes 11:445. doi: 10.3390/genes11040445
Shokralla, S., Gibson, J. F., Nikbakht, H., Janzen, D. H., Hallwachs, W., and Hajibabaei, M. (2014). Next-generation DNA barcoding: using next-generation sequencing to enhance and accelerate DNA barcode capture from single specimens. Mol. Ecol. Resour. 14, 892–901. doi: 10.1111/1755-0998.12236
Sović, I., Šikić, M., Wilm, A., Fenlon, S. N., Chen, S., and Nagarajan, N. (2016). Fast and sensitive mapping of nanopore sequencing reads with GraphMap. Nat. Commun. 7:11307. doi: 10.1038/ncomms11307
Srivathsan, A., Baloğlu, B., Wang, W., Tan, W. X., Bertrand, D., Ng, A. H. Q., et al. (2018). A MinION-based pipeline for fast and cost-effective DNA barcoding. Mol. Ecol. Resour. 18, 1035–1049. doi: 10.1111/1755-0998.12890
Srivathsan, A., Hartop, E., Puniamoorthy, J., Lee, W. T., Kutty, S. N., Kurina, O., et al. (2019). Rapid, large-scale species discovery in hyperdiverse taxa using 1D MinION sequencing. BMC Biol. 17:96. doi: 10.1186/s12915-019-0706-9
Srivathsan, A., and Meier, R. (2012). On the inappropriate use of Kimura-2-parameter (K2P) divergences in the DNA-barcoding literature. Cladistics 28, 190–194. doi: 10.1111/j.1096-0031.2011.00370.x
Srivathsan, A., Sha, J. C. M., Vogler, A. P., and Meier, R. (2015). Comparing the effectiveness of metagenomics and metabarcoding for diet analysis of a leaf-feeding monkey (Pygathrix nemaeus). Mol. Ecol. Resour. 15, 250–261. doi: 10.1111/1755-0998.12302
Sze, Y., Miranda, L. N., Sin, T. M., and Huang, D. (2018). Characterising planktonic dinoflagellate diversity in Singapore using DNA metabarcoding. Metabarcoding Metagenomics 2:e25136. doi: 10.3897/mbmg.2.25136
Tyler, A. D., Mataseje, L., Urfano, C. J., Schmidt, L., Antonation, K. S., Mulvey, M. R., et al. (2018). Evaluation of Oxford Nanopore’s MinION sequencing device for microbial whole genome sequencing applications. Sci. Rep. 8:10931. doi: 10.1038/s41598-018-29334-5
Vaser, R., Sović, I., Nagarajan, N., and Šikić, M. (2017). Fast and accurate de novo genome assembly from long uncorrected reads. Genome Res. 27, 737–746. doi: 10.1101/gr.214270.116
Wangensteen, O. S., Palacín, C., Guardiola, M., and Turon, X. (2018). DNA metabarcoding of littoral hard-bottom communities: high diversity and database gaps revealed by two molecular markers. PeerJ 6:e4705. doi: 10.7717/peerj.4705
Wick, R. R., Judd, L. M., and Holt, K. E. (2019). Performance of neural network basecalling tools for Oxford Nanopore sequencing. Genome Biol. 20:129. doi: 10.1186/s13059-019-1727-y
Wilson, E. O. (2017). Biodiversity research requires more boots on the ground. Nat. Ecol. Evol. 1, 1590–1591. doi: 10.1038/s41559-017-0360-y
Yeo, D., Srivathsan, A., and Meier, R. (2020). Longer is not always better: optimizing barcode length for large-scale species discovery and identification. Syst. Biol. syaa014. doi: 10.1093/sysbio/syaa014
Yip, Z. T., Quek, R. Z. B., Low, J. K. Y., Wilson, B., Bauman, A. G., Chou, L. M., et al. (2018). Diversity and phylogeny of Sargassum (Fucales, Phaeophyceae) in Singapore. Phytotaxa 369:200. doi: 10.11646/phytotaxa.369.3.3
Keywords: amplicon sequencing, cytochrome c oxidase subunit I (COI), DNA barcoding, metazoa, next-generation sequencing, Oxford Nanopore Technologies, species estimation
Citation: Chang JJM, Ip YCA, Bauman AG and Huang D (2020) MinION-in-ARMS: Nanopore Sequencing to Expedite Barcoding of Specimen-Rich Macrofaunal Samples From Autonomous Reef Monitoring Structures. Front. Mar. Sci. 7:448. doi: 10.3389/fmars.2020.00448
Received: 29 March 2020; Accepted: 20 May 2020;
Published: 24 June 2020.
Edited by:
Sophie von der Heyden, Stellenbosch University, South AfricaReviewed by:
Xavier Turon, Consejo Superior de Investigaciones Científicas (CSIC), SpainJian-Wen Qiu, Hong Kong Baptist University, Hong Kong
Copyright © 2020 Chang, Ip, Bauman and Huang. This is an open-access article distributed under the terms of the Creative Commons Attribution License (CC BY). The use, distribution or reproduction in other forums is permitted, provided the original author(s) and the copyright owner(s) are credited and that the original publication in this journal is cited, in accordance with accepted academic practice. No use, distribution or reproduction is permitted which does not comply with these terms.
*Correspondence: Jia Jin Marc Chang, Y2hhbmdqam1AdS5udXMuZWR1; Danwei Huang, aHVhbmdkYW53ZWlAbnVzLmVkdS5zZw==
†These authors have contributed equally to this work