 Julia Ehrlich1,2*
 Fokje L. Schaafsma3
 Bodil A. Bluhm4
 Ilka Peeken2
 Giulia Castellani2
 Angelika Brandt5,6
 Hauke Flores2
- 1Centre of Natural History (CeNak), University of Hamburg, Hamburg, Germany
- 2Alfred Wegener Institute, Helmholtz Centre for Polar and Marine Research, Bremerhaven, Germany
- 3Wageningen Marine Research, Den Helder, Netherlands
- 4Institute of Arctic and Marine Biology, UiT – The Arctic University of Norway, Tromsø, Norway
- 5Senckenberg Research Institute and Natural History Museum, Frankfurt am Main, Germany
- 6Institute of Ecology, Diversity and Evolution, Goethe University, Frankfurt am Main, Germany
A strong decline and thinning of the Arctic sea-ice cover over the past five decades has been documented. The former multiyear sea-ice system has largely changed to an annual system and with it the dynamics of sea-ice transport across the Arctic Ocean. Less sea ice is reaching the Fram Strait and more ice and ice-transported material is released in the northern Laptev Sea and the central Arctic Ocean. This trend is expected to have a decisive impact on ice associated (“sympagic”) communities. As sympagic fauna plays an important role in transmitting carbon from the ice-water interface to the pelagic and benthic food webs, it is important to monitor its community composition under the changing environmental conditions. We investigated the taxonomic composition, abundance and distribution of sea-ice meiofauna (here heterotrophs >10 μm; eight stations) and under-ice fauna (here metazoans >300 μm; fourteen stations) in Arctic 1.5 year-old pack ice north of Svalbard. Sampling was conducted during spring 2015 by sea-ice coring and trawling with a Surface and Under-Ice Trawl. We identified 42 taxa associated with the sea ice. The total abundance of sea-ice meiofauna ranged between 580 and 17,156 ind.m–2 and was dominated by Ciliophora (46%), Copepoda nauplii (29%), and Harpacticoida (20%). In contrast to earlier studies in this region, we found no Nematoda and few flatworms in our sea-ice samples. Under-ice fauna abundance ranged between 15 and 6,785 ind.m–2 and was dominated by Appendicularia (58%), caused by exceptionally high abundance at one station. Copepoda nauplii (23%), Calanus finmarchicus (9%), and Calanus glacialis (6%) were also very abundant while sympagic Amphipoda were comparatively rare (0.35%). Both sympagic communities showed regional differences in community composition and abundance between shelf and offshore stations, but only for the under-ice fauna those differences were statistically significant. Selected environmental variables moderately explained variations in abundances of both faunas. The results of this study are consistent with predictions of diversity shifts in the new Arctic.
Introduction
Arctic pack ice is drift ice which moves with the agitation of winds and currents. It is either annual and reaches a maximum thickness of ∼2 m, or perennial with a thickness of 3–4 m (Haas, 2003; Kwok and Cunningham, 2015). Because sea-ice extent and thickness have been decreasing rapidly over the past five decades, the Arctic Ocean is gradually changing from a perennial sea-ice system to a system dominated by annual sea ice (Serreze et al., 2007; Comiso, 2012; Melnikov, 2018). This shift combined with associated ecosystem changes has coined the term ‘The New Arctic’ (Jeffries et al., 2013; Carmack et al., 2015; Granskog et al., 2020). More recently, changes in the Transpolar Drift were also characterized. Less sea ice is now reaching the Fram Strait and more ice and ice-transported material is released in the northern Laptev Sea and the central Arctic Ocean (Krumpen et al., 2019).
Sea ice provides a habitat for sympagic communities, which include microalgae and a diversity of heterotrophic protists and metazoans (Gradinger, 1999; David et al., 2015; Bluhm et al., 2018). Sympagic fauna comprises organisms that complete either their entire life cycle within the sea ice (autochthonous fauna) or spend at least part of their life cycle attached to the ice (allochthonous fauna) (Melnikov and Kulikov, 1980; Carey, 1985; Gulliksen and Lønne, 1989). Of these, the small heterotrophic organisms (>10 μm), which live in the brine channels and cavities within the sea-ice matrix, are referred to as sea-ice meiofauna. Some field studies have estimated the abundance and documented the distribution of sea-ice meiofauna in landfast ice (Carey and Montagna, 1982; Friedrich, 1997; Michel et al., 2002), but only few have focused on Arctic pack ice (Gradinger et al., 1992, 2005; Gradinger, 1999). While taxonomic composition of sea-ice meiofauna varies between regions, seasons and ice types, Harpacticoida, Nematoda, Rotifera, Acoela, other flatworms, and various nauplii are frequently occurring taxa (Bluhm et al., 2018). Loss and/or reduction of sea-ice meiofaunal taxa, however, has been reported from sea ice in the central Arctic Beaufort Gyre between the 1970s and 1980s and been related to sea-ice change (Melnikov et al., 2001). The highest sea-ice meiofauna densities are usually found in the bottom layer of the sea ice (Friedrich, 1997; Nozais et al., 2001; Marquardt et al., 2011). This is because the bottom layer has a high probability of colonization from pelagic and benthic fauna and is in free exchange with nutrients from the underlying seawater, which sustain the growth of ice algal food for many of these taxa (Arndt and Swadling, 2006). Ice algae can account for 50% of the primary production in the central Arctic Ocean in summer (Gosselin et al., 1997; Fernández-Méndez et al., 2015) and are a high-quality food source for the Arctic food web (Søreide et al., 2006, 2013; Falk-Petersen et al., 2009; Kohlbach et al., 2016). Sea-ice decline increases the light availability (Nicolaus et al., 2012) and thus the primary production over shelf areas (Arrigo et al., 2008; Ardyna et al., 2014; Arrigo and van Dijken, 2015), whereas primary production in the basins may remain low due to nutrient limitation caused by strong stratification through sea-ice melt (Bluhm and Gradinger, 2008; Tremblay and Gagnon, 2009; Tremblay et al., 2015). By grazing on ice algae, sea-ice meiofauna may represent an important link in the carbon transfer from the sea-ice to pelagic and benthic communities. Gradinger et al. (1999) and Nozais et al. (2001) analyzed the potential role of sea-ice meiofauna in controlling algal production, though they drew contradictory conclusions. Gradinger (1999) found significant positive correlations between ice-algal biomass and meiofauna abundance, indicating a strong trophic link between ice algae and sea-ice meiofauna. In contrast, Nozais et al. (2001) found that the grazing impact of sea-ice meiofauna on ice algae was negligible, suggesting a rather limited contribution of sea-ice meiofauna to the carbon flux in the food web.
Larger taxa such as Amphipoda, Calanoida, and Appendicularia are generally excluded from the narrow-channeled ice matrix but tend to concentrate under the ice (Carey, 1985; Gradinger and Bluhm, 2004; Bluhm et al., 2010). Amphipoda are the most studied organisms of this under-ice fauna (Poltermann et al., 2000; Beuchel and Lønne, 2002; Hop et al., 2011). They can regionally occur in high densities of >100 ind.m–2, though decreasing densities have recently been suspected for the study area (Arctic Council Secretariat, 2016), and decreasing species number from the Beaufort Gyre (Melnikov et al., 2001). In contrast, the ice-association of Calanoida has gained much less attention and only few studies report on their species composition in the ice-water interface layer (Werner and Arbizu, 1999; David et al., 2015). Large copepod species are key drivers of the energy transfer through the Arctic marine ecosystem due to their high-energy lipid compounds and essential fatty acids (Søreide et al., 2010; Darnis et al., 2012; Kohlbach et al., 2016). There are three Calanus species in the Eurasian Arctic Ocean: Calanus finmarchicus, Calanus glacialis, and Calanus hyperboreus. They resemble one another morphologically, but differ in body size, reproductive strategy, life cycle, and distribution. While C. hyperboreus and C. glacialis are of true Arctic origin, C. finmarchicus is a boreal North Atlantic species (Conover, 1988; Auel and Hagen, 2002; Hirche and Kosobokova, 2007). In addition, C. glacialis and C. hyperboreus are dependent on ice algae as a food source at least during parts of their life cycle (Søreide et al., 2010; Kohlbach et al., 2016). In the past, under-ice fauna has mostly been sampled by divers (Arndt and Pavlova, 2005; Hop et al., 2011). This method provides a good small-scale resolution of sea-ice habitats, but does not provide insights into the large-scale spatial variability of the under-ice habitat. The SUIT used in this study overcomes that problem since it enables large-scale horizontal sampling of the 0–2 m surface layer, both under the sea ice and in the open water.
The community structure of sympagic fauna is related to ice age and under-ice topography (Hop et al., 2000; Hop and Pavlova, 2008; Flores et al., 2019). A further decline of sea ice may thus have strong effects on the composition, abundance, and biodiversity of sympagic fauna and, because of their role in the energy transfer to higher trophic levels (Budge et al., 2008), on the entire Arctic marine food web. Therefore, an accurate quantification of sympagic fauna in the Arctic Ocean along with environmental properties is crucial to provide a baseline for monitoring the effects of environmental changes on Arctic marine ecosystems. In this study, we combined two sampling methods to comprehensively cover a wide range of sympagic fauna from the Arctic Ocean pack ice. Sea-ice meiofauna was sampled by drilling ice cores on Arctic pack ice and under-ice fauna was sampled with the SUIT in the region of Atlantic Water inflow north of Svalbard during springtime 2015. Our study aimed to:
1. Provide a concurrent inventory of the community composition, biodiversity and abundance of sea-ice meiofauna and under-ice fauna, and
2. Identify key environmental variables of sea ice and the surface water that define in-ice and under-ice habitats and structure the different communities.
Materials and Methods
Study Area
During the Polarstern expedition TRANSSIZ (‘Transitions in the Arctic Seasonal Sea-Ice Zone,’ PS92) from May 19 to June 28, 2015 the composition, abundance, and distribution of sea-ice meiofauna and under-ice fauna were examined. Samples were collected during eight ice stations and fourteen SUIT stations between 7.068–19.907°E and 81.007–82.211°N. Two of the eight sea-ice stations were located on the marginal shelf of north Svalbard (19 and 32), four in the Sophia Basin and on its slope (27, 31, 39, and 47), and two at the Yermak Plateau (43 and 46). In close proximity to each ice station a SUIT station was conducted. Five of the fourteen SUIT stations were located on the marginal shelf of north Svalbard (19 and 32), eight were located in the Sophia Basin and on its slope (27, 28, 31, 38, 39, 47, 48, and 49), and four on the Yermak Plateau (43, 44, 45, and 56) (Figure 1).
Figure 1. Map of the sampled area north of Svalbard during the Polarstern expedition PS92 including the station numbers of ice and SUIT (Surface and Under-Ice Trawl) stations, the geographical regions, and the Atlantic Water inflow (AWi) originating from the West Spitsbergen Current (according to Renner et al., 2018). The map was created with Ocean Data View software version 5.1.7 (Schlitzer et al., 2018).
This region of the Arctic Ocean is characterized by a pronounced inflow of Atlantic Water along the West Spitsbergen Current and the Fram Strait branch. The latter is assumed to carry most of the oceanic heat into the Arctic Ocean (Rudels, 1987; Beszczynska-Möller et al., 2012; Rudels et al., 2013). Around 80°N the Atlantic Water inflow bifurcates due to topographic steering. Here, one part of the current propagates eastward while another part follows the topography around the Yermak Plateau. North of Svalbard the Atlantic Water is flowing close to the surface and thus contributing strongly to seasonal sea-ice melt and delays in the refreezing of the ice during fall (Rudels et al., 2004, 2013). In the past decades, observations in Fram Strait have revealed a warming of the Atlantic Water inflow into the Arctic Ocean. This warming trend reached its maximum in 2006 and has slightly decreased since then (Hughes et al., 2011; Beszczynska-Möller et al., 2012).
Environmental Parameters of Sea Ice at Ice Stations
At each ice station several ice cores were drilled for determination of environmental properties with a Kovacs corer (Kovacs Enterprise, Roseburg, OR, United States; inner diameter: 9 cm). To determine the chlorophyll a (chl a) concentration, one ice core was taken and the bottom 10 cm were cut into two sections of approximately 5 cm length. Those ice-core sections were then put into polyvinyl chloride (PVC) jars and 200 ml of 0.2 μm filtered seawater were added per 1 cm of ice core. Melting took place in a dark room at 4°C. After melting, the volume of the meltwater was determined and subsamples were filtered through Whatman GF/F filters. The filters were put into liquid nitrogen and kept at −80°C for later analysis. In the laboratories of the Alfred Wegener Institute, pigments including chl a were extracted from the filters with 100% Acetone and homogenized. The chl a concentration was then measured with high performance liquid chromatography (HPLC) as described in Tran et al. (2013) and calculated mean values of chl a concentration were used for further analyses. For ice-temperature measurements, one ice core was put into a PVC halfpipe immediately after coring and the temperature of the bottom 10 cm of the ice core was measured with a temperature probe (Testo 720) in 5 cm intervals. Mean values of those measurements were then calculated. In order to determine bulk salinity, one ice core was taken at each ice station and the bottom 10 cm section was cut off. The segment was put into a PVC jar and melted at 4°C in the dark. The salinity of the melted ice section was then measured with a salinometer (WTW Cond.3110) as described by Peeken (2016). Snow thickness was measured at 5 different points on each coring site by using a meter stick. Mean values were calculated and used for further analyses. Sea-ice thickness was measured using an ice thickness gauge (Kovacs Enterprise, Roseburg, OR, United States), which was lowered through one sea-ice meiofauna hole at each ice station.
Sampling and Processing of Sea-Ice Meiofauna
For sampling of sea-ice meiofauna, two replicate ice cores were drilled at each ice station with a Kovacs corer (Kovacs Enterprise, Roseburg, OR, United States; inner diameter: 9 cm) and the lowermost 10 cm of each ice core were cut off for further examination. The 10 cm ice-core sections were put separately into PVC jars. In the ship’s laboratory 200 ml 0.2 μm filtered seawater were added per 1 cm of ice core to prevent the fauna from osmotic stress during melting (Garrison and Buck, 1986). Melting took place in a dark room at 4°C. After melting, the total volume was determined and the sample was then concentrated over 10 μm gauze and fixed in 4% buffered formaldehyde solution until later quantitative analysis in the laboratories of The Arctic University of Norway (UiT). The replicates of all eight ice stations were sorted under a stereo- microscope (Zeiss Discovery.V20) and identified to the lowest taxonomic level possible. Taxonomic names were verified for correctness and synonymy using the World Register of Marine Species (WoRMS1).
The number of individuals per liter of melted sea ice was determined by dividing the number of individuals in each sample by the volume of the sample (minus the added filtered seawater). From that the number of individuals per m2 (ind.m–2) was then calculated by multiplying by 100, by the height of the ice-core section in meters (0.1 m) and by an ice-to-water density conversion factor of 0.95 (Bluhm et al., 2018). An average was then calculated for the two replicates per station.
Environmental Parameters of Sea Ice and Under-Ice Water at SUIT Stations
An array of sensors was mounted on the SUIT frame in order to collect data on sea-ice and water properties (David et al., 2015; Lange et al., 2016; Castellani et al., in press). It contained an Acoustic Doppler Current Profiler (ADCP, Nortek Aquadopp®, Norway), which measured the velocity and direction of water passing through the net at a frequency of 2 MHZ, and a sampling interval of 1 s, and a CTD (CTD75 M, Sea & Sun Technology, Germany) with built-in fluorometer (Cyclops, Turner Designs, United States), which measured water temperature, salinity and surface water chl a concentration every 0.1 s. An altimeter (PA500/6-E, Tritech, United Kingdom) mounted on the CTD probe measured the distance between the net and the sea-ice underside. In combination with pressure data from the CTD, the distance to the sea-ice underside was used to derive ice thickness profiles over the entire SUIT haul (Lange et al., 2016; Castellani et al., in press). For examination of the ridge density the keels of ridges were detected along each profile by using the Rayleigh criterion (Rabenstein et al., 2010; Castellani et al., 2014). For all of the above mentioned parameters mean values were calculated. An observer on deck estimated the snow thickness visually during trawling. These estimates are presented as approximate ranges if variable and are therefore reported in Table 1, but were not included in further analyses. Some environmental data were not available at SUIT stations 31 and 32 due to failure of sensors.
Table 1. Station table with the general characteristics of the ice stations.
Sampling and Processing of Under-Ice Fauna
Sampling of under-ice fauna was performed with the SUIT (van Franeker et al., 2009), which consisted of a steel frame with a 2 m × 2 m opening and two parallel, 15 m long nets attached. One net was a 0.3 mm mesh plankton net covering 0.5 m of the net opening, the other was a 7 mm half mesh covering 1.5 m of the net opening. As this study focused on mesozooplankton (0.3–20 mm), the net used to calculate the abundances of the under-ice fauna was the 0.3 mm zooplankton net. van Franeker et al. (2009), Flores et al. (2012), and David et al. (2015) provided a more detailed description of the SUIT. The catch was concentrated over a 100 μm sieve and a defined fraction (mostly one half of the original sample) was put in 4% buffered formaldehyde solution for preservation and later quantitative analysis. If the density was still high, the sample was split again with a plankton splitter prior to analysis. The samples of fourteen SUIT stations were sorted and identified to the lowest taxonomic level possible under a stereo- microscope coupled to a digital image analysis system (Leica Model M 205C, image analysis software LAR 4.2 or a Leica Discovery V8 with Axiocam) in the laboratories of the Alfred Wegener Institute. Taxonomic names were verified using the current classification of WoRMS1. Classification of Calanus spp. individuals to species level (C. hyperboreus, C. glacialis, and C. finmarchicus) was based on length measurements and stage determination according to Madsen et al. (2001). Abundances of ind.m–2 were calculated by multiplying the total number of individuals of each taxon in the sample by the respective splitting factor and dividing the result by the water volume sampled by the SUIT at the respective station (measured by the ADCP). The result was then multiplied by the height of the net (2 m) (David et al., 2015).
Data Analysis
A correlation based PCA (Mardia et al., 1979) with Euclidean distance measure was applied to both environmental datasets to reveal habitat typologies of the sea ice and the upper water column (Clarke and Warwick, 2001). Spearman’s rank correlation coefficients were used to identify environmental variables with high collinearity (Clarke and Warwick, 2001; Zuur et al., 2007) in order to decide which variables to include in the respective PCA. If pairs of environmental variables had a Spearman’s rank correlation coefficient >0.8, only one of the correlated variables was chosen for further analysis based on the relevance of this variable for the scientific question and the comparability to other studies (Zar, 1984). For the ice stations, six environmental variables were analyzed and four were retained for further statistical analysis (Supplementary Table S1). For the SUIT stations, seven environmental variables were analyzed and four were retained for further statistical analysis (Supplementary Table S2). The PCA was then applied to each normalized environmental dataset.
Three diversity indices were separately calculated for sea-ice meiofauna and under-ice fauna in order to investigate patterns of diversity over the sampled area: (1) Taxa richness (S) (the number of taxa observed per station), (2) Shannon diversity (H), and (3) Pielou’s evenness (J′) (Shannon and Weaver, 1963; Pielou, 1969). We note that these and subsequent analyses were done separately for sea-ice meiofauna and under-ice fauna communities, because gear types and mesh sizes are not directly comparable.
To visualize community similarity patterns of the sea-ice meiofauna and the under-ice fauna, NMDS (Shepard, 1962; Kruskal, 1964) based on a Bray–Curtis similarity matrix (Bray and Curtis, 1957) was applied to each data set. The four environmental variables selected for the PCA were fitted into the NMDS ordination. The generation of an NMDS is an iterative procedure. It compiles a plot by successively refining the positions of the points until they fit as closely as possible to the dissimilarity relations between the samples (Clarke and Warwick, 2001). Thus, short distances of sampling sites in the NMDS plot indicate a high similarity in community structure, whereas sampling sites with low similarity are further apart in the ordination plot. The goodness-of-fit of NMDS plots was assessed by Shepard plots and stress values (Clarke and Warwick, 2001; Legendre and Legendre, 2012). A stress value of <0.05 was considered a very good representation with no prospect of misinterpretation (Clarke and Warwick, 2001). We applied the NMDS analysis with different transformations (none to 4th root) of the abundance datasets. The lowest stress values for both sea-ice meiofauna and under-ice fauna datasets were achieved by untransformed abundance data. Based on these untransformed abundance data an analysis of similarity (ANOSIM; Clarke and Ainsworth, 1993) was conducted to test for significant differences of community similarity between a priori defined geographical regions (shelf, Yermak Plateau and Sophia Basin with adjacent slope). Again, this analysis was separately performed for sea-ice meiofauna and under-ice fauna. Geographical regions were defined by a combination of water depth and geomorphological structures. Statistical analyses were conducted with the R software Version 3.5.12 (R Core Team, 2018) by using the packages: vegan (Oksanen et al., 2018), ggplot2 (Wickham, 2016), dplyr (Wickham and Ruiz, 2018), and scales (Wickham, 2018).
Results
Environmental Conditions at Ice Stations
The ice thickness of the sea-ice cores was very similar among stations and ranged between 1.07 m (station 19) and 1.25 m (station 39) with an average thickness of 1.16 m, reflecting first-year sea ice (Table 1). Snow thickness was highest at station 19 with 0.9 m while it ranged for the other stations between 0.13 and 0.4 m, with station 43 having the lowest snow thickness. On average, the stations had a snow thickness of 0.33 m across the sampled area (Table 1). The temperature of the sea-ice cores varied between −2.2°C (station 19) and −1.2°C (station 47) with an average temperature of −1.7°C (Table 1). Bulk salinity of the bottom 10 cm sea-ice sections stood out at station 47 with a PSU of 1.65. All the other stations ranged in their PSU between 3.88 (station 27) and 5.88 (station 39), with a mean salinity of 4.47 (Table 1). Sea-ice chl a concentration of the bottom 10 cm of the ice core varied from 199 μgm–2 (station 43) to 790 μgm–2 (station 32) with an average of 420 μgm–2 (Table 1).
In the PCA of environmental variables, 67% of variance could be explained by the first two components (Figure 2). The first axis (PC1) explained 46% of the variance and was mainly driven by snow thickness. Along this axis there was a distinction between the two shelf stations 19 and 32, with station 19 being strongly influenced by snow thickness (Figure 2). The second axis (PC2) explained 22% of the variance and was mainly associated with bulk salinity. Along this axis there was a noticeable, albeit not very strong, regional distinction between the shelf, the Sophia Basin with adjacent slope, and the Yermak Plateau stations (Figure 2).
Figure 2. Principal Component Analysis (PCA) plot of environmental parameters at the ice stations. Stations were color-coded according to geographical regions (shelf, Sophia Basin, and Yermak Plateau). Black arrows point into the direction of increasing values of environmental parameters in the ordination. Percentage values in axis annotations indicate the proportion of explained variance of the PCA.
Sea-Ice Meiofauna Biodiversity, Taxonomic Composition and Abundance
In total 10 sea-ice meiofauna taxa belonging to five phyla were identified in this study (Tables 2, 3 and Figure 3). Taxa richness (S) ranged from 2 to 8 and Shannon diversity index (H′) ranged from 0.60 to 1.53 across ice stations (Table 2). The lowest S and H’ were observed at stations in the Sophia Basin and on the Yermak Plateau (stations 39 to 47) (Table 2). The ice cores of these stations contained either only Harpacticoida and copepod nauplii (stations 39, 47) or these two taxa and Ciliophora (stations 43, 46) (Figure 4). Higher S and H’ were observed at the stations on the Sophia Basin slope and the shelf of Svalbard with station 27 being the station with the highest S (8) and H′ (1.53) (Table 2). Except for Amoebozoa, all phyla were present in the ice cores of this station (Figure 4). Pielou’s evenness (J′) ranged from 0.54 to 0.90 and did not strictly follow the pattern of S and H′, though values were mostly higher further offshore where stations had low taxa richness and were dominated by Harpacticoida and copepod nauplii (Table 2 and Figure 4). The lowest value of J′ was reached at stations closer to the shelf, which were dominated by Ciliophora (Table 2 and Figure 4).
Table 2. List of total abundances and biodiversity indices for sea-ice meiofauna per station.
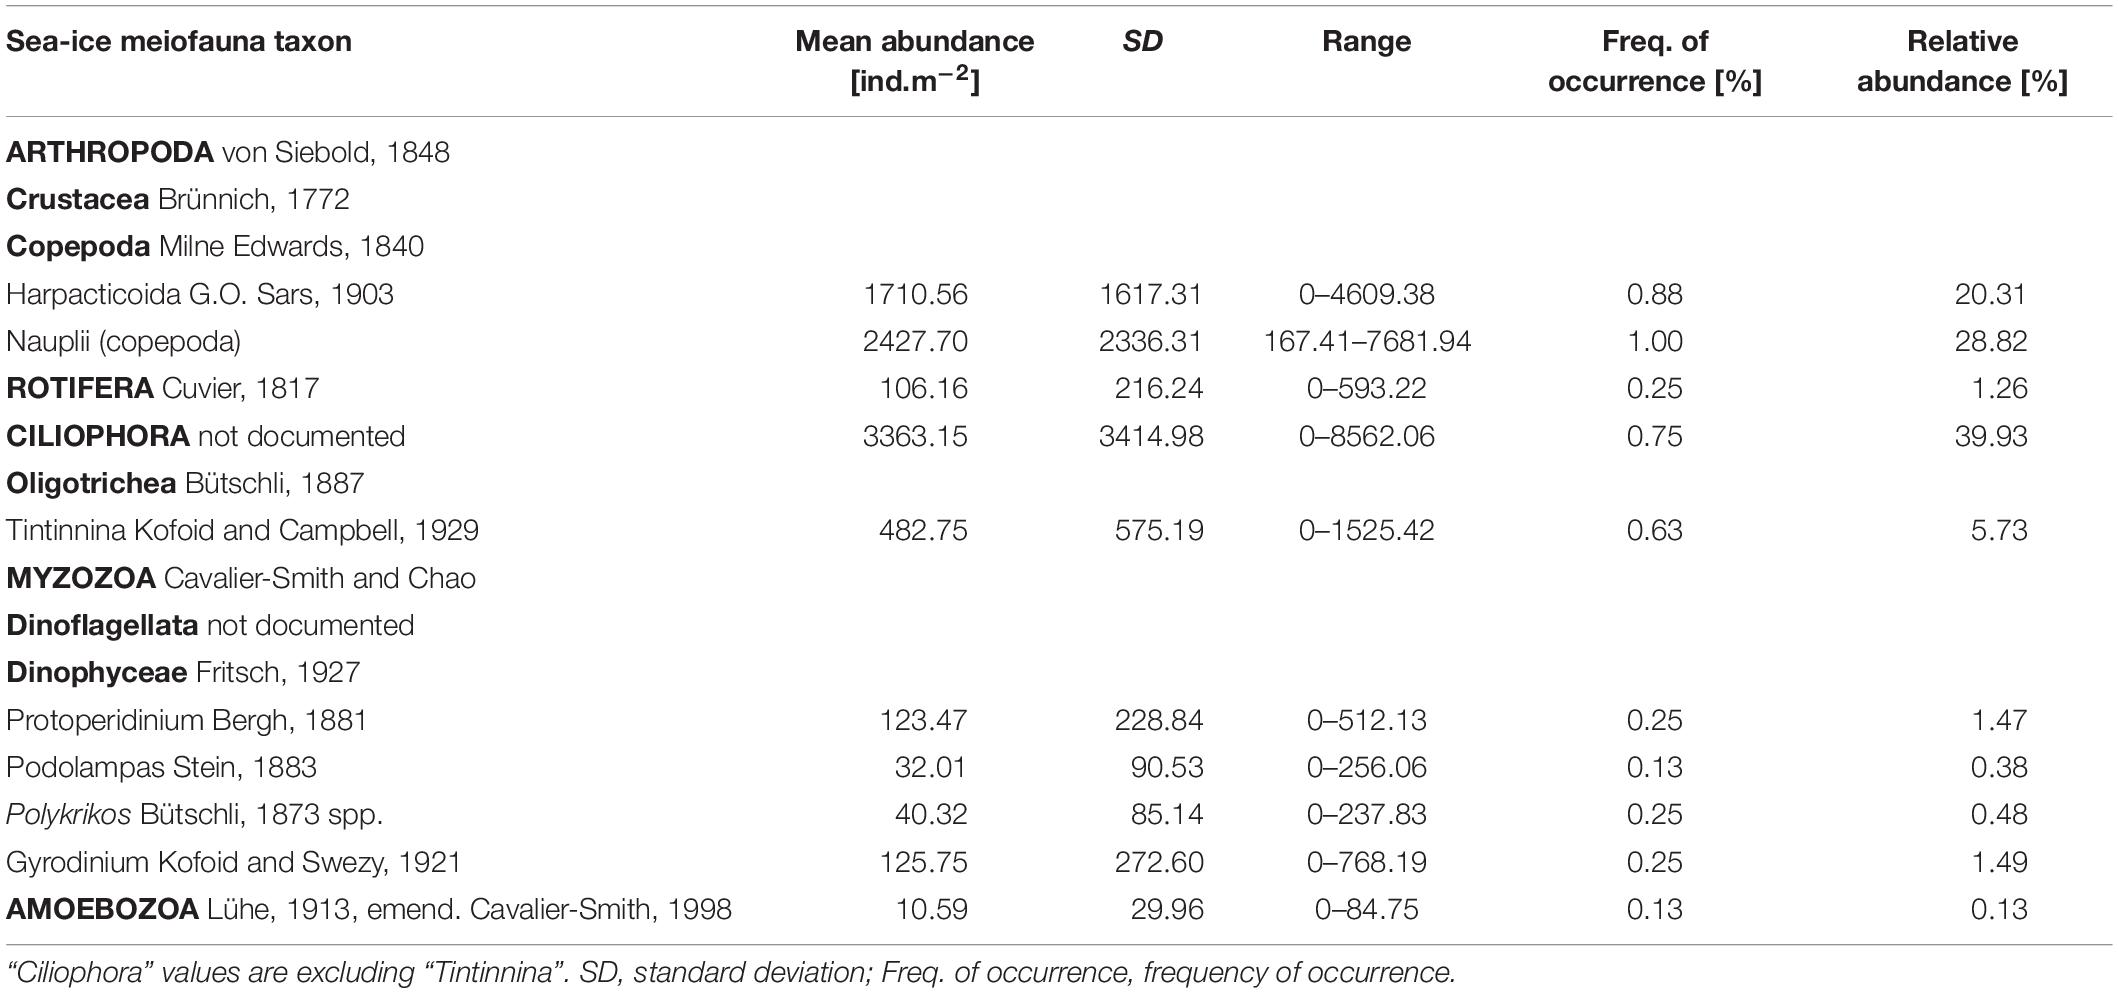
Table 3. List of sea-ice meiofauna taxa with mean abundance and frequency of occurrence across the sample area.
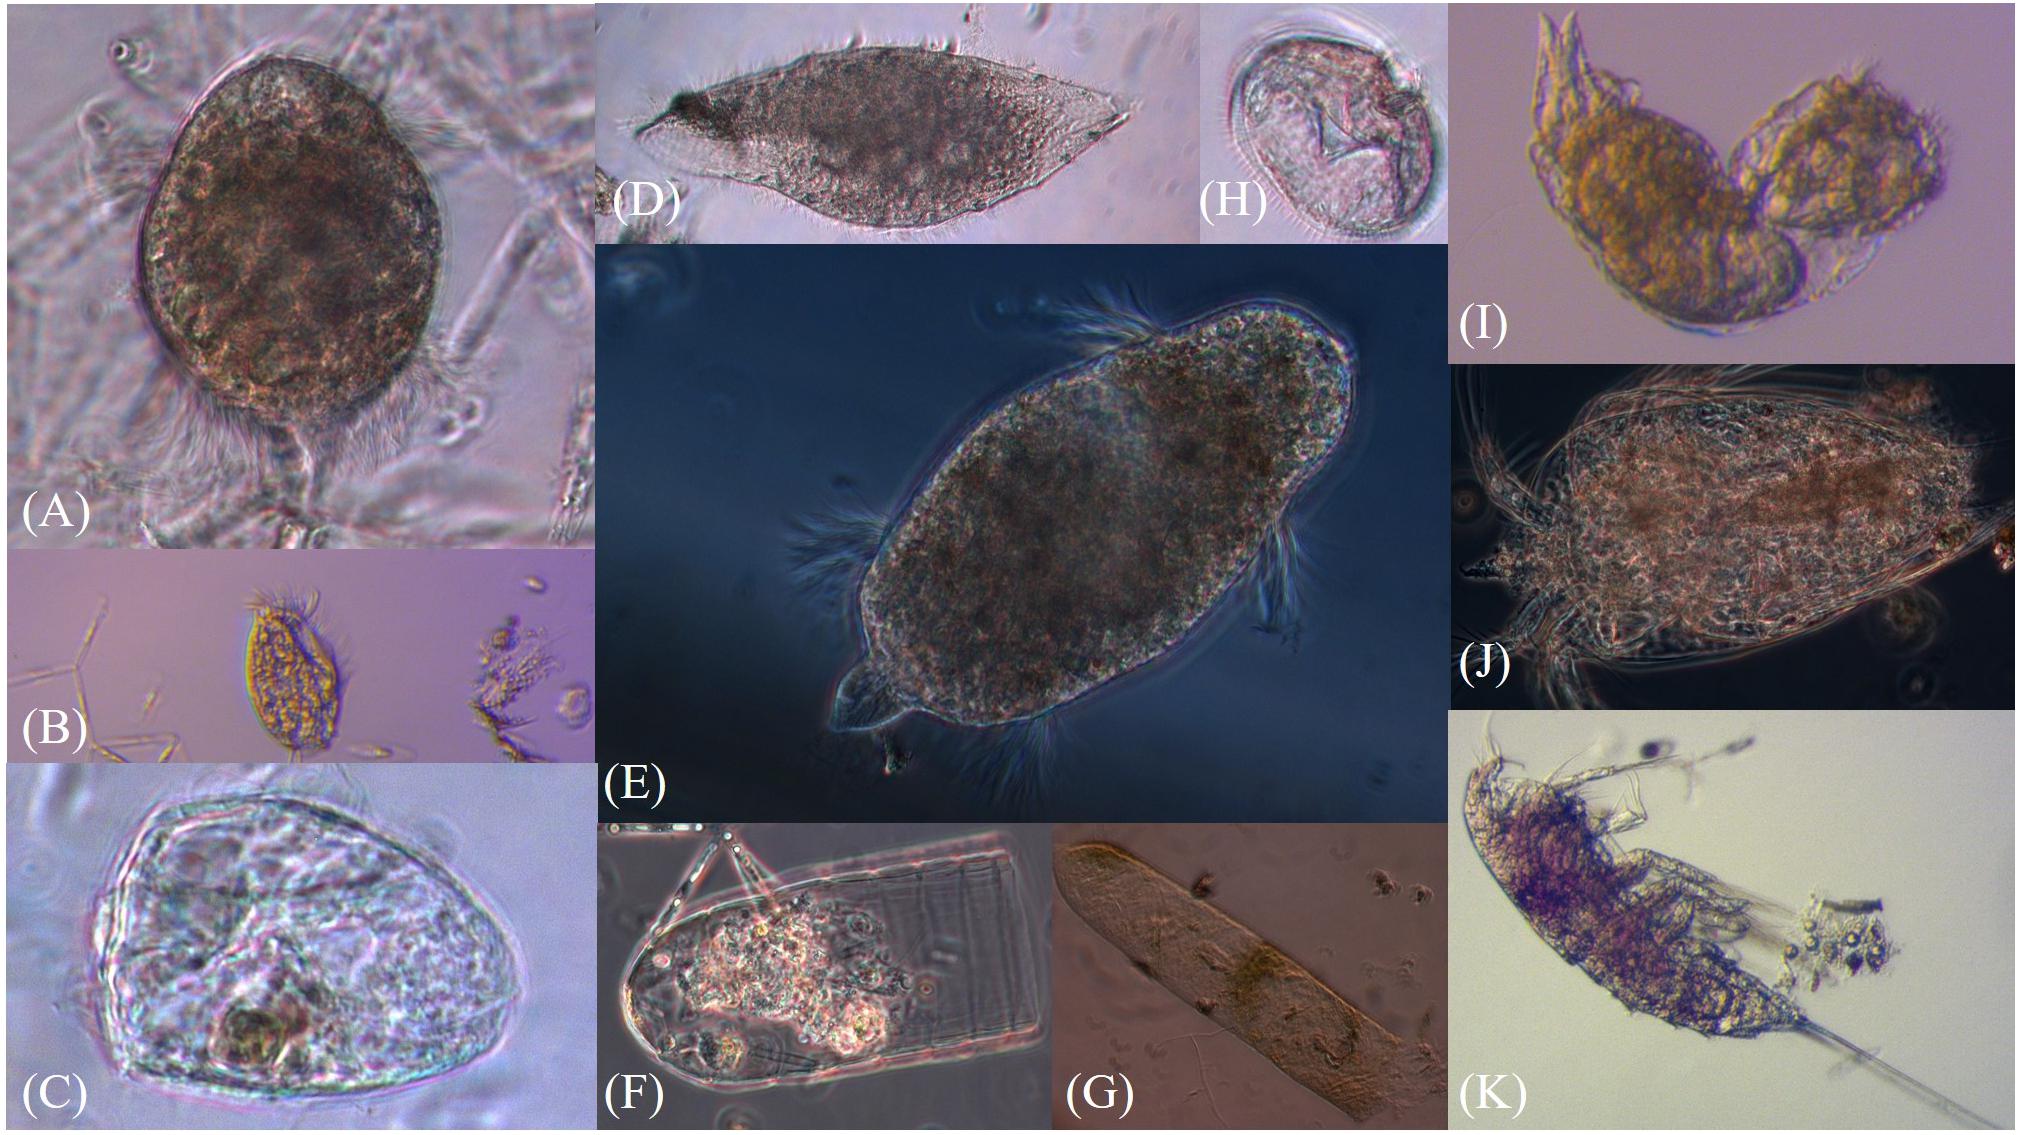
Figure 3. Pictures of sea-ice meiofauna (A–E) Ciliophora, (F,G) Tintinnina, (H) Protoperidinium sp., (I) Rotifera, (J) Nauplius, (K) Harpacticoida. Photographs by Julia Ehrlich.
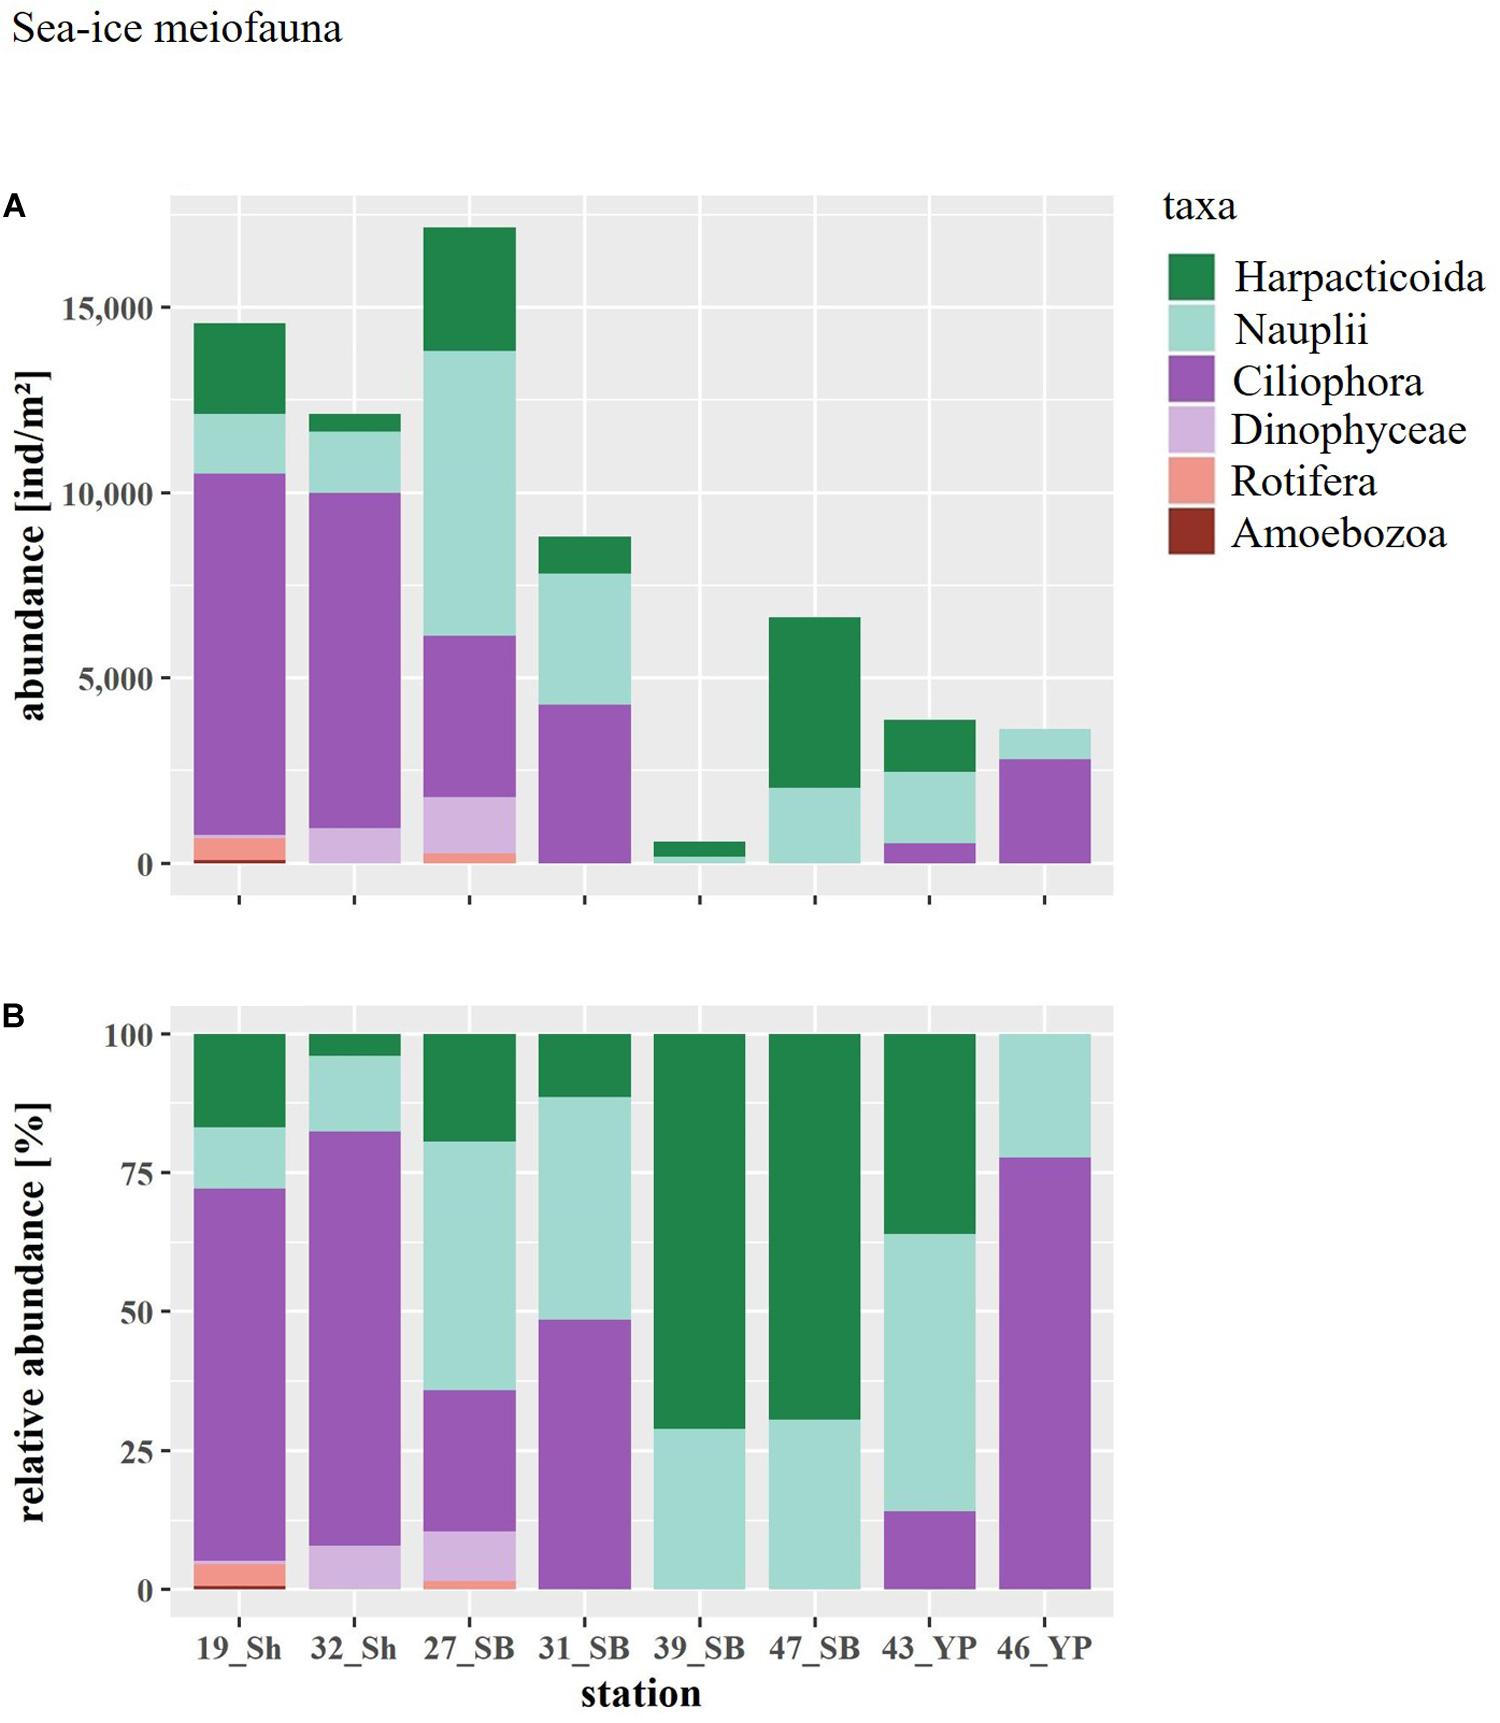
Figure 4. (A) Abundance and (B) relative abundance of the sea-ice meiofauna at ice stations arranged by geographical region (Sh, shelf; SB, Sophia Basin; YP, Yermak Plateau).
Total abundances of sea-ice meiofauna ranged from 580 ind.m–2 (station 39) to 17,156 ind.m–2 (station 27) (Table 2 and Figure 4). The most abundant taxon across all stations was Ciliophora with a maximum abundance of 8,562 ind.m–2 and an average contribution of 46% to the total sea-ice meiofauna abundance (Table 3). Second most abundant were copepod nauplii with a maximum abundance of 7,682 ind.m–2 and a share of 29%, and Harpacticoida with a maximum abundance of 4,609 ind.m–2 and a share of 20% to the total sea-ice meiofauna abundance (Table 3). The community structure showed some geographical or seasonal/temporal variability, since Rotifera, Dinophyceae, and Amoebozoa occurred solely at the four easternmost stations (stations 19–32) on the shelf of Svalbard and the slope of the Sophia Basin sampled early during the expedition (Figure 4). Those stations showed also a higher abundance of Ciliophora compared to the offshore stations (stations 39–47). The NMDS ordination of the sampling stations along ordination axis 1 largely resembled gradual changes in community structure along a quasi-bathymetric gradient from the shelf to the Sophia Basin with adjacent slope and the Yermak Plateau stations (Figure 5). However, the conducted ANOSIM showed no significant difference in community similarity between the three regions shelf, Sophia Basin with slope and Yermak Plateau (α > 0.05, R = −0.075, p = 0.41).
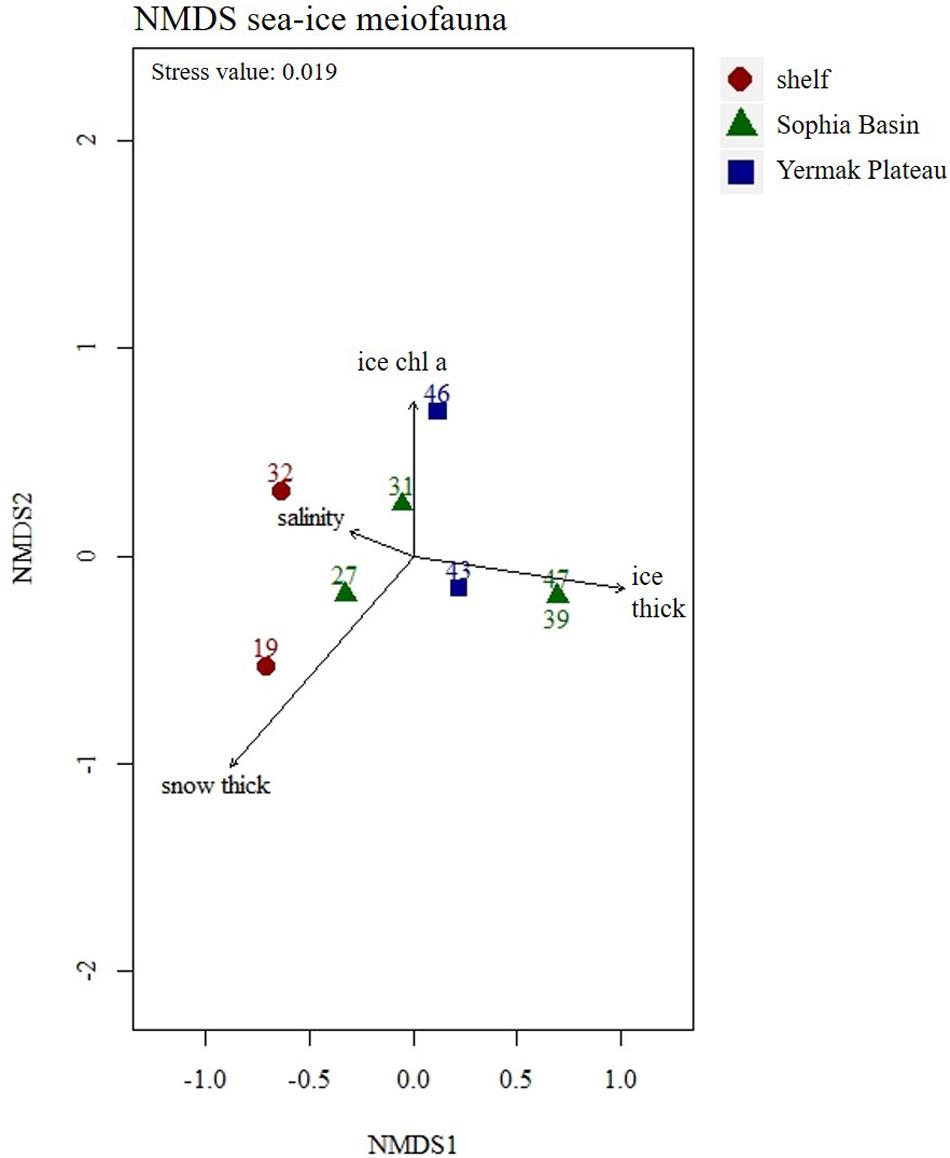
Figure 5. Non-metric Multidimensional Scaling (NMDS) plot of sea-ice meiofauna abundances with four fitted environmental variables. Stations were color coded according to geographical regions (shelf, Sophia Basin, and Yermak Plateau). Ice thick, ice thickness; ice chl a, ice chlorophyll a; snow thick, snow thickness.
Environmental Conditions at SUIT Stations
The bottom depth of the SUIT stations varied considerably during this study from 188 m on the shelf (station 19) to 2,249 m in the Sophia Basin (station 38) (Table 4). The average ice coverage in the areas of the under-ice hauls was 51% (Table 4). Ice thickness ranged between 1.05 m (station 19) and 3.84 m (station 44), with a mean of 1.70 m across the sampled stations (Table 4). The density of sea-ice ridges was highest at station 39 with 11.4 ridges km–1 and lowest at station 19 with 1.4 ridges km–1. The average ridge density was 4.9 ridges km–1 (Table 4). The temperature of the 0–2 m surface water varied between 1.3 and 1.8°C with an average of 1.6°C. Stations on the Svalbard shelf and slope of the Sophia Basin (stations 19, 27, and 28) had lower temperatures (1.3–1.4°C) than stations in the Sophia Basin and on the Yermak Plateau (39–56: 1.6–1.8°C) (Table 4). Salinity of the sampled SUIT stations ranged from 33.4 PSU (station 47) to 34.3 PSU (station 45) with a mean salinity of 33.8 PSU (Table 4). Chlorophyll a concentrations of the surface water varied widely between 540 μgm–2 at station 43 and 21,158 μgm–2 at station 47 with an average of 6,967 μgm–2 (Table 4).
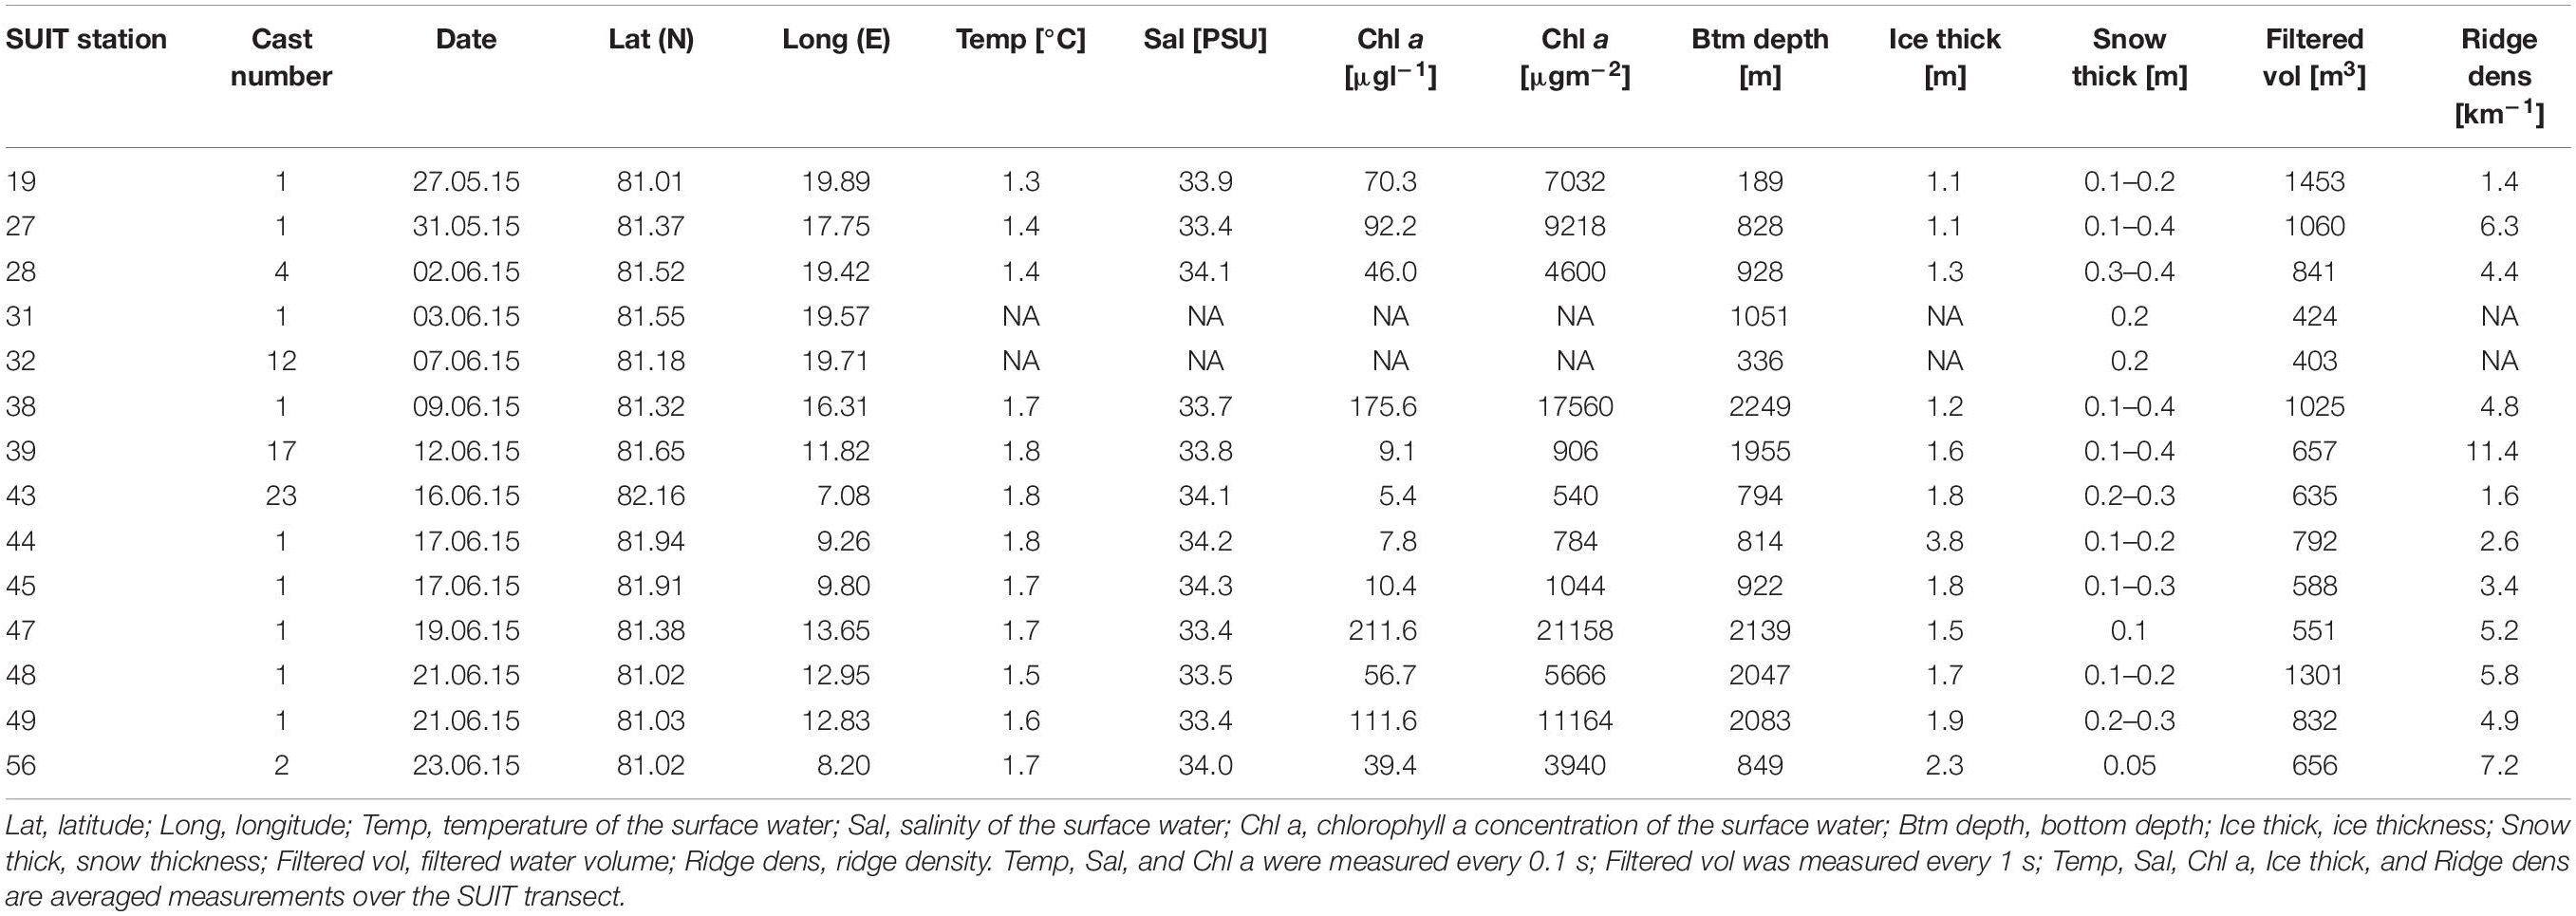
Table 4. Station table with the general characteristics of the SUIT stations.
The first two components (PC1 and PC2) of the PCA explained 75% of the variance and showed a regional pattern (Figure 6). Stations located in the Sophia Basin and adjacent slope grouped together as did those over the Yermak Plateau (Figure 6). PC1 explained 50% of the variance and was mainly driven by bottom depth. Along this ordination axis there was a regional distinction between the shelf, the Sophia Basin with adjacent slope, and the Yermak Plateau stations (Figure 6). PC2 explained 25% of the variance and was mainly associated with ice thickness. Along this axis there was a clear separation of station 44 from all the other stations, which had an appreciably higher ice thickness than the other stations (Figure 6).
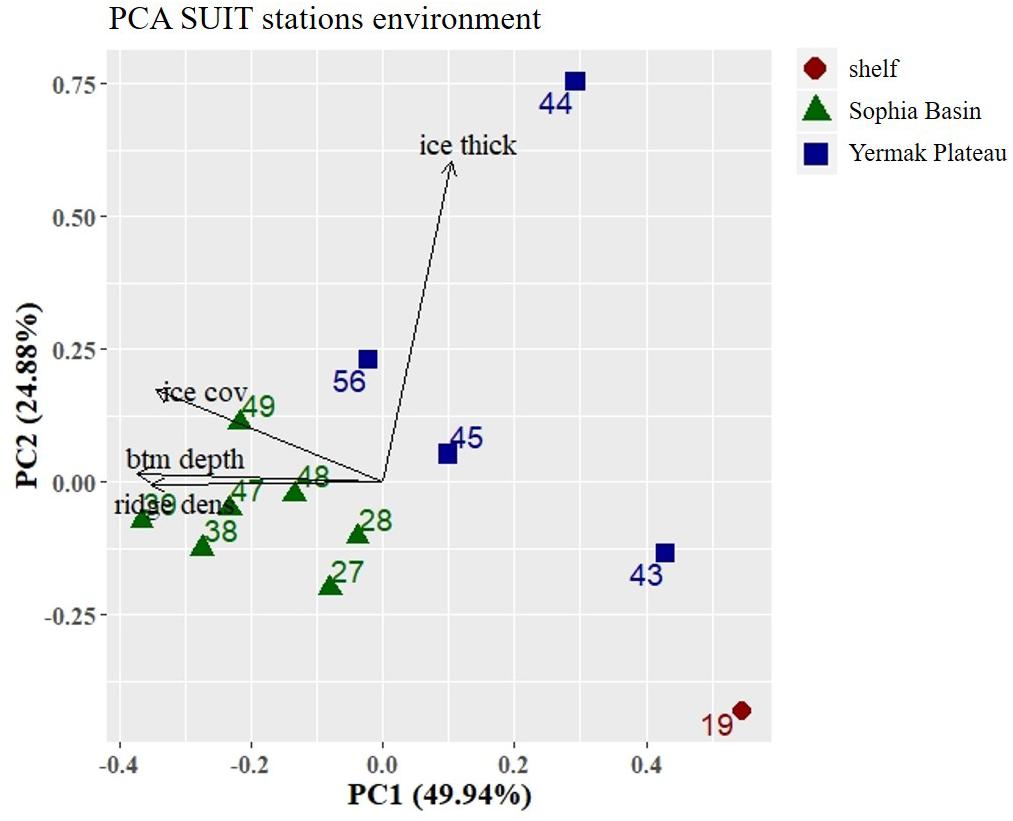
Figure 6. Principal Component Analysis (PCA) plot of environmental parameters at the SUIT stations. Stations were color coded according to geographical regions (shelf, Sophia Basin, and Yermak Plateau). Black arrows point into the direction of increasing values of environmental parameters in the ordination. Percentage values in axis annotations indicate the proportion of explained variance of the PCA. Ice thick, ice thickness; ice cov, ice coverage; btm depth, bottom depth; ridge dens, ridge density.
Under-Ice Fauna Biodiversity, Taxonomic Composition and Abundance
In total we identified 32 taxa of under-ice fauna from 8 phyla in this study (Tables 5, 6 and Figure 7). Species richness (S) ranged between 7 and 21 with no clear pattern among stations. For example, the lowest and the highest S were reached at stations 48 (7 taxa) and 49 (21 taxa), which were geographically closest to each other. Both stations were located in the southern part of the Sophia Basin and dominated by C. finmarchicus and C. glacialis (Figure 8). H′ and J′ ranged from 0.58 to 1.73 and from 0.21 to 0.80, respectively, again with no clear geographic pattern (Table 5). The highest H′ and J′ were reached at stations 27 and 31 on the slope of the Sophia Basin. Both stations were dominated by equally abundant C. finmarchicus, C. glacialis, C. hyperboreus, and nauplii. The lowest H′ and J′ were estimated for the shelf stations 19 and 32, which were dominated by copepod nauplii (Table 5 and Figure 8).
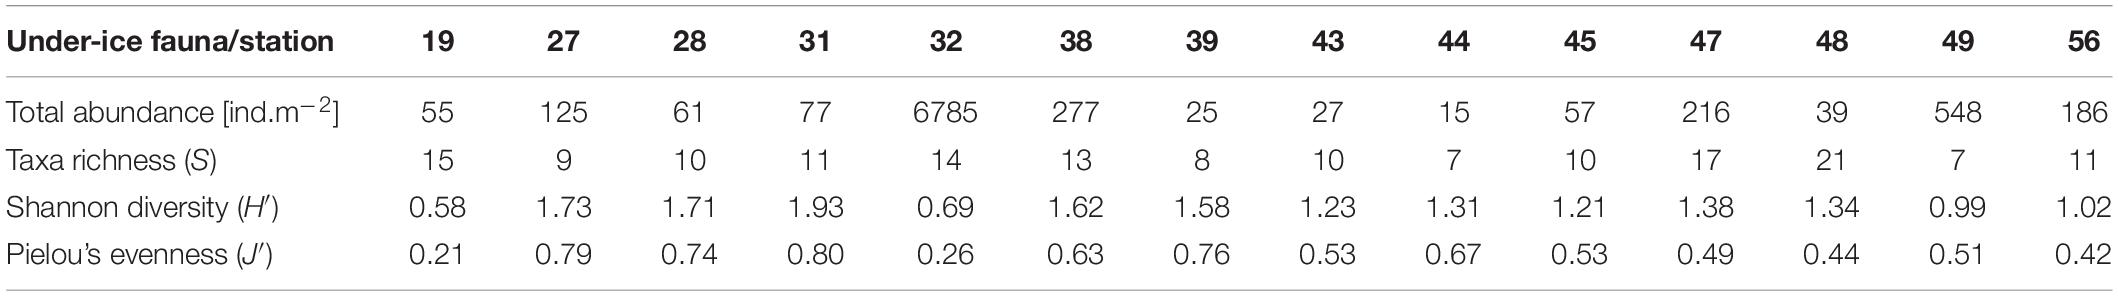
Table 5. List of total abundances and biodiversity indices for under-ice fauna per station.
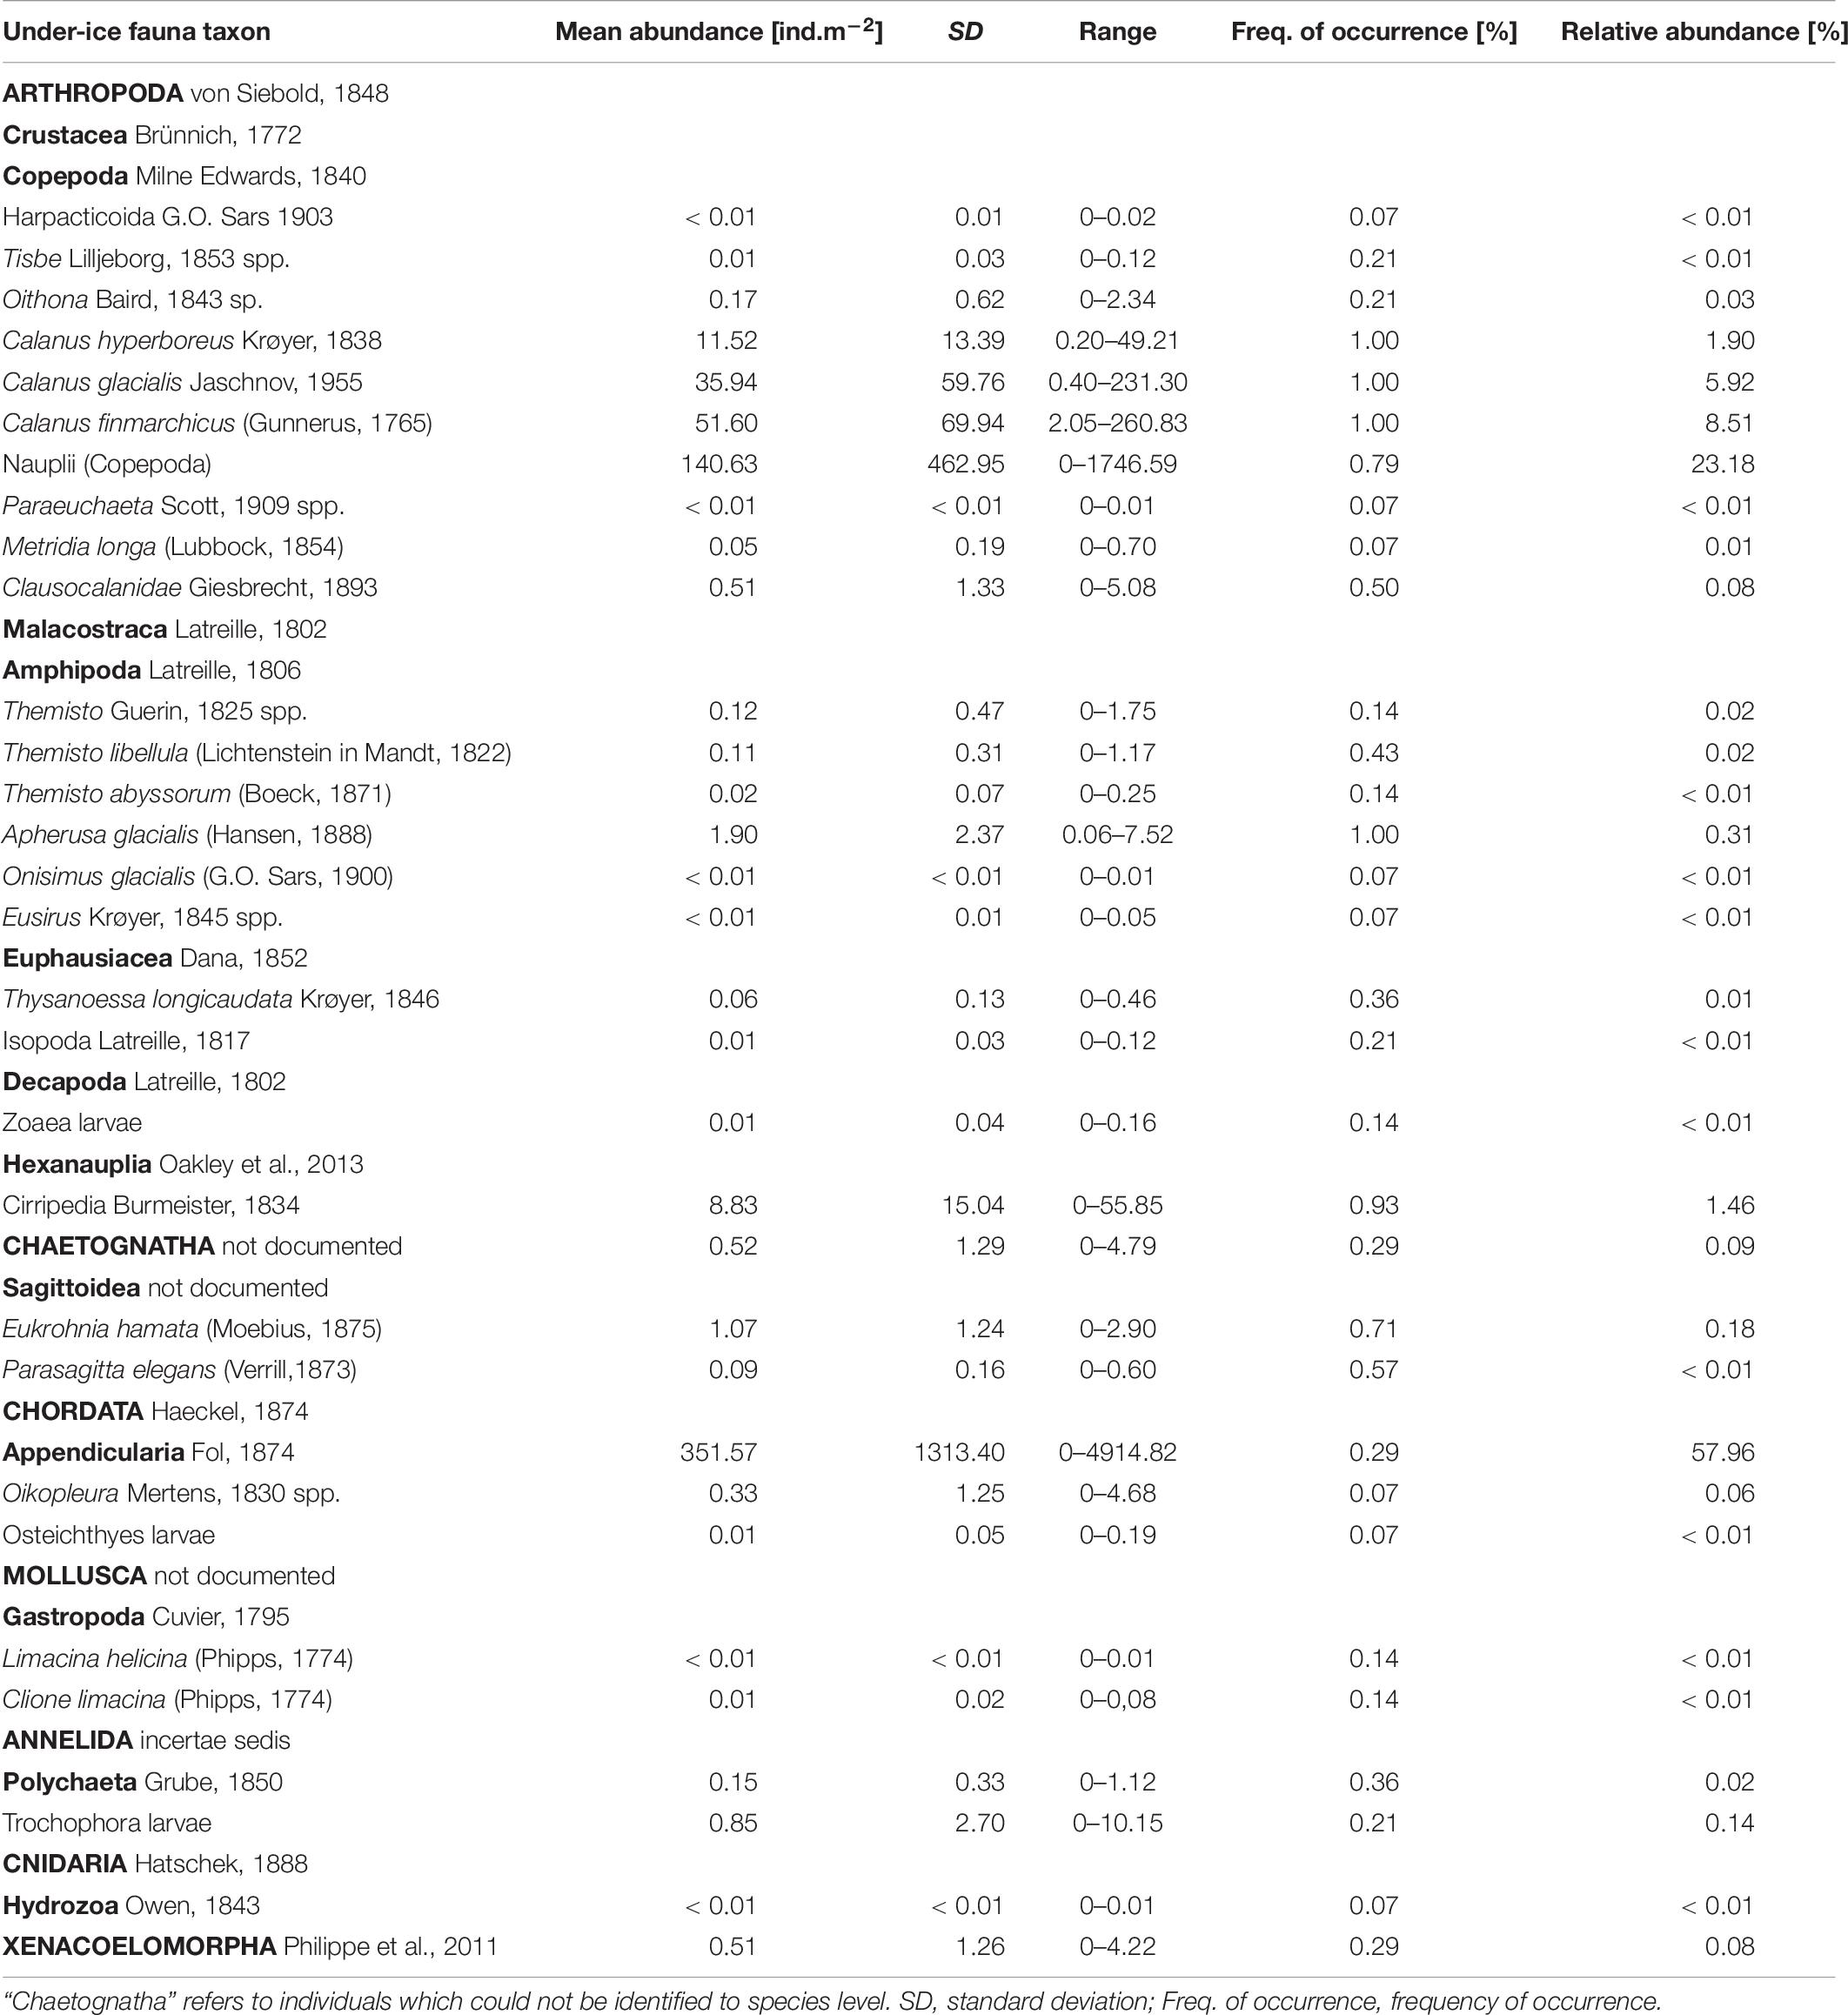
Table 6. List of under-ice fauna with mean abundance and frequency of occurrence across the sample area.
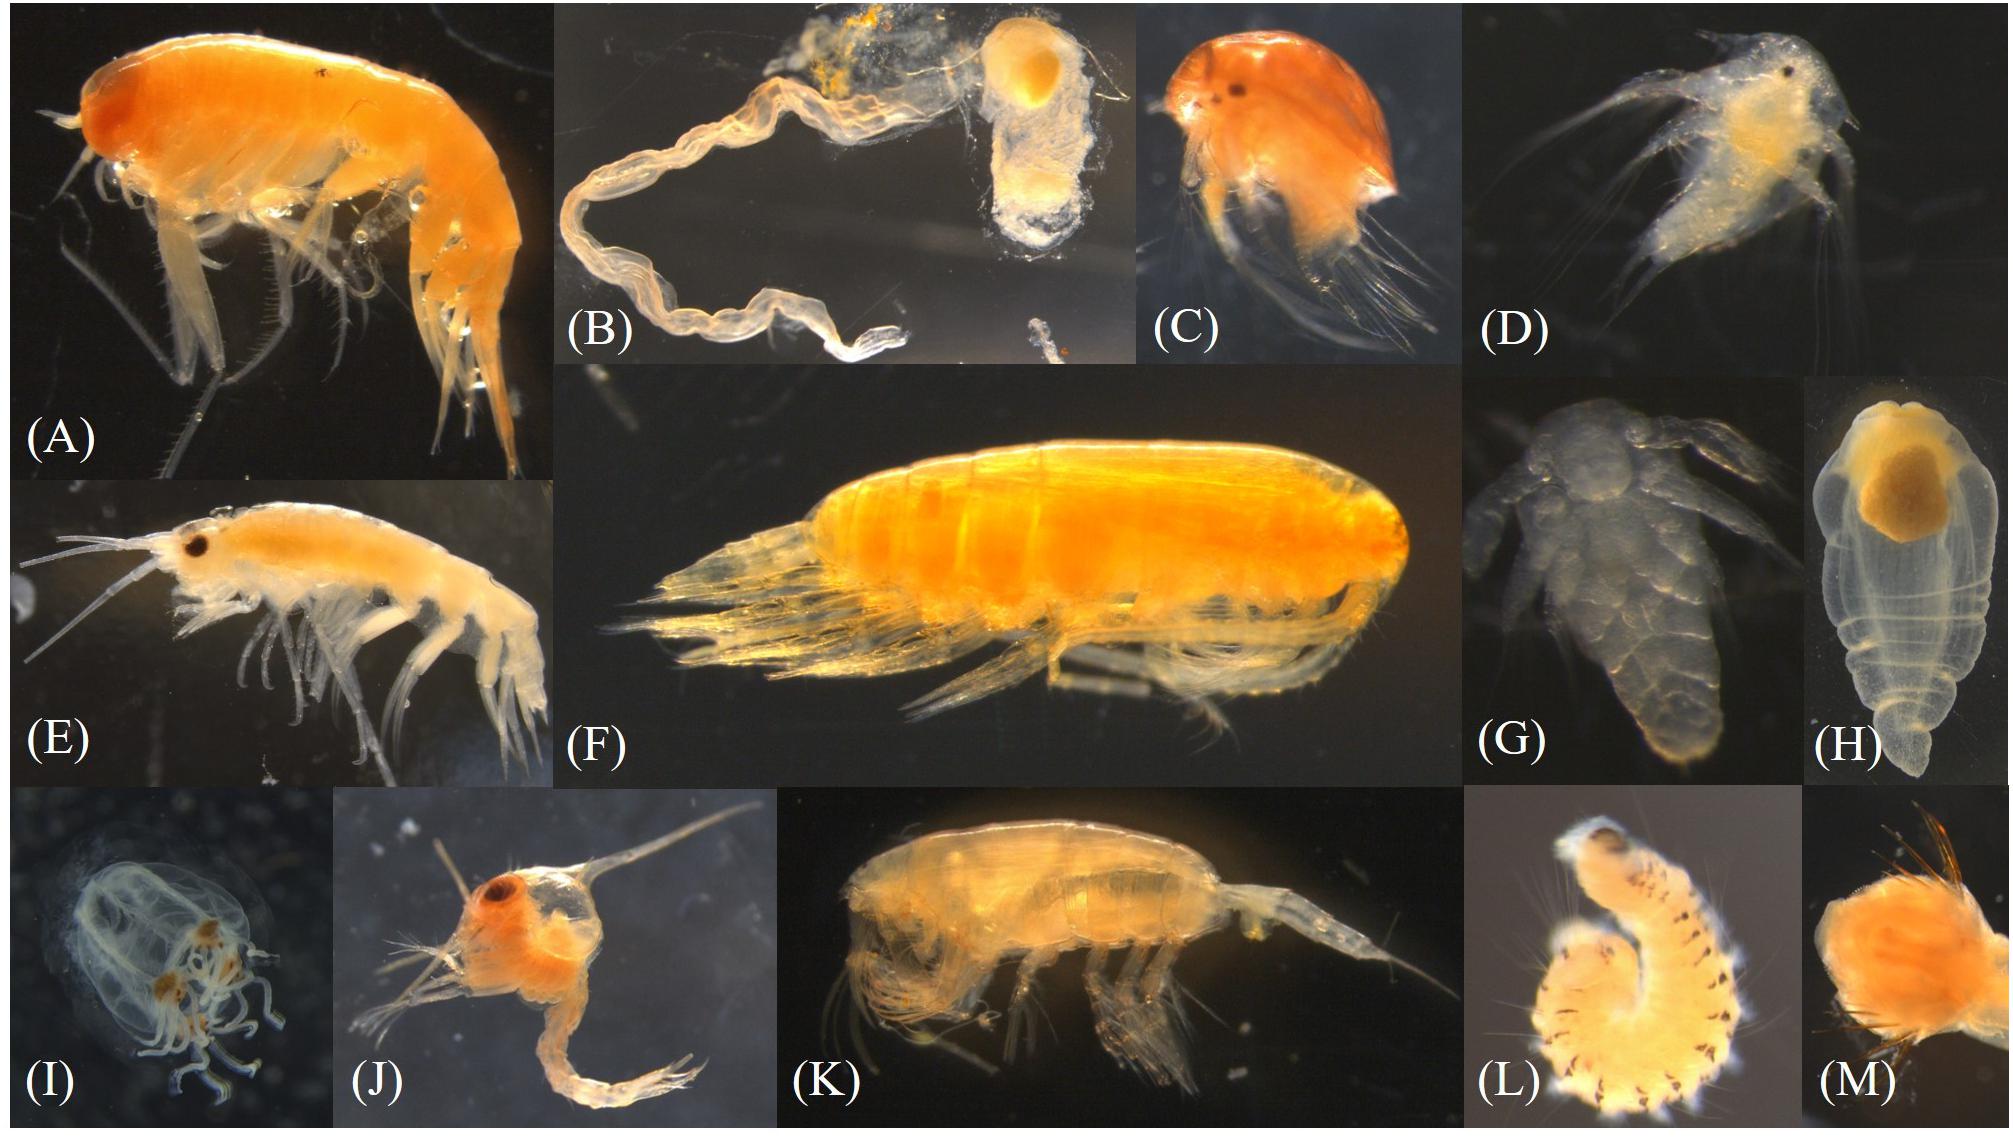
Figure 7. Pictures of under-ice fauna (A) Themisto sp., (B) Appendicularia, (C,D) Cirripedia, (E) Apherusa glacialis, (F) Calanus sp., (G) Nauplius, (H) Clione limacina, (I) Hydrozoa, (J) Zoaea larvae, (K) Paraeuchaeta sp., (L) Polychaeta, (M) Chaetognatha (head). Photographs by Julia Ehrlich.
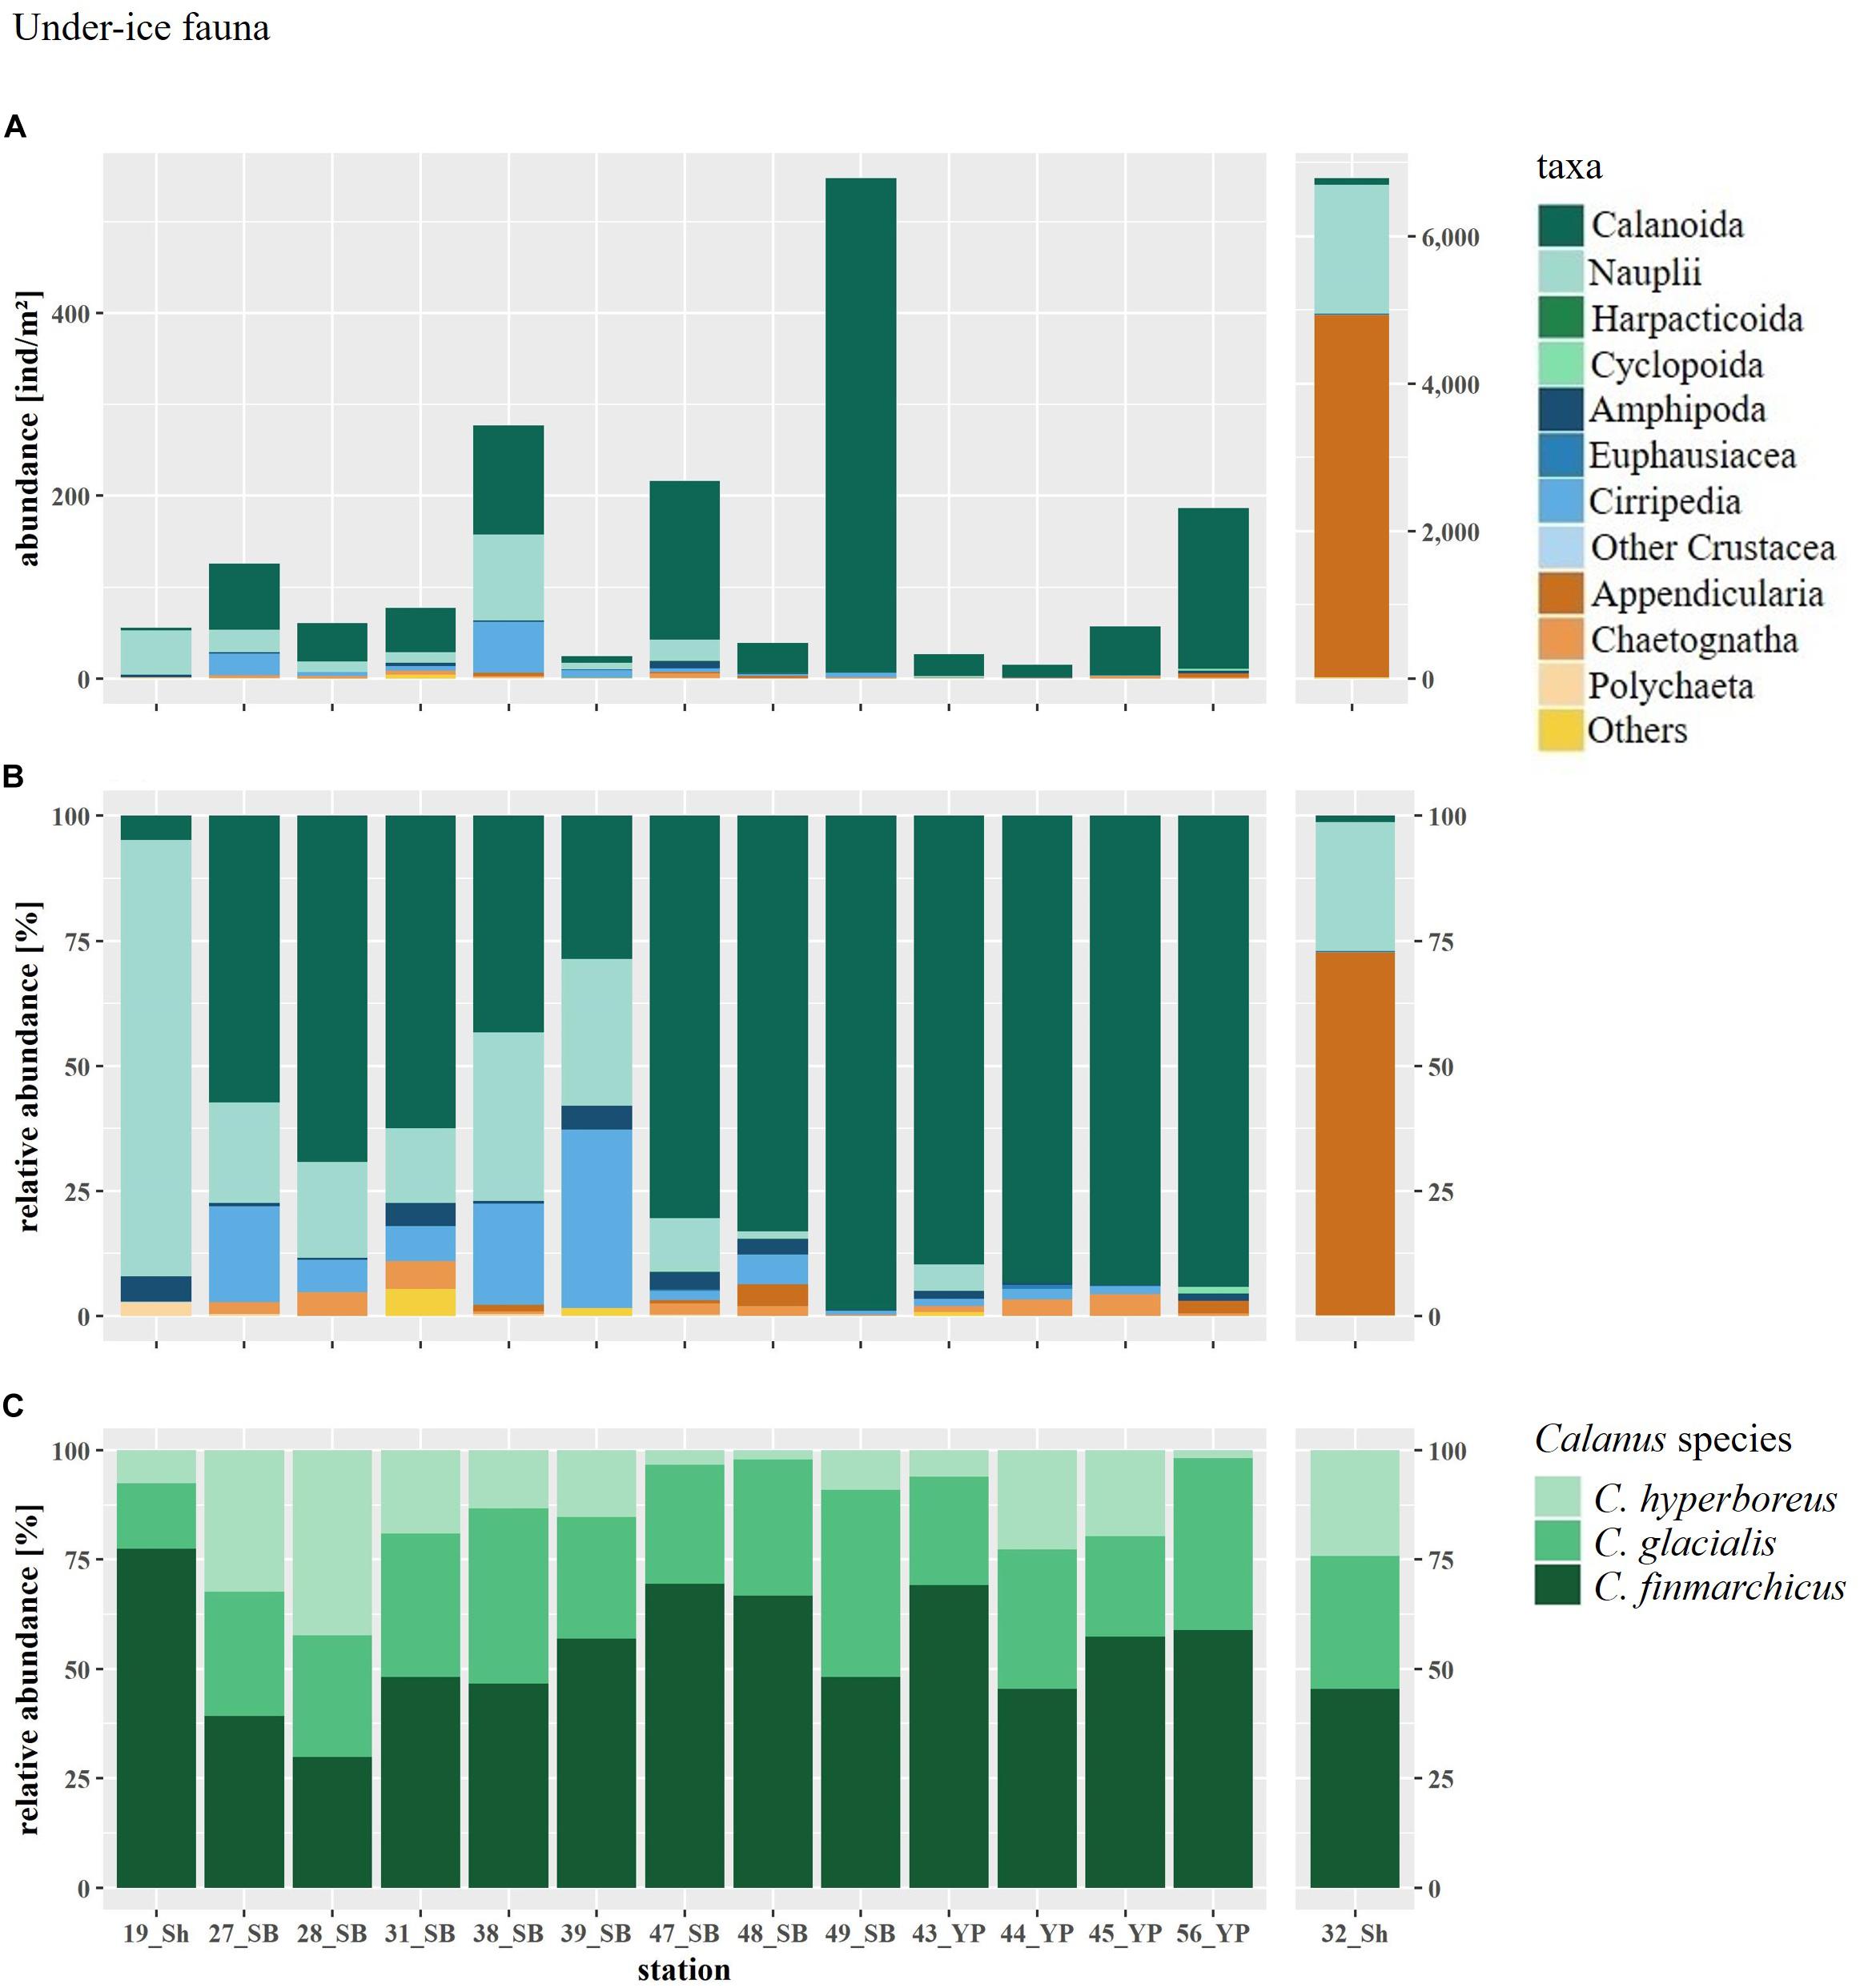
Figure 8. (A) Abundance and (B) relative abundance of the under-ice fauna and (C) relative abundance of the three Calanus species at SUIT stations arranged by geographical region (Sh, shelf; SB, Sophia Basin; YP, Yermak Plateau). SUIT Station 32 has a different y-axis, because of high Appendicularia abundance. “Others” includes the rare taxa Hydrozoa, Osteichthyes larvae, Xenacoelomorpha, Clione limacina, Limacina helicina. “Other Crustacea” includes Isopoda and Zoaea larvae.
Total abundances of under-ice fauna ranged from 15 ind.m–2 (station 44) to 6,785 ind.m–2 (station 32) (Table 5). The highest total abundances were found at stations in the center of the Sophia Basin (stations 38, 47, and 49) and at the single shelf station, with very high Appendicularia abundance (station 32) (Figure 8). The most abundant taxa were Appendicularia with a maximum abundance of 4,915 ind.m–2 and an average contribution of 58% to the total under-ice fauna abundance. The high share of Appendicularia to the overall abundance was due to their exceptionally high abundance (4,915 ind.m–2) at station 32. At all other stations, their abundance ranged between 0 and 4 ind.m–2 (Figure 8). Except for station 32, all other stations were dominated by copepod nauplii with a maximum abundance of 1,747 ind.m–2 and a share of 23% to the total under-ice fauna abundance (55% if Appendicularia abundance at station 32 was excluded) (Table 6 and Figure 8). Copepod nauplii were especially abundant at stations, which were sampled early during the expedition (stations 19–39). C. finmarchicus was the most abundant copepod species with abundances between 2 and 260 ind.m–2 contributing 9% to the total under-ice fauna abundance (20% if Appendicularia at station 32 excluded) (Table 6 and Figure 8). C. glacialis ranged between 0.4 and 231 ind.m–2 contributing 6% (14% if Appendicularia at station 32 excluded), and C. hyperboreus ranged between 0.2 and 49 ind.m–2 contributing 2% (5% if Appendicularia at station 32 excluded) to total under-ice fauna abundance (Table 6 and Figure 8). The remaining 27 taxa together made up 2% (6% if Appendicularia at station 32 excluded) of the total under-ice fauna abundance (Table 6). The three Calanus species were abundant at all fourteen stations and had a constantly high contribution to the under-ice fauna (Figure 8). Another taxon with high frequency of occurrence, but mostly low abundances (0–56 ind.m–2) were Cirripedia, which made up 1% of the entire under-ice fauna (3% if Appendicularia at station 32 excluded) (Table 6 and Figure 8). Cirripedia resembled the pattern of copepod nauplii that were mainly abundant at stations sampled early during the expedition (stations 27–39). The NMDS showed no clear separation of distinct communities based on taxa abundances (Figure 9). However, the ordination of the sampling stations along ordination axis 2 showed a gradual change in the community similarity from the shelf to the Sophia Basin with adjacent slope and the Yermak Plateau stations (Figure 9). This spatial community change was resembled in the conducted ANOSIM showed a significant difference in community similarity between the three regions shelf, Sophia Basin with slope and Yermak Plateau (α ≤ 0.05, R = 0.26, p = 0.04).
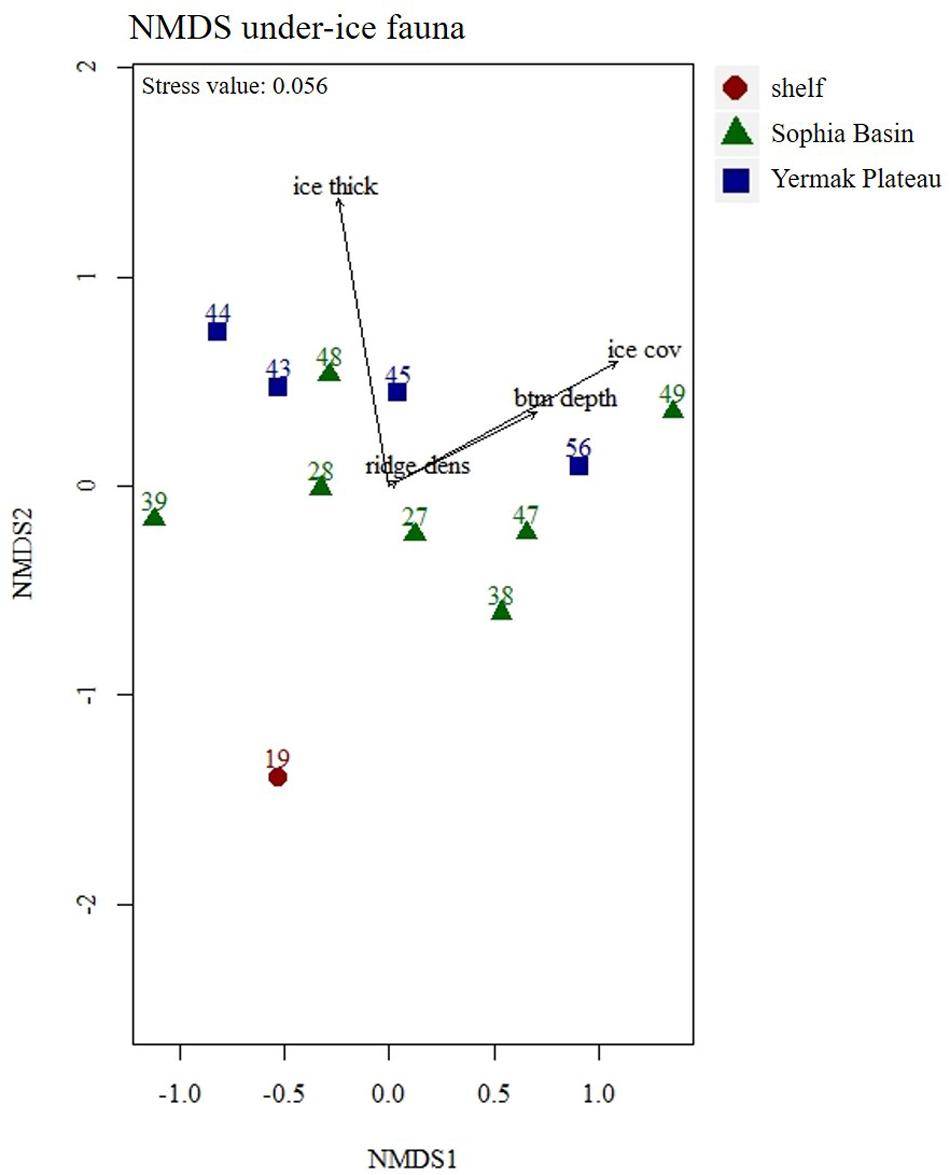
Figure 9. Non-metric Multidimensional Scaling (NMDS) plot of under-ice fauna abundances with four fitted environmental variables. Stations were color coded according to geographical regions (shelf, Sophia Basin, and Yermak Plateau). Ice thick, ice thickness; ice cov, ice coverage; btm depth, bottom depth; ridge dens, ridge density.
Discussion
Sea-Ice Meiofauna
During this study, sea-ice meiofauna abundances ranged from 580 to 17,156 ind.m–2 in the pack ice north of Svalbard. This abundance range is consistent with that reported from pack ice in the same region two decades earlier (Gradinger et al., 1999). When excluding Ciliophora, which most ice biota studies from the Arctic Ocean do not include, the total abundances of sea-ice meiofauna in this study ranged between 580 and 13,827 ind.m–2. This wide range of abundances is again similar to other pack-ice studies from the geographic area of our study (Schünemann and Werner, 2004; Bluhm et al., 2018) and has also been reported from other locations such as Baffin Bay and the Amerasian Basin (Nozais et al., 2001; Gradinger et al., 2005).
The taxonomic composition showed both similarities and differences to earlier sea-ice meiofauna studies. After Ciliophora, Harpacticoida and copepod nauplii were the most abundant groups, both of which have been consistently reported to occur in sea ice. Harpacticoida are common sea-ice residents and tolerant to extreme conditions such as freezing into solid ice for short periods (Damgaard and Davenport, 1994). Their capability to reproduce several times a year with no interruption during winter (Carey, 1992; Friedrich, 1997) may contribute to their high abundance in our and other studies. For pack ice in the region north-west of Svalbard, similar relative abundances for Copepoda (including Harpacticoida) were reported by Gradinger et al. (1999) and Schünemann and Werner (2004), but nauplii abundances were much lower in those studies. For the pan-Arctic, Bluhm et al. (2018) synthesized 23 studies on sea-ice meiofauna and estimated a mean abundance across all ice types and seasons of 341 ind.m–2 for Harpacticoida and 1,141 ind.m–2 for nauplii, recognizing that nauplii abundances are highly seasonal. Calanoid copepod nauplii tend to be encountered in sea ice in highest abundances in springtime (Bluhm et al., 2018) matching the sampling time in this study. In addition, Nozais et al. (2001) suggested that copepods (including Harpacticoida and Cyclopoida) reproduce inside the bottom ice layer itself. Consistent with these findings we suggest that the high densities of nauplii were a result of successful reproduction of copepods inside the sea-ice in our study.
The taxonomic composition of the sea-ice meiofauna in this study, however, also shows some marked differences to earlier studies. Nematoda, Acoela, and platyhelminth flatworms (in earlier studies reported as ‘Turbellaria’) were among the most abundant taxa in earlier Arctic pack-ice studies (Gradinger, 1999; Nozais et al., 2001; Gradinger et al., 2005) including the region north of Svalbard (Gradinger et al., 1999; Schünemann and Werner, 2004), but neither of these taxa were observed in this study. Essentially the same pattern (absence of flatworms and nematodes except for a single ice core) was found in a parallel study in the same area that extended over six months comprising the entire ice-covered period (N-ICE data set in Bluhm et al., 2018; Granskog et al., 2018) suggesting our finding was not barely a bias of our limited sample size or the time point of our sampling. As Nematoda are thought to colonize the sea ice in shallow waters from the sediment, where they dominate the meiofauna of the benthic interstitial (Carey and Montagna, 1982), they are predominantly found in land-fast ice or pack ice formed on shallow shelves. So far, it was assumed that Nematoda are allochthonous and do not reproduce in sea ice (Riemann and Sime-Ngando, 1997). However, recently reproduction of Nematoda was reported from shallow Arctic land-fast ice of Alaska’s north coast (Gradinger and Bluhm, 2020). Colonization patterns of ice fauna of benthic origin may change as climate driven sea-ice formation shifts. In a recent analysis of sea-ice meiofauna communities in different types of Arctic sea ice, Kiko et al. (2017) suggested that pack ice of the new Arctic will favor pelagic-sympagic species (e.g., Ciliophora) over benthic-sympagic species (e.g., Nematoda), because the now dominant first-year pack ice tends to form farther offshore and multi-year ice vanishes. For our study region, recent backtracking analyses suggest that less sea ice formed on the Siberian shelves now actually reaches the Fram Strait area (Krumpen et al., 2019). In addition, much of the ice in our research area was formed in the central Arctic Ocean (Krumpen et al., 2019). As a consequence, less sediment and, we suggest, less benthic-derived ice biota from shallow Siberian shelf areas may reached our research area. Satellite-backtracking data, which showed the origin of the specific ice floes sampled during this study, support that hypothesis (Krumpen, pers. communication). Finally, Rotifera only made up 1% of the sea-ice meiofauna abundance compared to a pan-Arctic average share of 22% (Bluhm et al., 2018) and even 33% to the pack-ice meiofauna north of Svalbard (Schünemann and Werner, 2004). According to Bluhm et al. (2018), Rotifera tend to get more abundant the later the season. Correspondingly, the early sampling season could explain the low abundance of Rotifera during this study. The abundance of sea-ice meiofauna is known to vary at least as much among seasons than regions typically reaching its peak by late spring/early summer (Schünemann and Werner, 2004; Bluhm et al., 2018). Thus, differences in abundances between studies are in part due to different seasons of sampling. A small fraction of the difference may also be explained by the fact that this study reports data from the bottom 10 cm while on average one-third of the abundance may be found outside this layer (Bluhm et al., 2018). However, inspection of the melted top 10 cm of our ice cores showed sea-ice meiofauna was absent from this layer.
Sea-ice chl a concentration can be used as an indicator for the prevalent food conditions in the pack ice for the dominant sympagic grazers in this study, Harpacticoida and copepod nauplii, who are known to feed on ice algae (Grainger and Hsiao, 1990; Gradinger and Bluhm, 2020). With a mean of 420 μg chl a m–2, the chl a concentration was markedly lower than in a summer pack-ice study from the same region almost two decades earlier when it reached a mean of 1,200 μg chl a m–2 (Gradinger et al., 1999). It is possible that some of the ice algae were already flushed out of the ice, given the low bulk salinities (<5 PSU) and moderate temperatures of the sea ice, which indicated the onset of ice melting during this late spring expedition. Another explanation for the low chl a concentration could be the snow thickness, which resulted in extreme low irradiance under the ice as could be shown during this study for most of the ice stations (Massicotte et al., 2019). Sea-ice chl a concentration did not correlate with sea-ice meiofauna abundance, although in other studies this was the case (Gradinger, 1999; Nozais et al., 2001).
Both chl a concentration and sea-ice meiofauna abundance can vary by orders of magnitude on small spatial scales and representative sampling should encompass large sample sizes or sensor profiles (Lange et al., 2017). It is, therefore, possible that the sample size of this study was too small to disentangle patchiness effects from the potential relationship between ice algae and sea-ice meiofauna. Although ice coring can cause inherent biases, because of the potential to lose part of the bottom section and/or brine, it is the current standard method for assessing the community structure of sea-ice meiofauna (Gradinger and Bluhm, 2009; Eicken et al., 2014). We recommend morphological studies such as this one to be combined with molecular approaches that are increasingly used for enhanced taxonomic resolution (Hardge et al., 2017; Marquardt et al., 2018; Pitusi, 2019).
Under-Ice Fauna
The overall mean abundance of under-ice fauna was 607 ind.m–2 during this study, which is one order of magnitude higher than in the only other SUIT study from the central Arctic Ocean from summer 2012 (David et al., 2015). The diversity of the under-ice fauna, however, was very much in accordance with studies from the Laptev Sea (Werner and Arbizu, 1999) and the central Arctic Ocean (David et al., 2015). Highest taxa richness and abundance of the under-ice fauna were found at stations with highest surface chl a values, though overall phytoplankton concentrations of the surface waters were relatively low compared to other studies (David et al., 2015; Castellani et al., in press).
It is well known that Crustacea such as Copepoda and Amphipoda can live associated with Arctic sea ice (Arndt and Swadling, 2006; Søreide et al., 2010; Hop et al., 2011). Apart from one occurrence of remarkably high abundance of Appendicularia (station 32), copepod nauplii and Calanus species were the most abundant and most frequent taxa across the sampled area. C. finmarchicus, the dominant Calanus species found in this study (Figure 3), is a boreal Atlantic species and is characteristic of the zooplankton community in Arctic areas with a strong inflow of Atlantic Water (Auel and Hagen, 2002; Rudels et al., 2013; Ehrlich, 2015). It shows a drastic decrease in abundance to <1 ind.m–2 toward the central deep basins (Kosobokova and Hirche, 2009; Kosobokova et al., 2011; David et al., 2015). C. glacialis and C. hyperboreus in turn are rather characteristic of Arctic conditions and dominated the under-ice fauna community in the central Arctic Ocean in other studies (Kosobokova and Hirche, 2000; David et al., 2015). As a well-known inhabitant of Arctic waters and an abundant species in first-year ice dominated environments (Werner and Auel, 2005) the high occurrence of C. glacialis in the present study is no surprise. In contrast to C. finmarchicus, this species reproduces in Arctic waters. Some studies predict a replacement of C. glacialis by the smaller and less energy-rich C. finmarchicus with increasing atlantification (Bonnet et al., 2005; Richardson, 2008; Polyakov et al., 2017). Potential consequences of that replacement for the Arctic ecosystem are not sufficiently assessed yet, but a recent study suggests it might not be as severe as previously assumed given the authors found copepod lipid content to be more related to habitat conditions than species identity (Renaud et al., 2018). The relatively low abundance of C. hyperboreus in this study can be explained by the fact that it is a high Arctic and deep water species, which occurs less in the meltwater layer underneath the ice (Hop et al., 2011). Both C. glacialis and C. hyperboreus, however, do use the under-ice environment as a nursing ground and time nauplii development with the springtime peak of primary production (Falk-Petersen et al., 2008; Kosobokova and Hirche, 2009; Søreide et al., 2010). High abundances of copepod nauplii under the ice, especially at the earlier sampled stations during this expedition, may have been related to spawning below the sea ice earlier in spring and to the release of nauplii from the sea ice.
Appendicularia are common in the Arctic Ocean (Kosobokova and Hirche, 2000; Auel and Hagen, 2002; Ershova and Kosobokova, 2019), but were not reported in such high abundance in the study region before. Mumm (1993) reported a relative abundance of 3% in the Nansen Basin in summer and similar ranges for Appendicularia were also reported from Kosobokova and Hirche (2000), and Ehrlich (2015) from the central Arctic Ocean. Similar to our study, David et al. (2015) reported a single station with a high abundance of Appendicularia in the ice-water interface layer from the central Arctic Ocean (52.6 ind.m–2). Such isolated high abundances indicate a high patchiness under the sea ice. Maybe Appendicularia can make use of the increased primary production in the Arctic measured by Arrigo et al. (2008) and others, including under-ice blooms, which occur beneath annual sea ice (Assmy et al., 2017; Wollenburg et al., 2018). As Appendicularia are soft-bodied filter feeders and capable of responding faster to shifts in primary production than crustaceans would (Hopcroft et al., 2005), their high abundance at one station might be a consequence of following a highly productive patch of water.
Amphipoda were rare in this study in comparison with their abundances in the under-ice fauna north of Svalbard almost three decades earlier (Lønne and Gulliksen, 1991). A more recent study from 2012 from the central Arctic Ocean, however, showed a similar range of sympagic Amphipoda abundance as the present study (David et al., 2015). An explanation for the decline of Amphipoda abundance could be that it seems to be positively related to the complexity of ice structures and the age of the ice (Bluhm et al., 2010; Hop et al., 2011; Bluhm et al., 2017). In the area north of Svalbard, multi-year ice has been declining dramatically since the mid-2000s (Polyakov et al., 2012; Perovich and Richter-Menge, 2015) and with it the abundance of sympagic Amphipoda (Bluhm et al., 2017). In our study, mainly ∼1.5 year-old sea ice (Peeken, 2016) covered the sampling area and might have been the reason for the low abundance of sympagic Amphipoda. Apherusa glacialis was the most abundant among the amphipod species and occurred at every station. This is in accordance with other studies (Werner and Auel, 2005; Hop et al., 2011; David et al., 2015). The species occurs under any ice type through the Arctic Ocean, though it is also found occasionally in the water column (Kunisch et al., 2020). As surface chl a concentration was very low during this study, the low abundance of A. glacialis might be related to food limitation. The larger amphipod species Gammarus wilkitzkii and Eusirus sp. were absent or very rare in the analyzed samples, but were actually found regularly, albeit in very low abundances in the larger (7 mm mesh) shrimp net of the SUIT (Schaafsma, pers. communication).
Conclusion
Although the results of this study show that the present taxa in the sea-ice and the under-ice water were in accordance with previous studies from this region, some relevant deviations in community composition have occurred. Some of the previously found sympagic taxa were conspicuously absent (e.g., Acoela, Platyhelminthes, and Nematoda) or rare (Rotifera, and ice Amphipoda) in our study area. This finding might reflect the changes in connectivity between the ice-producing shelf and the pack-ice areas in the last decades (Krumpen et al., 2019). The change from a multi-year to an annual sea-ice system means also a change from an ecosystem where a relatively constant community of sympagic fauna can establish over years to one where the community needs to reestablish annually and thus comprises more organisms from the pelagic habitat. This would apply especially to the sea-ice meiofauna, which is more tightly reflecting sea-ice processes, while the under-ice fauna is more influenced by water-mass processes. The under-ice community in part reflected the inflow of the Atlantic Water in this area. While Atlantic Water has in the past been below our sampled stratum, recent evidence documents decreased freshwater content from ice melt, because of less sea ice in the area, increased salinity, and enhanced mixing of Atlantic Water upward (Lind et al., 2018; Renner et al., 2018). Increased water temperatures might result in a further northward shift of Atlantic species, such as C. finmarchicus and will cause changes in the sympagic ecosystem by increasing competition for resources and space. Potential changes in sympagic community composition should be monitored to evaluate if occurrences of certain taxa such as Appendicularia are actually increasing and the trend of decreasing benthic-origin taxa continues. Consistent and increased taxonomic resolution (through molecular analysis, Hardge et al., 2017; Marquardt et al., 2018; Pitusi, 2019) is also recommended. Bio-physically coupled datasets should be prioritized to unequivocally link the reduction in the sea ice to change of sympagic fauna.
Data Availability Statement
The datasets generated for this study are available on PANGAEA (Ehrlich et al., 2020a, b).
Author Contributions
JE wrote the manuscript. AB, HF, and JE designed the sampling of this study. FS, GC, IP, and HF collected the samples of sea-ice meiofauna and under-ice fauna. JE and BB analyzed the sea-ice meiofauna samples. JE and FS analyzed the under-ice fauna samples. FS and IP contributed to the biological dataset. GC and FS contributed to the environmental dataset. AB contributed to the taxonomical accuracy of the manuscript. JE analyzed the data and prepared all figures and tables. BB, FS, and HF contributed to data interpretation. All authors contributed to the discussion of various versions of the manuscript.
Conflict of Interest
The authors declare that the research was conducted in the absence of any commercial or financial relationships that could be construed as a potential conflict of interest.
Funding
JE was funded by the national scholarships “Promotionssti- pendium nach dem Hamburger Nachwuchsfördergesetz (HmbNFG)” and “Gleichstellungsfond 2017 (4-GLF-2017)”, both granted by the University of Hamburg. The German Academic Exchange Service (DAAD) and the graduate school “POLMAR” at Alfred Wegener Institute Bremerhaven supported JE’s visit at The Arctic University of Norway’s Institute of Arctic and Marine Biology. FS received support by Wageningen Marine Research, which is commissioned by the Netherlands Ministry of Agriculture, Nature and Food Quality (LNV) under its Statutory Research Task Nature & Environment WOT-04-009-047.04. The Netherlands Polar Programme (NPP), managed by the Dutch Research Council (NWO) funded this research under project nr. ALW 866.13.009. BB’s contribution was under the framework of the Arctic Seasonal Ice Zone Ecology project, co-funded by UiT – The Arctic University of Norway and the Tromsø Research Foundation (Project Number 01vm/h15) and the Arctic ABC Project (Project Number #244319), funded by the Norwegian Research Council. IP, JE, GC, and HF were funded by the PACES (Polar Regions and Coasts in a Changing Earth System) programme of the Helmholtz Association and the expedition Grant No. AWI_PS92_00. HF, JE, and GC were part of the Helmholtz Association Young Investigators Groups Iceflux: Ice-ecosystem carbon flux in polar oceans (VH-NG-800).
Acknowledgments
We thank the Captain and crew of Polarstern for their excellent support during the PS92 expedition. We are greatful for the technical help and great support during the work at sea and on the ice by team members Michiel van Dorssen and André Meijboom. We thank Ulrike Dietrich and Mischa Ungermann for their help with the sea-ice sampling. We thank Rolf Gradinger (UiT) for his support during the lab analysis of sea-ice meiofauna. The SUIT for this study was kindly provided by Jan Andries van Franeker (Wageningen Marine Research).
Supplementary Material
The Supplementary Material for this article can be found online at: https://www.frontiersin.org/articles/10.3389/fmars.2020.00452/full#supplementary-material
Abbreviations
A., Apherusa; C., Calanus; chl a, chlorophyll a; CTD, Conductivity Temperature Depth probe; H ′, Shannon diversity; ind., individuals; J ′, Pielou’s evenness; NMDS, non-metric multidimensional scaling; PCA, principal component analysis; PS, Polarstern; PVC, polyvinylchloride; S, taxa richness; SUIT, Surface and Under-Ice Trawl.
Footnotes
References
Arctic Council Secretariat (2016). Memo on the State of the Arctic Marine Biodiversity Report (SAMBR). Tromsø: Arctic Council Secretariat.
Ardyna, M., Babin, M., Gosselin, M., Devred, E., Rainville, L., and Tremblay, J. É (2014). Recent Arctic Ocean sea ice loss triggers novel fall phytoplankton blooms. Geophys. Res. Lett. 41, 6207–6212. doi: 10.1002/2014gl061047
Arndt, C. E., and Pavlova, O. (2005). Origin and fate of ice fauna in the Fram Strait and Svalbard area. Mar. Ecol. Progr. Ser. 301, 55–66. doi: 10.3354/meps301055
Arndt, C. E., and Swadling, K. M. (2006). Crustacea in arctic and antarctic sea ice: distribution, diet and life history strategies. Adv. Mar. Biol. 51, 197–315. doi: 10.1016/s0065-2881(06)51004-1
Arrigo, K. R., van Dijken, G., and Pabi, S. (2008). Impact of a shrinking Arctic ice cover on marine primary production. Geophys. Res. Lett. 35:L19603. doi: 10.1029/2008gl035028
Arrigo, K. R., and van Dijken, G. L. (2015). Continued increases in Arctic Ocean primary production. Progr. Oceanogr. 136, 60–70. doi: 10.1016/j.pocean.2015.05.002
Assmy, P., Fernández-Méndez, M., Duarte, P., Meyer, A., Randelhoff, A., Mundy, C. J., et al. (2017). Leads in Arctic pack ice enable early phytoplankton blooms below snow-covered sea ice. Sci. Rep. 7:40850.
Auel, H., and Hagen, W. (2002). Mesozooplankton community structure, abundance and biomass in the central Arctic Ocean. Mar. Biol. 140, 1013–1021. doi: 10.1007/s00227-001-0775-4
Beszczynska-Möller, A., Fahrbach, E., Schauer, U., and Hansen, E. (2012). Variability in Atlantic water temperature and transport at the entrance to the Arctic Ocean, 1997–2010. ICES J. Mar. Sci. 69, 852–863. doi: 10.1093/icesjms/fss056
Beuchel, F., and Lønne, O. (2002). Population dynamics of the sympagic amphipods Gammarus wilkitzkii and Apherusa glacialis in sea ice north of Svalbard. Polar Biol. 25, 241–250. doi: 10.1007/s00300-001-0329-8
Bluhm, B. A., and Gradinger, R. (2008). Regional variability in food availability for Arctic marine mammals. Ecol. Appl. 18, S77–S96.
Bluhm, B. A., Gradinger, R. R., and Schnack-Schiel, S. B. (2010). Sea ice meio-and macrofauna. Sea Ice 2, 357–393. doi: 10.1002/9781444317145.ch10
Bluhm, B. A., Hop, H., Vihtakari, M., Gradinger, R., Iken, K., Melnikov, I. A., et al. (2018). Sea ice meiofauna distribution on local to pan-Arctic scales. Ecol. Evol. 8, 2350–2364. doi: 10.1002/ece3.3797
Bluhm, B. A., Swadling, K. M., and Gradinger, R. (2017). “Sea ice as a habitat for macrograzers,” in Sea Ice, Ed. D. N. Thomas (Hoboken, NJ: Wiley), 394–414. doi: 10.1002/9781118778371.ch16
Bonnet, D., Richardson, A., Harris, R., Hirst, A., Beaugrand, G., Edwards, M., et al. (2005). An overview of Calanus helgolandicus ecology in European waters. Progr. Oceanogr. 65, 1–53. doi: 10.1016/j.pocean.2005.02.002
Bray, J. R., and Curtis, J. T. (1957). An ordination of the upland forest communities of southern Wisconsin. Ecol. Monogr. 27, 325–349. doi: 10.2307/1942268
Budge, S., Wooller, M., Springer, A., Iverson, S. J., McRoy, C., and Divoky, G. (2008). Tracing carbon flow in an arctic marine food web using fatty acid-stable isotope analysis. Oecologia 157, 117–129. doi: 10.1007/s00442-008-1053-7
Carey, A. G. Jr. (1992). The ice fauna in the shallow southwestern Beaufort Sea. Arctic Ocean. J. Mar. Syst. 3, 225–236. doi: 10.1016/0924-7963(92)90002-p
Carey, A. G. Jr., and Montagna, P. A. (1982). Arctic Sea Ice Fauna1 Assemblage: First approach to description and source of the underice meiofauna. Mar. Ecol. Progr. Ser. 8, 1–8. doi: 10.3354/meps008001
Carmack, E., Polyakov, I., Padman, L., Fer, I., Hunke, E., Hutchings, J., et al. (2015). Toward quantifying the increasing role of oceanic heat in sea ice loss in the new Arctic. Bull. Am. Meteorol. Soc. 96, 2079–2105. doi: 10.1175/bams-d-13-00177.1
Castellani, G., Lüpkes, C., Hendricks, S., and Gerdes, R. (2014). Variability of A rctic sea-ice topography and its impact on the atmospheric surface drag. J. Geophys. Res. 119, 6743–6762. doi: 10.1002/2013jc009712
Castellani, G., Schaafsma, F., Arndt, S., Lange, B. A., Peeken, I., Ehrlich, J., et al. (in press). Large-scale variability of physical and biological sea-ice properties in polar oceans. Front. Mar. Sci.
Clarke, K., and Ainsworth, M. (1993). A method of linking multivariate community structure to environmental variables. Mar. Ecol. Progr. Ser. 92, 205–205.
Clarke, K. R., and Warwick, R. (2001). Change in Marine Communities: An Approach to Statistical Analysis and Interpretation. Plymouth: Primer-E Ltd.
Comiso, J. C. (2012). Large decadal decline of the Arctic multiyear ice cover. J. Clim. 25, 1176–1193. doi: 10.1175/jcli-d-11-00113.1
Conover, R. (1988). Comparative life histories in the genera Calanus and Neocalanus in high latitudes of the northern hemisphere. Hydrobiologia 167, 127–142. doi: 10.1007/978-94-009-3103-9_11
Damgaard, R., and Davenport, J. (1994). Salinity tolerance, salinity preference and temperature tolerance in the high-shore harpacticoid copepod Tigriopus brevicornis. Mar. Biol. 118, 443–449. doi: 10.1007/bf00350301
Darnis, G., Robert, D., Pomerleau, C., Link, H., Archambault, P., Nelson, R. J., et al. (2012). Current state and trends in Canadian Arctic marine ecosystems: II. Heterotrophic food web, pelagic-benthic coupling, and biodiversity. Clim. Change 115, 179–205. doi: 10.1007/s10584-012-0483-8
David, C., Lange, B., Rabe, B., and Flores, H. (2015). Community structure of under-ice fauna in the Eurasian central Arctic Ocean in relation to environmental properties of sea-ice habitats. Mar. Ecol. Progr. Ser. 522, 15–32. doi: 10.3354/meps11156
Ehrlich, J. (2015). Diversity and Distribution Of High-Arctic Zooplankton in the Eurasian Basin in Late Summer 2012. Hamburg: University of Hamburg/Alfred-Wegener-Institut.
Ehrlich, J., Schaafsma, F. L., Bluhm, B. A., Peeken, I., Castellani, G., Brandt, A., et al. (2020a). Sea-ice meiofauna (>10 μm) abundance in Arctic pack ice north of Svalbard during the Polarstern expedition PS92 in 2015. PANGAEA. doi: 10.1594/PANGAEA.915960
Ehrlich, J., Schaafsma, F. L., Bluhm, B. A., Peeken, I., Castellani, G., Brandt, A., et al. (2020b). Under-ice fauna abundance of Arctic pack ice north of Svalbard during the Polarstern expedition PS92 in 2015. PANGAEA. doi: 10.1594/PANGAEA.915961
Eicken, H., Bluhm, B. A., Collins, R. E., Haas, C., Ingham, M., Gradinger, R., et al. (2014). “Field techniques in sea-ice research,” in Cold Regions Science and Marine Technology, Ed. H. H. Shen (Paris: EOLSS Publishers), 1–20.
Ershova, E. A., and Kosobokova, K. N. (2019). Cross-shelf structure and distribution of mesozooplankton communities in the East-Siberian Sea and the adjacent Arctic Ocean. Polar Biol. 42, 1353–1367. doi: 10.1007/s00300-019-02523-2522
Falk-Petersen, S., Leu, E., Berge, J., Kwasniewski, S., Nygård, H., Røstad, A., et al. (2008). Vertical migration in high Arctic waters during autumn 2004. Deep Sea Res. Part II Top. Stud. Oceanogr. 55, 2275–2284. doi: 10.1016/j.dsr2.2008.05.010
Falk-Petersen, S., Mayzaud, P., Kattner, G., and Sargent, J. R. (2009). Lipids and life strategy of Arctic Calanus. Mar. Biol. Res. 5, 18–39.
Fernández-Méndez, M., Katlein, C., Rabe, B., Nicolaus, M., Peeken, I., Bakker, K., et al. (2015). Photosynthetic production in the central Arctic Ocean during the record sea-ice minimum in 2012. Biogeosciences 12, 3525–3549. doi: 10.5194/bg-12-3525-2015
Flores, H., David, C., Ehrlich, J., Hardge, K., Kohlbach, D., Lange, B. A., et al. (2019). Sea-ice properties and nutrient concentration as drivers of the taxonomic and trophic structure of high-Arctic protist and metazoan communities. Polar Biol. 42, 1377–1395. doi: 10.1007/s00300-019-02526-z
Flores, H., Van Franeker, J. A., Siegel, V., Haraldsson, M., Strass, V., Meesters, E. H., et al. (2012). The association of Antarctic krill Euphausia superba with the under-ice habitat. PLoS One 7:e31775. doi: 10.1371/journal.pone.0031775
Friedrich, C. (1997). Ökologische Untersuchungen zur Fauna des arktischen Meereises. Ber. zur Polarforschung 246:211.
Garrison, D. L., and Buck, K. R. (1986). Organism losses during ice melting: a serious bias in sea ice community studies. Polar Biol. 6, 237–239. doi: 10.1007/bf00443401
Gosselin, M., Levasseur, M., Wheeler, P. A., Horner, R. A., and Booth, B. C. (1997). New measurements of phytoplankton and ice algal production in the Arctic Ocean. Deep Sea Res. Part II Top. Stud. Oceanogr. 44, 1623–1644. doi: 10.1016/s0967-0645(97)00054-4
Gradinger, R. (1999). Integrated abundance and biomass of sympagic meiofauna in Arctic and Antarctic pack ice. Polar Biol. 22, 169–177. doi: 10.1007/s003000050407
Gradinger, R., and Bluhm, B. (2009). “Assessment of the abundance and diversity of sea ice biota,” in Field Techniques for Sea-Ice Research, eds H. Eicken and M. Salganek (Fairbanks, AK: University of Alaska Press), 283.
Gradinger, R., and Bluhm, B. A. (2020). First analysis of an Arctic sea ice meiofauna food web based on abundance, biomass and stable isotope ratios. Mar. Ecol. Progr. Ser. 634, 29–43. doi: 10.3354/meps13170
Gradinger, R., Friedrich, C., and Spindler, M. (1999). Abundance, biomass and composition of the sea ice biota of the Greenland Sea pack ice. Deep Sea Res. Part II Top. Stud. Oceanogr. 46, 1457–1472. doi: 10.1016/s0967-0645(99)00030-2
Gradinger, R., Spindler, M., and Weissenberger, J. (1992). On the structure and development of Arctic pack ice communities in Fram Strait: a multivariate approach. Polar Biol. 12, 727–733.
Gradinger, R. R., and Bluhm, B. A. (2004). In-situ observations on the distribution and behavior of amphipods and Arctic cod (Boreogadus saida) under the sea ice of the High Arctic Canada Basin. Polar Biol. 27, 595–603.
Gradinger, R. R., Meiners, K., Plumley, G., Zhang, Q., and Bluhm, B. A. (2005). Abundance and composition of the sea-ice meiofauna in off-shore pack ice of the Beaufort Gyre in summer 2002 and 2003. Polar Biol. 28, 171–181. doi: 10.1007/s00300-004-0674-5
Grainger, E., and Hsiao, S. I. (1990). Trophic relationships of the sea ice meiofauna in Frobisher Bay. Arctic Canada. Polar Biol. 10, 283–292.
Granskog, M. A., Assmy, P., and Koç, N. (2020). “Emerging Traits of Sea Ice in the Atlantic Sector of the Arctic” in Climate Change and the White World, eds P. S. Goel, R. Ravindra, and S. Chattopadhyay (Berlin: Springer), 3–10. doi: 10.1007/978-3-030-21679-5_1
Granskog, M. A., Fer, I., Rinke, A., and Steen, H. (2018). Atmosphere-Ice-Ocean-Ecosystem processes in a thinner arctic sea ice regime: the norwegian young sea ICE (N-ICE2015) expedition. J. Geophys. Res. 123, 1586–1594. doi: 10.1002/2017jc013328
Gulliksen, B., and Lønne, O. J. (1989). Distribution, abundance, and ecological importance of marine sympagic fauna in the Arctic. Rapp. PV Reun. Cons. Int. Explor. Mer. 188, 133–138.
Haas, C. (2003). Dynamics versus thermodynamics: The sea ice thickness distribution. Sea Ice 1, 82–111. doi: 10.1002/9780470757161.ch3
Hardge, K., Peeken, I., Neuhaus, S., Lange, B. A., Stock, A., Stoeck, T., et al. (2017). The importance of sea ice for exchange of habitat-specific protist communities in the Central Arctic Ocean. J. Mar. Syst. 165, 124–138. doi: 10.1016/j.jmarsys.2016.10.004
Hirche, H.-J., and Kosobokova, K. (2007). Distribution of Calanus finmarchicus in the northern North Atlantic and Arctic Ocean—expatriation and potential colonization. Deep Sea Res. Part II Top. Stud. Oceanogr. 54, 2729–2747. doi: 10.1016/j.dsr2.2007.08.006
Hop, H., Mundy, C. J., Gosselin, M., Rossnagel, A. L., and Barber, D. G. (2011). Zooplankton boom and ice amphipod bust below melting sea ice in the Amundsen Gulf, Arctic Canada. Polar Biol. 34, 1947–1958. doi: 10.1007/s00300-011-0991-994
Hop, H., and Pavlova, O. (2008). Distribution and biomass transport of ice amphipods in drifting sea ice around Svalbard. Deep Sea Res. Part II Top. Stud. Oceanogr. 55, 2292–2307. doi: 10.1016/j.dsr2.2008.05.023
Hop, H., Poltermann, M., Lønne, O. J., Falk-Petersen, S., Korsnes, R., and Budgell, W. P. (2000). Ice amphipod distribution relative to ice density and under-ice topography in the northern Barents Sea. Polar Biol. 23, 357–367. doi: 10.1007/s003000050456
Hopcroft, R., Clarke, C., Nelson, R., and Raskoff, K. (2005). Zooplankton communities of the Arctic’s Canada Basin: the contribution by smaller taxa. Polar Biol. 28, 198–206. doi: 10.1007/s00300-004-0680-7
Hughes, T., Bellwood, D., Baird, A., Brodie, J., Bruno, J., and Pandolfi, J. (2011). Shifting base-lines, declining coral cover, and the erosion of reef resilience: comment on Sweatman et al.(2011). Coral Reefs 30, 653–660. doi: 10.1007/s00338-011-0787-6
Kiko, R., Kern, S., Kramer, M., and Mütze, H. (2017). Colonization of newly forming Arctic sea ice by meiofauna: a case study for the future Arctic? Polar Biol. 40, 1277–1288. doi: 10.1007/s00300-016-2052-5
Kohlbach, D., Graeve, M., Lange, B. A., David, C., Peeken, I., and Flores, H. (2016). The importance of ice algae-produced carbon in the central Arctic Ocean ecosystem: Food web relationships revealed by lipid and stable isotope analyses. Limnol. Oceanogr. 61, 2027–2044. doi: 10.1002/lno.10351
Kosobokova, K., and Hirche, H.-J. (2000). Zooplankton distribution across the Lomonosov Ridge, Arctic Ocean: species inventory, biomass and vertical structure. Deep Sea Res. Part I Oceanogr. Res. Papers 47, 2029–2060. doi: 10.1016/s0967-0637(00)00015-7
Kosobokova, K., and Hirche, H.-J. (2009). Biomass of zooplankton in the eastern Arctic Ocean–a base line study. Progr. Oceanogr. 82, 265–280. doi: 10.1016/j.pocean.2009.07.006
Kosobokova, K. N., Hopcroft, R. R., and Hirche, H.-J. (2011). Patterns of zooplankton diversity through the depths of the Arctic’s central basins. Mar. Biodivers. 41, 29–50. doi: 10.1007/s12526-010-0057-9
Krumpen, T., Belter, H. J., Boetius, A., Damm, E., Haas, C., Hendricks, S., et al. (2019). Arctic warming interrupts the Transpolar Drift and affects long-range transport of sea ice and ice-rafted matter. Sci. Rep. 9:5459.
Kruskal, J. B. (1964). Nonmetric multidimensional scaling: a numerical method. Psychometrika 29, 115–129. doi: 10.1007/bf02289694
Kunisch, E. H., Bluhm, B. A., Daase, M., Gradinger, R., Hop, H., Melnikov, I. A., et al. (2020). Pelagic occurrences of the ice amphipod Apherusa glacialis throughout the Arctic. J. Plankton Res. 42, 73–86. doi: 10.1093/plankt/fbz072
Kwok, R., and Cunningham, G. (2015). Variability of Arctic sea ice thickness and volume from CryoSat-2. Philos. Trans. R. Soc. A 373:20140157.
Lange, B. A., Katlein, C., Castellani, G., Fernández-Méndez, M., Nicolaus, M., Peeken, I., et al. (2017). Characterizing spatial variability of ice algal chlorophyll a and net primary production between sea ice habitats using horizontal profiling platforms. Front. Mar. Sci. 4:349. doi: 10.3389/fmars.2017.00349
Lange, B. A., Katlein, C., Nicolaus, M., Peeken, I., and Flores, H. (2016). Sea ice algae chlorophyll a concentrations derived from under-ice spectral radiation profiling platforms. J. Geophys. Res. 121, 8511–8534. doi: 10.1002/2016jc011991
Lind, S., Ingvaldsen, R. B., and Furevik, T. (2018). Arctic warming hotspot in the northern Barents Sea linked to declining sea-ice import. Nat. Clim. Change 8, 634–639. doi: 10.1038/s41558-018-0205-y
Lønne, O., and Gulliksen, B. (1991). Sympagic macro-fauna from multiyear sea-ice near Svalbard. Polar Biol. 11, 471–477.
Madsen, S., Nielsen, T., and Hansen, B. (2001). Annual population development and production by Calanus finmarchicus, C. glacialis and C. hyperboreus in Disko Bay, western Greenland. Mar. Biol. 139, 75–83.
Mardia, K., Kent, J. T., and Bibby, J. M. (1979). Multivariate Analysis. San Francisco, CA: WordPress.
Marquardt, M., Kramer, M., Carnat, G., and Werner, I. (2011). Vertical distribution of sympagic meiofauna in sea ice in the Canadian Beaufort Sea. Polar Biol. 34, 1887–1900. doi: 10.1007/s00300-011-1078-y
Marquardt, M., Majaneva, S., Pitusi, V., and Søreide, J. E. (2018). Pan-Arctic distribution of the hydrozoan Sympagohydra tuuli? First record in sea ice from Svalbard (European Arctic). Polar Biol. 41, 583–588. doi: 10.1007/s00300-017-2219-8
Massicotte, P., Peeken, I., Katlein, C., Flores, H., Huot, Y., Castellani, G., et al. (2019). Sensitivity of phytoplankton primary production estimates to available irradiance under heterogeneous sea ice conditions. J. Geophys. Res. 124, 5436–5450. doi: 10.1029/2019jc015007
Melnikov, I. (2018). “Characterization of the Biodiversity of Modern Sea Ice in the North Pole Region,” in Doklady Earth Sciences, Ed. N. S. Bortnikov (Berlin: Springer), 792–795. doi: 10.1134/s1028334x18060132
Melnikov, I., and Kulikov, A. (1980). “The cryopelagic fauna of the central Arctic basin,” in Biology of the central Arctic Basin, eds M. E. Vinogradov, and I. A. Mel’nikov, (Moscow: Nauka), 97–111.
Melnikov, I. A., Zhitina, L. S., and Kolosova, H. G. (2001). The Arctic sea ice biological communities in recent environmental changes (scientific note). Mem. Natl. Inst. Polar Rev. Spl. Issue 54:409416.
Michel, C., Nielsen, T. G., Nozais, C., and Gosselin, M. (2002). Significance of sedimentation and grazing by ice micro-and meiofauna for carbon cycling in annual sea ice (northern Baffin Bay). Aquatic Microb. Ecol. 30, 57–68. doi: 10.3354/ame030057
Mumm, N. (1993). Composition and distribution of mesozooplankton in the Nansen Basin, Arctic Ocean, during summer. Polar Biol. 13, 451–461.
Nicolaus, M., Katlein, C., Maslanik, J., and Hendricks, S. (2012). Changes in Arctic sea ice result in increasing light transmittance and absorption. Geophys. Res. Lett. 39:L24501.
Nozais, C., Gosselin, M., Michel, C., and Tita, G. (2001). Abundance, biomass, composition and grazing impact of the sea-ice meiofauna in the North Water, northern Baffin Bay. Mar. Ecol. Progr. Ser. 217, 235–250. doi: 10.3354/meps217235
Oksanen, J., Blanchet, F., Friendly, M., Kindt, R., Legendre, P., McGlinn, D., et al. (2018). vegan: Community Ecology Package. R package version 2.5-2.
Peeken, I. (2016). The Expedition PS92 of the Research Vessel POLARSTERN to the Arctic Ocean in 2015. Rep. Polar Mar. Res. 694:153. doi: 10.2312/BzPM_0694_2016
Perovich, D. K., and Richter-Menge, J. A. (2015). Regional variability in sea ice melt in a changing Arctic. Philos. Trans. R. Soc. A 373:20140165.
Pitusi, V. (2019). Seasonal Abundance and Activity of Sympagic Meiofauna in Van Mijenfjorden, Svalbard. Tromsø: UiT Norges arktiske universitet.
Poltermann, M., Hop, H., and Falk-Petersen, S. (2000). Life under Arctic sea ice–reproduction strategies of two sympagic (ice-associated) amphipod species, Gammarus wilkitzkii and Apherusa glacialis. Mar. Biol. 136, 913–920. doi: 10.1007/s002270000307
Polyakov, I. V., Pnyushkov, A. V., Alkire, M. B., Ashik, I. M., Baumann, T. M., Carmack, E. C., et al. (2017). Greater role for Atlantic inflows on sea-ice loss in the Eurasian Basin of the Arctic Ocean. Science 356, 285–291. doi: 10.1126/science.aai8204
Polyakov, I. V., Walsh, J. E., and Kwok, R. (2012). Recent changes of Arctic multiyear sea ice coverage and the likely causes. Bull. Am. Meteorol. Soc. 93, 145–151. doi: 10.1175/bams-d-11-00070.1
R Core Team (2018). R: A Language and Environment for Statistical Computing. Vienna: R Foundation for Statistical Computing. Available online at: https ://www.R-project.org/
Rabenstein, L., Hendricks, S., Martin, T., Pfaffhuber, A., and Haas, C. (2010). Thickness and surface-properties of different sea-ice regimes within the Arctic Trans Polar Drift: Data from summers 2001, 2004 and 2007. J. Geophys. Res. 115:C12.
Renaud, P. E., Daase, M., Banas, N. S., Gabrielsen, T. M., Søreide, J. E., Varpe, Ø, et al. (2018). Pelagic food-webs in a changing Arctic: a trait-based perspective suggests a mode of resilience. ICES J. Mar. Sci. 75, 1871–1881. doi: 10.1093/icesjms/fsy063
Renner, A., Sundfjord, A., Janout, M., Ingvaldsen, R., Beszczynska-Möller, A., Pickart, R., et al. (2018). Variability and redistribution of heat in the Atlantic Water boundary current north of Svalbard. J. Geophys. Res. 123, 6373–6391. doi: 10.1029/2018jc013814
Richardson, A. J. (2008). In hot water: zooplankton and climate change. ICES J. Mar. Sci. 65, 279–295. doi: 10.1093/icesjms/fsn028
Riemann, F., and Sime-Ngando, T. (1997). Note on sea-ice nematodes (Monhysteroidea) from Resolute Passage. Canadian high Arctic. Pol. Biol. 18, 70–75. doi: 10.1007/s003000050160
Rudels, B. (1987). On the Mass Balance of the Polar Ocean, with Special Emphasis on the Fram Strait. Tromsø: Norsk Polarinstitutt.
Rudels, B., Jones, E. P., Schauer, U., and Eriksson, P. (2004). Atlantic sources of the Arctic Ocean surface and halocline waters. Polar Res. 23, 181–208. doi: 10.3402/polar.v23i2.6278
Rudels, B., Schauer, U., Björk, G., Korhonen, M., Pisarev, S., Rabe, B., et al. (2013). Observations of water masses and circulation in the Eurasian Basin of the Arctic Ocean from the 1990s to the late 2000s. OS Special Issue 9, 147–169. doi: 10.5194/os-9-147-2013
Schlitzer, R., Anderson, R. F., Dodas, E. M., Lohan, M., Geibert, W., Tagliabue, A., et al. (2018). The GEOTRACES intermediate data product 2017. Chem. Geol. 493, 210–223.
Schünemann, H., and Werner, I. (2004). Seasonal variations in distribution patterns of sympagic meiofauna in Arctic pack ice. Mar. Biol. 146, 1091–1102. doi: 10.1007/s00227-004-1511-1517
Serreze, M. C., Holland, M. M., and Stroeve, J. (2007). Perspectives on the Arctic’s shrinking sea-ice cover. Science 315, 1533–1536. doi: 10.1126/science.1139426
Shepard, R. N. (1962). The analysis of proximities: multidimensional scaling with an unknown distance function. I. Psychometrika 27, 125–140. doi: 10.1007/bf02289630
Søreide, J. E., Carroll, M. L., Hop, H., Ambrose, W. G. Jr., Hegseth, E. N., and Falk-Petersen, S. (2013). Sympagic-pelagic-benthic coupling in Arctic and Atlantic waters around Svalbard revealed by stable isotopic and fatty acid tracers. Mar. Biol. Res. 9, 831–850. doi: 10.1080/17451000.2013.775457
Søreide, J. E., Hop, H., Carroll, M. L., Falk-Petersen, S., and Hegseth, E. N. (2006). Seasonal food web structures and sympagic–pelagic coupling in the European Arctic revealed by stable isotopes and a two-source food web model. Progr. Oceanogr. 71, 59–87. doi: 10.1016/j.pocean.2006.06.001
Søreide, J. E., Leu, E., Berge, J., Graeve, M., and Falk-Petersen, S. (2010). Timing of blooms, algal food quality and Calanus glacialis reproduction and growth in a changing Arctic. Glob. Change Biol. 16, 3154–3163.
Tran, S., Bonsang, B., Gros, V., Peeken, I., Sarda-Esteve, R., Bernhardt, A., et al. (2013). A survey of carbon monoxide and non-methane hydrocarbons in the Arctic Ocean during summer 2010. Biogeosciences 10, 1909–1935. doi: 10.5194/bg-10-1909-2013
Tremblay, J. -É, Anderson, L. G., Matrai, P., Coupel, P., Bélanger, S., Michel, C., et al. (2015). Global and regional drivers of nutrient supply, primary production and CO2 drawdown in the changing Arctic Ocean. Progr. Oceanogr. 139, 171–196. doi: 10.1016/j.pocean.2015.08.009
Tremblay, J. -É, and Gagnon, J. (2009). “The effects of irradiance and nutrient supply on the productivity of Arctic waters: a perspective on climate change,” in Influence of Climate Change on the Changing Arctic And Sub-Arctic Conditions, Ed. J. Nihoul (Berlin: Springer), 73–93. doi: 10.1007/978-1-4020-9460-6_7
van Franeker, J. A., Flores, H., and Van Dorssen, M. (2009). The Surface and Under Ice Trawl (SUIT). Frozen Desert Alive-The role of sea ice for Pelagic Macrofauna and Its Predators. PhD thesis, University of Groningen, Groningen, 181–188.
Werner, I., and Arbizu, P. M. (1999). The sub-ice fauna of the Laptev Sea and the adjacent Arctic Ocean in summer 1995. Polar Biol. 21, 71–79. doi: 10.1007/s003000050336
Werner, I., and Auel, H. (2005). Seasonal variability in abundance, respiration and lipid composition of Arctic under-ice amphipods. Mar. Ecol. Progr. Ser. 292, 251–262. doi: 10.3354/meps292251
Wickham, H. (2018). Scales: Scale Functions for Visualization [WWW Document]. Available online at: https://cran.r-project. org/package= scales (accessed May 5, 2019).
Wollenburg, J., Katlein, C., Nehrke, G., Nöthig, E.-M., Matthiessen, J., Wolf-Gladrow, D. A., et al. (2018). Ballasting by cryogenic gypsum enhances carbon export in a Phaeocystis under-ice bloom. Sci. Rep. 8, 1–9.
Keywords: Arctic Ocean, Svalbard, sea-ice meiofauna, under-ice fauna, zooplankton, biodiversity, community composition, environmental conditions
Citation: Ehrlich J, Schaafsma FL, Bluhm BA, Peeken I, Castellani G, Brandt A and Flores H (2020) Sympagic Fauna in and Under Arctic Pack Ice in the Annual Sea-Ice System of the New Arctic. Front. Mar. Sci. 7:452. doi: 10.3389/fmars.2020.00452
Received: 02 March 2020; Accepted: 22 May 2020;
Published: 19 June 2020.
Edited by:
Zhijun Dong, Yantai Institute of Coastal Zone Research (CAS), ChinaReviewed by:
Xiubao Li, Hainan University, ChinaJuan Andrés López, University of Alaska Fairbanks, United States
Copyright © 2020 Ehrlich, Schaafsma, Bluhm, Peeken, Castellani, Brandt and Flores. This is an open-access article distributed under the terms of the Creative Commons Attribution License (CC BY). The use, distribution or reproduction in other forums is permitted, provided the original author(s) and the copyright owner(s) are credited and that the original publication in this journal is cited, in accordance with accepted academic practice. No use, distribution or reproduction is permitted which does not comply with these terms.
*Correspondence: Julia Ehrlich, anVsaWEuZWhybGljaEBhd2kuZGU=