- 1Department of Geography, University College London, London, United Kingdom
- 2Institute of Zoology, Zoological Society of London, London, United Kingdom
- 3Department of Life Sciences, Imperial College London, London, United Kingdom
- 4Greenland Institute of Natural Resources, Nuuk, Greenland
The term vulnerable marine ecosystem (VME) was introduced to facilitate the spatial management of deep-seas, identifying those habitats vulnerable to anthropogenic disturbance, such as trawling. Consistent interpretation of the VME definition has been hampered by an underlying paucity of knowledge about the nature and distribution of deep-sea habitats. Photographic and video platforms yield data rich, quantifiable imagery to address these knowledge gaps. A low-cost towed benthic video sled has been used to investigate deep-sea habitats and trawling impacts in west Greenland. A review of imagery from multiple cruises highlighted an area where benthic megafauna contributes to notable structural complexity on the continental slope of the Toqqusaq Bank. Quantitative analysis of imagery from this area provides the first description of a soft coral garden habitat and other communities. The coral garden and observed densities are considered in relation to the VME guidelines (FAO, 2009) and wider literature. The study proposes a 486 km2 area spanning ∼60 km of continental slope as a VME. This has direct implications for the management of economically important deep-sea trawl fisheries, which are immediately adjacent. This furthers our knowledge and understanding of VMEs in North Atlantic, in a previously understudied region and demonstrates the utility of a low-cost video sled for identifying and describing VMEs.
Introduction
The deep-sea (> 200 m) is the world’s largest habitat covering ∼65% of the earth’s surface (Danovaro et al., 2017) and is increasingly subject to anthropogenic disturbance from fishing (Morato et al., 2006). Typically, deep-sea species are characterized by traits, including slow growth, late-maturity, and longevity, which can render populations, communities and habitats vulnerable to exploitation and disturbance (Ramirez-Llodra et al., 2010). Recognizing this, the United Nations General Assembly (UNGA) Resolution 61/105 called upon States to take action to protect vulnerable marine ecosystems (VMEs) (UNGA, 2006). Following a period of consultation, the Food and Agriculture Organization (FAO) defined VMEs as exhibiting one or more of the following criteria: (i) unique or rare; (ii) functionally significant, (iii) fragile, (iv) containing component species whose life-history traits make recovery difficult; or (v) structurally complex (Gjerde et al., 2008; FAO, 2009).
The term VME has subsequently been applied to a wide variety of deep-sea habitats in both areas beyond national jurisdiction (ABNJ) and within exclusive economic zones (EEZs) around the world. States and regional fisheries management organizations (RFMOs) have adopted differing approaches for both identifying VMEs (Ardron et al., 2014) and implementing measures to protect them (Rogers and Gianni, 2011), which includes bycatch thresholds and move-on rules (Auster et al., 2010). Frequently, identification of VMEs has been based on the occurrence of VME indicator species, such as cold-water coral or sponges, at significant concentrations, which is a matter of expert judgment in the absence of explicit thresholds in the FAO guidance (Auster et al., 2010). This has led efforts to establish more consistent, quantitative and systematic approaches for identifying VMEs (Ardron et al., 2014; Morato et al., 2018). Fundamentally, adoption of a consistent systematic approach requires a sound understanding of the underlying nature and distribution of VMEs and indicator species globally. Currently, biases in survey effort mean that regions such as the Northeast Atlantic have received considerable attention (e.g., Muñoz and Sayago-Gil, 2011; Buhl-Mortensen et al., 2015; Huvenne et al., 2016), whilst others remain comparatively poorly known.
Survey approaches which yield quantifiable seafloor imagery by employing remote operated vehicles (ROVs), manned submersibles or towed cameras are among the preferred approaches for identifying VMEs. Morato et al. (2018) observe that the cost of obtaining and deploying equipment capable of imaging deep-sea environments has limited the identification of VMEs, with only a minute fraction of the deep-sea floor having been surveyed to date. Nevertheless, they predict that the rapid advance in technologies will reduce costs and increase coverage.
Despite having an EEZ of over 2.2 million km2, Greenland has few Marine Protected Areas (MPAs). These are exclusively in inshore waters totalling ∼4.5% of the EEZ (UNEP-WCMC, 2019), with none designated to protect known VMEs. A number of “Technical Conservation Measures” introduced by Executive Orders have been used to limit the use of bottom-contact fishing gears in some areas, of these only two are associated with the presence of VME indicator species. Specifically, there is a ∼6.5 km2 area in southwest Greenland bounding a single observation of Desmophyllum pertusum (Government of Greenland, 2017; Kenchington et al., 2017) and 11 discrete areas within the offshore region of Melville Bay closed to bottom trawling “based on significant observations of sea pens” (Umbellula sp.). (Cappell et al., 2018; Government of Greenland, 2018). This paucity of spatial management measures to protect VMEs is principally due to a lack of knowledge about the nature and distribution of VMEs within the Greenlandic EEZ, representing a knowledge gap in the North Atlantic.
Greenland is economically dependent on fisheries which account for 80–95% of the country’s export income (Mortensen, 2014; The Economic Council, 2017; Jacobsen, 2018). The majority of this income is from deep-sea fisheries for prawns (Pandalus borealis) and Greenland halibut (Reinhardtius hippoglossoides) in west Greenland, though there is a growing contribution from pelagic fisheries in east Greenland. Since 2011, a program of benthic surveys using a drop camera (Yesson et al., 2015, 2017; Gougeon et al., 2017) and more recently a benthic video sled, has been working to quantify the impacts of trawling on benthic habitats by sampling across a spectrum of fishing effort. A series of stations from the western slope of the Toqqusaq Bank between 274 and 585 m, appear to show varied communities, with notable concentrations of cauliflower corals (Nephtheidae) and other VME indicator species, on rocky and mixed substrates.
Coral gardens are characterized by aggregations of one or more species (typically of non-reef forming coral), on a wide range of hard and soft substrates, supporting diverse benthic and epi-benthic fauna (ICES, 2007; OSPAR Commission, 2010). There is considerable diversity among coral garden communities, which may be dominated by soft corals (Alcyonacea), sea pens (Pennatulacea), black corals (Antipatharia), and stony corals (Scleractinia), often with sponges (Porifera) abundant but not dominant. Coral gardens dominated by cauliflower corals from four genera (Gersemia, Duva, Drifa, and Pseudodrifa), found on hard and mixed substrates are sometimes referred to as “cauliflower coral gardens” (Davies et al., 2017; Buhl-Mortensen et al., 2019). These have previously been observed in northwest and southeast Iceland (J. Burgos, pers. comm.; Buhl-Mortensen et al., 2019), Norway (Guillaumont et al., 2016) and eastern Canada (B. de Moura Neves, pers. comm.). Recognizing the vulnerability of cauliflower corals to physical disturbance, especially trawling (Devine et al., 2019), these cauliflower coral gardens have been considered VMEs by some including the North East Atlantic Fisheries Commission (NEAFC) (NEAFC, 2014; Buhl-Mortensen et al., 2019).
This study presents imagery collected using a custom built, low-cost benthic sled (total cost ∼5,000 USD), which utilizes a commercially available action camera (GoPro). Imagery is used to produce a quantitative description of soft coral garden habitat in west Greenland, in the Northwest Atlantic. The findings are used to propose an area of continental slope as a soft coral garden VME, with reference to the FAO guidance and the wider literature.
Materials and Methods
Study Site
The study site lies on the west Greenland continental slope, where the shallower Davis Strait separates the deeper northern Labrador Sea and Baffin Bay basins. The continental shelf in west Greenland can extend > 100 km offshore with numerous deep troughs and shallow banks (Jørgensen et al., 2018). Historically, the banks in west Greenland have been important fishing grounds for cod and more presently for prawns. Monitoring studies suggest that hydrographic conditions can stimulate high pelagic primary production across the edge of these banks (Poulsen and Reuss, 2002; Juul-Pedersen et al., 2015). Water mass characteristics are determined by the strength and mixing of two currents, the warm saline Irminger Current and colder, fresher East Greenland current (Myers et al., 2007). Icebergs scour the seabed to maximum depth of 600 m and deposit terrigenous sediments and dropstones (Gutt, 2002; Streuff et al., 2017). The diversity of topographic features and oceanographic influences results in diversity and heterogeneity of benthic communities (Gougeon et al., 2017).
Since 2011, benthic camera surveys (∼30–1,500 m) have been used to map habitats and quantify trawling impacts in west Greenland, employing a drop camera (Yesson et al., 2015, 2017; Gougeon et al., 2017) and benthic video sled from 2017. The benthic video sled was deployed during two RV Sanna research cruises in October 2018 and May 2019, dedicated to the Toqqusaq Bank area. Video imagery from these cruises and a smaller number of video stations obtained opportunistically on other cruises were reviewed. This highlighted that a subset of stations appeared to show structurally complex habitats with higher densities of cauliflower corals, VME indicator taxa and other structure forming taxa than had been observed elsewhere. Constraints prevent a comprehensive characterization of all the habitats in this area using all available imagery. Instead the focus is on producing a quantitative description of the habitats in a subset of stations where the review highlighted notable structural complexity created by benthic macrofauna. This subset of stations selected during the review (n = 18), are at depths from 274 to 585 m, on the continental slope on the western edge of the Toqqusaq Bank, in Greenlandic waters (NAFO Areas 1C + D) (Figure 1).
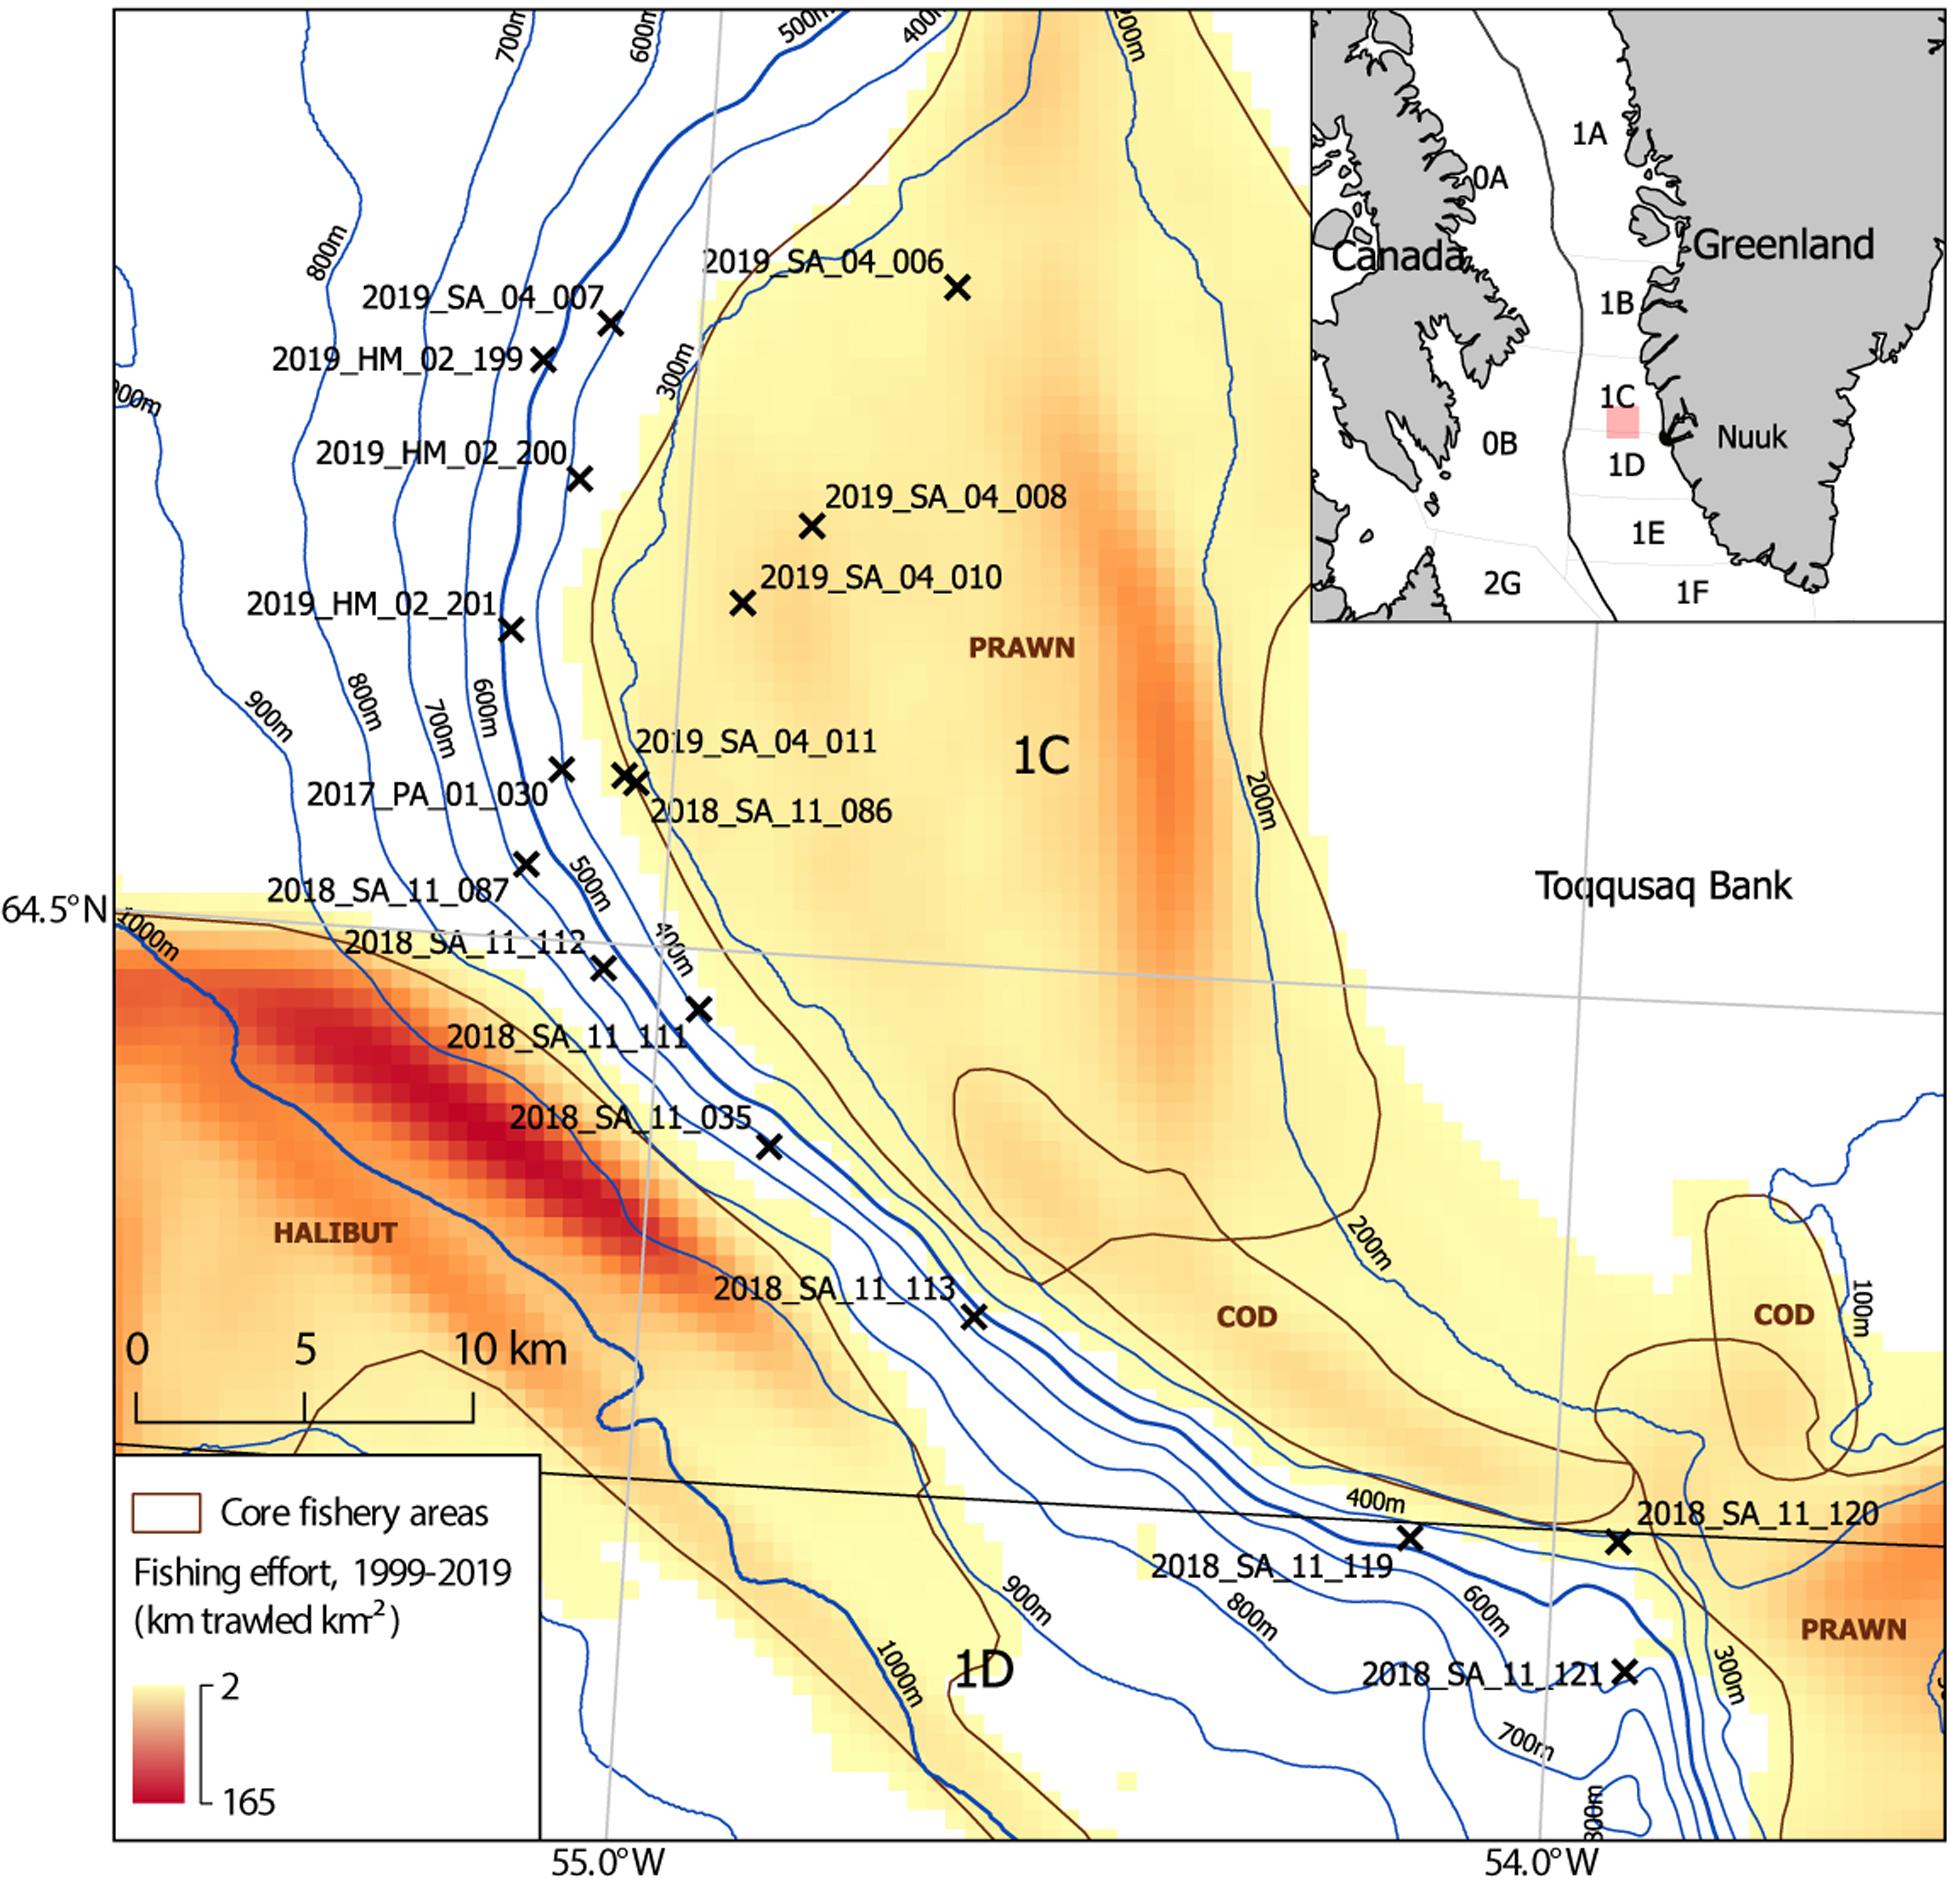
Figure 1. Map of study site showing the location of benthic video sled survey stations (n = 18), on the continental slope of the Toqqusaq Bank, west Greenland. NAFO Divisions are indicated. Video sled stations (X) are drawn at the ship’s position at the middle of each tow. The video sled station name indicates the year, vessel, cruise number, and station number (Year_Ship_Leg_Station number). The two letter ship codes indicate the RV Paamiut (PA), RV Sanna (SA), or MT Helga Maria (HM). Fishing effort is based on haul by haul logbook data from 1999 to 2019, used to determine the distance trawled per unit area (km trawled km–2). The core target areas of halibut, prawn and cod trawling effort are annotated (brown), based on visual review of the effort dataset. This is intended to be indicative.
The study area sits directly between two Marine Stewardship Council (MSC) certified deep-sea trawl fisheries. Namely, the West Greenland Offshore Greenland Halibut Fishery (800–1,500 m) (Cappell et al., 2017) and the West Greenland Coldwater Prawn Fishery, which targets areas on the continental shelf and slope (200–500 m) (Cappell et al., 2018; Figure 1). In the southern part of the study area there has been additional fishing pressure from an emerging cod (Gadus morhua) fishery. Following collapse of the west Greenland offshore cod fishery in the early 1990s, a management plan introduced a closure in 2014 to allow recovery. This was overturned and a Total Allowable Catch (TAC) of 5,000 tonnes was set for 2015–2018, inclusive (ICES, 2019b). In 2018, 4,187 t was landed by trawlers (61%) and longliners (39%), half of which (2,666 t) was from NAFO 1C/D (ICES, 2019a), with the main fishing grounds being the Toqqusaq Bank, at the top of the slope (∼200–300 m) centered on the NAFO 1C/D boundary (Figure 1; ICES, 2019b).
Benthic Video Sled
Imagery from 14 stations sampled with RV Sanna (SA, 2018–2019) was supplemented with a single station from RV Paamiut (PA, 2017) and three stations from MT Helga Maria (HM, 2019). All stations were sampled between May and October. Imagery was collected using a towed benthic video sled with an oblique angled centrally mounted video camera, lights, scaling lasers and an echo sounder unit. Illumination was provided by two Group-Binc Nautilux 1,750 m LED torches arranged either side of the camera and angled inwards to achieve as close to even illumination as possible. A pair of green Z-Bolt lasers (wavelength = 515 nm) in custom-made housings, were positioned 20 cm apart directly below the camera to provide an indication of scale. The position of the sled relative to the seafloor was monitored from the bridge using a Marport Trawl Eye Explorer (echo sounder unit) fixed to the top of the sled, which reported the depth (± 0.1 m), pitch and roll of the sled. Once the sled had made bottom contact it was towed at a target speed of 0.8–1 knots for a minimum of 15 min and up to 45 min. Longer tow times were used where time allowed, or to ensure adequate footage was obtained when there were potential issues (e.g. rough sea) during deployment.
Video was collected using a GoPro action camera in Group-Binc housings, which have a flat acrylic port. A GoPro4 recording 1,920 × 1,080 pixels at 48 frames per second (fps) was used in 2017, in a Group-Binc Scout housing. Subsequently, a GoPro5 was used, recording at the same aspect ratio (16 × 9) but higher resolution of 2,704 × 1,520 pixels at 60 fps, in a Group-Binc Benthic 3 housing.
The “Medium FOV” setting was used on both cameras. Per the manufacturer’s specifications this provides the same field of view (FOV), with vertical (αair) and horizontal (βair) aperture angles in air of 55 and 94.4°, respectively. Guided by the discussion in Treibitz et al. (2011), these were corrected for refraction according to Snell’s Law of refraction, which means it is necessary to correct for refraction by the bulk medium (seawater) but not the acrylic lens of the housing. This allows the vertical (α) and horizontal (β) aperture angles in seawater to be determined (Eqs. 1 and 2).
Where, r is the refractive index of seawater, for which a value of 1.34 was used based on the likely range of depth, temperature and salinity encountered in this study (Millard and Seaver, 1990). The calculated values were α = 40.3°, β = 66.4°.
Due to the oblique angle the very uppermost part of the image is difficult to interpret due to a lack of reflected light and taxa appearing smaller furthest from the camera. The distribution of all annotations made was reviewed, there were none in the top hundredth of the image. Excluding this unannotated area reduces the likelihood of artificially underestimating faunal density. Thus the area of seafloor in the annotated FOV is calculated for JBDK, a subset of ABDE, where length JB is 0.99 of the length AB (Figure 2).
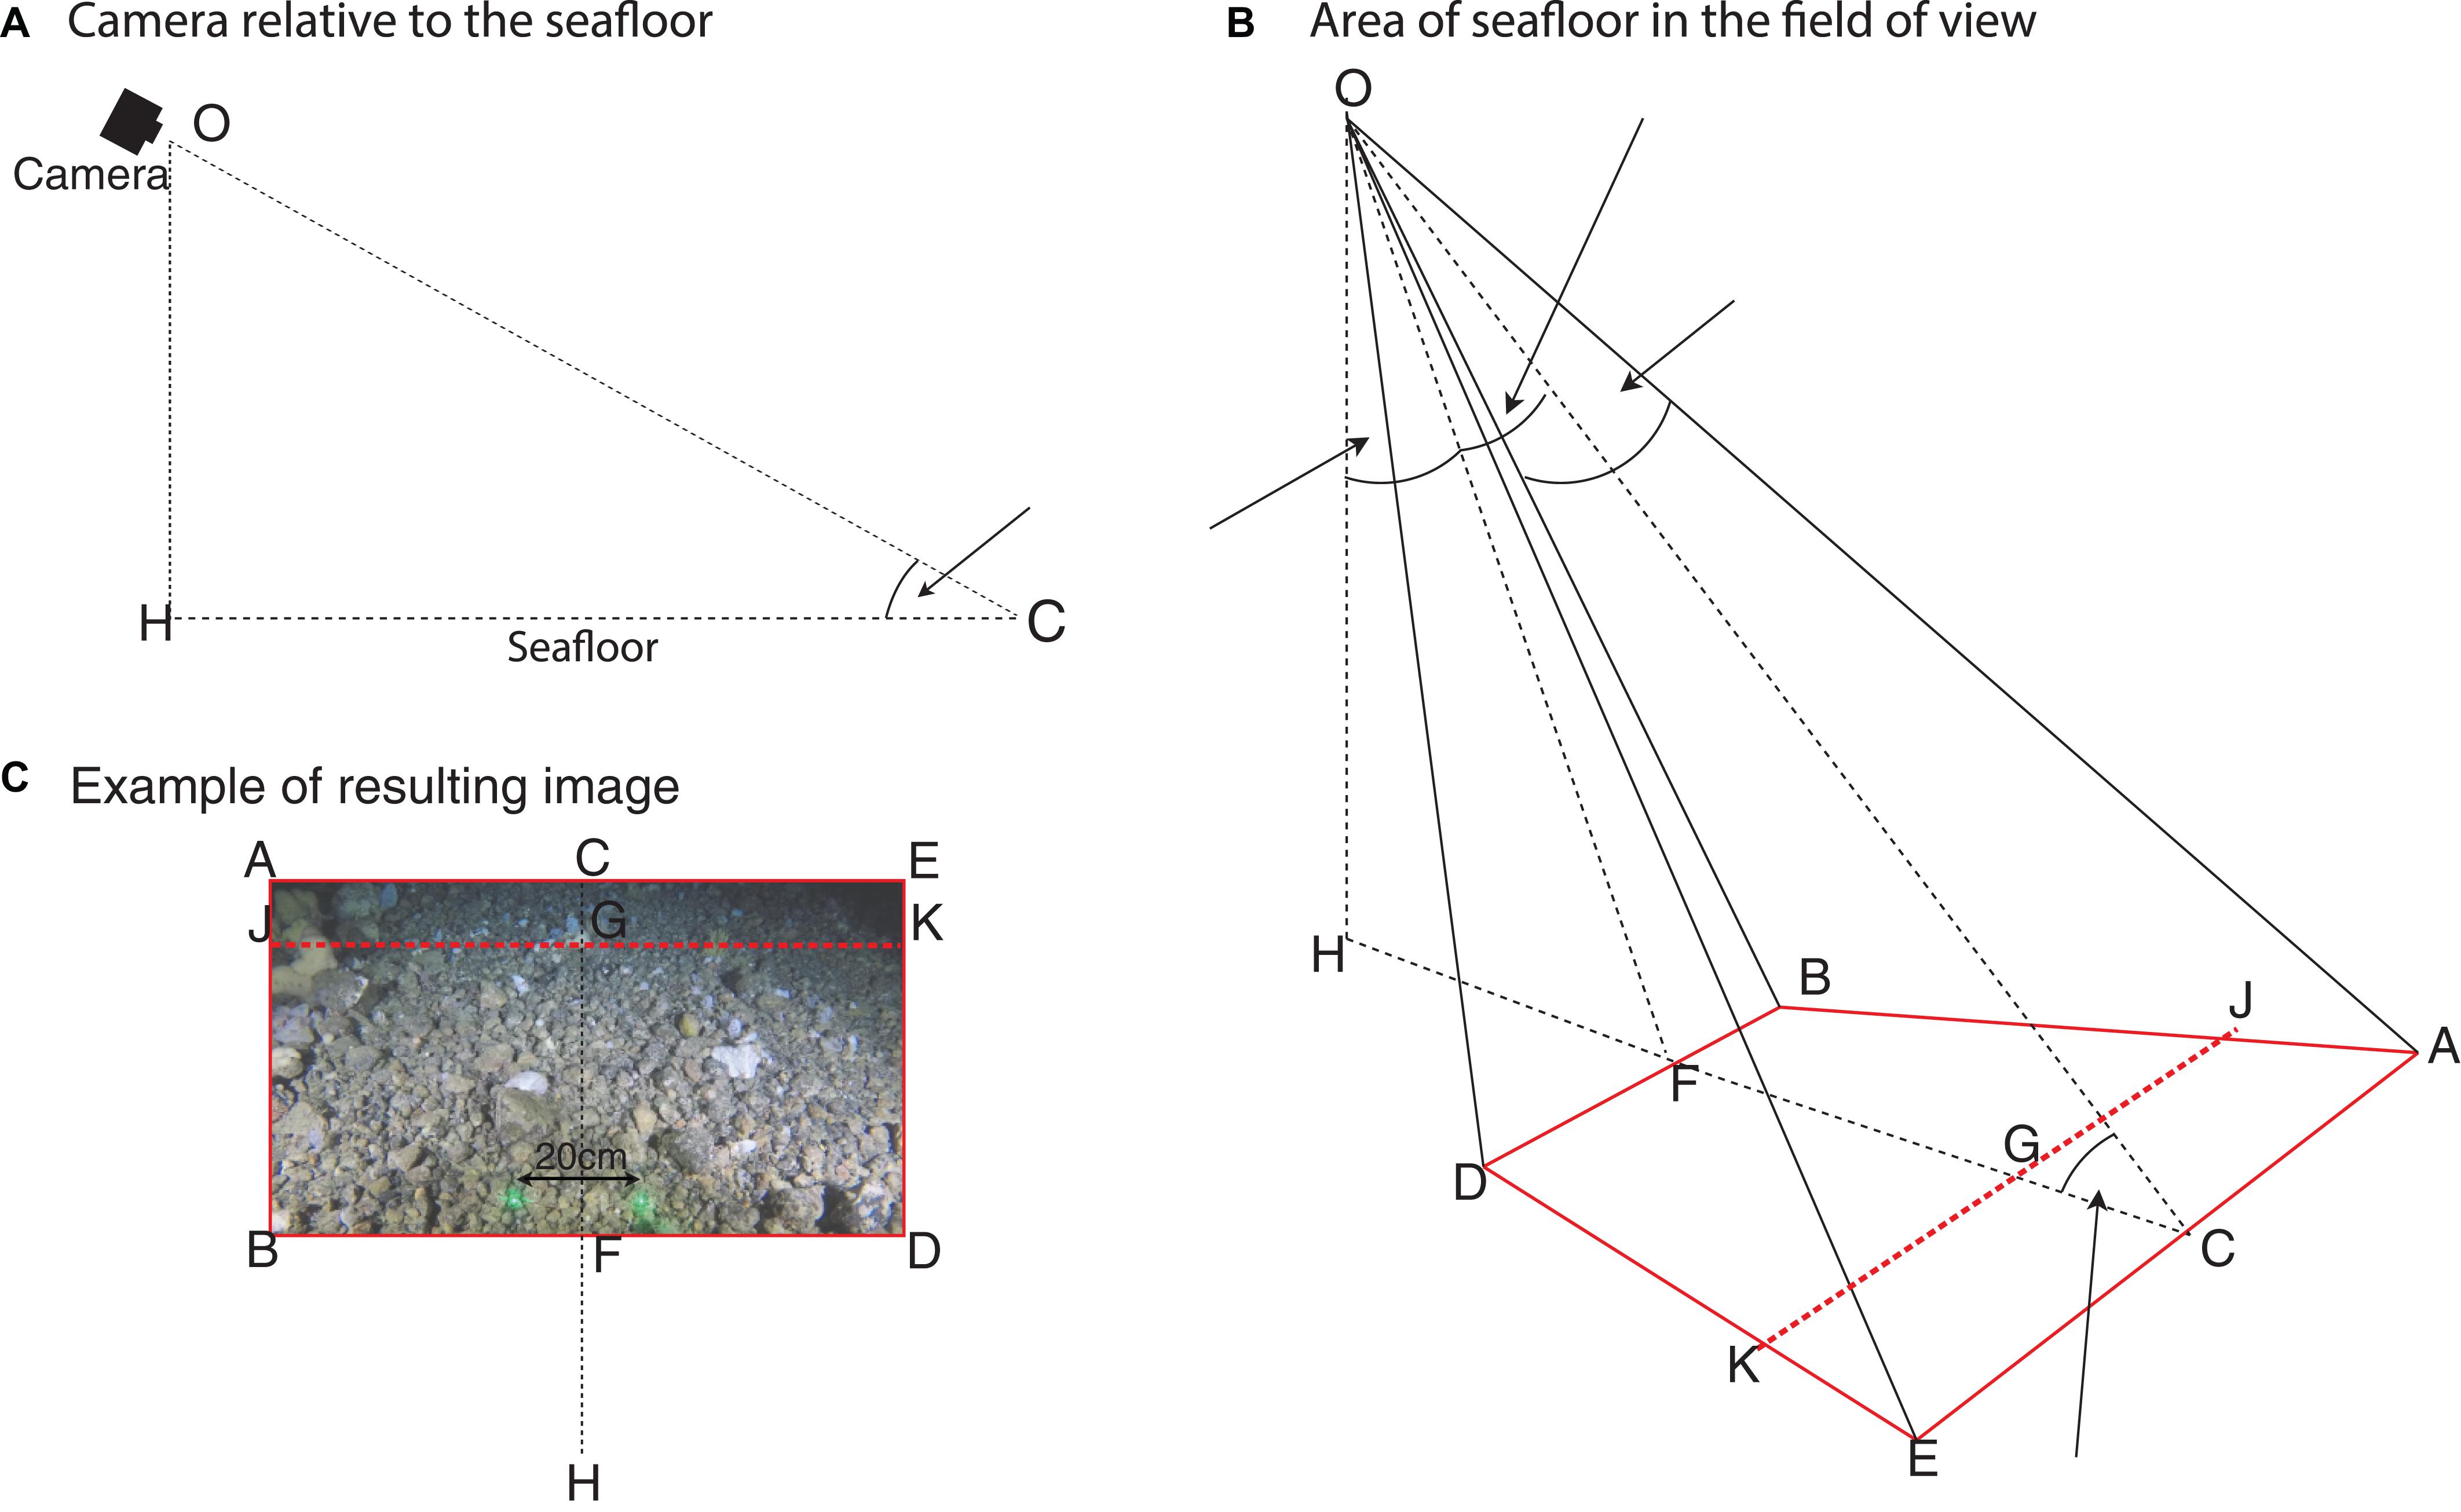
Figure 2. Diagrammatic representation of the benthic video sled camera for determining the area of the field of view. (A) Shows the camera orientation relative to the seafloor. (B) Shows the camera position, aperture angles and area of seafloor (ABDE) in the camera’s FOV (red line); with a cut-off line JK to exclude the portion of the image unsuitable for analysis (red dashed line). (C) Shows an example image of the seafloor, in relation to (A,B), for which the area JBDK is calculated and used in the estimation of fauna density. Adapted from: Nakajima et al. (2014).
The method described by Nakajima et al. (2014) is modified to allow the estimation of the area JBDK (Eqs. 3–8).
Where, OH the height of the camera was 0.55 m, θ the angle of incidence with the seafloor was 28.8° and the aperture angles (α and β) are determined as above (Eqs. 1 and 2). The area of seafloor analyzed in each image (JBDK) was estimated to be 8.23 m2. This value is used throughout for estimating densities of taxa.
Image Processing
Extraction of Images
Quantitative analysis was conducted on still images extracted from videos. All footage was reviewed and useable video segments identified, excluding segments where: (i) suspended sediment or other material obscured > 5% of the screen; (ii) illumination was inadequate due to one or more torches being partially or wholly obscured; (iii) the sled was not level and on the seabed; (iv) the sled was stationary; or (iv) the sled was moving too fast, which occurs at the end of tow when the winch is being used to retrieve the sled. Stills were extracted at 15 s intervals, from the useable segments. At each 15 s interval the frame with the sharpest focus within that second of video was selected, where 1 s of video was represented by 48 frames (GoPro4) or 60 frames (GoPro5).
The frame with sharpest focus was that with the highest value of standard deviation based on the Laplacian Convolution Kernal of a grayscaled version of each frame, determined using the “convolve” function of the R package “imager” (R Core Team, 2013; Barthelmé, 2017). Convolution kernels are an established way of measuring the focus of an image within a range of similar images (Riaz et al., 2008). The resulting stills were reviewed to ensure they met the criteria above, any exceptions were removed.
Processing of Images
The images were then uploaded to a browser based annotation platform, BioImage Indexing, Graphical Labeling and Exploration 2.0 (BIIGLE 2.0) (Ontrup et al., 2009; Langenkämper et al., 2017). The platform allows the creation of custom hierarchical label trees, which can be used to annotate features within images and/or be applied at the level of the image. A representative subset of the images was reviewed by the team to agree on a consistent approach to annotation. This was informed by previous experience of image and physical sampling surveys in the region. To ensure consistency a single member of the team made all primary annotations, for both fauna and substrate.
Fauna annotation
The nature of the imagery means not all fauna can be consistently seen and reliably identified. For example, small fauna closest to the camera (bottom of the image) may not necessarily be visible or identifiable at the back of the field of view (top of the image). Therefore, only taxa that could be consistently identified within and between images were selected for annotation and analysis. Additionally, annotation was restricted to those taxa that form structurally significant/complex components of the habitats and thus are of relevance to criteria (iv) of the FAO’s VME definition (FAO, 2009). To allow density estimation only taxa where discrete individuals or colonies could be identified were annotated. The taxa which met these conditions, are shown with reference to whether they are considered VME indicator taxa by Northwest Atlantic Fisheries Organization (NAFO) and NEAFC (Table 1).
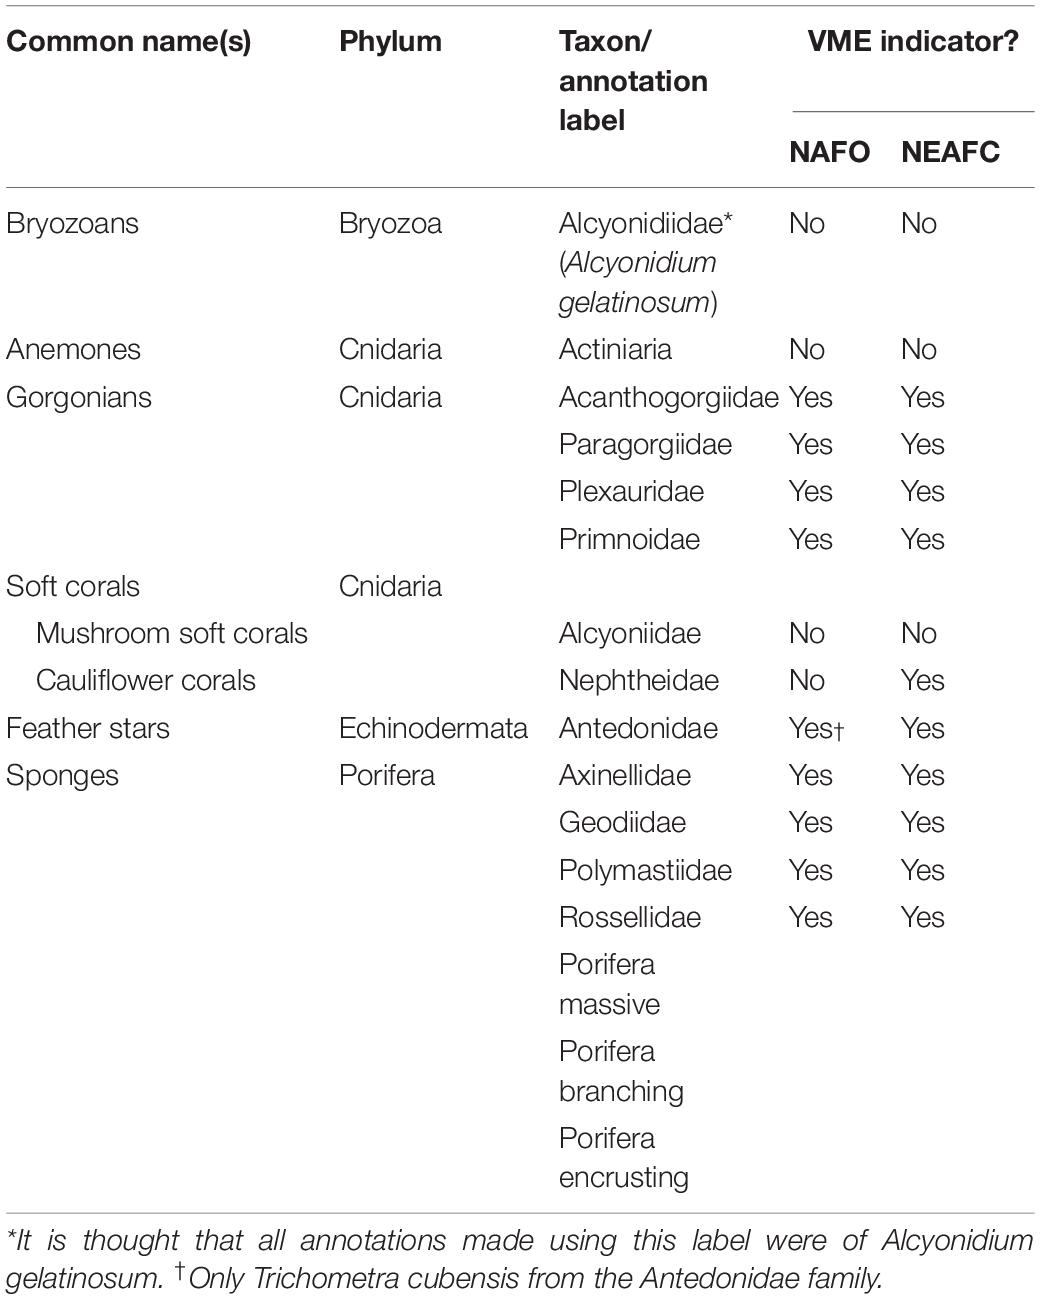
Table 1. Taxa selected for annotation in images. For each taxon NAFO (NAFO, 2012) and NEAFC (2014) guidance was consulted to determine if the taxa is considered a VME indicator.
When annotating each image the section of video that it was obtained from was reviewed alongside the image. A moving perspective was found to be useful in aiding identification of taxa and distinguishing individuals or differentiating between separate colonies.
Genera of Nephtheidae (sensu lato) found in west Greenland are Gersemia, Duva, Drifa, and Pseudodrifa (Jørgensen et al., 2013). The current taxonomy in the World Register of Marine Species (WoRMS) lists all these as belonging to the family Nephtheidae. Although the genus Gersemia is currently still formally placed in Nephtheidae, it is widely regarded as Alcyoniidae (McFadden et al., 2006; Williams, 2013). These genera are hard to distinguish from imagery (Buhl-Mortensen et al., 2019) and so throughout this study have been treated as Nephtheidae (sensu lato) and collectively referred to a cauliflower corals.
Substrate annotation
Substrates were determined by annotation at the level of the image. The revised EUNIS Habitat Classification (Davies et al., 2004), which includes deep-sea specific categories, was previously adapted by Gougeon et al. (2017) for classifying substrates in imagery from west Greenland. For the purpose of this study this is further modified with clarified descriptions (A6.1.4 and A6.2.1) and two new subclasses (A6.1.5 and A6.2.2). Only those sub-classes used in this study are described here (Table 2 and Figure 3).

Table 2. Substrate classes used to label images sampled from videos. Substrate classes are based on the revised EUNIS Habitat Classification (Davies et al., 2004), as adapted by Gougeon et al. (2017) and further modified here.
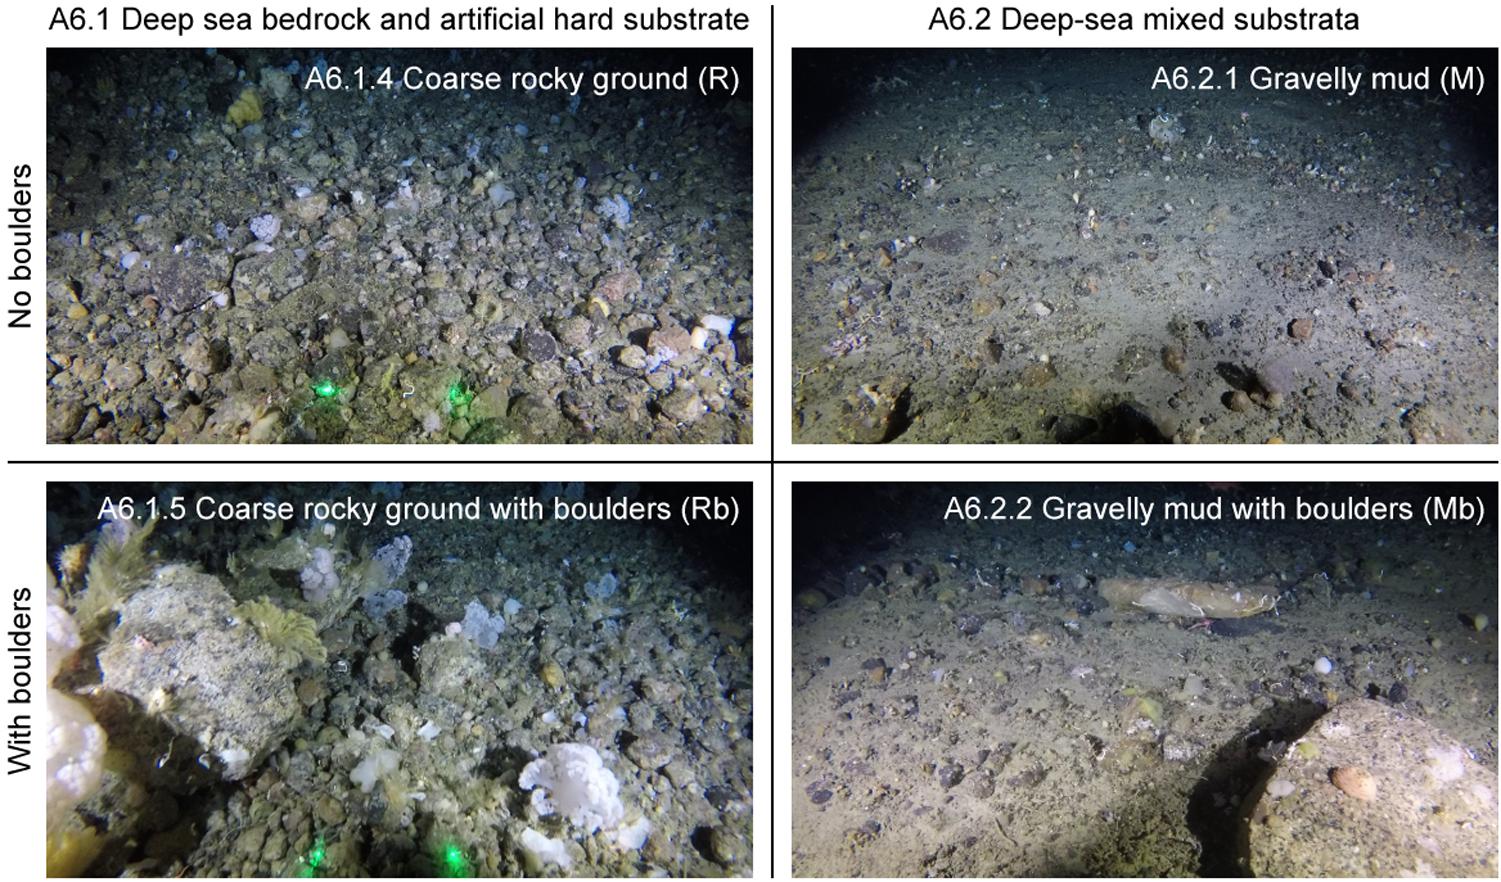
Figure 3. Example image of each type of substrate class used to label images sampled from videos. Substrate classes are based on the revised EUNIS Habitat Classification (Davies et al., 2004), as adapted by Gougeon et al. (2017) and further modified here. Examples are taken from images used in the analysis. Where present laser dots (green) are 20 cm apart.
Modeling
Data processing and analysis was performed in R (R Core Team, 2013). A probabilistic approach was used to determine whether the taxa selected for annotation were positively, negatively, or randomly associated with one another. The observed co-occurrence was compared to the expected co-occurrence where the latter is the product of the two species’ probability of occurrence multiplied by the number images (n = 1,239) (Veech, 2013). Associations were considered significant where the probability of the observed frequency of concurrence is < 0.05, were the taxa distributed independently of one another. This was performed using the “co-occur” package in R (Griffith et al., 2016).
Mapping
The BedMachine version 3, 150 m resolution bathymetry grid (Morlighem et al., 2017) was used to produce bathymetric contours in figures and for describing the boundary of the proposed VME.
Representation of fishing effort is based on haul-by-haul logbook data from the Greenland Fishery Licence Control (GFLK) from fisheries employing demersal trawl gear from 1999 to 2019, all species and vessels inclusive. Raw data from GFLK was processed and recalculated in SAS statistical software (SAS Institute, 2019) to establish an annual data set with information on the target species, gear type, position, haul distance, and speed. No information on gear width is available, so the transversal coverage of each haul is unknown. The data set was further processed using Safe FME Workbench software (Safe Software, 2019) to establish line vectors from start and end haul positions, removing displaced positions and unrealistic long and fast hauls. The line vectors representing the hauls were interpolated with Python using the ESRI Spatial Analyst Line Density function (ESRI, 2013) with a 5 km search radius to a 1 km grid, and the result hereof further calculated against a mask of the proportion of sea and land. The resulting raster represents the distance trawled per unit area (km trawled km–2).
Results
Station Data
A total of 18 video sled stations were selected from which 1,239 images were extracted for annotation (Table 3). This represents a total area analyzed of ∼10,000 m2.
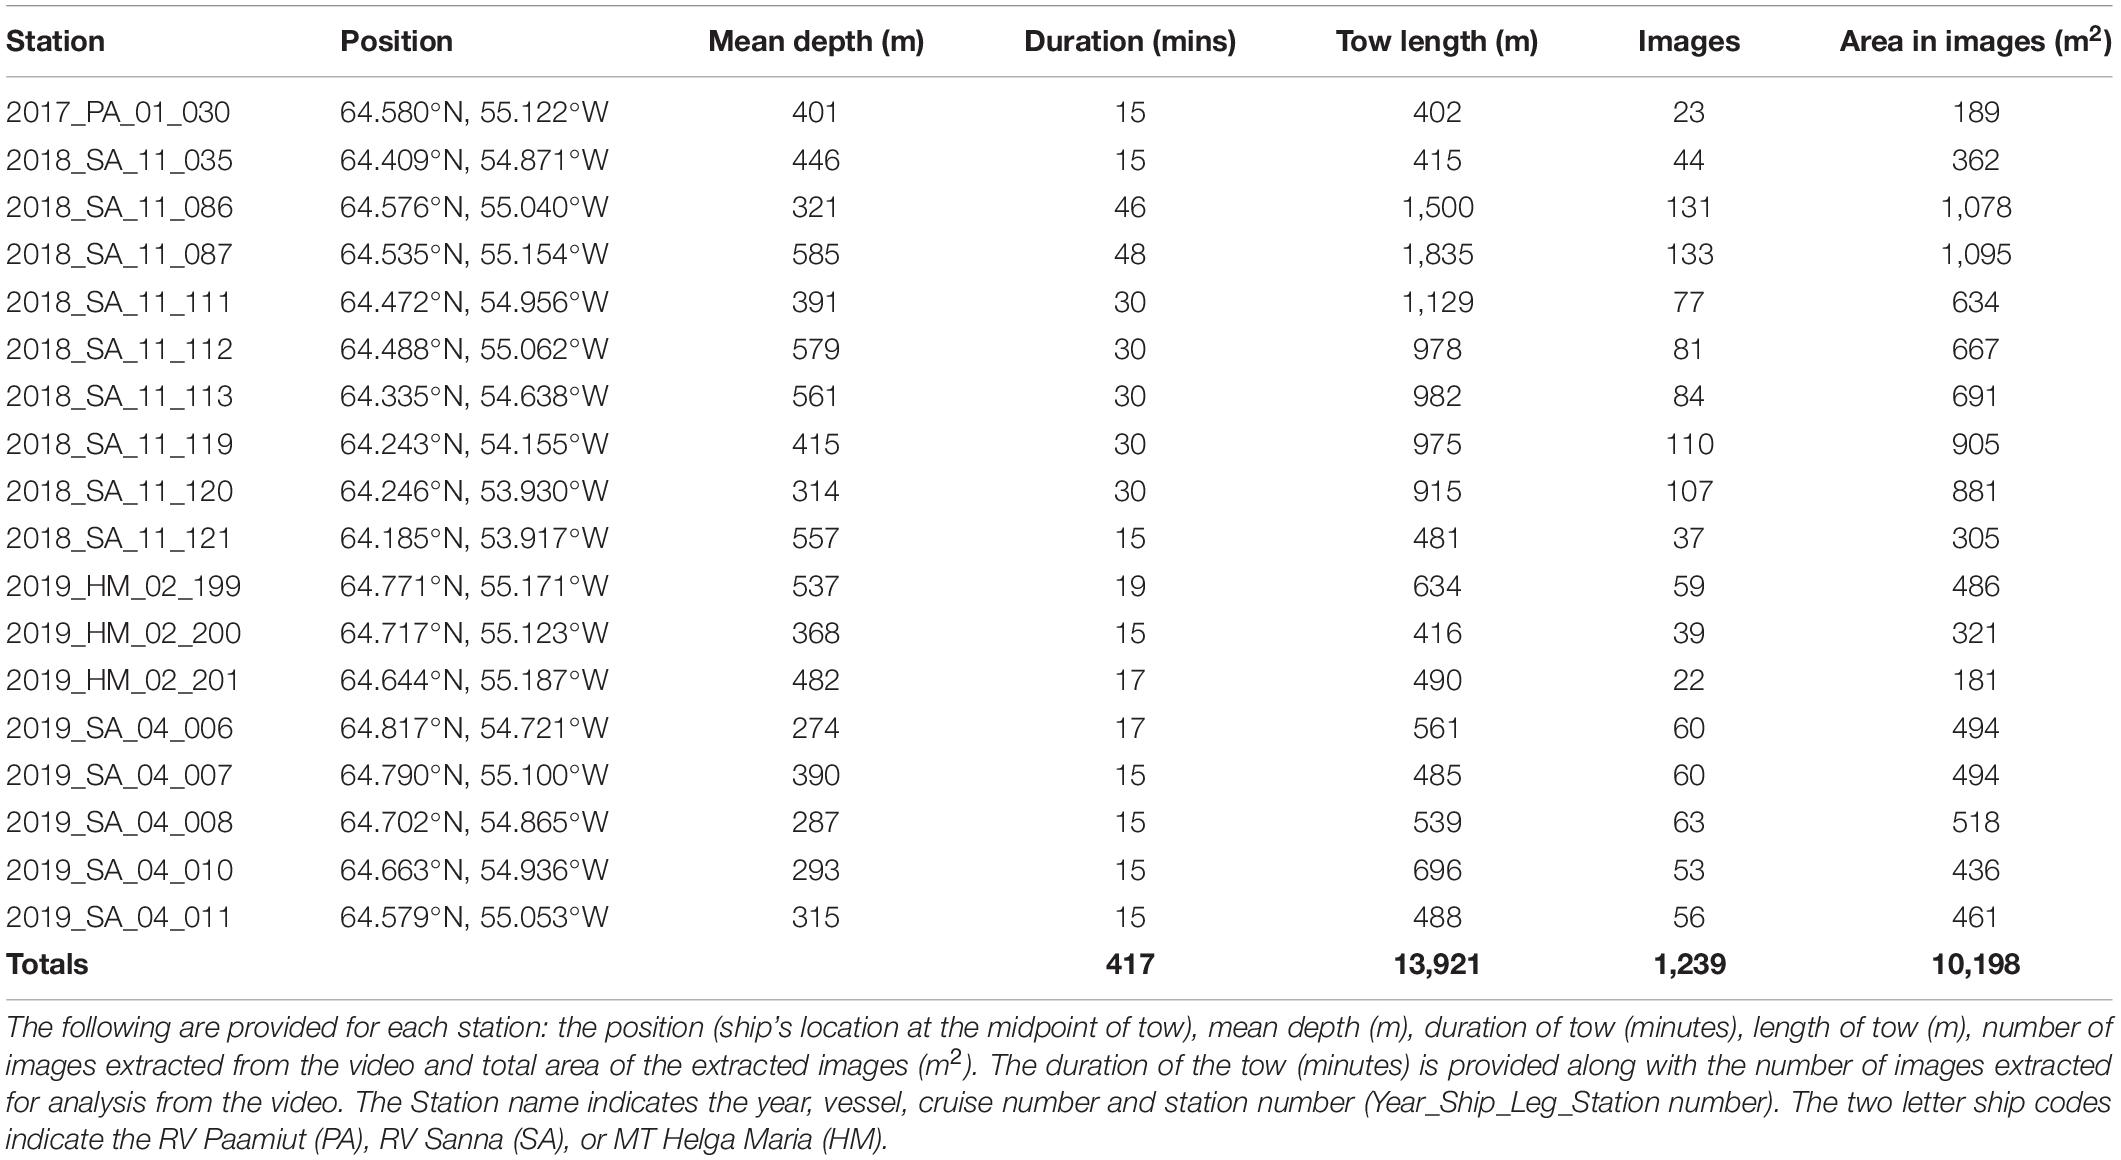
Table 3. List of stations where the benthic video sled was deployed on the continental slope of the Toqqusaq Bank, west Greenland.
Fauna Observations
A total of 44,035 annotations of the selected fauna were made. The most numerous annotations were anemones (15,531) and cauliflower corals (11,633). The anemones appeared to be predominantly Hormathiidae. The least frequent were gorgonians, with just 250 annotations of Acanthogorgiidae, Paragorgiidae, Plexauridae, and Primnoidae combined. The mean (Table 4), minimum and maximum (Table 5) densities of annotated taxa are shown for each station, aggregated to a parent label where appropriate. Cauliflower corals were the only coral present at all stations, with a maximum density of 9.36 m–2. The maximum density of any coral taxa was mushroom soft corals 13.37 m–2. The maximum density of any taxa was anemones 18.23 m–2.
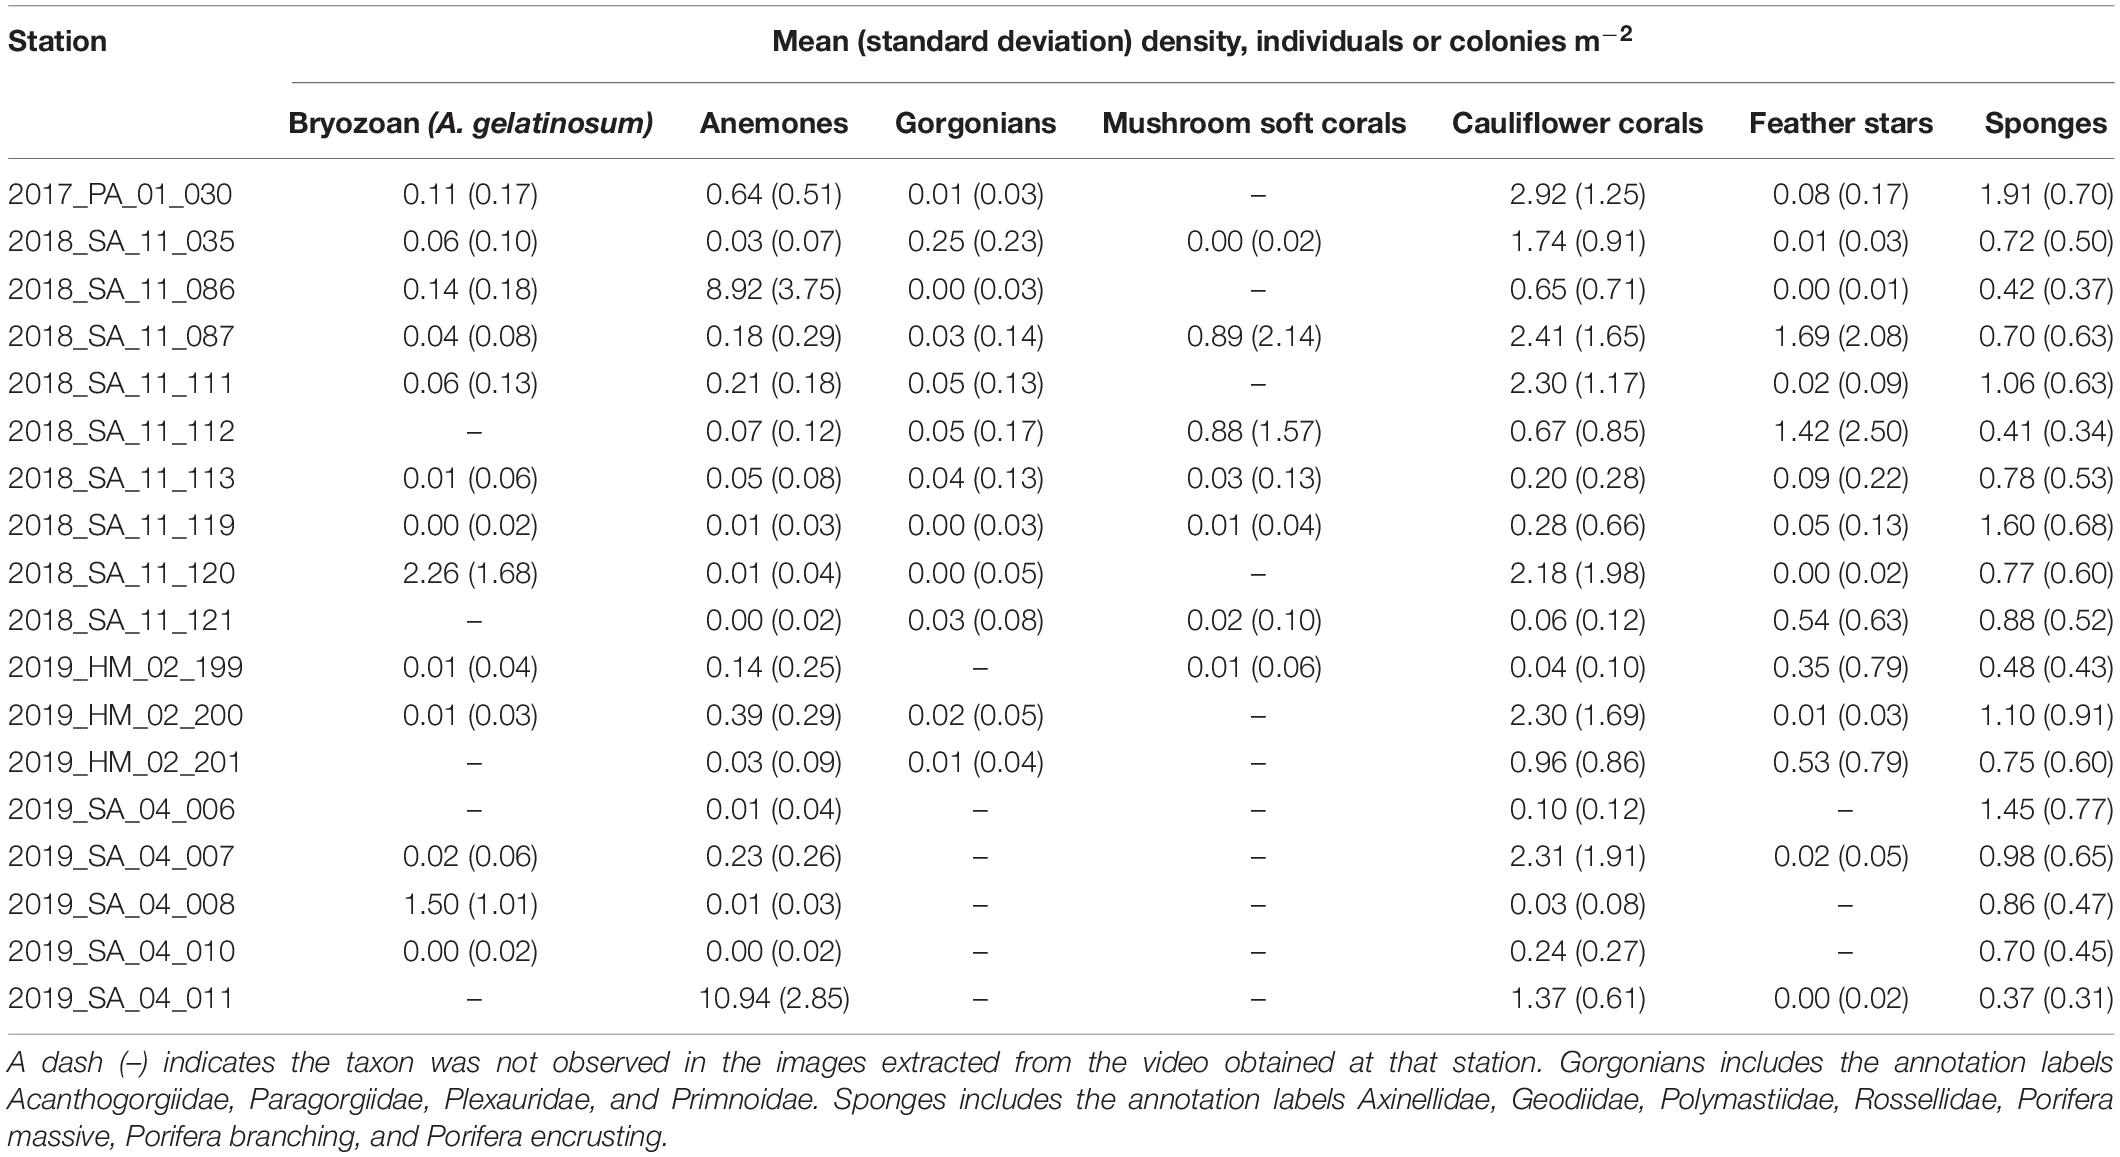
Table 4. Observed mean (standard deviation) densities (individuals or colonies m–2) of taxa at each station, based on the number of annotations from all images for each station, adjusted for the area of the field of view in the images (8.23 m2).
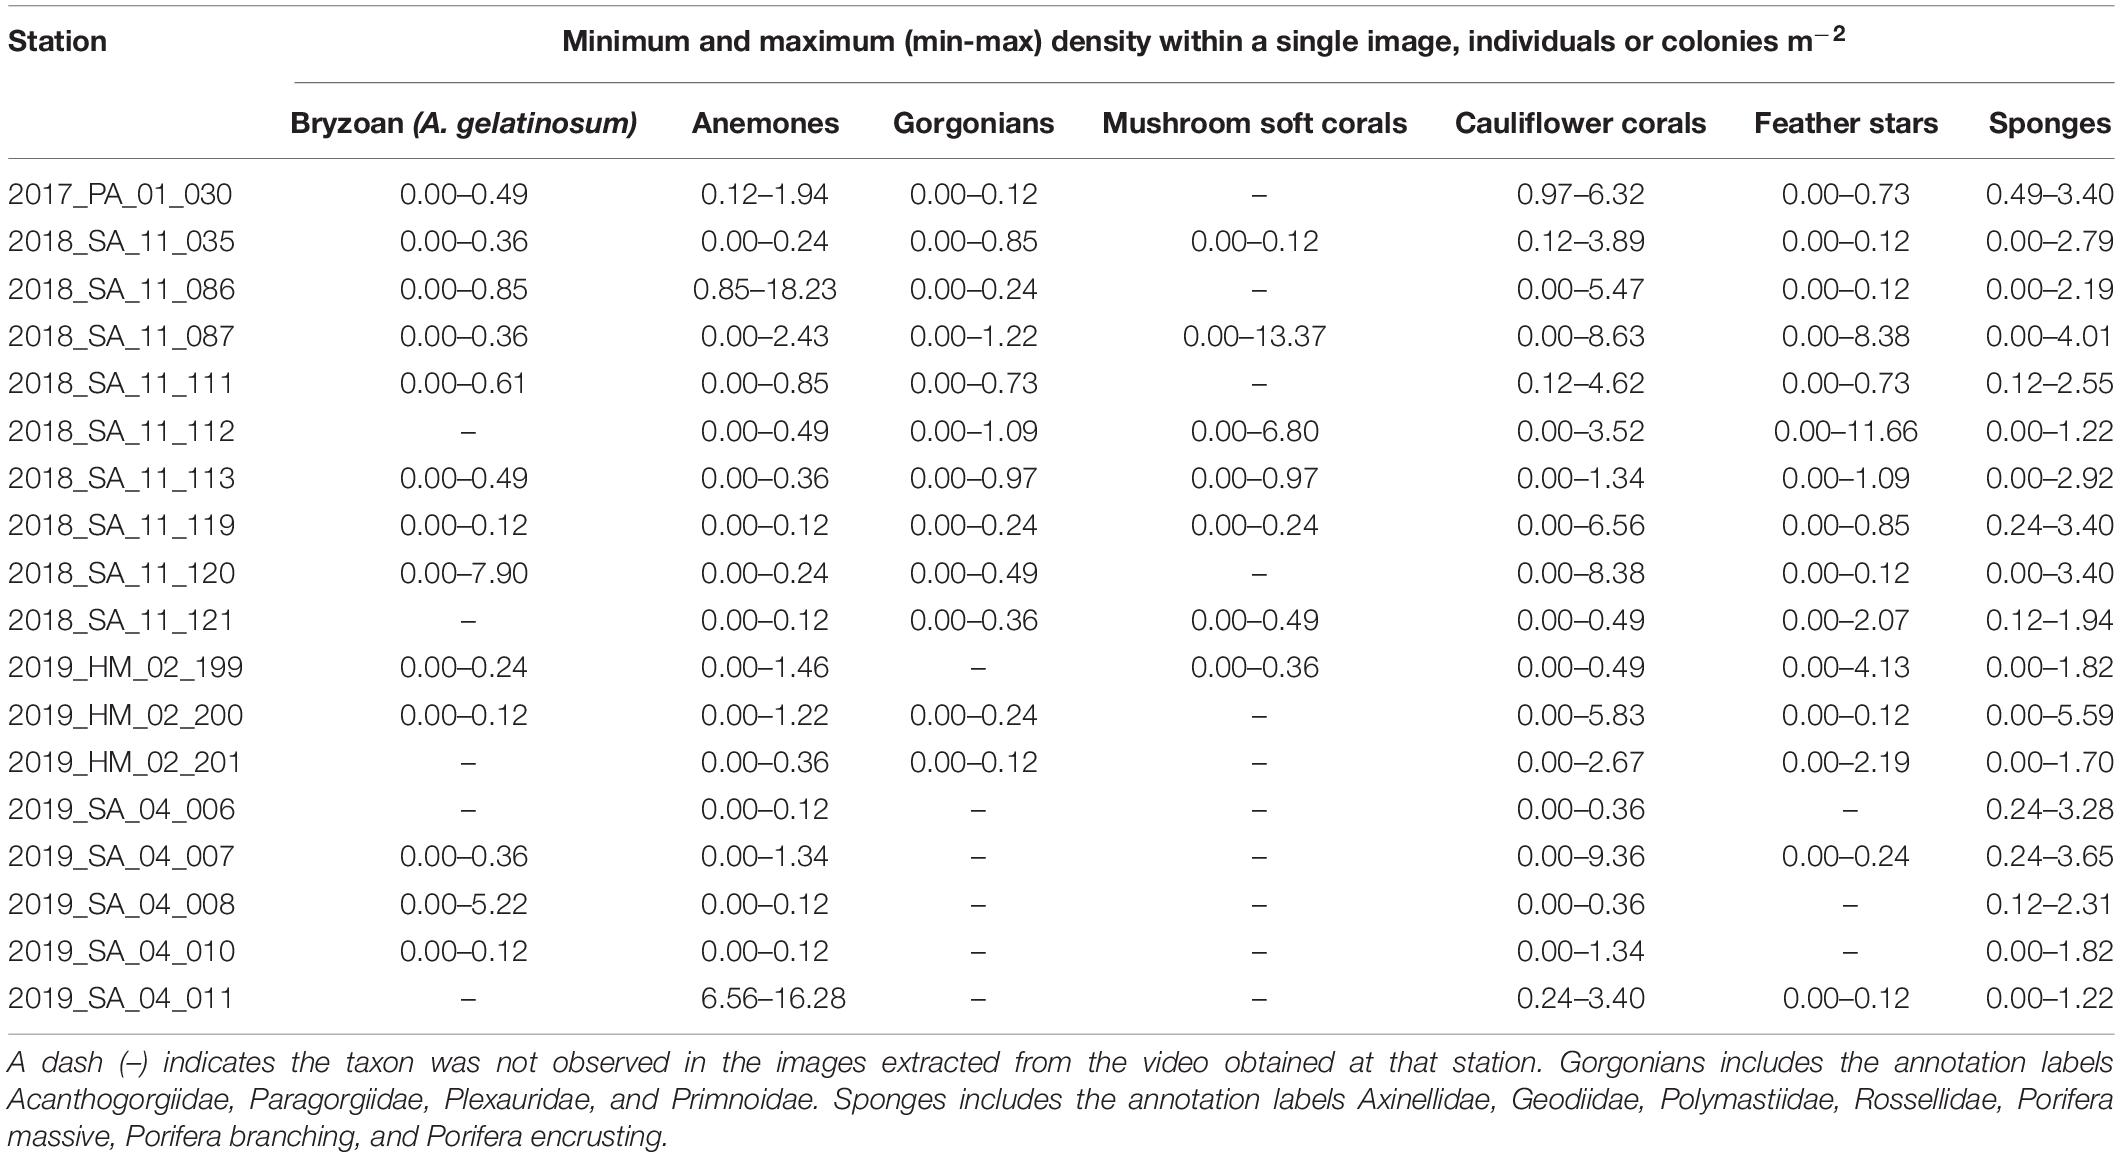
Table 5. The minimum and maximum (min-max) densities (individuals or colonies m–2) of taxa observed within a single image for each station, based on the number of annotations adjusted for the area of the field of view in the image (8.23 m2).
There were a number of different distinct assemblages, often characterized by a high density of one particular taxon. Examples of the differing assemblages showing high densities of particular taxa are shown (Figure 4). Assemblages dominated by cauliflower corals on rocky substrates, with and without boulders, up to a maximum density of 9.36 m–2 (Figure 4A), were seen at multiple stations, with varying densities of feather stars, anemones and sponges also present. In some cases a similar assemblage was seen, in terms of species composition but instead dominated by high densities of anemones (Figure 4B), feather stars (Figure 4C), and sponges (Figure 4D). Patches dominated by mushroom soft corals, with other megafauna absent or occasional, were observed on rocky ground, where the substrate was largely homogenous gravel (< 4 cm) (Figure 4E). This assemblage was common in images from stations 2018_SA_11_087 and 2018_SA_11_112, with a maximum observed mushroom soft coral density of 13.37 m–2 (Table 5). Assemblages dominated by the bryozoan Alcyonidium gelatinosum, sometimes with sponges present were seen on both rocky and muddy substrates to a maximum density of 7.90 A. gelatinosum m–2 (Figure 4F).
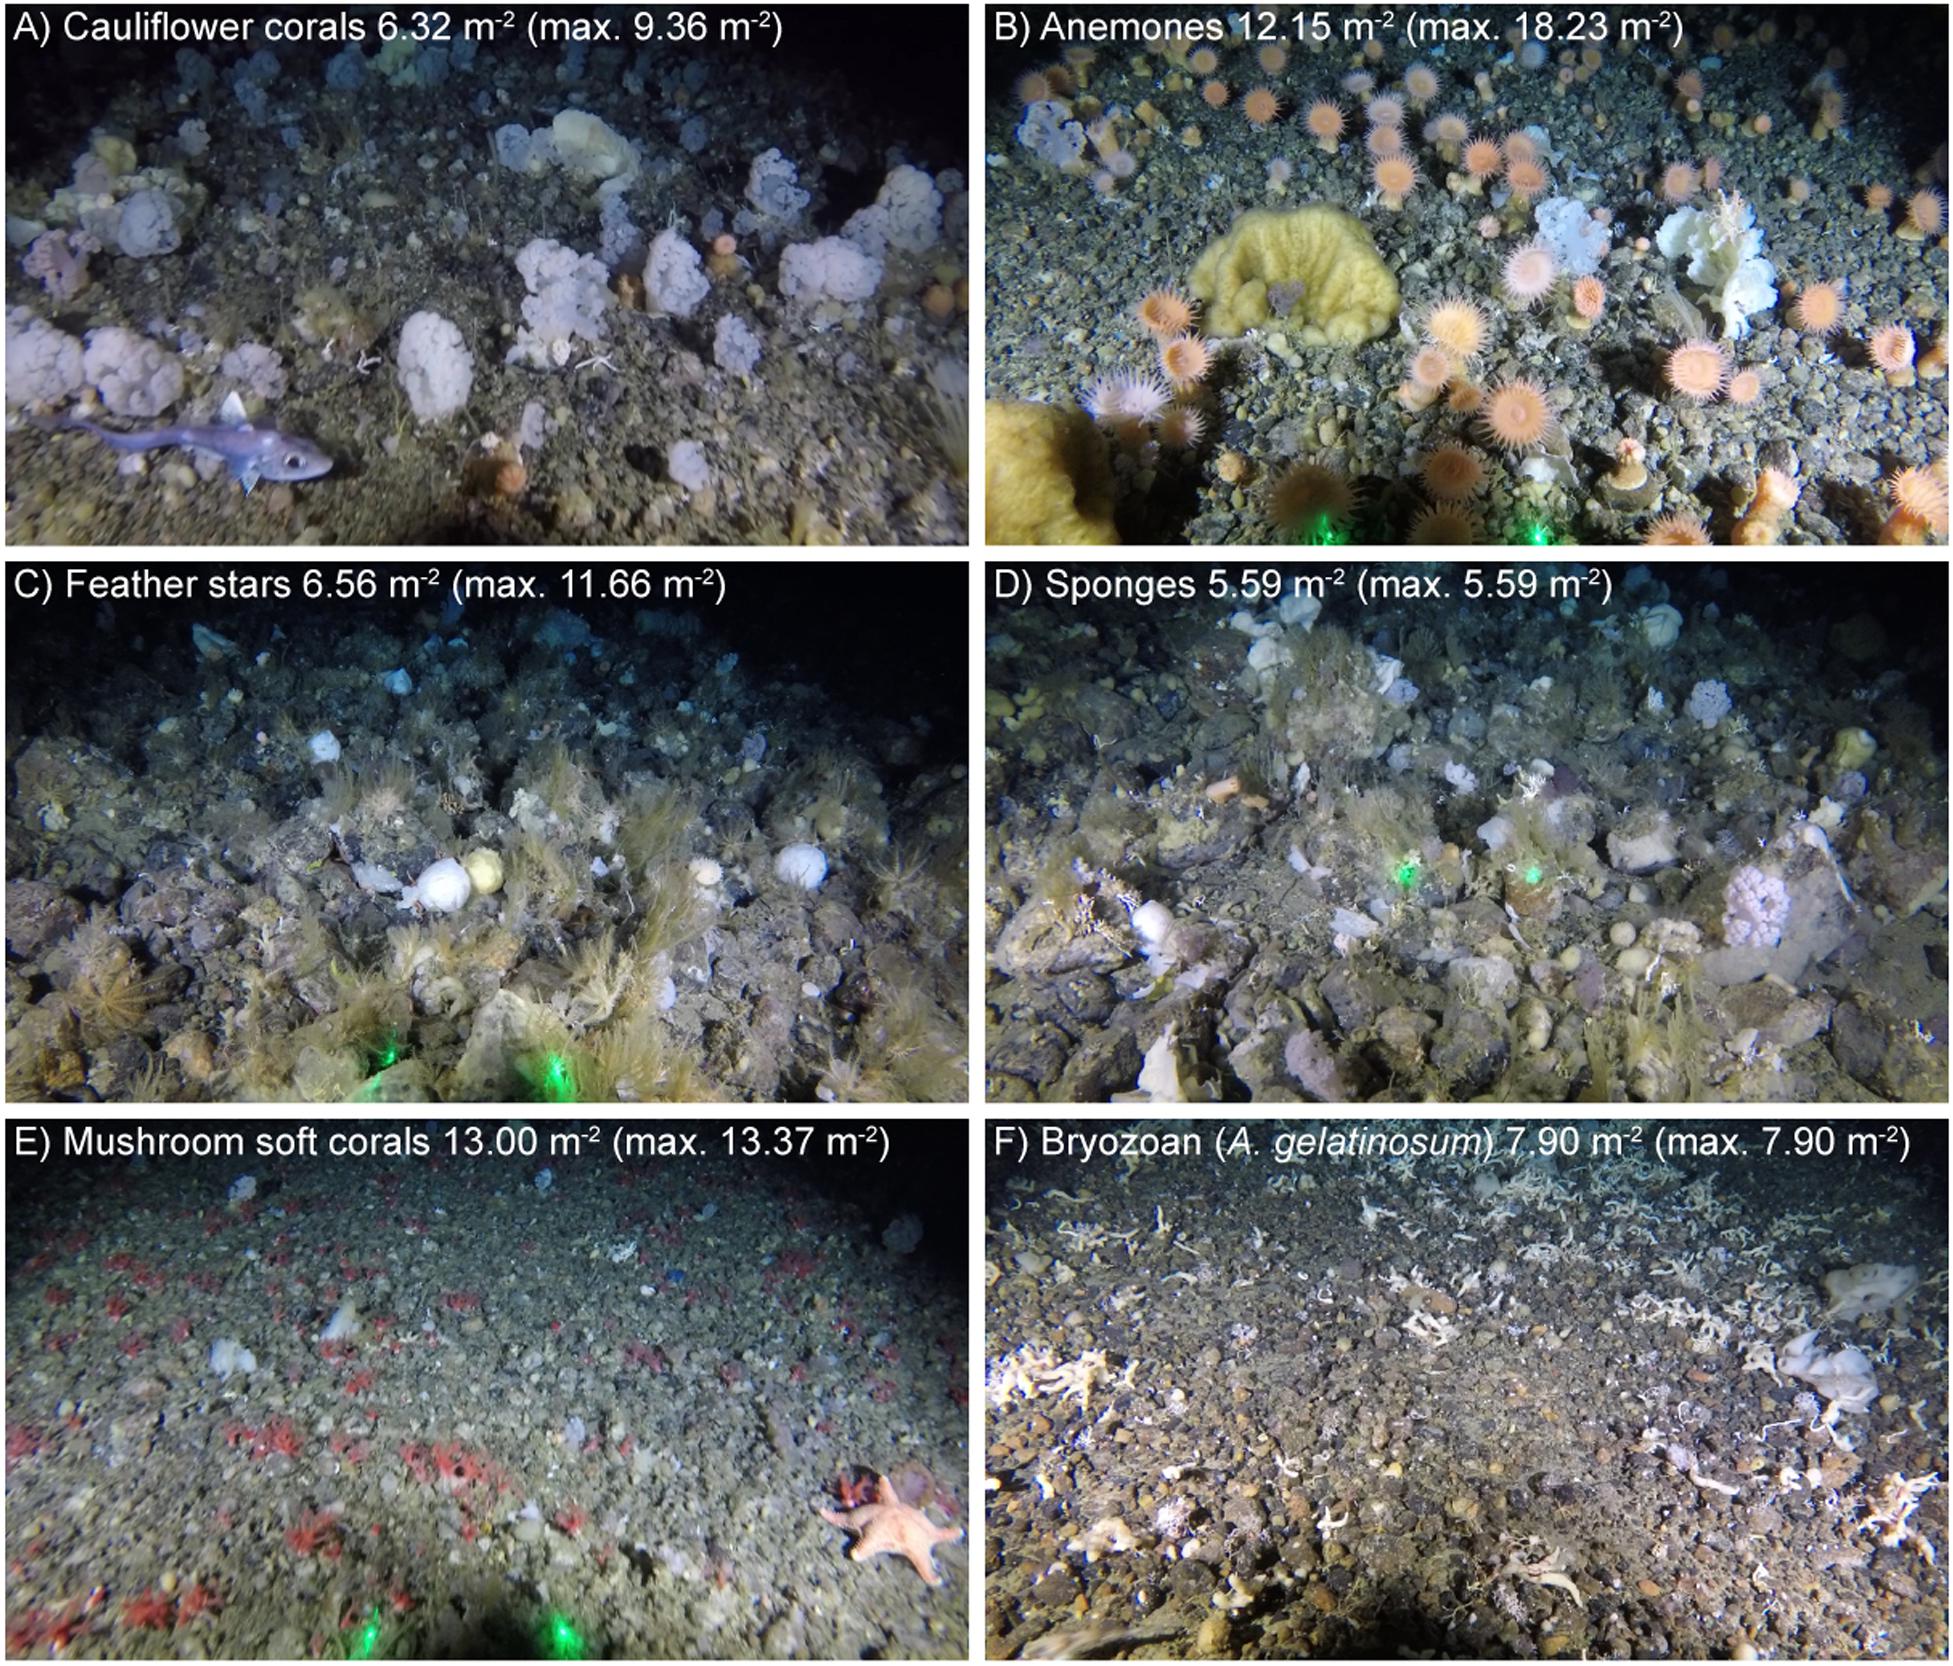
Figure 4. Examples of different assemblages with high density of: (A) Cauliflower corals; (B) Anemones; (C) Feather stars; (D) Sponges; (E) Mushroom soft corals; and (F) Bryozoan (A. gelatinosum). Images were selected for illustrative clarity. The density of the highlighted taxa within each image is reported (along with the maximum observed density in all images for reference). Where present, laser dots (green) are 20 cm apart.
There was considerable heterogeneity in the abundance and composition both within and between stations (Tables 4, 5 and Figure 5). Cauliflower corals, anemones, and sponges were present at all stations, whilst the bryozoan A. gelatinosum, gorgonians, feather stars and mushroom soft corals were not observed at all stations. Comparing those stations where taxa were present, the mean density varied by at least an order of magnitude in each taxon, with the exception of sponges whose density was more evenly distributed (Table 4). There was also considerable variation in densities within stations demonstrated by the range in minimum and maximum values (Table 5). This indicates an inherent patchiness, which is illustrated by visualizing data from 2018_SA_11_087 (Figure 5). Areas where the assemblage is dominated by cauliflower corals, feather stars and sponges (Figures 5A,C) are interspersed by patches of mushroom soft corals (Figure 5B) where other taxa are absent.
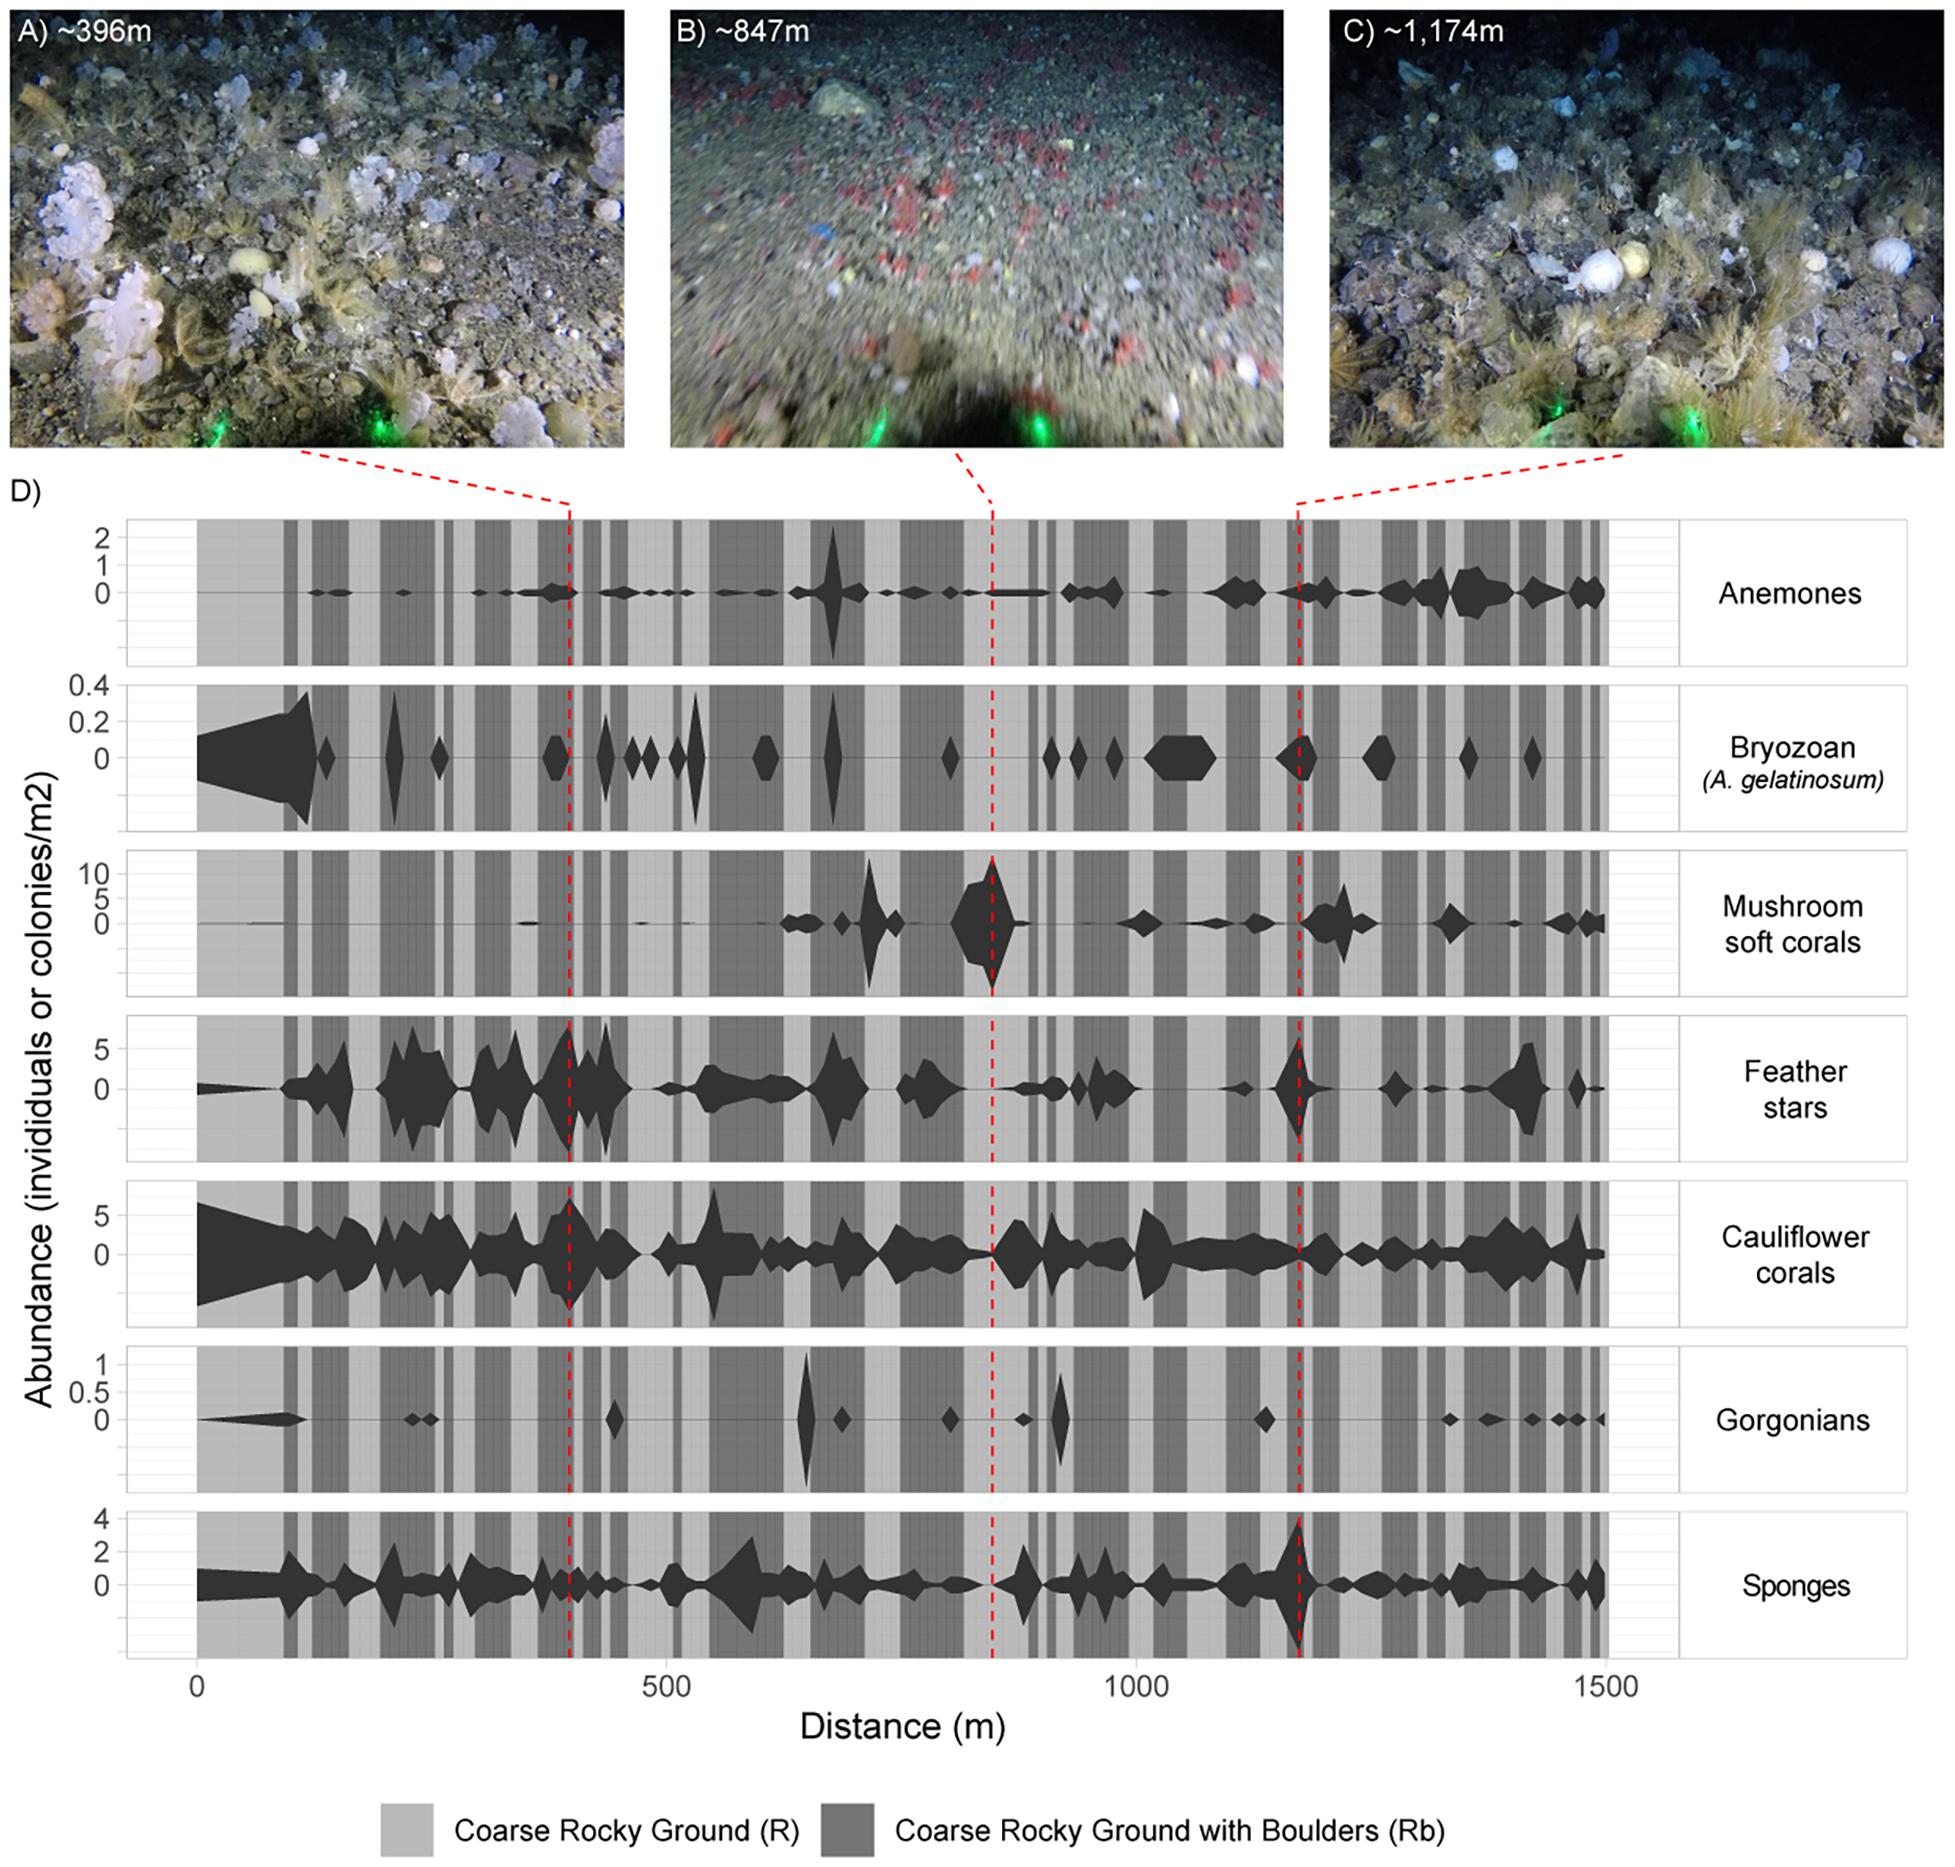
Figure 5. Kite diagram showing variation in faunal abundance and substrate across an example station (2018_SA_11_087), based on fauna and substrate annotations of images sampled from the video. The width of kite is determined by the observed abundance in the image sampled at that distance along the tow. Distance is based on the speed of the vessel and the time elapsed from touchdown. The background is shaded according to substrate observed in each image. Substrate type and faunal abundance is interpolated between images to produce an illustrative representation. The example images (A–C) are included to illustrate the variation across the station as described by (D). The left and right extremities of example images have been cropped and thus do not display the full field of view (FOV). Laser dots (green) are 20 cm apart.
Significant positive and negative associations between pairs of taxa were observed (Figure 6). Cauliflower corals were positively associated with feather stars, gorgonians and anemones, which was more positive associations than any other taxa. Co-occurrence of cauliflower corals with feather stars and anemones was readily apparent in the imagery (Figures 4A–D).
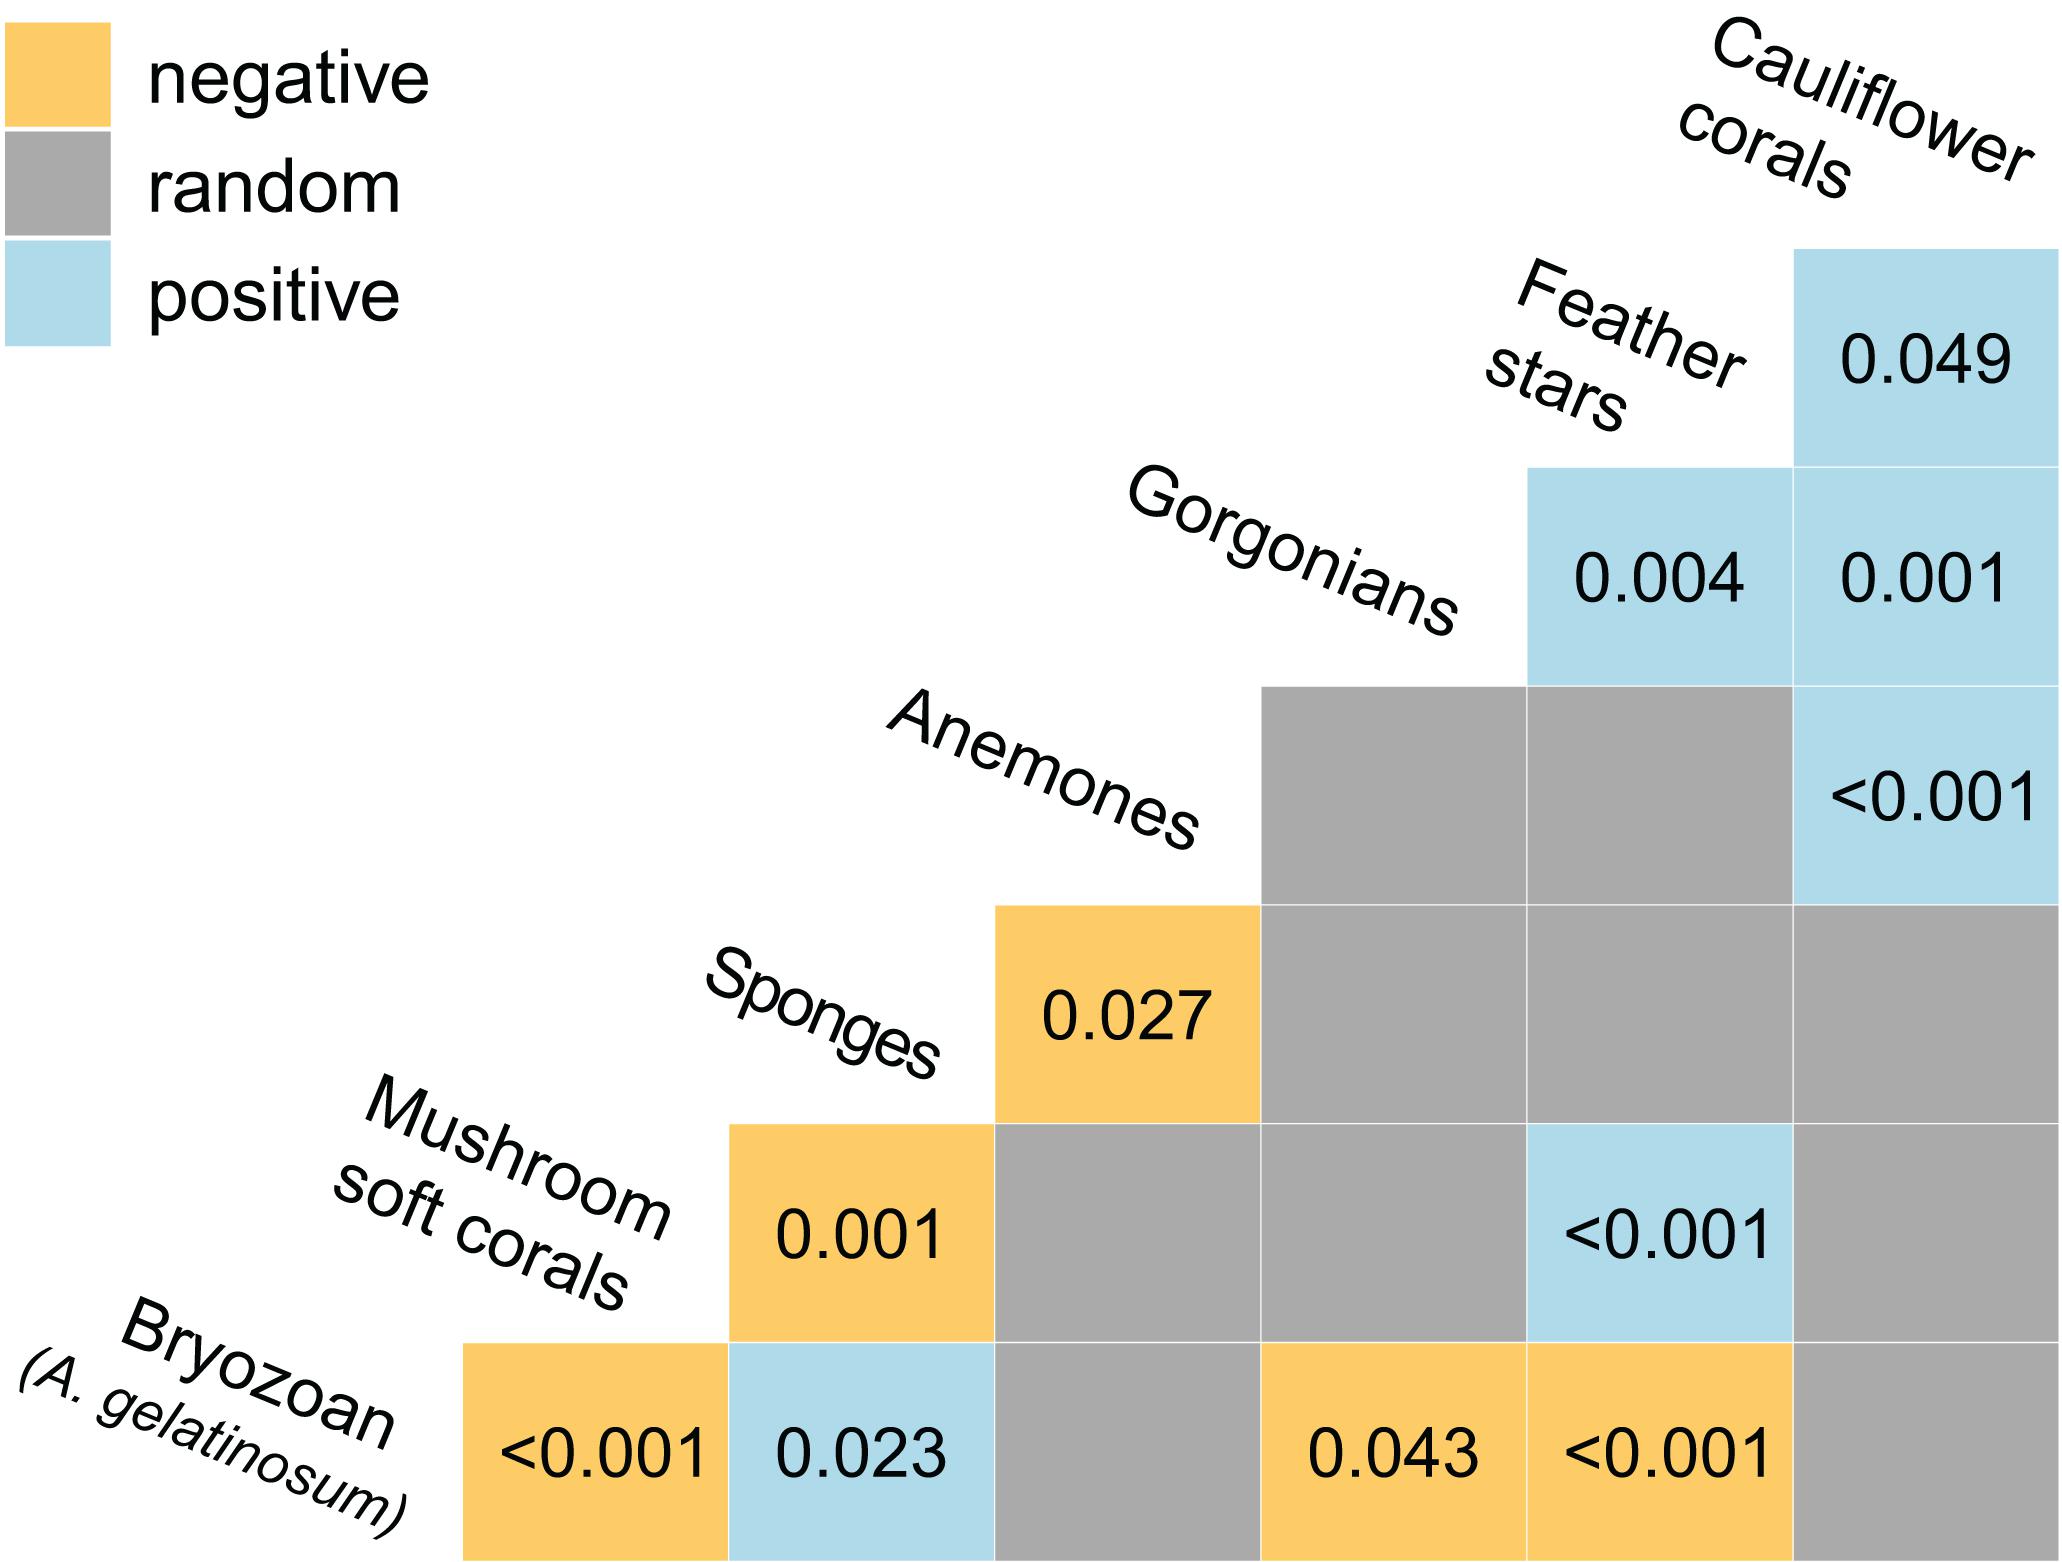
Figure 6. Heat map showing the positive and negative associations between taxa as determined by a probabilistic co-occurrence model (Veech, 2013). For each pair the observed frequency of co-occurrence within images (n = 1,239) is either, significantly large and greater than expected (positive association), significantly small and less than expected (negative association), or not significantly different and approximately equal to expected (random association). Associations are considered significant where the probability of the observed frequency of concurrence is < 0.05 were the taxa distributed independently of one another. P-values are provided for significant associations.
There were other taxa, which could not be consistently identified and/or annotated in the imagery, but contributed to the structural diversity of the habitats. They can be observed in some sections of video and where abundant clearly form a significant component of this habitat. Specifically this includes, calcified bryozoans, from the families Celleporidae, Flustridae, Horneridae, Myriaporidae, and Phidoloporidae, as well as hydrozoans from the families Aglaopheniidae and Sertulariidae.
Substrates
The dominant substrates were coarse rocky ground (R and Rb), with these being the only substrates identified in 11 of the stations (n = 18) (Figure 7). Conversely, gravelly mud substrates (gM and GMb) were the only substrates in just two of the stations. Boulders were present at all the stations (Figure 7), and were typically observed intermittently during the course of a tow (Figure 5).
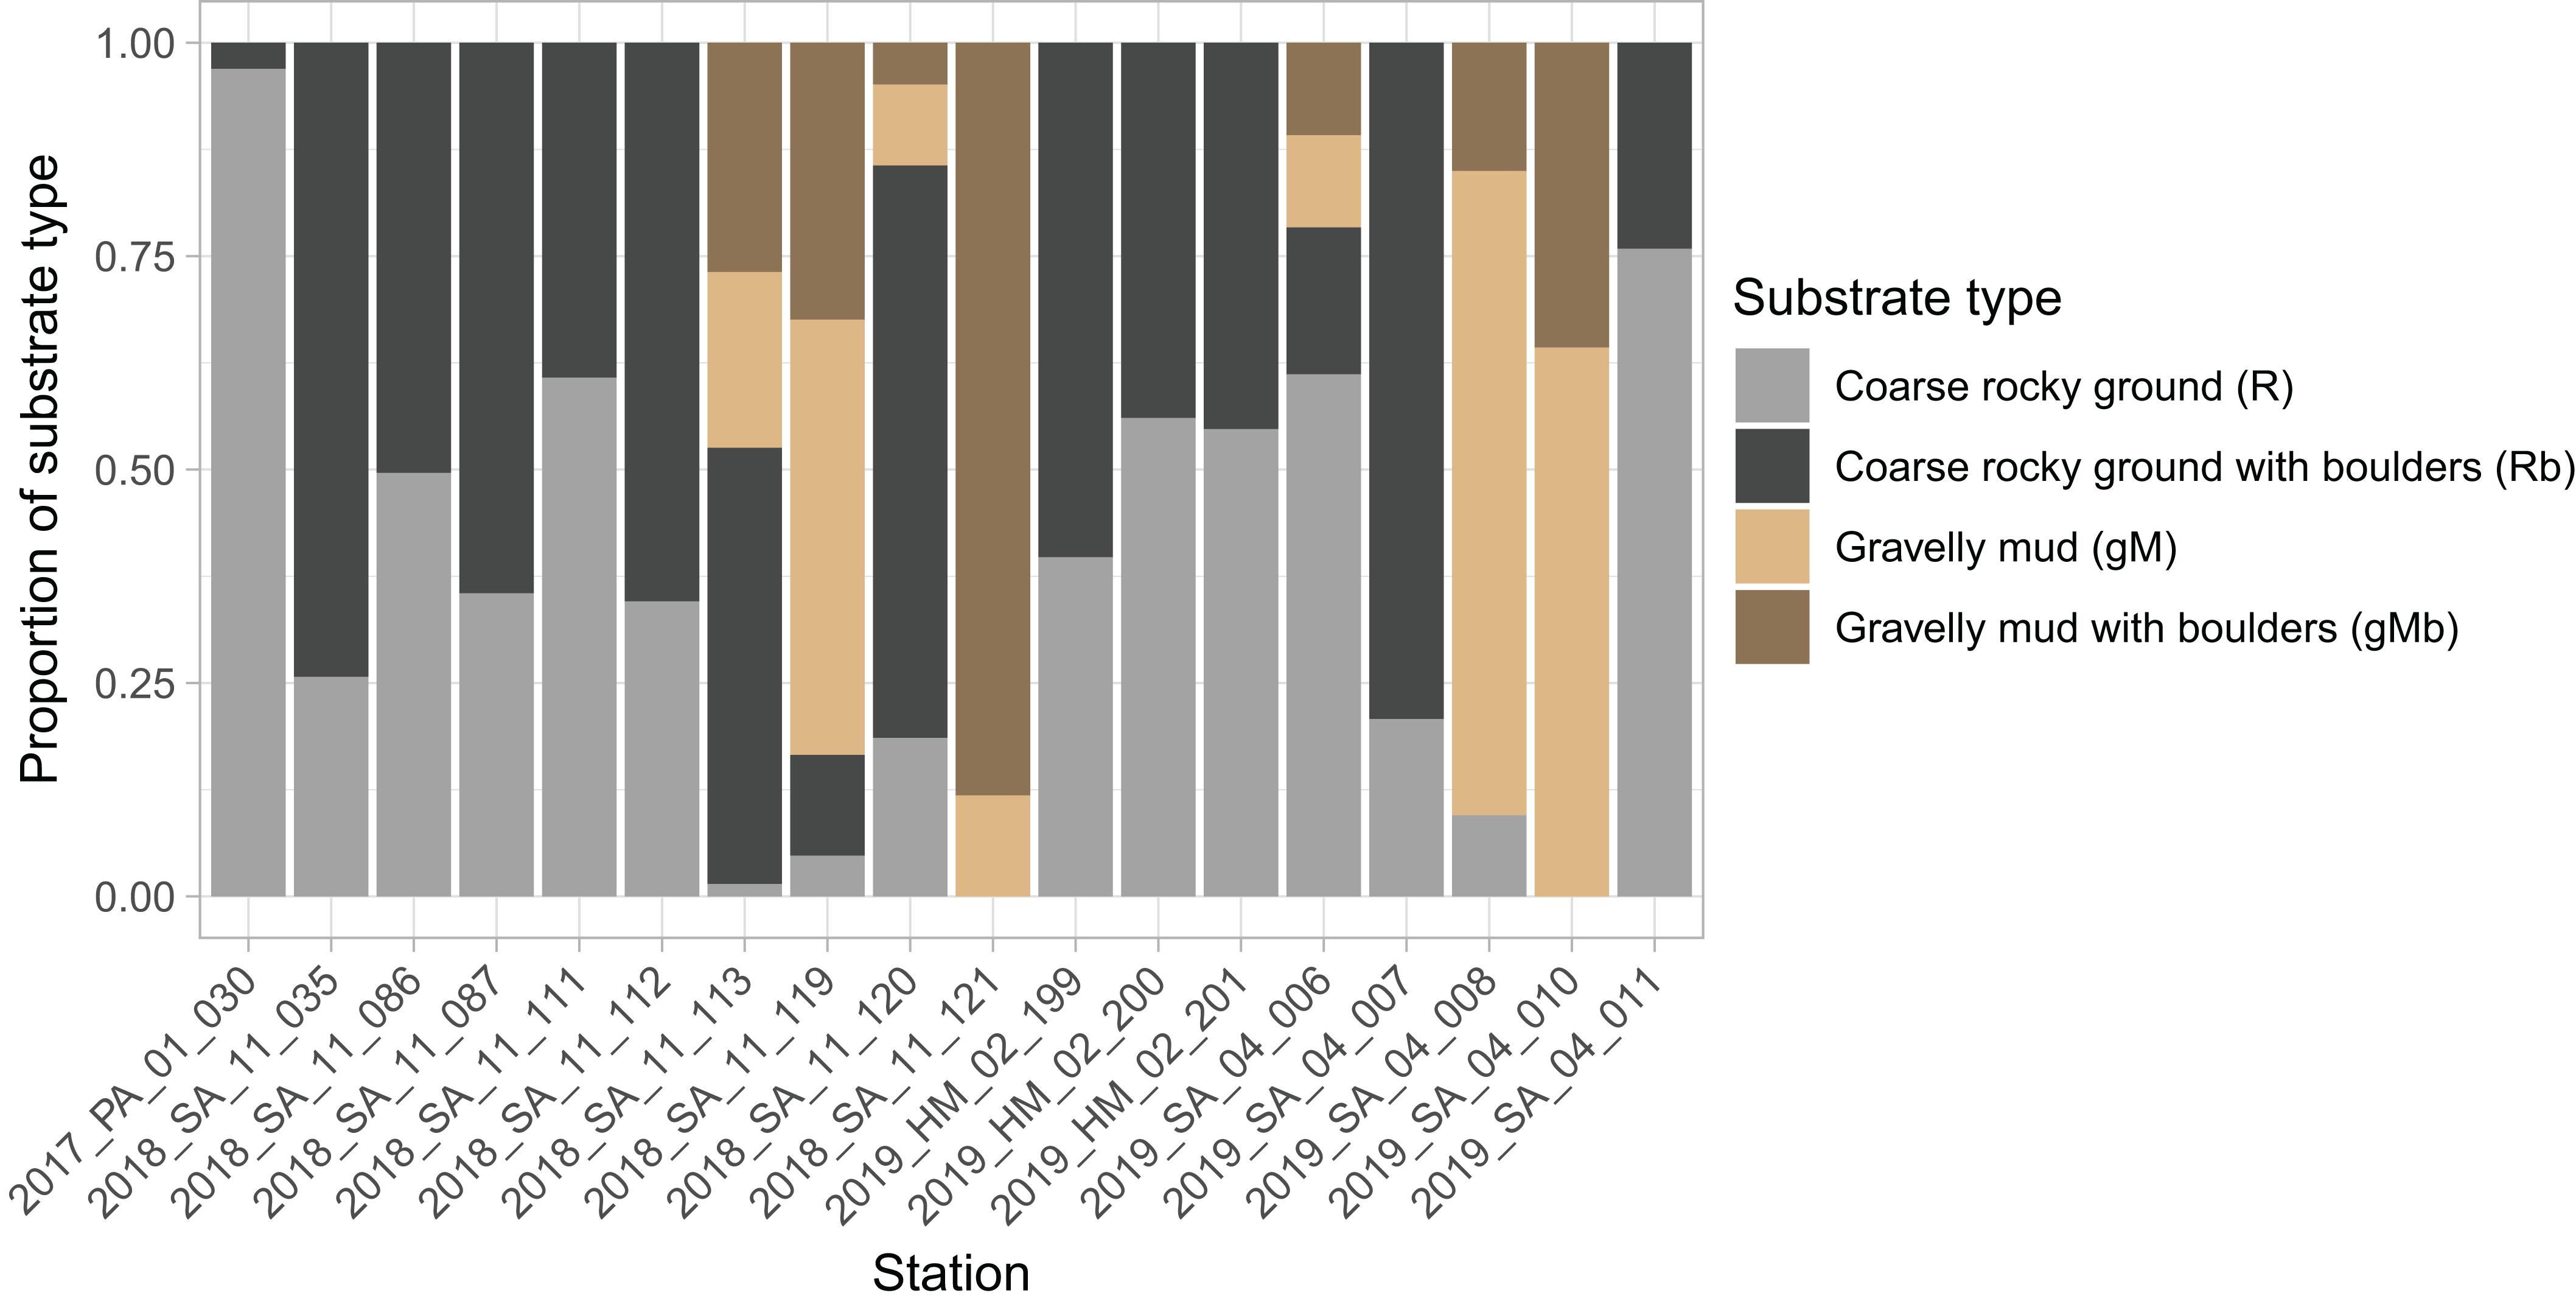
Figure 7. Stacked bar chart showing proportion of each substrate type in images from each station. Substrate classes are based on the revised EUNIS Habitat Classification (Davies et al., 2004), as adapted by Gougeon et al. (2017) and further modified for the purposes of this study.
The number of annotations of some taxa varied with substrate. Anemones, mushroom soft corals, feather stars and cauliflower corals were more prevalent on hard substrates (R and Rb) (Figure 8). Habitats dominated by cauliflower corals and or feather stars were typically found where there was a heterogeneity in size of the rocky material, with a combination of gravel, cobbles, and boulders (Figures 4A,C,D). Conversely, patches of mushroom soft corals appeared to only be found on more uniform gravel substrates (Figure 4E). These differences in the size of rocky material were not quantified, with the exception of differentiating between the presence and absence of boulders.
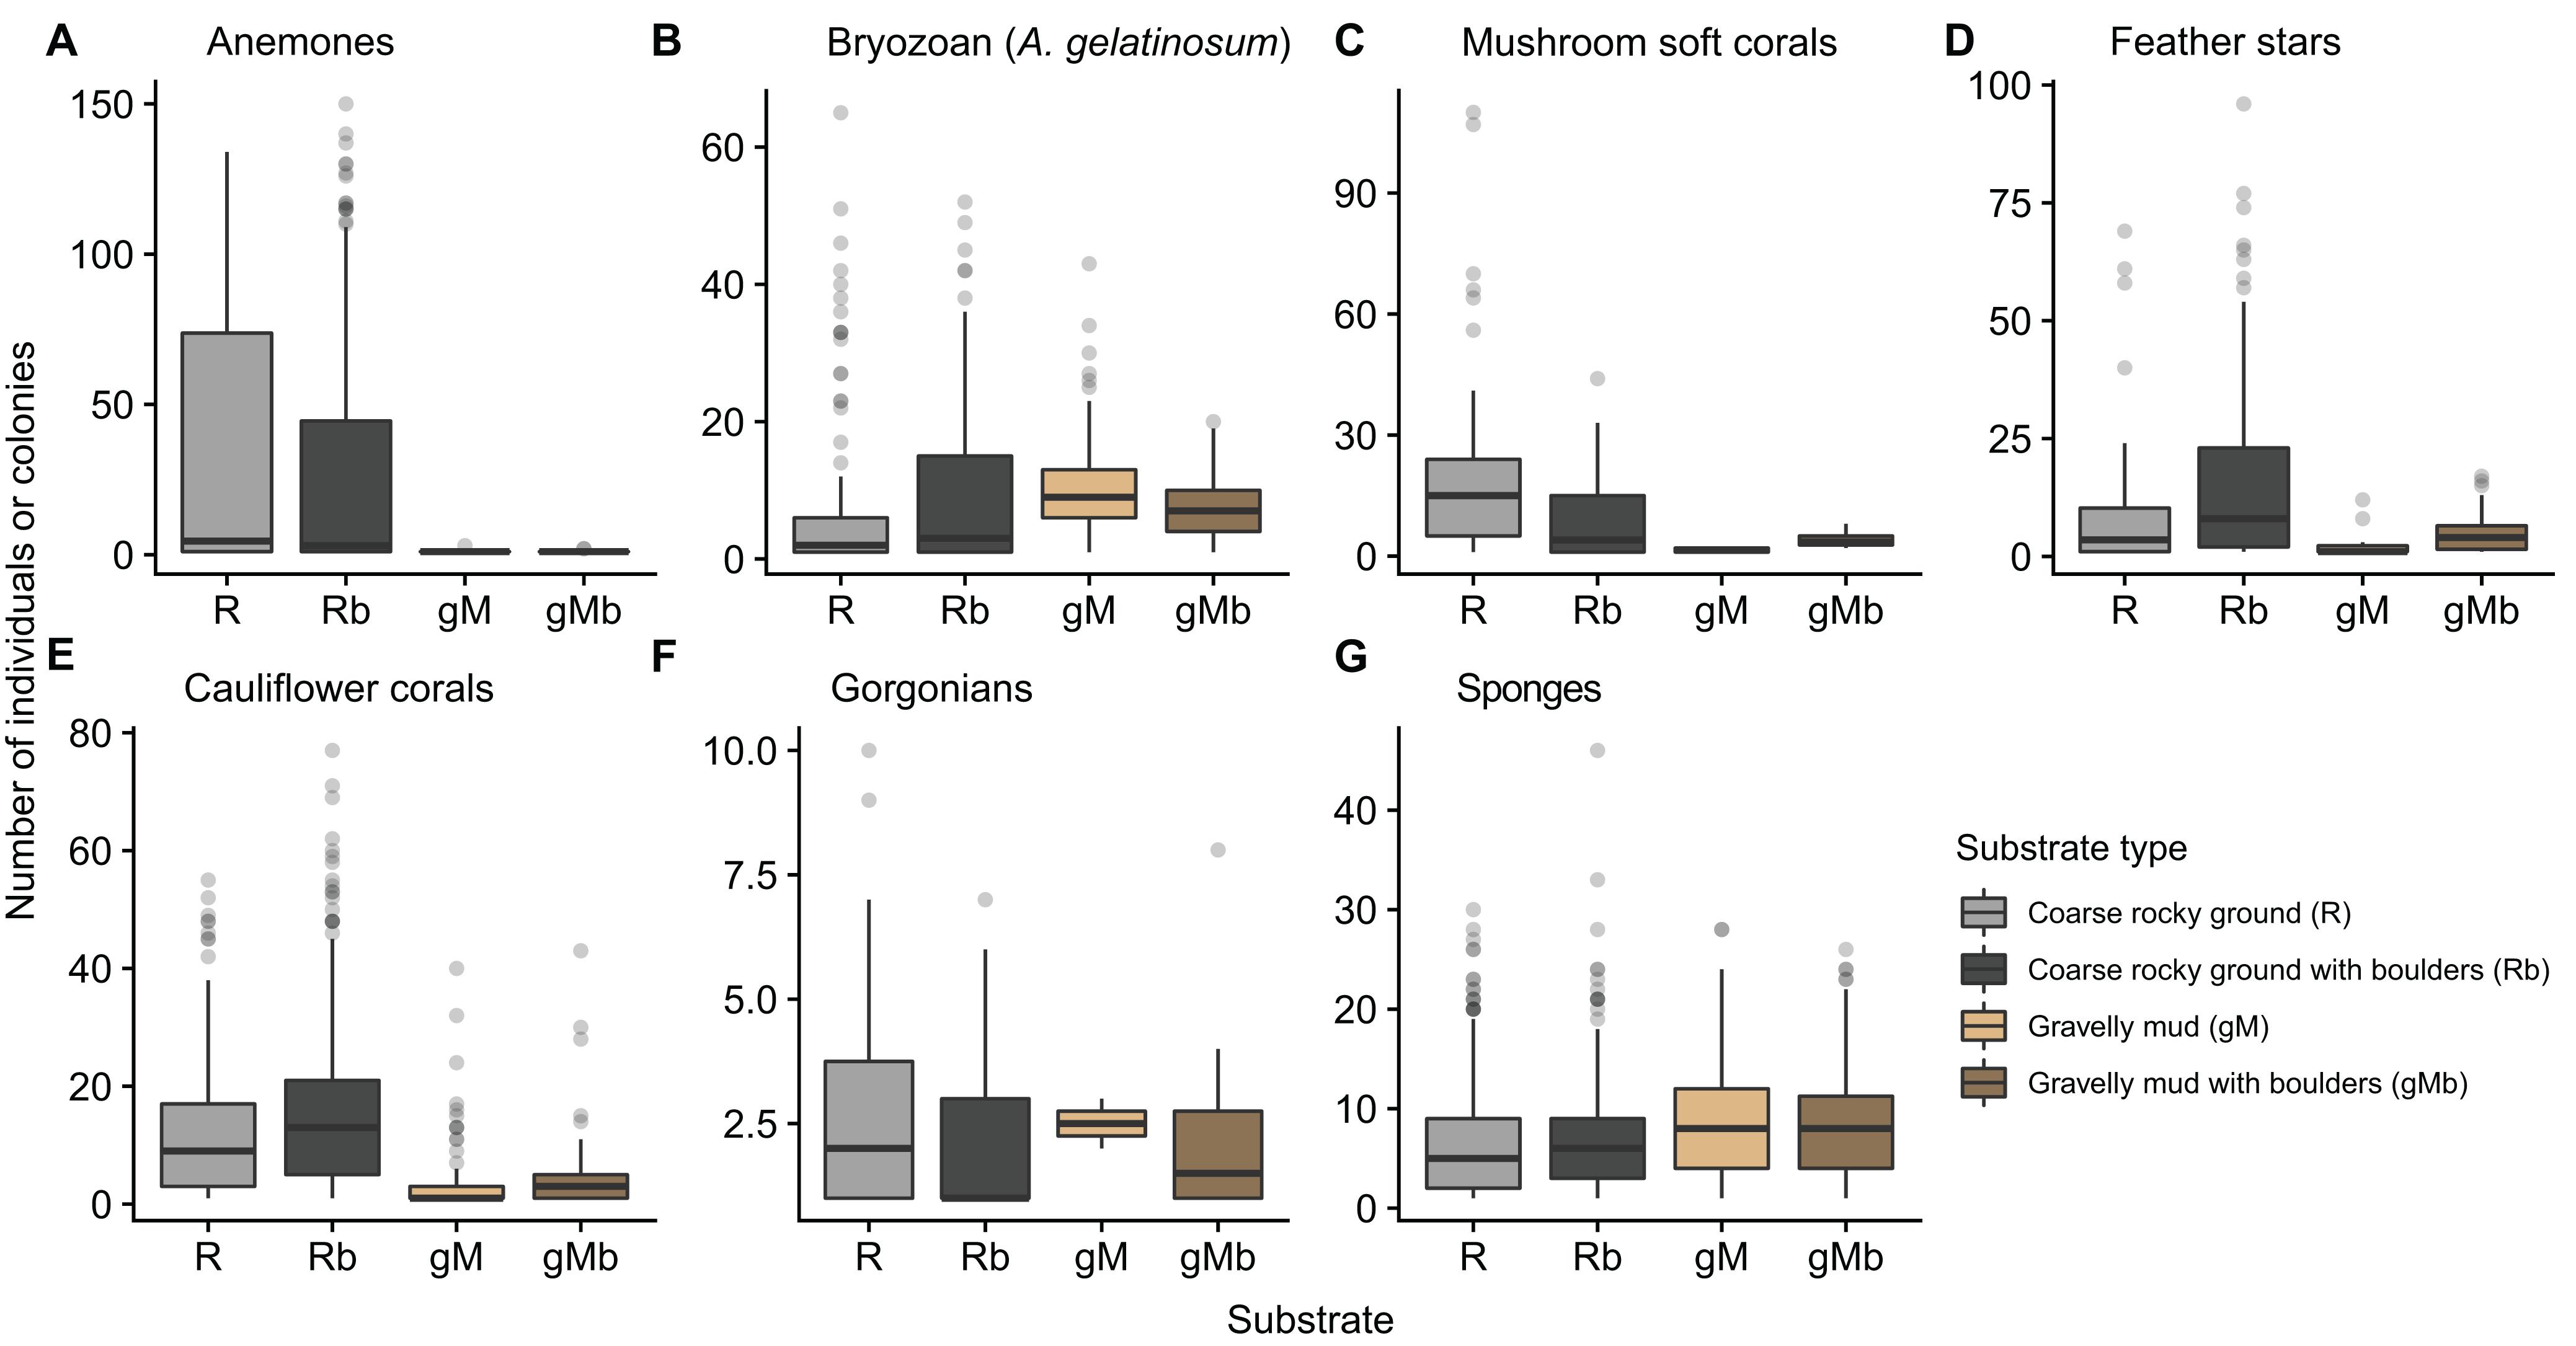
Figure 8. Box-whisker plot showing the number of annotations of seven taxa (A–G) in images, which were annotated with one of four classes of substrate type. Substrate classes are based on the revised EUNIS Habitat Classification (Davies et al., 2004), as adapted by Gougeon et al. (2017) and further modified for the purposes of this study.
Discussion
Analysis of the imagery from 18 stations showed heterogeneity in the substrates and communities on the slope of the Toqqusaq Bank. This patchiness was observed within stations, with notable variation across single video sled tows as well as between stations. Several distinct assemblages were observed, in some cases the assemblage was dominated by a single taxa forming a patch of habitat, with anemone fields, mushroom soft coral beds and areas dominated by the bryozoan A. gelatinosum. The assemblages which appeared to be most structurally complex and diverse, were those characterized by high densities of cauliflower corals, feather stars and sponges. In such assemblages the combined effect of observed densities is a habitat with considerable structural heterogeneity, found on coarse rocky substrates. Intuitively, substrate likely plays an important part in determining the assemblage present. Previously, Baker et al. (2012) found that substrate type had a clear influence on the occurrence and abundance of deep-sea corals in the Labrador Sea, they reported that the greatest diversity was seen in video transects with a mosaic of substrate types. Many of the taxa selected for annotation in this study are sessile and require a hard substrate for attachment, for example it is known that most soft corals and gorgonians require hard substrates for larval settlement and growth (Pérez et al., 2016). Some taxa (anemones, mushroom soft corals, feather stars and cauliflower corals) showed a clear preference for the coarse rocky substrates, whilst annotations of other taxa were more evenly distributed across the substrate classes.
Defining Soft Coral Gardens
Habitat classification systems support conservation goals by providing universally understood definitions that can be used to describe and map the distribution of habitats, a necessary pre-requisite for spatial management (Howell et al., 2010). The term “coral garden” was first applied to dense aggregations of non-reef forming corals, dominated by gorgonians (Bullimore et al., 2013). A formal definition offered by the Oslo and Paris Conventions (OSPAR) applies to a much wider range of cold-water corals on both hard and soft substrates (ICES, 2007; OSPAR Commission, 2010). This definition captures a range of different habitats and does not therefore represent a single ecological unit (Bullimore et al., 2013).
In their cold-water coral classification scheme, Davies et al. (2017) proposes a biotope consisting of cold-water Alcyoniina on hard/mixed substrate, specifically, Nephtheidae (cauliflower corals) and Anthomastus sp. (mushroom soft coral, family: Alcyoniidae). Whilst the proposed biotope refers to Anthomastus sp., we suggest that this could be interpreted more broadly as mushroom soft corals, given: (i) the known diversity of mushroom soft coral species in the North Atlantic (Molodtsova, 2013); (ii) the taxonomic revision of genera in Alcyoniidae; and (iii) the fact that close relatives have similar gross morphologies and likely occupy similar niches. In the present study, the imagery does not allow greater taxonomic resolution with regards mushroom soft corals. The supplementary material in the Davies et al. (2017) classification scheme, describes the cold-water Alcyoniina on hard/mixed substrate biotope as being known from depths of 600 m in Iceland and Norway (Guillaumont et al., 2016) and provides an example image. The example image is comparable to the coral garden habitat described here. The NEAFC consider cauliflower corals to be a VME indicator taxa for a VME habitat type described as “cauliflower coral fields,” which is listed as a soft-bottom habitat (NEAFC, 2014).
There is no accepted quantitative definition of soft coral gardens or coral gardens more broadly. Rogers et al. (2015) propose that to qualify the density of coral garden species must exceed 10 times the background level. Practically this relies on a good understanding of the background level which is rarely the case, including in this context. Further, since coral gardens by their nature are comprised of multiple species, it is not clear whether densities should be considered individually or the combined density of the species present compared with combined background level. Thus, this study must rely on the application of “expert” judgment to make a determination and in doing so provide a quantitative description that can be used to inform the development of revised definitions in the future. This judgment is guided by the indicative densities in the description of the broader coral garden habitat type (ICES, 2007; OSPAR Commission, 2010). Specifically, these suggest colony densities of 1–7 m–2 generally, 0.5–2 m–2 for small gorgonians (Acanthogorgiidae and Primnoidae) and 0.01–0.02 m–2 for larger gorgonians (Paragorgiidae). It has been suggested that these ranges can be used to differentiate between comparatively sparse and dense coral gardens (ICES, 2007). These indicative density thresholds are not accompanied by a requirement for the density to be present over a minimum area, which would be a useful additional guidance, pending consensus among the scientific community.
Cauliflower corals are the most abundant corals in the study area. They make a significant contribution to structural complexity and exhibited more positive associations than any other taxa. They are therefore an obvious candidate to serve as an indicator species for this soft coral garden habitat. A mean density threshold of 1 colony m–2 is applied to determine those stations where the soft coral garden habitat is present. The lower bound of the generic indicative density suggested by OSPAR is used, as it is recognized that the study area is inherently patchy. To use a higher threshold would potentially exclude stations with patches of cauliflower corals at significant densities, indicating areas of coral garden. Excluding these would not recognize their presence in an ecosystem displaying a mosaic nature, with patches of soft coral garden present among differing substrates and assemblages. Those 8 out of 18 stations which meet this threshold are highlighted (Figure 9).
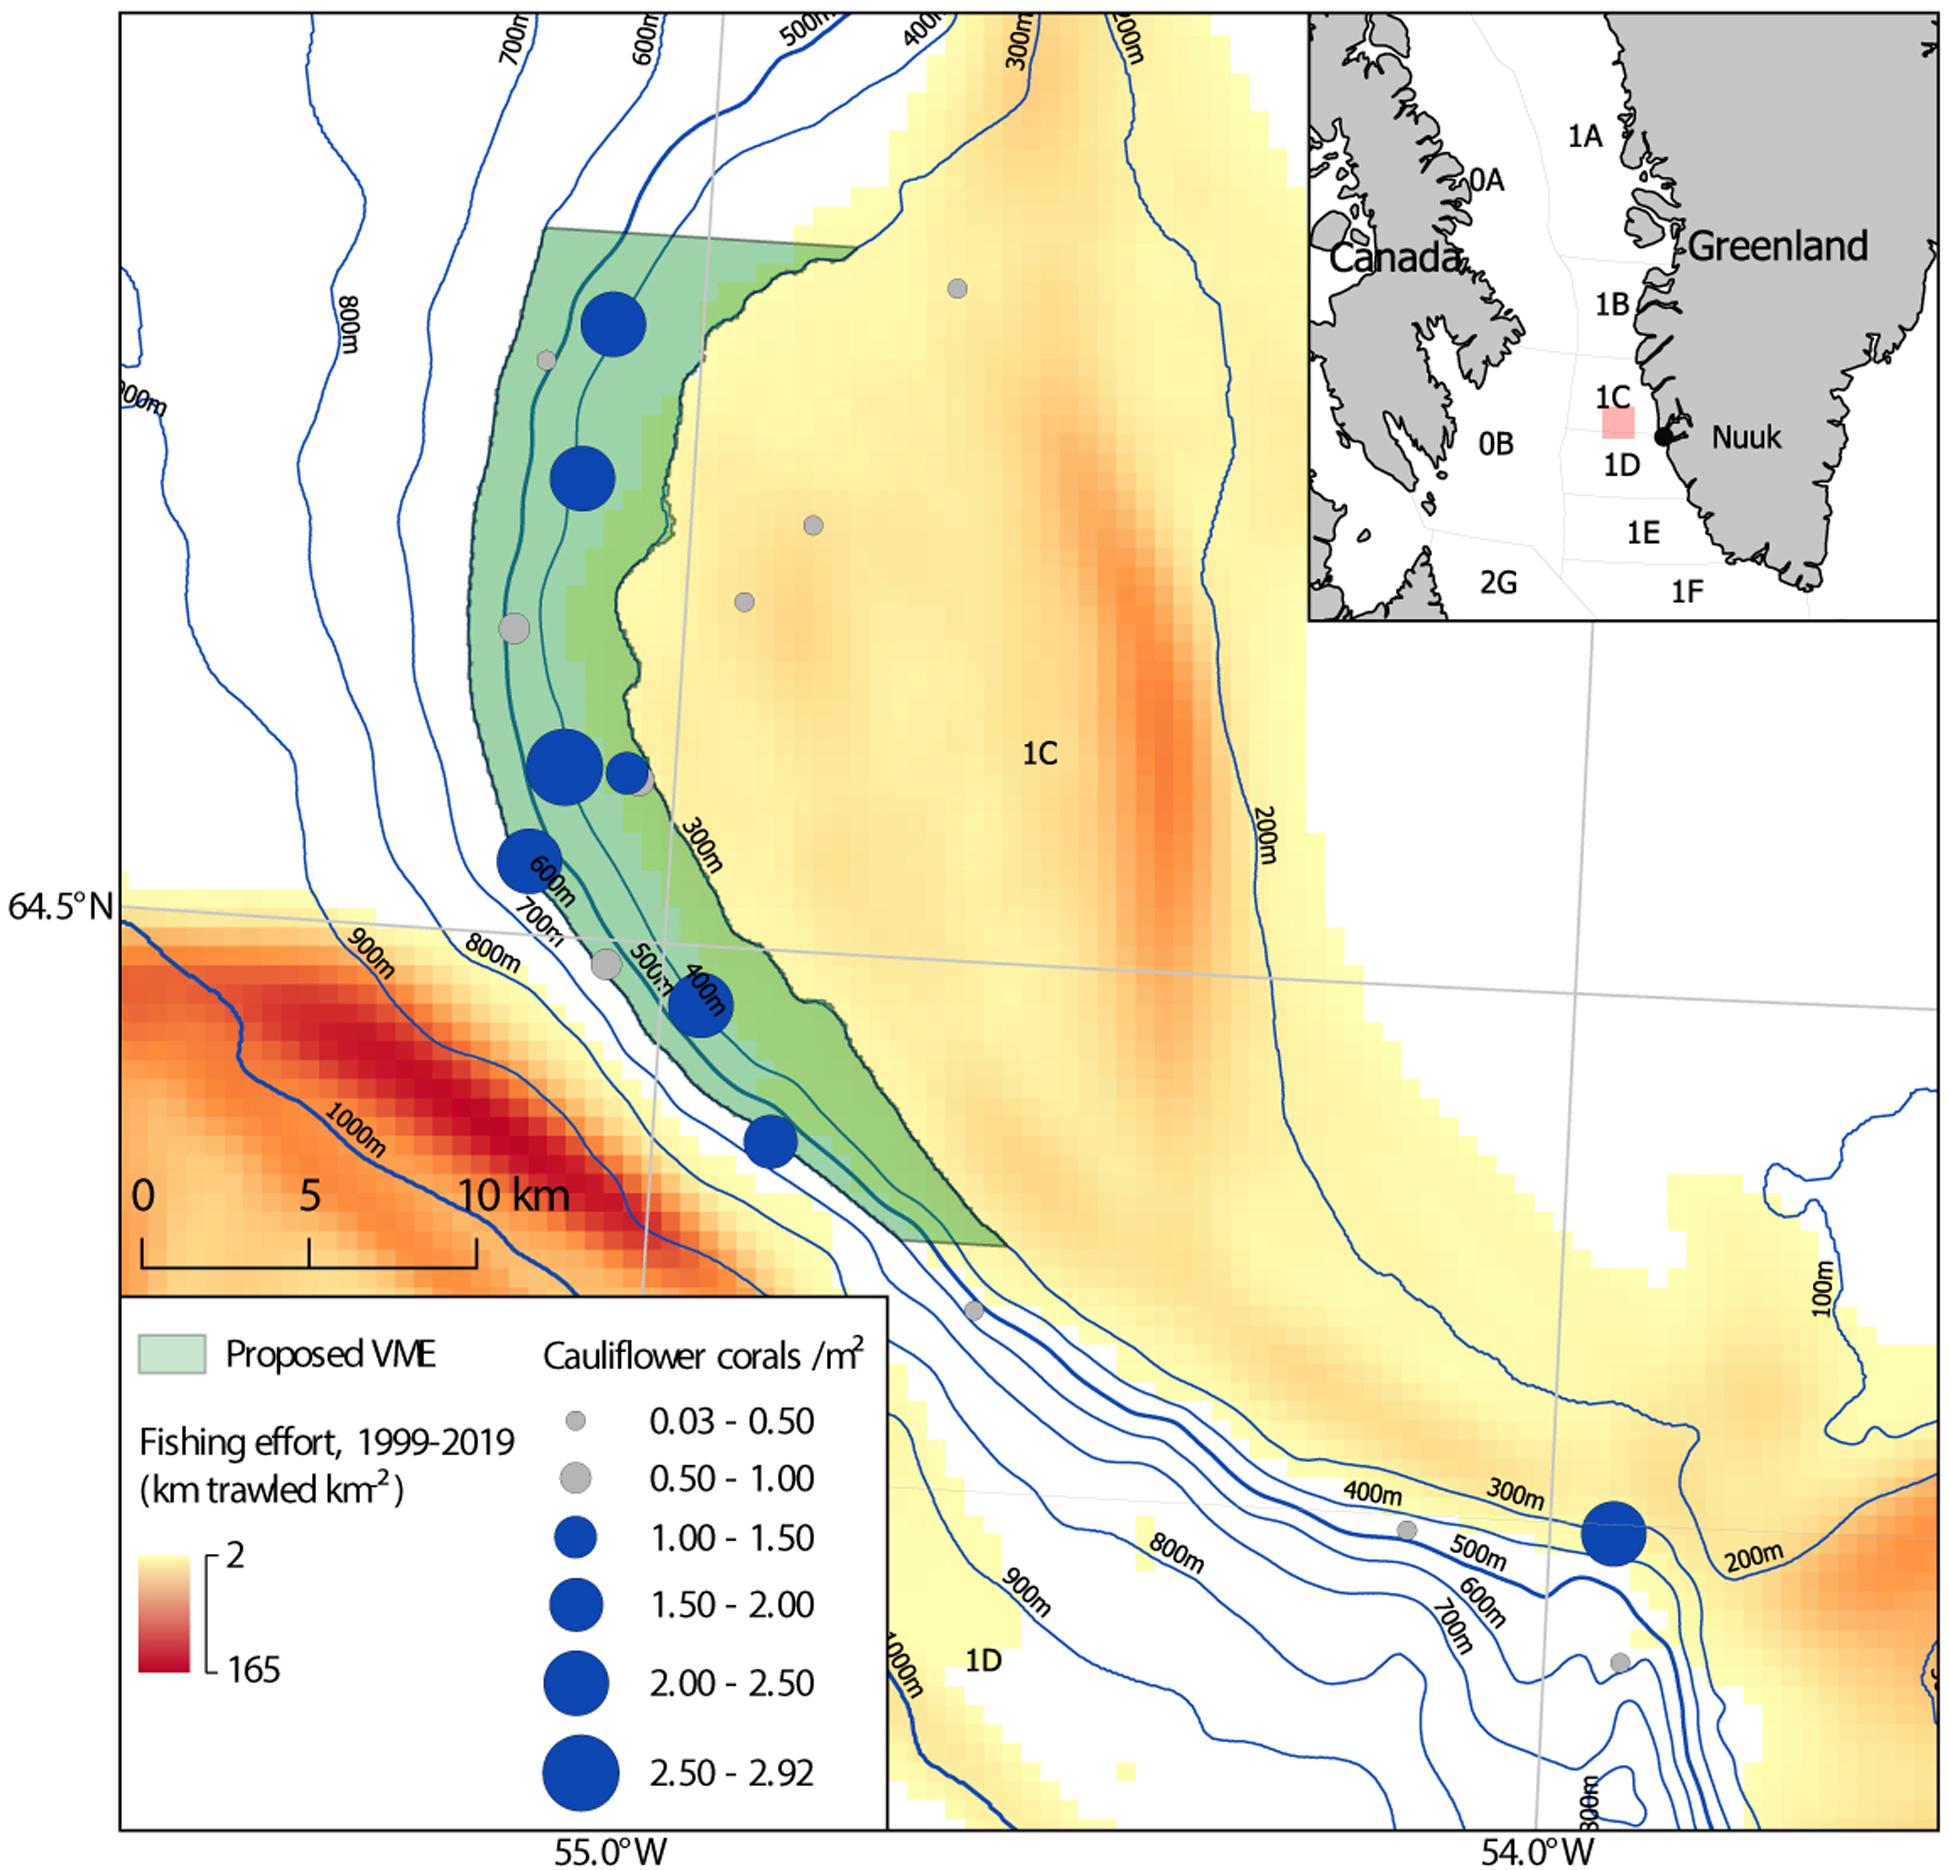
Figure 9. Map of the 486 km2 proposed soft coral garden vulnerable marine ecosystem (VME) (light green), on the continental slope of the Toqqusaq Bank, west Greenland. NAFO Divisions are indicated. The mean density of cauliflower coral colonies is shown (circles), with those stations exhibiting a density ≥ 1 m2 highlighted in blue (< 1 m2 gray). Fishing effort is based on haul by haul logbook data from 1999 to 2019, used to determine km trawled km−2.
Does This Soft Coral Garden Constitute a Vulnerable Marine Ecosystem (VME)?
Soft coral gardens and cauliflower corals more generally, are both recognized as VMEs and VME indicators, respectively, by NEAFC, the RFMO for the Northeast Atlantic (NEAFC, 2014). Conversely, neither are considered a VME or indicator by NAFO, the RFMO for the Northwest Atlantic (NAFO, 2012). This apparent inconsistency could in theory reflect a fundamental difference in the nature of deep-sea benthic ecosystems in the Northwest Atlantic compared to those in the Northeast Atlantic, though no such rational is provided by either RFMO. More likely this is the product of differing interpretations of the VME definition by experts in separate RFMOs. This lack of coordination and harmonization between adjacent RFMOs has been noted by others (Bell et al., 2019). Therefore here, direct reference is made to the underlying VME definition, with each criteria addressed in turn (FAO, 2009).
Uniqueness or Rarity
There is no evidence to support recognition as a VME by virtue of the unique or rare criteria. The taxa observed have a wide distribution and are not known to be threatened globally. The rarity of the habitat is not known but similar assemblages have been reported elsewhere in the North Atlantic. The true spatial extent within Greenlandic waters is not known but it may well extend beyond the present study area along the continental slope.
Functional Significance of the Habitat
The soft coral garden habitat likely plays a functionally significant role, though this is not directly assessed here and only limited inferences can be made from the imagery. In general more is known about gorgonians than cauliflower corals. Buhl-Mortensen and Mortensen (2005) reported finding 114 associated species and nearly 4,000 individuals on the 25 Paragorgia arborea and Primnoa resedaeformis colonies they sampled. Krieger and Wing (2002) observed 10 mega faunal groups (rockfish, sea stars, nudibranchs, feather stars, basket stars, crabs, shrimps, snails, anemones, and sponges) associated with Primnoa spp., which was used to either prey on, suspension feed from, or provide protection. Cauliflower corals are known to host a variety of species. Gersemia spp. can be considered habitat-forming species, as the embryonic development of the basket stars (Gorgonocephalus spp.) may occur within the coral’s tissues, with juveniles attached to the outside whilst feeding (Patent, 1970). As many as 118 small basket stars have been found on a single cauliflower colony (B. de Moura Neves, pers. comm.). Whilst not quantified, Gorgonocephalus spp. were observed on cauliflower corals in video and images in this study. The presence of cephalopods, decapods, Rajiformes and various fish was noted in images from this habitat. Grenadier fish (Macrouridae) and redfish (Sebastes spp.) were commonly encountered in videos and sampled images. Unpublished data from prawn stock assessment trawl and beam trawl surveys provides further insights into a rich community of benthic invertebrates associated with the observed soft coral garden habitat (Supplementary Table 1).
Fragility
The habitat should be considered fragile, as it is vulnerable to degradation by physical disturbance, especially trawling. The vulnerability of deep-sea gorgonians to trawling is well established (e.g., Freese et al., 1999; Witherell and Coon, 2000). The largest and perhaps most vulnerable species present was Paragorgia arborea. The ability to retract and recover from acute local injury may render cauliflower corals less vulnerable to mechanical disturbance than other corals with rigid skeletons and unretractable colonies (Henry et al., 2003). Nevertheless, these responses do not provide protection against removal. It has been noted that cauliflower corals are prone to incidental bycatch in emerging deep-sea fisheries (Devine et al., 2019). Groundfish survey trawl data from the Grand Banks and Flemish Cap, confirm that soft coral biomass was the largest component of bycatch and that abundance was significantly lower in previously trawled areas (Murillo et al., 2010). In the Bering Sea, the biomass of Gersemia spp. has been found to be highest in untrawled areas (McConnaughey et al., 2000). Similarly, Jørgensen et al. (2013) consider Gersemia fruticosa, G. rubiformis, Drifa glomerata, and Duva florida to be at “high risk” from trawling and found the highest biomass outside trawled areas in the Barents Sea. In the present study the lowest densities of cauliflower corals were seen in those stations (2019_SA_006, 2019_SA_008 and 2019_SA_010) within the trawling footprint, with gorgonians and mushroom soft corals also being absent there. This supports the idea that the component taxa of this soft coral garden are vulnerable to trawling. It may be the case that this coral garden assemblage is only observed in the relatively narrow section of the continental slope that has not been subject to fishing pressure to date.
Life-History Traits of Component Species That Make Recovery Difficult
Slow growth and long-life are exhibited by component taxa of this habitat, rendering recovery slow. To date studies on growth rates and longevity in deep-sea octocorals have focused on gorgonians (Pérez et al., 2016), whereas cauliflower corals have received less attention, not least because of the challenges associated with measuring soft coral colonies. Sherwood and Edinger (2009) report gorgonian axial growth rates as little as 0.56 cm year–1 for Paramuricea spp., 1.62 cm year–1 for Paragorgia arborea, and 1.00 cm year–1 for Primnoa resedaeformis, with ages exceeding 100 years. Laboratory study of larval and early growth of G. fructicosa and D. florida, found post-settlement growth to be very slow, suggesting a “sluggish recovery” following anthropogenic disturbance (Sun et al., 2011). Although, the authors note that this may be partially offset by the small size at sexual maturity and the potential for disturbance to release planulae from fertile colonies that grow into viable offspring. A similar study with Drifa sp. and D. glomerata, also suggested that early growth rates of primary polys was extremely slow with no budding of the primary polys of Drifa sp. in 21 months (Sun et al., 2010). Cordes et al. (2001) monitored Heteropolypus ritteri (mushroom soft coral; in the family Alcyoniidae; formerly in the genus Anthomastus) in the laboratory, finding slow initial growth became more rapid at intermediate size, before approaching an asymptote at 26–30 years. They observed that the slow growth and relative longevity was typical of other deep-sea organisms. Watling and Auster (2005) conclude that growth rates and patchy recruitment mean that recovery of alcyonacean communities following removal is likely to take a very long time.
Structural Complexity
Perhaps the most compelling justification for consideration as a VME, provided by the imagery collected, is the structural complexity created by the biotic components of this habitat. The combined effect of all the taxa annotated but especially cauliflower corals, feather stars, sponges and gorgonians, adds considerable structure at varying scales to the otherwise limited complexity of the coarse rocky substrates (Figure 10). Further structural complexity is added by the abundant bryozoans and hydrozoans that are present but were not quantified (Figure 10). As discussed above, these structures play a functional role in the ecosystems, for example by providing refugia and supporting filter feeding organisms, resulting in high diversity and abundance. These habitats are patchy in nature; denser areas of cauliflower corals are interspersed with other assemblages, for example, areas dominated by anemones (Figure 4B) and mushroom soft corals (Figure 4E). Similarly, substrates varied within and between stations from coarse rocky ground to gravelly mud substrates. This mosaic nature and resulting variation in structural complexity on a larger spatial scale, is likely to support greater diversity of species and functions.
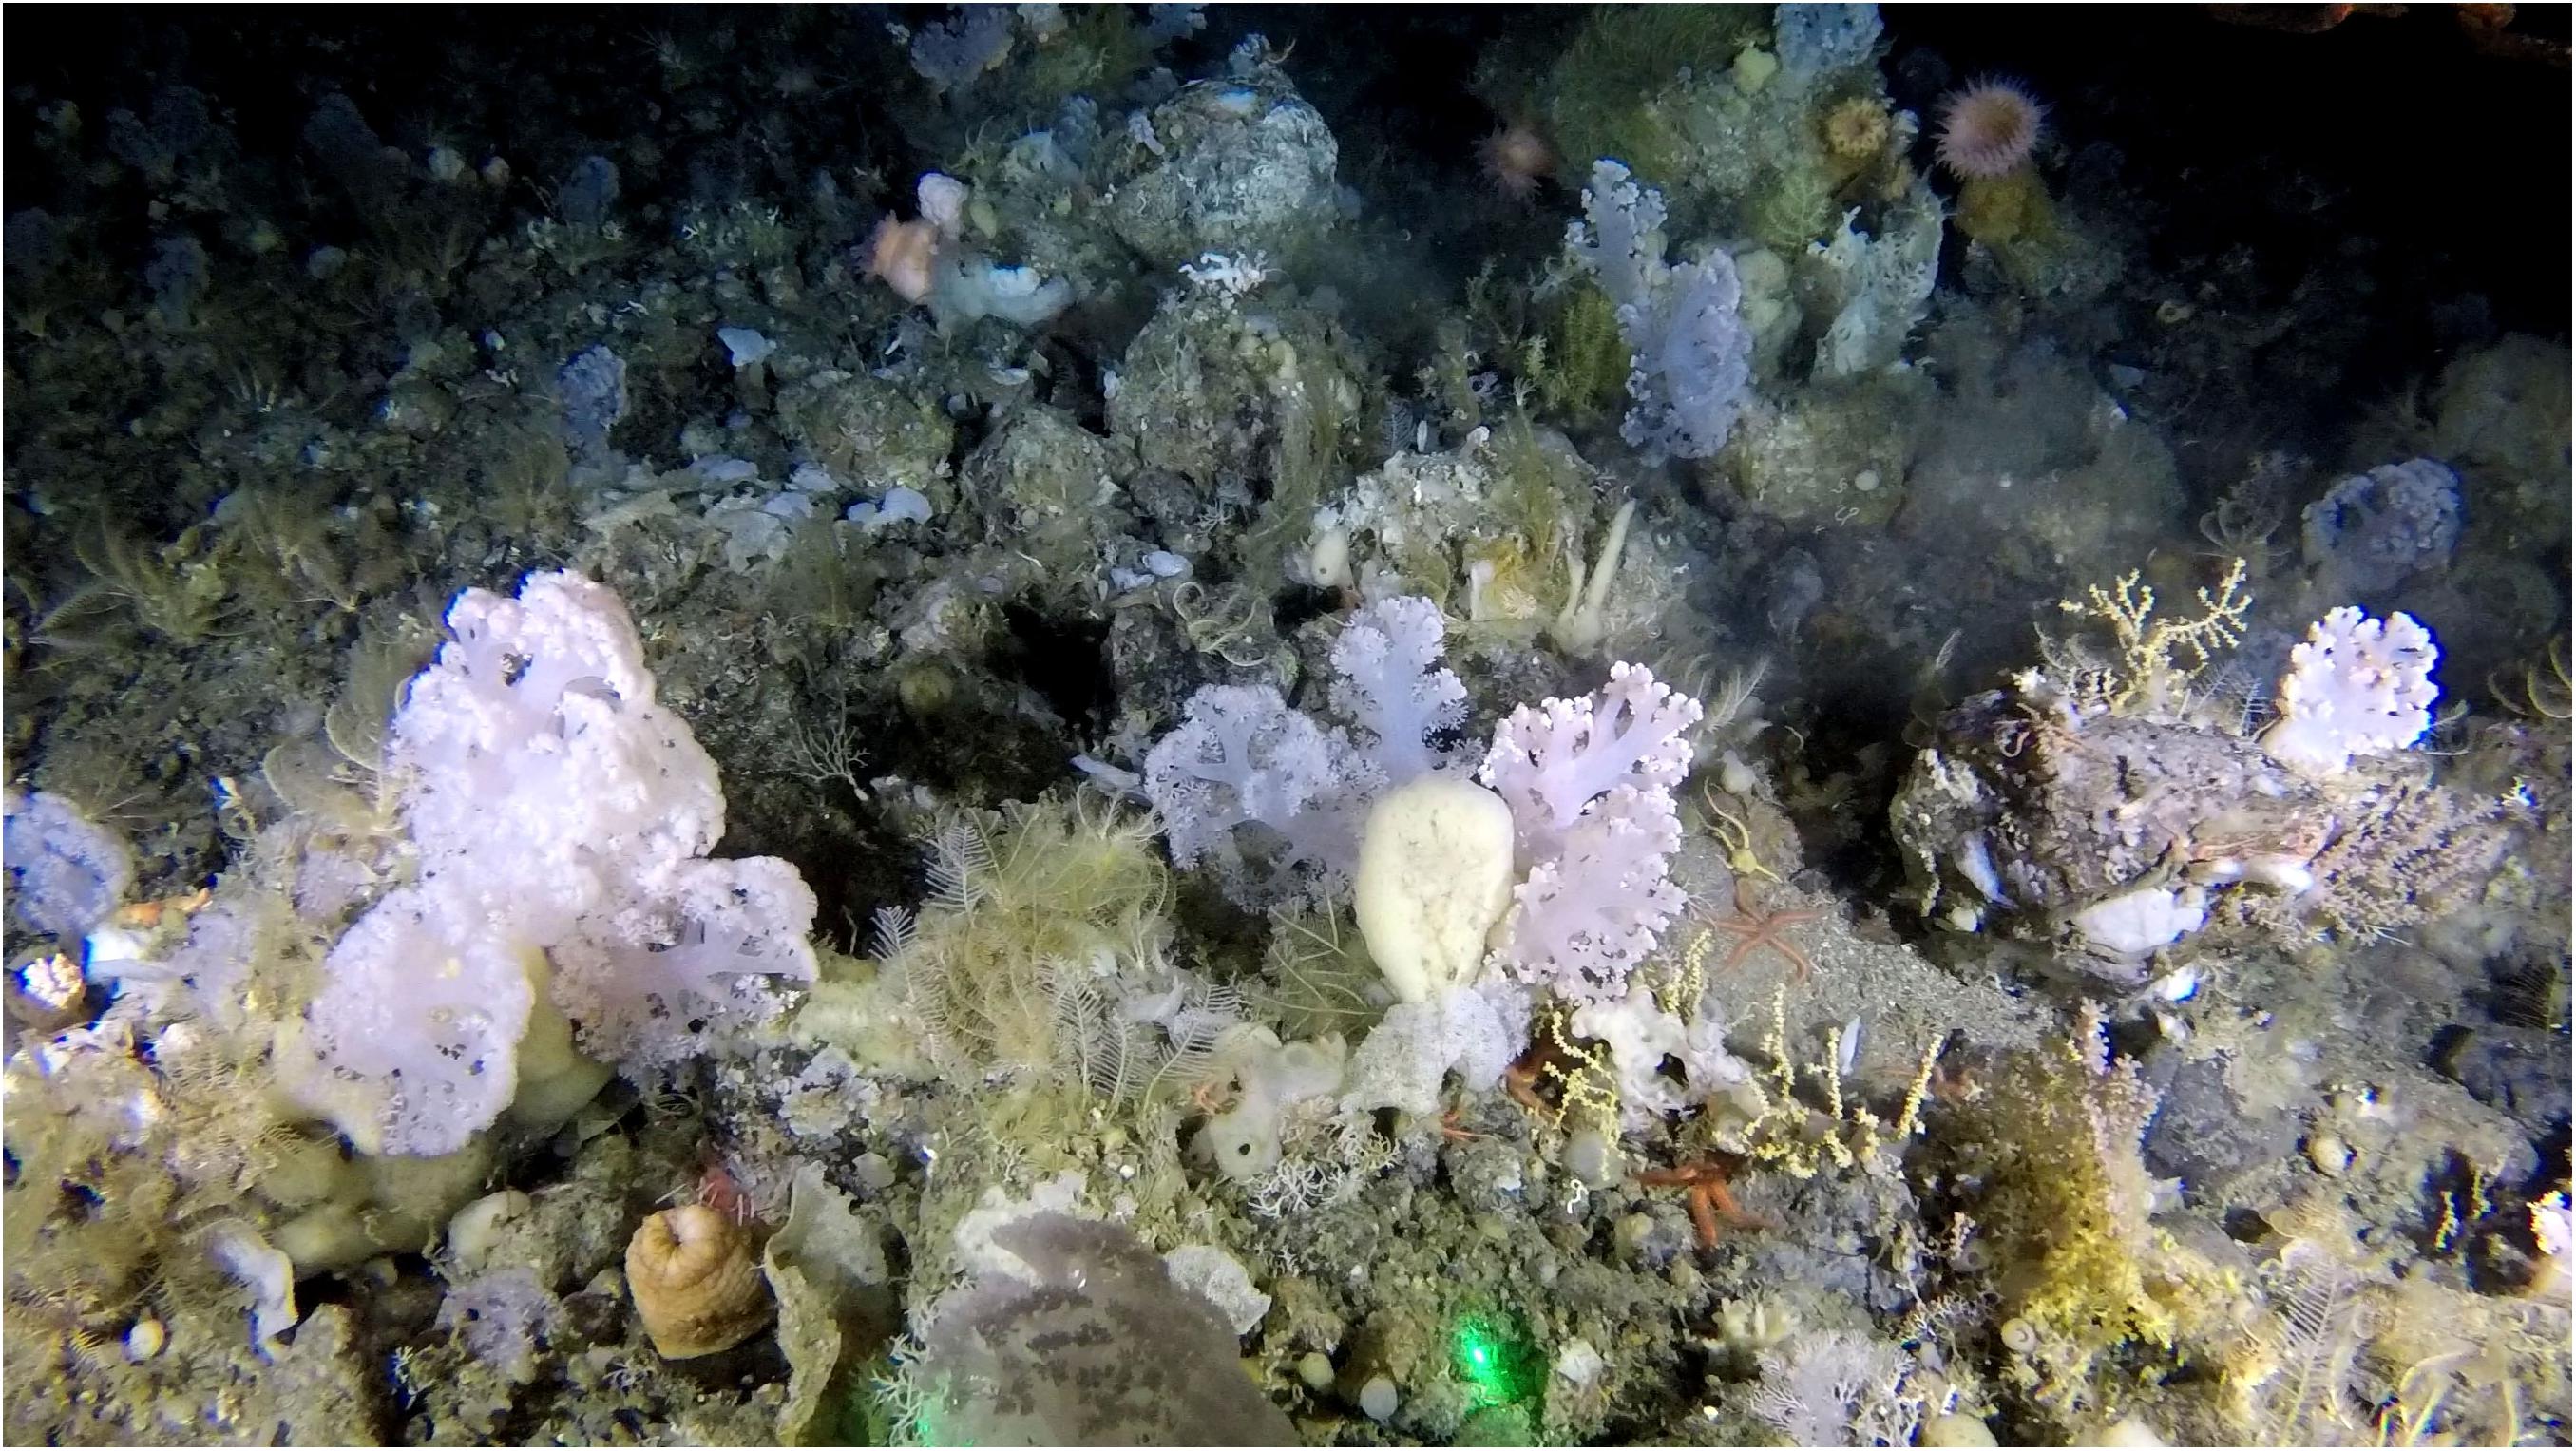
Figure 10. Example still showing the structural complexity of the soft coral garden habitat, from Station 2018_SA_11_087, at a depth of 585 m, on the continental slope of Toqqusaq Bank, west Greenland. Cauliflower corals, feather stars, gorgonians, sponges, anemones, brittle stars, hydrozoans, and calcified bryozoans, are present. Laser dots (green) are 20 cm apart; the left hand dot is partially obscured.
Those highlighted stations (Figure 9) exhibiting the soft coral garden habitat, would appear to meet multiple criteria for a VME (FAO, 2009). Therefore it is proposed that this area be recognized as a VME.
Implications for Management
It is widely recognized that spatial closures are the most effective method of avoiding serious adverse impacts on VMEs (Bell et al., 2019). Executive Order No.4, 30 March 2017, Section 13, introduced by the Government of Greenland makes provision for the closure of areas to bottom gears where VMEs are identified in Greenlandic waters (Government of Greenland, 2017). The soft coral garden habitat identified is immediately adjacent to the MSC certified cold-water prawn (Cappell et al., 2018) and Greenland halibut fisheries (Cappell et al., 2017). This certification requires that measures are in place to ensure that fisheries do not cause serious or irreversible harm to VMEs (MSC, 2014). It should be acknowledged that the coarse rocky ground in the proposed VME area is not necessarily optimal for the prawn fishery and too shallow for the halibut fishery. Therefore, the most immediate threat maybe from the emerging cod fishery (ICES, 2019b), as the slope of the Toqqusaq Bank may be suitable ground for targeting cod. The soft coral garden habitat identified is also partially overlapped by a hydrocarbon exploration and exploitation license, which is currently pending (License: No. 2019/02) (Government of Greenland, 2020).
A bounding polygon for this candidate VME is proposed encompassing seven of the eight stations where the soft coral garden habitat was identified (Figure 9). These seven stations were spatially contiguous in the northern portion of the study area, within a 60 km span of continental slope. In the southern portion of the study area only one station (2018_SA_11_120) out of four exceeded the mean cauliflower corals density threshold (> 1 m2) used to determine the presence of the soft coral garden habitat. This suggests the soft coral garden habitat was not a dominant habitat there. On that basis the southern portion of the study area was not included in the proposed VME area.
The depth range (314–585 m) of those eight stations where the soft coral garden habitat was found is used as the upper and lower boundary on the continental slope of the Toqqusaq Bank. For both pragmatic and precautionary reasons this is rounded down to 300 m and up to 600 m. Bathymetric contours are used to form the eastern (300 m contour) and western (600 m contour) edges of the polygon. The latitudinal extent is determined by the latitude of the most northerly (2019_SA_04_007) and southerly (2018_SA_11_035) of these seven stations. A 5 km latitudinal buffer is added, rounded to the nearest minute (one nautical mile). The proposed VME area can be described as the area with depths of 300–600 m between 64°50′N and 64°22′N on the western edge of the Toqqusaq Bank. This 486 km2 area, spans ∼60 km of the continental slope and is intended to be pragmatic from a spatial management perspective, whilst affording protection to known areas of this soft coral garden habitat.
The VME area proposed here is based on multiple, adjacent observations, which are sufficient to justify the introduction of spatial management measures. It is acknowledged that the data show this soft coral garden habitat is present toward the southern extremity of the study area at a single station. Thus patches of this habitat are present along at least 100 km2 of continental slope. The true spatial range may well be greater, possibly extending a considerable distance along the continental slope of west Greenland. Management and future research should draw on other data, including unpublished GINR surveys (stock assessment trawl bycatch and beam trawls). Further research should address whether the VME area proposed in this study should be extended, especially in terms of its latitudinal extent. The role of fishing effort, substrate and other environmental variables should be subject to investigation, as one or more of these may explain the distribution of this habitat and abundance of its component species.
Limitations
A fundamental methodological decision was to annotate images sampled from stills rather than directly analyze videos. This was in part due to pragmatic constraints (time) but also provides greater scope for revision and further work on the images and annotations. However, it should be acknowledged that a considerable amount of data contained in the videos are therefore excluded. This impacts our understanding of the abundance of sparser (e.g., Paragorgia arborea) and mobile fauna, particularly fish, which are less likely to be sampled in images.
The nature of imagery means only certain taxa can be identified and limits the taxonomic resolution that can be obtained during annotation. A more complete taxa inventory based on unpublished beam trawl and stock assessment trawls from the proposed VME area is included for reference (Supplementary Table 1). Efforts were made to annotate different sponge taxa and morphologies but these were ultimately aggregated to achieve consistency. Aggregation of multiple taxa to a parent label, for example into “sponges,” results in a more general picture and does not allow more specific taxa associations with other taxa and substrates to be determined. The approach of annotating individuals or colonies means some taxa (e.g., hydrozoans) that formed significant components of the habitats were not quantified in this study. To do so would require a different annotation strategy and likely require considerably more time investment, the latter being a familiar problem in the benthic imaging field.
The resolution within the substrate classes themselves limited their explanatory power. In the images gorgonians were only ever seen attached to hard substrates. It was anticipated that inclusion of a sub-class “with boulders” into gravel mud, would add explanatory power accounting for the presence of gorgonians in gravelly mud substrates. Clearly this was not adequate, with some gorgonians annotated on gravelly mud substrates (gM) (Figure 8). In such cases the gorgonians were attached to rocky material that did not exceed the 20 cm boulder threshold, thus the substrate in the image was classed as gravelly mud (gM) and not gravelly mud with boulders (gMb). The proportion and size of hard substrates for attachment varies considerably within classes and some images exhibit a range of substrates. A higher resolution approach to substrate annotation would enable further conclusions to be drawn regarding the relationship between substrates and the observed assemblage and abundance of taxa. This could be achieved by the introduction of additional substrate classes or sub-classes, or alternatively by applying substrate labels to discrete areas within the images. The optimum approach would depend on the question(s) being addressed.
Conclusion
Despite the limitations identified, the benthic video sled employed proved to be a low-cost effective tool to collect imagery suitable for identifying and providing a quantitative description of a proposed VME. This allowed the first description of this soft coral garden habitat, characterized by a high density of cauliflower corals, on the continental slope of the Toqqusaq Bank. This structurally complex habitat appears to meet the definition of a VME as provided by the FAO. The vulnerability and potential ecological value mean there is a need for effective spatial management measures, given the proximity of economically important halibut and prawn fisheries along with the emerging cod fishery. A candidate VME area of 486 km2 is therefore proposed, from which activities liable to cause serious or irreversible harm, such as benthic trawling, should be excluded.
Data Availability Statement
All datasets generated for this study are included in the article/Supplementary Material.
Author Contributions
SL, MB, NH, KK, and CY contributed to the conception and design of the study. SL, MB, NH, MF, and CY collected the video imagery. BS-S performed the image extraction and annotation. RN and KZ prepared fishing effort data. SL and CY conducted the analyses and produced the figures. SL drafted the manuscript. All authors contributed to manuscript revision, read and approved the submitted version.
Funding
This research was an outcome of the project “Fish, plankton and seabed – ecological dynamics on Toqqusaq and Fyllas Bank.” The majority of data were collected during two ship surveys planned and funded by the Greenland Institute of Natural Resources (GINR) (Project Nos. 3205 and 2458). This research was partially conducted under an IUCN BEST 2.0 funded project (Reference No. 1586), led by Zoological Society of London (ZSL), with Sustainable Fisheries Greenland (SFG) as a project partner. This research was also associated with a wider ongoing Benthos Monitoring Programme of the Greenland Institute of Natural Resources (GINR). The GINR was financially supported by the North Atlantic Cooperation (nora.fo; J. No. 510-151), the Ministry for Research in Greenland (IKIIN), the Environmental Protection Agency (Dancea) of the Ministry of Environment and Food of Denmark (J. No. mst-112-00272), and the Nordic Council of Ministers (Project No. 15002). SL was funded by a Ph.D. studentship from the Natural Environment Research Council (NERC) (Grant No. NE/L002485/1). Open access publishing fees were paid by University College London (UCL).
Conflict of Interest
The Zoological Society of London (ZSL) has previously received funding from Sustainable Fisheries Greenland (SFG), who were a partner in the IUCN BEST 2.0 project detailed in the Funding Statement. The nature of this partnership is that ZSL maintains complete academic independence. SFG play no role in the design, execution, or interpretation of research conducted by authors at ZSL, including this study.
Acknowledgments
We wish to acknowledge the following contributions to this study. The crews of the R. V. Paamiut, R. V. Sanna, and M. T. Helga Maria, helped deploy the video sled. Aaamal Hussain provided input into trigonometric approaches to determining the area of the field of view. The Institute of Making at UCL and the Department of Mechanical Engineering at UCL assisted with the design and manufacture of the laser housings. Tim Nattkemper and Daniel Langenkämper facilitated the authors’ use of the BIIGLE platform. Michael Darling assisted with video sled deployment and video data management during the cruise aboard MT Helga Maria. The manuscript was improved by the comments of two reviewers.
Supplementary Material
The Supplementary Material for this article can be found online at: https://www.frontiersin.org/articles/10.3389/fmars.2020.00460/full#supplementary-material
References
Ardron, J. A., Clark, M. R., Penney, A. J., Hourigan, T. F., Rowden, A. A., Dunstan, P. K., et al. (2014). A systematic approach towards the identification and protection of vulnerable marine ecosystems. Mar. Policy 49, 146–154. doi: 10.1016/j.marpol.2013.11.017
Auster, P. J., Gjerde, K., Heupel, E., Watling, L., Grehan, A., and Rogers, A. D. (2010). Definition and detection of vulnerable marine ecosystems on the high seas: problems with the “move-on” rule. ICES J. Mar. Sci. 68, 254–264. doi: 10.1093/icesjms/fsq074
Baker, K. D., Wareham, V. E., Snelgrove, P. V., Haedrich, R. L., Fifield, D. A., Edinger, E. N., et al. (2012). Distributional patterns of deep-sea coral assemblages in three submarine canyons off Newfoundland, Canada. Mar. Ecol. Prog. Ser. 445, 235–249. doi: 10.3354/meps09448
Barthelmé, S. (2017). imager: Image Processing Library Based on ‘CImg’. R package Version 0.40.2. Available online at: https://CRAN.R-project.org/package=imager (accessed April 12, 2018).
Bell, J., Guijarro, E., and Kenny, A. (2019). Demersal fishing in areas beyond national jurisdiction: a comparative analysis of Regional Fisheries Management Organisations. Front. Mar. Sci. 6:596. doi: 10.3389/fmars.2019.00596
Buhl-Mortensen, L., Buhl-Mortensen, P., Dolan, M. F., and Holte, B. (2015). The MAREANO programme–A full coverage mapping of the Norwegian off-shore benthic environment and fauna. Mar. Biol. Res. 11, 4–17. doi: 10.1080/17451000.2014.952312
Buhl-Mortensen, L., Burgos, J. M., Steingrund, P., Buhl-Mortensen, P., Ólafsdóttir, S. H., and Ragnarsson, S. Á. (2019). Vulnerable Marine Ecosystems (VMEs): Coral and Sponge VMEs in Arctic and Sub-Arctic Waters–Distribution and Threats. Copenhagen: Nordic Council of Ministers.
Buhl-Mortensen, L., and Mortensen, P. B. (2005). “Distribution and diversity of species associated with deep-sea gorgonian corals off Atlantic Canada,” in Cold-Water Corals and Ecosystems, eds A. Freiwald, and J. M. Roberts (Berlin: Springer), 849–879. doi: 10.1007/3-540-27673-4_44
Bullimore, R. D., Foster, N. L., and Howell, K. L. (2013). Coral-characterized benthic assemblages of the deep Northeast Atlantic: defining “Coral Gardens” to support future habitat mapping efforts. ICES J. Mar. Sci. 70, 511–522. doi: 10.1093/icesjms/fss195
Cappell, R., Lassen, H., Holt, T., and Bekkevold, S. (2017). Public Certification Report for the Initial Assessment of the West Greenland Offshore Greenland halibut fishery. Høvik: DNV GL Business Assurance.
Cappell, R., Mouat, B., and Hambrey, J. (2018). West Greenland Coldwater Prawn Fishery: Public Certification Report. Edinburgh: Acoura Marine Ltd.
Cordes, E., Nybakken, J., and VanDykhuizen, G. (2001). Reproduction and growth of Anthomastus ritteri (Octocorallia: Alcyonacea) from Monterey Bay, California, USA. Mar. Biol. 138, 491–501. doi: 10.1007/s002270000470
Danovaro, R., Aguzzi, J., Fanelli, E., Billett, D., Gjerde, K., Jamieson, A., et al. (2017). An ecosystem-based deep-ocean strategy. Science 355, 452–454. doi: 10.1126/science.aah7178
Davies, C. E., Moss, D., and Hill, M. O. (2004). EUNIS Habitat Classification Revised 2004. Paris: European Topic Centre on Nature Protection and Biodiversity, 127–143.
Davies, J., Guillaumont, B., Tempera, F., Vertino, A., Beuck, L., Ólafsdóttir, S., et al. (2017). A new classification scheme of European cold-water coral habitats: implications for ecosystem-based management of the deep sea. Deep Sea Res. Part II Top. Stud. Oceanogr. 145, 102–109. doi: 10.1016/j.dsr2.2017.04.014
Devine, B. M., Wheeland, L. J., de Moura Neves, B., and Fisher, J. A. D. (2019). Baited remote underwater video estimates of benthic fish and invertebrate diversity within the eastern Canadian Arctic. Polar Biol. 42, 1323–1341. doi: 10.1007/s00300-019-02520-5
FAO (2009). Report of the Technical Consultation on International Guidelines for the Management of Deep-sea Fisheries in the High Seas. Rome: Food and Agriculture Organisation.
Freese, L., Auster, P. J., Heifetz, J., and Wing, B. L. (1999). Effects of trawling on seafloor habitat and associated invertebrate taxa in the Gulf of Alaska. Mar. Ecol. Prog. Ser. 182, 119–126. doi: 10.3354/meps182119
Gjerde, K., Clark, M. R., Rogers, A., and Hall-Spencer, J. (2008). The Science Behind the Guidelines: A Scientific Guide to the FAO Draft International Guidelines (December 2007) for the Management of Deep-Sea Fisheries in the High Seas and Examples of How the Guidelines may be Practically Implemented. Plymouth: University of Plymouth.
Gougeon, S., Kemp, K., Blicher, M., and Yesson, C. (2017). Mapping and classifying the seabed of the West Greenland continental shelf. Estuar. Coast. Shelf Sci. 187, 231–240. doi: 10.1016/j.ecss.2017.01.009
Government of Greenland (2017). Selvstyrets Bekendtgørelse nr. 4 af 30. Marts 2017 om Tekniske Bevaringsforanstaltninger i Fiskeriet. Government of Greenland Executive Order no. 4 of 30 March 2017 on Technical Conservation Measures in Fishing. Nuuk: Departementet for Finanser og Skatter.
Government of Greenland (2018). Beskyttelse af de Sårbare og Tidligere Uberørte Havmiljøområder i Melvillebugten. Available: https://naalakkersuisut.gl//da/Naalakkersuisut/Nyheder/2018/01/2301_melvillebugten (accessed August 22, 2019).
Government of Greenland (2020). Minerals and Petroleum Licence Map. Mineral Resources Authority. Available online at: https://asiaq.maps.arcgis.com/apps/webappviewer/index.html?id=819ff201b76f44f99b31da7ef630c18e&locale=en (accessed April 04, 2020).
Griffith, D. M., Veech, J. A., and Marsh, C. J. (2016). Cooccur: probabilistic species co-occurrence analysis in R. J. Stat. Softw. 69, 1–17.
Guillaumont, B., Tempera, F., Vertino, J., Beuck, L., Ólafsdóttir, S., Smith, C., et al. (2016). CoralFISH Northeast Atlantic and Mediterranean Cold-Water Coral Habiats Catalogue (version 2). Anavyssos: Hellenic Centre for Marine Research.
Gutt, J. (2002). “On the direct impact of ice on marine benthic communities, a review,” in Ecological Studies in the Antarctic Sea Ice Zone, eds W. E. Arntz et al. (Berlin: Springer), 157–168. doi: 10.1007/978-3-642-59419-9_21
Henry, L., Kenchington, E. L., and Silvaggio, A. (2003). Effects of mechanical experimental disturbance on aspects of colony responses, reproduction, and regeneration in the cold-water octocoral Gersemia rubiformis. Can. J. Zool. 81, 1691–1701. doi: 10.1139/z03-161
Howell, K., Davies, J., and Narayanaswamy, B. (2010). Identifying deep-sea megafaunal epibenthic assemblages for use in habitat mapping and marine protected area network design. J. Mar. Biol. Assoc. U.K. 90, 33–68. doi: 10.1017/s0025315409991299
Huvenne, V., Bett, B., Masson, D., Le Bas, T., and Wheeler, A. (2016). Effectiveness of a deep-sea cold-water coral Marine Protected Area, following eight years of fisheries closure. Biol. Conserv. 200, 60–69. doi: 10.1016/j.biocon.2016.05.030
ICES (2007). Report of the Working Group on Deep-water Ecology (WGDEC). Copenhagen: International Council for the Exploration of the Seas.
ICES (2019a). “Cod (Gadus morhua) in NAFO divisions 1A–1E, offshore (West Greenland),” in ICES Advice on Fishing Opportunities, Catch, and Effort, Arctic Ocean and Greenland Sea Ecoregions, (Copenhagen: International Council for the Exploration of the Seas).
ICES (2019b). “Cod (Gadus morhua) in NAFO Subdivisions 1A–1E (Offshore West Greenland),” in North Western Working Group (NWWG) Scientific Reports, ed. K. Kristinsson (Copenhagen: International Council for the Exploration of the Seas).
Jacobsen, R. B. (2018). “The sustainability of what? Stocks, communities, the public purse?” in The Politics of Sustainability in the Arctic, eds U. P. Gad and J. Strandsbjerg (Abingdon: Routledge), 33–47.
Jørgensen, L. L., Blicher, M., Bluhm, B., Christiansen, J. S., Fredriksen, R., Hammeken, N., et al. (2018). Detecting Changes in the Arctic Ecosystem–Long-Term Benthos Monitoring Network for Detecting Changes in the Arctic Benthic Ecosystem (LTM-Benthos) 2017–2020. Bergen: Norwegian Institute of Marine Research.
Jørgensen, O. A., Tendal, O. S., and Arboe, N. H. (2013). “Preliminary mapping of the distribution of corals observed off West Greenland as inferred from bottom trawl surveys 2010-2012,” in Proceedings of the 35th Scientific Council Research Meeting NAFO, Halifax, NS.
Juul-Pedersen, T., Arendt, K. E., Mortensen, J., Krawczyk, D., Retzel, A., Nygaard, R., et al. (2015). “The MarineBasis programme 2015,” in Nuuk Ecological Research Operations 9th Annual Report, 2015, eds E. Topp-Jørgensen, J. Hansen, and T. R. Christensen (Aarhus: Aarhus University).
Kenchington, E., Yashayaev, I., Tendal, O. S., and Jørgensbye, H. (2017). Water mass characteristics and associated fauna of a recently discovered Lophelia pertusa (Scleractinia: Anthozoa) reef in Greenlandic waters. Polar Biol. 40, 321–337. doi: 10.1007/s00300-016-1957-3
Krieger, K. J., and Wing, B. L. (2002). Megafauna associations with deepwater corals (Primnoa spp.) in the Gulf of Alaska. Hydrobiologia 471, 83–90.
Langenkämper, D., Zurowietz, M., Schoening, T., and Nattkemper, T. W. (2017). BIIGLE 2.0 - browsing and annotating large marine image collections. Front. Mar. Sci. 4:83. doi: 10.3389/fmars.2017.00083
McConnaughey, R., Mier, K., and Dew, C. (2000). An examination of chronic trawling effects on soft-bottom benthos of the eastern Bering Sea. ICES J. Mar. Sci. 57, 1377–1388. doi: 10.1006/jmsc.2000.0906
McFadden, C. S., France, S. C., Sánchez, J. A., and Alderslade, P. (2006). A molecular phylogenetic analysis of the Octocorallia (Cnidaria: Anthozoa) based on mitochondrial protein-coding sequences. Mol. Phylogenet. Evol. 41, 513–527. doi: 10.1016/j.ympev.2006.06.010
Millard, R., and Seaver, G. (1990). An index of refraction algorithm for seawater over temperature, pressure, salinity, density, and wavelength. Deep Sea Res. Part A Oceanogr. Res. Pap. 37, 1909–1926. doi: 10.1016/0198-0149(90)90086-b
Molodtsova, T. N. (2013). Deep-sea mushroom soft corals (Octocorallia: Alcyonacea: Alcyoniidae) of the northern mid-Atlantic ridge. Mar. Biol. Res. 9, 488–515. doi: 10.1080/17451000.2012.750427
Morato, T., Pham, C. K., Pinto, C., Golding, N., Ardron, J. A., Muñoz, P. D., et al. (2018). A multi criteria assessment method for identifying Vulnerable Marine Ecosystems in the North-East Atlantic. Front. Mar. Sci. 5:460. doi: 10.3389/fmars.2018.00460
Morato, T., Watson, R., Pitcher, T. J., and Pauly, D. (2006). Fishing down the deep. Fish Fish. 7, 24–34. doi: 10.1111/j.1467-2979.2006.00205.x
Morlighem, M., Williams, C. N., Rignot, E., An, L., Arndt, J. E., Bamber, J. L., et al. (2017). BedMachine v3: Complete bed topography and ocean bathymetry mapping of Greenland from multibeam echo sounding combined with mass conservation. Geophys. Res. Lett. 44, 11051–11061.
Mortensen, B. O. G. (2014). The quest for resources – the case of Greenland. J. Military Strateg. Stud. 15, 93–128.
MSC (2014). MSC Fisheries Certification Requirements and Guidance, Version 2.0. London: Marine Stewardship Council.
Muñoz, P. D., and Sayago-Gil, M. (2011). An overview of cold-water coral protection on the high seas: the Hatton bank (NE Atlantic)—a case study. Mar. Policy 35, 615–622. doi: 10.1016/j.marpol.2011.01.023
Murillo, F. J., Durán Muñoz, P., Altuna, A., and Serrano, A. (2010). Distribution of deep-water corals of the Flemish Cap, Flemish Pass, and the Grand Banks of Newfoundland (Northwest Atlantic Ocean): interaction with fishing activities. ICES J. Mar. Sci. 68, 319–332. doi: 10.1093/icesjms/fsq071
Myers, P. G., Kulan, N., and Ribergaard, M. H. (2007). Irminger water variability in the West Greenland Current. Geophys. Res. Lett. 34:L17601.
Nakajima, R., Komuku, T., Yamakita, T., Lindsay, D. J., Jintsu-Uchifune, Y., Watanabe, H., et al. (2014). A new method for estimating the area of the seafloor from oblique images taken by deep-sea submersible survey platforms. JAMSTEC Rep. Res. Dev. 19, 59–66. doi: 10.5918/jamstecr.19.59
NEAFC (2014). Recommendation on the Protection of Vulnerable Marine Ecosystems in the NEAFC Regulatory Area. London: North East Atlantic Fisheries Commission.
Ontrup, J., Ehnert, N., Bergmann, M., and Nattkemper, T. W. (2009). “BIIGLE-Web 2.0 enabled labelling and exploring of images from the Arctic deep-sea observatory HAUSGARTEN,” in Proceedings of the International Oceans ’09 Conference and Exhibition OCEANS 2009-EUROPE (Piscataway, NJ: IEEE).
Patent, D. H. (1970). Life history of the basket star, Gorgonocephalus eucnemis (Müller & Troschel)(Echinodermata; Ophiuroidea). Ophelia 8, 145–159. doi: 10.1080/00785326.1970.10429556
Pérez, C. D., de Moura Neves, B., Cordeiro, R. T., Williams, G. C., and Cairns, S. D. (2016). “Diversity and distribution of Octocorallia,” in The Cnidaria, Past, Present and Future, eds S. Goffredo and Z. Dubinsky (Berlin: Springer), 109–123. doi: 10.1007/978-3-319-31305-4_8
Poulsen, L. K., and Reuss, N. (2002). The plankton community on Sukkertop and Fylla Banks off West Greenland during a spring bloom and post-bloom period: hydrography, phytoplankton and protozooplankton. Ophelia 56, 69–85. doi: 10.1080/00785236.2002.10409491
R Core Team (2013). R: A Language and Environment for Statistical Computing. Vienna: R Foundation for Statistical Computing.
Ramirez-Llodra, E., Brandt, A., Danovaro, R., De Mol, B., Escobar, E., German, C., et al. (2010). Deep, diverse and definitely different: unique attributes of the world’s largest ecosystem. Biogeosciences 7, 2851–2899. doi: 10.5194/bg-7-2851-2010
Riaz, M., Park, S., Ahmad, M. B., Rasheed, W., and Park, J. (2008). “Generalized laplacian as focus measure,” in International Conference on Computational Science, eds M. Bubak, G. D. van Albada, J. Dongarra, and P. M. A. Sloot (Berlin: Springer).
Rogers, A. D., and Gianni, M. (2011). Implementation of UNGA Resolutions 61/105 and 64/72 in the Management of Deep-Sea Fisheries on the High Seas. Darby, PA: DIANE Publishing.
Rogers, A. D., Kemp, K. M., Davies, A. J., and Lisa Taylor, M. (2015). The diseases of deep-water corals. Dis. Coral 416–441. doi: 10.1002/9781118828502.ch32
Sherwood, O. A., and Edinger, E. N. (2009). Ages and growth rates of some deep-sea gorgonian and antipatharian corals of Newfoundland and Labrador. Can. J. Fish. Aquat. Sci. 66, 142–152. doi: 10.1139/f08-195
Streuff, K., Cofaigh, C. Ó., Hogan, K., Jennings, A., Lloyd, J. M., Noormets, R., et al. (2017). Seafloor geomorphology and glacimarine sedimentation associated with fast-flowing ice sheet outlet glaciers in Disko Bay, West Greenland. Quat. Sci. Rev. 169, 206–230. doi: 10.1016/j.quascirev.2017.05.021
Sun, Z., Hamel, J.-F., and Mercier, A. (2010). Planulation periodicity, settlement preferences and growth of two deep-sea octocorals from the northwest Atlantic. Mar. Ecol. Prog. Ser. 410, 71–87. doi: 10.3354/meps08637
Sun, Z., Hamel, J. F., and Mercier, A. (2011). Planulation, larval biology, and early growth of the deep-sea soft corals Gersemia fruticosa and Duva florida (Octocorallia: Alcyonacea). Invertebr. Biol. 130, 91–99. doi: 10.1111/j.1744-7410.2011.00229.x
The Economic Council (2017). Nunatta Aningaasaqarnera: Greenland’s Economy. Nuuk: The Economic Council.
Treibitz, T., Schechner, Y., Kunz, C., and Singh, H. (2011). Flat refractive geometry. IEEE Trans. Patt. Anal. Mach. Intell. 34, 51–65. doi: 10.1109/tpami.2011.105
UNEP-WCMC (2019). Protected Area Profile for Greenland from the World Database of Protected Areas, October 2019. Available online at: https://www.protectedplanet.net/country/GL (accessed October 25, 2019).
UNGA (2006). Resolution 61/105. Sustainable Fisheries, Including Through the 1995 Agreement for the Implementation of the Provisions of the United Nations Convention on the Law of the Sea of 10 December 1982 Relating to the Conservation and Management of straddling Fish Stocks and Highly Migratory Fish Stocks, and Related Instruments. New York, NY: United Nations General Assembly.
Veech, J. A. (2013). A probabilistic model for analysing species co-occurrence. Glob. Ecol. Biogeogr. 22, 252–260. doi: 10.1111/j.1466-8238.2012.00789.x
Watling, L., and Auster, P. J. (2005). “Distribution of deep-water Alcyonacea off the Northeast Coast of the United States,” in Cold-Water Corals and Ecosystems, eds A. Freiwald, and J. M. Roberts (Berlin: Springer), 279–296. doi: 10.1007/3-540-27673-4_13
Williams, G. C. (2013). New taxa and revisionary systematics of alcyonacean octocorals from the Pacific coast of North America (Cnidaria, Anthozoa). ZooKeys 283, 15–42.
Witherell, D., and Coon, C. (2000). “Protecting gorgonian corals off Alaska from fishing impacts,” in Proceedings of the Nova Scotian Institute of Science, Halifax, NS, 117–115.
Yesson, C., Fisher, J., Gorham, T., Turner, C. J., Arboe, N. H., Blicher, M. E., et al. (2017). The impact of trawling on the epibenthic megafauna of the west Greenland shelf. ICES J. Mar. Sci. 866–876. doi: 10.1093/icesjms/fsw206
Keywords: deep-sea, coral garden, spatial management, fishery management, towed video sled, cauliflower corals, benthic habitats
Citation: Long S, Sparrow-Scinocca B, Blicher ME, Hammeken Arboe N, Fuhrmann M, Kemp KM, Nygaard R, Zinglersen K and Yesson C (2020) Identification of a Soft Coral Garden Candidate Vulnerable Marine Ecosystem (VME) Using Video Imagery, Davis Strait, West Greenland. Front. Mar. Sci. 7:460. doi: 10.3389/fmars.2020.00460
Received: 31 October 2019; Accepted: 22 May 2020;
Published: 29 June 2020.
Edited by:
Christopher Kim Pham, University of the Azores, PortugalReviewed by:
Travis William Washburn, University of Hawai‘i at Mānoa, United StatesTina Molodtsova, P. P. Shirshov Institute of Oceanology (RAS), Russia
Copyright © 2020 Long, Sparrow-Scinocca, Blicher, Hammeken Arboe, Fuhrmann, Kemp, Nygaard, Zinglersen and Yesson. This is an open-access article distributed under the terms of the Creative Commons Attribution License (CC BY). The use, distribution or reproduction in other forums is permitted, provided the original author(s) and the copyright owner(s) are credited and that the original publication in this journal is cited, in accordance with accepted academic practice. No use, distribution or reproduction is permitted which does not comply with these terms.
*Correspondence: Stephen Long, U3RlcGhlbi5sb25nLjE2QHVjbC5hYy51aw==
 Stephen Long
 Bridget Sparrow-Scinocca
 Martin E. Blicher
 Nanette Hammeken Arboe
 Mona Fuhrmann
 Kirsty M. Kemp
 Rasmus Nygaard4
 Karl Zinglersen
 Chris Yesson