Introduction
Large national and international observational efforts over recent decades have provided extensive and invaluable datasets of a range of ocean variables. Compiled large datasets, structured, or unstructured, are a powerful tool that allow scientists to access and synthesize data collected over large spatial and temporal scales. The data treatment approaches for any element in the ocean could lead to new global perspectives of their distribution patterns and to a better understanding of large-scale oceanic processes and their impact on other biogeochemical cycles, which may not be evident otherwise. Ocean chemistry Big Data analysis may not just be limited to distribution patterns, but may be used to assess how sampling efforts and analytical methodologies can be improved. Furthermore, a systematic global scale assessment of data is important to evaluate the gaps in knowledge and to provide avenues for future research. In this context, here we provide an extensive compilation of oceanic aluminum (Al) concentration data from global ocean basins, including data available in the GEOTRACES Intermediate Data product (Schlitzer et al., 2018), but also thus far unpublished data.
Aluminum is the third most abundant element in the continental crust (Wedepohl, 1995), but is only found in trace amounts in seawater. Aluminum is supplied to the oceans through atmospheric deposition, hydrothermal venting, sediment resuspension, diffusion from sediment pore waters, and continental drainage (e.g., fluvial). The element is a widely used tracer of atmospheric deposition to the surface ocean (Measures and Brown, 1996; Measures and Vink, 2000; Grand et al., 2015a; Menzel Barraqueta et al., 2019), and is also used as a tracer of water masses and input sources (Measures and Edmond, 1990; Brown et al., 2010; Resing et al., 2015; Menzel Barraqueta et al., 2018). Dissolved Al (dAl) is particle reactive, and displays a scavenged-type vertical profile in many ocean regions (Bruland et al., 2013). However, recent dissolved Al data reveal that this element also displays a recycled or reversible scavenging type distribution in certain ocean regions (Van Hulten et al., 2013; Rolison et al., 2015; Menzel Barraqueta et al., 2018). Since the first publication on Al concentrations in seawater [(Hydes, 1979); sampling year 1973], sampling and analytical techniques [review in (Tria et al., 2007)] have improved, contamination risks have been reduced, and analytical precision, accuracy and detection limit improved. For example, the introduction of a solid-phase extraction method (Resing and Measures, 1994) with further optimizations (Brown and Bruland, 2008) have yielded detection limits at the sub-nanomolar level (e.g., 0.1 nM) which are lower than previous values (e.g., 1.85 nM, Hydes and Liss, 1976). This may indicate lower Al concentrations measured in recent years (see section Data Variability Over Time). Dissolved Al is defined as the Al concentration in the filtered fraction (filter cut-off 0.2–0.45 μm) of a solution. Studies have shown that only a small percentage of dAl is present in the colloidal phase in open ocean waters (Dammshäuser and Croot, 2012) and that Al concentrations in unfiltered and unacidified samples measured onboard shortly after collection are consistent with those from filtered samples as the dissolution of particulate Al is negligible at the pH of natural seawater (Measures et al., 1986). As a result of the development of intercalibration exercises [e.g., SAFE, (Johnson et al., 2007)] and best sampling practices and protocols (e.g., GEOTRACES Cookbook, www.geotraces.org) a recommendation on filtration protocols for all trace metals has been adopted in order to ensure data comparability among different groups. In this manuscript we focus on dAl and make the simple assumption that the strong vertical and basin-scale gradients in dAl concentrations within the ocean are larger than the systematic differences between unfiltered (unacidified and measured shortly after collection) and filtered samples.
The aim of this manuscript is to provide the scientific community with a global oceanic dAl database containing historical and recent data. We provide general global statistics with a focus on spatial, temporal and seasonal dAl variability. There is no intention to create a fully calibrated database, since this has only become possible in recent years due to the efforts made by the GEOTRACES programme (Frank et al., 2003) that aims to provide the scientific community with inter-calibrated datasets in the form of intermediate data products (Mawji et al., 2015; Schlitzer et al., 2018). Nevertheless, having a readily accessible database, even if not fully intercalibrated, is fundamental for research and comparison purposes. We note that the amount of intercalibrated dAl data will steadily increase in the coming years as Al is a key parameter of the GEOTRACES programme.
Description of the Database
The global oceanic and coastal dAl database file (Oceanic_Al_Menzel.xlsx) compiled here is accessible via the following link (https://doi.org/10.25413/sun.12167877.v1). The database forms an extension of the data files gathered by Gehlen et al. (2003) and Van Hulten et al. (2013), who collated Al data while applying internally chosen quality standards for specific, purpose driven, modeling efforts. We note another modeling manuscript (Han et al., 2008), that also compiled Al oceanic data; however, none of these manuscripts provide publicly available Al data. The Al data compiled here includes a considerable amount of unpublished data (ca. 20%, Table 1) which will be useful for the community and may foster further scientific discussion. Unpublished data may not be reproduced without prior permission from the respective data originator, whose details are found in the database file (fourth tab). We compiled data reported in published papers, data reported in publicly accessible data-bases and additionally data was obtained directly from researchers if quantitative Al data was not reported in a publication (a list of Al manuscripts whose data is not included can be found at the end of Table 1). Despite our best efforts to retrieve all available Al data by searching the literature and approaching researchers we cannot assert that all historical data is included in the data file (apart from the previous mentioned manuscripts). Thus, we encourage researchers to submit generated Al data (to JLMB) to keep updating the Al database.
Table 1
| Sampling year | Month | Ocean/Sea | Region | Filter (Yes/No) | Reference material | References |
|---|---|---|---|---|---|---|
| 1973 | 10 | Atlantic | Central | N | N | Hydes, 1979 |
| 1976 | 5, 9 | Mediterranean | – | Y | N | Stoffyn and Mackenzie, 1982 |
| 1977 | 4 | Atlantic | Barbados | Y | N | Stoffyn and Mackenzie, 1982 |
| 1977 | 9 | Atlantic | Central | N | N | Hydes, 1979 |
| 1978 | 7 | Atlantic | – | Y | N | Stoffyn and Mackenzie, 1982 |
| 1979 | 3–5 | Arctic | Central | N | N | Moore, 1981 |
| 1980 | 9, 10 | Pacific | Northeast | Y | N | Orians and Bruland, 1986 |
| 1982 | 1,2 | Atlantic | Northeast | N | N | Hydes, 1983 |
| 1982 | 3, 4 | Atlantic | Northeast | N | N | Kremling, 1985 |
| 1982 | – | Atlantic | – | – | – | Moore and Millward, 1984 |
| 1983 | 7 | Pacific | Northeast | Y | N | Orians and Bruland, 1986 |
| 1983 | 11 | Atlantic | Northwest | N | N | Measures et al., 1984 |
| 1984 | 4, 5 | Atlantic | Central | – | N | Hydes et al., 1986 |
| 1984 | Monthly | Atlantic | Sargasso | – | – | Jickells et al., 1994 |
| 1984 | 7 | Atlantic | North Sea | Y | N | Kremling and Hydes, 1988 |
| 1984 | 6, 7 | Pacific | Northeast | Y | N | Orians and Bruland, 1986 |
| 1985 | Monthly | Atlantic | Sargasso | – | – | Jickells et al., 1994 |
| 1987 | 7, 8 | Indian | Arabian Sea | N | N | Narvekar and Singbal, 1993 |
| 1987 | 5, 6 | Mediterranean | – | Y | N | Hydes et al., 1988 |
| 1988 | 10, 11 | Indian | Arabian Sea | N | N | Narvekar and Singbal, 1993 |
| 1988 | 1–3 | Atlantic | South | N | N | Measures and Edmond, 1990 |
| 1988 | 4 | Atlantic | Northwest | Y and N | N | Moran and Moore, 1991 |
| 1988 | 1, 2 | Indian | Arabian Sea | N | N | Upadhyay and Gupta, 1994 |
| 1988 | 11, 12, 1 | Southern | – | N | N | Van Bennekom et al., 1991 |
| 1988 | – | Mediterranean | West | Y | N | Chou and Wollast, 1997 |
| 1989 | 1 | Southern | Weddell Sea | N | N | Moran et al., 1992 |
| 1989 | 7 | Mediterranean | West | Y | N | Chou and Wollast, 1997 |
| 1990 | 5 | Atlantic | Latitudinal | N | N | Helmers and Rutgers van der Loef, 1993 |
| 1990 | 10, 11 | Atlantic | Latitudinal | N | N | Helmers and Rutgers van der Loef, 1993 |
| 1990 | 3 | Atlantic | Eastern | Y | N | Measures, 1995 |
| 1990 | 4 | Mediterranean | West | Y | N | Chou and Wollast, 1997 |
| 1991 | 2,3 | Southern | Weddell Sea | Y | N | Sanudo-Wilhelmy et al., 2002 |
| 1991 | 3 | Atlantic | Northeast | N | N | Gelado-Caballero et al., 1996 |
| 1992 | 10, 11 | Pacific | Coral & Tasman Sea | N | N | Obata et al., 2008 |
| 1993 | 8 | Atlantic | North | Y and N | N | Hall and Measures, 1998 |
| 1993 | 3–5 | Indian | Enderby & Crozet Basin | – | N | Van Beusekom et al., 1997 |
| 1994 | 7–9 | Arctic | – | N | N | Measures, 1999 |
| 1995 | 1, 2 | Indian | Arabian Sea | Y | N | Measures and Vink, 1999 |
| 1995 | 3, 4 | Indian | Arabian Sea | Y | N | Measures and Vink, 1999 |
| 1995 | 5 | Indian | Arabian Sea | N | N | Schüßler et al., 2005 |
| 1995 | 7 | Indian | Arabian Sea | N | N | Schüßler et al., 2005 |
| 1995 | 7, 8 | Indian | Arabian Sea | Y | N | Measures and Vink, 1999 |
| 1995 | 8, 9 | Indian | Arabian Sea | Y | N | Measures and Vink, 1999 |
| 1995 | 10, 11 | Indian | Arabian Sea | Y | N | Measures and Vink, 1999 |
| 1996 | 8, 9 | Atlantic | Latitudinal | N | N | Bowie et al., 2002 |
| 1996 | 12 | Atlantic | Northeast | N | N | Gelado-Caballero unpublished |
| 1996 | 7 | Pacific | Western | Y | N | Obata et al., 2004 |
| 1996 | 5, 6 | Atlantic | Latitudinal | Y | N | Vink and Measures, 2001 |
| 1997 | 2, 3 | Indian | Arabian Sea | N | N | Schüßler et al., 2005 |
| 1997 | 7, 8 | Atlantic | Northeast | N | N | Gelado-Caballero unpublished |
| 1997 | – | Southern | Pacific sector | Y | N | Measures unpublished jgofs |
| 1998 | – | Southern | Pacific sector | Y | N | Measures unpublished jgofs |
| 1998 | 5, 6 | Atlantic | Latitudinal | N | N | Bowie et al., 2002 |
| 1998 | 3 | Atlantic | Northeast | Y | N | de Jong et al., 2007 |
| 1998 | – | Pacific | – | Y | N | Obata et al., 2007 |
| 2001 | 3–5 | Pacific | Northwest | N | N | Johnson et al., 2003 |
| 2002 | 10 | Atlantic | Northeast | Y | N | Kramer et al., 2004 |
| 2003 | 6–8 | Atlantic | Latitudinal | Y | N | Measures et al., 2008a |
| 2004 | 2, 3 | Southern | Atlantic sector | Y | N | Measures et al., 2013 |
| 2004 | 1 | Pacific | Equatorial | Y | N | Kaupp et al., 2011 |
| 2005 | 10, 11 | Atlantic | East | N | N | Pohl et al., 2011 |
| 2005 | 8, 9 | Pacific | North | Y | Y | Zheng et al., 2019 |
| 2006 | 8, 9 | Pacific | Equatorial | Y | N | Slemons et al., 2010 |
| 2007 | 1, 2 | Southern | Tasman Sea | Y | Y | Remenyi, 2013 |
| 2007 | – | Atlantic | Northeast | Y | Y | Middag test |
| 2007 | 7–9 | Arctic | – | Y | Y | Middag et al., 2009 |
| 2007 | 2, 3 | Indian | South | Y | N | Grand et al., 2015a |
| 2007 | 4 | Indian | North | Y | N | Grand et al., 2015a |
| 2008 | 3 | Southern | Atlantic sector | Y | Y | Middag et al., 2011 |
| 2008 | 3 | Southern | Atlantic sector | Y | Y | Middag et al., 2012 |
| 2008 | 3, 4 | Southern | Australian sector | Y | Y | Remenyi, 2013 |
| 2008 | 2, 3 | Southern | Atlantic sector | Y | Y | Croot unpublished |
| 2008 | 2, 3 | Southern | Indian sector | Y | N | Grand et al., 2015b |
| 2009 | 3–5 | Indian | Longitudinal | Y | N | Grand et al., 2015b |
| 2009 | 11, 12 | Indian | Latitudinal | Y | Y | Thi Dieu Vu and Sohrin, 2013 |
| 2009 | 11, 12 | Atlantic | Tropical | Y | Y | Dammshäuser et al., 2013 |
| 2010 | 4, 5 | Atlantic | Northwest | Y | Y | Middag et al., 2015 |
| 2010 | 6, 7 | Atlantic | Northwest | Y | Y | Middag et al., 2015 |
| 2010 | 10, 11 | Atlantic | Tropical | Y | N | Measures et al., 2015 |
| 2010 | 4, 5 | Atlantic | North | Y | Y | Klar unpublished |
| 2010 | 5 | Atlantic | North | Y | Y | Klar unpublished |
| 2010 | 7, 8 | Atlantic | North | Y | Y | Klar unpublished |
| 2010 | 4, 5 | Atlantic | Latitudinal | Y | Y | Dammshäuser et al., 2013 |
| 2010 | 4, 5 | Atlantic | Latitudinal | Y | Y | Dammshauser et al., 2011 |
| 2011 | 5, 6 | Pacific | West | Y | Y | Bowie unpublished |
| 2011 | 1 | Atlantic | South | Y | Y | Klar unpublished |
| 2011 | 3, 4 | Atlantic | Southwest | Y | Y | Middag et al., 2015 |
| 2011 | 2, 3 | Atlantic | Tropical | Y | Y | Klar unpublished |
| 2011 | 2, 3 | Atlantic | Tropical | Y | Y | Schlosser et al., 2014 |
| 2011 | 7 | Pacific | North | Y | Y | Zheng et al., 2019 |
| 2012 | 8, 9 | Pacific | North | Y | Y | Zheng et al., 2019 |
| 2012 | 8 | Atlantic | Northwest | Y | Y | Middag et al., 2015 |
| 2013 | 8–10 | Atlantic | Latitudinal | Y | Y | Barrett et al., 2015 |
| 2013 | 10–12 | Pacific | South | Y | Y | Resing et al., 2015 |
| 2013 | 5, 6 | Mediterranean | – | Y | Y | Rolison et al., 2015 |
| 2013 | 7, 8 | Mediterranean | Black Sea | Y | Y | Rolison et al., 2015 |
| 2014 | 5, 6 | Atlantic | North | Y | Y | Menzel Barraqueta et al., 2018 |
| 2014 | 6 | Atlantic | Mauritania shelf | Y | Y | Rapp et al., 2019 |
| 2015 | 11, 12 | Atlantic | Southeast | Y | Y | Menzel Barraqueta unpublished |
| 2015 | 5 | Pacific | Southwest | Y | Y | Middag unpublished |
| 2016 | 5 | Pacific | Southwest | Y | Y | Middag unpublished |
| 2016 | 3, 4 | Indian | Tropical | Y | Y | Singh et al., 2020 |
| 2017 | 1–3 | Indian | BoB | Y | Y | Singh et al., 2020 |
Publications included in the database and ordered by year of sampling.
Data not included in the database (reference). Kaupp et al. (2011) (Surface data in the database); Li et al. (2013), Liu et al. (2017), Measures et al. (1986), Measures et al. (2005), Measures and Edmond (1992), Ren et al. (2006), Ren et al. (2011), Vink et al. (2000). Month refers to the month of sampling being 1 and 12 January and December, respectively. Information not available in the manuscript is noted with an interrupted dash line. Yes and No are denoted as Y and N, respectively. Region sampled refers to the location were the majority of sampling took place.
The dataset presented here includes (1) open ocean Al data for all major oceans (Atlantic, Arctic, Indian, Pacific, and Southern Oceans), (2) semi- and enclosed basins such as the Mediterranean Sea, Black Sea, and Arabian Sea and (3) regions where Al data was collected in proximity to major sources such as hydrothermal vents, shelf regions and river outflows. In some instances, a dataset includes repeated sections such as the A16N cruise which was sampled in 2003 and 2013 (Measures et al., 2008a; Barrett et al., 2015) thus providing temporally different Al concentrations for the same coordinates. Data from process studies, which, for instance, sample the same region over a determined period of time have also been included. We have also included one study which was undertaken at the LOREX site in the Arctic Ocean while the ship was drifting (Moore, 1981). In the latter case we chose a point halfway between the start and the end of sampling as station coordinates. From the dataset, we have excluded Al in brackish to freshwater environments (< salinity 25). We acknowledge that the compilation of Al concentration data would be greatly improved by accompanying ancillary parameters such as salinity, temperature, and nutrients. This could help to better understand key processes occurring within the ocean and how these controls the distribution of Al therein.
The time span covered by the database ranges from 1973 to 2017. Table 1 lists all the publications included in the database. Following publication, the file includes, if given, the following additional information for each dataset: station number, sampling year, vessel, location, analytical method, reference material, filtration, and publication reference. The file can be easily reorganized alphabetically or numerically under the following terms and options: Location (Atlantic, Arctic, Indian, Pacific, and Southern oceans, and Arabian, Black and Mediterranean Sea), reference material (Yes & No), filtration (Yes & No), sampling year etc. The dAl concentration is given in nanomolar (nM) units. In addition, a third tab records the changes made to the database following publication (e.g., in case new data are submitted).
Database
The data file contains 24,194 dAl data points and are presented in an alphabetical order in reference to the data originator. Figure 1 shows graphical representations of the dAl concentration data included in the database. Below we provide three different sets of information; (i) general sampling efforts; (ii) global dAl concentration data statistics and representative dAl depth profiles; (iii) assessment of data variability over time.
Figure 1
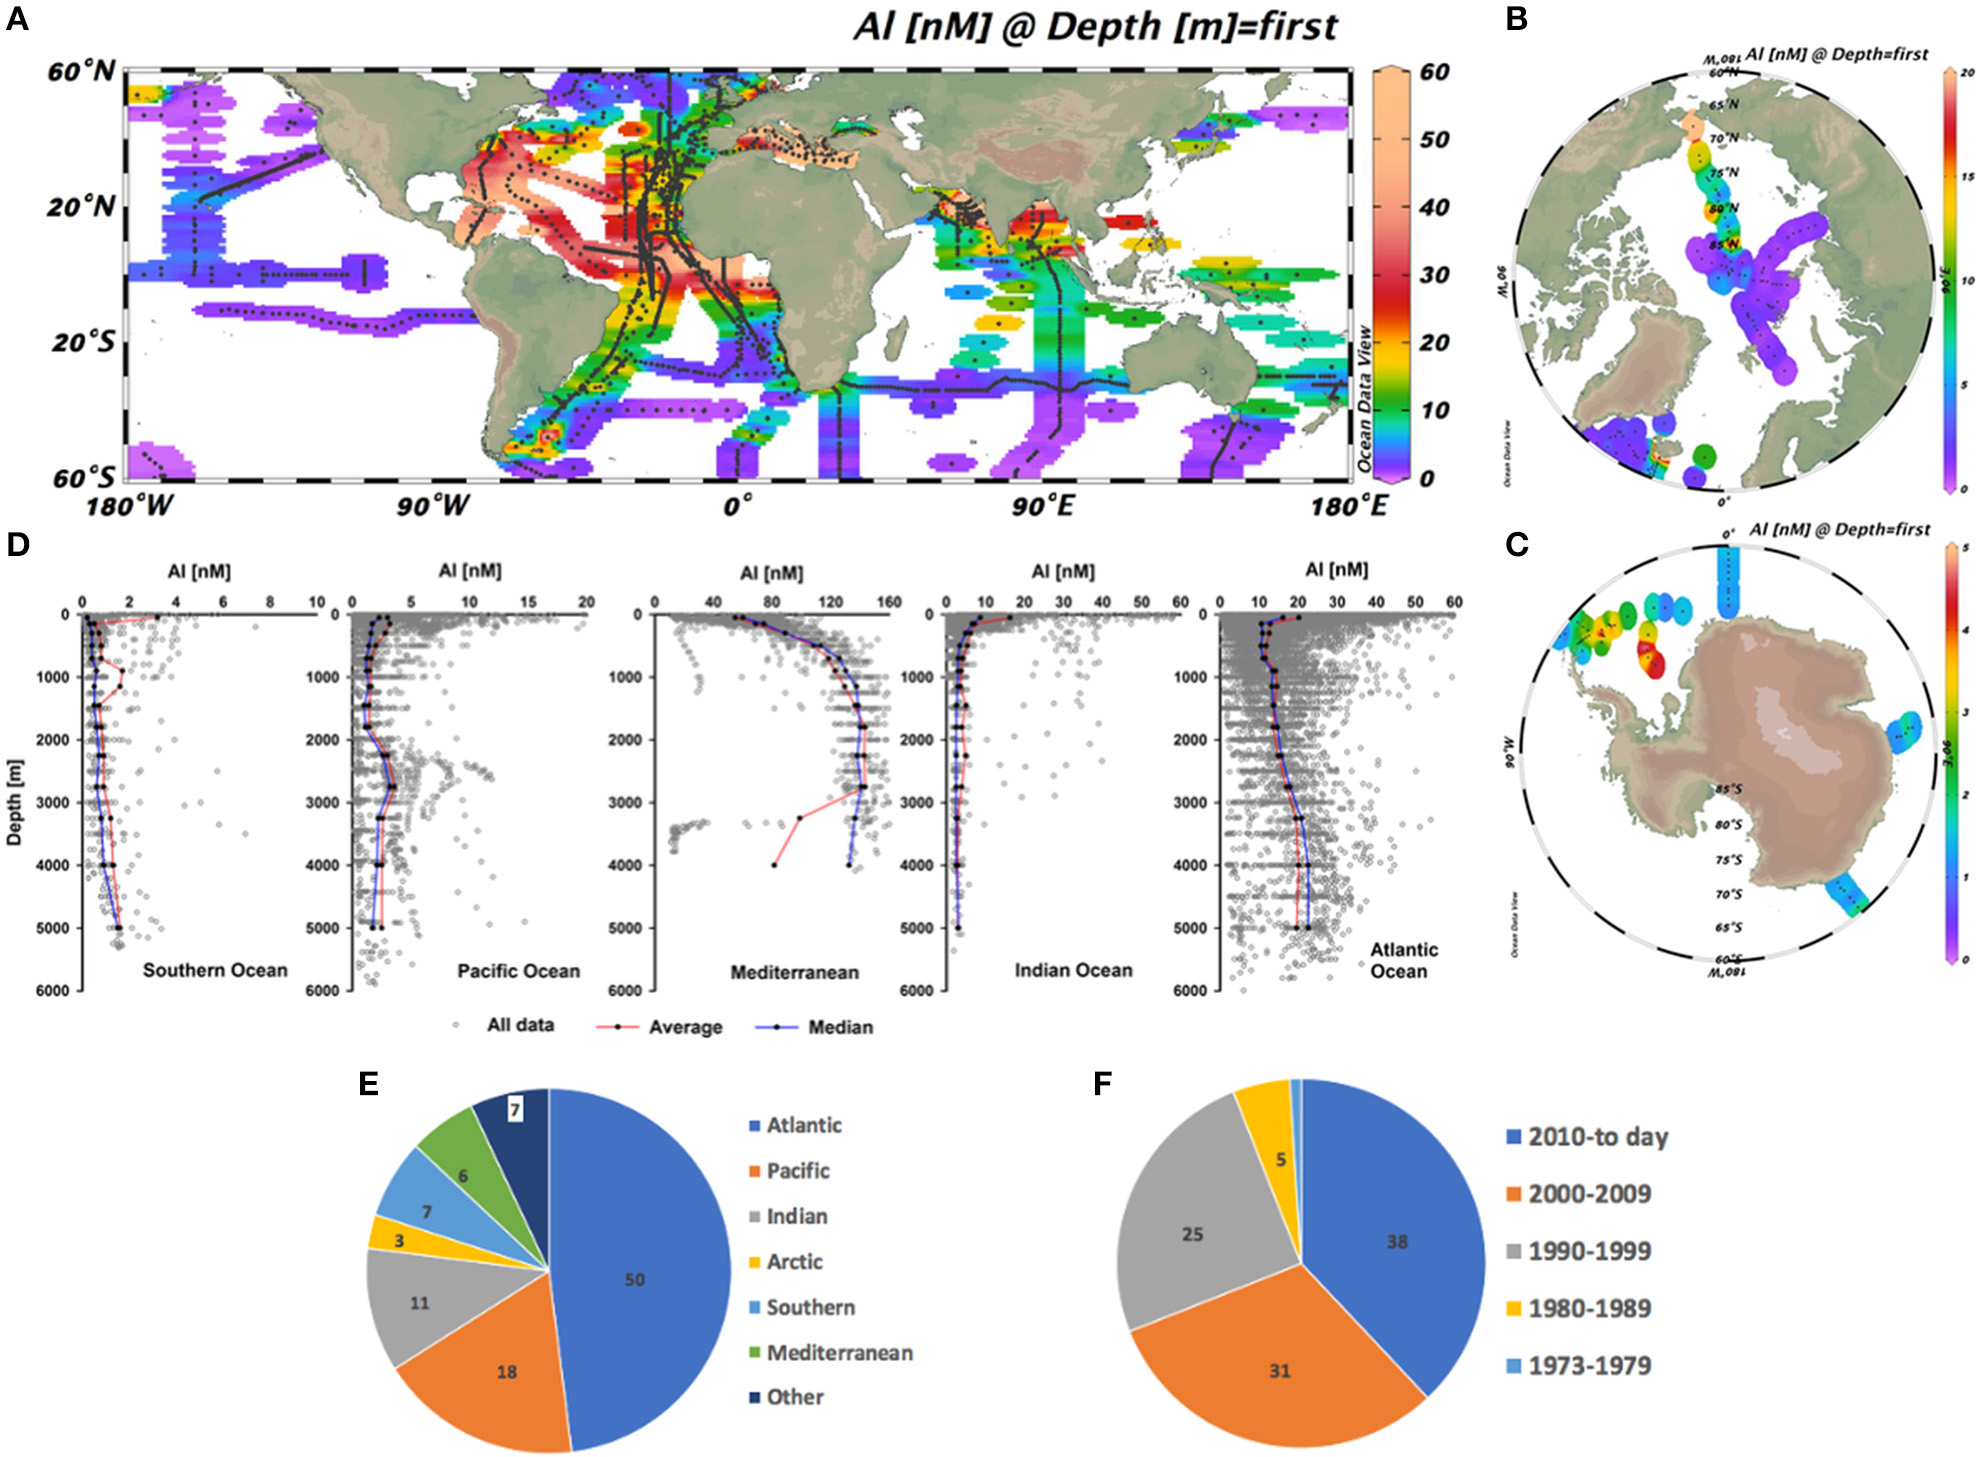
Sampling locations for AI overlaid with gridded first sampled depth AI concentration for: (A) Atlantic, Pacific, and Indian Oceans: (B) Arctic Ocean; (C) Southern Ocean. (D) Scatter plots [AI] vs depth with overlaid average and median AI profiles. For the representation of average and median profiles the depth subdivision is as follow: 0–100, 100–200, 200–400, 400–600, 600–800, 800–1,000, 1,000–1,300, 1,300–1,600, 1,600–2,000, 2,000–2,500, 2,500–3,000, 3,000–3,500, 3,500–4,500, 4,500-bottom. Pie charts showing: (E) Percentage of data included in the database per major ocean basin; (F) Percentage of data included in the database per decade.
The different regions and geographical boundaries analyzed below are: Atlantic Ocean (60 °N to 60 °S), North Atlantic (NATL, 60 °N to 30 °N), tropical Atlantic (TATL, 30 °N to 30 °S), South Atlantic (SATL, 30° to 60° S), Pacific Ocean (PAC, 60 °N to 60 °S), Indian Ocean (IND, 10 °N to 60 °S), Southern Ocean (SO, south of 60 °S), Arabian Sea (ARS, > 10 °N), Mediterranean Sea (MED, east of 7 °E), and Arctic Ocean (ARC, north of 60 °N). The non-differentiation between northern and southern regions in the Pacific Ocean and Indian oceans arises from a lack of dAl data. The division of the Atlantic Ocean tries to capture the large differences in dAl concentrations between the northern, southern and tropical regions.
Glimpse Into Sampling Efforts
The Al dataset shows an uneven coverage in sampling between different regions, different seasons, and depths in the water column. Geographically, half of the data points correspond to the Atlantic Ocean (48%), followed by the Pacific and Indian Oceans (18 and 11%, respectively). The Mediterranean Sea and the Southern Ocean account for 6 and 7% of the total dAl data, while the Arctic Ocean represents just 3% of the total data. From a historical point of view, a sharp rise in total seawater dAl concentration data is observed on a decadal timescale with 69% of the total data collected after the year 2000 (Figure 1). The increase in basin scale knowledge of dAl biogeochemistry arises from the GEOTRACES programme, and other recent smaller scale research programmes. For example, 83 and 50% of dAl concentration data for the Mediterranean Sea and Atlantic Ocean were collected in the last 7 years of the database (2010 to 2017). In contrast, the Arctic and Southern Oceans have not seen any new data during the same period (2010 to 2017). During the last decade (2000 to 2009) and thanks to the International Polar Year cruises the number of samples collected in the two previously mentioned ocean basins increased by 91 and 68%, respectively. Nearly 71% of the expeditions have taken place in the northern hemisphere which was thus sampled more often than the southern hemisphere (63 vs. 37%). From a seasonal point of view, with 61 and 64% of the total expeditions for the northern and southern hemisphere, respectively, most of the sampling was conducted during spring and summer months (Table 1). However, nearly no data exists in austral winter for the Southern Ocean. Within the water column, 21% of the sampling points correspond to the first 20 m, 43% to the upper 100 m, 26% to a depth between 100 and 500 m, and 33% to a depth below 500 m. A special case is seen in the Indian Ocean where observations below 1,000 m are limited to only 372 samples.
Global Dissolved Al Concentrations Data Statistics
Table 2 shows global mean, median, minimum and maximum dAl concentration data for the different oceanic regions. Globally, the mean and median oceanic concentrations of dAl are 15.4 ± 25.9 and 6.8 nM (n = 24,194), respectively. Maximum and minimum Al concentrations were 674 nM (Arabian Sea) and 0.05 nM (Southern Ocean), respectively. It is noticeable that there is a large amount of data (n = 590) with concentrations over 100 nM which correspond to regions that are strongly influenced by Al sources (e.g., atmospheric, hydrothermal, riverine, and sedimentary). The mean dAl concentration includes data points (2.4%) directly affected by sources of Al, therefore the median value may represent a better estimate. In the following, samples with concentrations above 300 nM are not considered. Highest mean and median concentrations are found in the Mediterranean Sea (91.1 ± 42.6 and 85.3 nM) followed by the Arabian Sea (16.7 ± 37 and 7.8) and the Atlantic Ocean (16.3 ± 12.5 and 13.9 nM). Lowest mean and median Al concentration data are found in the Southern Ocean (1.7 ± 20.6 and 0.5 nM) followed by the Pacific (3.1 ± 3.1 and 2.3 nM), Indian (4.1 ± 3.7 and 3.3), and Arctic (8.4 ± 7.9 and 4.9 nM) Oceans. In surface waters (0–100 m) highest mean Al concentrations are observed in the Mediterranean Sea (54.9 ± 22.9 nM, n = 375) followed by the Arabian Sea (20 ± 45.3, n=970), and the Atlantic (19.8 ± 15.8 nM, n = 4,747), Indian (5.5 ± 5.5 nM, n = 882), Pacific (3.3 ± 3.5 nM, n = 2,118), Arctic (2.7 ± 3.4 nM, n = 234) and Southern (0.8 ± 0.9 nM, n = 714) Oceans. In intermediate waters (500–2,000 m) highest mean Al concentrations are observed in the Mediterranean Sea (127 ± 29 nM, n = 321) followed by the Arabian Sea (25.7 ± 12.6, n = 58), and the Atlantic (13.1 ± 8 nM, n = 2,673), Arctic (6 ± 2.3, n = 76), Indian (3.1 ± 1 nM, n = 600), Pacific (2 ± 1.7 nM, n = 678), and Southern (0.7 ± 0.7 nM, n = 273) Oceans. In deep waters (2,000 m to bottom) the same trend is noticeable with highest mean Al concentrations observed in the Mediterranean Sea (118 ± 53.3 nM, n = 236) followed by the Arabian Sea (28.8 ± 7.7, n = 7), and the Atlantic (17.6 ± 8.7 nM, n = 1,790), Arctic (12.3 ± 4.4 nM, n = 106), Pacific (3.1 ± 2.6 nM, n = 674), Indian (2.5 ± 0.9 nM, n = 148), and Southern (0.9 ± 0.6 nM, n = 196) Oceans. To provide a more useful surface water Al estimate we extracted the depth of the surface mixed layer (SML) for the regions of interest from a monthly mixed layer climatology calculated using the density threshold method (density criterion of 0.03 kg m−3, Holte et al., 2017. In the SML highest mean Al concentrations are observed in the Mediterranean Sea (55.3 ± 43) followed by the Arabian Sea (23.3 ± 37.3), and the Atlantic (21.6 ± 16.1 nM), Indian (6.2 ± 6.3 nM), Pacific (3.2 ± 3.4 nM), Arctic (3 ± 7.9), and Southern (0.8 ± 0.9 nM) Oceans.
Table 2
| Ocean or sea | Mean | Median | Minimum | Maximum | MLD | Surface (0–100) | Sub-surface (100–500) | Mid (500–2,000) | Deep (2,000-bottom) |
|---|---|---|---|---|---|---|---|---|---|
| All data | 15.4 ± 25.9 | 6.8 | 0.05 | 673.4 | – | 14.7 ± 22.9 | 13.2 ± 22 | 16.8 ± 31.3 | 20.1 ± 32.3 |
| n = 24,194 | |||||||||
| n = 10,252 | n = 6,379 | n = 4,896 | n = 3,261 | ||||||
| Atlantic O. | 16.3 ± 12.5 | 13.9 | 0.1 | 313.7 | 21.6 ± 16.1 | 19.8 ± 15.6 | 12.2 ± 9.6 | 13.1 ± 8 | 17.6 ± 8.7 |
| n = 11,624 | |||||||||
| z = 65 | n = 4,747 | n = 2,642 | n = 2,673 | n = 1,790 | |||||
| NATL | 16.4 ± 9.4 | 15.4 | 0.44 | 64.5 | 12.8 ± 10.9 | 12.7 ± 10.7 | 14.8 ± 9.4 | 17.2 ± 7.5 | 22.1 ± 6.2 |
| n = 4,309 | z = 91 | n = 1,214 | n = 1,031 | n = 1,342 | n = 845 | ||||
| TATL | 19.8 ± 13.9 | 16.2 | 0.16 | 313.7 | 27.4 ± 15.7 | 25 ± 15.6 | 13.5 ± 9.4 | 11.3 ± 5.6 | 17.8 ± 7.3 |
| n = 5,662 | |||||||||
| z = 49 | n = 3,083 | n = 1,153 | n = 889 | n = 617 | |||||
| SATL | 3.7 ± 4.3 | 2.2 | 0.1 | 50 | 4.9 ± 6.4 | 4.8 ± 6 | 3.2 ± 3.2 | 2.7 ± 2.2 | 4.6 ± 3.4 |
| n = 1,241 | z = 77 | n = 344 | n = 311 | n = 299 | n = 292 | ||||
| Arabian Sea | 16.7 ± 37 | 7.8 | 0.2 | 673.4 | 23.3 ± 37.3 | 20 ± 45.3 | 9.5 ± 6.9 | 25.7 ± 12.6 | 28.8 ± 7.7 |
| n = 1,511 | z = 39 | n = 970 | n = 505 | n = 58 | n = 7 | ||||
| Arctic O. | 8.4 ± 7.9 | 4.9 | 0.29 | 28.19 | 3 ± 7.9 | 2.7 ± 3.4 | 3.1 ± 1.6 | 6 ± 2.3 | 12.3 ± 4.4 |
| n = 734 | z = 60 | n = 234 | n = 165 | n = 76 | n = 106 | ||||
| Black S. | 4 ± 5.4 | 3.1 | 52.8 | 0.6 | 11.6 ± 5.4 | 6.2 ± 9.1 | 3.7 ± 0.8 | 2.6 ± 0.8 | 1.9 ± 1 |
| n = 251 | z = 21 | n = 80 | n = 106 | n = 29 | n = 40 | ||||
| Indian O. | 4.1 ± 3.7 | 3.3 | 0.3 | 51.2 | 6.2 ± 6.3 | 5.5 ± 5.5 | 3.7 ± 2.1 | 3 ± 1 | 2.5 ± 0.9 |
| n = 2,573 | z = 64 | n = 882 | n = 1,006 | n = 600 | n = 148 | ||||
| Mediterranean S. | 91.1 ± 42.6 | 85.3 | 10.3 | 178.1 | 55.3 ± 43 | 54.9 ± 22.9 | 81.7 ± 25.9 | 127.7 ± 29 | 118 ± 53.3 |
| n = 1,338 | z = 42 | n = 375 | n = 468 | n = 321 | n = 236 | ||||
| Pacific O. | 3.1 ± 3.1 | 2.3 | 0.05 | 33.7 | 3.2 ± 3.4 | 3.3 ± 3.5 | 3.5 ± 3.2 | 2 ± 1.7 | 3.1 ± 2.6 |
| n = 4,240 | z = 61 | n = 2,118 | n = 906 | n = 678 | n = 674 | ||||
| Southern O. | 1.7 ± 20.6 | 0.5 | 0.07 | 660.2 | 0.8 ± 0.9* | 0.8 ± 0.9* | 0.8 ± 0.9 | 0.7 ± 0.7 | 0.9 ± 0.6 |
| n = 1,669 | z = 61 | n = 714 | n = 512 | n = 273 | n = 196 |
| Variability over time | Atlantic | Pacific | Mediterranean | Indian | SO | NATL | TATL | SATL |
|---|---|---|---|---|---|---|---|---|
| < year 2002 | 23.3 ± 13.7 | 2.8 ± 2.7 | 93.6 ± 49 | 5.7 ± 3.7 | 2.7 ± 33 | 19 ± 9.1 | 27.8 ± 15.3 | 7.8 ± 8.3 |
| (n = 4,443) | (n = 1,757) | (n = 285) | (n = 182) | (n = 651) | (n = 2,060) | (n = 2,289) | (n = 87) | |
| ≥year 2002 | 11.9 ± 9.4 | 3.4 ± 3.3 | 90.5 ± 40.7 | 4 ± 3.6 | 1 ± 0.8 | 13.9 ± 8.9 | 14.3 ± 9.5 | 3.4 ± 3.6 |
| (n = 7,181) | (n = 2,483) | (n = 1,053) | (n = 2,392) | (n = 1,018) | (n = 2,249) | (n = 3,373) | (n = 1,154) | |
| P-value (α = 0.001) | <0.0000 | <0.0000 | 0.2576 | <0.0000 | <0.0000 | <0.0000 | <0.0000 | <0.0000 |
| H0 | Rejected | Rejected | Accepted | Rejected | Rejected | Rejected | Rejected | Rejected |
| < year 2002 | 19.7 ± 7.3 | 2.4 ± 2.0 | 104.1 ± 59 | 26.3 ± 11.2 | 0.6 ± 0.6 | 20.7 ± 6.8 | 16.6 ± 7.2 | 6.8 ± 5.7 |
| (z = <500) | (n = 1,364) | (n = 214) | (n = 285) | (n = 36) | (n = 160) | (n = 1,116) | (n = 219) | (n = 22) |
| ≥ year 2002 | 13.6 ± 7.9 | 2.9 ± 2.2 | 131.3 ± 26 | 3.1 ± 1.2 | 0.9 ± 0.7 | 17.5 ± 7.7 | 13.5 ± 6.9 | 4.2 ± 2.7 |
| (z = <500) | (n = 2,833) | (n = 982) | (n = 380) | (n = 789) | (n = 302) | (n = 1,035) | (n = 1,285) | (n = 345) |
| P-value (α = 0.001) | <0.0000 | <0.0000 | 0.0361 | <0.0000 | <0.0000 | 0.0000 | <0.0000 | 0.0444 |
| H0 | Rejected | Rejected | Accepted | Rejected | Rejected | Rejected | Rejected | Accepted |
Main global Al concentration data (nM) statistics.
SO, Southern Ocean; NATL, North Atlantic Ocean; TATL, Tropical Atlantic Ocean; and SATL, South Atlantic Ocean. The statistics marked with a star do not consider samples with values above 300 nM (n = 3). The depth interval statistics shows average and standard deviation. The mid and deep depth interval for the Arctic is 500–1,000 and 1,000–2,000 m, respectively. Hypothesis 0 (H0) refers to no statistically significant difference between samples collected prior and after the year 2000. MLD refers to Mixed Layer Depth. The MLD depth has been extracted for the regions of interest from the monthly mixed layer climatology calculated using the density threshold method (Holte et al., 2017).
“Representative” Al Depth Profiles
With the aim to provide representative dAl depth profiles for major oceanic regions we have further constrained the available Al data. To avoid profiles affected by continental inputs, we have selected only off-shelf samples, which we define as being located at least 50 nautical miles offshore. Large intra and inter-basin differences in the shape of mean Al depth profiles are evident (Figure 1) with varying dAl distributions displaying either a nutrient, scavenged, or mixed-type profile. This reveals that Al is a highly dynamic metal with different responses to different oceanographic settings and therefore is a useful indicator for processes (e.g., input and removal of metals) occurring in the marine environment.
Data Variability Over Time
Whether dAl data variability over time can be attributed to improvements in sampling and analytical techniques is difficult to assess and relies on large assumptions that may not be correct (e.g., comparable seasonal and geographical coverage in sampling). The choice of a cut-off year between historical and recent observations is complicated. In this attempt to assess data variability over time we have chosen the year 2002 which coincided with the advent of large-scale clean seawater sampling capabilities (De Baar et al., 2008; Measures et al., 2008b). We have investigated the Atlantic (including the three Atlantic regions defined in the above section), Indian (excluding the Arabian Sea), Pacific, and Southern Oceans as well as the Mediterranean Sea and include analysis for all data as well as for values below 500 m depth (to reduce the influence of seasonal variability in an element with short residence times). A graphical representation on the location of data for both analysis is shown in the Supplementary Figures 1, 2. We acknowledge that no differentiation is made between analytical methods and that some datasets may be directly influenced by Al sources. However, we assume improvements in analytical and sampling techniques in recent decades and we consider that both datasets (before the year 2002 and after) will contain regions where samples directly influenced by strong Al sources were collected. To assess if Al data have varied over time for the same oceanic regions, we applied the two tailed non-parametric Mann-Whitney test (including outliers) which shows the probability that a randomly chosen group (e.g., A or B) is statistically different to the other group. The test rejected the H0 hypothesis (A = B) at a significant level α <0.001 for all analysis except for the Mediterranean Sea in both analysis (all data and below 500 m, Table 2). An exception is the South Atlantic Ocean where H0 is accepted when considering data below 500 m. Although it is noticeable that Al data below 500 meters for the South Atlantic Ocean before the year 2002 are restricted to only two stations and 22 data points (Supplementary Figure 2 and Table 2). This indicates that the distribution of independent observations from both groups (prior to 2002 and onwards) are significantly different for all major oceans except for the Mediterranean Sea and the South Atlantic Ocean when considering only data below 500 m. The reason for no significant difference for the Mediterranean Sea could be to the high concentrations found in this region (Table 2), making any influence of improvements in analytical and sampling techniques for trace constituents negligible. Although an effect of improved analytical and sampling techniques seems likely based on the observed difference between historical and recent observations, this observation is by no means conclusive evidence. Therefore, the influence of spatial coverage needs to be considered. Ideally, in order to provide better evidence relating lower Al concentrations with improvement in sampling and analytical techniques we would require repeated sampling in the same region over long periods of time.
Summary and Prospects
We have compiled 24,194 dAl concentration data points for the global ocean spanning a sampling period from 1973 to 2017. We further provided global dAl concentration statistics for each of the major oceanic, enclosed, and semi-enclosed basins and provided global average depth profiles for representative areas within the major regions. The compilation shows a large variability in dAl concentration data which highlights the varying magnitude of input and removal rates. It also highlights our limited knowledge on how dAl varies between seasons and the relative lack of observations in regions such as the Pacific and Indian Oceans. This opens interesting research questions to plan future research expeditions. For example, an interesting region for research is the western Indian Ocean. Here the role of the southwards flowing western boundary currents as a carrier of Al (and other trace metals) to the Southwest Indian subtropical gyre via the Mozambique Channel has been suggested (Grand et al., 2015a) but requires additional studies to highlight the extent of this supply and the influence that Mozambique eddies embedded in the Agulhas Current could have further south. This area would also produce new knowledge on the continent-island influence on trace metal distributions in a highly dynamic area. Another interesting area is the western Pacific along the American continent where the influence of upwelling on the distribution of Al remains less well-constrained than, for example, for the upwelling regions along the western African continent. We believe that the Al compilation will be a useful tool for modeling purposes and will help to better understand the global biogeochemical cycle of Al. Combined with global data products on mixed layer depths the Al data compilation can be used to revise residence times of Al in surface waters as well as updating the global oceanic Al inventory. Furthermore, an additional combination with global chlorophyll data products could investigate the role that biogenic particles (e.g., assuming the more chlorophyll the more particles present in surface waters) may have on the residence times of Al in surface waters and elucidate if chlorophyll global products could be used to better constrain Al residence times in surface waters.
Statements
Data availability statement
The data compiled in this study have been deposited in an open access repository and is available under the following link https://doi.org/10.25413/sun.12167877.v1.
Author contributions
J-LM conceived the study, wrote the manuscript with early contributions from AR, and compiled the database. TD, RC, JL, and SS helped with data compilation. EA, JK, RM, AB, PC, TR, and MG-C submitted unpublished data. AR provided funds for the study. All co-authors commented on previous manuscript drafts and on the final manuscript draft. All authors contributed to the article and approved the submitted version.
Funding
This study was funded by NRF, South Africa (UID# 105826 AND 110715).
Acknowledgments
We would like to extend our gratitude to all scientists and personnel involved in the collection and analysis of all the samples included in the database. Special thanks to Marco Van Hulten and Marion Gehlen for providing their early aluminum compilations. Also, special thanks to all researchers who provided, upon request, their Al data. This study was funded by NRF, South Africa (UID# 105826 AND 110715).
Conflict of interest
The authors declare that the research was conducted in the absence of any commercial or financial relationships that could be construed as a potential conflict of interest. The reviewer MG declared a past co-authorship with several of the authors EA, AB, and RM to the handling editor.
Supplementary material
The Supplementary Material for this article can be found online at: https://www.frontiersin.org/articles/10.3389/fmars.2020.00468/full#supplementary-material
References
1
Barrett P. M. Resing J. A. Buck N. J. Landing W. M. Morton P. L. Shelley R. U. (2015). Changes in the distribution of Al and particulate Fe along A16N in the eastern North Atlantic Ocean between 2003 and 2013: implications for changes in dust deposition. Mar. Chem. 177, 57–68. 10.1016/j.marchem.2015.02.009
2
Bowie A. R. Whitworth D. J. Achterberg E. P. Mantoura R. F. C. Worsfold P. J. (2002). Biogeochemistry of Fe and other trace elements (Al, Co, Ni) in the upper Atlantic Ocean. Deep Sea Res. Part I49, 605–636. 10.1016/S0967-0637(01)00061-9
3
Brown M. T. Bruland K. W. (2008). An improved flow-injection analysis method for the determination of dissolved aluminum in seawater. Limnol. Oceanogr.6, 87–95. 10.4319/lom.2008.6.87
4
Brown M. T. Lippiatt S. M. Bruland K. W. (2010). Dissolved aluminum, particulate aluminum, and silicic acid in northern Gulf of Alaska coastal waters: glacial/riverine inputs and extreme reactivity. Mar. Chem.122, 160–175. 10.1016/j.marchem.2010.04.002
5
Bruland K. W. Middag R. Lohan M. C. (2013). Controls of trace metals in seawater, in Treatise on Geochemistry: Second Edition, eds MottlM. J.ElderfieldH. (Philadelphia: Saunders, Elsevier Inc.), 19–51. 10.1016/B978-0-08-095975-7.00602-1
6
Chou L. Wollast R. (1997). Biogeochemical behavior and mass balance of dissolved aluminum in the western Mediterranean Sea. Deep Sea Res. Part II44, 741–768. 10.1016/S0967-0645(96)00092-6
7
Dammshäuser A. Croot P. L. (2012). Low colloidal associations of aluminium and titanium in surface waters of the tropical Atlantic. Geochim. Cosmochim. Acta96, 304–318. 10.1016/j.gca.2012.07.032
8
Dammshäuser A. Wagener T. Garbe-Schönberg D. Croot P. (2013). Particulate and dissolved aluminum and titanium in the upper water column of the Atlantic Ocean. Deep Sea Res. Part I73, 127–139. 10.1016/j.dsr.2012.12.002
9
Dammshauser A. Wagener T. Croot P. L. (2011). Surface water dissolved aluminum and titanium: tracers for specific time scales of dust deposition to the Atlantic?Geophys. Res. Lett. 38:L24601. 10.1029/2011GL049847
10
De Baar H. J. Timmermans K. R. Laan P. De Porto H. H. Ober S. Blom J. J. et al . (2008). Titan: a new facility for ultraclean sampling of trace elements and isotopes in the deep oceans in the international Geotraces program. Mar. Chem. 111, 4–21. 10.1016/j.marchem.2007.07.009
11
de Jong J. T. Boyé M. Gelado-Caballero M. D. Timmermans K. R. Veldhuis M. J. Nolting R. F. et al . (2007). Inputs of iron, manganese and aluminium to surface waters of the Northeast Atlantic Ocean and the European continental shelf. Mar. Chem.107, 120–142. 10.1016/j.marchem.2007.05.007
12
Frank M. Jeandel C. Anderson R. F. Henderson G. Francois R. Sharma M. (2003). GEOTRACES: studying the global marine biogeochemistry of trace elements and isotopes. EOS Trans. 84:34. 10.1029/2003EO340006
13
Gehlen M. Heinze C. Maier-Reimer E. Measures C. I. (2003). Coupled Al-Si geochemistry in an ocean general circulation model: A tool for the validation of oceanic dust deposition fields?Global Biogeochem. Cycles17, 1028-1–1028-18. 10.1029/2001GB001549
14
Gelado-Caballero M. D. Torres-Padrón M. E. Hernández-Brito J. J. Herrera-Melian J. A. Pérez-Peña J. J. M. C. (1996). Aluminium distributions in central east Atlantic waters (Canary Islands). Marine chemistry, 51, 359–372. 10.1016/0304-4203(95)00069-0
15
Grand M. M. Measures C. I. Hatta M. Hiscock W. T. Landing W. M. Morton P. L. et al . (2015a). Dissolved Fe and Al in the upper 1000 m of the eastern Indian Ocean: a high-resolution transect along 95° E from the Antarctic margin to the Bay of Bengal. Global Biogeochem. Cycles29, 375–396. 10.1002/2014GB004920
16
Grand M. M. Measures C. I. Hatta M. Morton P. L. Barret P. Milne A. et al . (2015b). The impact of circulation and dust deposition in controlling the distribution of dissolved Fe and Al in the south Indian subtropical gyre. Mar. Chem.176, 110–125. 10.1016/j.marchem.2015.08.002
17
Hall I. R. Measures C. I. (1998). The distribution of Al in the IOC stations of the North Atlantic and Norwegian Sea between 52° and 65° North. Mar. Chem. 61, 69–85. 10.1016/S0304-4203(98)00008-5
18
Han Q. Moore J. K. Zender C. Measures C. Hydes D. (2008). Constraining oceanic dust deposition using surface ocean dissolved Al. Global Biogeochem. Cycles22. 10.1029/2007GB002975
19
Helmers E. Rutgers van der Loef M. (1993). Lead and aluminum in Atlantic surface waters (50n to 50s) reflecting anthropogenic and natural sources in the aeolian transport. J. Geophys. Res. 98, 20261–20273. 10.1029/93JC01623
20
Holte J. Talley L. D. Gilson J. Roemmich D . (2017), An Argo mixed layer climatology database. Geophys. Res. Lett. 44, 5618–5626. 10.1002/2017GL073426
21
Hydes D. de Lange G. de Baar H. (1988). Dissolved aluminium in the Mediterranean. Geochim. Cosmochim. Acta52, 2107–2114. 10.1016/0016-7037(88)90190-1
22
Hydes D. Statham P. Burton J. (1986). A vertical profile of dissolved trace metals (Al, Cd,Cu, Mn, Ni) over the median valley of the mid Atlantic ridge, 43N: implications for Hydrothermal activity. Sci. Total Environ. 49, 133–145. 10.1016/0048-9697(86)90236-6
23
Hydes D. J. (1979). Aluminum in seawater: Control by inorganic processes. Science205, 1260–1262. 10.1126/science.205.4412.1260
24
Hydes D. J. (1983). Distribution of aluminium in waters of the North East Atlantic 25°N to 35°N. Geochim. Cosmochim. Acta47, 967–973. 10.1016/0016-7037(83)90164-3
25
Hydes D. J. Liss P. S. (1976). Fluorimetric method for the determination of low concentrations of dissolved aluminium in natural waters. Analyst. 101, 922–931.
26
Jickells T. Church T. Veron A. Arimoto R. (1994). Atmospheric inputs of Manganese and Aluminum to the Sargasso Sea and their relation to surface-water concentrations. Mar. Chem. 46, 283–292. 10.1016/0304-4203(94)90083-3
27
Johnson K. S. Elrod V. Fitzwater S. Plant J. Boyle E. Bergquist B. et al . (2007). Developing standards for dissolved iron in seawater. Eos Trans. Am. Geophys. Union88, 131–132. 10.1029/2007EO110003
28
Johnson K. S. Elrod V. A. Fitzwater S. E. Plant J. N. Chavez F. P. Tanner S. J. et al . (2003). Surface ocean-lower atmosphere interactions in the northeast Pacific Ocean gyre: aerosols, iron, and the ecosystem response. Global Biogeochem. Cycles17, 32-1–32-14. 10.1029/2002GB002004
29
Kaupp L. J. Measures C. I. Selph K. E. Mackenzie F. T. (2011). The distribution of dissolved Fe and Al in the upper waters of the Eastern Equatorial Pacific. Deep Sea Res. Part II58, 296–310. 10.1016/j.dsr2.2010.08.009
30
Kramer J. Laan P. Sarthou G. Timmermans K. De Baar H. (2004). Distribution of dissolved aluminium in the high atmospheric input region of the subtropical waters of the North Atlantic Ocean. Mar. Chem. 88, 85–101. 10.1016/j.marchem.2004.03.009
31
Kremling K. (1985). The distribution of cadmium, copper, nickel, manganese, and aluminium in surface waters of the open Atlantic and European shelf area. Deep Sea Res. Part A.32, 531–555. 10.1016/0198-0149(85)90043-3
32
Kremling K. Hydes D. (1988). Summer distribution of dissolved Al, Cd, Co, Cu, Mn and Ni in surface waters around the British Isles. Cont. Shelf Res.8, 89–105. 10.1016/0278-4343(88)90026-X
33
Li F. Ren J. Yan L. Liu S. Liu C. Zhou F. et al . (2013). The biogeochemical behavior of dissolved aluminum in the Southern Yellow Sea: influence of the spring phytoplankton bloom. Chinese Sci. Bull.58, 238–248. 10.1007/s11434-012-5512-5
34
Liu J. Zhou L. Tan Y. Wang Q. Hu Z. Li J. et al . (2017). Distribution of reactive aluminium under the influence of mesoscale eddies in the western South China Sea. Acta Oceanol. Sin.36, 95–103. 10.1007/s13131-017-1046-7
35
Mawji E. Schlitzer R. Dodas E. M. Abadie C. Abouchami W. Anderson R. F. et al . (2015). The GEOTRACES intermediate data product 2014. Mar. Chem.177, 1–8. 10.1016/j.marchem.2015.04.005
36
Measures C. Brown M. Selph K. Apprill A. Zhou M. Hatta M. et al . (2013). The influence of shelf processes in delivering dissolved iron to the HNLC waters of the Drake Passage, Antarctica. Deep Sea Res. Part II90, 77–88. 10.1016/j.dsr2.2012.11.004
37
Measures C. Brown M. Vink S. (2005). Dust deposition to the surface waters of the western and central north pacifc inferred from surface water dissolved aluminum concentrations. Geochem. Geophys. Geosyst. 6:Q09M03. 10.1029/2005GC000922
38
Measures C. Edmond J. (1990). Aluminium in the South Atlantic: steady state distribution of a short residence time element. J. Geophys. Res.95, 5331–5340. 10.1029/JC095iC04p05331
39
Measures C. Hatta M. Fitzsimmons J. Morton P. (2015). Dissolved Al in the zonal N Atlantic section of the US GEOTRACES 2010/2011 cruises and the importance of hydrothermal inputs. Deep Sea Res. Part II116, 176–186. 10.1016/j.dsr2.2014.07.006
40
Measures C. Landing W. M. Brown M. T. Buck C. S. (2008b). A commercially available rosette system for trace metal—clean sampling. Limnol. Oceanogr.6, 384–394. 10.4319/lom.2008.6.384
41
Measures C. I. (1995). The distribution of Al in the IOC stations of the eastern Atlantic between 30° S and 34° N. Mar. Chem.49, 267–281. 10.1016/0304-4203(95)00017-L
42
Measures C. I. (1999). The role of entrained sediments in sea ice in the distribution of aluminium and iron in the surface waters of the Arctic Ocean. Mar. Chem. 68, 59–70. 10.1016/S0304-4203(99)00065-1
43
Measures C. I. Brown E. T. (1996). Estimating dust input to the Atlantic Ocean using surface water aluminium concentrations, in The Impact of Desert Dust Across the Mediterranean, eds GuerzoniS.ChesterR. (Dordrecht: Springer), 301–311.
44
Measures C. I. Edmond J. M. (1992). The distribution of aluminium in the Greenland Sea and its relationship to ventilation processes. J. Geophys. Res. Oceans97, 17787–17800. 10.1029/92JC01798
45
Measures C. I. Edmond J. M. Jickells T. D. (1986). Aluminium in the northwest Atlantic. Geochim. Cosmochim. Acta50, 1423–1429. 10.1016/0016-7037(86)90315-7
46
Measures C. I. Grant B. Khadem M. Lee D. S. Edmond J. M. (1984). Distribution of Be, Al, Se and Bi in the surface waters of the western North Atlantic and Caribbean. Earth Planet. Sci. Lett. 71, 1–12. 10.1016/0012-821X(84)90047-5
47
Measures C. I. Vink S. (1999). Seasonal variations in the distribution of Fe and Al in the surface waters of the Arabian Sea. Deep Sea Res. Part II46, 1597–1622. 10.1016/S0967-0645(99)00037-5
48
Measures C. I. Vink S. (2000). On the use of dissolved aluminum in surface waters to estimate dust deposition to the ocean. Global biogeochem. cy.14, 317–327. 10.1029/1999GB001188
49
Measures C. Landing W. Brown M. Buck C. (2008a). High-resolution Al and Fe data from the Atlantic Ocean CLIVAR-CO2 Repeat Hydrography A16N transect: extensive linkages between atmospheric dust and upper ocean geochemistry. Global Biogeochem. Cycles22, GB1005-1–GB1005-10. 10.1029/2007GB003042
50
Menzel Barraqueta J. L. Klar J. Gledhill M. Schlosser C. Shelley R. Planquette H. F. et al . (2019). Atmospheric deposition fluxes over the Atlantic Ocean: a GEOTRACES case study. Biogeosciences16, 1525–1542. 10.5194/bg-16-1525-2019
51
Menzel Barraqueta J. L. Schlosser C. Planquette H. Gourain A. Cheize M. Boutorh J. et al . (2018). Aluminium In the North Atlantic Ocean and the Labrador Sea (geotraces GA01 Section). Biogeosciences15, 5271–5286. 10.5194/bg-15-5271-2018
52
Middag R. de Baar H. J. W. Laan P. Bakker K. (2009). Dissolved aluminium and the silicon cycle in the Arctic Ocean. Mar. Chem.115, 176–195. 10.1016/j.marchem.2009.08.002
53
Middag R. Van Hulten M. M. P. Van Aken H. M. Rijkenberg M. J. A. Gerringa L. J. A. Laan P. et al . (2015). Dissolved aluminium in the ocean conveyor of the West Atlantic Ocean: effects of the biological cycle, scavenging, sediment resuspension and hydrography. Mar. Chem.177, 69–86. 10.1016/j.marchem.2015.02.015
54
Middag R. van Slooten C. de Baar H. J. W. Laan P. (2011). Dissolved aluminium in the Southern Ocean. Deep Sea Res. Part II58, 2647–2660. 10.1016/j.dsr2.2011.03.001
55
Middag R. Baar H. d. Laan P. Huhn O. (2012). The effects of continental margins and water mass circulation on the distribution of dissolved aluminum and manganese in Drake Passage. J. Geophys. Res.117, C01019-1–C01019-19. 10.1029/2011JC007434
56
Moore R. M. (1981). Oceanographic distributions of zinc, cadmium, copper and aluminium in waters of the central Arctic. Geochim. Cosmochim. Acta45, 2475–2482. 10.1016/0016-7037(81)90099-5
57
Moore R. M. Millward G. E. (1984). Dissolved-particulate interactions of aluminium in ocean water. Geochim. Cosmochim. Acta48, 235–241. 10.1016/0016-7037(84)90247-3
58
Moran S. B. Moore R. M. (1991). The potential source of dissolved aluminium from resuspended sediments to the North Atlantic deep water. Geochim. Cosmochim. Acta55, 2745–2751. 10.1016/0016-7037(91)90441-7
59
Moran S. B. Moore R. M. Westerlund S. (1992). Dissolved aluminum in the Weddell Sea. Deep Sea Res. Part A39, 537–547. 10.1016/0198-0149(92)90087-A
60
Narvekar P. V. Singbal S. Y. S. (1993). Dissolved aluminium in the surface microlayer of the eastern Arabian Sea. Mar. Chem.42, 85–94. 10.1016/0304-4203(93)90239-K
61
Obata H. Alibo D. Nozaki Y. (2007). Dissolved aluminum, indium, and cerium in the Sea of Japan and the Sea of Okhotsk: Comparison to the marginal seas of the western North Pacific. J. Geophys. Res. 112:C12003. 10.1029/2006JC003944
62
Obata H. Nozaki Y. Alibo D. Yamamoto Y. (2004). Dissolved al, in, and ce in the eastern indian ocean and the southeast asian seas in comparison with the radionuclides 210pb and 210po1. Geochim. Cosmochim. Acta68, 1035–1048. 10.1016/j.gca.2003.07.021
63
Obata H. Shitashima K. Isshik K. Nakayama E. (2008). Iron, manganese and aluminum in upper waters of the western South Pacific Ocean and its adjacent seas. J. Oceanogr. 64, 233–245. 10.1007/s10872-008-0018-0
64
Orians K. Bruland K. (1986). The biogeochemistry of aluminum in the Pacific Ocean. Earth Planet. Sci. Lett. 78, 397–410. 10.1016/0012-821X(86)90006-3
65
Pohl C. Croot P. Hennings U. Daberkow T. Budeus G. Loe M. (2011). Synoptic transects on the distribution of trace elements (hg, pb, cd, cu, ni, zn, co, mn, fe, and al) in surface waters of the northern-and southern east Atlantic. J. Mar. Syst.84:2841. 10.1016/j.jmarsys.2010.08.003
66
Rapp I. Schlosser C. Menzel Barraqueta J.-L. Wenzel B. Lüdke J. Scholten J. et al . (2019). Controls on redox-sensitive trace metals in the Mauritanian oxygen minimum zone, Biogeosciences. 16, 4157–4182. 10.5194/bg-16-4157-2019
67
Remenyi T . (2013): Investigating the Impact of Aeolian Deposition to the Southern Ocean Using Dissolved Aluminium Concentrations. Doctor of philosophy in quantitative marine science, Quantitative Marine Science Program, UTas and CSIRO joint program.
68
Ren J.-L. Zhang G-L. Zhang J. Shi J.-H. Liu S.-M. Li F-M. et al . (2011). Distribution of dissolved aluminum in the Southern Yellow Sea: influences of a dust storm and the spring bloom. Mar. Chem.125, 69–81. 10.1016/j.marchem.2011.02.004
69
Ren J. L. Zhang J. Li J. B. Yu X. Y. Liu S. M. Zhang E. R. et al . (2006). Dissolved aluminum in the Yellow Sea and East China Sea – Al as a tracer of Changjiang (Yangtze River) discharge and Kuroshio incursion. Estuar. Coas. Shelf Sci.68, 165–174. 10.1016/j.ecss.2006.02.004
70
Resing J. A. Measures C. I. (1994). Fluorometric determination of Al in seawater by flow injection analysis with in-line preconcentration. Anal. Chem.66, 4105–4111. 10.1021/ac00094a039
71
Resing J. A. Sedwick P. N. German C. R. Jenkins W. J. Moffett J. W. Sohst B. M. et al . (2015). Basin-scale transport of hydrothermal dissolved metals across the South Pacific Ocean. Nature523:200. 10.1038/nature14577
72
Rolison J. Middag R. Stirling C. Rijkenberg M. de Baar H. (2015). Zonal distribution of dissolved aluminium in the Mediterranean Sea. Mar. Chem. 177, 87–100. 10.1016/j.marchem.2015.05.001
73
Sanudo-Wilhelmy S. A. Olsen K. A. Scelfo J. M. Foster T. D. Flegal A. R. (2002). Trace metal distributions off the Antarctic Peninsula in the Weddell Sea. Mar. Chem. 77, 157–170. 10.1016/S0304-4203(01)00084-6
74
Schlitzer R. Anderson R. F. Dodas E. M. Lohan M. Geibert W. Tagliabue A. et al . (2018). The GEOTRACES intermediate data product 2017. Chem. Geol. 493, 210–223. 10.1016/j.chemgeo.2018.05.040
75
Schlosser C. Klar J. K. Wake B. D. Snow J. T. Honey D. J. Woodward E. M. S. et al . (2014). Seasonal ITCZ migration dynamically controls the location of the (sub) tropical Atlantic biogeochemical divide. Proc. Natl. Acad. Sci. U.S.A.111, 1438–1442. 10.1073/pnas.1318670111
76
Schüßler U. Balzer W. Deeken A. (2005). Dissolved Al distribution, particulate Al fluxes and coupling to atmospheric Al and dust deposition in the Arabian Sea. Deep Sea Res. Part II52, 1862–1878. 10.1016/j.dsr2.2005.06.005
77
Singh N. D. Chinni V. Singh S. K. (2020). Dissolved aluminium cycling in the northern, equatorial and subtropical gyre region of the Indian Ocean. Geochim. Cosmochim. Acta, 268, 160–185. 10.1016/j.gca.2019.09.028
78
Slemons L. Murray J. Resing J. Paul B. Dutrieux P. (2010). Western Pacific coastal sources of iron, manganese, and aluminum to the Equatorial Undercurrent. Global Biogeochem. Cycles24, GB3024-1–GB3024-16. 10.1029/2009GB003693
79
Stoffyn M. Mackenzie F. T. (1982). Fate of dissolved aluminum in the oceans. Mar. Chem11, 105–127. 10.1016/0304-4203(82)90036-6
80
Thi Dieu Vu H. Sohrin Y. (2013). Diverse stoichiometry of dissolved trace metals in the Indian Ocean. Sci. Rep. 3:1745. 10.1038/srep01745
81
Tria J. Butler E. C. Haddad P. R. Bowie A. R. (2007). Determination of aluminium in natural water samples. Anal. Chim. Acta588, 153–165. 10.1016/j.aca.2007.02.048
82
Upadhyay S. Gupta R. S. (1994). Aluminium in the northwestern Indian Ocean (Arabian sea). Mar. Chem. 47, 203–214. 10.1016/0304-4203(94)90020-5
83
Van Bennekom A. J. Buma A. Nolting R. (1991). Dissolved aluminium in the Weddell-Scotia Confluence and effect of Al on the dissolution kinetics of biogenic silica. Mar. Chem.35, 423–434. 10.1016/S0304-4203(09)90034-2
84
Van Beusekom J. Van Bennekom A. Tr eguer P. Morvan J. (1997). Aluminium and silicic acid in water and sediments of the enderby and crozet basins. Deep Sea Res. Part II44, 987–1003. 10.1016/S0967-0645(96)00105-1
85
Van Hulten M. M. P. Sterl A. Tagliabue A. Dutay J. C. Gehlen M. de Baar H. J. et al . (2013). Aluminium in an ocean general circulation model compared with the West Atlantic Geotraces cruises. J. Mar. Syst.126, 3–23. 10.1016/j.jmarsys.2012.05.005
86
Vink S. Boyle E. A. Measures C. I. Yuan J. (2000). Automated high resolution determination of the trace elements iron and aluminium in the surface ocean using a towed Fish coupled to flow injection analysis. Deep Sea. Res. Part I. 47, 1141–1156. 10.1016/S0967-0637(99)00074-6
87
Vink S. Measures C. (2001). The role of dust deposition in determining surface water distributions of Al and Fe in the South West Atlantic. Deep Sea Res. Part II48, 2787–2809. 10.1016/S0967-0645(01)00018-2
88
Wedepohl K. H. (1995). The composition of the continental crust. Geochim. Cosmochim. Acta59, 1217–1232. 10.1016/0016-7037(95)00038-2
89
Zheng L. Minami T. Konagaya W. Chan C. Y. Tsujisaka M. Takano S. et al . (2019). Distinct basin-scale-distributions of aluminum, manganese, cobalt, and lead in the North Pacific Ocean. Geochim. Cosmochim. Acta254, 102–121. 10.1016/j.gca.2019.03.038
Summary
Keywords
database, oceans, aluminum, compilation, biogeochemistry, GEOTRACES
Citation
Menzel Barraqueta J-L, Samanta S, Achterberg EP, Bowie AR, Croot P, Cloete R, De Jongh T, Gelado-Caballero MD, Klar JK, Middag R, Loock JC, Remenyi TA, Wenzel B and Roychoudhury AN (2020) A First Global Oceanic Compilation of Observational Dissolved Aluminum Data With Regional Statistical Data Treatment. Front. Mar. Sci. 7:468. doi: 10.3389/fmars.2020.00468
Received
24 February 2020
Accepted
26 May 2020
Published
14 July 2020
Volume
7 - 2020
Edited by
Antonio Tovar-Sanchez, Consejo Superior de Investigaciones Científicas (CSIC), Spain
Reviewed by
Mariko Hatta, University of Hawaii, United States; Maxime M. Grand, Moss Landing Marine Laboratories, United States
Updates
Copyright
© 2020 Menzel Barraqueta, Samanta, Achterberg, Bowie, Croot, Cloete, De Jongh, Gelado-Caballero, Klar, Middag, Loock, Remenyi, Wenzel and Roychoudhury.
This is an open-access article distributed under the terms of the Creative Commons Attribution License (CC BY). The use, distribution or reproduction in other forums is permitted, provided the original author(s) and the copyright owner(s) are credited and that the original publication in this journal is cited, in accordance with accepted academic practice. No use, distribution or reproduction is permitted which does not comply with these terms.
*Correspondence: Jan-Lukas Menzel Barraqueta jmenzel@sun.ac.za
This article was submitted to Marine Biogeochemistry, a section of the journal Frontiers in Marine Science
Disclaimer
All claims expressed in this article are solely those of the authors and do not necessarily represent those of their affiliated organizations, or those of the publisher, the editors and the reviewers. Any product that may be evaluated in this article or claim that may be made by its manufacturer is not guaranteed or endorsed by the publisher.