 Eduardo Ramirez-Romero1*
 Gabriel Jordà2
 Angel Amores1
 Susan Kay3
 Mariona Segura-Noguera4
 Diego M. Macias5
 Francesc Maynou6
 Ana Sabatés6Ignacio A. Catalán1
- 1Institut Mediterrani d’Estudis Avançats, IMEDEA (CSIC-UIB), Esporles, Spain
- 2Centre Oceanogràfic de Balears, Instituto Español de Oceanografía (IEO), Palma, Spain
- 3Plymouth Marine Laboratory, Plymouth, United Kingdom
- 4Joseph Banks Laboratories, School of Life Sciences, University of Lincoln, Lincoln, United Kingdom
- 5European Commission, Joint Research Centre, Ispra, Italy
- 6Institut de Ciències del Mar (CSIC), Barcelona, Spain
Numerical modeling is a key tool to complement the current physical and biogeochemical observational datasets. It is essential for understanding the role of oceanographic processes on marine food webs and producing climate change projections of variables affecting key ecosystem functions. In this work, we evaluate the horizontal and vertical patterns of four state-of-the-art coupled physical–biogeochemical models, three of them already published. Two of the models include data assimilation, physical and/or biological, and two do not. Simulations are compared to the most exhaustive dataset of in situ observations in the North Western Mediterranean, built ad hoc for this work, comprising gliders and conventional CTD surveys and complemented with satellite observations. The analyses are performed both in the whole domain and in four subregions (Catalan Shelf, Ebro Delta, Mallorca Channel, and Ibiza Channel), characterized by a priori divergent primary production dynamics and driving mechanisms. Overall, existing models offer a reasonable representation of physical processes including stratification, surface temperature, and surface currents, but it is shown that relatively small differences among them can lead to large differences in the response of biogeochemical variables. Our results show that all models are able to reproduce the main seasonal patterns of primary production both at the upper layer and at the deep chlorophyll maximum (DCM), as well as the differential behavior of the four subregions. However, there are significant discrepancies in the local variability of the intensity of the winter mixing, phytoplankton blooms, or the intensity and depth of the DCM. All model runs show markedly contrasting patterns of interannual phytoplankton biomass in all four subregions. This lack of robustness should dissuade end users from using them to fill gaps in time series observations without assessing their appropriateness. Finally, we discuss the usability of these models for different applications in marine ecology, including fishery oceanography.
Introduction
Understanding ecological processes, biogeochemical fluxes, and potential changes in marine ecosystems requires a profound knowledge of the dynamics of primary production. Primary production and its spatiotemporal variability shape the marine food web dynamics and ultimately the production available for higher and exploitable trophic levels (Cushing, 1983; Sommer et al., 2002). The Mediterranean Sea has long been recognized as oligotrophic regarding chlorophyll-a and nutrient ranges, with some local regions having enhanced productivity (see a thorough review in Siokou-Frangou et al., 2010). Based on this, the “Mediterranean paradox” has emerged from the unexpectedly high fishery yield in this basin, compared to levels expected only based on the chlorophyll-a and nutrient levels (Sournia, 1975; Estrada, 1996). This paradox was reinforced by ocean color images from remote sensing. However, recent works have brought insight about previously overlooked features, such as productivity within the DCM and mechanisms enhancing fertility in connection with hydrographic structures and circulation patterns (Macias et al., 2014, 2018b; Kessouri et al., 2017). In addition, other works related this paradox to the dominance of small phytoplankton and the channeling of an important proportion of the carbon fluxes through the microbial food web, which may contribute to efficient energy transfer to the upper trophic levels (Siokou-Frangou et al., 2010).
A clear distinction exists between Eastern and Western Mediterranean basins in terms of dynamics and productivity, with the Western Mediterranean showing higher values of primary production, nutrients, and surface chlorophyll-a (Turley, 1999; D’Ortenzio and Ribera d’Alcalà, 2009; Siokou-Frangou et al., 2010). The northwest Mediterranean (NWM) has a complex oceanographic structure (Millot and Taupier-Letage, 2006; Figure 1). This complexity arises from (i) the highly variable and spatially heterogeneous atmosphere–ocean interactions (e.g., heat fluxes, winds) (Grifoll et al., 2013; Jordà et al., 2017); (ii) the confluence of recent Atlantic Waters (AW) inflow coming from the Strait of Gibraltar, with the saltier resident AW in the North (Balbín et al., 2014); (iii) the effect of complex topography, with canyons, islands, deep areas, and wide shelves; and (iv) the influence of rivers such as the Ebro and the Rhone (Figure 1). These features trigger the relatively high primary production levels in this sub-basin (Estrada, 1996), mainly maintained by (i) deep ocean convection around Gulf of Lions (GoL) (Severin et al., 2014; Kessouri et al., 2017), (ii) riverine nutrient inputs by the Ebro and Rhone rivers, (iii) sub-mesoscale and frontal processes (Estrada et al., 1999; Sabatés et al., 2013; Oguz et al., 2015), and (iv) the DCM presence (Estrada et al., 1993; Macias et al., 2014). As a result, it is an exceptional sub-basin within the Mediterranean in terms of secondary production (Calbet et al., 2001; Alcaraz et al., 2007) and fisheries (Palomera et al., 2007; FAO, 2016).
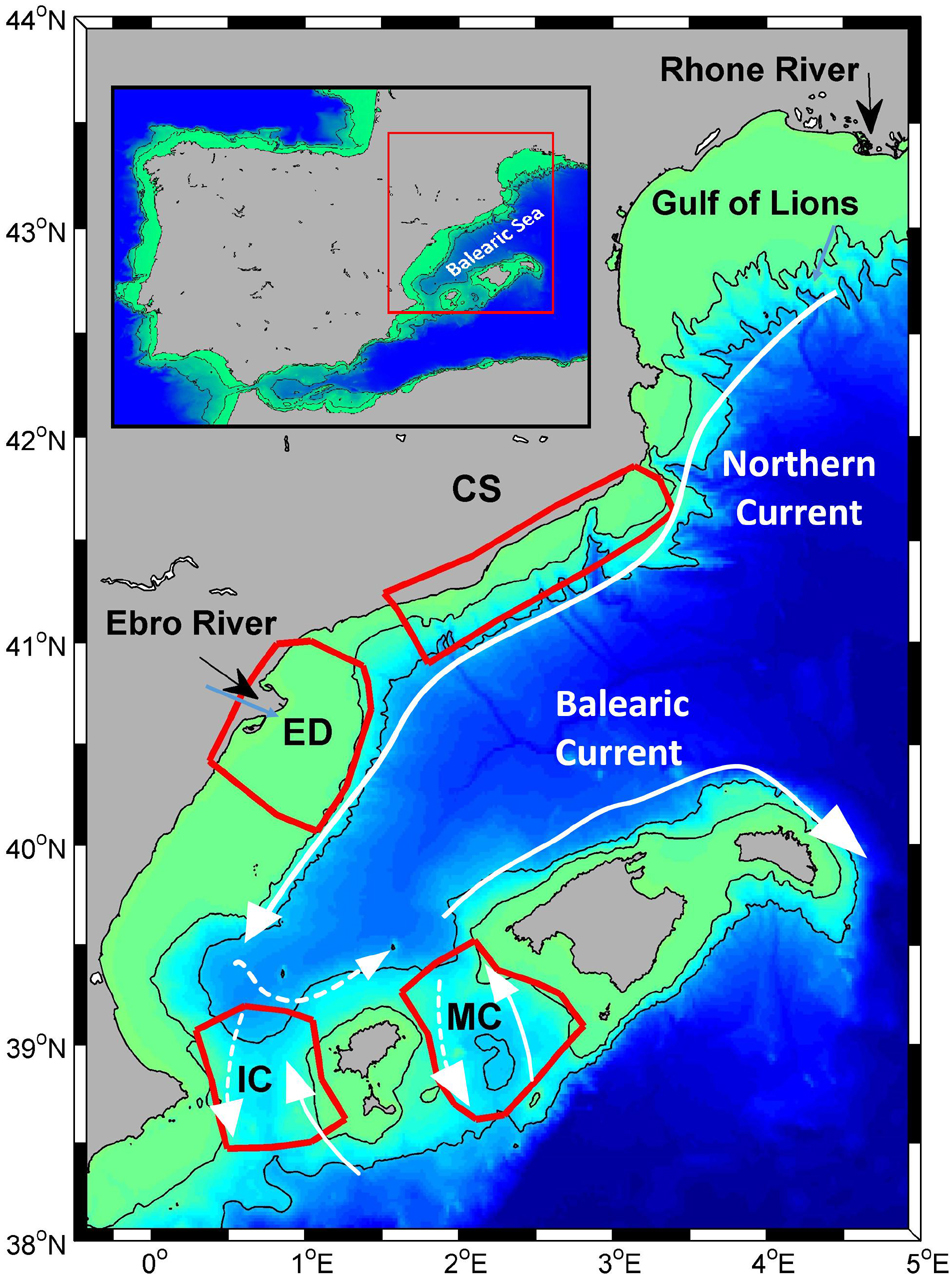
Figure 1. Domain of the study, areas where specific analyses were conducted, and main currents. CS, Catalan Shelf; ED, Ebro Delta; IC, Ibiza Channel, MC, Mallorca Channel.
Despite the need for biogeochemical (BGC) information in this area, current datasets are sparse and incomplete. Numerical modeling can be an alternative that helps by filling spatial and temporal gaps, enabling a better representation of BGC processes in the region (e.g., Oguz et al., 2015; Palmiéri et al., 2015; Lazzari et al., 2016). The potential of BGC models to understand ecosystem functioning extends to more applied fields; for instance, BGC models have been widely applied in fishery oceanography and marine policy (Tedesco et al., 2016; Van Leeuwen et al., 2016; Piroddi et al., 2017). Nevertheless, BGC modeling is not straightforward and requires a proper parameterization and fine-tuning of a large number of biological processes, based on an accurate reconstruction of the physical dynamics (Doney, 1999).
Therefore, a comparative approach of model skills of the most commonly used BGC models can be invaluable not only to improve the models but also to select potential variables amenable for trans-disciplinary use, including projections of climate-change impacts (e.g., Lavoie et al., 2017). The potential exploitation of climate projections depends on the modeling skill simulating current climate conditions, which requires a proper assessment of these skills using observational data (Stow et al., 2009).
In this work, we compare four different state-of-the-art coupled physical–biogeochemical model simulations in the NWM, three of them already published, comparing the models to each other and to observational data. Up to now, due to the lack of comprehensive in situ observational datasets, most evaluations of BGC models have relied on satellite observations and thus have been restricted to surface processes (Lazzari et al., 2012; Macias et al., 2018a). Here, we solve that limitation by gathering an extensive database of vertical profiles, which includes historical and recent in situ observations of temperature, salinity, nutrients, and chlorophyll-a in the region. The final goal is to elucidate the robustness and weaknesses of the present-day BGC simulations focusing on features/processes driving primary production and to tailor the variables and models useful for different heuristic and prognostic purposes. The model comparison will focus particularly on key physical (temperature and density) and biogeochemical variables (chlorophyll-a, nitrate, phosphate) that are frequently used in marine ecology and fishery studies.
Materials and Methods
The reference regions where model skill is assessed in this study (Figure 1) have been chosen following these criteria: (i) the availability of in situ data; (ii) the different biogeochemical features, covering different trophic regimes and ecoregions previously described (e.g., Lavigne et al., 2013; Ayata et al., 2017); and (iii) the relevance for natural living resources, such as fisheries (Palomera et al., 2007; FAO, 2016).
Observations
In situ Data
In situ data came from different sources and were collected and unified in a general dataset. The first source of data is the IBAMar database1 which compiles physical and biogeochemical data collected in the Western Mediterranean for the last four decades by the monitoring programs of the Spanish Institute of Oceanography (IEO). Physical data were collected from CTD casts, and biogeochemical variables were determined from bottle samples collected at standard levels, with this study focusing in particular on chlorophyll-a and dissolved inorganic macronutrients (phosphate and nitrate). Further details can be found in Lopez-Jurado et al. (2014) and Aparicio-González et al. (2015).
The second data source is the database collected by Segura-Noguera et al. (2011), which includes 41 cruises performed in the NWM between 1979 and 2004, by the Institute of Marine Sciences of Barcelona (ICM-CSIC) and the Center for Advanced Studies of Blanes (CEAB-CSIC) of the Spanish National Research Council. This database contains data of dissolved inorganic macronutrients and dissolved oxygen and chlorophyll-a, as well as basic physical information about the water column. Data from this database were the main source of in situ observations for the Ebro Delta (ED) and Catalan Shelf (CS) regions used in this study (Figure 1).
A third data source was collected from the Operational Observatory of the Catalan Sea2 (OOCS), downloaded from the Copernicus Marine Environmental Monitoring Service (CMEMS; INSITU_MED_NRT_OBSERVATIONS_013_035). This is a fixed monitoring station placed in the CS (41°66′ N, 2°90′ E) that provides two CTD profiles per month for the 2014–2016 period, including temperature, salinity, and chlorophyll-a estimates derived from fluorescence.
Finally, data collected by the Balearic Islands Coastal Observing and Forecasting System3 (SOCIB, Tintoré et al., 2013) has been also included. SOCIB performs routine monitoring of physical and biogeochemical properties around the Balearic Islands with particular emphasis on the Ibiza and Mallorca channels (IC, MC) through a fleet of gliders (Figure 1). Original data collected included physical (temperature, salinity, and total density) and biogeochemical data (dissolved oxygen and fluorescence).
All the available data were interpolated to the standard levels defined by the IBAMar database (5, 15, 25, 40, 63, 88, and 113 m). After interpolation, in situ profiles were spatially averaged on a monthly basis in the selected areas (Figure 1). Then, monthly values were aggregated in seasons. However, due to the gaps in the time coverage we decided not to include the months for which there were less than 5 years with available data. Thus, the seasons have been defined as winter (February, March), spring (April, May), summer (July), and fall (October). The seasonality captured by these months matches the stratification dynamics already described in the NWM and is a reasonable proxy for standard seasonal dynamics (Figure 2 in Segura-Noguera et al., 2011). Mixed-layer depth (MLD) was computed using the potential density threshold defined by Holte and Talley (2009), using 10 m as reference depth and a threshold of 0.03 kg m–3.
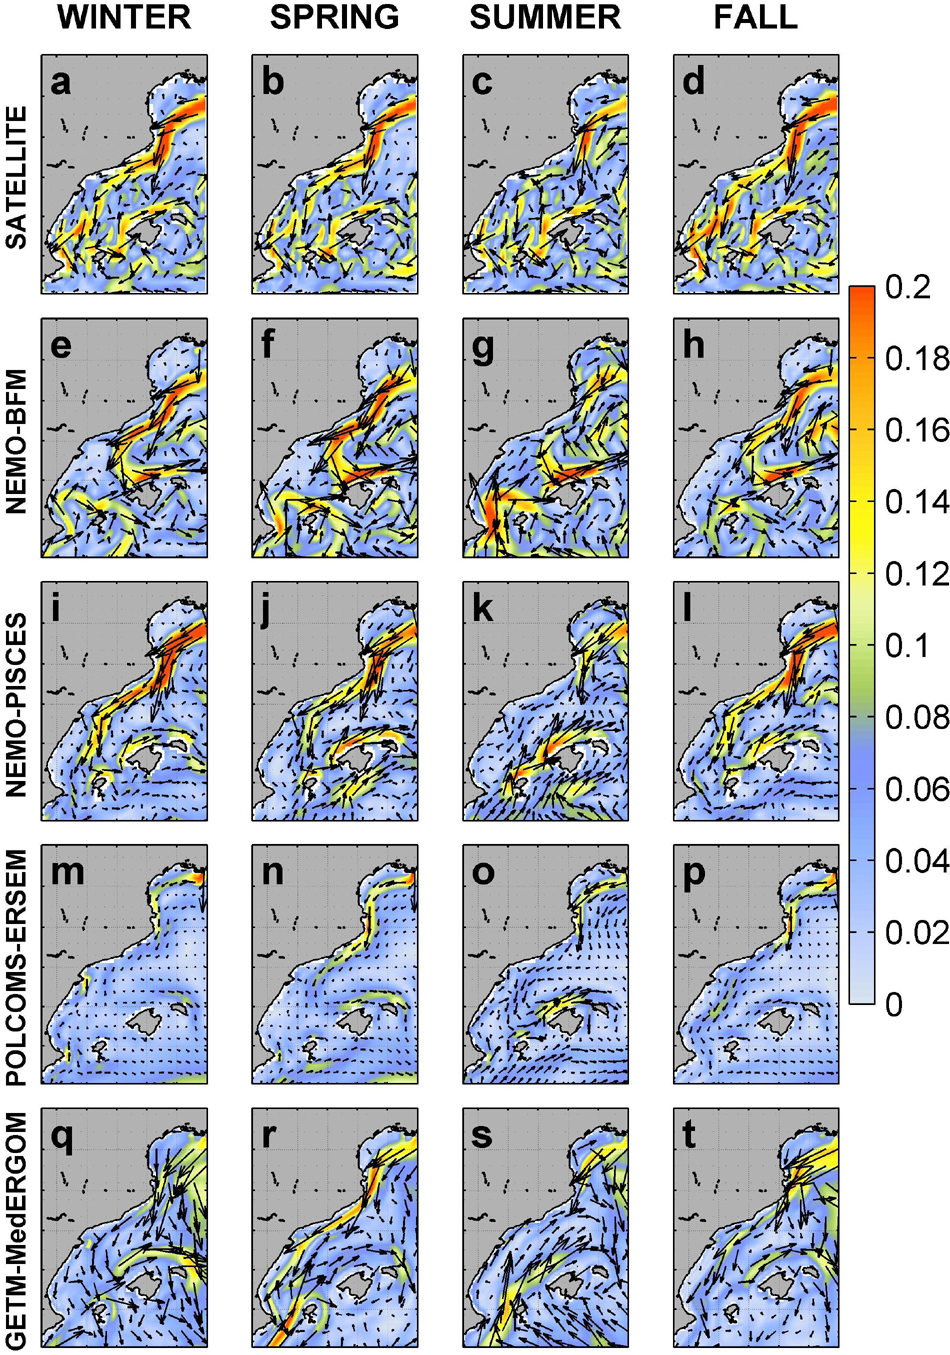
Figure 2. Seasonal pattern of surface currents derived from satellite and the four runs. Intensity (m s– 1) and circulation patterns are shown. Satellite (a–d), NEMO-BFM (e–h), NEMO-PISCES (i–l), POLCOMS-ERSEM (m–p), and GETM-MedERGOM (q–t).
In order to assess the skill of the coupled systems (Doney et al., 2009; Stow et al., 2009), we computed the bias and root mean square difference (RMSD) comparing the average profile (climatology) of observations and each of the runs, using the seven standard vertical levels already defined. We computed these metrics for each season and area and plotted them in target diagrams (Jolliff et al., 2009; Salon et al., 2019) for the main variables of interest (density, nitrate, phosphate, and chlorophyll-a).
Observations: Satellite
Monthly satellite data obtained from the Copernicus Marine Environment Monitoring Service (CMEMS) for the period 2000–2016 were used. In particular, surface chlorophyll-a concentrations at 1 km spatial resolution (OCEANCOLOUR_ MED_CHL_L4_REP_OBSERVATIONS_009_078 Volpe et al., 2012), Sea Surface Temperature (SST) at ∼4 km (SST_MED_ SST_L4_REP_OBSERVATIONS_010_021; Buongiorno Nardelli et al., 2013), and surface geostrophic currents at ∼15 km, derived from altimetric sea-level observations (SEALEVEL_MED_ PHY_L4_REP_OBSERVATIONS_008_051). Furthermore, SST and surface chlorophyll-a from satellite were used as a reference and compared versus surface model outputs using Taylor diagrams (Taylor, 2001).
Coupled Physical–Biogeochemical Models
Four different state-of-the-art coupled physical–biogeochemical modeling systems were assessed. The outputs from the NEMO-BFM system (1/16° horizontal resolution, 72 vertical levels) (Teruzzi et al., 2016) and the NEMO-PISCES (1/12° horizontal resolution, 75 vertical levels) (Sotillo et al., 2015) system were obtained from the CMEMS data center and cover the period 2000–2016. The outputs from the POLCOMS-ERSEM system (1/10° horizontal resolution, 40 vertical levels) were developed in the framework of the CERES H2020 project4 (EU678193) and have recently been reported in Kay et al. (2018). GETM-MedERGOM (1/12° horizontal resolution, 25 vertical levels) is the oceanic component of the Marine Modelling Framework developed at the Joint Research Centre of the EU Commission (Stips et al., 2015). The main results from these simulations can be found in Macias et al. (2019). In all cases, we used the monthly outputs (period 2000–2015) and the data followed the same processing that was mentioned above for the observational data.
With a spatial resolution of 6–12 km, all simulations can be considered eddy-permitting (i.e., not solving the full mesoscale spectrum) and no big differences in their ability to represent the physics can be expected. The main difference among models is the use or not of data assimilation: The NEMO-BFM model assimilates physical and biological data, the NEMO-PISCES model only assimilates physical data, and the POLCOMS-ERSEM and GETM-MedERGOM models do not assimilate any data. All of the systems use similar atmospheric and river forcing (monthly climatologies based on observations), and in all cases, the underlying numerical models have been successfully used in different applications. Detailed information on the main features of the coupled systems, both physical and biogeochemical subsystems, and inputs is shown in Supplementary Tables 1a,b and Supplementary Information a,b.
Results
Horizontal Patterns
In this section, we compare the modeled and observed surface currents, temperature, and chlorophyll-a concentration. We also make comparisons between the four models for density gradient, mixed-layer depth, and surface nitrate and phosphate concentration.
All models capture the main circulation feature of this region, the Northern Current, flowing SW at ca. 0.2 m s–1 following the continental slope of the GoL and the CS (Figure 2). Noticeably, POLCOMS-ERSEM displays lower velocities than observations, 0.07–0.12 m s–1 throughout the year. All models also capture the main seasonal modulation of this current as shown by the satellite-derived results, i.e., current flows enhanced during winter/fall and less intense during summer, in good agreement with observationally based knowledge (Millot and Taupier-Letage, 2006). The NE current flowing along the north of the Balearic islands (Balearic Current, Figures 1, 2) was captured by all models, although the NEMO-BFM simulation generated a marked and permanent cyclonic gyre connecting the Northern Current with a restricted Balearic Current, only extending along the slope around Mallorca and Menorca Islands (Figures 2e–h). There are also noticeable discrepancies among models in the IC, where the observed almost permanent exchange between waters flowing northward and southward is not reproduced.
Observed SST shows a clear seasonal cycle and a marked latitudinal gradient in this region (Figures 3a–d). GoL temperatures show an average seasonal cycle from 12 to 20°C, whereas the southern areas present a cycle from 14 to 26°C. In general, all the models reproduced these main patterns, presenting also good spatial correlations with satellite observations, but there were biases in the amplitude of the seasonal cycle (Figure 3 and Supplementary Figures 1, 2). NEMO-BFM shows an overall and slight overestimation over the whole area of ca. 0.5°C in spring and summer (Figures 3f,g). POLCOMS-ERSEM presents an overall overestimation over the whole area during winter, spring, and summer, reaching around + 1°C (Figures 3m–o). GETM-MedERGOM generally overestimates, with maximum differences ca. 1°C in winter; however, coastal and shallow areas are underestimated by around 1°C throughout the year (Figures 3q–t). It is worth mentioning that NEMO-BFM and NEMO-PISCES do assimilate SST data, which probably explains their better performance.
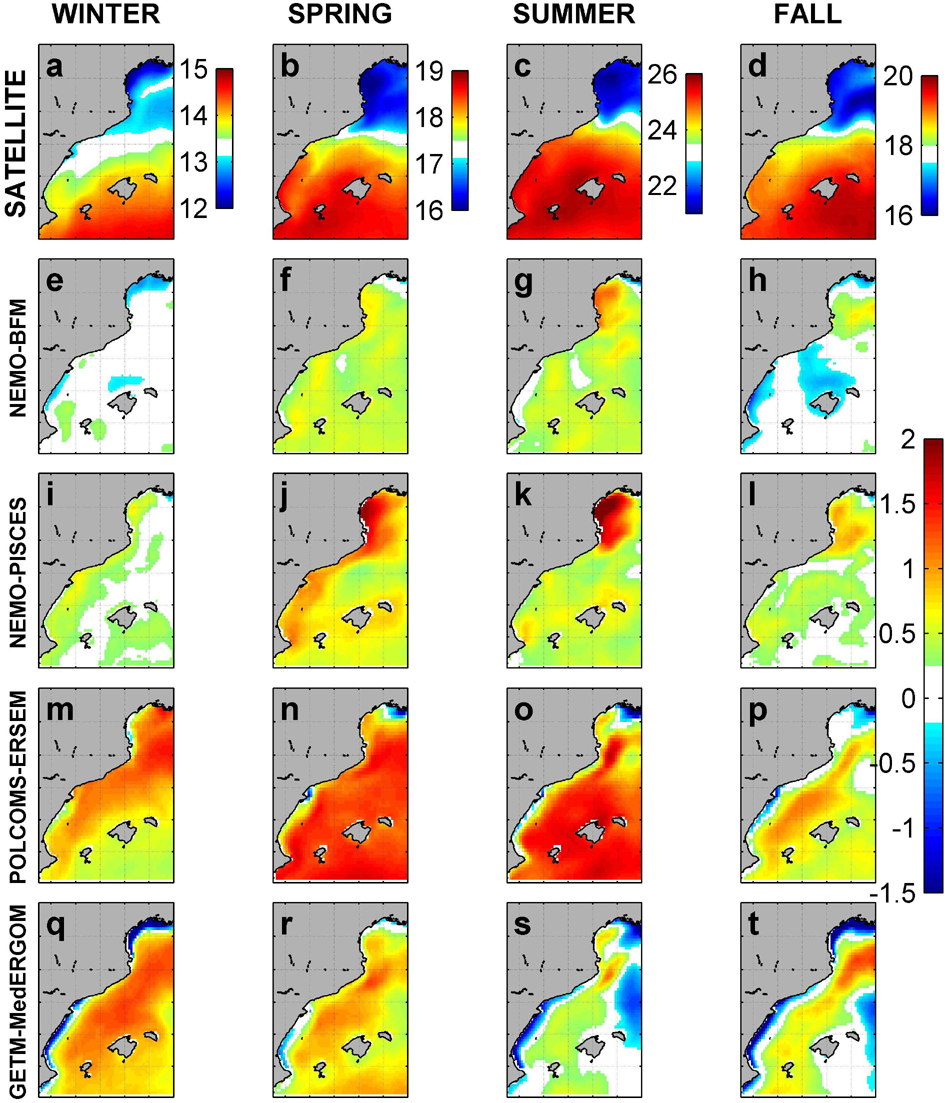
Figure 3. Average seasonal SST from satellites and differences (°C) in SST between satellites and models. Satellite (a–d), NEMO-BFM (e–h), NEMO-PISCES (i–l), POLCOMS-ERSEM (m–p), and GETM-MedERGOM (q–t).
The modeled vertical difference of density (between 10 and 90 m), used as a proxy of stratification, shows similar spatiotemporal patterns for all the models (Figure 4). The upper water column is less stratified in the north and along the Northern Current path, and there is a marked seasonal cycle with minimal stratification in winter. Values vary between 0.5 and 4.5 kg m–3 in winter and summer, respectively (Figure 4). However, significant differences are found among models, with NEMO-PISCES showing more stratification along the year (e.g., 30–50% more than GETM-MedERGOM in summer) (Figures 4i,k). The density differences in the vertical may have important implications in how the vertical motions and nutrient diffusivity are reproduced in the models. An additional indicator of vertical mixing is the MLD in February, which has traditionally been used as a proxy for the intensity of deep winter convection. MLD is computed from monthly mean fields, and thus the computed MLD values are smaller than the ones typically reported in the literature for particular events, when MLD could be deeper than 1000 m (Somot et al., 2018). Estimates from NEMO-BFM and NEMO-PISCES runs (Figures 4a,f) present an area with maximum values extending from the CS to the GoL, varying from 100 to 150 m and 70–100 m, respectively. Within the rest of the region, this depth varies from 60 to 80 m and 20–50 m for each run. On the other hand, POLCOMS-ERSEM and GETM-MedERGOM present during February a similar spatial pattern of MLD, but with an exceptional area southward of the GoL that reached more than 800 m for POLCOMS-ERSEM and 500 m for GETM-MedERGOM (Figures 4k,p). Previous reported MLD from climatological (i.e., monthly mean fields) analysis using the same criterion (see subsection “In situ Data”) presented thickness values during February that could reach 50 m (no bloom – Algerian sub-basin, Balearic Channels), 97 m (intermittent bloom – NW, CS), and 185 m (bloom region, GoL) (Lavigne et al., 2013).
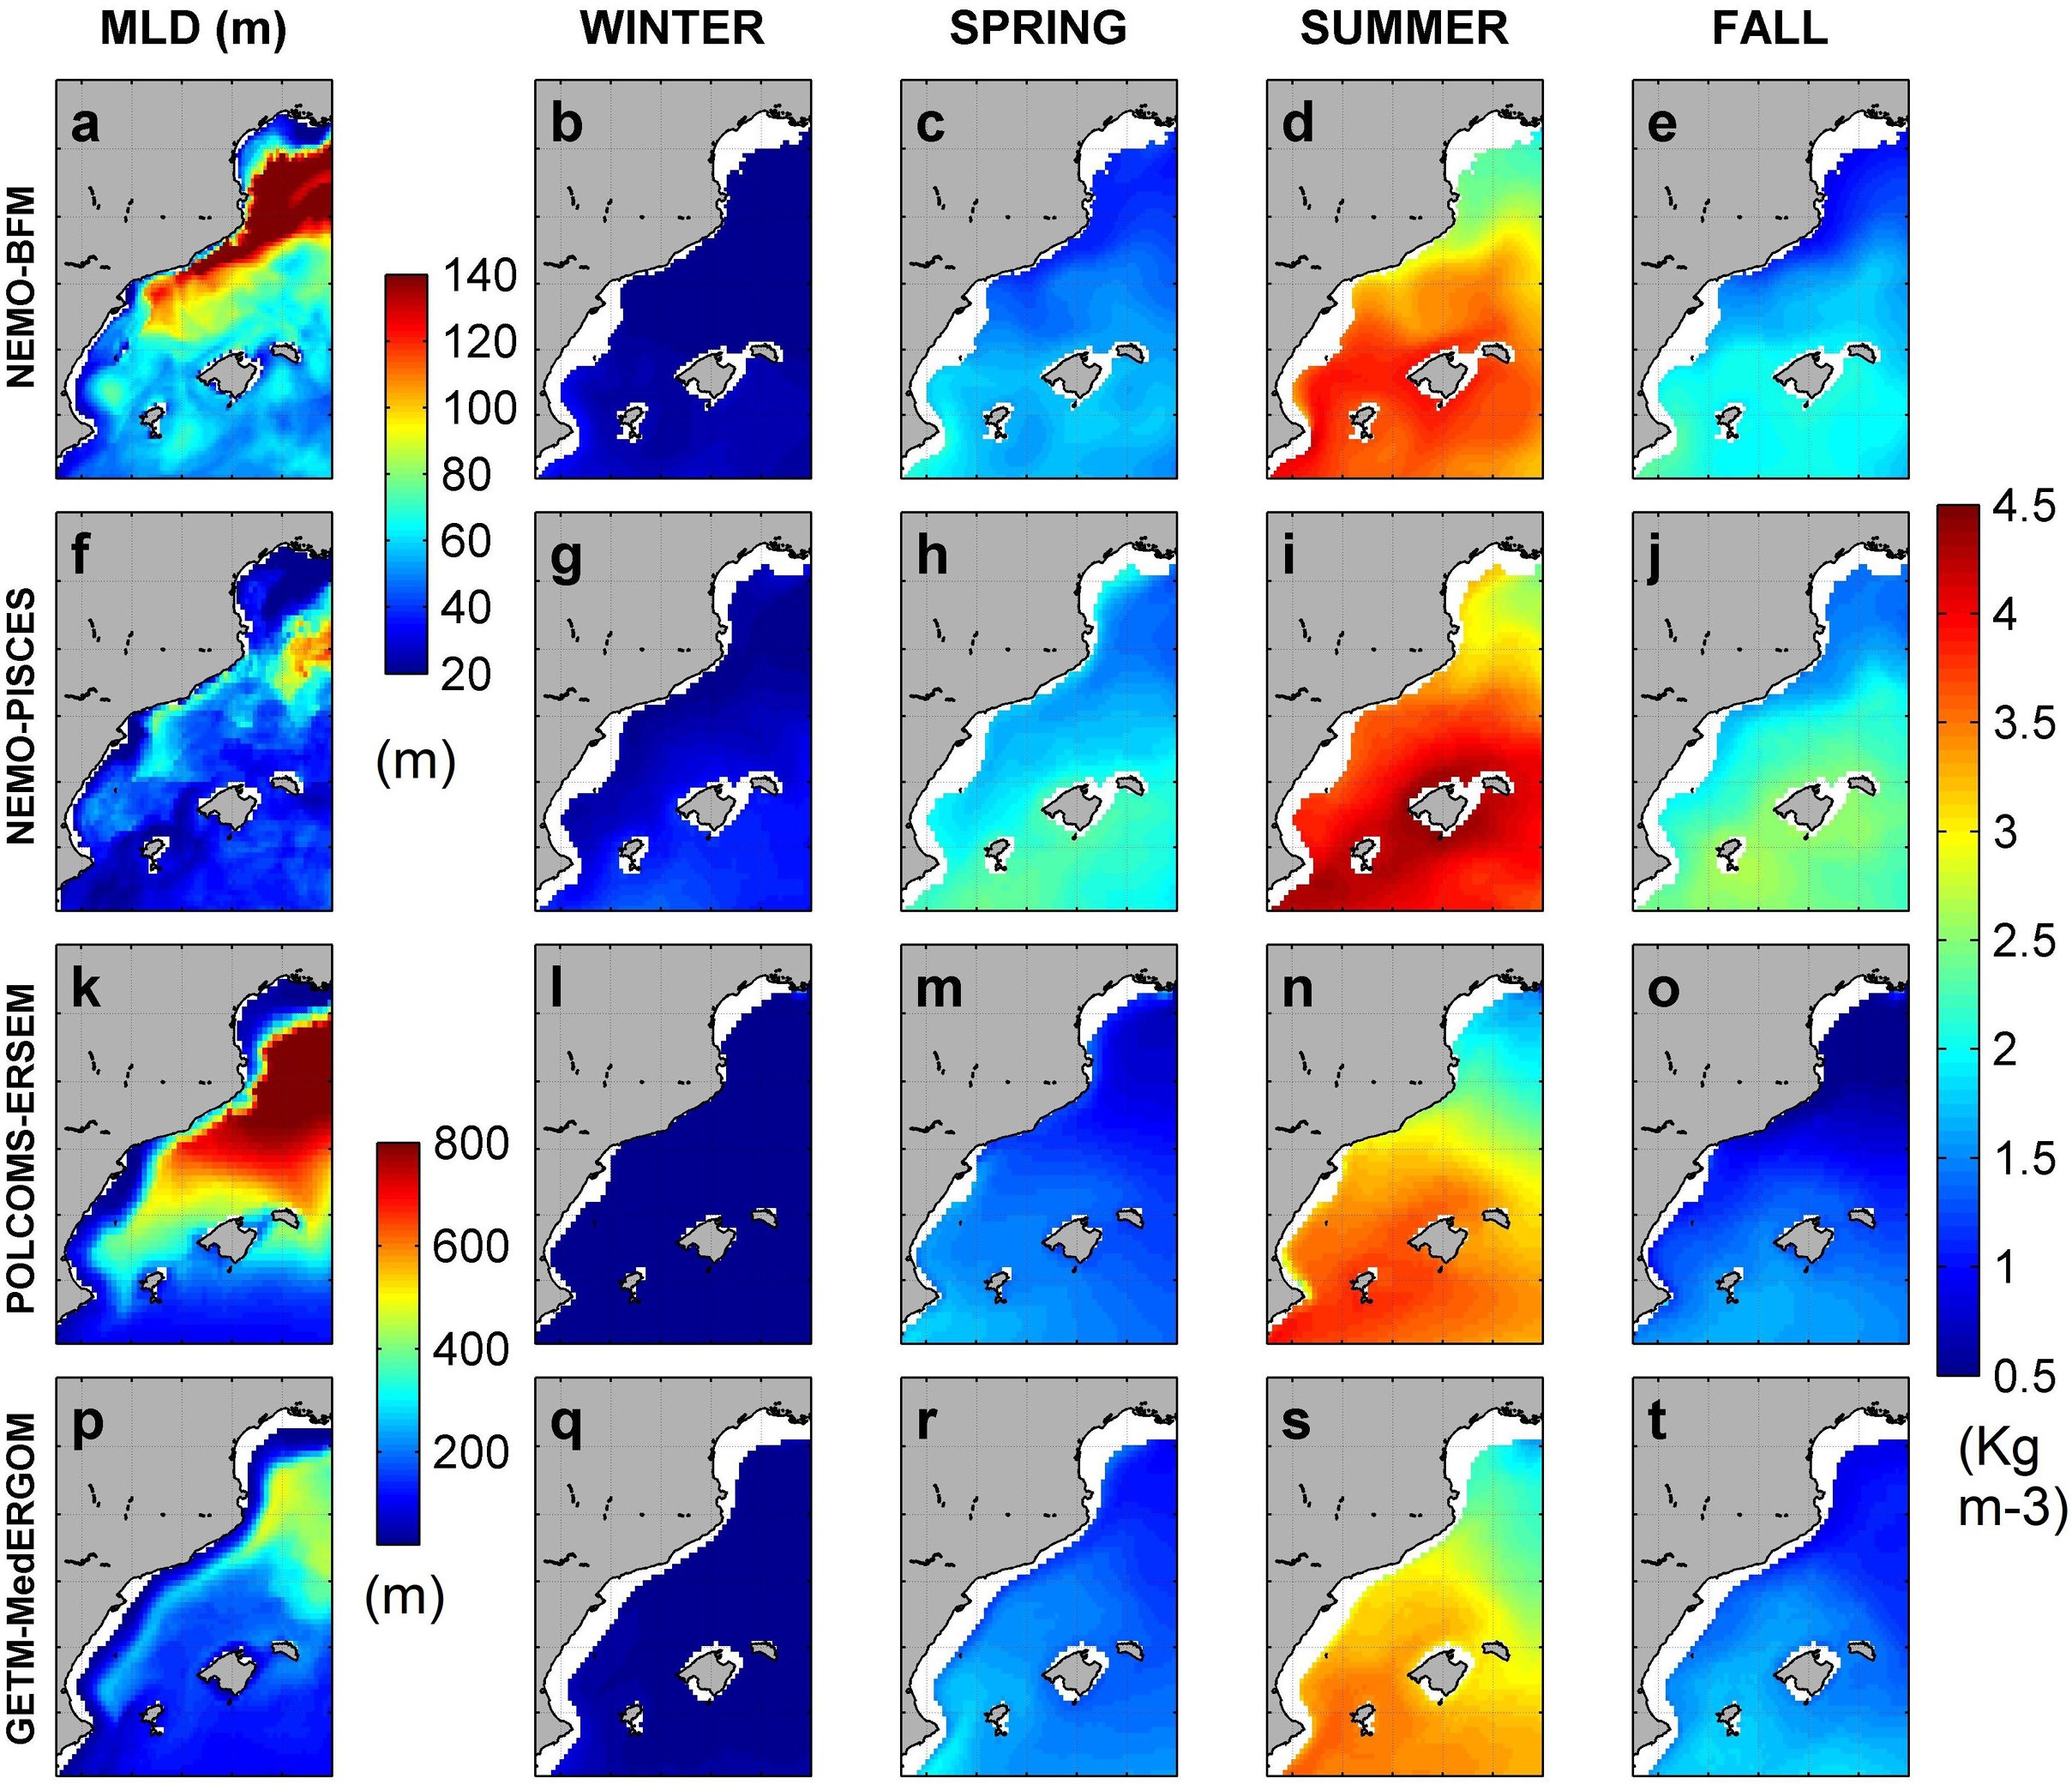
Figure 4. Mixed-layer depth (MLD) (m) in February (a,f,k,p). Density difference (0–90 m) through seasons is shown for NEMO-BFM (b–e), NEMO-PISCES (g–i), POLCOMS-ERSEM (l–o), and GETM-MedERGOM (q–t).
Simulated surface nitrate concentrations (Figure 5) show maximum values during winter. In NEMO-BFM and NEMO-PISCES, the largest values are associated with the Ebro and Rhone rivers and extend south over the GoL and CS (Figures 5a,e). In those areas, NEMO-BFM presents values from 1 to 2 μM, whereas NEMO-PISCES shows a tongue with large values from GoL southward (10 μM), including CS. In winter, this tongue follows the Northern Current and reaches the Ibiza Channel (IC) with concentrations of 1–2 μM (Figure 5e). On the other hand, POLCOMS-ERSEM and GETM-MedERGOM present large values in the open sea, reaching 6 μM GETM-MedERGOM (Figures 5i,m). For the rest of the seasons, local maxima are located around ED, CS, and Rhone River, with peaks ca. 5, 2, and 4 μM for NEMO-BFM, POLCOMS-ERSEM, and GETM-MedERGOM simulations, respectively (Figure 5).
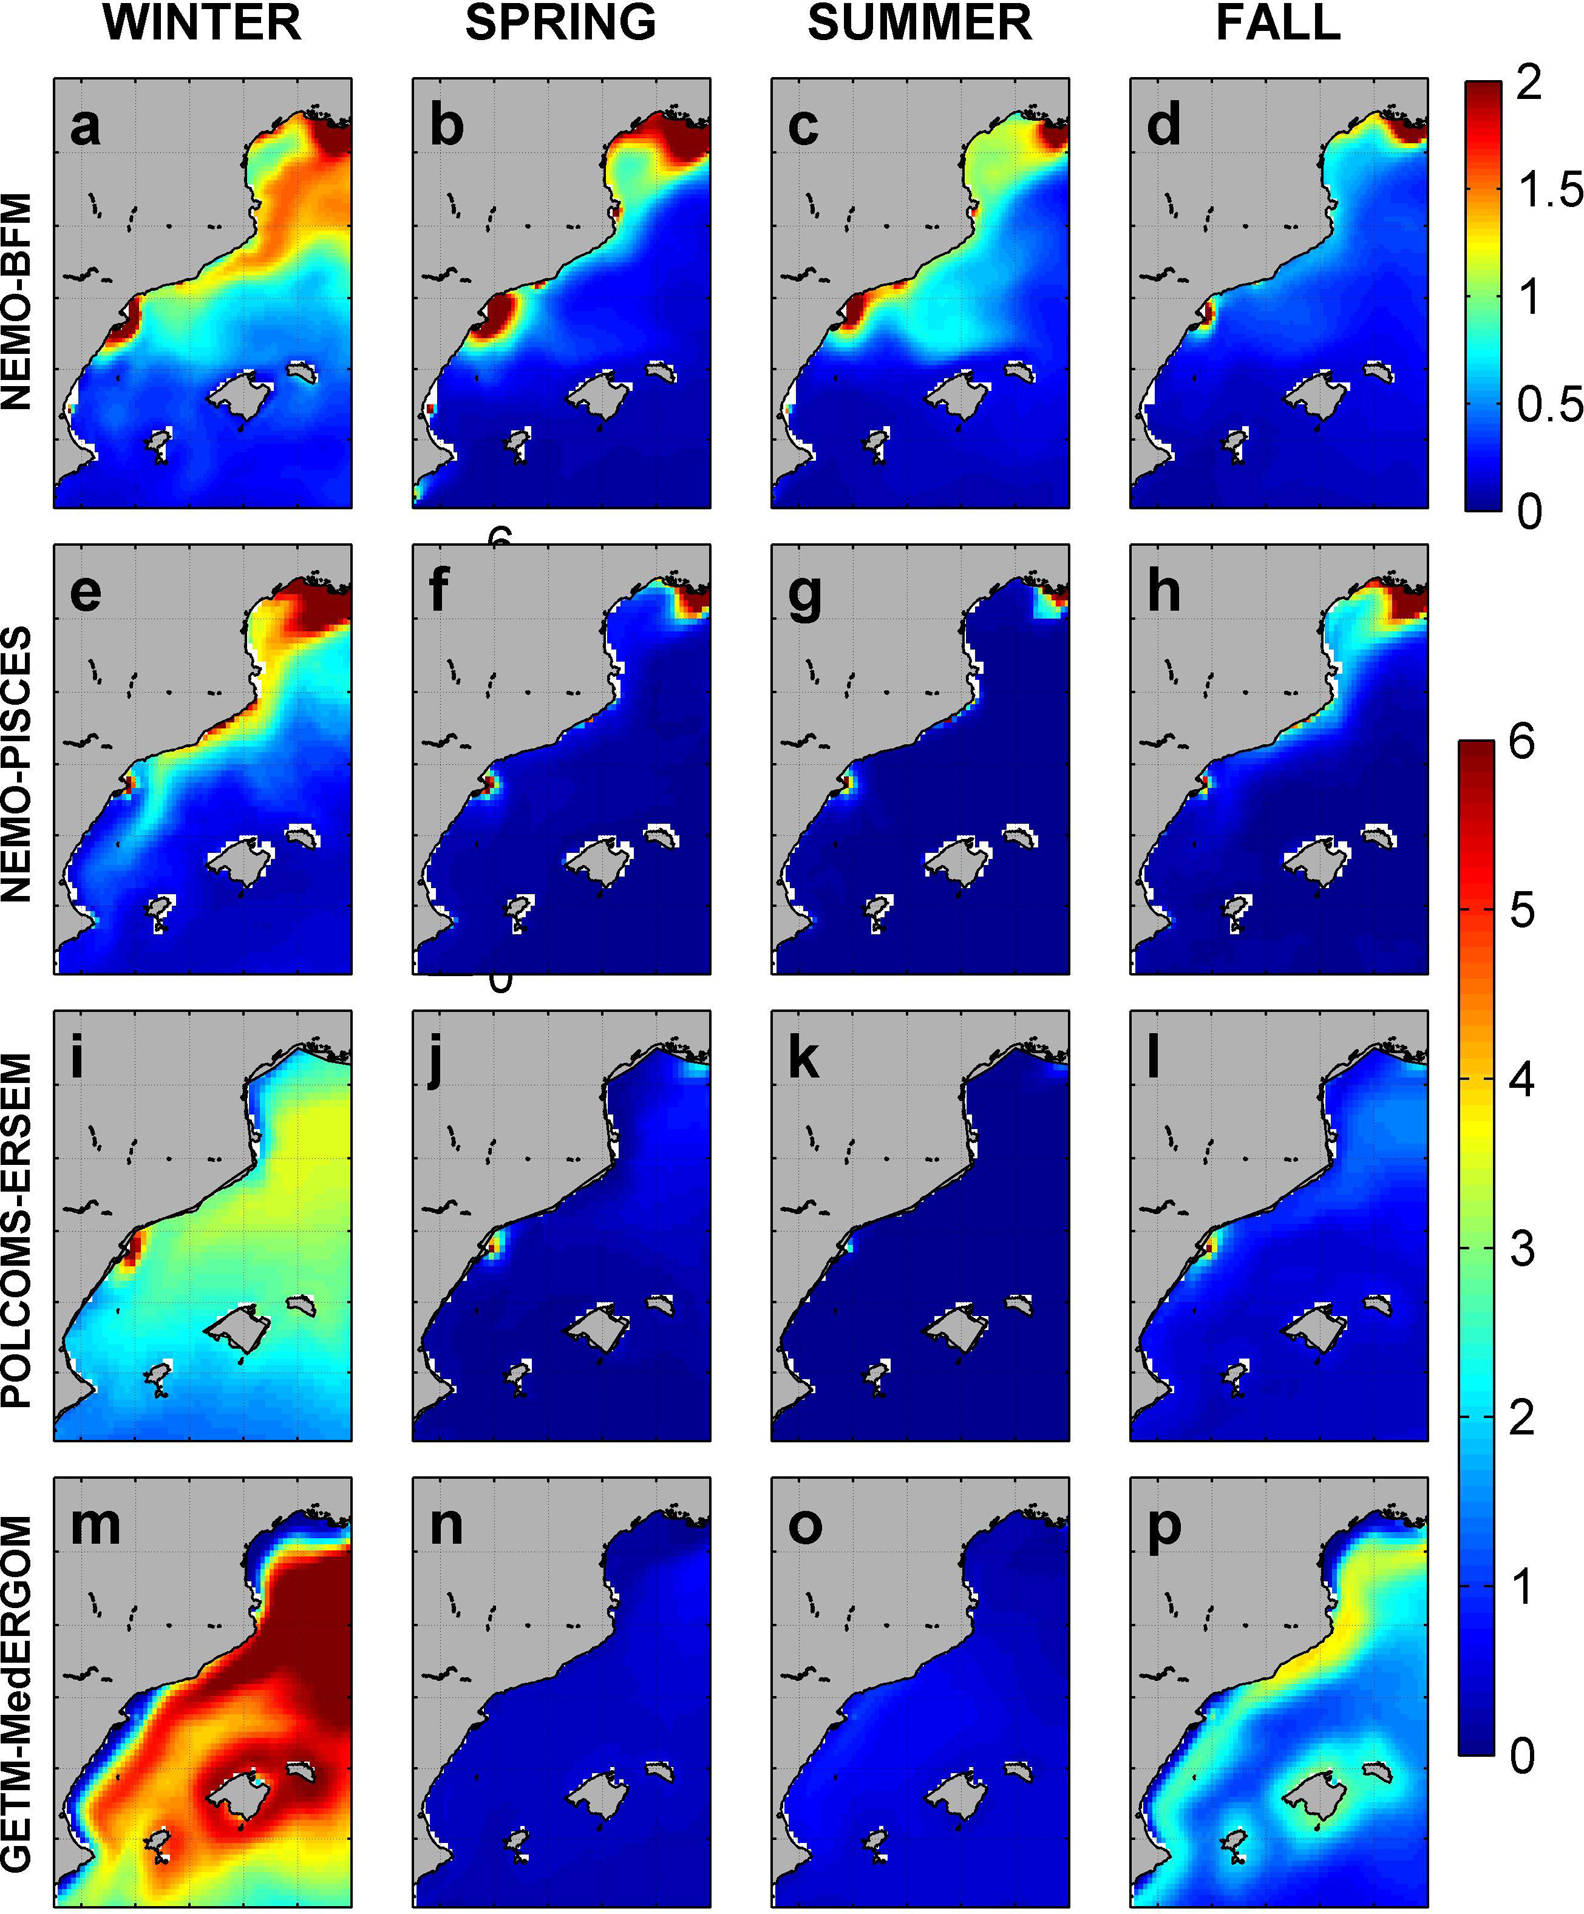
Figure 5. Surface nitrate concentration from each model. Values in μM. Nitrate levels around Rhone River reach 10 μM, but in order to show the spatial variability in the rest of the area, the color bar saturates at 6 μM. NEMO-BFM (a–d), NEMO-PISCES (e–h), POLCOMS-ERSEM (i–l), and GETM-MedERGOM (m–p).
Surface phosphate concentrations (Figure 6) follow partially the aforementioned nitrate patterns. Maxima are reached during winter within the area of CS and GoL, with 0.1 μM for NEMO-BFM, 0.2 μM for NEMO-PISCES, and 0.4 μM for POLCOMS-ERSEM and GETM-MedERGOM (Figures 6a,e,i,m). The Ebro and Rhone rivers supply phosphate, leading to spatially restricted local maxima throughout the year of 0.2 μM for NEMO-BFM and 0.4 μM for the other coupled systems. POLCOMS-ERSEM and GETM-MedERGOM overall present higher surface phosphate concentrations in open-ocean conditions, ranging from 0.3 to 0.4 μM in winter/fall to 0.15–0.2 μM during spring/summer (lower for POLCOMS-ERSEM) (Figures 6i,m). It is worth noticing that the advection of nutrients from the GoL southward (both nitrate and phosphate) follows the path of the Northern Current. The aforementioned differences in the pattern of the Northern Current in the Balearic Sea determine the range of influence of the Rhone river.
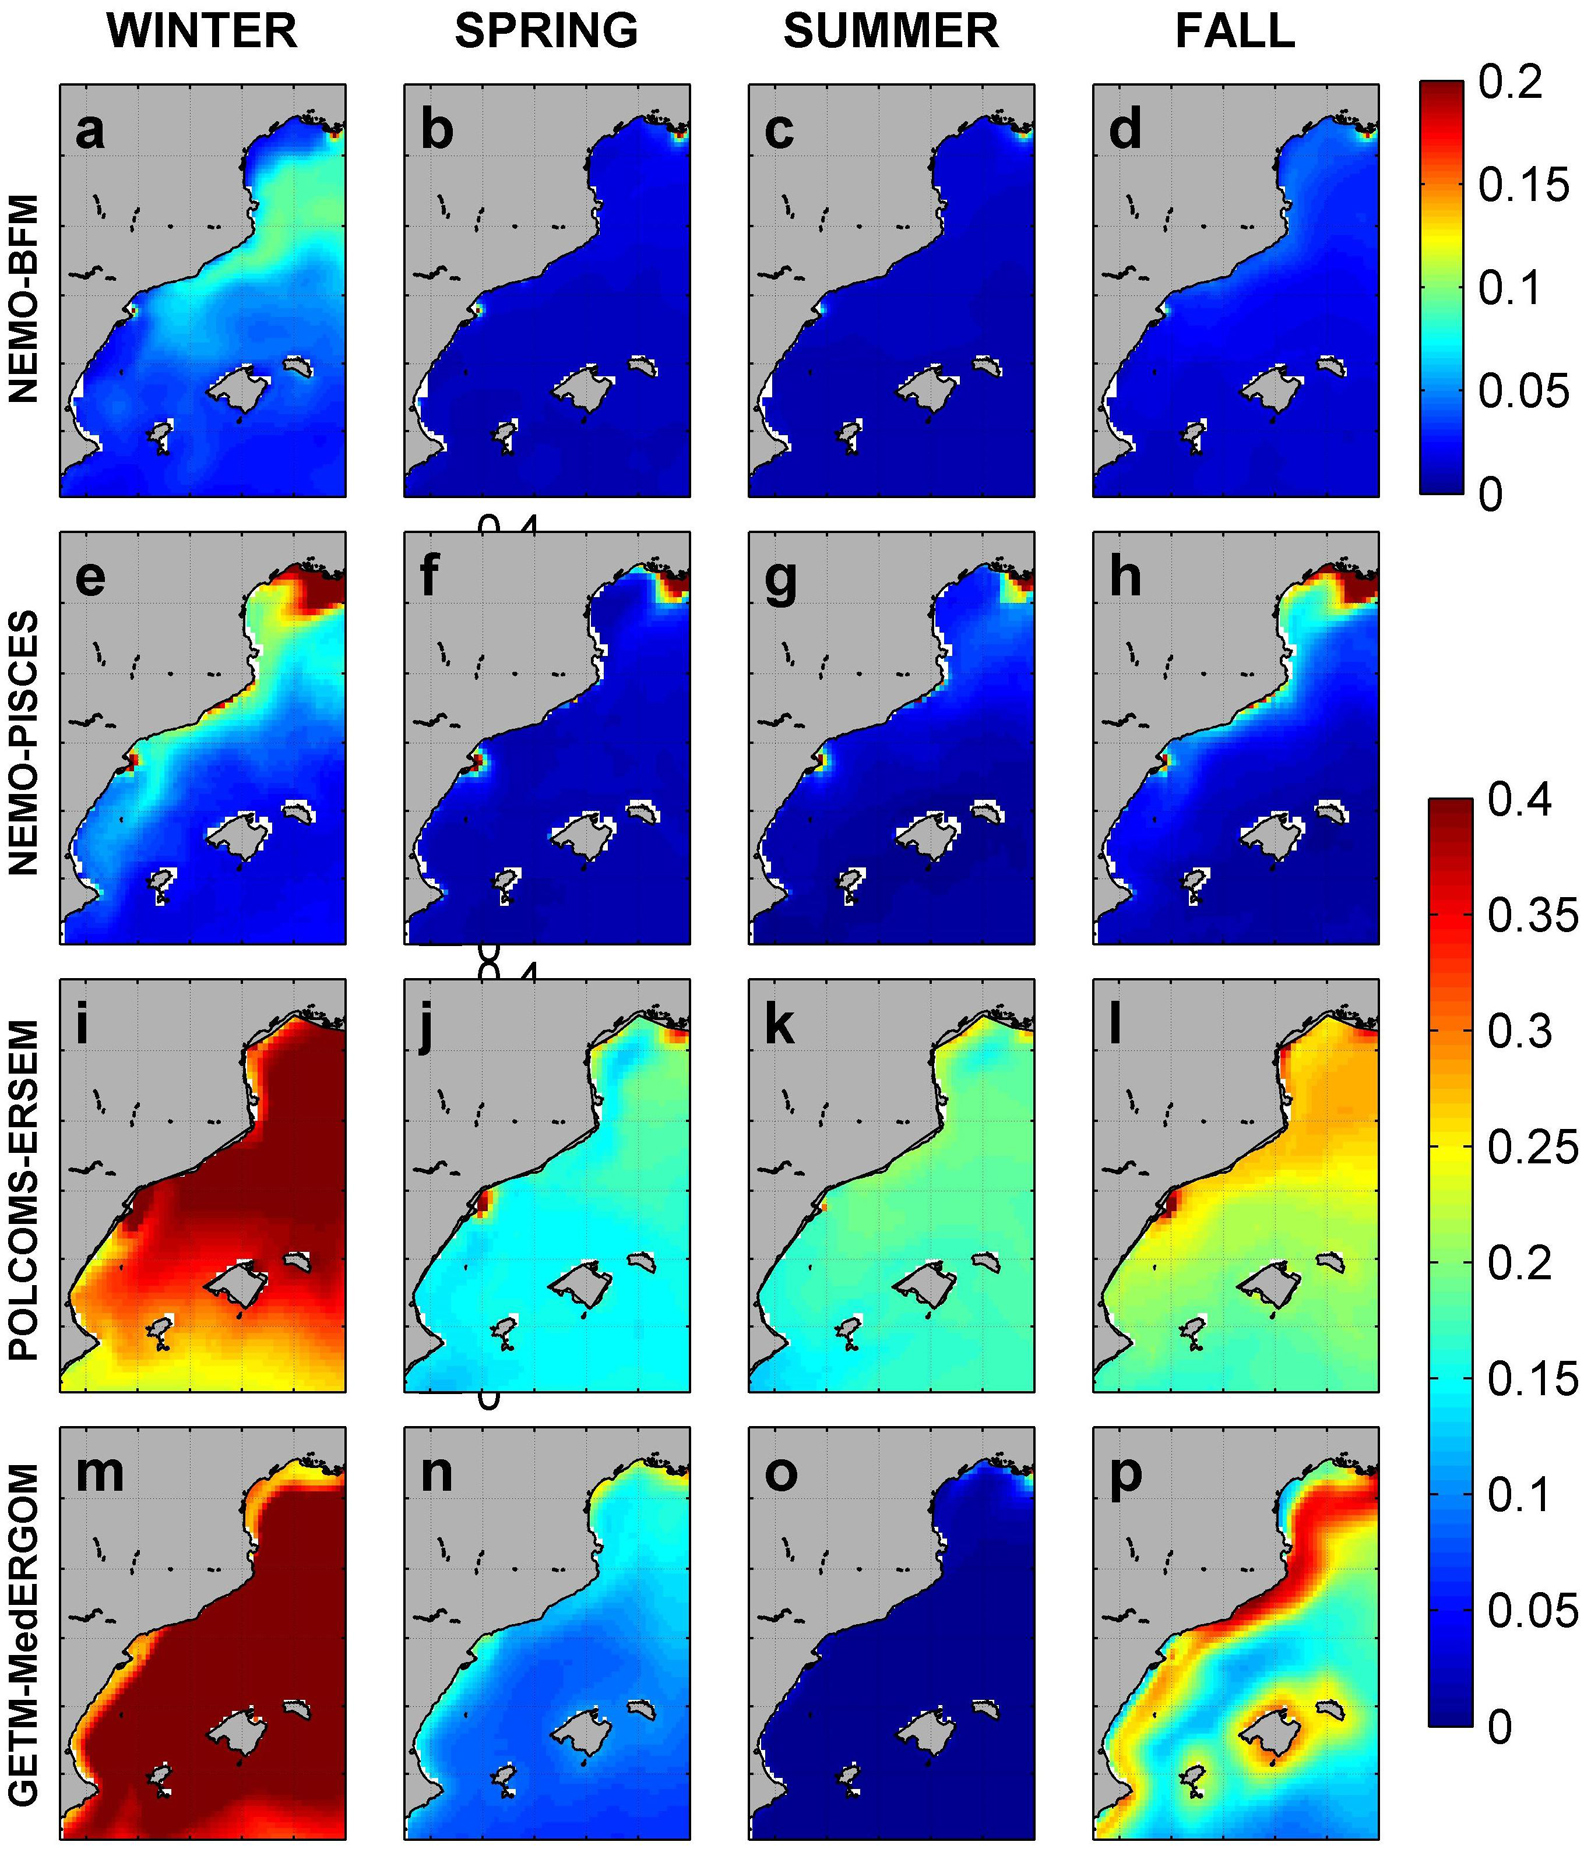
Figure 6. Surface phosphate concentration from each model. Values in μM. NEMO-BFM (a–d), NEMO-PISCES (e–h), POLCOMS-ERSEM (i–l), and GETM-MedERGOM (m–p).
Observed surface chlorophyll-a from satellite shows a seasonal pattern in open waters (central and southern areas) with the highest values during winter (0.4–0.3 mg m–3) and minima of ca. 0.1 mg m–3 in summer (Figures 7a–d). The southern part of the GoL exhibits a different seasonal pattern, with maxima during spring (ca. 0.3 mg m–3) (Figures 7a–d). The ED and coastal areas within the GoL exhibit local maxima along the entire year, exceeding 1 mg m–3. The NEMO-BFM simulation is almost identical to the seasonal satellite climatologies due to data assimilation. However, winter correlation is slightly lower than 0.5 and very similar to values of other runs (Figures 7e–h and Supplementary Figures 3, 4). Furthermore, some limited coastal areas around Ebro delta and Rhone presented lower values, with a difference of around 0.5 mg m–3 (Figures 7f,h and Supplementary Figure 4). The NEMO-PISCES model shows higher-than-expected chlorophyll-a concentrations, particularly during winter when values exceed satellite observation by 1.5–2 mg m–3 in most of the shelf and coastal areas (Figure 7i). The POLCOMS-ERSEM simulation does not follow satellite patterns during winter, presenting negative correlations with observations (correlation coefficient = -0.13, symbol is not shown in Supplementary Figure 3 a due to the negative value) and local maxima in the southernmost area, overestimating satellite values by 0.5–1 mg m–3 and estimating very low concentrations in the GoL (differences of -0.5 mg m–3) (Figure 7m and Supplementary Figure 4m). The GETM-MedERGOM simulation overall slightly overestimates surface values in open water, and maximum positive differences are associated with coastal areas and Rhone riverine influence during summer (2 mg m–3) (Figures 7s,t and Supplementary Figures 4s,t).
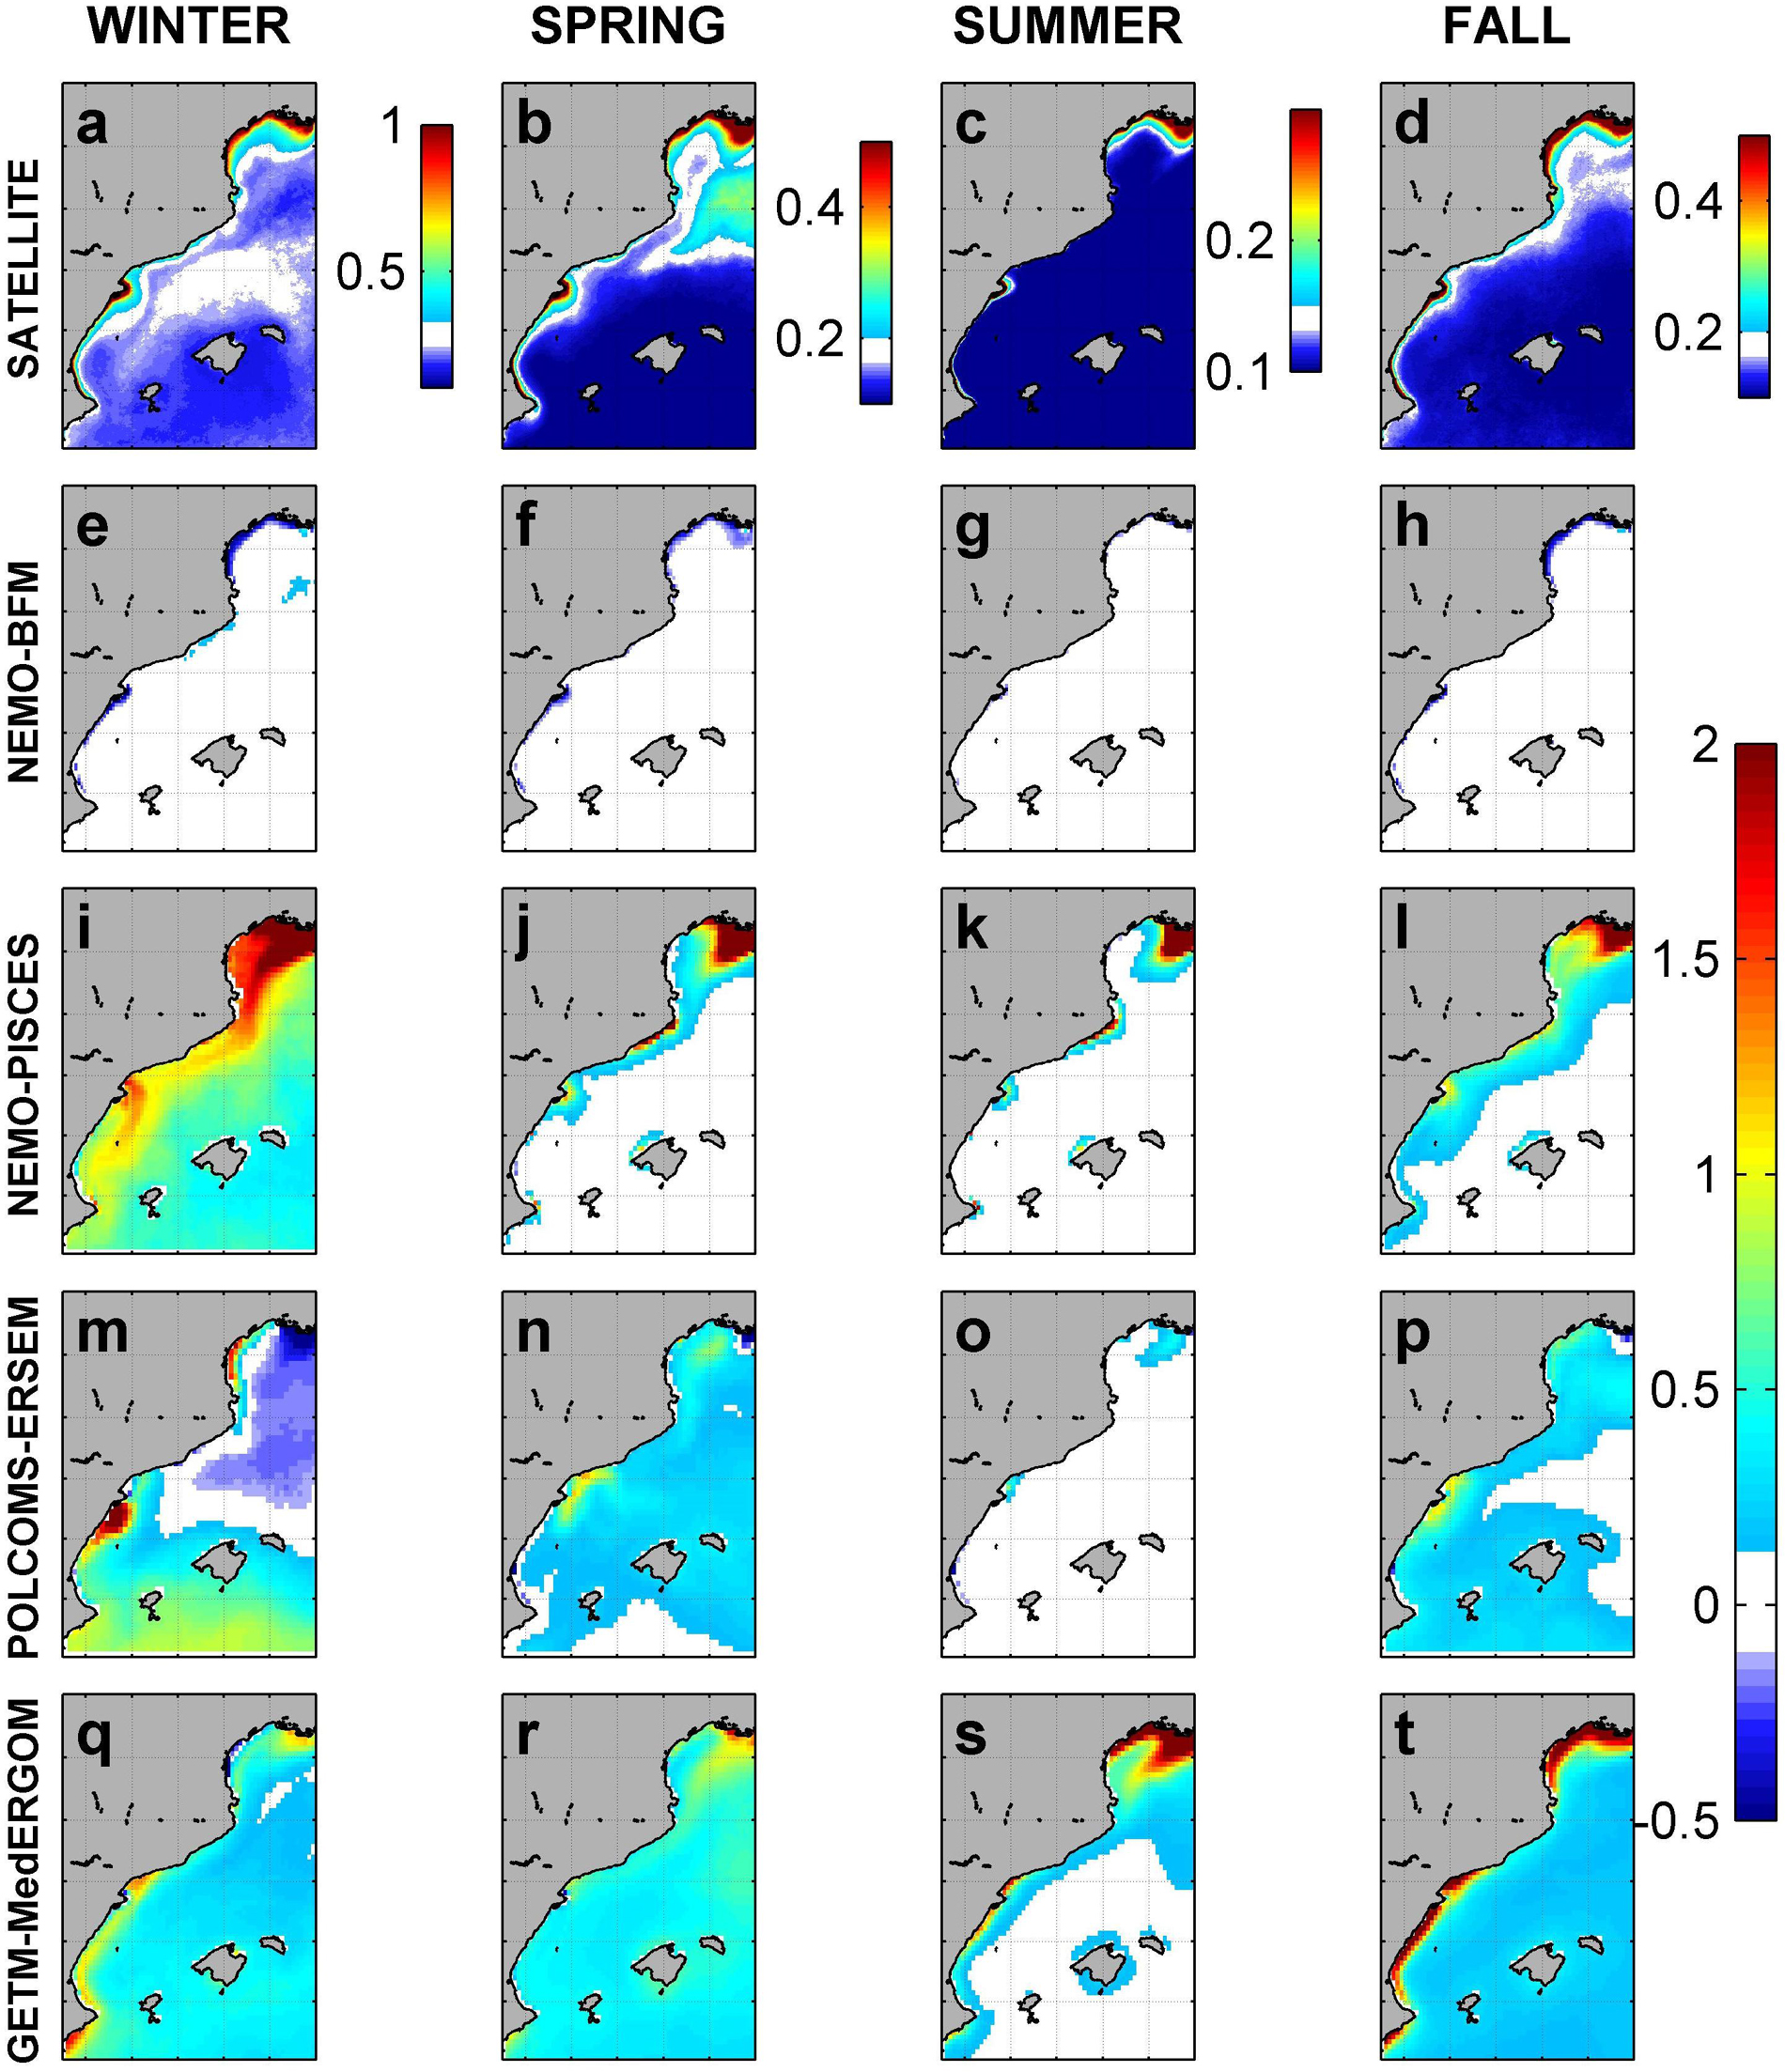
Figure 7. Average seasonal pattern of surface chlorophyll-a a derived from satellite and difference with the four models (mg m– 3). Satellite (a–d), NEMO-BFM (e–h), NEMO-PISCES (i–l), POLCOMS-ERSEM (m–p), and GETM-MedERGOM (q–t).
Vertical and Temporal Patterns
In this section, we compare vertical profiles of the model outputs to in situ measurements of density, nitrate, phosphate, and chlorophyll-a concentration. The comparison is summarized using target diagrams in this section, profile plots can be found in Supplementary Information.
Observed profiles of density in all regions show a marked seasonality (Figure 8a and Supplementary Figures 5a, 6, 7). In summer, the water column is highly stratified due to the warming of the upper layers, but the stratification is eroded in fall until the mixed winter conditions set in. In general, all models show a good agreement with in situ profiles and seasonal patterns in all regions, capturing the differing intensity of winter mixing and timing of the re-stratification of the water column between regions (Figure 9 and Supplementary Figure 5–7). However, a detailed analysis shows some differences. In the Balearic channels (IC and MC), observations and simulations show a similar seasonal cycle, density ranging from 1029.5 kg m–3 (120 m) to 1024.5 kg m–3 (summer at 5 m) (Figure 8a and Supplementary Figures 5a, 6). NEMO-BFM presents the overall highest deviation from observations particularly at the IC, simulating lighter waters and thus negative bias, due to the absence of the Northern Current influence as mentioned above (Figure 9C). The NEMO-PISCES run presents overall shallower peaks ca. 30–40 m (Figure 8e and Supplementary Figure 5e). On the other hand, POLCOMS-ERSEM and GETM-MedERGOM present deeper peaks in February, ranging between 130 and 500 m and 120 and 180 m, respectively (Figures 8g,i and Supplementary Figures 5g,i). Regarding the depth of the pycnocline, there are also differences among models, with NEMO-BFM showing it at deeper levels and POLCOMS-ERSEM at shallower levels, and NEMO-PISCES being the one that best fits the observed values (Supplementary Figure 6). Finally, POLCOMS-ERSEM simulates lighter waters below the pycnocline throughout the year in both areas, ca. 1029 kg m–3 (120 m) (Supplementary Figures 6e–h,m–p).
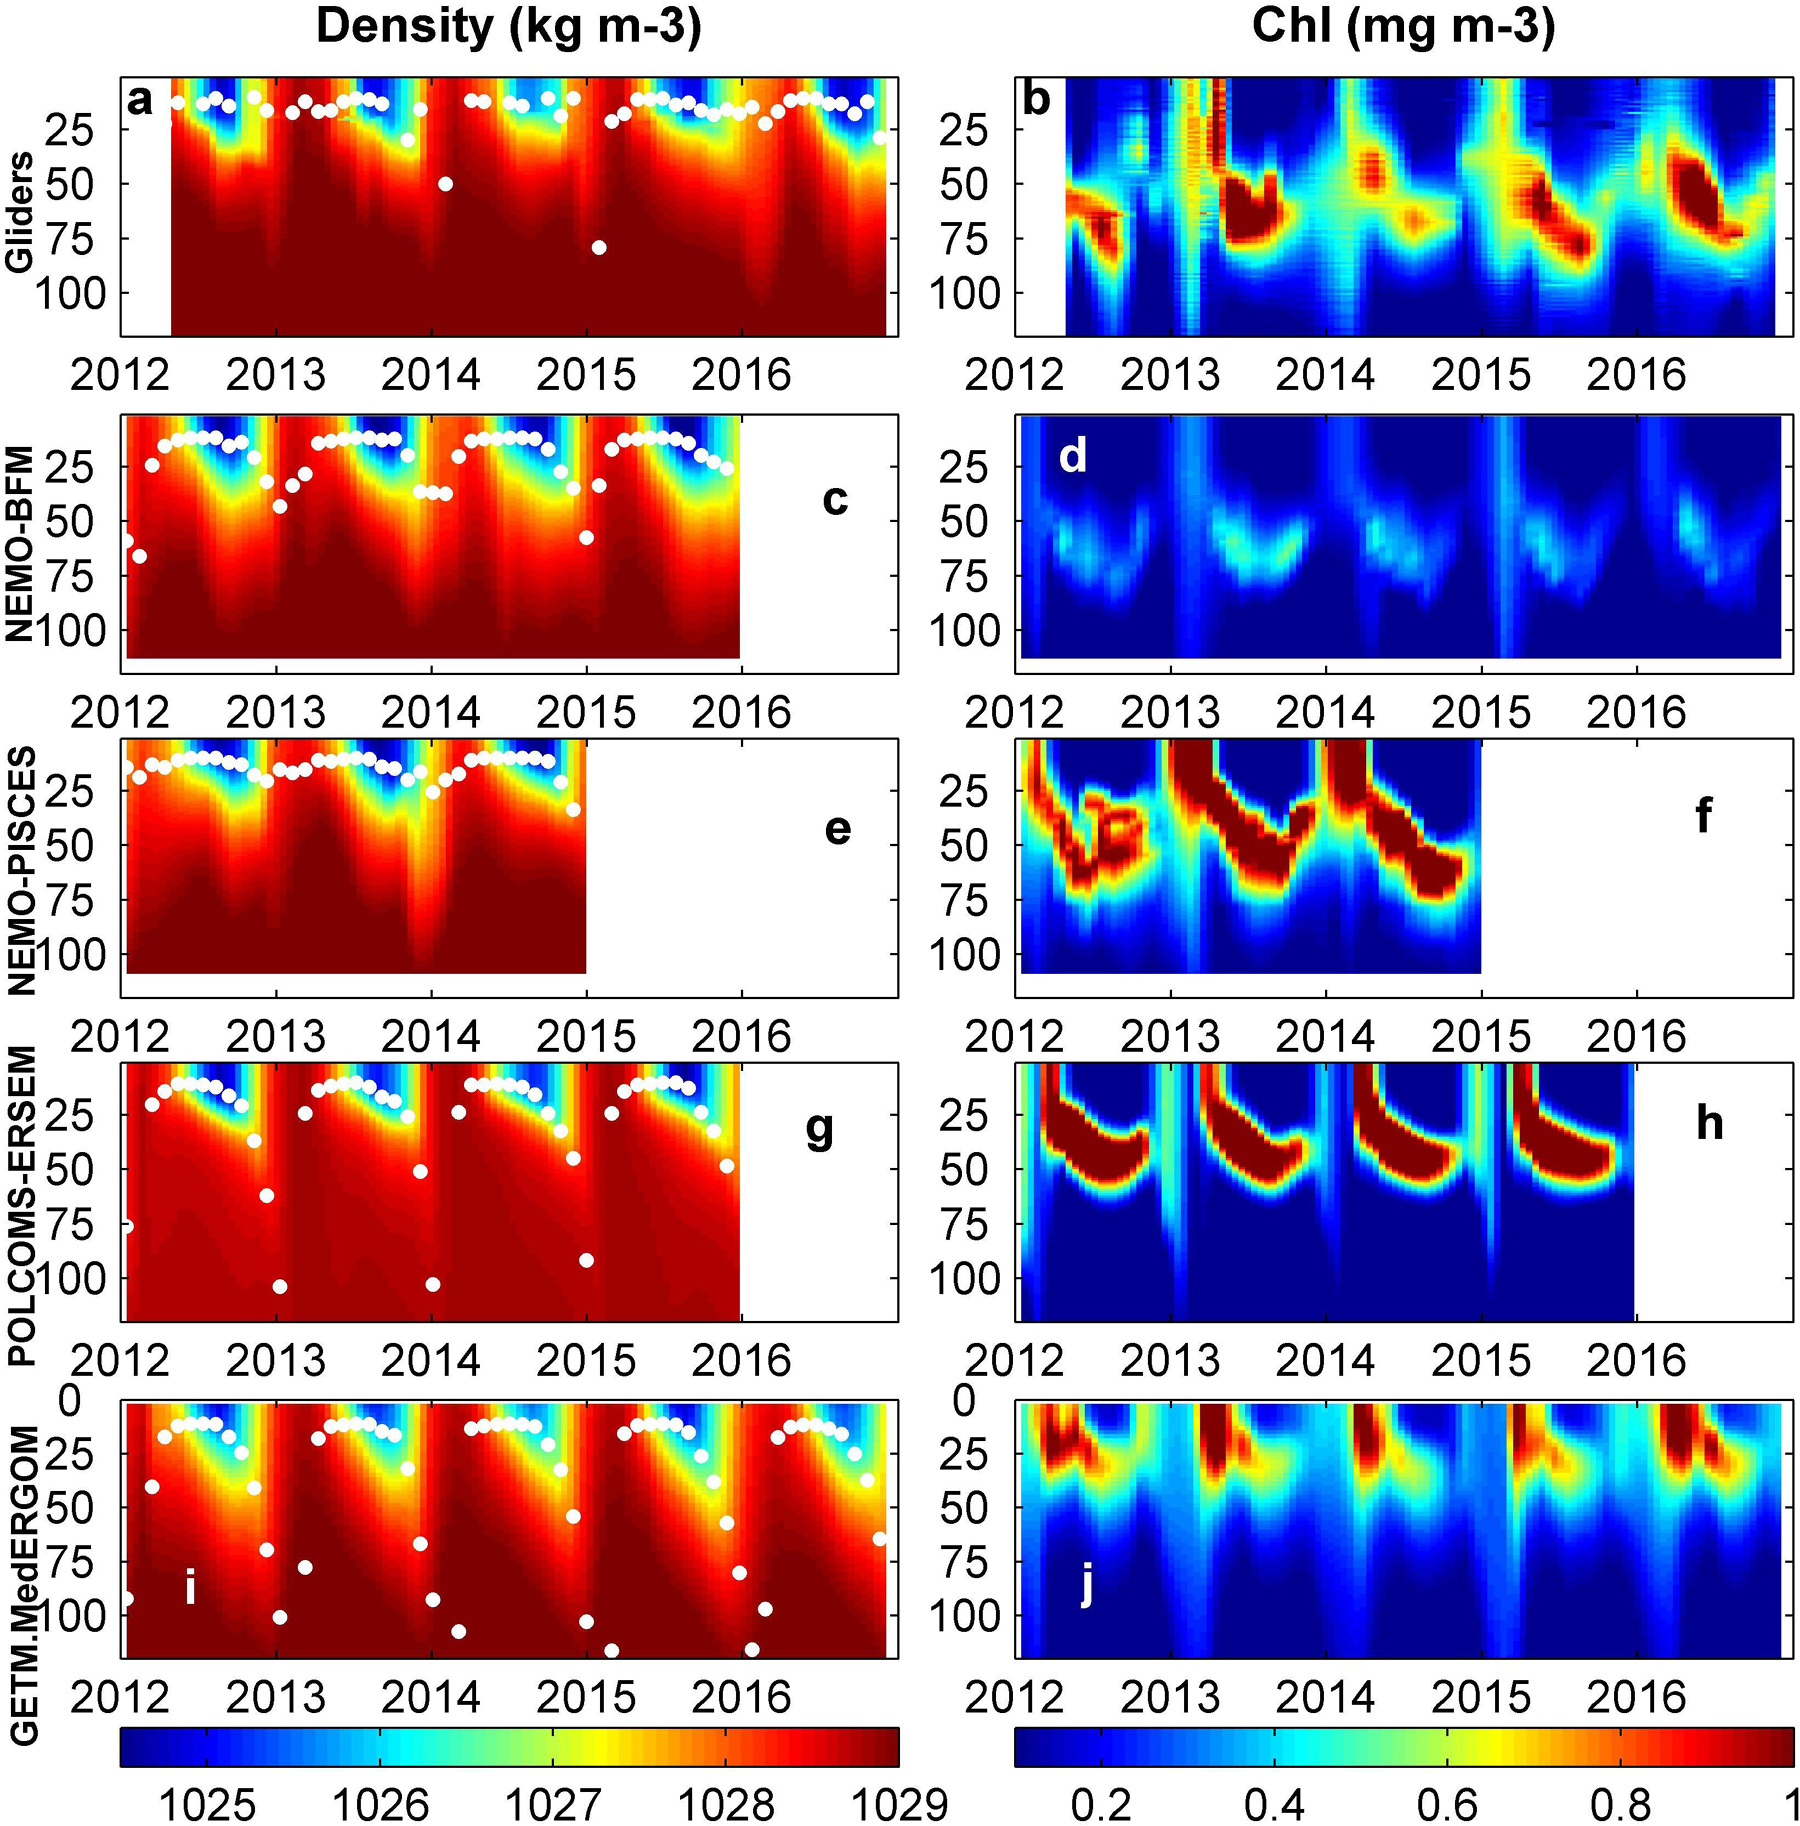
Figure 8. z–t plots of water density and chlorophyll-a at the Ibiza Channel from gliders and models. White dots are mixed-layer depth estimates. Gliders (a–b), NEMO-BFM (c–d), NEMO-PISCES (e–f), POLCOMS-ERSEM (g–h), and GETM-MedERGOM (i–j).
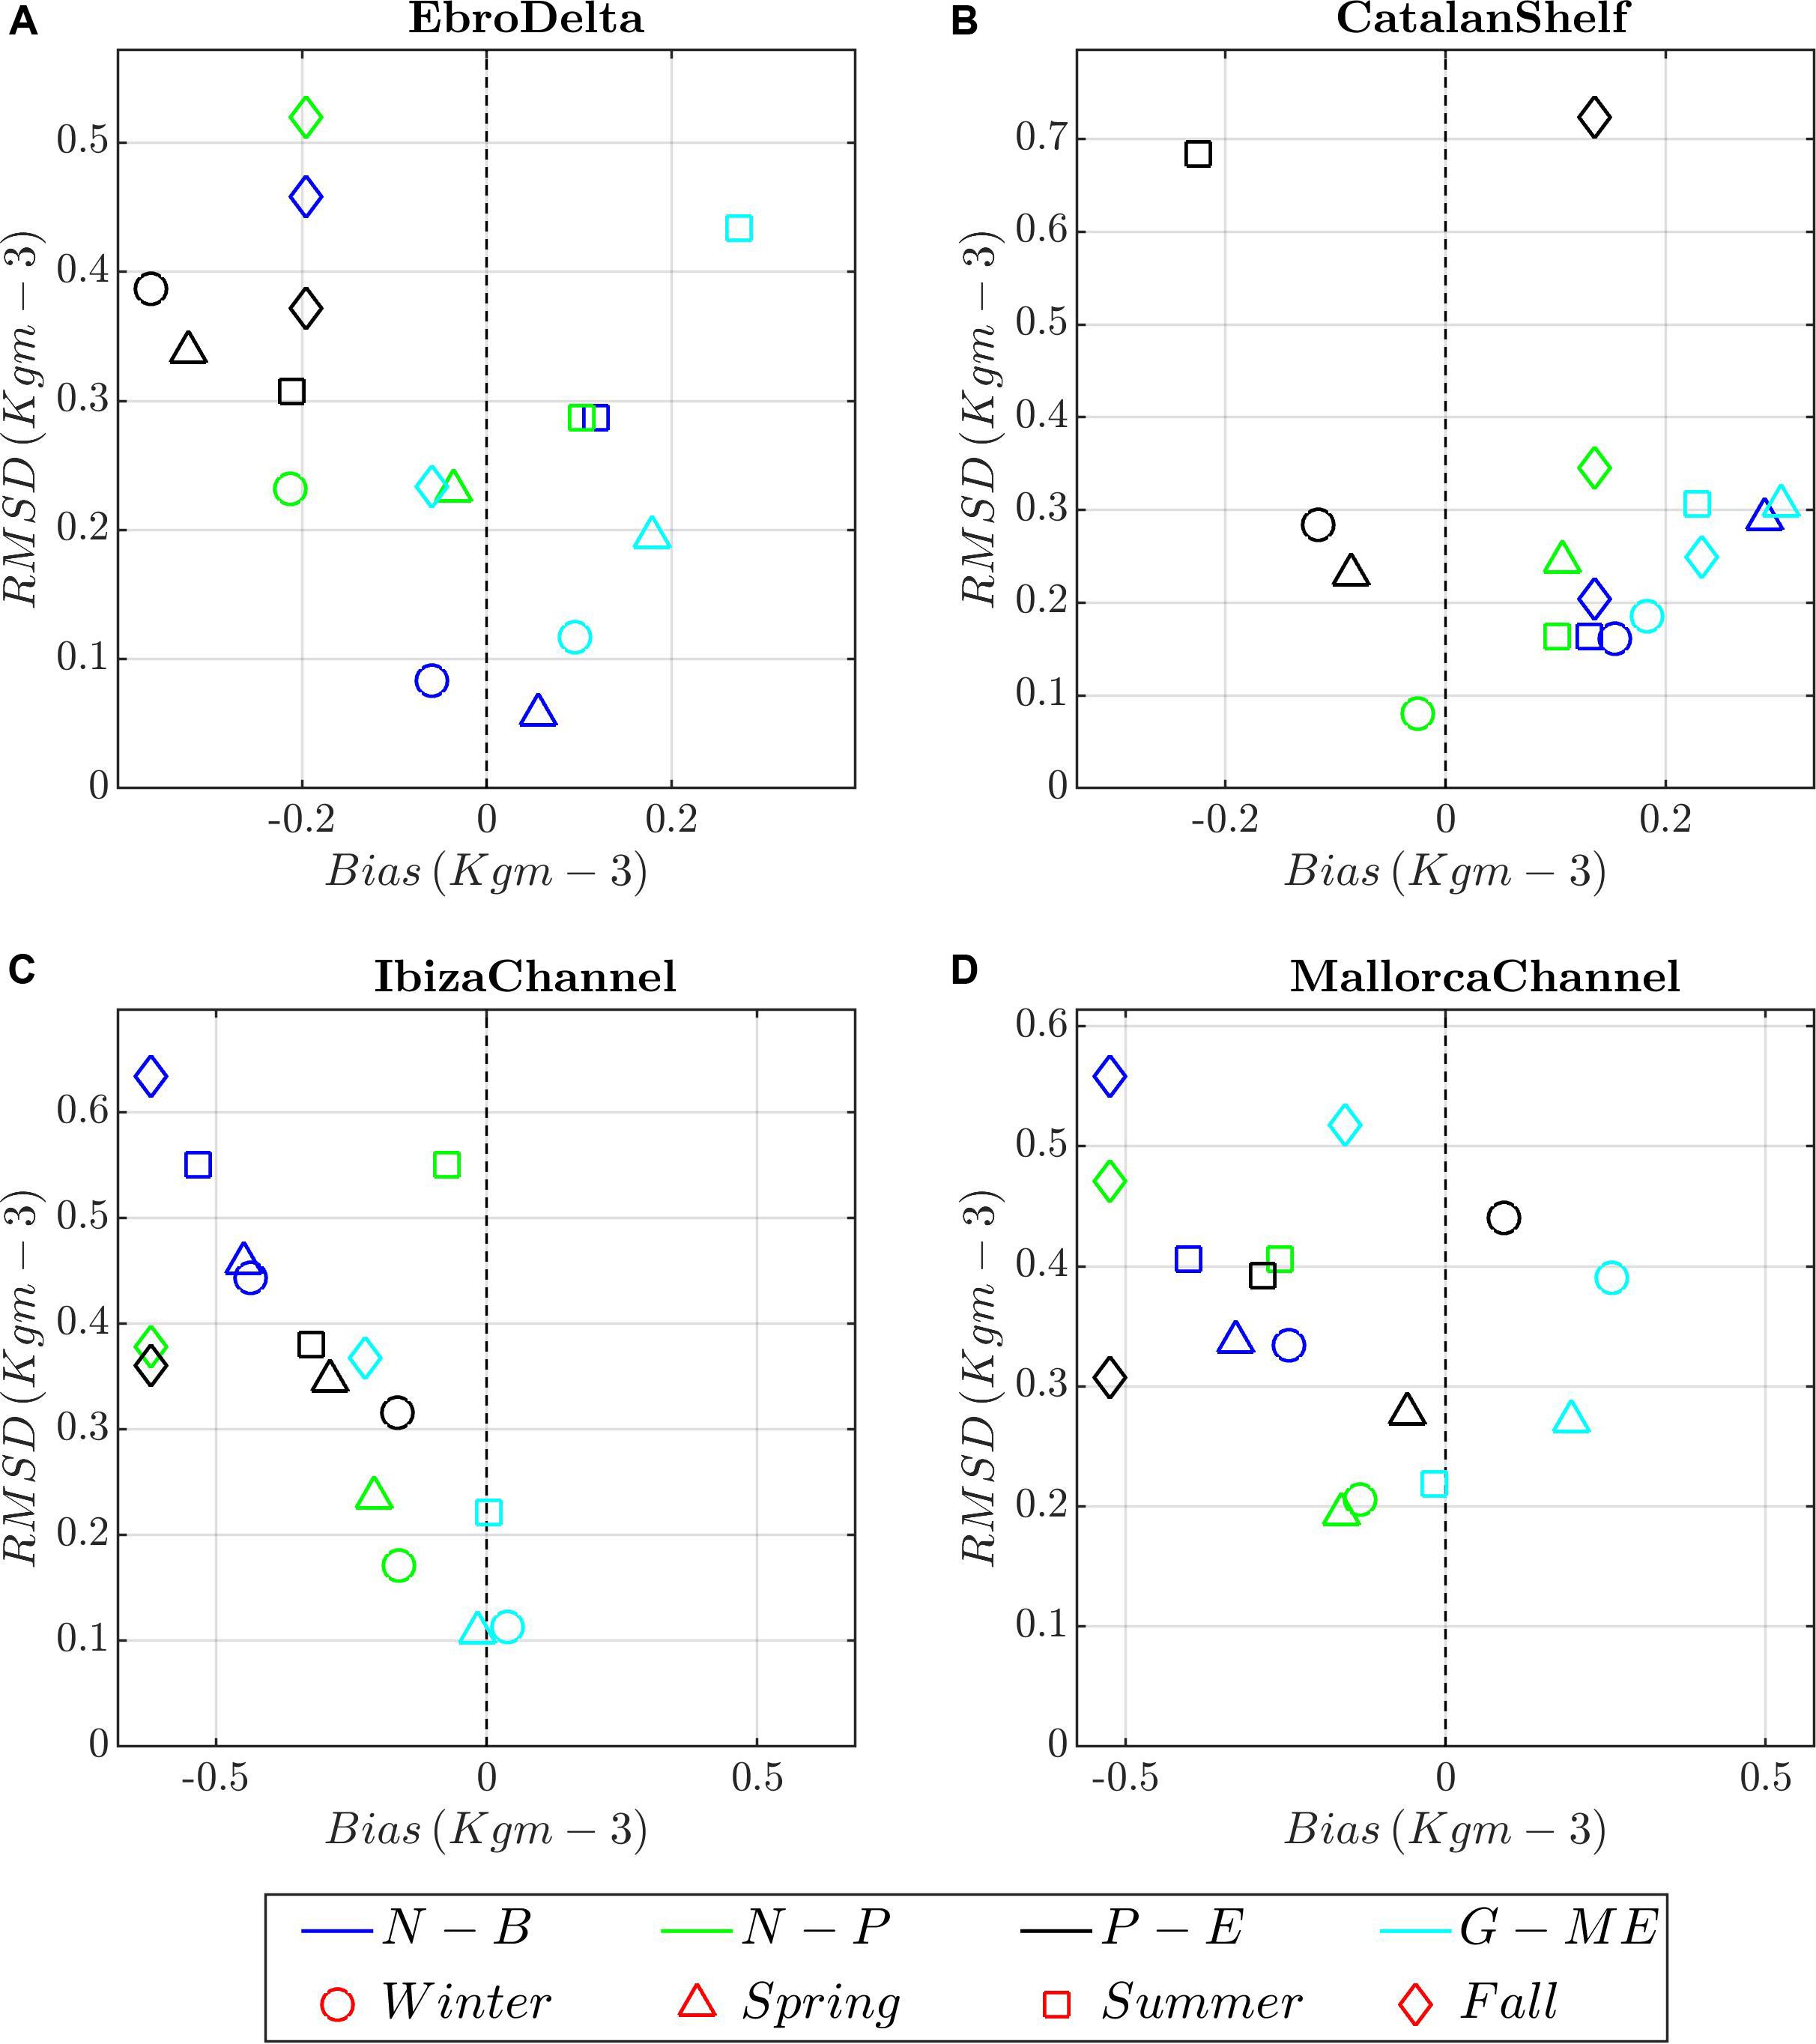
Figure 9. Target diagrams between model runs (color shading) and climatological profiles of water density for the different seasons (symbols) and areas. (A) Ebro Delta; (B) Catalan Shelf, (C) Ibiza Channel, and (D) Mallorca Channel. Model runs: blue, N-B (NEMO-BFM); green, N-P (NEMO-PISCES), dark gray; P-E (POLCOMS-ERSEM), and light blue, G-E (GETM-MedERGOM).
In the CS region (Supplementary Figures 7a–h), the observations and simulations show a more homogeneous winter profile due to intense mixing processes and a weaker re-stratification during summer and fall, in good agreement with the MLD and stratification maps shown in Figure 4. All runs present an overall slight positive bias, excepting POLCOMS-ERSEM presenting lighter values along the whole profile from winter to summer (Figure 9B). In situ density profiles from ED (Figure 9A and Supplementary Figures 7i–p) present slightly higher variability particularly referring to the lower-density values registered in the surface layer due to the riverine influence. In the ED, all models capture the seasonal cycle but overall showing an excessive riverine influence during winter and spring, attending to the lighter surface waters and thus slight negative bias, excepting for GETM-MedERGOM (Figure 9A). Observed nitrate and phosphate profiles show a similar structure along the year in IC/MC, characterized by a nutrient-depleted surface layer. Below this layer, a nutricline is present where the concentrations rise gradually, reaching ca. 4 μM at 120 m for nitrates and 0.2 μM for phosphates (Supplementary Figures 8, 9). On the other hand, CS presents a relatively homogeneous nutrient profile during winter, from the surface to 120 m, ranging ca. 2 to 5 μM for nitrates, respectively, and around 0.15 μM for phosphates (Supplementary Figures 10a–h, 11a–h). Two different noticeable deviations between models and observations emerge from the target diagrams in the Balearic Channels and CS: (i) NEMO-PISCES present higher values (slight positive bias) during winter/spring on the way of the Northern Current, with higher deviation from the CS southward (Figures 2i, 5e, 10B–D). (ii) GETM-MedERGOM present values above the observed profile, with a positive bias and RMSD values of 2–4 and 3–4 μM for nitrate and 0.2–0.4 and 0.3–0.5 μM phosphate in the Balearic Channels and CS (Figures 5i,m, 10B–D, 11B–D). Furthermore, POLCOMS-ERSEM also presents a positive bias particularly for phosphate levels (ca. 0.2 μM) with a RMSD around 0.2–0.3 μM along the year and within Balearic Channels and CS (Figures 11B–D).
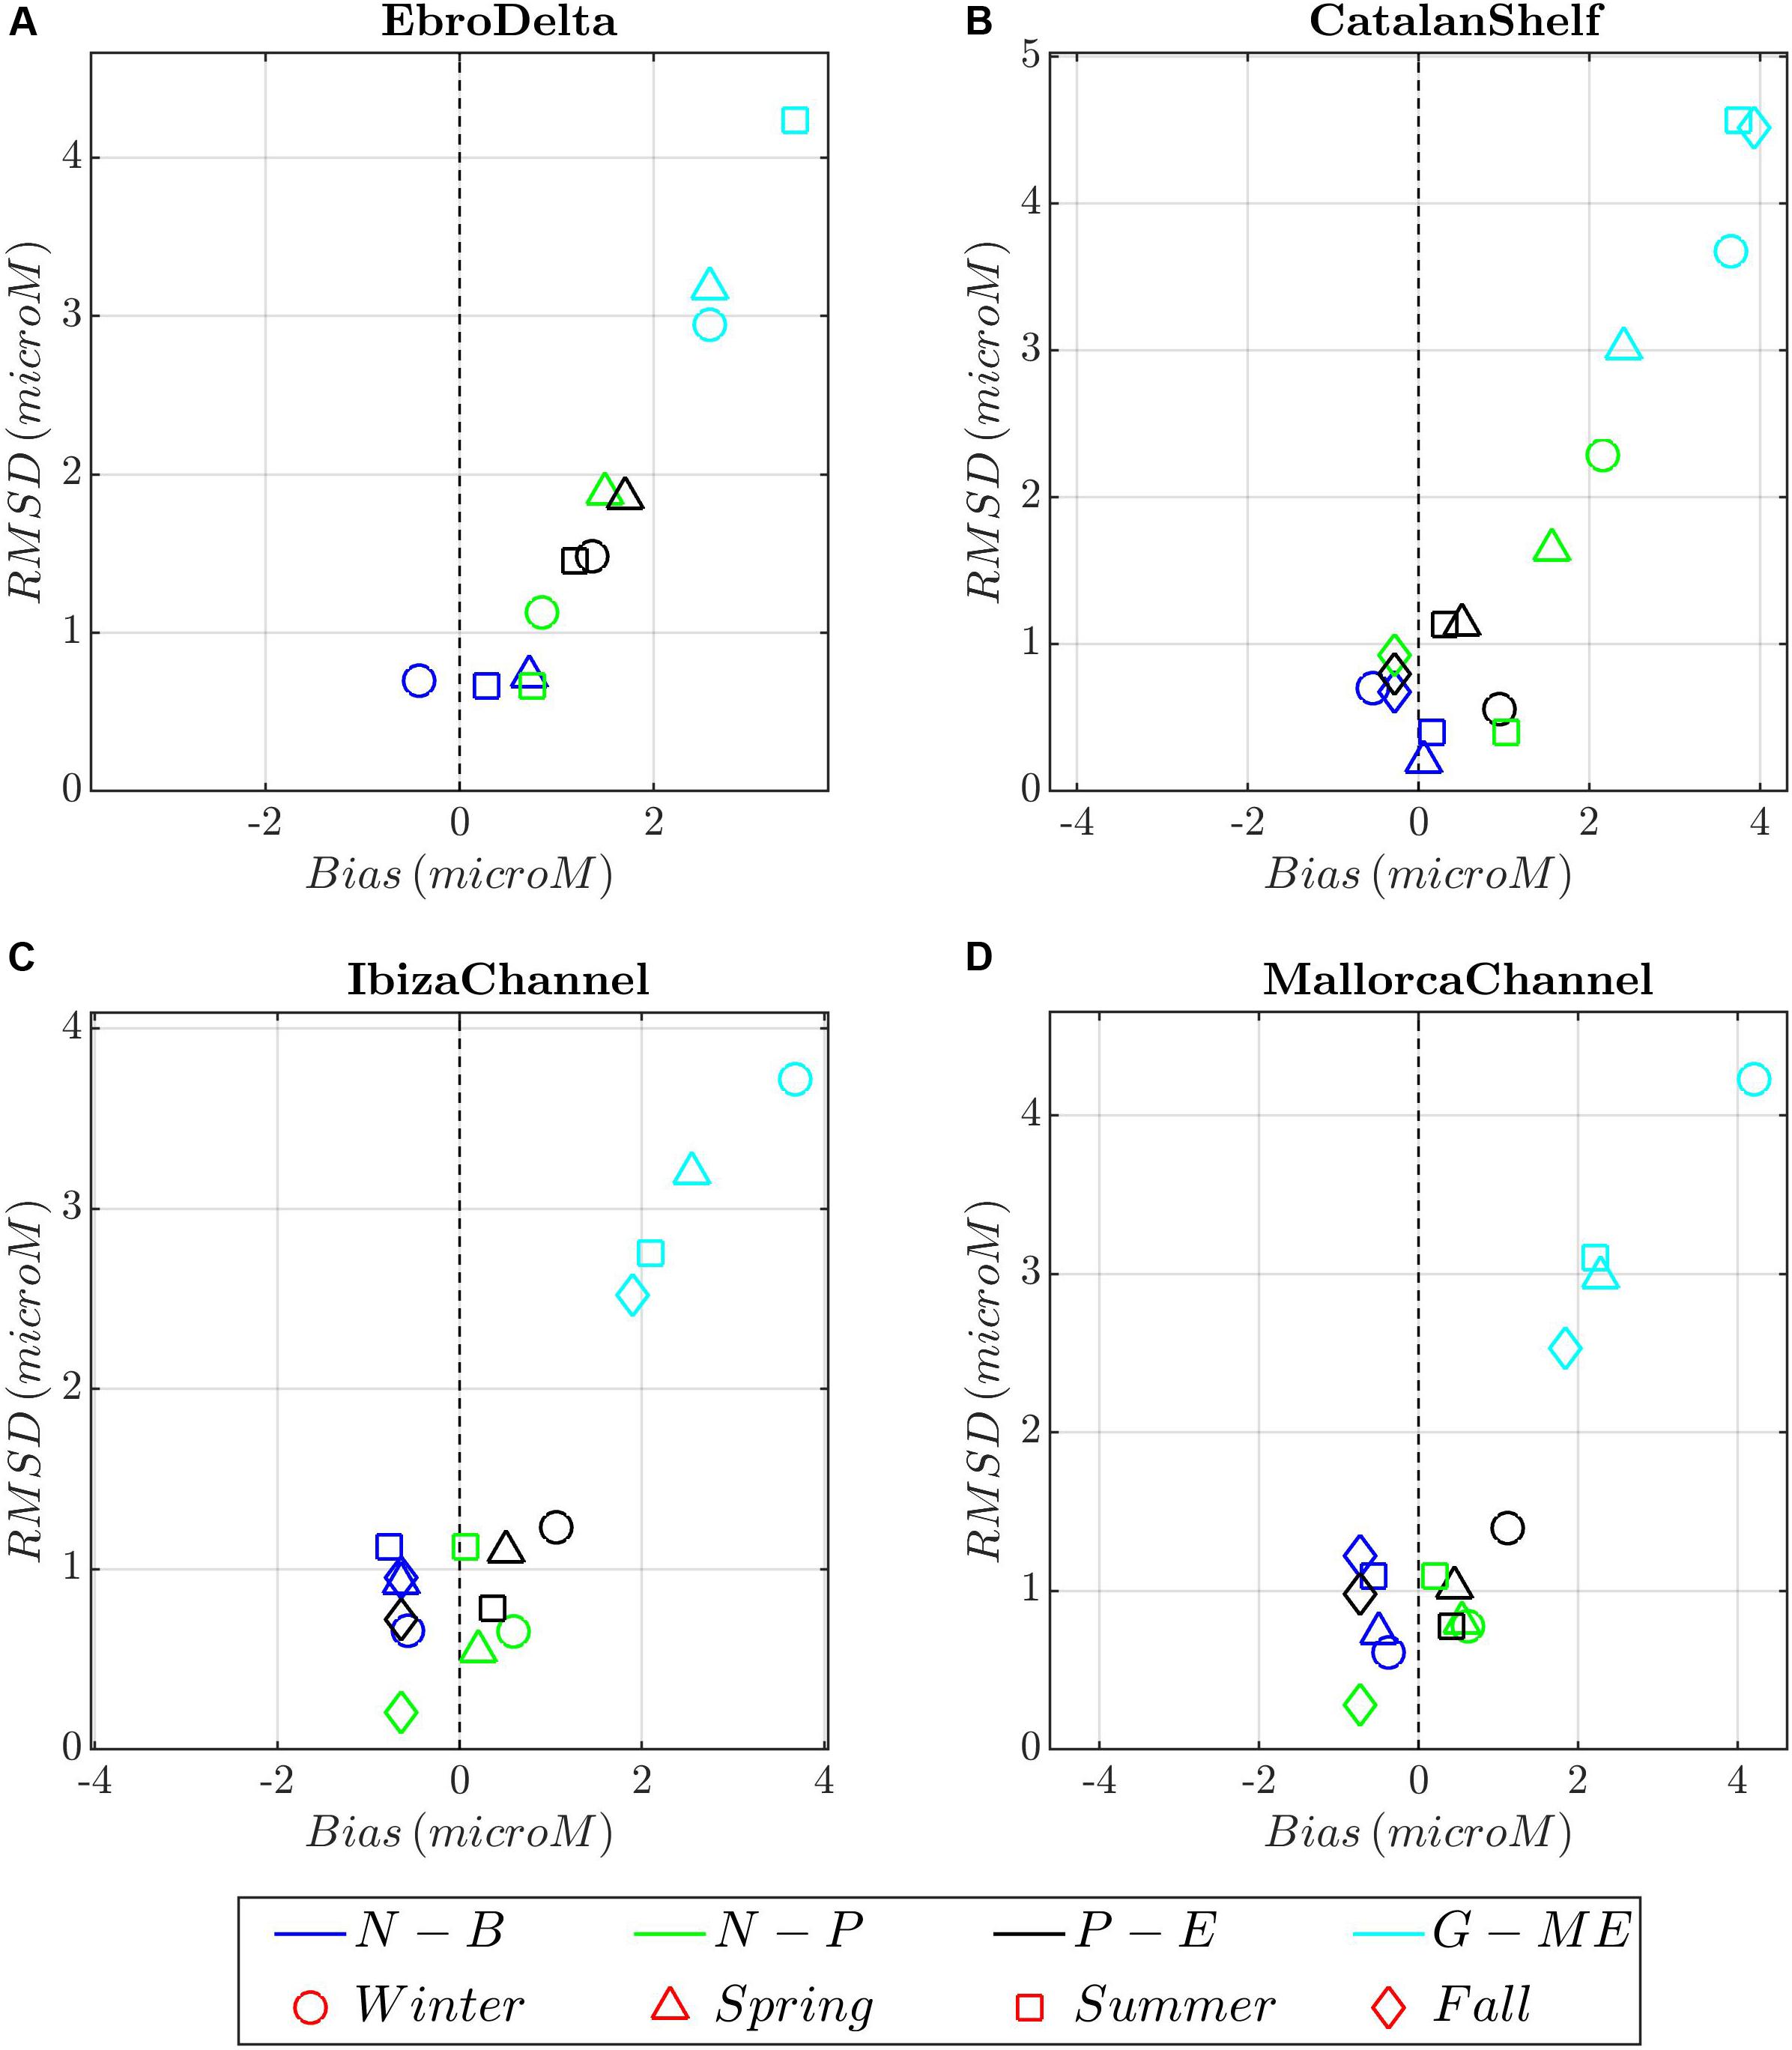
Figure 10. Target diagrams between model runs (color shading) and nitrate climatological profiles for the different seasons (symbols) and areas. (A) Ebro Delta; (B) Catalan Shelf, (C) Ibiza Channel, and (D) Mallorca Channel. Model runs: blue, N-B (NEMO-BFM); green, N-P (NEMO-PISCES), dark gray; P-E (POLCOMS-ERSEM), and light blue, G-E (GETM-MedERGOM).
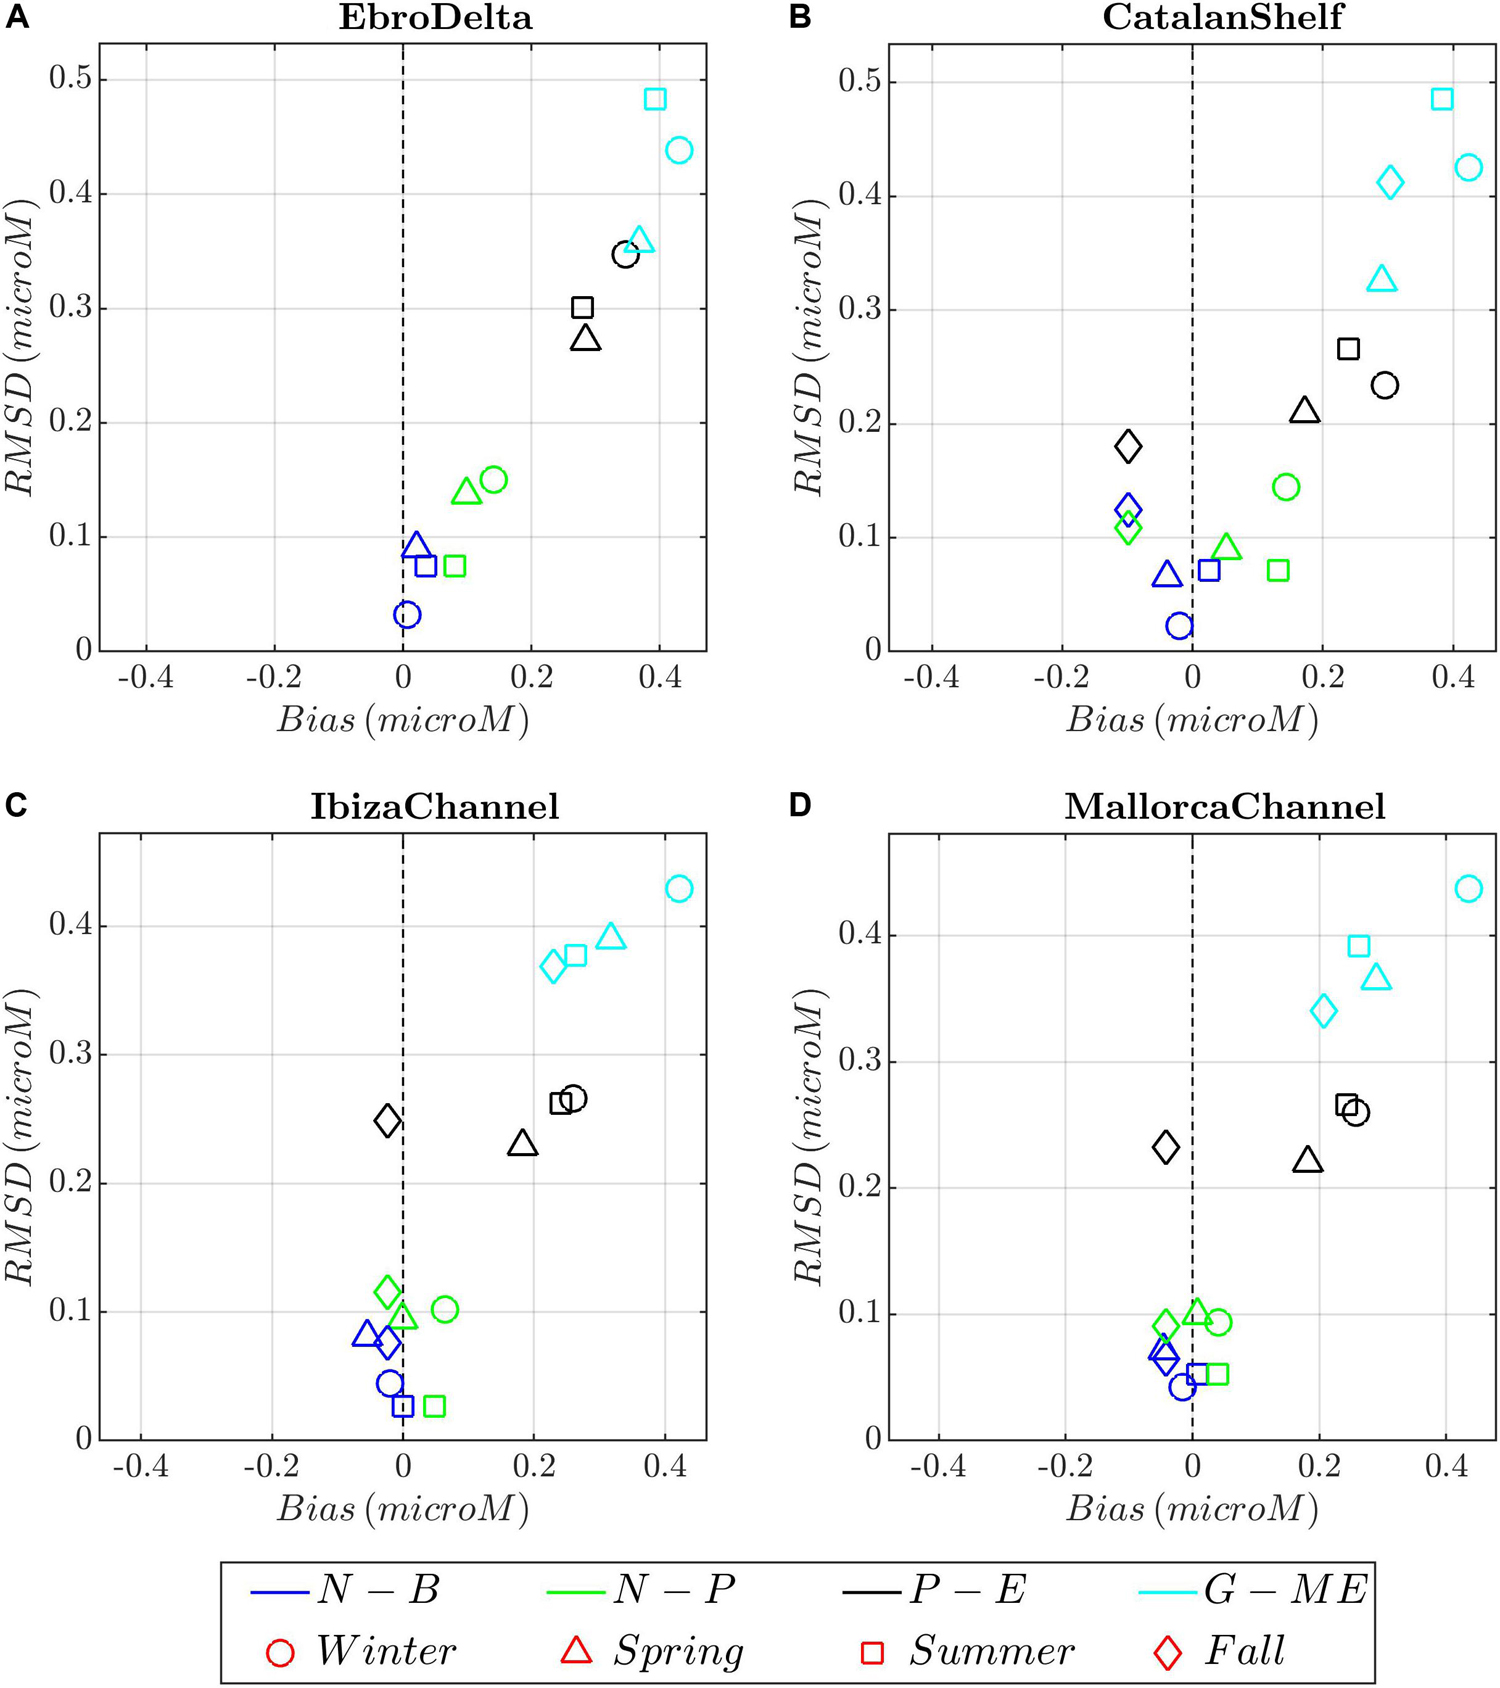
Figure 11. Target diagrams between model runs (color shading) and phosphate climatological profiles for the different seasons (symbols) and areas. (A) Ebro Delta; (B) Catalan Shelf, (C) Ibiza Channel; and (D) Mallorca Channel. Model runs: blue, N-B (NEMO-BFM); green, N-P (NEMO-PISCES), dark gray; P-E (POLCOMS-ERSEM), and light blue, G-E (GETM-MedERGOM).
Within the ED, observed surface nutrients oscillate from 0 to 4 μM for nitrate and 0 to 0.2 μM for phosphate (Supplementary Figures 10i–p 11i–p). Due to the relative scarcity of nutrient data and the high surface variability registered in the ED, the evaluation of the models in this region has to be taken with care. NEMO-BFM, NEMO-PISCES, and POLCOMS-ERSEM roughly mimicked surface nitrate range during winter, with ca. 2–4 μM for all the simulations and slight positive bias and RMSD (ca. 0–2 μM for both metrics) (Figure 10A and Supplementary Figures 10a,e,i,m). GETM-MedERGOM presents also positive bias and RMSD values ca. 2–4 and 3–4 μM for nitrate (Figure 10A). For phosphate levels, POLCOMS-ERSEM and GETM-MedERGOM also present the same positive bias and RMSD ca. 0.3 μM (both metrics) and ca. 0.4 μM (both metrics), for each run respectively (Figure 11A).
Observed chlorophyll-a profiles also follow a clear seasonal cycle in the Balearic channels (IC/MC, Figure 8b and Supplementary Figures 5b, 12), starting with a late-winter bloom tightly coupled to winter mixing and extending along a wide portion of the water column (0.6–0.8 mg m–3 within the first 100 m). Subsequently, in spring a DCM develops, ca. 0.8 mg m–3, between 40 and 60 m (Figure 8b and Supplementary Figures 5b, 12). This structure progressively deepens and becomes more marked during summer (in the range 1–1.5 mg m–3) (Figure 8b and Supplementary Figures 5b, 12c,k). The DCM is then located at the same depths during summer and fall, from 60 to 90 m, until the mixing events occurring in winter erode it. The observations in CS during winter record a homogeneous and thick layer with high chlorophyll-a concentrations (0.75 mg m–3 from 0 to 50 m), followed by the presence of a marked DCM during summer (0.5 mg m–3 at 60 m) (Supplementary Figures 13a–c). All models capture these patterns, but they present markedly different values. Regarding winter and spring bloom, NEMO-BFM captures the patterns but presents lower chlorophyll-a values in the Balearic Channels and CS (Figures 12B–D). NEMO-PISCES exhibits a shallower and marked bloom during winter and spring in all areas affected by the Northern Current (positive bias), from CS to IC (Figures 8f, 12C,D and Supplementary Figures 12a, 13a). POLCOMS-ERSEM shows the same features, but winter minima are present along the whole water column just before the late winter–spring bloom (negative bias), even in IC (Figures 8h, 12C). The runs without assimilation presented a well-mixed winter profile and then an intense spring bloom (0.8 mg m–3); however, observations during spring present a DCM in all areas (Figures 12C,D and Supplementary Figures 12e,f,m,o, 13e,f).
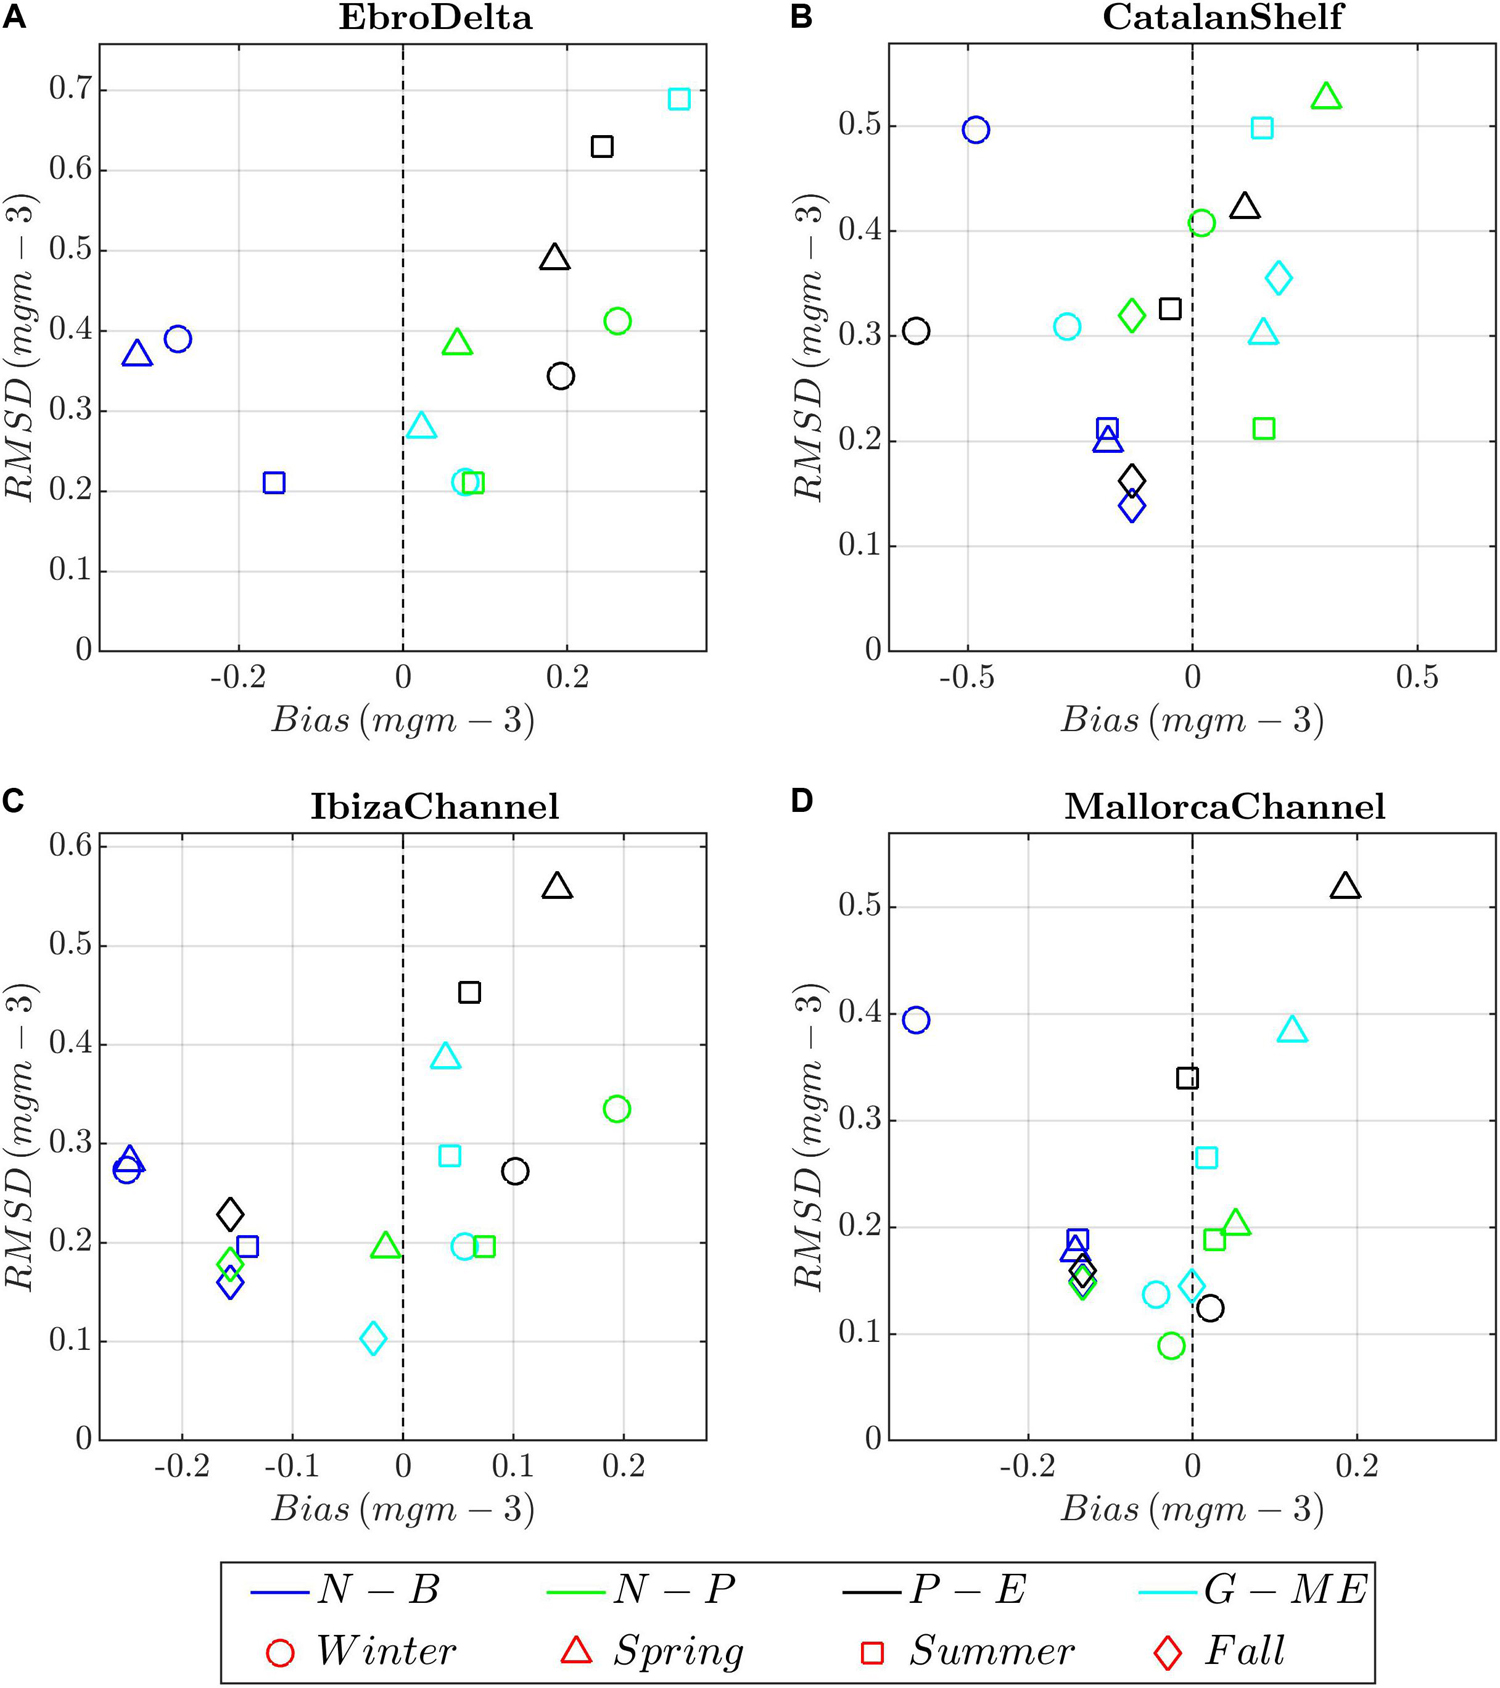
Figure 12. Target diagrams between model runs (color shading) and chlorophyll-a climatological profiles for the different seasons (symbols) and areas. (A) Ebro Delta; (B) Catalan Shelf, (C) Ibiza Channel, and (D) Mallorca Channel. Model runs: blue, N-B (NEMO-BFM); green, N-P (NEMO-PISCES), dark gray; P-E (POLCOMS-ERSEM), and light blue, G-E (GETM-MedERGOM).
During the stratification period, observations show a permanent DCM of approx. 0.5 mg m–3 at ca. 60 m in all areas during summer (Supplementary Figures 12c,g,k,o, 13c,g,k,o). The NEMO-BFM reproduces the DCM but underestimates the chlorophyll-a concentrations (ca. 0.2–0.4 mg m–3), presenting an overall marked negative bias in all areas and throughout the year (Figure 12). The NEMO-PISCES present a good performance with only a slight positive bias in all areas (Figure 12 and Supplementary Figures 12c,k, 13c). The runs without assimilation place a shallower than observed DCM (25–40 m) during summer with marked higher values (ca. 1 mg m–3) and hence positive bias and high RMSD, particularly in the northern areas, ED and CS (Figures 12A,B and Supplementary Figures 13g,o).
Depth-integrated chlorophyll-a (0–100 m) is a relevant variable as a proxy of the total phytoplankton biomass in the photic layer (i.e., including the subsurface biomass and production within the DCM). Unfortunately, the spatiotemporal distribution of observational data is not fine enough to compute interannual series or maps of integrated chlorophyll-a. In consequence, we can only compare simulations among them. Figure 13 shows the normalized anomalies (z-scores) of yearly averaged integrated chlorophyll-a of each region to show the interannual variability of the runs. Besides the different range of chlorophyll-a values already discussed (e.g., Figures 7, 12 and Supplementary Figures 12, 13), the runs present contrasting interannual variability presenting an overall disagreement between time series (Figure 13). The highest correlations are found between NEMO-PISCES vs. NEMO-BFM in IC and ED, being 0.43 and 0.66, respectively. However, correlations are overall very low (ca. < 0.3) and even negative, e.g., POLCOMS-ERSEM vs. NEMO-PISCES yielded r values of -0.55 and -0.66 in IC and ED, respectively.
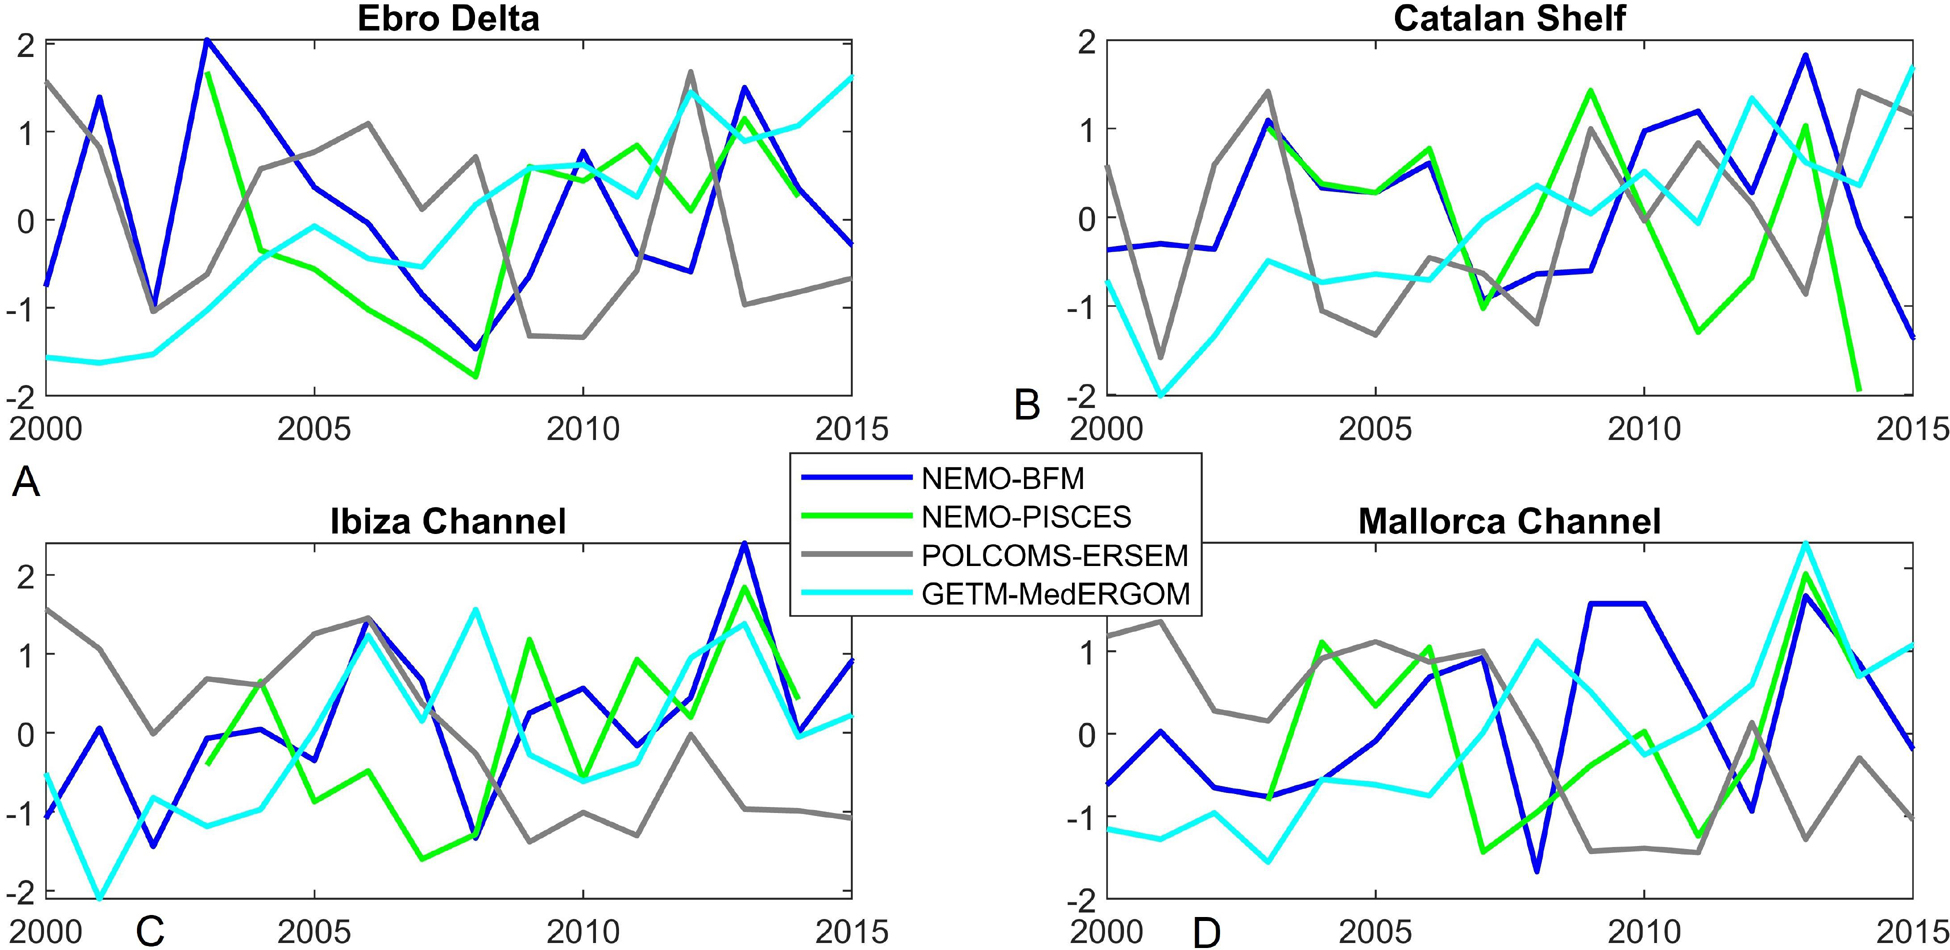
Figure 13. Normalized anomalies (z-scores) for integrated chlorophyll-a (0–100 m) time series for the different chosen areas. Each series of annual averages were normalized using the whole period average and standard deviation. (A) Ebro Delta; (B) Catalan Shelf, (C) Ibiza Channel, and (D) Mallorca Channel.
Discussion
This section is focused on the processes/features that we consider crucial for explaining the special features of the western Mediterranean sub-basin in terms of primary production and biogeochemical cycles. Within this area, different ecoregions and trophic regimes have previously been described, which has opened the need to assess biogeochemical model skill in terms of different mechanisms driving primary production (Siokou-Frangou et al., 2010; Lavigne et al., 2013; Mayot et al., 2017). We also discuss the relevance of these processes and potential applications for other users and disciplines such as fishery science.
Hydrodynamic Skill and Derived Impacts
All the tested models capture the main hydrodynamic patterns and their seasonal evolution reasonably well, reproducing the key features such as Northern and Balearic currents, as observed through altimetry (Figure 2) and reported in the literature. However, altimetry underestimates the actual currents, in terms of both mean currents and mesoscale activity (Escudier et al., 2013). On the other hand, some works have pointed out the importance of fronts and mesoscale structures in the NW Mediterranean (Salat, 1995; Pinot et al., 2002). Fronts and mesoscale structure involve vertical water movements and mixing, fertilizing, and maintaining high primary production levels in this area (Estrada et al., 2014; Oguz et al., 2015). In spite of the differences in the spatial resolution, all models are eddy-permitting (i.e., not able to fully resolve the whole mesoscale spectrum); thus, it can be expected that these processes could be underestimated in the present state-of-the-art coupled systems. However, in spite of a potential underestimation, these processes have been highlighted as major primary production drivers in NW Mediterranean using coupled models such as GETM-MedERGOM (Macias et al., 2018b).
Moreover, proper capture of sea surface current velocities, hydrographic variables, and their gradients are crucial for the parameterization of the pelagic seascape. These features drive key ecological processes such as the spawning of small pelagic fish (Sabatés et al., 2013) and top predators, such as bluefin tuna, in this area (e.g., Alvarez-Berastegui et al., 2016, 2014). Currents are also essential in determining ecological and evolutionary connectivity due to their effect on advection of planktonic stages (Sabatés et al., 2007; Ospina-Alvarez et al., 2013, 2015; Riesgo et al., 2016). Here, probably NEMO-BFM, NEMO-PISCES, and GETM-MedERGOM will yield better results than POLCOMS-ERSEM, because they simulate higher current speeds more in line with altimetry estimates (Figure 2), despite the aforementioned underestimation of currents through altimetry. On the other hand, biases in the circulation can have important negative effects. For instance, the permanent cyclonic gyre connecting the Northern and Balearic Current in the NEMO-BFM run produces an improper performance of this run and adversely affects the Ibiza Channel density patterns (Figure 9C). Thus, the skills of different models with regard to the main circulation patterns should be thoroughly reviewed before using any model output in this hydrodynamically complex area.
The SST seasonal patterns are correctly captured by all the coupled models, including the non-assimilative runs (Figure 3 and Supplementary Figures 1, 2). Moreover, vertical profiles of density are relatively coherent with observations (Figure 9 and Supplementary Figures 5–7). An accurate representation of both temperature and surface currents is crucial not only for the correct implementation of the coupled model but also for end users aiming to predict biological responses of higher trophic levels, including human food sources. Temperature data are routinely used in the area to infer key vital rates (e.g., reproduction, growth, mortality) and distribution of many organisms (Sabatés et al., 2009; Lejeusne et al., 2010; Peck et al., 2013; Givan et al., 2018). Average seasonal patterns can be key to selecting model traits for modeling particular biological responses, and for this our results have practical implications. We have shown that most models have biases in temperature with respect to observations (Figure 3 and Supplementary Figure 3). Therefore, identified seasonal biases could be used to correct hindcast or forecast products (e.g., Gudmundsson et al., 2012) to be used in a prognostic fashion in several fields of biological oceanography and fisheries.
Riverine Influence
Nutrient loads from rivers have been pointed out to be a significant driver of the biogeochemical processes of the Mediterranean, particularly on shelf areas (Estrada, 1996; Siokou-Frangou et al., 2010). Nevertheless, riverine inputs seem to have a secondary role in primary productivity within the northwestern basin, compared to mesoscale and frontal processes (Macias et al., 2018b). However, during the stratified period, the contribution of the Ebro riverine runoff to the total primary productivity is moderate (ca. 10–20%, Salat et al., 2002), maintaining surface planktonic production in areas under the influence of the river discharges (Saiz et al., 2014). These highly productive areas have been reported to be important spawning grounds of anchovy, Engraulis encrasicolus, in the NW Mediterranean (Palomera et al., 2007).
The surface nutrient levels in NEMO-PISCES within the influence area of Rhone River are clearly out of range (Figures 5e,h, 6E,H, 10, 11 and Supplementary Figures 8a, 9a, 10a, 11a), which is probably due to the fixed ratio that transforms the input of Dissolved Organic Carbon/Dissolved Inorganic Carbon into macronutrients such as nitrate/phosphate (see Supplementary Table 1b), extracted from global estimates (Ludwig and Probst, 1996; Aumont and Bopp, 2006). In the NEMO-PISCES run, the nutrient input through the Ebro and particularly the Rhone River masks the local dynamics and the mixing-bloom mechanisms, affecting areas from the Gulf of Lions to Ibiza Channel (Figures 5e–h, 10). The GETM-MedERGOM simulation slightly overestimates the Ebro River influence but presents a Rhone River tongue with excessive chlorophyll-a and nutrient levels extending from Catalan Shelf southward along the shelf (Figures 5m–p, 6M–P). The POLCOMS-ERSEM run tends to overestimate the inputs from the Ebro River, which is reflected in both nutrient input and chlorophyll-a (Figures 5i–l, 7m–p).
A different case is the NEMO-BFM run, in which the main discrepancy with respect to observed data is in the higher surface nitrate levels, particularly marked during summer, as observed in Ebro Delta and Catalan Shelf (Figure 5c and Supplementary Figures 10b,c,j,k). A further impact of the riverine input might come from the small rivers during spring, summer, and autumn (Figure 5c and Supplementary Figure 10c); their monthly input is defined as constant without a seasonal signal in NEMO-BFM. However, the chlorophyll-a concentrations are slightly underestimated (Figure 12), probably due to the effect of the applied data assimilation scheme, as have been reported and improved recently by Teruzzi et al. (2018).
A proper description of the effect of rivers on shelf waters is crucial for assessing the spawning habitat of small pelagic fishes in this area. These rich production areas have been reported to be important spawning grounds of anchovy, providing favorable habitat conditions for the development of their larvae (Palomera et al., 2007). In recent years, an increasing abundance and northward expansion of round sardinella, Sardinella aurita, has been documented in the Western Mediterranean coasts associated with sea water warming (Sabatés et al., 2009). Spawning of this species takes place in summer coinciding with that of anchovy, with different niches as a function of salinity, temperature, and chlorophyll-a (Maynou et al., 2014, 2020). Therefore, model outputs and projections could provide information about future conditions and potential changes in the spawning niches of these species.
Winter Mixing and Phytoplankton Bloom
Within this sub-basin, different ecoregions have been described regarding the intensity and timing of the phytoplankton bloom derived from mixing/stratification of surface layers. In the Balearic Channels, within the “no Bloom-Algerian Basin” (Lazzari et al., 2012; Lavigne et al., 2013), stratification dominates throughout the year and a low-intensity bloom is described to be tightly coupled to the weakening of the stratification during late winter (Figures 8a,b and Supplementary Figures 5a,b, 6a,b, 12a,b). On the other hand, the Catalan Shelf shows a markedly different seasonal pattern than the channels, including intense winter mixing and marked bloom in the “Intermittent North-West” and “Bloom North-West” areas (Lavigne et al., 2013; Segura-Noguera et al., 2016; Supplementary Figures 7a,b, 13a,b).
All models were able to simulate in general terms both phenomena and the differing seasonal pattern (e.g., Figures 4a–l, and Supplementary Figures 6, 7). However, in some aspects all of them showed limitations. In the NEMO-PISCES simulation, the higher absolute values of nutrients and chlorophyll-a are linked to riverine inputs advected by the Northern Current, reaching as far south as the Ibiza Channel (see the previous section) (Figures 5e–h). The NEMO-BFM produced chlorophyll-a values lower than observed in situ, maybe because of the lower nutrient representation in deep layers, which cannot be counteracted by the data assimilation (Figures 8, 12 and Supplementary Figures 10–13). In the POLCOMS-ERSEM and GETM-MedERGOM runs, the overestimation of the winter mixing can lead to an intense light limitation even in the Balearic channels, contrary to observations (Figures 8h,j and Supplementary Figures 5h,j). However, the timing of the bloom during late winter and the onset of stratification are correctly simulated in the channels by both models (Figures 8h,j and Supplementary Figures 5h,j). In the northern areas (Catalan Shelf and Gulf of Lions), the intense simulated mixing induced higher nutrient levels and a delayed and strengthened bloom, with an overestimation of nutrient and chlorophyll-a levels in POLCOMS-ERSEM and GETM-MedERGOM (Pasqueron De Fommervault et al., 2015; Figures 5i,m, 6I,M, 10, 11). Satellite observations show a spring bloom in the Gulf of Lions, but in the Catalan Shelf the main bloom is described at the end of winter, not in spring, when a DCM is already observed, a classical feature linked with the re-stratification of the water column (Figure 7b and Supplementary Figures 13b).
The winter–spring bloom is the main contributor to the overall phytoplankton biomass and primary production in the northwestern basin (Bosc et al., 2004; Estrada et al., 2014) and fuels energy to micro and mesozooplankton that support key ecosystem components, from pelagic fish (e.g., Martin et al., 2016) to marine birds (Ramírez et al., 2016). Fluctuations in the intensity of vertical mixing result in interannual variations in the extent of the winter–spring phytoplankton bloom and zooplanktonic biomass (Vandromme et al., 2011; Severin et al., 2014) and have been related with the recruitment success of pelagic species that reproduce in winter, such as blue whiting, Micromesistius poutassou, and sardine, Sardina pilchardus (Lloret et al., 2004; Martin et al., 2016). Section “Interannual Variability” discusses the range of interannual variability represented by the models.
Stratified Period and Deep Chlorophyll Maximum (DCM)
Regarding the density profiles, all models show a reasonably high level of agreement with each other and with observations (Figure 9 and Supplementary Figures 6, 7). Despite the clear latitudinal gradient of stratification captured by all the models, the magnitude of the DCM and depth-integrated chlorophyll-a is relatively similar among zones during the stratified period, for all models and observations, excepting that NEMO-BFM shows specially low values (Figures 8b,d,f,h,j, 12 and Supplementary Figures 5b,d,f,h,j). A more careful look shows that the vertical stratification and DCM features differ between models. The depth of the DCM in summer, around 60–70 m, is correctly captured by NEMO-BFM and NEMO-PISCES, presenting lower chlorophyll-a values in the former run (Figures 8b,d,f,h,j, 12 and Supplementary Figures 5b,d,f,h,j). POLCOMS-ERSEM and GETM-MedERGOM show shallower DCMs although values in the latter are closer to the observations (Figures 8b,d,f,h,j, 12 and Supplementary Figures 5, 12e–h,m–p, 13e–h,m–p). This can be explained because of the slightly lower stratification, which increases eddy diffusivity (Osborn, 1980), leading to shallower nutrient supply into more illuminated layers. Furthermore, both models present higher deep nutrient levels, another factor related to the shoaling and the magnitude of the DCM (Beckmann and Hense, 2007). MedERGOM does not include photoacclimation or flexible chlorophyll-a to N biomass ratio but correctly captures chlorophyll-a levels (Figure 12 and Supplementary Figures 12, 13). Therefore, the simulated DCM in the GETM-MedERGOM run matches and represents a biomass maximum, which is shallower than the chlorophyll-a or pigments maximum (e.g., Cullen, 2015). DCM features, e.g., depth, thickness, and maximum, depend on a complex array of physical, chemical, and biological processes (for a thorough description, see Cullen, 2014). Simulations in a 1D frame can disentangle the driving processes and their specific role in shaping the DCM (Hodges, 2004; Beckmann and Hense, 2007).
Correct representation of the biological production within the DCM is key for models of Mediterranean Sea ecosystems, where the nutrient depletion and surface oligotrophy do not reflect overall productivity, and subsurface production can form from 30 to 60% of the total production of the water column during the stratified season (Estrada et al., 1984; Macias et al., 2014). In such an oligotrophic environment, the presence of the DCM could be considered as an “oasis” to sustain secondary production and has implications for the functioning and structuring of the pelagic food web. During the stratified period, the vertical distribution of epipelagic zooplankton is characterized by the presence of a zooplankton maximum at the DCM depth during the daytime (Alcaraz, 1985; Nowaczyk et al., 2011; Saiz et al., 2014). In turn, larvae of some fish species, as well as planktivorous fish, such as anchovy, have been reported to feed at the deep zooplankton maximum, benefiting from food aggregations at this level (Tudela and Palomera, 1997; Olivar et al., 2001; Sabatés et al., 2007). Modeling exercises using coupled models to analyze upper trophic levels dynamics should carefully select the best-suited model, attending to how accurately it reproduces the observed DCM at the location of interest. Further, interannual comparisons with observed data will be necessary for validating some assumptions; this will require, both for the winter/spring bloom and the DCM dynamics, more extensive observational datasets in each of the ecoregions.
Interannual Variability
One useful application from biogeochemical modeling is filling the gaps in time series observations aiming to assess interannual variability. This application includes classical climate indexes as drivers and their effect on e.g., pelagic food webs and fisheries (Fernández de Puelles and Molinero, 2007; Molinero et al., 2008; Hidalgo et al., 2011). Our results show that the model runs included here present an overall disagreement between time series (Figure 13). As proper data to assess the best-performing model are not available, we can conclude that state-of-the-art coupled models in the Mediterranean are not mature enough to produce robust estimates of interannual variations of phytoplankton biomass. This statement could be applied to both our chosen areas and the whole North-Western Mediterranean sub-basin (data not shown). The caveat of using chlorophyll-a as a proxy of biomass, due to the flexible carbon:chlorophyll-a ratio, should also be taken into consideration.
The evaluation of several state-of-the-art coupled models and their comparison with multisource observational data makes it possible to asses (i) which features of the regional circulation and biogeochemistry are properly modeled and (ii) which are more sensitive to the choice of model. Furthermore, this approach provides insights about the suitability of model outputs and the potential use of biogeochemical variables within other more applied fields such as fisheries oceanography. In general, our graphical outputs can guide end users to evaluate the pros and cons of each model to be used for specific scientific questions.
In general, all models can capture the main surface hydrodynamic features such as the Northern and Balearic Currents and their seasonal patterns. The hydrographic seasonal cycle is also simulated for all the coupled systems, including the latitudinal decrease in temperature and stratification. Planktonic seasonal cycles derived from the different intensity of winter mixing-stratification succession among areas are also correctly captured in terms of timing. Models with non-realistic winter mixing show problems with the timing and magnitude of winter–spring bloom of phytoplankton (e.g., POLCOMS-ERSEM). We showed where better input data could improve the performance of the runs. For example, nutrient loads for the Rhone River should be carefully included particularly for the NEMO-PISCES run, which displays nutrient levels out of range that can mask the mechanism and dynamics of primary production in the studied areas. A DCM is found in observations and models during the stratified period in different zones of the open ocean. Models are able to reproduce the seasonality of the DCM, but discrepancies arise in terms of its depth and intensity. Finally, contrasting interannual variability among models show that phytoplankton biomass estimates are not robust and should dissuade end users from using them to fill gaps in time-series observations without proper assessment. Long observational time series spread across regions with different forcing dynamics should be promoted, so that numerical models can expand their reach to solve some more applied problems.
Data Availability Statement
Publicly available datasets were analyzed in this study. This data can be found here: http://marine.copernicus.eu/services-portfolio/access-to-products/, http://www.ba.ieo.es/ibamar, http://thredds.socib.es/thredds/catalog.html.
Author Contributions
ER-R, GJ, IC, and AA led the data analysis and the statistical analysis of the results. SK, DM, and MS-N provided simulations and observational data essential for this study. IC, AS, FM, and GJ conceived the original idea and acquired the funding. All the authors contributed extensively during the writing and revision of the manuscript.
Funding
This work was supported by the European Union’s Horizon 2020 Research and Innovation Program under grant agreement no. 678193 (CERES, Climate Change and European Aquatic Resources). ER-R is grateful for the funding from “Govern de les Illes Balears-Conselleria d’Innovació, Recerca i Turisme, Programa Vicenç Mut.”
Conflict of Interest
The authors declare that the research was conducted in the absence of any commercial or financial relationships that could be construed as a potential conflict of interest.
Supplementary Material
The Supplementary Material for this article can be found online at: https://www.frontiersin.org/articles/10.3389/fmars.2020.00497/full#supplementary-material
Footnotes
- ^ http://www.ba.ieo.es/ibamar
- ^ http://www2.ceab.csic.es/oceans/
- ^ www.socib.eu
- ^ https://ceresproject.eu/
References
Alcaraz, M. (1985). “Vertical distribution of zooplankton biomass during summer stratification in the Western Mediterranean,” in Proc.19th Eur.Mar.Biol.Symp, ed. P. E. Gibbs (Cambridge, MA: Cambridge University Press), 135–143.
Alcaraz, M., Calbet, A., Estrada, M., Marrasé, C., Saiz, E., and Trepat, I. (2007). Physical control of zooplankton communities in the Catalan Sea. Prog. Oceanogr. 74, 294–312. doi: 10.1016/j.pocean.2007.04.003
Alvarez-Berastegui, D., Ciannelli, L., Aparicio-Gonzalez, A., Reglero, P., Hidalgo, M., López-Jurado, J. L., et al. (2014). Spatial scale, means and gradients of hydrographic variables define pelagic seascapes of bluefin and bullet tuna spawning distribution. PLoS One 9:e0109338. doi: 10.1371/journal.pone.0109338
Alvarez-Berastegui, D., Hidalgo, M., Tugores, M. P., Reglero, P., Aparicio-González, A., Ciannelli, L., et al. (2016). Pelagic seascape ecology for operational fisheries oceanography: modelling and predicting spawning distribution of Atlantic bluefin tuna in Western Mediterranean. ICES J. Mar. Sci. 73, 1851–1862. doi: 10.1093/icesjms/fsw041
Aparicio-González, A., López-Jurado, J. L., Balbín, R., Alonso, J. C., Amengual, B., Jansá, J., et al. (2015). IBAMar database: four decades of sampling on the Western Mediterranean Sea. Data Sci. J. 13, 172–191. doi: 10.2481/dsj.14-020
Aumont, O., and Bopp, L. (2006). Globalizing results from ocean in situ iron fertilization studies. Global Biogeochem. Cycles 20, 1–15. doi: 10.1029/2005GB002591
Ayata, S.-D., Irisson, J.-O., Aubert, A., Berline, L., Dutay, J.-C., Mayot, N., et al. (2017). Regionalisation of the Mediterranean basin, a MERMEX synthesis. Prog. Oceanogr. 163, 7–20. doi: 10.1016/j.pocean.2017.09.016
Balbín, R., López-Jurado, J. L., Flexas, M. M., Reglero, P., Vélez-Velchí, P., González-Pola, C., et al. (2014). Interannual variability of the early summer circulation around the Balearic Islands: driving factors and potential effects on the marine ecosystem. J. Mar. Syst. 138, 70–81. doi: 10.1016/j.jmarsys.2013.07.004
Beckmann, A., and Hense, I. (2007). Beneath the surface: characteristics of oceanic ecosystems under weak mixing conditions – A theoretical investigation. Prog. Oceanogr. 75, 771–796. doi: 10.1016/j.pocean.2007.09.002
Bosc, E., Bricaud, A., and Antoine, D. (2004). Seasonal and interannual variability in algal biomass and primary production in the Mediterranean Sea, as derived from 4 years of SeaWiFS observations. Global Biogeochem. Cycles 18:GB1005. doi: 10.1029/2003GB002034
Buongiorno Nardelli, B., Tronconi, C., Pisano, A., and Santoleri, R. (2013). High and Ultra-High resolution processing of satellite Sea Surface Temperature data over Southern European Seas in the framework of MyOcean project. Remote Sens. Environ. 129, 1–16. doi: 10.1016/j.rse.2012.10.012
Calbet, A., Garrido, S., Saiz, E., Alcaraz, M., and Duarte, C. (2001). Annual zooplankton succession in coastal NW Mediterranean waters: the importance of the smallest size fractions. J. Plankton Res. 23, 319–331. doi: 10.1093/plankt/23.3.319
Cullen, J. J. (2014). Subsurface chlorophyll maximum layers: enduring enigma or mystery solved? Ann. Rev. Mar. Sci. 7, 207–242.
Cullen, J. J. (2015). Subsurface chlorophyll maximum layers: enduring enigma or mystery solved? Ann. Rev. Mar. Sci 7, 207–239. doi: 10.1146/annurev-marine-010213-135111
Cushing, D. H. (1983). Climate and fisheries. Clim. Fish 25, 373–493. doi: 10.1016/0272-7714(87)90048-5
Doney, S. C. (1999). Major challenges confronting marine biogeochemical modeling. Global Biogeochem. Cycles 13, 705–714. doi: 10.1029/1999GB900039
Doney, S. C., Lima, I., Moore, J. K., Lindsay, K., Behrenfeld, M. J., Westberry, T. K., et al. (2009). Skill metrics for confronting global upper ocean ecosystem-biogeochemistry models against field and remote sensing data. J. Mar. Syst. 76, 95–112. doi: 10.1016/j.jmarsys.2008.05.015
D’Ortenzio, F., and Ribera d’Alcalà, M. (2009). On the trophic regimes of the Mediterranean Sea: a satellite analysis. Biogeosciences 6, 139–148. doi: 10.5194/bg-6-139-2009
Escudier, R., Bouffard, J., Pascual, A., Poulain, P. M., and Pujol, M. I. (2013). Improvement of coastal and mesoscale observation from space: Application to the northwestern Mediterranean Sea. Geophys. Res. Lett. 40, 2148–2153. doi: 10.1002/grl.50324
Estrada, M., Latasa, M., Emelianov, M., Gutiérrez-Rodríguez, A., Fernández-Castro, B., Isern-Fontanet, J., et al. (2014). Seasonal and mesoscale variability of primary production in the deep winter-mixing region of the NW Mediterranean. Deep. Res. Part I Oceanogr. Res. Pap. 94, 45–61. doi: 10.1016/j.dsr.2014.08.003
Estrada, M., Marrase, C., and Latasa, M. (1993). Variability of deep chlorophyll maximum characteristics in the Northwestern Mediterranean. Mar. Ecol. Prog. Ser. 92, 289–300. doi: 10.3354/meps092289
Estrada, M., Varela, R. A., Salat, J., Cruzado, A., and Arias, E. (1999). Spatio-temporal variability of the winter phytoplankton distribution across the Catalan and North Balearic fronts (NW Mediterranean). J. Plankton Res. 21, 1–20. doi: 10.1093/plankt/21.1.1
Estrada, M., Vives, F., and Alcaraz, M. (1984). “Life and the productivity of the open sea,” in Western Mediterranean, Key Environments (Oxford: Pergamon Press Ltd), 148–197.
Fernández de Puelles, M. L., and Molinero, J. C. (2007). North Atlantic climate control on plankton variability in the Balearic Sea, western Mediterranean. Geophys. Res. Lett. 34, 1–5. doi: 10.1029/2006GL028354
Givan, O., Edelist, D., Sonin, O., and Belmaker, J. (2018). Thermal affinity as the dominant factor changing Mediterranean fish abundances. Glob. Chang. Biol. 24, e80–e89. doi: 10.1111/gcb.13835
Grifoll, M., Aretxabaleta, A. L., Pelegrí, J. L., Espino, M., Warner, J. C., and Sánchez-Arcilla, A. (2013). Seasonal circulation over the Catalan inner-shelf (northwest Mediterranean Sea). J. Geophys. Res. Ocean. 118, 5844–5857. doi: 10.1002/jgrc.20403
Gudmundsson, L., Bremnes, J. B., Haugen, J. E., and Engen-Skaugen, T. (2012). Technical Note: downscaling RCM precipitation to the station scale using statistical transformations – a comparison of methods. Hydrol. Earth Syst. Sci. 16, 3383–3390. doi: 10.5194/hess-16-3383-2012
Hidalgo, M., Rouyer, T., Molinero, J. C., Massutí, E., Moranta, J., Guijarro, B., et al. (2011). Synergistic effects of fishing-induced demographic changes and climate variation on fish population dynamics. Mar. Ecol. Prog. Ser. 426, 1–12. doi: 10.3354/meps09077
Hodges, B. (2004). Simple models of steady deep maxima in chlorophyll and biomass. Deep Sea Res. Part I Oceanogr. Res. Pap. 51, 999–1015. doi: 10.1016/j.dsr.2004.02.009
Holte, J., and Talley, L. (2009). A new algorithm for finding mixed layer depths with applications to argo data and subantarctic mode water formation. J. Atmos. Ocean. Technol. 26, 1920–1939. doi: 10.1175/2009JTECHO543.1
Jolliff, J. K., Kindle, J. C., Shulman, I., Penta, B., Friedrichs, M. A. M., Helber, R., et al. (2009). Summary diagrams for coupled hydrodynamic-ecosystem model skill assessment. J. Mar. Syst. 76, 64–82. doi: 10.1016/j.jmarsys.2008.05.014
Jordà, G., Von Schuckmann, K., Josey, S. A., Caniaux, G., García-Lafuente, J., Sammartino, S., et al. (2017). The Mediterranean Sea heat and mass budgets: estimates, uncertainties and perspectives. Prog. Oceanogr. 156, 174–208. doi: 10.1016/j.pocean.2017.07.001
Kay, S., Andersson, H., Catalan, I., Eilola, K., Jordá, G., Ramirez-Romero, E., et al. (2018). Projections of physical and Biogeochemical Parameters and Habitat Indicators for European Seas, Including Synthesis of Sea Level Rise and Storminess. H2020 CERES Project Deliverable D1.3. https://ec.europa.eu/research/participants/documents/downloadPublic?documentIds=080166e5b9fdf8fb&appId=PPGMS
Kessouri, F., Ulses, C., Estournel, C., Marsaleix, P., Severin, T., Pujo-pay, M., et al. (2017). Nitrogen and phosphoreus budgets in the northwestern Mediterranean deep convection region. J. Geophys. Res. Ocean. 122, 9429–9454. doi: 10.1002/2016JC012669
Lavigne, H., D’Ortenzio, F., Migon, C., Claustre, H., Testor, P., D’Alcalà, M. R., et al. (2013). Enhancing the comprehension of mixed layer depth control on the Mediterranean phytoplankton phenology. J. Geophys. Res. Ocean. 118, 3416–3430. doi: 10.1002/jgrc.20251
Lavoie, D., Lambert, N., and Gilbert, D. (2017). Projections of future trends in biogeochemical conditions in the northwest atlantic using CMIP5 Earth System Models. Atmos. Ocean 57, 18–40. doi: 10.1080/07055900.2017.1401973
Lazzari, P., Solidoro, C., Ibello, V., Salon, S., Teruzzi, A., Béranger, K., et al. (2012). Seasonal and inter-annual variability of plankton chlorophyll and primary production in the Mediterranean Sea: a modelling approach. Biogeosciences 9, 217–233. doi: 10.5194/bg-9-217-2012
Lazzari, P., Solidoro, C., Salon, S., and Bolzon, G. (2016). Spatial variability of phosphate and nitrate in the Mediterranean Sea: a modeling approach. Deep. Res. Part I Oceanogr. Res. Pap. 108, 39–52. doi: 10.1016/j.dsr.2015.12.006
Lejeusne, C., Chevaldonné, P., Pergent-Martini, C., Boudouresque, C. F., and Pérez, T. (2010). Climate change effects on a miniature ocean: the highly diverse, highly impacted Mediterranean Sea. Trends Ecol. Evol. 25, 250–260. doi: 10.1016/j.tree.2009.10.009
Lloret, J., Palomera, I., Salat, J., and Sole, I. (2004). Impact of freshwater input and wind on landings of anchovy (Engraulis encrasicolus) and sardine (Sardina pilchardus) in shelf waters surrounding the Ebre (Ebro) River delta (north-western Mediterranean). Fish. Oceanogr. 13, 102–110. doi: 10.1046/j.1365-2419.2003.00279.x
Lopez-Jurado, J., Aparicio-González, A., Balbín, R., Alonso, J. C., Amengual, B., Jansá, J., et al. (2014). IBAMar DATABASE: 4 Decades Sampling on the Western Mediterranean Sea. Madrid: Instituto Español de Oceanografía.
Ludwig, W., and Probst, J. L. (1996). Predicting the oceanic input of organic carbon by continental erosion. Global Biogeochem. Cycles 10, 23–41. doi: 10.1029/95GB02925
Macias, D., Garcia-Gorriz, E., and Stips, A. (2018a). Deep winter convection and phytoplankton dynamics in the NW Mediterranean Sea under present climate and future (horizon 2030) scenarios. Sci. Rep. 8:6626. doi: 10.1038/s41598-018-24965-0
Macias, D., Garcia-Gorriz, E., and Stips, A. (2018b). Major fertilization sources and mechanisms for Mediterranean Sea coastal ecosystems. Limnol. Oceanogr. 63, 897–914. doi: 10.1002/lno.10677
Macias, D., Huertas, I. E., Garcia-Gorriz, E., and Stips, A. (2019). Non-Redfieldian dynamics driven by phytoplankton phosphate frugality explain nutrient and chlorophyll patterns in model simulations for the Mediterranean Sea. Prog. Oceanogr. 173, 37–50. doi: 10.1016/j.pocean.2019.02.005
Macias, D., Stips, A., and Garcia-Gorriz, E. (2014). The relevance of deep chlorophyll maximum in the open Mediterranean Sea evaluated through 3D hydrodynamic-biogeochemical coupled simulations. Ecol. Modell 281, 26–31.
Martin, P., Maynou, F., Recasens, L., and Sabatés, A. (2016). Cyclic fluctuations of blue whiting (Micromesistius poutassou) linked to open-sea convection processes in the northwestern Mediterranean. Fish. Oceanogr. 25, 229–240. doi: 10.1111/fog.12147
Maynou, F., Sabatés, A., and Raya, V. (2020). Changes in the spawning habitat of two small pelagic fish in the Northwestern Mediterranean. Fish. Oceanogr. 29, 202–214. doi: 10.1111/fog.12464
Maynou, F., Sabatés, A., and Salat, J. (2014). Clues from the recent past to assess recruitment of Mediterranean small pelagic fishes under sea warming scenarios. Clim. Change 126, 175–188. doi: 10.1007/s10584-014-1194-0
Mayot, N., D’Ortenzio, F., Taillandier, V., Prieur, L., Pasqueron de Fommervault, O., Claustre, H., et al. (2017). Physical and biogeochemical controls of the phytoplankton blooms in North-Western Mediterranean Sea: a multiplatform approach over a complete annual cycle (2012-2013 DEWEX experiment). J. Geophys. Res. Ocean. 122, 9999–10019. doi: 10.1002/2016JC012052
Millot, C., and Taupier-Letage, I. (2006). Circulation in the Mediterranean Sea. Berlin: Springer, 29–66.
Molinero, J., Ibanez, F., Souissi, S., Buecher, E., Dallot, S., and Nival, P. (2008). Climate control on the long-term anomalous changes of zooplankton communities in the Northwestern Mediterranean. Glob. Chang. Biol. 14, 11–26.
Nowaczyk, A., Carlotti, F., Thibault-Botha, D., and Pagano, M. (2011). Distribution of epipelagic metazooplankton across the Mediterranean Sea during the summer BOUM cruise. Biogeosciences 8, 2159–2177. doi: 10.5194/bg-8-2159-2011
Oguz, T., Macias, D., and Tintore, J. (2015). Ageostrophic frontal processes controlling phytoplankton production in the Catalano-Balearic Sea (Western Mediterranean). PLoS One 10:e0129045. doi: 10.1371/journal.pone.0129045
Olivar, M. P., Salat, J., and Palomera, I. (2001). Comparative study of spatial distribution patterns of the early stages of anchovy and pilchard in the NW Mediterranean Sea. Mar. Ecol. Prog. Ser. 217, 111–120. doi: 10.3354/meps217111
Osborn, T. R. (1980). Estimates of the local rate of vertical diffusion from Dissipation Measurements. J. Phys. Oceanogr. 10, 83–89. doi: 10.1175/1520-0485(1980)010<0083:eotlro>2.0.co;2
Ospina-Alvarez, A., Bernal, M., Catalán, I. A., Roos, D., Bigot, J. L., and Palomera, I. (2013). Modeling fish egg production and spatial distribution from acoustic data: a step forward into the analysis of recruitment. PLoS One 8:e0073687. doi: 10.1371/journal.pone.0073687
Ospina-Alvarez, A., Catalán, I. A., Bernal, M., Roos, D., and Palomera, I. (2015). From egg production to recruits: connectivity and inter-annual variability in the recruitment patterns of European anchovy in the northwestern Mediterranean. Prog. Oceanogr 138, 431–447. doi: 10.1016/j.pocean.2015.01.011
Palmiéri, J., Orr, J. C., Dutay, J. C., Béranger, K., Schneider, A., Beuvier, J., et al. (2015). Simulated anthropogenic CO2 storage and acidification of the Mediterranean Sea. Biogeosciences 12, 781–802. doi: 10.5194/bg-12-781-2015
Palomera, I., Olivar, M. P., Salat, J., Sabatés, A., Coll, M., García, A., et al. (2007). Small pelagic fish in the NW Mediterranean Sea: an ecological review. Prog. Oceanogr. 74, 377–396. doi: 10.1016/j.pocean.2007.04.012
Pasqueron De Fommervault, O., D’Ortenzio, F., Mangin, A., Serra, R., Migon, C., Claustre, H., et al. (2015). Seasonal variability of nutrient concentrations in the Mediterranean Sea: contribution of Bio-Argo floats. J. Geophys. Res. Ocean. 120, 8528–8550. doi: 10.1002/2015JC011103
Peck, M. A., Reglero, P., Takahashi, M., and Catalán, I. A. (2013). Life cycle ecophysiology of small pelagic fish and climate-driven changes in populations. Prog. Oceanogr. 116, 220–245. doi: 10.1016/j.pocean.2013.05.012
Pinot, J. M., López-Jurado, J. L., and Riera, M. (2002). The CANALES experiment (1996-1998). Interannual, seasonal, and mesoscale variability of the circulation in the Balearic Channels. Prog. Oceanogr. 55, 335–370. doi: 10.1016/S0079-6611(02)00139-8
Piroddi, C., Coll, M., Liquete, C., Macias, D., Greer, K., Buszowski, J., et al. (2017). Historical changes of the Mediterranean Sea ecosystem: modelling the role and impact of primary productivity and fisheries changes over time. Sci. Rep. 7, 1–18. doi: 10.1038/srep44491
Ramírez, F., Afán, I., Tavecchia, G., Catalán, I. A., Oro, D., and Sanz-Aguilar, A. (2016). Oceanographic drivers and mistiming processes shape breeding success in a seabird. Proc. R. Soc. B Biol. Sci 283:20152287. doi: 10.1098/rspb.2015.2287
Riesgo, A., Pérez-Portela, R., Pita, L., Blasco, G., Erwin, P. M., and López-Legentil, S. (2016). Population structure and connectivity in the Mediterranean sponge Ircinia fasciculata are affected by mass mortalities and hybridization. Heredity 117, 427–439. doi: 10.1038/hdy.2016.41
Sabatés, A., Olivar, M. P., Salat, J., Palomera, I., and Alemany, F. (2007). Physical and biological processes controlling the distribution of fish larvae in the NW Mediterranean. Prog. Oceanogr. 74, 355–376. doi: 10.1016/j.pocean.2007.04.017
Sabatés, A., Salat, J., Raya, V., and Emelianov, M. (2013). Role of mesoscale eddies in shaping the spatial distribution of the coexisting Engraulis encrasicolus and Sardinella aurita larvae in the northwestern Mediterranean. J. Mar. Syst. 11, 108–119. doi: 10.1016/j.jmarsys.2012.10.002
Sabatés, A., Salat, J., Raya, V., Emelianov, M., and Segura-Noguera, M. (2009). Spawning environmental conditions of Sardinella aurita at the northern limit of its distribution range, the western Mediterranean. Mar. Ecol. Prog. Ser. 385, 227–236. doi: 10.3354/meps08058
Saiz, E., Sabatés, A., and Gili, J. (2014). “The zooplankton,” in The Mediterranean Sea: Its History and Present Challenges, eds S. Goffredo and Z. Dubinsky (New York, NY: Springer), 1–678.
Salat, J. (1995). The interaction between the catalan and balearic currents in the southern catalan sea. Oceanol. Acta 18, 227–234.
Salat, J., Garcia, M. A., Cruzado, A., Palanques, A., Arin, L., Gomis, D., et al. (2002). Seasonal changes of water mass structure and shelf slope exchanges at the Ebro shelf (NW Mediterranean). Cont. Shelf Res. 22, 327–348. doi: 10.1016/S0278-4343(01)00031-0
Salon, S., Cossarini, G., Bolzon, G., Feudale, L., Lazzari, P., Teruzzi, A., et al. (2019). Novel metrics based on biogeochemical argo data to improve the model uncertainty evaluation of the cmems Mediterranean marine ecosystem forecasts. Ocean Sci. 15, 997–1022. doi: 10.5194/os-15-997-2019
Segura-Noguera, M., Cruzado, A., and Blasco, D. (2011). Nutrient preservation, analysis precision and quality control of an oceanographic database of inorganic nutrients, dissolved oxygen and chlorophyll a from the NW Mediterranean Sea. Sci. Mar. 75, 321–339. doi: 10.3989/scimar.2011.75n2321
Segura-Noguera, M., Cruzado, A., and Blasco, D. (2016). The biogeochemistry of nutrients, dissolved oxygen and chlorophyll a in the Catalan Sea (NW Mediterranean Sea). Sci. Mar. 80, 39–56. doi: 10.3989/scimar.04309.20A
Severin, T., Conan, P., Durrieu de Madron, X., Houpert, L., Oliver, M. J., Oriol, L., et al. (2014). Impact of open-ocean convection on nutrients, phytoplankton biomass and activity. Deep. Res. Part I Oceanogr. Res. Pap. 94, 62–71. doi: 10.1016/j.dsr.2014.07.015
Siokou-Frangou, I., Christaki, U., Mazzocchi, M. G., Montresor, M., Ribera d’Alcalá, M., Vaqué, D., et al. (2010). Plankton in the open Mediterranean Sea: a review. Biogeosciences 7, 1543–1586. doi: 10.5194/bg-7-1543-2010
Sommer, U., Stibor, H., Katechakis, A., Sommer, F., and Hansen, T. (2002). Pelagic food web con gurations at different levels of nutrient richness and their implications for the ratio sh production:primary production. Hydrobiologia 484, 11–20. doi: 10.1023/A:1021340601986
Somot, S., Houpert, L., Sevault, F., Testor, P., Bosse, A., Taupier-Letage, I., et al. (2018). Characterizing, modelling and understanding the climate variability of the deep water formation in the North-Western Mediterranean Sea. Clim. Dyn. 51, 1179–1210. doi: 10.1007/s00382-016-3295-0
Sotillo, M. G., Cailleau, S., Lorente, P., Levier, B., Aznar, R., Reffray, G., et al. (2015). The myocean IBI ocean forecast and reanalysis systems: operational products and roadmap to the future copernicus service. J. Oper. Oceanogr. 8, 63–79. doi: 10.1080/1755876X.2015.1014663
Sournia, A. (1975). La production primaire planctonique en Méditerranée: essai de mise a jour. Bull. Etude Commun. Mediter 5, 1–128.
Stips, A., Dowell, M., Somma, F., Coughlan, C., Piroddi, C., Macias, D., et al. (2015). Towards an Integrated Water Modelling Toolbox. Brussels: European Commission.
Stow, C. A., Jolliff, J., McGillicuddy, D. J., Doney, S. C., Allen, J. I., Friedrichs, M. A. M., et al. (2009). Skill assessment for coupled biological/physical models of marine systems. J. Mar. Syst. 76, 4–15. doi: 10.1016/j.jmarsys.2008.03.011
Taylor, K. E. (2001). Summarizing multiple aspects of model performance in a single diagram. J. Geophys. Res. Atmos. 106, 7183–7192. doi: 10.1029/2000JD900719
Tedesco, L., Piroddi, C., Kämäri, M., and Lynam, C. (2016). Capabilities of Baltic Sea models to assess environmental status for marine biodiversity. Mar. Policy 70, 1–12. doi: 10.1016/j.marpol.2016.04.021
Teruzzi, A. G., Salon, S., Lazzari, P., Solidoro, C., and Cossarini, G. (2018). Assimilation of coastal and open sea biogeochemical data to improve phytoplankton simulation in the Mediterranean Sea. Ocean Model. 132, 46–60. doi: 10.1016/j.ocemod.2018.09.007
Teruzzi, A., Cossarini, G., Lazzari, P., Salon, S., Bolzon, G., Crise, A., et al. (2016). Mediterranean Sea biogeochemical reanalysis (CMEMS MED REA-Biogeochemistry 1999-2015). Copernicus Monit. Environ. Mar. Serv. doi: 10.25423/MEDSEA_REANALYSIS_BIO_006_008
Tintoré, J., Vizoso, G., Casas, B., Heslop, E., Pascual, A., Orfila, A., et al. (2013). SOCIB: the balearic islands coastal ocean observing and forecasting system responding to science, technology and society needs. Mar. Technol. Soc. J. 47, 101–117. doi: 10.4031/MTSJ.47.1.10
Tudela, S., and Palomera, I. (1997). Trophic ecology of the European anchovy Engraulis encrasicolus in the Catalan Sea (northwest Mediterranean). Mar. Ecol. Prog. Ser. 160, 121–134. doi: 10.3354/meps160121
Turley, C. M. (1999). The changing Mediterranean Sea – A sensitive ecosystem? Prog. Oceanogr. [Prog. Ocean. 44, 387–400. doi: 10.1016/s0079-6611(99)00033-6
Van Leeuwen, S. M., Le Quesne, W. F., and Parker, E. R. (2016). Potential future fisheries yields in shelf waters: a model study of the effects of climate change and ocean acidification. Biogeosciences 13, 441–454. doi: 10.5194/bg-13-441-2016
Vandromme, P., Stemmann, L., Berline, L., Gasparini, S., Mousseau, L., Prejger, F., et al. (2011). Inter-annual fluctuations of zooplankton communities in the Bay of Villefranche-sur-mer from 1995 to 2005 (Northern Ligurian Sea. France). Biogeosciences 8, 3143–3158. doi: 10.5194/bg-8-3143-2011
Keywords: primary production, biogeochemical cycle, coupled models, plankton food webs, plankton functional type model, deep chlorophyll maximum, Mediterranean Sea, Balearic Sea
Citation: Ramirez-Romero E, Jordà G, Amores A, Kay S, Segura-Noguera M, Macias DM, Maynou F, Sabatés A and Catalán IA (2020) Assessment of the Skill of Coupled Physical–Biogeochemical Models in the NW Mediterranean. Front. Mar. Sci. 7:497. doi: 10.3389/fmars.2020.00497
Received: 23 January 2020; Accepted: 03 June 2020;
Published: 09 July 2020.
Edited by:
Johan Schijf, University of Maryland Center for Environmental Science (UMCES), United StatesReviewed by:
Anna Teruzzi, Istituto Nazionale di Oceanografia e di Geofisica Sperimentale (OGS), ItalyMichael Adam Alexander, Earth System Research Laboratory (NOAA), United States
Camille Richon, University of Liverpool, United Kingdom
Copyright © 2020 Ramirez-Romero, Jordà, Amores, Kay, Segura-Noguera, Macias, Maynou, Sabatés and Catalán. This is an open-access article distributed under the terms of the Creative Commons Attribution License (CC BY). The use, distribution or reproduction in other forums is permitted, provided the original author(s) and the copyright owner(s) are credited and that the original publication in this journal is cited, in accordance with accepted academic practice. No use, distribution or reproduction is permitted which does not comply with these terms.
*Correspondence: Eduardo Ramirez-Romero, ZXJhbWlyZXpAaW1lZGVhLnVpYi1jc2ljLmVz