 Jennifer Rehren
 Didier Gascuel
- ESE, Ecology and Ecosystem Health, Institut Agro, INRAE, Rennes, France
Distributing fishing mortality across the widest possible range of species, stocks, and sizes in proportion to their natural productivity (i.e., balanced harvest, BH) has been suggested as a new paradigm of fisheries management to minimize the effects of fishing on the ecosystem structure while maximizing overall yield. Models that have been used to test the effects of BH, however, usually concentrate on fish and assume full alignment of fishing mortality with the productivity of each species. Here, we used the trophic-level-based approach EcoTroph to investigate the effects of BH on the biomass and catch trophic spectra of a virtual ecosystem assuming (1) a full implementation, where all trophic levels can be fished according to their productivity and (2) a more realistic implementation, where low and intermediate trophic levels are only partially exploitable by fisheries mimicking current technological and practical limitations. EcoTroph simulations show that a BH fishing pattern does not fully maintain ecosystem structure but results in small structural changes and a large total yield. The resulting catch, however, was dominated by low trophic levels (i.e., 2–2.5). Considering that fishing mortality cannot be fully aligned to all species, we observed an additional adverse impact of BH: the increase in unexploitable biomass. In contrast, protecting lower trophic levels appeared as an efficient way to limit the impact of fisheries on the highest trophic levels, which play a crucial role in ecosystem stability and biodiversity. We conclude that given our inability to align fishing mortality to the productivity of each species, BH could lead to strong adverse impacts on the ecosystem. Instead of expanding fishing pressure toward new species and trophic levels, we first should ensure the sustainable management of those that are currently harvested beyond their capacity to replenish.
Introduction
Balanced harvest (BH) has been suggested as a new paradigm of fisheries management, which minimizes the effects of fishing on the structure of marine ecosystems, while simultaneously maximizing overall yield (Garcia et al., 2012; Kolding et al., 2016c). According to this approach, selective fisheries disproportionally remove certain ecosystem components – often the larger species and size classes – compromising the structure and functioning of marine ecosystems (Kolding et al., 2014).
With the intention to maintain ecosystem structure, while increasing fisheries yield a BH approach not only aims to meet international efforts toward an ecosystem-based approach to fisheries management but also efforts toward global food security (UN Sustainable Development Goal 2, SDG) (Kolding et al., 2016b). Thereby, it partly reconciles ecological and socio-economic goals (Zhou et al., 2019), making it a particularly attractive concept.
Under BH, the intent is to distribute “a moderate fishing pressure across the widest possible range of species, stocks, and sizes of animals within an ecosystem, in proportion to their natural productivity so that the relative size and species composition is maintained” (Garcia et al., 2012). A transition of fisheries management to such an approach, reduces fishing pressure on higher trophic levels, while increasing it on the more productive lower trophic levels, and induces a general fisheries expansion (Law et al., 2013; Zhou et al., 2019).
The BH approach has received considerable criticism (Burgess et al., 2015; Breen et al., 2016; Froese et al., 2016). For instance, that a shift in fishing pressure toward lower trophic levels will deplete prey densities for higher trophic levels (Froese et al., 2016). The approach is, thereby, discordant with other studies that call for reductions in the exploitation of forage fish (Smith et al., 2011).
Balanced harvest has been tested with size spectrum models (Law et al., 2012, 2013, 2016), ecosystem models (Garcia et al., 2012; Heath et al., 2017) and multispecies predation models (Zhou and Smith, 2017; Plank, 2018). These models predict a better or full maintenance of ecosystem structure (Garcia et al., 2012; Law et al., 2012, 2013; Jacobsen et al., 2014; Zhou and Smith, 2017; Plank, 2018), contradicting the concern of negative effects through prey loss. Furthermore, they predict higher total catches (e.g., Garcia et al., 2012; Jacobsen et al., 2014; Kolding et al., 2016c), and sometimes an increase in system biomass (e.g., Garcia et al., 2012; Law et al., 2016). Often the argument is made that maximizing protein production will help meet the basic nutritional needs of a growing population. That directs the focus on the total catch, rather than its trophic composition. Because these studies largely center around the idea of fish communities (e.g., Jacobsen et al., 2014; Law et al., 2012, 2016; Plank, 2018), they indicate that under BH we might have to accept catches dominated by forage fish (Jacobsen et al., 2014) or smaller individuals of commercially important species (Law et al., 2016). It remains the question, which trophic levels will ultimately feed the world when fishing with the BH approach at an ecosystem level.
Setting each ecosystem component proportional to its productivity is arguably impossible in practice, due to technological and practical limitations (Burgess et al., 2015). Particularly, balancing fishing mortality with the production rate (i.e., total production, dimensions mass time–1) is more difficult to implement as it not only requires the knowledge of the productivity (i.e., dimension time–1, P/B) of each ecosystem component but also estimates of its biomass (Heath et al., 2017). Reality shows, that the monitoring and assessment of multi-species fisheries, let alone the implementation of quota systems is highly challenging and rarely possible (Salas et al., 2007; Branch and Hilborn, 2008). Several studies have suggested a minimum size limit (Jacobsen et al., 2014; Law et al., 2016) or have argued that fisheries operate in a socio-economic context and that society will determine the range of organisms harvested; probably exempting some species from fishing (Garcia et al., 2016; Heath et al., 2017). Attempting a BH fishing strategy under technological constraints or deliberately exempting parts of the ecosystem from fishing, could, however, have unforeseen consequences that merit thorough evaluation at an ecosystem level.
In this study, we use the EcoTroph approach (Gascuel, 2005; Gascuel et al., 2011) to revisit the impacts of BH on the structure of marine ecosystems using a virtual ecosystem. EcoTroph is a widely used trophic-level based approach to investigate the impacts of fishing on the ecosystem (Gasche et al., 2012; Halouani et al., 2015; Moullec et al., 2017). The model tracks the quantity and rate of biomass flow through the system and quantifies how fishing effects disrupt these flows, and how they change the biomass and production trophic structure. These aspects lie at the heart of the BH concept. With this approach, we move from a definite number of species (size classes) toward a more holistic, though abstract, representation of an aquatic ecosystem. We specifically address the effect of BH on the biomass trophic spectrum and the relative trophic composition of the catch when balancing fishing mortality with (1) productivity and (2) production rate and investigate which fishing pattern leads to full maintenance of the ecosystem structure. Furthermore, we investigate the consequences of a BH fishing strategy under the assumption of restricted access to lower and intermediate trophic levels to fisheries. Finally, we test the BH fishing strategy on different ranges of trophic levels. This sheds light on the potential effects of broadening the currently harvested trophic level range.
Materials and Methods
The EcoTroph Model
EcoTroph is a trophic-level based approach used to investigate the impact of fishing on the trophic structure of marine ecosystems (Gasche et al., 2012; Halouani et al., 2015; Moullec et al., 2017). In the EcoTroph model the system’s biomass is distributed across continuous trophic levels, split into 0.1 classes. The flow equation of the EcoTroph model (Eq. 1) expresses the flow of biomass (i.e., Φ) through the food-web as a function of (1) natural losses due to non-predation mortalities such as excretion and respiration [i.e., μ, transfer efficiency, TE = exp(−μ)], and (2) losses due to fishing (i.e., φ).
where τ denotes the trophic level and Δτ the trophic level step (i.e., 0.1 for TLs > 2). This biomass flow transfer represents the continuous flow of energy through ontogenetic process and discrete jumps between trophic levels via predation. Energy enters the model at trophic level 1 as generated by the photosynthetic activity of the primary producers, and recycling by the microbial loop. The model does not consider semi-autotrophic organisms (trophic levels between 1 and 2) because they occur in few ecosystems and usually have low levels of biomass (e.g., coral polyps and tridacnid clams).
The mean biomass flow Φτ over the [τ, τ + Δτ] trophic class can be derived from integrating equation 1:
Because the biomass flow is the density of the production at a given trophic level, we can calculate the production P of a trophic class [τ, τ + Δτ] by multiplying the mean biomass flow with the trophic level step:
The speed of the biomass transfer from one trophic level to the next (i.e., kinetics, K) can be expressed as the number of trophic levels passed per time (τ . t-1).
The biomass (B) at each trophic level, thus, becomes a function of the production divided by the speed of the flow:
This process of biomass flow through the trophic system is a purely physical description analog to the density flow equation and implicitly introduces bottom-up control of prey on predators into the model. In contrast, top-down control is explicitly introduced into the model, by making the speed of biomass transfer partly dependent on the biomass of higher (i.e., predators, pred) trophic levels.
where F is the fishing mortality and α is a coefficient expressing the fraction of the kinetics that depends on predator abundance. This assumes that the higher the abundance of predators in the system the faster the prey is eaten. The gamma coefficient γ defines the functional relationship between prey and predators. If γ is set to 1 the effect of predator abundance is linear (similar to a Holling type I functional response), and with values below 1 the relationship between the prey and its predators becomes non-linear (closer to a Holling type II functional response). This implementation only allows for the calculation of changes in kinetics due to top-down control and therefore requires a reference system (i.e., ref) for which parameters are known (i.e., K, F, B, and Φ).
Virtual Ecosystem and Simulations of Fishing Effects
To investigate the impacts of different fishing patterns on marine ecosystems (see section “Fishing Strategies”), we created a virgin (unfished) ecosystem using the EcoTroph model. We calculated the biomass flows for a trophic level range of 1 to 5, assuming a production of 100 arbitrary units at trophic level 2 and no fishing (i.e., φ = 0). According to Christensen and Pauly (1993), we considered a conventional TE of 10% for all trophic levels (i.e., μ = 2.30).
According to Gascuel et al. (2008) the productivity of a trophic level under steady-state condition can be described, in practice, as a measure of the speed of the trophic flow (i.e., P/B = Kinetics). We estimated the speed of the biomass flow and calculated the corresponding biomass at each trophic level using Gascuel et al. (2008) empirical equation P/B = 20.19τ−3.26exp0.041T with a mean water temperature of 15°C (i.e., T).
In EcoTroph the speed of the biomass flow is partly dependent on the intensity of fishing and the biomass of predators in the system (Eq. 6). In turn, the biomass is dependent on the speed of the biomass flow (Eq. 5). Given these interdependencies the simulation of fishing effects on the virgin ecosystem relies on a stepwise iteration process. To initialize the calculations a fishing mortality vector is introduced and a new starting vector for the kinetics of a fished ecosystem is estimated by adding the new fishing mortalities to the virgin ecosystem kinetics. The iteration process itself is based on a three-step procedure: (1) we calculate the new biomass flow at each trophic level using the fishing mortality vector (Eq. 1); (2) we recalculate the biomass using the new biomass flow and kinetics (Eq. 5); and (3) we use the new biomass values together with the new fishing mortality vector to recalculate the kinetics (Eq. 6). These three steps are repeated until kinetics and biomass flow values stabilize (i.e., values of iteration i and i + 1 do not vary more than 106). For further details on the iteration procedure refer to Gascuel and Pauly (2009).
The Exploitable Fraction of an Ecosystem
It is unlikely that in the near future we can achieve a fishing pattern that harvests each trophic level proportional to its productivity, because of the current technical and practical limitations of the fishery. Particularly, low trophic levels (i.e., τ = 2:2.5), mainly composed of small zooplankton and benthic invertebrates are usually not or little exploitable, at least according to our current fishing technologies. Intermediate trophic levels (i.e., τ = 2.5:3.5) often consist of some highly targeted species (e.g., small pelagics, shrimps, and cephalopods) and some less or not at all exploited groups (e.g., worms and large zooplankton). We explored the consequences of different fishing patterns under limited exploitability of these low and intermediate trophic levels, by separating the biomass and biomass flow of the ecosystem into an exploitable and an unexploitable part. The transfer from the total biomass to the exploitable biomass is described by a selectivity coefficient S, expressing the fraction of the biomass B exploitable by fisheries:
where the slope k and the asymptote L were set to 4.84 and 1, respectively. The parameter a is defined by the trophic level where Sτ is equal to 50%. Values of k, L, and Sτ were set according to the conventional values used by Gascuel and Pauly (2009) in order to mimic a likely scenario where on average 10 and 50% of the biomass is exploitable at TL 2.0 and 2.5, respectively (Figure 1.). We explored the sensitivity of the results to different assumptions of a (results in Supplementary Material). Multiplying the selectivity coefficient (Sτ) with the total system values, we can derive the exploitable biomass (B∗), biomass flow (Φ∗), and the fishing loss rate (φ∗) of the exploitable biomass flow (Gascuel et al., 2011). Furthermore, using the exploitable biomass flow and fishing loss rate the natural loss rate (μ∗) of the exploitable biomass flow is calculated as:
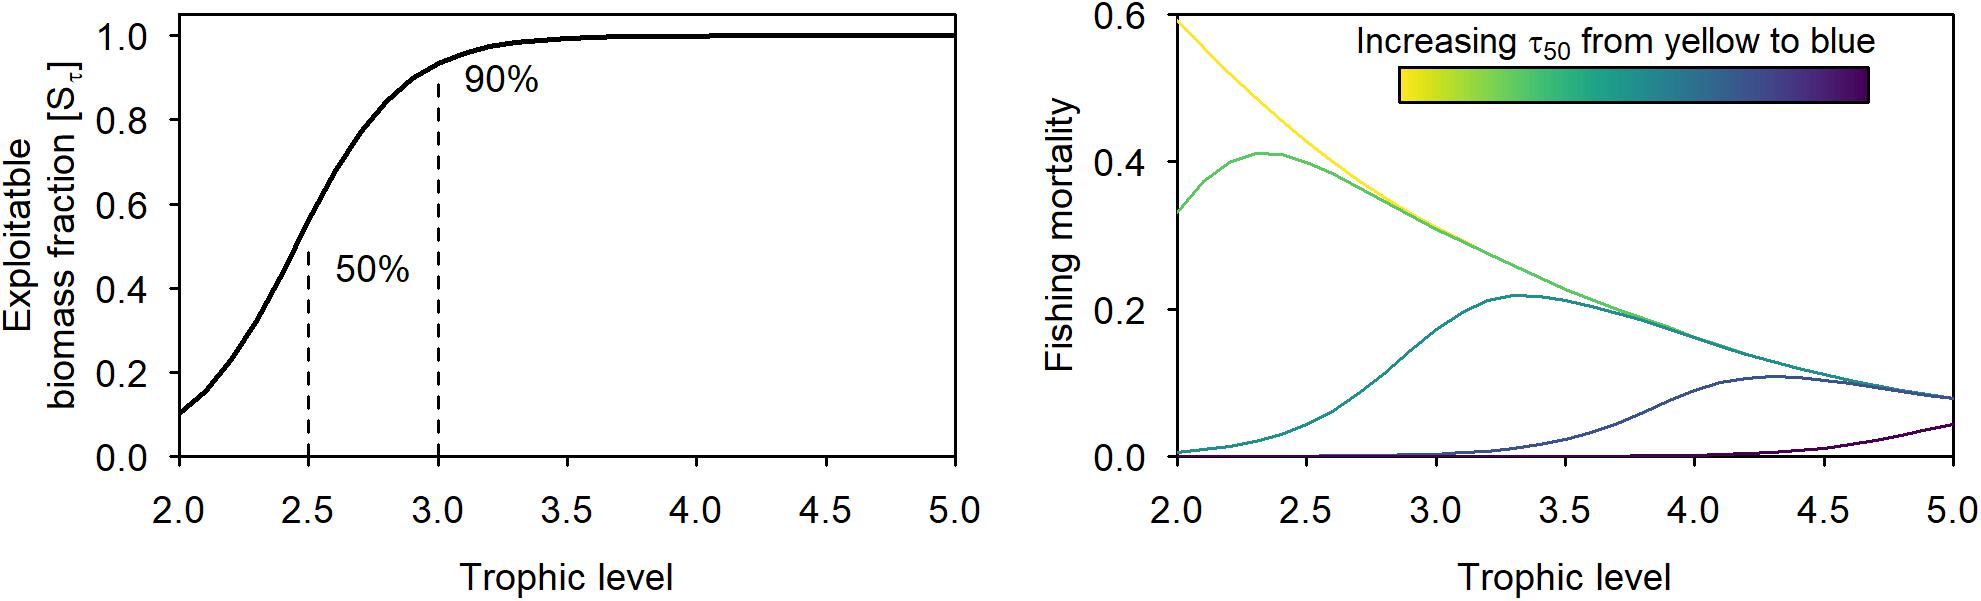
Figure 1. Trophic distribution of the coefficient S determining the exploitable part of the biomass at each trophic level (left panel) and an example of the fishing mortalities resulting from different τ50 values (increasing from yellow to blue) at an asymptotic exploitation rate (c1, BHP/B) of 0.4 (right panel). Left panel defines what is exploitable, while right panel refers to what is exploitable in terms of trophic levels.
We used the empirical model proposed by Gascuel et al. (2008) for finfish P/B = 2.31τ-1.72 exp0.053T to estimate the speed of the biomass flow for the exploitable part of the ecosystem. This results in slower flow speed for the exploitable biomass reflecting the fact that easily exploitable species, such as forage fish or shrimps, often exhibit lower turn-over and thus slower kinetics than less exploitable species occupying a similar trophic level position (i.e., zooplankton).
Fishing Strategies
Balanced Harvest
We tested two different implementations of BH: setting fishing mortalities proportional to (1) the productivity (P/B, dimension time–1) of each trophic level (BHP/B); and (2) the production rate (P, dimension mass time–1) of each trophic level (BHP) (Zhou et al., 2019).
In the BHP/B scenario, setting fishing mortality proportional to productivity results in an exploitation rate that is constant across trophic levels. As the productivity of a trophic level under steady-state condition can be described as a measure of the speed of the trophic flow (Gascuel et al., 2008), the fishing mortality directly relates to the kinetics as:
where c is a constant between 0 and 1.
The initial fishing mortality of each trophic level was set at 10% of its kinetics (corresponding to an exploitation rate E of 0.1).
In the BHp scenario, the fishing mortality is set proportional to the production rates of each trophic level:
The coefficient c2 does not represent an exploitation rate and does not need to be set between 0 and 1. However, it is a measure of fishing intensity, like c1. Setting fishing mortality proportional to the production rate accounts for the fact that when removing a given part of the biomass flow from a given trophic level τ, trophic level τi+1 receives less biomass flow and consequently must be harvested with a lower exploitation rate for the biomass structure to be maintained. For comparison purposes, we chose a c2 value (i.e., 0.0039) that resulted in fishing mortalities at trophic level 2 similar to those under BHP/B.
We applied a fishing effort multiplier ranging from 0 to 10 by increments of 0.1 for both scenarios. First, we simulated the impacts of BHP/B and BHP assuming that all trophic levels are equally exploitable (Sτ, value of 1). We also tested the sensitivity of our results to different values of top-down control (α and γ) and TE. As a second step, we searched iteratively for a fishing pattern that fully maintained the biomass structure. For that we started the first iteration with the BHP fishing mortality vector (Fτ = c2*Kτ). For each consecutive iteration i (until convergence), the fishing mortality of each trophic level is corrected by the relative increase/decrease of the relative biomass of that trophic level compared to the virgin ecosystem:
This allowed to maintain ecosystem structure, with exactly the same rate of reduction of the ecosystem biomass at all trophic levels. We compared the resulting fishing pattern (hereafter called balanced structure harvest or BSH) with the initial BHP and BHP/B BH fishing patterns.
In order to get closer to realistic situations, we then used the BSH and the BHP/B pattern to simulate fishing impacts on the ecosystem assuming that part of the biomass of lower and intermediate trophic levels is not exploitable (Figure 1).
Expanding Fisheries or Intensifying Protection
We explored the performance of a BHP/B and a BSH pattern under harvesting different ranges of trophic levels. For this, we simulated a range of different fishing intensities following a logistic curve with a range of different midpoints values (τ50, trophic level at first capture analog to length at first capture) (Figure 1). The trophic level at first capture represents the level of protection: the lower the τ50 the wider the range of low trophic levels fished (restricted BHP/B and BSH). A τ50 of 1 represents a scenario where the exploitable biomass of all trophic levels experiences the same fishing intensity: that is harvesting the widest possible range (i.e., full BHP/B and BSH). A τ50 around 3.5 can be seen as a proxy of the situation currently observed in many exploited ecosystems. This allows us to look at the results not only by comparison to a virgin state but starting from that “current situation” and thus analyzing the effects of expanding fisheries toward lower trophic levels.
Performance Measures
We compared the performance of the various fishing scenarios tested, using the following metrics:
(1) The total ecosystem biomass and the biomass of predators, compared to the virgin state;
(2) The disturbance index (Bundy et al., 2005), which is a measure of changes in the biomass trophic structure:
where Ve is the virgin ecosystem;
(3) The high trophic indicator (HTI), which is the percentage of consumer biomass from trophic levels above 4 in the ecosystem (Bourdaud et al., 2016). Because high trophic levels are often strongly impacted by anthropogenic activities (Pauly and Watson, 2005) and have been shown to play a crucial role in ecosystem stability and biodiversity (Rooney et al., 2006; Sergio et al., 2008), such a measure of the abundance of top-predators in the ecosystem can be considered as an index (among others) of functional biodiversity;
(4) The relative amount of exploitable biomass as a measure of structural changes occurring at each trophic level;
(5) The total catch expressed as the sum of catches across trophic levels. To approximate the economic performance of each fishing scenario, we also analyzed the catch trophic spectra, calculating the relative contribution of trophic levels between 3.5 and 5 (hereafter, predatory trophic levels) and the relative contribution of low trophic levels (τ = 2:2.5).
Results
Effects of Balanced Harvest on Biomass and Catch Trophic Structure
Under a BH scenario, where fishing mortality is set proportional to the productivity (time–1, BHP/B), the same proportion of production is harvested at each trophic level, and as a result fishing mortalities scale with trophic level (Figure 2). At all fishing intensities, the resulting biomass structure deviates from the virgin ecosystem, with a stronger biomass depletion of higher trophic levels (Figure 3) resulting in disturbance index values between 0.02 and 0.34. Under such fishing strategy, the catch is centered around lower trophic levels, resulting in 76 to 84% of the total catch coming from trophic level 2 to 2.5. The catch of predatory trophic levels only contributes with 1–3% to the overall catch (Figure 3). The impact on the biomass structure and the high catch of lower trophic levels persists even under different top-down control strengths (Supplementary Figure 1), but changes substantially with different transfer efficiencies (Supplementary Figure 2): the lower the efficiency the lower the biomass and the catch of predators, and thus the higher the proportion of low trophic levels in the total catch (ranging from 63 to 90%).
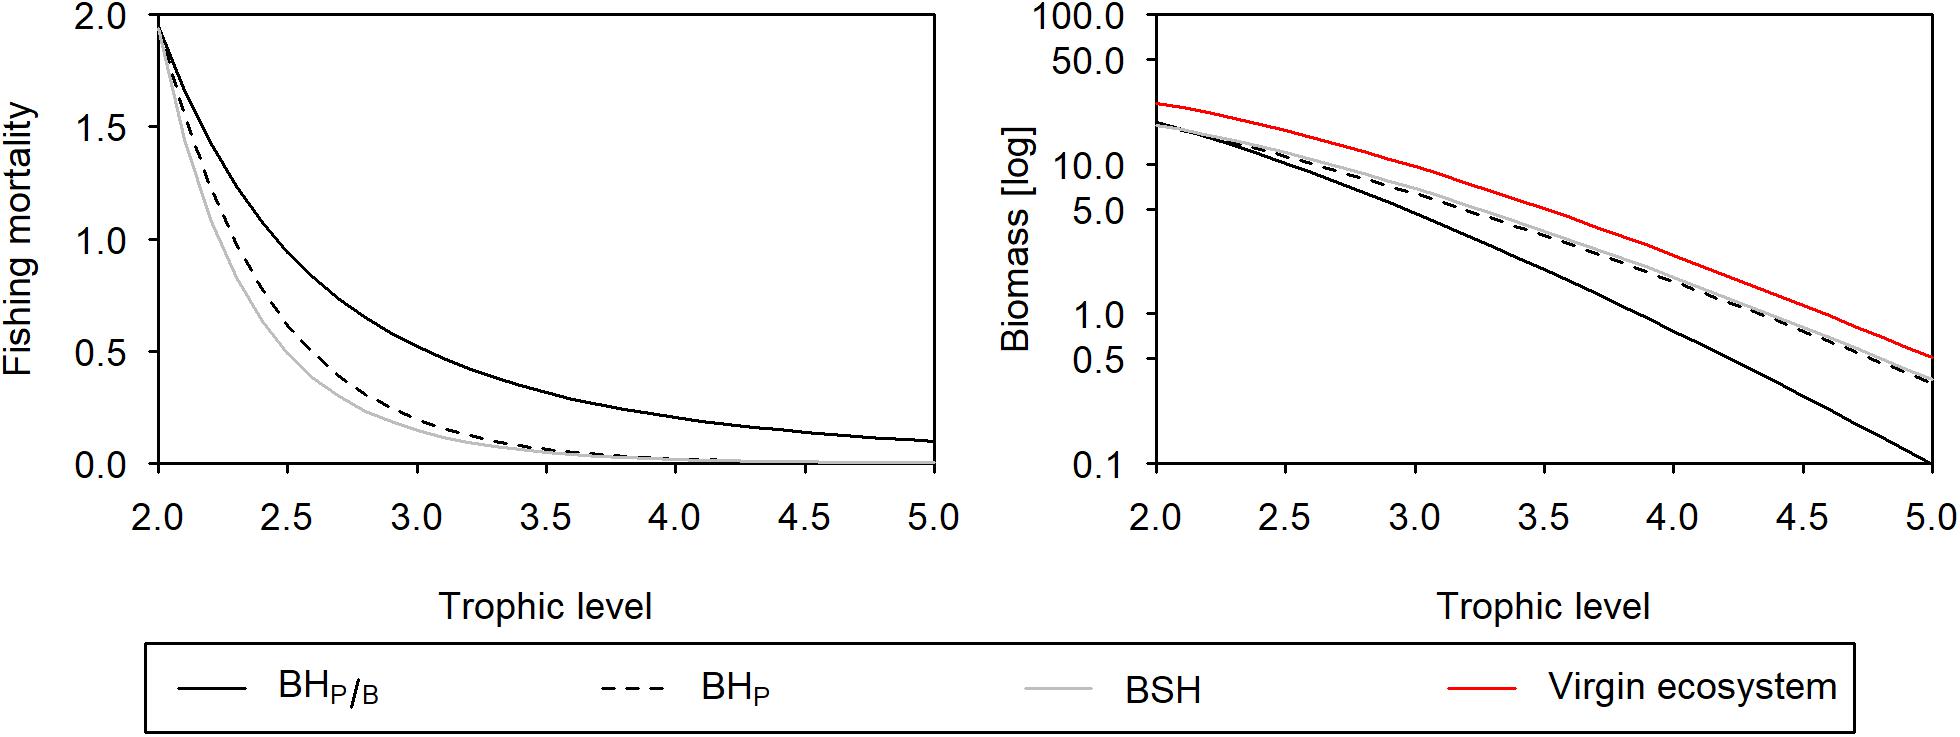
Figure 2. Fishing pattern (left panel) and biomass (log transformed) trophic structure (right panel) when balancing fishing mortality with productivity (black solid line), production (black dashed line), and when applying a fishing mortality that fully maintains the biomass structure (gray solid line). The red line in the biomass trophic spectrum represents a multiplier of 0 (virgin ecosystem).
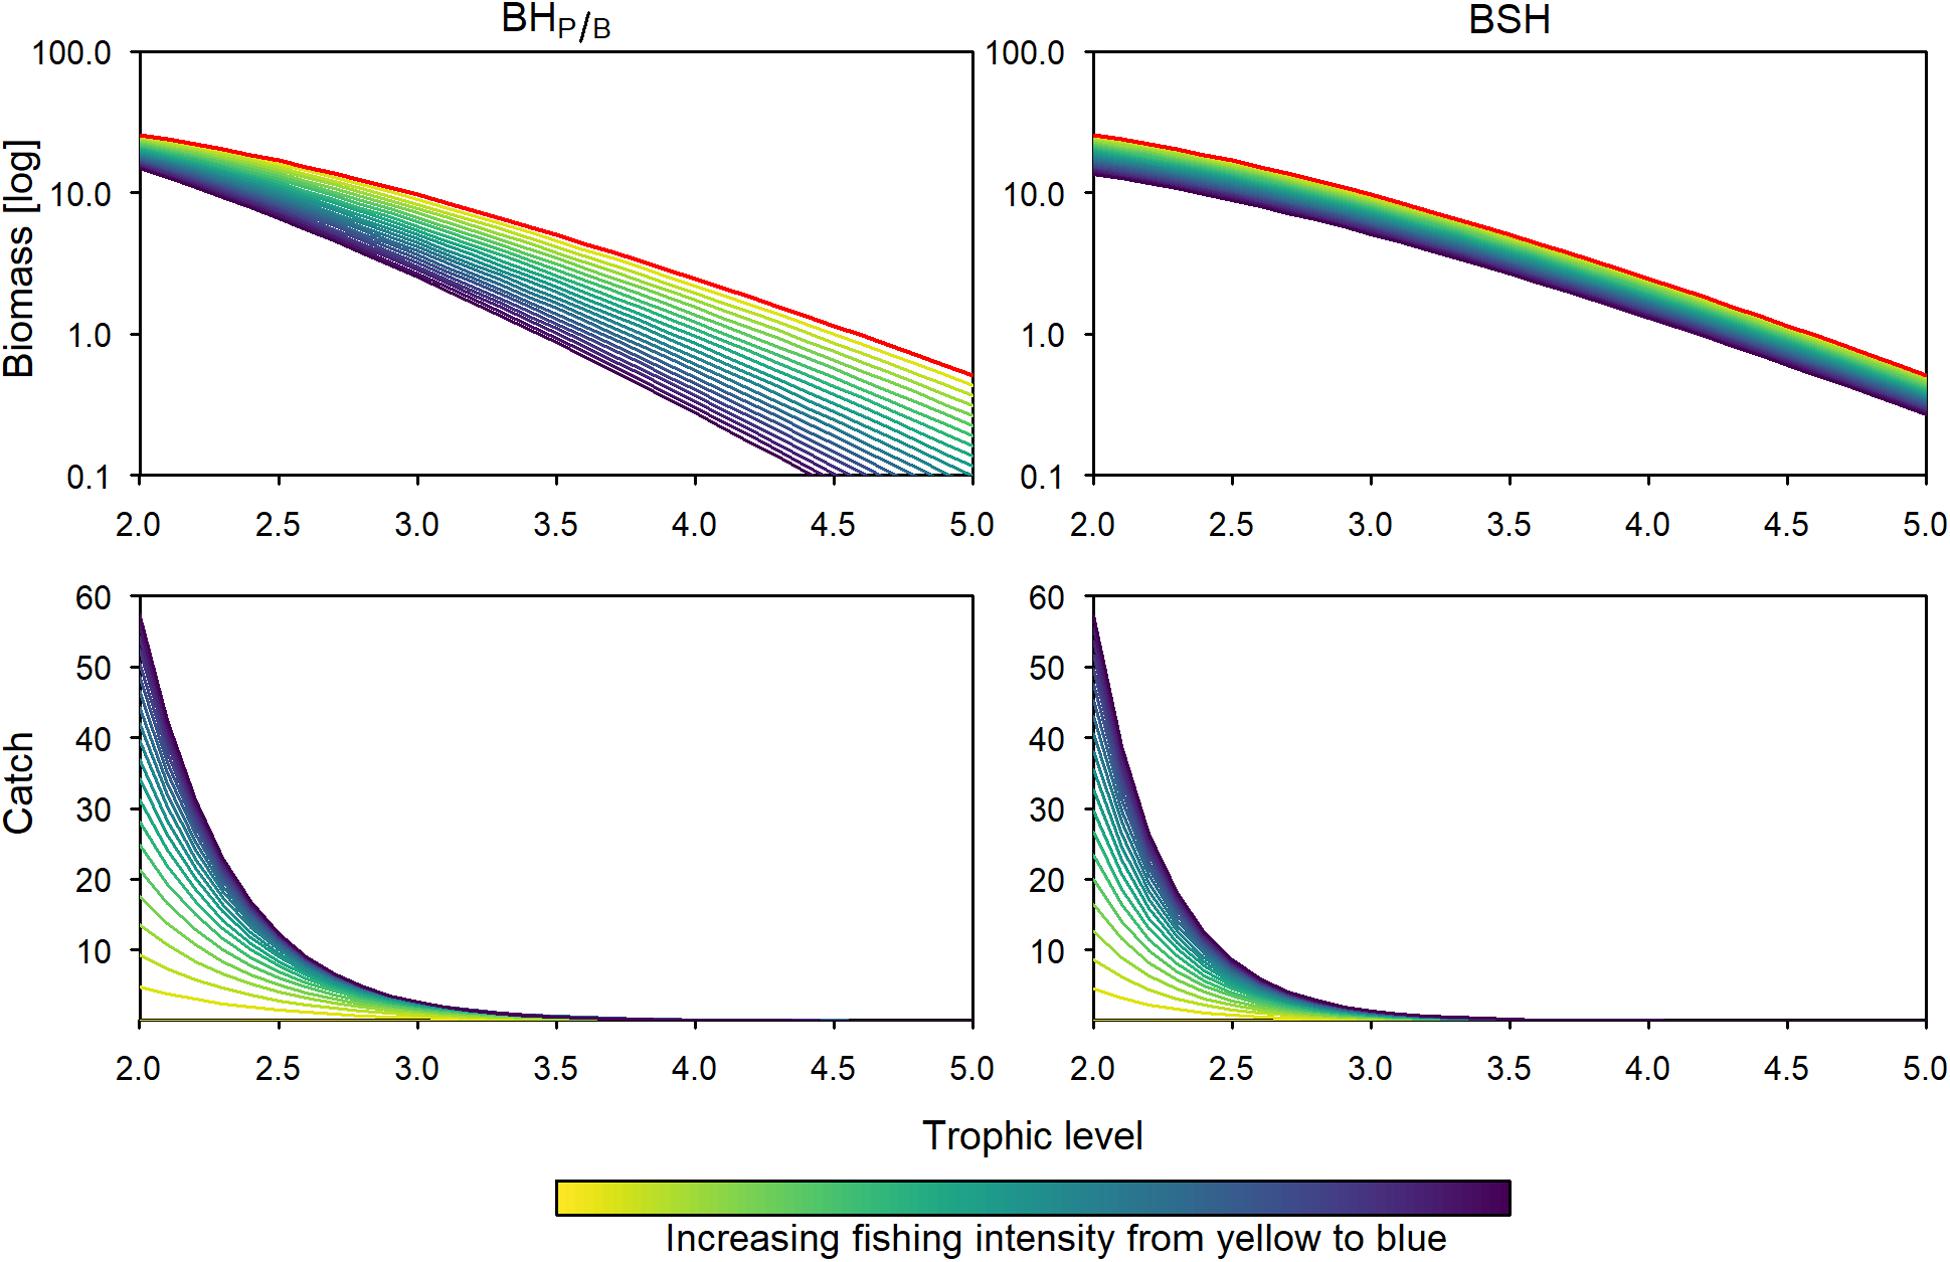
Figure 3. Biomass (log transformed) and catch trophic structure using a BHP/B (left panels) and a BSH (right panels) fishing pattern. Colored lines depict different effort multipliers (increasing from yellow to blue). The red lines in the biomass trophic spectrum represent a multiplier of 0 (virgin ecosystem).
If fishing mortality is set proportional to the production rate (mass time–1, BHP), mortalities even stronger decrease with increasing trophic level (Figure 2). The resulting exploitation rate for trophic level 5 is more than one magnitude lower: when harvesting trophic level 2 with an exploitation of 40%, trophic level 5 can only be harvested with an exploitation of 1.3%. Under such fishing strategy, the biomass structure is almost, but not fully maintained (Figure 2), with disturbance index values ranging from 0.002 to 0.06. Changes in the biomass structure are particularly sensitive to the magnitude of TE: the higher the TE the higher is the impact on the biomass structure (Supplementary Figure 2). Under a TE of 20%, for instance, the disturbance increases to 0.01–0.27.
The fishing mortality vector we estimated iteratively in order to fully maintain ecosystem structure (BSH), is close but not exactly equal to a fishing mortality vector that is set proportional to the production rate (BHP). It allows for slightly higher mortalities at higher trophic levels and reduces a bit the fishing mortalities of lower and intermediate trophic levels (Figure 2, Supplementary Table 1). The total catch resulting from this fishing strategy is very close to the BHP scenario and about 17–33% lower compared to BHP/B. Compared to this latter one, the low fishing mortalities of higher trophic levels reduce the catches of predatory trophic levels to 0.5% of the total catch and increases those from lower trophic levels (i.e., 2 to 2.5) to 87–89% (Figure 3).
Consequences of Balanced Harvest Under Limited Exploitability
When fishing with a BHP/B or BSH pattern under limited exploitability of lower and intermediate trophic levels, the total catch is approximately 78% lower, because the more productive trophic levels are not fully harvested. Similar, to the full-exploitability scenario, the catch is 23 to 25% lower when fishing with the BSH pattern compared to BHP/B (Figures 4, 6). In the two patterns, the relative predatory catch is improved (5–12% in BHP/B), even if it remains low when fishing with a BSH pattern (2%). When balancing fishing mortality with productivity the trophic levels below 2.4 experience a small increase in biomass due to predation release, leading to increased changes in the biomass trophic structure. According to its aim, the BSH scenario maintains the trophic structure of the exploited part of the ecosystem but the structure of the total biomass is disturbed (Figure 4, 0.007–0.12 disturbance index). In both the BHP/B and BSH scenarios, the relative amount of unexploitable biomass is increasing strongly with exploitation (from 41 to 77% and 74% respectively, Figure 5). This increase varies according to the midpoint chosen: the more trophic levels are fully exploitable, the stronger the relative increase of unexploitable biomass with fishing (Supplementary Figure 3).
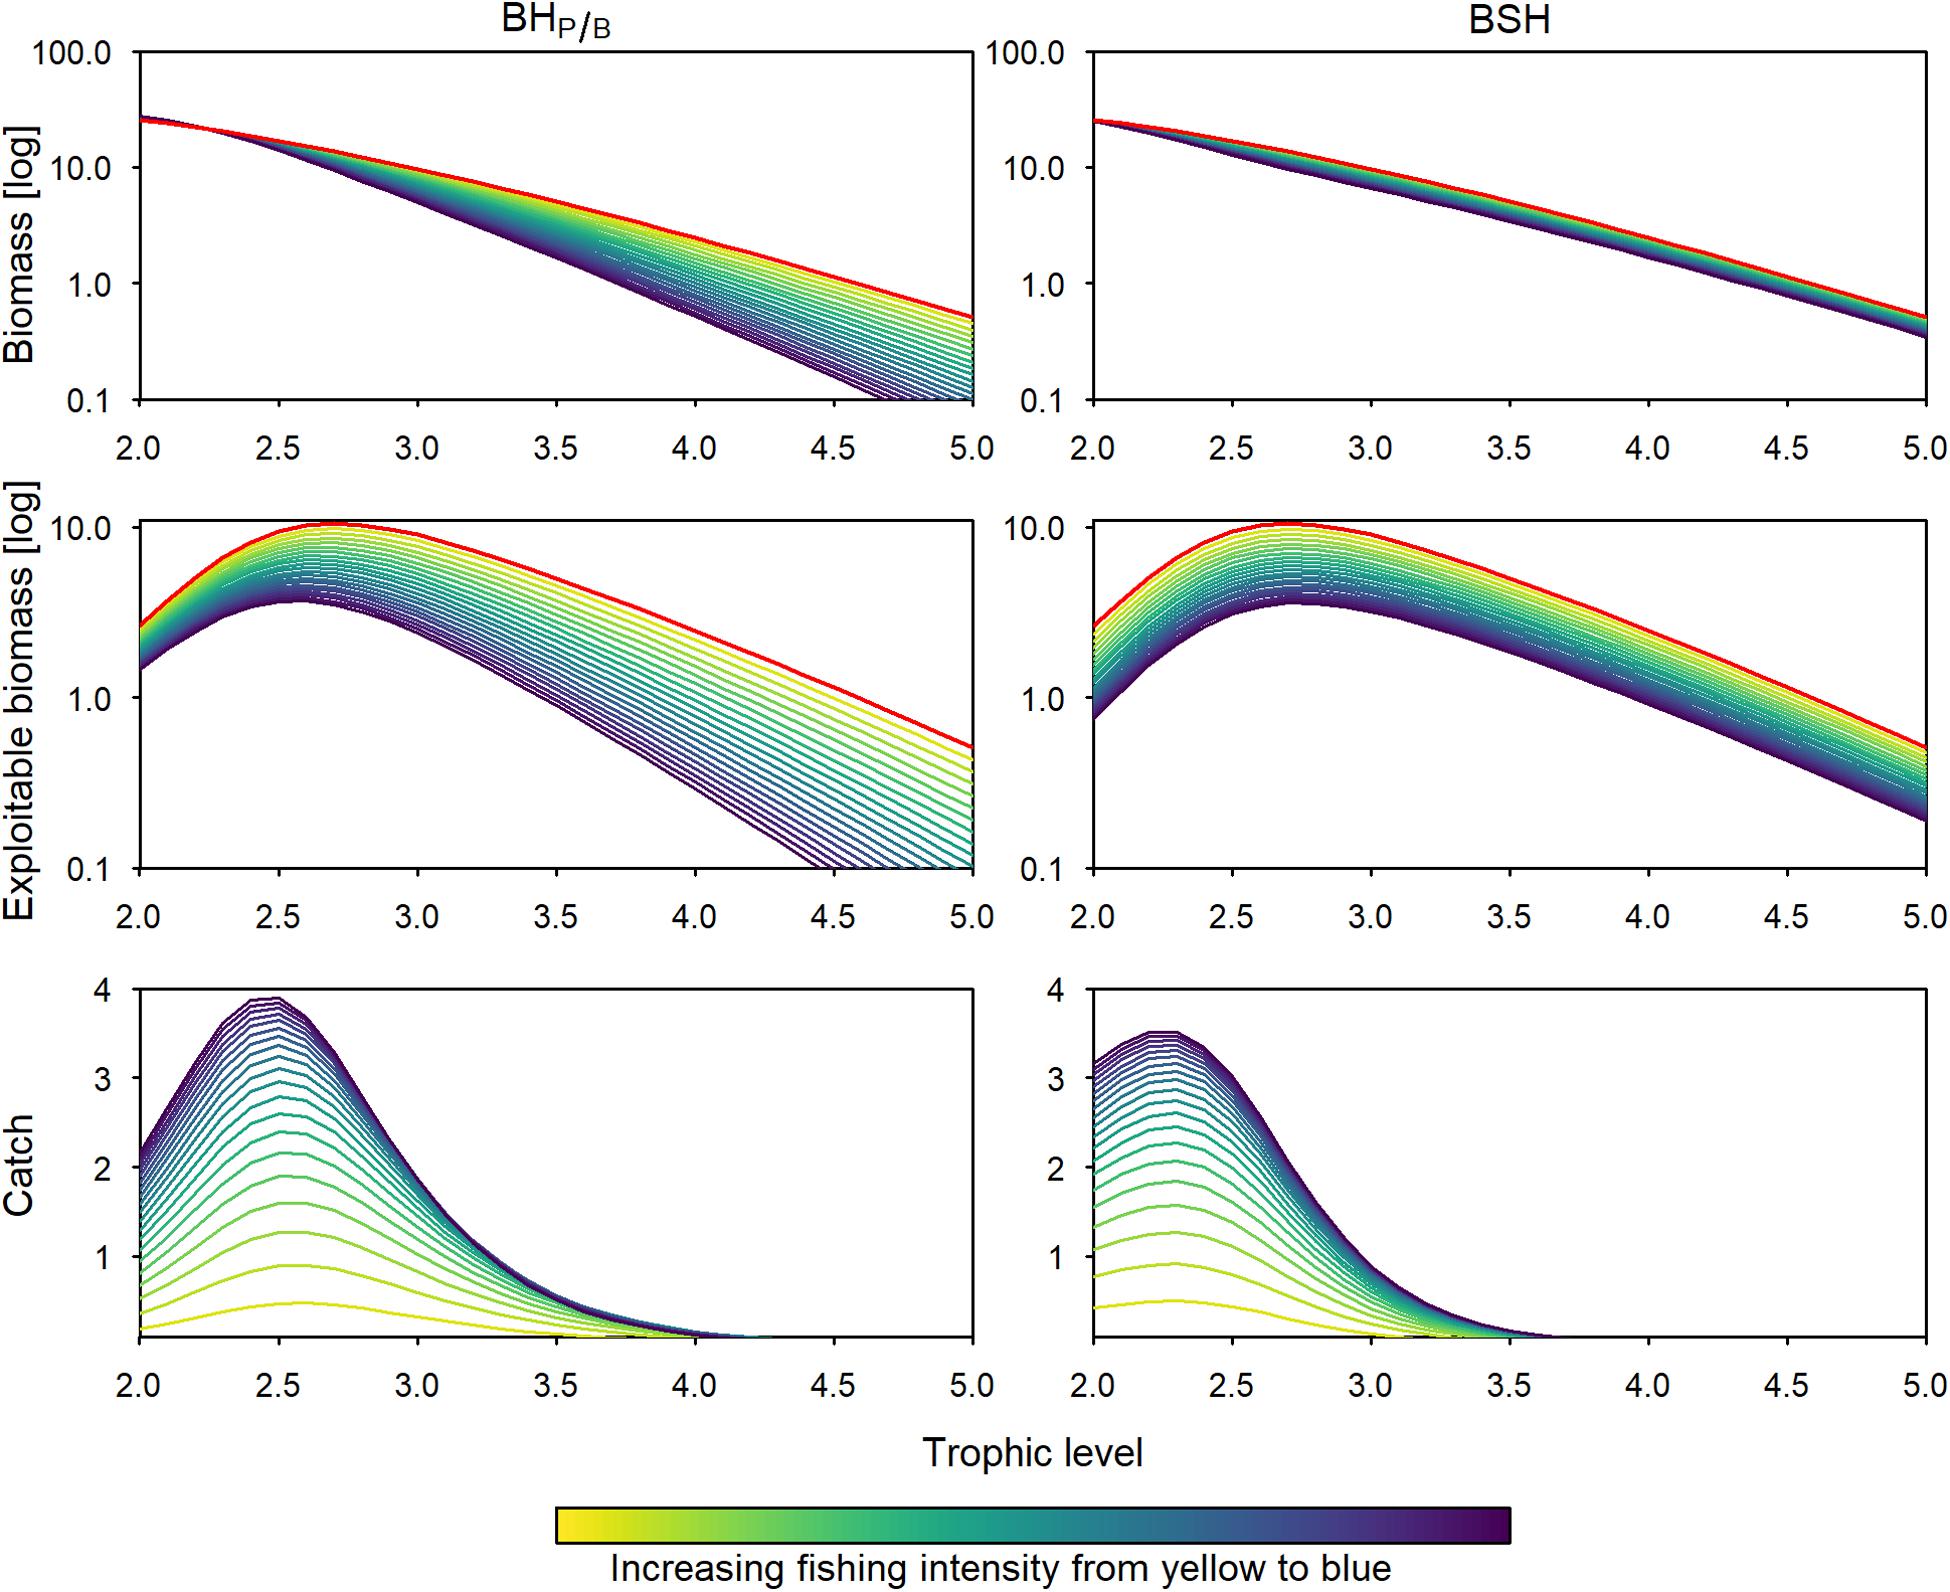
Figure 4. Total and exploitable biomass (log transformed), and catch trophic spectrum, under BHP/B (left panels) and BSH (right panels) assuming limited exploitability of lower and intermediate trophic levels. Colors as in Figure 3.
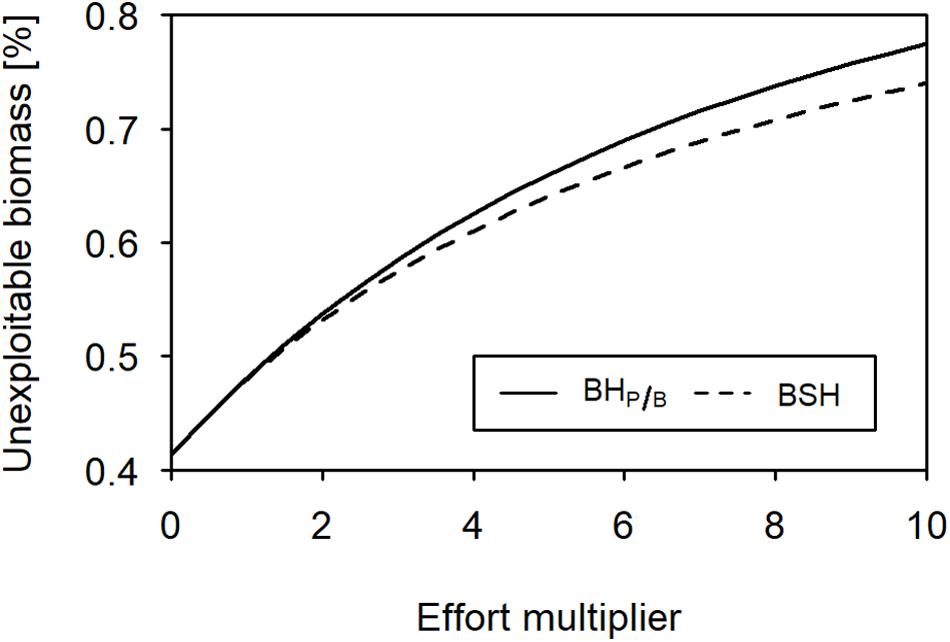
Figure 5. Relative unexploitable biomass in the ecosystem (BHP/B, solid line; BSH, dashed line) under different levels of fishing intensity.
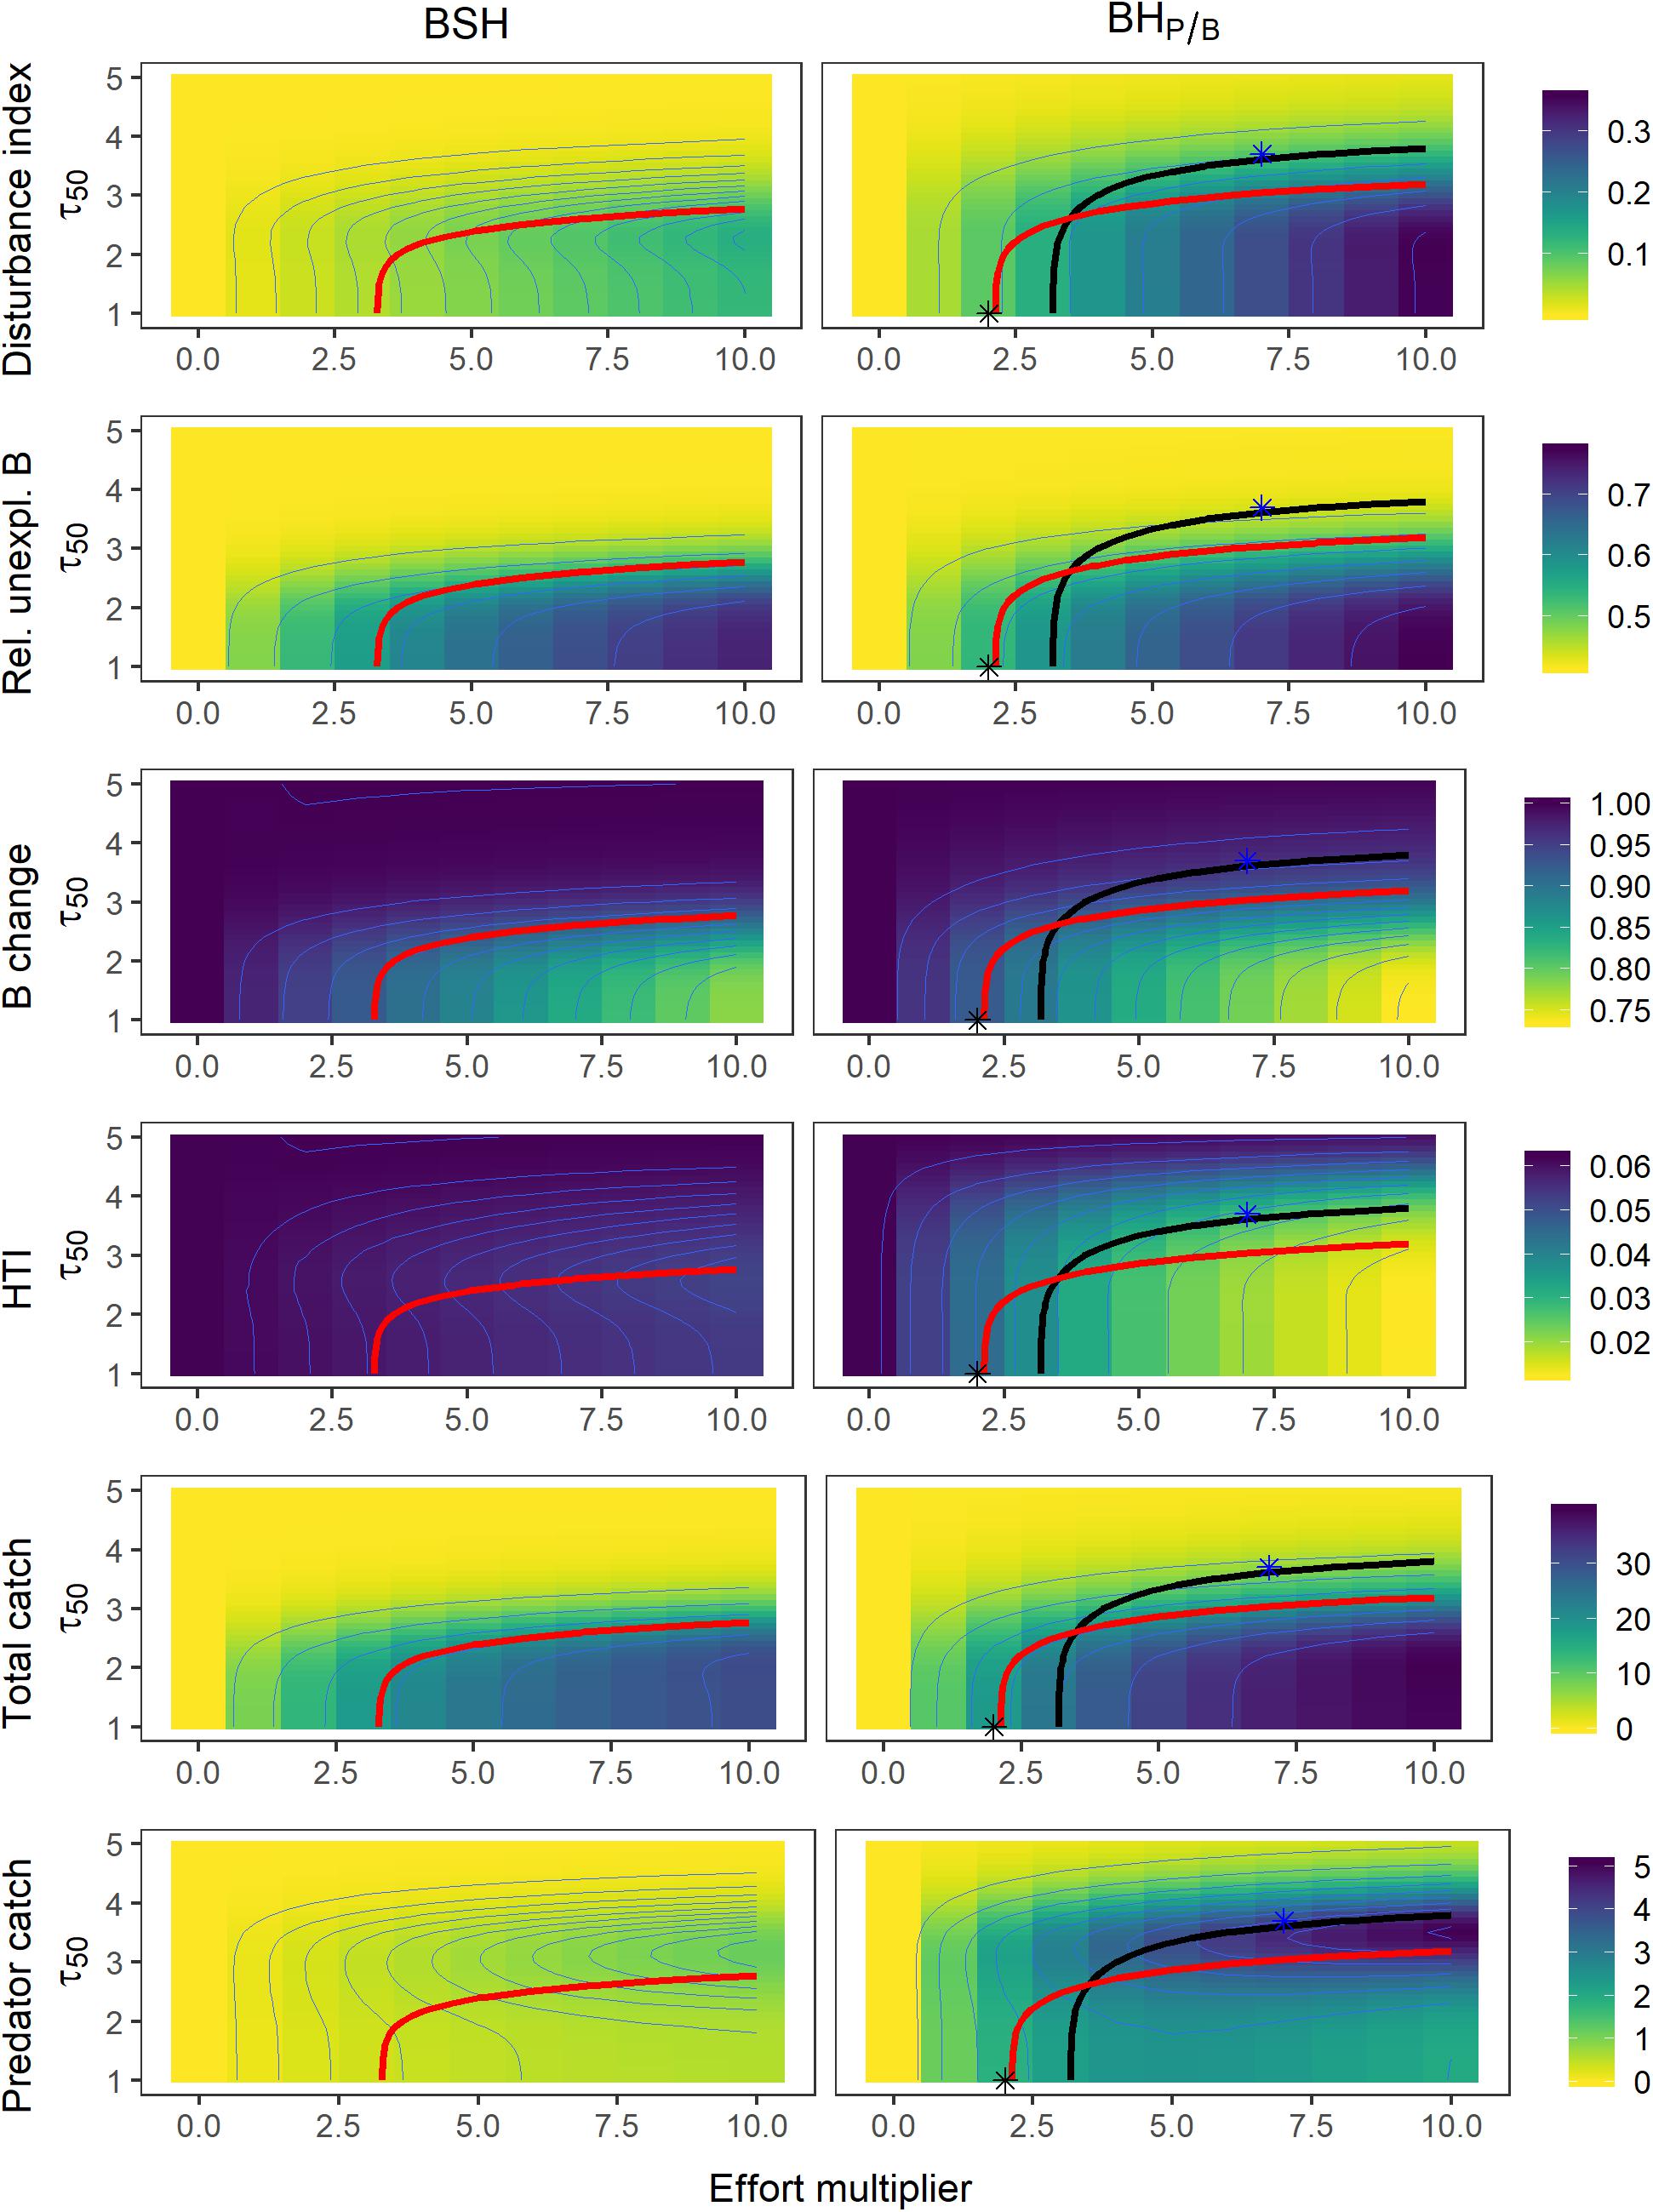
Figure 6. Contour plots of the different performance measures as a function of the harvest intensity (effort multiplier) and the trophic level at first capture (τ50), under a BSH fishing pattern (left panels) and BHP/B (right panels). Thick isolines depict combinations of τ50 values and effort multipliers that lead to (A) a 40% decrease in predator biomass (black), and (B) a catch of 80% maximum catch (red). The stars (*) depict fishing patterns and strategies that maximize total catch (black) and predator catch (blue), while not depleting biomass below 60% virgin biomass.
Effects of Protecting Lower and Intermediate Trophic Levels
Best Fishing Strategy for the Ecosystem
The best fishing strategy from a purely ecological point of view (i.e., lowest disturbance, lowest unexploitable biomass, and highest predator and total biomass) is to delay fishing sufficiently to restrict the impact of fishing to a small range of trophic levels (e.g., τ50 > 4, Figure 6). This level of protection, however, results in a small total catch. For example, with a trophic level at first catch of 4, the catch is reduced by 82 to 98% compared to no protection and a situation where fisheries are targeting all the exploitable biomass of the ecosystem. Generally, a BSH pattern outperforms BHP/B regarding all three ecological indicators (Figure 6). Under such BSH strategy, fishing mortality is set very low for high trophic levels, reducing the overall impact on the predator biomass.
Maximizing Catch1
For a given total catch, harvesting all exploitable trophic levels without any protection (full BHP/B or full BSH) has the least impact on the overall ecosystem structure but induces the highest increase in the relative unexploitable biomass. This strategy does not outperform the protection of low trophic levels in terms of HTI and predator biomass. To reduce the impact on these two performance measures, the trophic level at first catch must be delayed at least to values between 1.8 and 2.6 depending on the amount of total catch.
The BSH pattern outperforms BHP/B in terms of disturbance and predator biomass changes, but it generates stronger increases in relative unexploitable biomass. A BSH pattern also generates higher total catches than BHP/B without depleting total or predatory biomass below 60% (Figure 6). It must be noted that increasing total catch always comes at the expense of higher disturbance and higher relative unexploitable biomass. In other words, if a level at first catch around 3.5 is considered representative of the current situation of many ecosystems, enlarging exploitation toward lower trophic levels, would lead to higher ecological impacts in terms of unexploitable biomass.
In our tested scenarios, to get the largest predatory catch, fishing mortality should be balanced with productivity and trophic level at first capture should be delayed to τ50 3.7 (Figure 6). Contrasting to maximizing total catch it induces a lower impact on the amount of unexploitable biomass and biomass structure but reduces total catch by 71% compared to its maximum. For a given predator catch, a full BH pattern has the same or a higher impact on the ecosystem structure, a higher impact on the total biomass and predator biomass, and a higher impact on the relative unexploitable biomass compared to a fishing strategy where lower trophic levels are protected (i.e., restricted BHP/B).
Total catch and predatory catch are only partly reconcilable: To keep both as high as possible (72 and 60% of the maximum total and predatory catch, respectively), while keeping total and predator biomass above 60%, trophic level at first catch should be delayed to 2.6 at an exploitation rate of 0.3 while setting fishing mortality proportional to productivity (BHP/B).
Discussion
Potential Impacts of a Full Implementation of Balanced Harvest
The EcoTroph theoretical approach demonstrated that, neither balancing fishing mortality with productivity nor with production maintained the ecosystem structure. These results are in line with findings from other studies testing the impact of a BH fishing strategy (Law et al., 2014; Plank, 2018). When using productivity (P/B, dimensions time–1) as the measure to balance fishing mortality, the resulting exploitation rate – that is the part of the harvested production – is constant across trophic levels. Because losses in production due to fishing at the basis of the food-web will be propagated during trophic transfer, higher trophic levels experience higher biomass changes. This notion of “prey” loss has prompted the call for reducing the exploitation on lower trophic levels (Smith et al., 2011) and has been addressed by Froese et al. (2016) in their critical view on the BH concept. If we aim to maintain ecosystem structure, we must account for these cumulative losses by reducing the exploitation rate on higher trophic levels accordingly. In other words, expanding fisheries exploitation toward low trophic levels would necessarily come at the expense of catches from high trophic levels.
One proposal has been to set fishing mortality proportional to production (P, dimensions mass time–1). This implementation was very close but did not fully maintain ecosystem structure, which seems to be consistent with results from other studies (Law et al., 2014; Plank, 2018). An ideal distribution of fishing mortalities that maintained ecosystem structure varied depending on the fishing intensity as fishing directly impacted the productivity of each trophic level. Furthermore, because fishing also impacts TE (Maureaud et al., 2017) and top-down control strength (Cury and Shannon, 2004; Colléter et al., 2015), there simply might not be a general fishing pattern that maintains ecosystem structure. Then a steady adaptation of the fishing mortality using the information on production (mass time–1) becomes a crucial aspect of BH (Heath et al., 2017). This is important to keep in mind because BH is often referred to as a fishing strategy that can maintain ecosystem structure by balancing fishing mortality with some measure of productivity, often referring to P/B (Garcia et al., 2012; Burgess et al., 2015; Kolding et al., 2016c).
Here, we tested a BH fishing strategy in a theoretical ecosystem context using an abstract representation of an entire food chain, from primary producers to top predators. Our results indicate that although total catches might be very large, more than 70% and up to 90% (when balancing fishing mortality to production) of those catches will come from trophic levels between 2 and 2.5. This concentration of catches on very low trophic levels was even higher in another study testing BH using a Holling-Tanner model (95% in Plank, 2018). We tested not only different magnitudes of TE but also different distributions and we find that the percentage of the catch coming from lower trophic levels remains systematically very high. It must be noted though that in the EcoTroph model applied here, the TE does not change with the intensity of fishing. A starting point for future simulations could be to model different transfer efficiencies for the exploitable and unexploitable part of the ecosystem.
While it has been recognized that under a BH fishing strategy a large part of the catch would be comprised of forage fish and juvenile fish (Jacobsen et al., 2014; Law et al., 2016), we show that at an ecosystem scale our aquatic animal protein would mainly be coming from zooplankton, meiobenthos, and benthic invertebrates. In other words, if we want to fully maintain ecosystem structure, we will have to profoundly shift our consumer preferences from finfish to invertebrates and plankton.
Consequences of Balanced Harvest Under Imperfect Implementation
When BH is applied in situations where not all trophic levels are equally exploitable, we not only observe a higher disruption of the ecosystem structure but also an additional effect on the ecosystem: the increase in less or unexploitable biomass. Given the selective nature of fisheries, it is highly questionable that we will be capable of perfectly aligning fishing mortality with productivity for all species and size classes in the near future. These constraints for fisheries management are nothing new: species have different catchabilities that can emerge from different technical and species-specific biological aspects (e.g., morphology and behavior), leading to a mix of over and under harvested species in the catches (FAO, 2018; STECF, 2019). And yet, BH has been tested to date solely under the assumption of full implementation. We evaluated the impacts of a more realistic implementation, where only a fraction of lower and intermediate trophic levels is exploitable. One could imagine, however, that there is no clear trophic pattern in the exploitability of biomass to fisheries management, but that this effect holds only true at the species level and is masked when aggregating species with different exploitabilities. While our model outcomes are dependent on the trophic distribution of exploitability, we also demonstrate that qualitative results are robust to different trophic level mid-points.
We show that expanding exploitation toward trophic levels for which fishing mortality cannot be fully aligned to the productivity of each species (e.g., zooplankton or benthic invertebrates), will disrupt the balance between exploitable and non/less exploitable species at each trophic level. In this context, a BH approach facilitates the proliferation of the latter and induces structural changes in the food web that may not be detected by the overall ecosystem trophic structure. Humans, as any predator, are part of natural ecosystems and thus cannot live off the sea without leaving traces.
Best Fishing Strategy
One central aspect of the BH approach is to set fishing mortality proportional to productivity, to ensure sustainability. This aspect is consistent with FMSY, the usual target for sustainability, also relating to stock productivity. As a rule of thumb, Gulland suggested as early as in 1971 to set FMSY equal to natural mortality, and thus, under steady-state condition to 0.5⋅P/B.
The other – more controversial – idea of the BH approach is to call for an expansion of fisheries toward the widest possible range of species stocks and size classes. In our analysis, the overall impact on the ecosystem was lowest when only harvesting a few trophic levels (>4): less disruption of the ecosystem structure, less change in exploitable biomass and less impact on system and predator biomass. At the same time, such a fishing strategy ensured only very limited catches. On the other hand, our analysis confirms that fishing all trophic levels proportional to their productivity maximizes catch while minimizing the impact on the overall ecosystem structure (Jacobsen et al., 2014; Law et al., 2014; Zhou and Smith, 2017). This may justify expanding fisheries toward lower trophic levels, but our results also show that through cumulative effects, such an expansion increasingly impacts the biomass of high trophic levels.
Furthermore, the argued decrease in excessive fishing mortality, currently applied to many high trophic level species (Charles et al., 2016), might be sidelined in practice by the simple addition of new fishing mortalities to the current ones. In fact, fisheries management should prioritize the preservation of higher trophic level biomass because it has been shown that key species are likely to be found on the top of the food chain (Cury et al., 2003) and top predators can have stabilizing effects on the ecosystem and increase biodiversity (Rooney et al., 2006; Sergio et al., 2008). While we may better conserve the size or trophic structure of an ecosystem with a BH fishing pattern, the system could experience marked changes in species composition (i.e., loss in predator biomass and increase in less exploitable species), ultimately impacting biodiversity. The here presented modeling approach does not track the fate of a species and thus can only limitedly inform on the above presented aspects. Future efforts should be made to understand the changes in species composition and biodiversity including processes such as competition when fishing with a BH strategy.
Despite maintaining ecosystem structure, a central argument for a full BH implementation is the maximization of total catches. This supposedly serves to facilitate the SDG goal 2 aiming at increased food security (Zhou et al., 2019). The intention here is to shift away from the current harvest system which has been called relatively inefficient due to its concentration on the top of the food chain (Kolding et al., 2016a). Using the more productive lower trophic levels could be considered a priority for management given that the number of malnourished people in 2010 has been estimated at 1 billion (FAO et al., 2019), and that a further increase in the global population to 9 billion by 2050 is expected (Godfray et al., 2010). The fact that nutritional needs are present in many coastal communities around the world where enough fish catches are produced, however, highlights that maximizing catches would not necessarily increase food security (Hicks et al., 2019). It has also been demonstrated that in several developing countries nutritional needs could be met by only a portion of the current catches (Hicks et al., 2019). Most of the catch from those countries is, in fact, exported to developed countries (FAO, 2018): we fish in the south and consume in the north. This highlights that food security is determined by multiple factors, including food access, utilization, and distribution (Barrett, 2010) and not only fisheries production.
In addition, the projected increase in global animal protein demand is said to be driven by consumer preferences (Tilman and Clark, 2014). In industrial fisheries, the preference for and the high market value of large fish may call for balancing between total and predator catches. In our model, applying a BH approach to all trophic levels did not fulfill this goal. Lower trophic levels had to be protected to maintain a relatively high predator catch. That begs the question: who benefits from an expansion of fisheries toward the exploitation of all prey fish or even zooplankton? Since these resources are already exploited mainly by large industrial vessels (see for instance the krill fishing in Greenland), it may well be that such an expansion mainly serves industrial sectors like the fish meal industry. It most likely ensures the profitability of exploiting low value products caught in large quantities. More generally, this may call for a focus on more equitable rules in sharing and access to global fish production rather than on developing fishing strategies that intend to enlarge fisheries production indefinitely. Modifying marine ecosystems toward food production systems dominated by less exploitable biomass will further divide nature and human society.
Conclusion
Our analysis highlights that applying a BH fishing strategy could not maintain ecosystem structure. When setting fishing mortality proportional to productivity, the biomass of predators experiences negative cumulative effects due to prey loss. Because aligning fishing mortalities with the productivity of each species is currently unachievable in practice, BH must be tested under imperfect implementations. We show that although a BH approach let to reduced changes in ecosystem structure and large total catch, it also disrupted the balance between highly exploitable and less exploitable species at each trophic level. While the use of a steady-state virtual ecosystem is appropriate to explore the theoretical consequences of a BH strategy, future efforts need to evaluate BH and the here explored aspects with dynamic models representing real ecosystems.
From a practical point of view, there is a risk that efforts to implement BH will tend toward a broadening of the range of species fished rather than applying a moderate, balanced fishing mortality. Under such circumstances, it will likely lead to a net increase in fishing pressure on the ocean. Nutritional needs of a growing population should not be used to justify such an expansion toward an increased impact on marine ecosystems, since larger fisheries productions will not necessarily tackle food insecurity and malnutrition. Considering this and our inability in the near future to align fishing mortality with productivity calls for a precautionary approach: before expanding our current fisheries to the widest possible range, we should adequately manage those species that are currently harvested beyond their capacity to replenish.
Data Availability Statement
The original contributions presented in the study are included in the article/Supplementary Material; further inquiries can be directed to the corresponding author/s.
Author Contributions
DG and JR conceived and designed the research, and wrote the manuscript. JR performed the analysis. All authors contributed to the article and approved the submitted version.
Funding
This project was conducted in the frame of a Post-doc funded by the Region Bretagne in France (SAD1-2017 TrophMod), with the scientific support of the Nereus program Predicting Future Oceans funded by the Nippon Foundation.
Conflict of Interest
The authors declare that the research was conducted in the absence of any commercial or financial relationships that could be construed as a potential conflict of interest.
Acknowledgments
The authors thank Hubert du Pontavice for helpful comments.
Supplementary Material
The Supplementary Material for this article can be found online at: https://www.frontiersin.org/articles/10.3389/fmars.2020.00510/full#supplementary-material
Footnotes
- ^ Maximum catch here refers to the maximum catch generated without reducing the total or predator biomass below 60% of its virgin biomass.
References
Barrett, C. B. (2010). Measuring food insecurity. Science 327, 825–828. doi: 10.1007/978-3-319-55942-1_3
Bourdaud, P., Gascuel, D., Bentorcha, A., and Brind’Amour, A. (2016). New trophic indicators and target values for an ecosystem-based management of fisheries. Ecol. Indic. 61, 588–601. doi: 10.1016/j.ecolind.2015.10.010
Branch, T. A., and Hilborn, R. (2008). Matching catches to quotas in a multispecies trawl fishery: targeting and avoidance behavior under individual transferable quotas. Can. J. Fish. Aquat. Sci. 65, 1435–1446. doi: 10.1139/F08-065
Breen, M., Graham, N., Pol, M., He, P., Reid, D., and Suuronen, P. (2016). Selective fishing and balanced harvesting. Fish. Res. 184, 2–8. doi: 10.1016/j.fishres.2016.03.014
Bundy, A., Fanning, P., and Zwanenburg, K. C. T. (2005). Balancing exploitation and conservation of the eastern Scotian Shelf ecosystem: application of a 4D ecosystem exploitation index. ICES J. Mar. Sci. 62, 503–510. doi: 10.1016/j.icesjms.2004.12.008
Burgess, M. G., Diekert, F. K., Jacobsen, N. S., Andersen, K. H., and Gaines, S. D. (2015). Remaining questions in the case for balanced harvesting. Fish. Fish. 17, 1216–1226. doi: 10.1111/faf.12123
Charles, A., Garcia, S. M., and Rice, J. (2016). Balanced harvesting in fisheries: economic considerations. ICES J. Mar. Sci. 158, 950–950. doi: 10.1126/science.158.3803.950
Colléter, M., Walters, C. J., Gatti, P., and Gascuel, D. (2015). Including foraging arena and top-down controls improves the modeling of trophic flows and fishing impacts in aquatic food webs. Mar. Ecol. Prog. Ser. 534, 17–37. doi: 10.3354/meps11357
Cury, P., and Shannon, L. (2004). Regime shifts in upwelling ecosystems: observed changes and possible mechanisms in the northern and southern Benguela. Prog. Oceanogr. 60, 223–243. doi: 10.1016/j.pocean.2004.02.007
Cury, P., Shannon, L., and Shin, Y. (2003). “The functioning of marine ecosystems: a fisheries perspective,” in Responsible Fisheries in the Marine Ecosystem, eds M. Sinclair and G. Valdimarsson (Wallingford: CABI publishing), 103–123. doi: 10.1079/9780851996332.0103
FAO, IFAD, UNICEF, WFP, and WHO, (2019). The State of Food Security and Nutrition in the World 2019. Safeguarding Against Economic Slowdowns and Downturns. Rome: FAO.
Froese, R., Walters, C., Pauly, D., Winker, H., Weyl, O. L. F., Demirel, N., et al. (2016). A critique of the balanced harvesting approach to fishing. ICES J. Mar. Sci. 73, 1640–1650. doi: 10.1093/icesjms/fsv122
Garcia, S. M., Kolding, J., Rice, J., Rochet, M.-J., Zhou, S., Arimoto, T., et al. (2012). Reconsidering the consequences of selective fisheries. Science 335, 1045–1047.
Garcia, S. M., Rice, J., and Charles, A. (2016). Balanced harvesting in fisheries: a preliminary analysis of management implications. ICES J. Mar. Sci. 73, 1214–1225. doi: 10.1038/srep04684
Gasche, L., Gascuel, D., Shannon, L., and Shin, Y. J. (2012). Global assessment of the fishing impacts on the Southern Benguela ecosystem using an EcoTroph modelling approach. J. Mar. Syst. 90, 1–12. doi: 10.1016/j.jmarsys.2011.07.012
Gascuel, D. (2005). The trophic-level based model: a theoretical approach of fishing effects on marine ecosystems. Ecol. Model. 189, 315–332. doi: 10.1016/j.ecolmodel.2005.03.019
Gascuel, D., Guénette, S., and Pauly, D. (2011). The trophic-level-based ecosystem modelling approach: a theoretical overview and practical uses. ICES J. Mar. Sci. 68, 1403–1416. doi: 10.1093/icesjms/fsr062
Gascuel, D., Morissette, L., Palomares, M. L. D., and Christensen, V. (2008). Trophic flow kinetics in marine ecosystems: toward a theoretical approach to ecosystem functioning. Ecol. Model. 217, 33–47. doi: 10.1016/j.ecolmodel.2008.05.012
Gascuel, D., and Pauly, D. (2009). EcoTroph: modelling marine ecosystem functioning and impact of fishing. Ecol. Model. 220, 2885–2898. doi: 10.1016/j.ecolmodel.2009.07.031
Godfray, H. C. J., Beddington, J. R., Crute, I. R., Haddad, L., Lawrence, D., Muir, J. F., et al. (2010). Food security: the challenge of feeding 9 billion people. Science 327, 812–818. doi: 10.1126/science.1185383
Halouani, G., Gascuel, D., Hattab, T., Lasram, F. B. R., Coll, M., Tsagarakis, K., et al. (2015). Fishing impact in Mediterranean ecosystems: an EcoTroph modeling approach. J. Mar. Syst. 150, 22–33. doi: 10.1016/j.jmarsys.2015.05.007
Heath, M., Law, R., and Searle, K. (2017). Scoping the background information for an ecosystem approach to fisheries in Scottish waters: Review of predator-prey interactions with Fisheries, and Balanced Harvesting. A Study Commissioned by Fisheries Innovation Scotland (FIS). Available at: http://www.fiscot.org (accessed 12 June 2019).
Hicks, C. C., Cohen, P. J., Graham, N. A. J., Nash, K. L., Allison, E. H., D’Lima, C., et al. (2019). Harnessing global fisheries to tackle micronutrient deficiencies. Nature 574, 95–98. doi: 10.1038/s41586-019-1592-6
Jacobsen, N. S., Gislason, H., and Andersen, K. H. (2014). The consequences of balanced harvesting of fish communities. Proc. R. Soc. B Biol. Sci. 281:20132701. doi: 10.1098/rspb.2013.2701
Kolding, J., Bundy, A., Van Zwieten, P. A. M., and Plank, M. J. (2016a). Fisheries, the inverted food pyramid. ICES J. Mar. Sci. 69, 1226–1233. doi: 10.1093/icesjms/fss023
Kolding, J., Garcia, S. M., Zhou, S., and Heino, M. (2016b). Balanced harvest: utopia, failure, or a functional strategy? ICES J. Mar. Sci. J. du Cons. 69, 389–398. doi: 10.1093/icesjms/fss153
Kolding, J., Jacobsen, N. S., Andersen, K. H., van Zwieten, P. A. M., and Giacomini, H. (2016c). Maximizing fisheries yields while maintaining community structure. Can. J. Fish. Aquat. Sci. 73, 644–655. doi: 10.1139/cjfas-2015-0098
Kolding, J., Law, R., Plank, M. J., and Van Zwieten, P. A. M. (2014). “5.5 The optimal fishing pattern,” in Freshwater Fisheries Ecology, Ed. J. F. Craig (Hoboken, NJ: Wiley Blackwell), 1–24.
Law, R., Kolding, J., and Plank, M. J. (2013). Squaring the circle: Reconciling fishing and conservation of aquatic ecosystems. Fish Fish. 16, 160–174. doi: 10.1111/faf.12056
Law, R., Plank, M. J., and Kolding, J. (2012). On balanced exploitation of marine ecosystems: results from dynamic size spectra. ICES J. Mar. Sci. 69, 602–614. doi: 10.1093/icesjms/fss031
Law, R., Plank, M. J., and Kolding, J. (2014). Balanced exploitation and coexistence of interacting, size-structured, fish species. Fish Fish. 17, 281–302. doi: 10.1111/faf.12098
Law, R., Plank, M. J., and Kolding, J. (2016). Balanced exploitation and coexistence of interacting, size-structured, fish species. Fish Fish. 17, 281–302. doi: 10.1111/faf.12098
Maureaud, A., Gascuel, D., Colleter, M., Palomares, M. L. D., Palomares, M. L. D., Pontavice, H. D., et al. (2017). Global change in the trophic functioning of marine food webs. PLoS One 12:e182826. doi: 10.1371/journal.pone.0182826
Moullec, F., Gascuel, D., Bentorcha, K., Guénette, S., and Robert, M. (2017). Trophic models: What do we learn about Celtic Sea and Bay of Biscay ecosystems? J. Mar. Syst. 172, 104–117. doi: 10.1016/j.jmarsys.2017.03.008
Pauly, D., and Watson, R. (2005). Background and interpretation of the “Marine Trophic Index” as a measure of biodiversity. Philos. Trans. R. Soc. B Biol. Sci. 360, 415–423. doi: 10.1098/rstb.2004.1597
Plank, M. J. (2018). How should fishing mortality be distributed under balanced harvesting? Fish. Res. 207, 171–174. doi: 10.1016/j.fishres.2018.06.003
Rooney, N., McCann, K., Gellner, G., and Moore, J. C. (2006). Structural asymmetry and the stability of diverse food webs. Nature 442, 265–269. doi: 10.1038/nature04887
Salas, S., Chuenpagdee, R., Seijo, J. C., and Charles, A. (2007). Challenges in the assessment and management of small-scale fisheries in Latin America and the Caribbean. Fish. Res. 87, 5–16. doi: 10.1016/j.fishres.2007.06.015
Sergio, F., Caro, T., Brown, D., Clucas, B., Hunter, J., Ketchum, J., et al. (2008). Top predators as conservation tools: ecological rationale, assumptions, and efficacy. Annu. Rev. Ecol. Evol. Syst. 39, 1–19. doi: 10.1146/annurev.ecolsys.39.110707.173545
Smith, A. D. M., Brown, C. J., Bulman, C. M., Fulton, E. A., Johnson, P., Kaplan, I. C., et al. (2011). Impacts of fishing low-trophic level species on marine ecosystems. Science 333, 1147–1150. doi: 10.1126/science.1209395
Tilman, D., and Clark, M. (2014). Global diets link environmental sustainability and human health. Nature 515, 518–522. doi: 10.1038/nature13959
Zhou, S., Kolding, J., Garcia, S., Plank, M. J., Bundy, A., Charles, A., et al. (2019). Balanced harvest: concept, policies, evidence, and management implications. Rev. Fish Biol. Fish. 29, 711–733. doi: 10.1007/s11160-019-09568-w
Keywords: ecosystem impact of fishing, fisheries management, trophic modeling, fisheries selectivity, ecosystem structure
Citation: Rehren J and Gascuel D (2020) Fishing Without a Trace? Assessing the Balanced Harvest Approach Using EcoTroph. Front. Mar. Sci. 7:510. doi: 10.3389/fmars.2020.00510
Received: 24 March 2020; Accepted: 04 June 2020;
Published: 26 June 2020.
Edited by:
Athanassios C. Tsikliras, Aristotle University of Thessaloniki, GreeceReviewed by:
Tommaso Russo, University of Rome Tor Vergata, ItalyFabien Moullec, University of Hamburg, Germany
Copyright © 2020 Rehren and Gascuel. This is an open-access article distributed under the terms of the Creative Commons Attribution License (CC BY). The use, distribution or reproduction in other forums is permitted, provided the original author(s) and the copyright owner(s) are credited and that the original publication in this journal is cited, in accordance with accepted academic practice. No use, distribution or reproduction is permitted which does not comply with these terms.
*Correspondence: Jennifer Rehren, amVuLnJlaHJlbkBnbWFpbC5jb20=