 Anna Maria Dąbrowska
 Józef Mikołaj Wiktor Jr.
 Małgorzata Merchel2
 Józef Maria Wiktor
- 1Marine Protists Laboratory, Department of Marine Ecology, Institute of Oceanology Polish Academy of Sciences, Sopot, Poland
- 2Observational Oceanography Laboratory, Department of Physical Oceanography, Institute of Oceanology Polish Academy of Sciences, Sopot, Poland
The European Arctic is rapidly changing where increasing water temperatures and rapid loss of sea ice will likely influence the structure and functioning of the entire ecosystem. This study aimed to describe the taxonomic composition and spatial distribution of early summer (2015–2016) nano- and microplanktonic protists in the Nordic (Norwegian, Greenland) Seas and the Fram Strait (70.99°N to 78.84°N; 1.52°E to 19.90°E) and to determine the distribution patterns of the communities from the aspect of hydrography, as deduced from in situ measurements. Here we identify some generalized regularity in the protistan distribution, indicating the two separated domains at the 6°C threshold. While Phaeocystis seemed to be a fairly conservative representative of the colder area (<6°C), the taxonomic structure of the warmer waters (>6°C) may vary significantly between successive summers: from mostly Bacillariophyceae-dominated communities in 2015 to flagellate-dominated in 2016. Based on our results, we hypothesized that the more intense phototroph development in the area, as deduced from higher remotely sensed chlorophyll a concentrations in 2016, i.e., record warm year in the observational period, could lead to faster depletion of nutrients and, thus, an earlier shift into the post-bloom community stage. Taking into account the possible phenological shift toward early summer domination of flagellates in a warmer year, as well as a higher number of heterotrophic protists associated with the warmer domain in two evaluated summers, it is highly likely that climatic warming of this region will have an impact on energy transfer to higher trophic levels. Although generalized patterns could be elucidated, more information is needed to predict and understand how the changing Arctic will alter protistan communities and, thus, higher-order consumers.
Introduction
The Nordic Seas (Greenland, Iceland, and Norwegian Seas) cover a large area south and north of the Arctic Circle. They play an important role in the climate dynamics of the northern hemisphere, as the major transport route for fresh water and heat between the North Atlantic and the Arctic Ocean. Compared with other areas at its latitudes, this area has the strongest positive sea surface and air temperature anomalies (Drange et al., 2005). Since the 1990s, the temperature and salinity of the Atlantic water (AW) entering the Nordic Seas have rapidly increased (Holliday et al., 2008; Lauvset et al., 2018), leading to weaker ocean stratification and, in turn, intensified wintertime mixing (Latarius and Quadfasel, 2016; Bosse et al., 2018; Brakstad et al., 2019). The northward advection of warm AW not only affects the thermal conditions (Walczowski et al., 2012; Walczowski, 2014; Bosse et al., 2018) and the sea ice cover (e.g., Hansen et al., 2013) in the area but also determines the structure of pelagic communities (among others, Leu et al., 2011; Nöthig et al., 2015).
Planktonic protists represent the primary trophic level in marine ecosystems through which most of the biological material produced via photosynthesis (phototrophic protists) is further channeled through the food web (inter alia, by phagotrophic protists) to the higher-level consumers (Calbet, 2008). Due to their short lifetime and high reproductive rates, protists may be considered especially sensitive to environmental changes (Foissner and Hawksworth, 2009). Recent studies of the European Arctic protists have focused on how climate-driven alterations can drive modifications in the communities. So far, however, in situ determined relationships between environmental factors and protists are well-documented mainly for the West Spitsbergen fjords and the adjacent waters (e.g., Keck et al., 1999; Wiktor, 1999; Owrid et al., 2000; Piwosz et al., 2009, 2015; Hegseth and Tverberg, 2013; Kubiszyn et al., 2014, 2017; Smoła et al., 2017; Hegseth et al., 2019). Those studies have indicated several potential responses of protist communities to the ongoing environmental changes regarding shifts in species sizes toward pico- and nanoplanktonic organisms, promoting flagellates and reducing the share of microplanktonic primary producers during spring bloom period (Hegseth and Tverberg, 2013; Piwosz et al., 2015; Kubiszyn et al., 2017); functional structure with the prevalence of microplanktonic grazers (especially ciliates and dinoflagellates: Seuthe et al., 2011; Mayzaud et al., 2013; Kubiszyn et al., 2014); biogeographical patterns with the northward expansion of boreal species such as coccolithophores (Hegseth and Sundfjord, 2008; Dylmer et al., 2015); and phenology due to earlier ice breakup and onset of the phytoplankton bloom (Søreide et al., 2010; Hodal et al., 2012). However, more field observations are needed to ground reliable predictions of biotic/abiotic interactions in the age of the progressive Arctic warming. These data are also essential to support findings from previous primary production studies at the Atlantic–Arctic boundary based primarily on ocean color sensors and physically–biologically coupled models. For example, satellite remote sensing of chlorophyll a concentration in the Arctic is spatially and temporally limited and sensitive to cloudiness—a common feature of the spring–summer months. Thus, it needs to be supplemented and validated with a significant amount of in situ observations. This is all the more important that the recent studies revealed potential climate-generated changes in the productivity of the Atlantic–Arctic sector, including slight trends toward higher productivity in the eastern Fram Strait (Nöthig et al., 2015), a considerable influence of AW advected phytoplankton on the local in situ primary production (Vernet et al., 2019), and a shift in the summer months plankton composition from large diatoms toward Phaeocystis pouchetii and other small flagellates (e.g., Lalande et al., 2013; Nöthig et al., 2015).
The Arctic Experiment (AREX) cruises, performed during early summers 2015–2016, offered us the opportunity to sample protistan plankton and measure chlorophyll a in waters extended from the northern coasts of continental Norway to northwest Svalbard and covered the mainstream of the AW to the Arctic Ocean. This study attempts to provide a detailed insight into the Arctic planktonic protists of the open ocean at a time of warming northward water flow. The specific purposes of this study are (1) to describe the taxonomic composition and spatial distribution of the sizes and trophic (abundance) structures of summer (2015–2016) nano- and microplanktonic protists in the Nordic (Norwegian, Greenland) Seas and the Fram Strait and (2) to determine the distribution patterns of the communities from the aspect of hydrography, as deduced from in situ measurements. Due to the high spatial resolution of the research, as well as the investigation of both taxonomical and functional traits, the data presented herein represent an important contribution to the broadening of knowledge of the European Arctic communities.
Materials and Methods
Hydrography of the Area
The study site was located in the eastern Nordic Seas and the Fram Strait (70.99°N to 78.84°N; 1.52°E to 19.90°E). This area is open to the North Atlantic in the south and the Arctic Ocean in the north and is connected to the Barents Sea to the east; thus, a cauldron is formed in this area in which various water masses mix and transform (Rudels et al., 2015). Briefly, AW enters the Nordic Seas via the northern limb of the North Atlantic Current through the Greenland–Scotland Ridge and travels northward via two branches of the Norwegian Atlantic Current (Hansen and Østerhus, 2000); the major pathways of the AW entering the Nordic Seas are illustrated in Walczowski (2010). The colder, less saline western branch (the Faroe branch) of the Norwegian Atlantic Current is topographically guided from the Iceland–Faroe Front toward the Fram Strait (Walczowski, 2013). However, only a part of this joint AW flow between 77°N and 77°30′N continues into the Arctic Ocean; a significant amount recirculates directly within the Fram Strait and returns south to the Nordic Seas (Schauer et al., 2004). The warmer, more saline eastern branch of the AW (the Shetland branch) enters the Nordic Seas through the Faroe–Shetland Channel and continues north along the Norwegian shelf edge as the Norwegian Atlantic Slope Current. After passing northern Norway, this current divides (Beszczynska-Moller et al., 2012). One branch of the AW enters the Barents Sea as the North Cape Current (the Barents Sea Branch) and flows into the Arctic Ocean. The second branch, the West Spitsbergen Current (WSC), continues northward along the continental slope. This flow is also called the eastern branch of the WSC or the core of the WSC; correspondingly, the continuation of the Faroe branch linked with the oceanic frontal system is called the western branch of the WSC (Walczowski, 2013). These two currents and hydrological fronts related to both branches of the WSC create the dynamic borders of the region occupied by the AW—the Atlantic domain of the Nordic Seas. Both fronts separate the Atlantic-origin waters from the ambient, much colder and fresher water masses. Between Bear Island and Sørkapp, the frontal line is complicated because part of the AW circulates cyclonically and mixes with waters from the Barents Sea (Walczowski, 2013). In this region, the Bjørnøya Current (Barents Current) maintains the front on the right, shallow-water side. The current carrying the cold and less saline waters around the southern Spitsbergen tip, which originates mostly from the East Spitsbergen Current, is often called the Sørkapp Current or the South Cape Current, whereas the flow over the western Spitsbergen shelf is called the Coastal Current (Saloranta and Svendsen, 2001). On the West Spitsbergen Shelf, the freshwater input from the glaciers and rivers makes an additional hydrographic contribution.
Data Collection
Biological and environmental data were collected during two (2015–2016) summer expeditions on the r/v Oceania as part of the AREX program led by the Institute of Oceanology Polish Academy of Sciences (IO PAN; Figure 1). The sampling stations were distributed along several zonal sections, crossing the continental shelf break and extending toward the deep basin. On the eastern side, the stations were limited by the Barents Sea shelf break and the shelf area west and north of Svalbard, and they covered the eastward flow of AW to the Barents Sea. To the west, the transect crossed the Arctic Front. Sampling was performed at 35 stations in 2015 and 31 stations in 2016 starting from continental Norway and extending toward the north. In both years, the sampling dates were similar and occurred at approximately the same times (June 20, 2015–July 14, 2015; June 22, 2016–July 16, 2016); the coordinates of the stations and the dates of sample collection in individual summers are available online as Supplementary Data 1. The seawater sampling was preceded by measuring the temperature and salinity of the upper (50 m) water column using a conductivity, temperature, depth (CTD) probe (Sea-Bird 911+), equipped with in situ fluorometer sensor (Seapoint Sensors Inc.). Seawater samples for analysis of the protist community, as well as the chlorophyll a, were collected using 10-L Niskin bottles from depths of 5, 15, 25, 35, and 50 m.
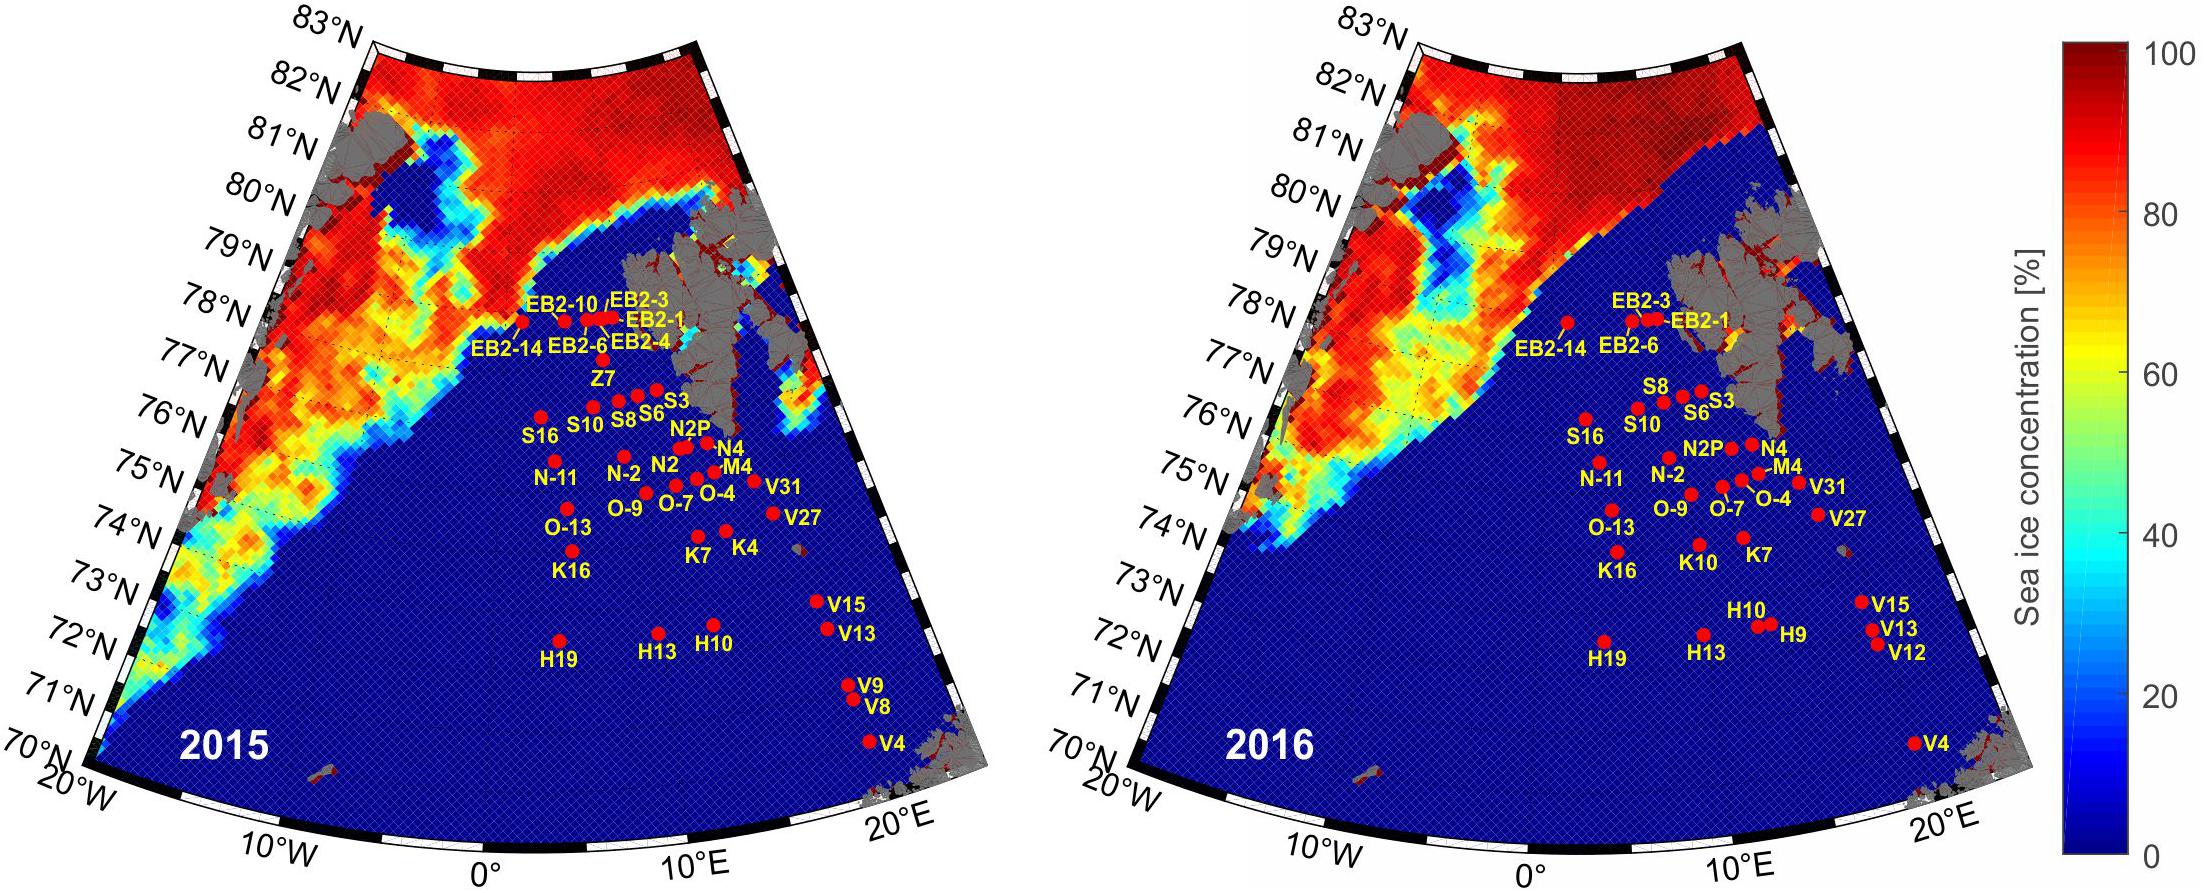
Figure 1. The sampling station locations in the summers of 2015 and 2016. The satellite remote sensing sea ice concentration data (5-day median calculated for a sampling day closest to the ice) were obtained from https://nsidc.org/ (Cavalieri et al., 1996, updated yearly).
Chlorophyll a Analysis
Water subsamples (250–400 ml) were analyzed in triplicate, as described by Holm-Hansen and Riemann (1978). The subsamples were filtered through Whatman GF/F filters, folded, wrapped in aluminum foil and immediately frozen at −80°C. Pigment extraction was performed in 10 ml of 90% acetone for 20–24 h in a cool (4°C), dark location no later than 4 months after sampling. The chlorophyll a concentrations (mg m–3) were measured with a Trilogy fluorometer (Turner Designs, model no. 7200-000; calibrated with pure chlorophyll a, Sigma S6144) and averaged for the upper 50-m water column using a weighted average with weights adjusted to the thickness of the layer.
Protist Community Analysis
Protist samples were collected from discrete depths (5, 15, 25, 35, and 50 m) and immediately physically integrated into one sample (volume of 200 ml) representing the mean community structure (cells in m3) for the upper 5–50-m water column. For this purpose, samples were mixed in proportion to the vertical extent of water they represent, according to the formulas given in Möller and Bernhard (1974). The integrated samples were fixed with an acidic Lugol’s solution and, after 24 h, with glutaraldehyde (Edler and Elbrächter, 2010). The fixatives were added to final concentrations of 2 and 1%, respectively. Samples were qualitatively and quantitatively analyzed according to the protocols described by Utermöhl (1958) and modified by Edler (1979). For this purpose, 10–50-ml subsamples were poured into the sedimentation chambers for 24 h, and then the protists were counted under an inverted microscope equipped with phase and interference contrasts (Nikon Eclipse TE-300). Nanoplanktonic cells (3–20 μm) were counted at 400× magnification by moving the field of view along the length of three transverse transects. For the most numerous taxa, we counted up to 50 specimens, and the number of fields of view was considered individually. Taxa were identified to the lowest possible taxonomic level. The taxonomic system presented in the World Register of Marine Species (WoRMS) was considered. Except for the indeterminate flagellates (Flagellate indet.: classified as mono- and biflagellates, up to 13 μm), each taxon was classified as one major taxonomic group (class or phylum). Thereafter, they were classified into nanoplanktonic and microplanktonic fractions. As Lugol’s fixative precluded feeding strategy identification, we use the data available in the literature and the Nordic Microalgae web base1, which was developed and operated by the Swedish Meteorological and Hydrological Institute (SMHI), to distinguish taxa with different modes of nutrition. Because we could not determine the mixotrophs, taxa were categorized as phototrophs (for which chloroplasts can be reproduced in an individual) and heterotrophs, analogously to the classification provided in Kubiszyn et al. (2014, 2017). When the taxa could not be identified at the species level and the trophic mode was not evident, the contribution from phototrophy or heterotrophy could not be determined. Hence, these taxa were classified into a separate group of unknown feeding mode.
Statistical Analysis of the Community
We used the R statistical environment, version 3.4.3 (R Core Team, 2017), and the Vegan 2.4-3 library: Community Ecology Package for R (Oksanen et al., 2017) for all of the statistical analyses. All plots were created with the ggplot2 package in R (Wickham, 2016), except for the temperature and salinity data, which were analyzed and illustrated using MATLAB. To determine the differences in the variability in protist community composition (2-year abundance data), we used permutational NP-MANOVA (multivariate analysis of variance) (as implemented in the Adonis function in the Vegan package; Oksanen et al., 2017), which is a non-parametric permutational and multidimensional equivalent of ANOVA and uses the Bray–Curtis distance metric, which is interpreted as a dissimilarity measure. To determine the transition temperature for the communities expressing the largest intergroup to intragroup variance in the protist community structure, we evaluated the R2 of the different splitting values ranging from 3 to 7°C with a 0.5°C step; the highest R2 value marks the best splitting. Community types were determined based on their mutual similarity levels using k-means. The number of groups was estimated by applying the k-means procedure to the data with different k-values and determining the goodness of fit (homogeneity of the resulting groups). The k-value after which the goodness of fit decreased was selected.
Results
Hydrography
The analysis of the CTD data from the upper (50 m) water layer demonstrated that the mean seawater temperature and salinity for the whole region were slightly higher in 2016 than in 2015 (+0.29°C and +0.045, respectively); the warmer conditions in 2016 were also reflected in the less sea ice concentrations in this area (Figures 1, 2A,B). In both years, the maximum seawater temperature was observed close to northern Norway at an area represented by station V4 (7.47°C in 2015 and 7.80°C in 2016), while the minimum temperature was recorded south of Spitsbergen (at the sampling station V27–1.21°C in 2015 and 3.00°C in 2016). The spatial distributions of water temperature and salinity characterized the AW transformation during its northward flow. In the southern part of the investigated area (south of Bear Island, <74.5°N), the water was warmer and more saline, with mean temperatures of 6.17°C in 2015 and 5.91°C in 2016 and salinities of 34.97 in 2015 and 34.92 in 2016 compared with the values of 4.13 and 4.88°C and 34.69 and 34.87 in the north (>74.5°N) in 2015 and 2016, respectively. Regarding the longitudinal aspect, the water temperature increased from west to east, except the West Spitsbergen Shelf (Figure 2A), where colder and less saline waters were observed, especially in 2015. The higher mean temperature and salinity along the western coast of Spitsbergen in 2016 (+1.5°C and +0.3, respectively) likely resulted from the weaker on-shelf advection of the Sørkapp Current, carrying cold and relatively fresh waters from the Barents Sea.
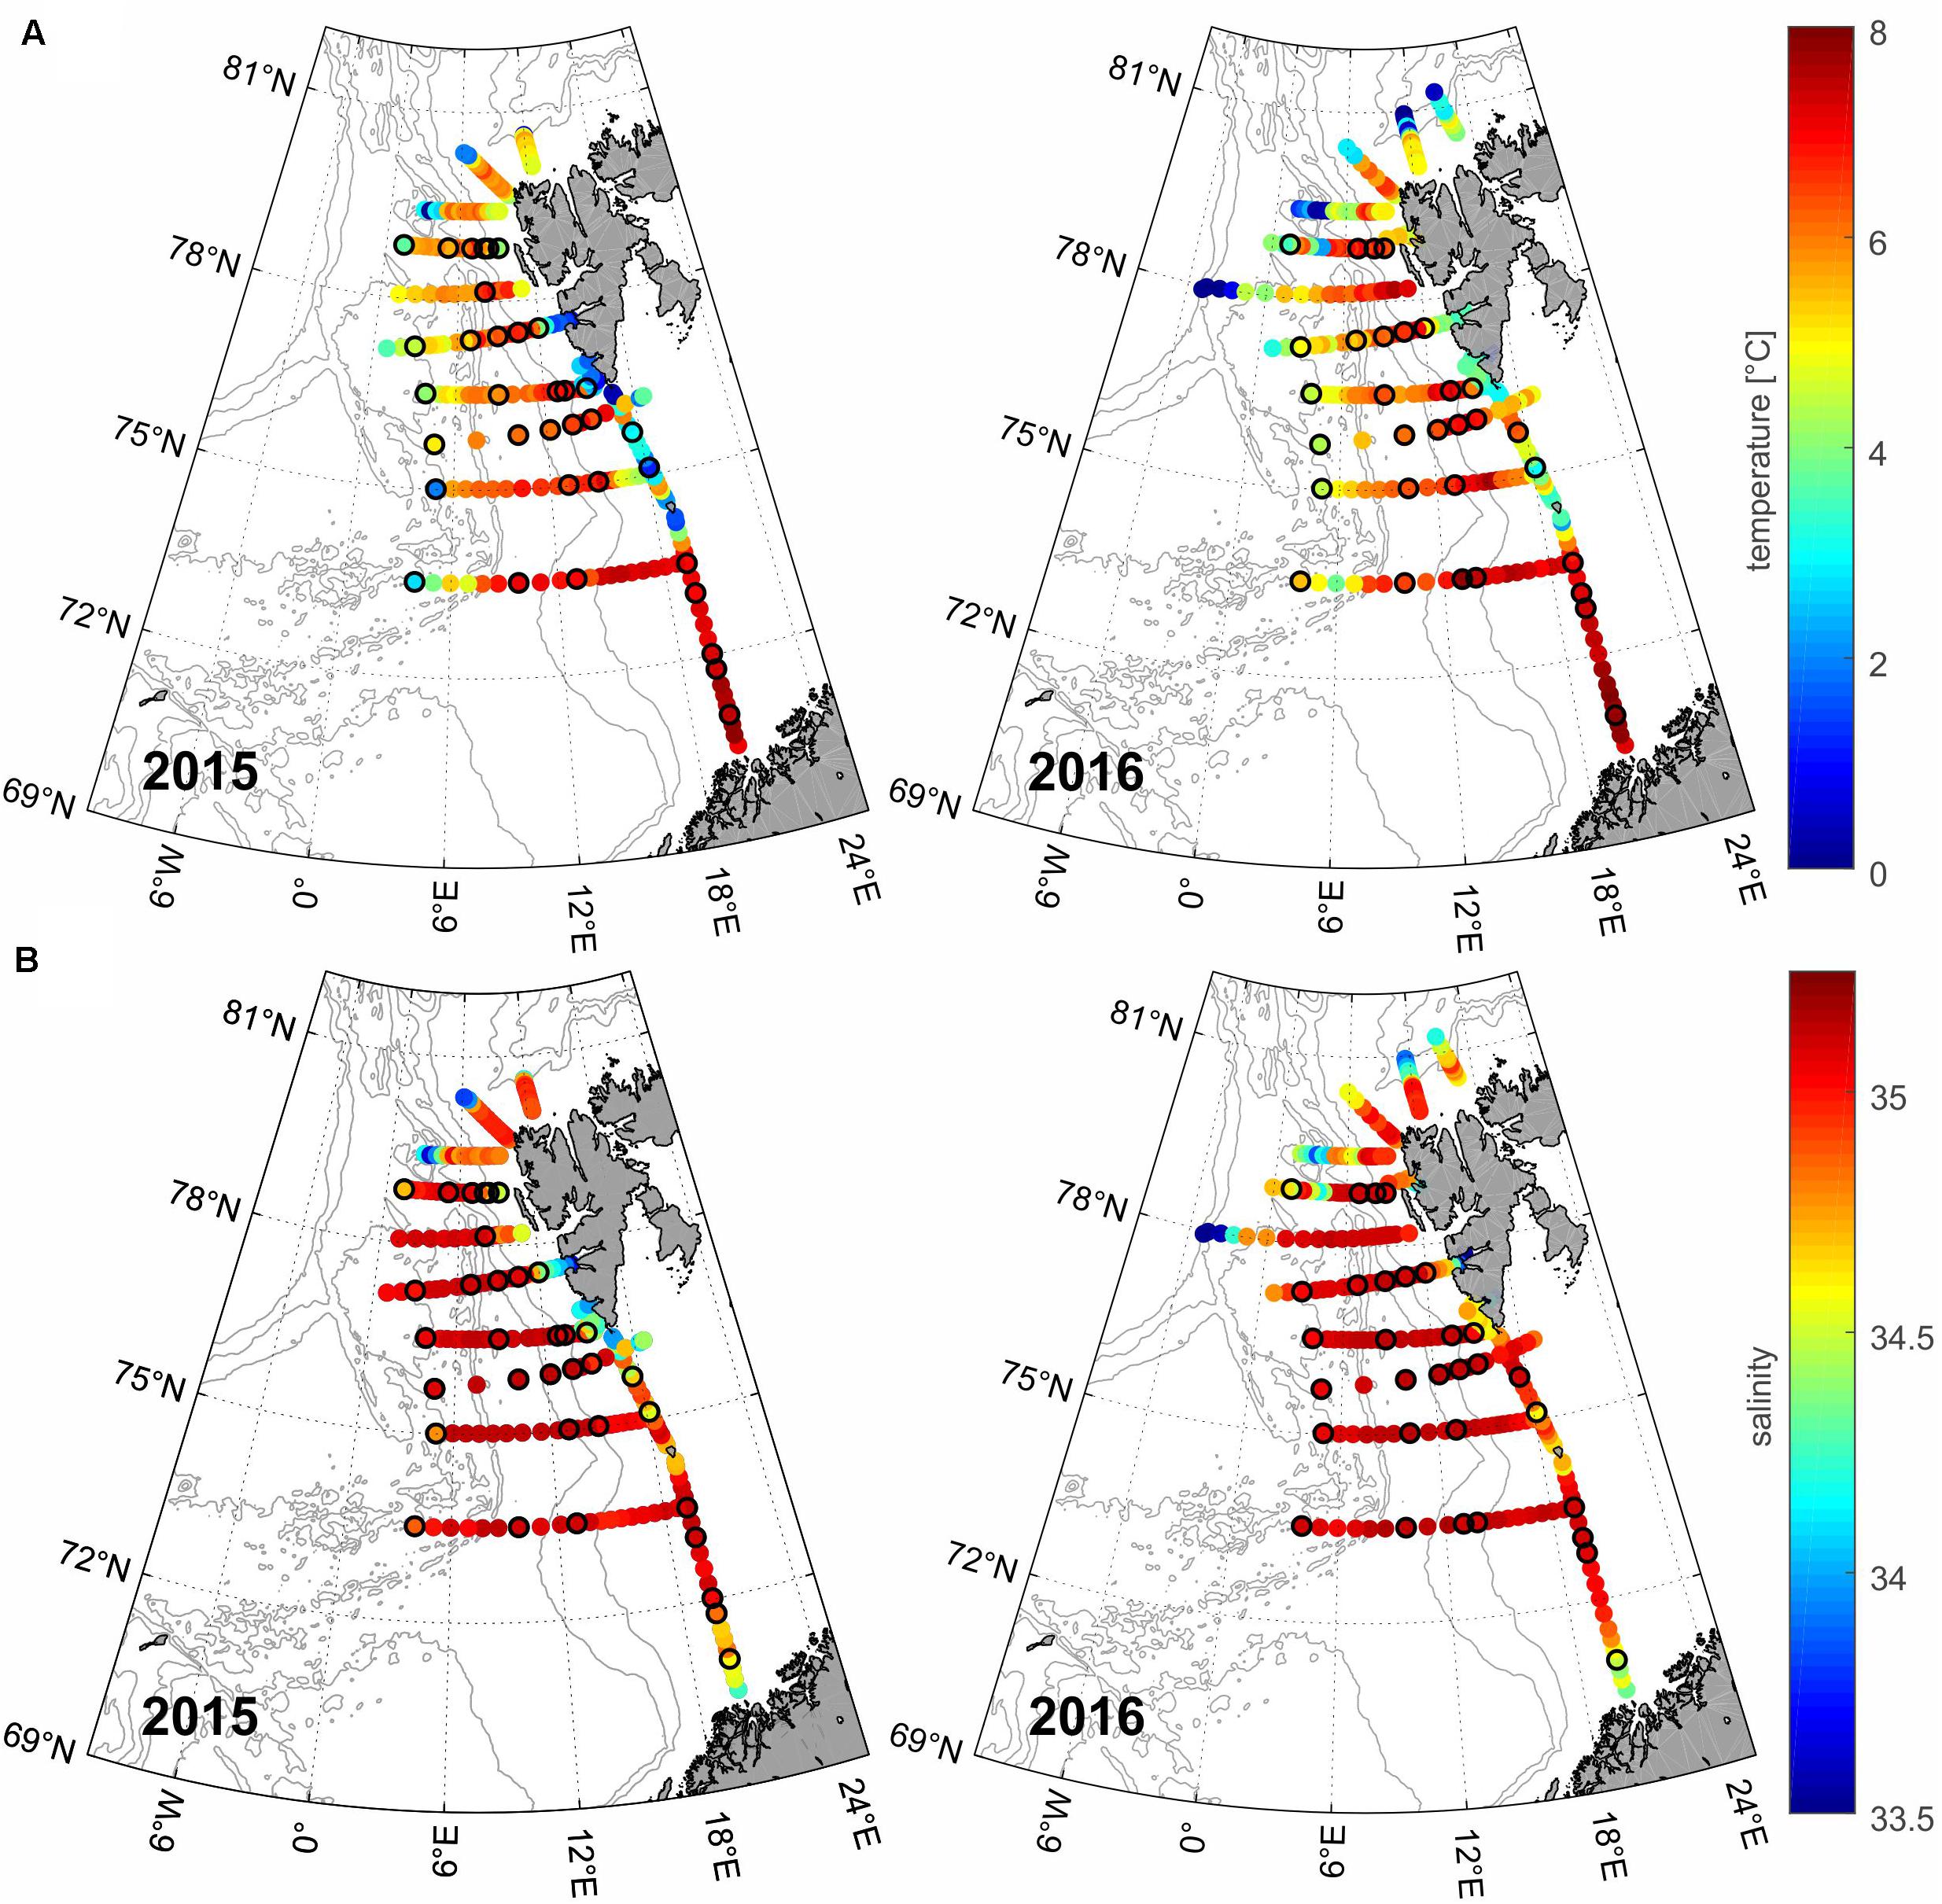
Figure 2. Temperature [°C] (A) and salinity (B) of seawater (values averaged for the upper 50-m water column) in the area in 2015 and 2016. Colored circles correspond to the conductivity, temperature, depth (CTD) stations of the Arctic Experiment (AREX) cruises; circles with additional black frame indicate the plankton stations.
Planktonic Protists
Qualitative Composition
During both campaigns (35 samples in 2015 and 31 in 2016), 153 taxa were detected (109 in 2015, 125 in 2016), and most of them were determined to the species level (Table 1; a complete list of taxa is available online as Supplementary Data 2). Regarding taxonomic composition, plankton consisted of 12 major groups of which Bacillariophyceae were the most biodiverse (39.87% of all taxa), followed by Dinophyceae (32.03%) and Ciliophora (14.38%). Among the other groups, only Prymnesiophyceae exceeded 5% (Table 1). Indeterminate mono- and biflagellates (up to 13 μm) were also found.
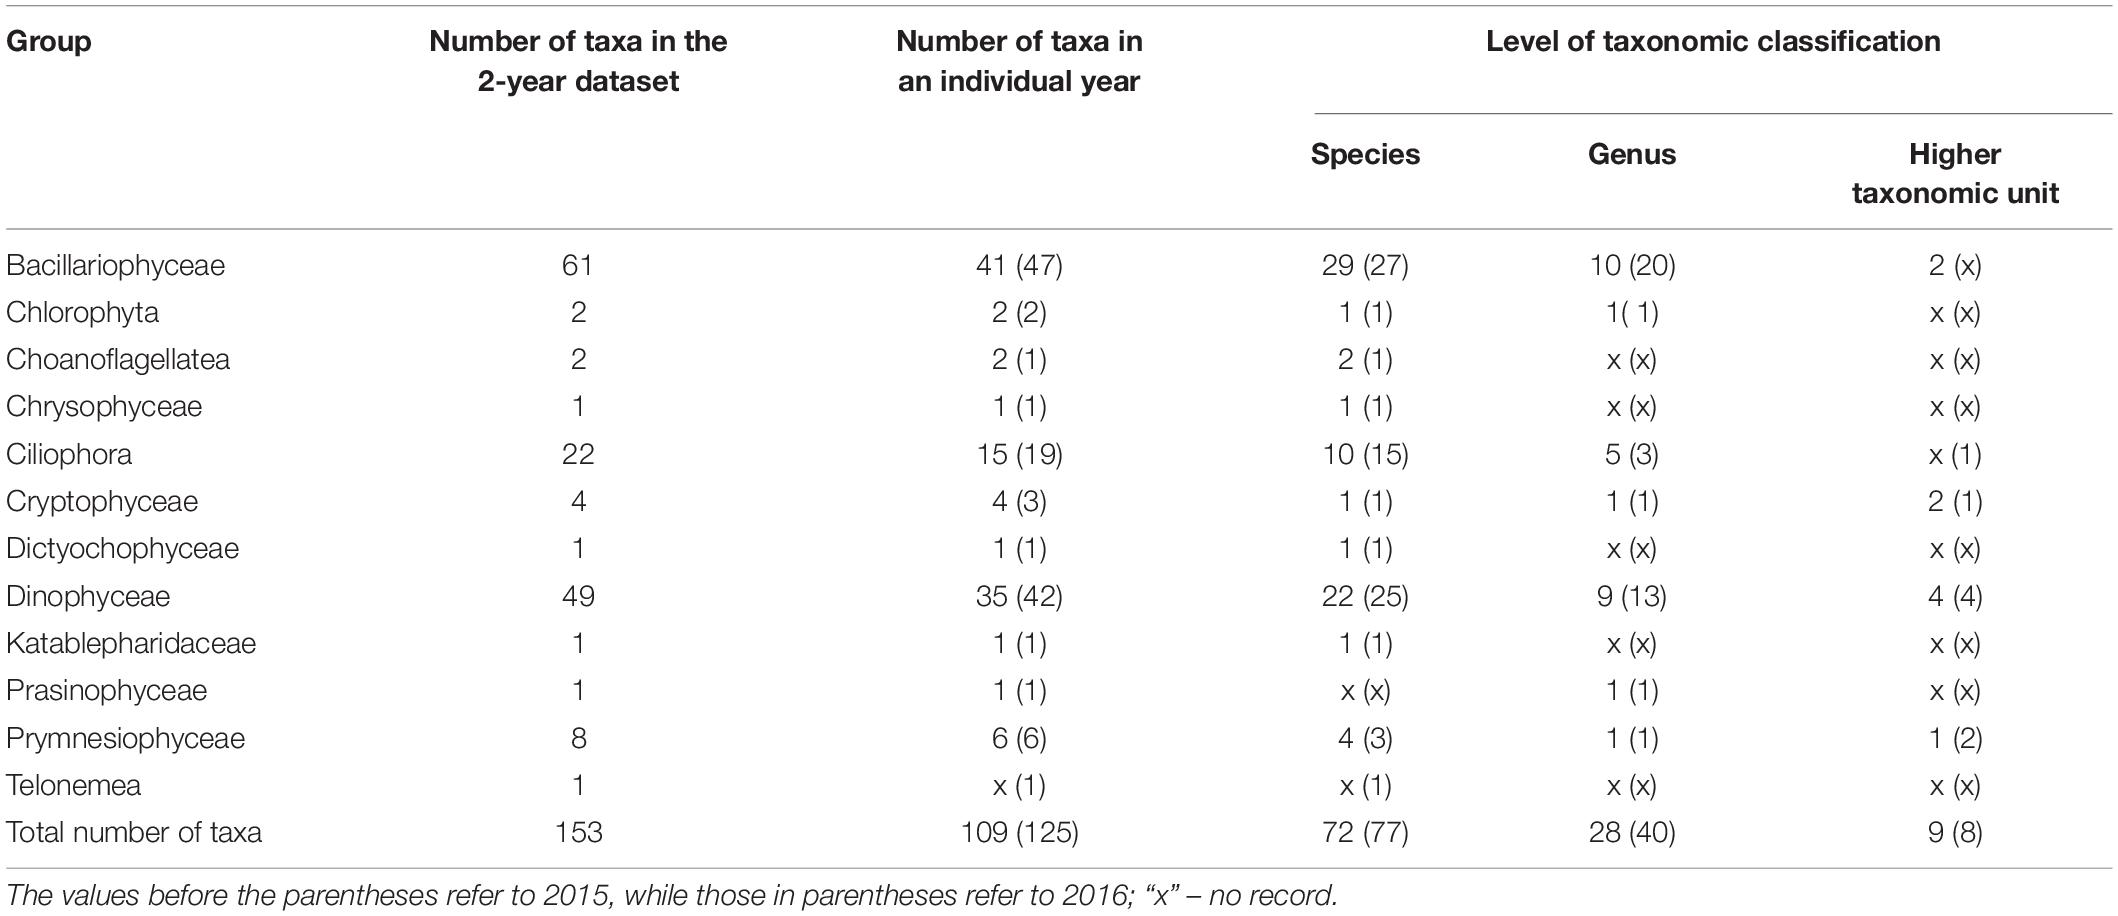
Table 1. The number of taxa of individual protist groups observed in the study according to the different taxonomic classification levels.
Chlorophyll a and Fluorescence
We observed substantial spatial variation in the chlorophyll a concentrations in both summers (Figure 3A). In 2015, the highest chlorophyll values occurred in the eastern and western frontal zones at stations N-11 and V31 (4.67 mg m–3 and 3.18 mg m–3, respectively). Relatively high values (>1.24 mg m–3) were noted in the area represented by station M4, as well as the O section and partially (N-11, N-2, N2) the N section. Distinctly low values (0.06–0.79 mg m–3) were observed along the S and EB2 profiles, as well as at stations N2P and N4.
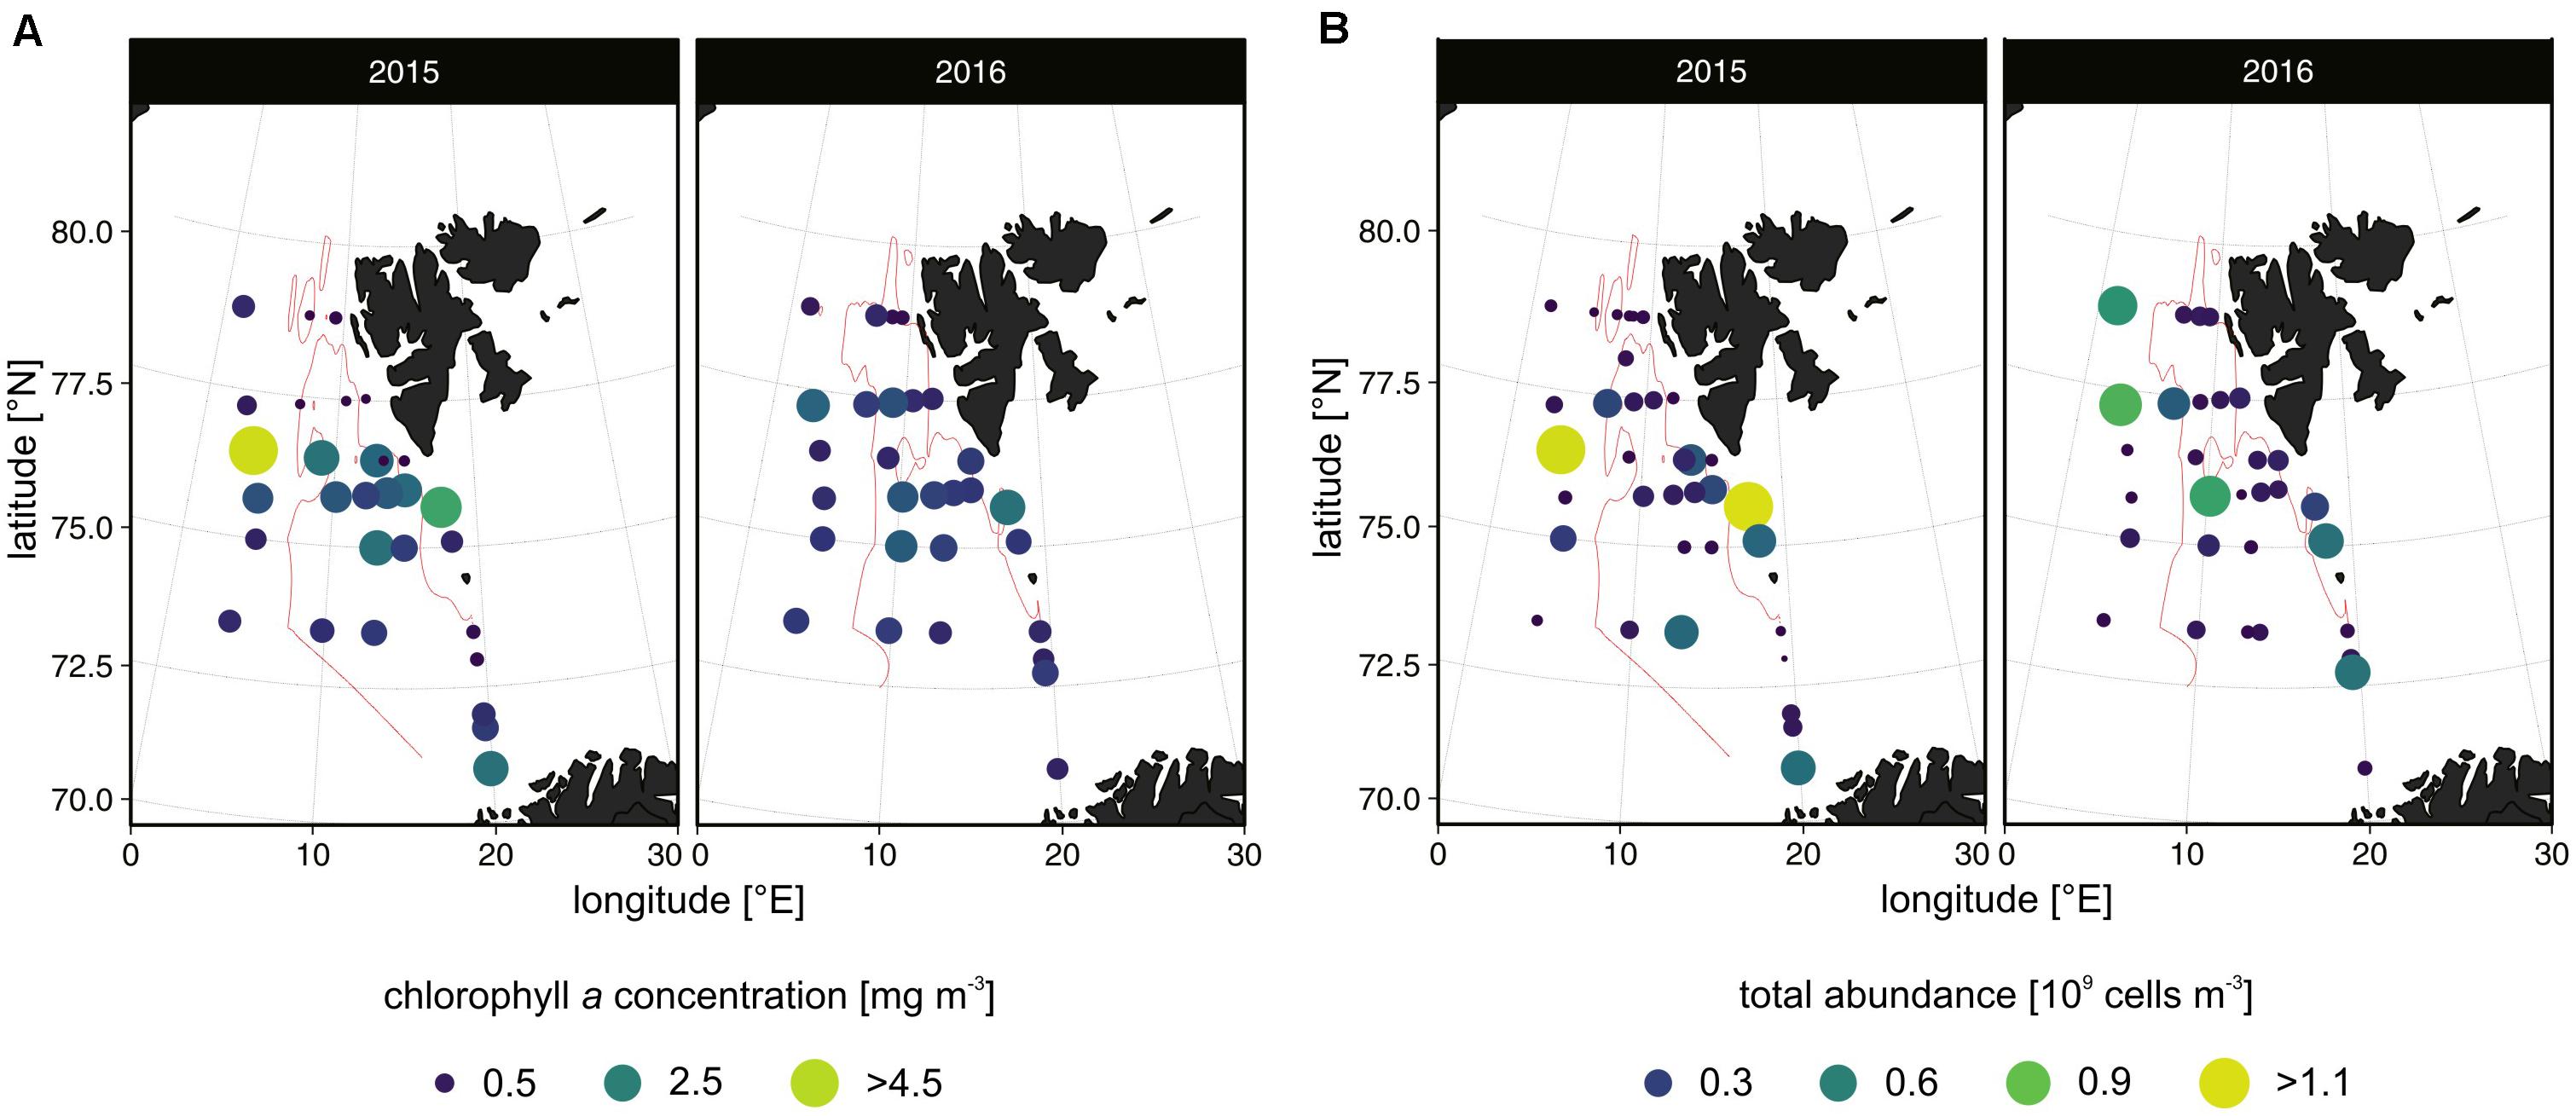
Figure 3. The extracted chlorophyll a concentrations [mg m– 3] (A) and total protist abundance [109 cells m– 3] (B) at the stations in the summers of 2015 and 2016. Only values higher than 0.5 mg m– 3 and 0.3 × 10⁹ cells m– 3 are included in the legend. The 6°C isotherm is marked with the solid line (also in Figure 6C).
In 2016, the chlorophyll a concentrations ranged from 0.23 mg m–3 (EB2-1) to 2.26 mg m–3 (V31). Generally, high values were observed in the regions of the H, K, and O sections and stations V27 and M4 (72.5–76°N) and in the north throughout the S section. Similar to 2015, low values occurred along the EB2 section.
The in situ chlorophyll a fluorescence generally corresponded with the values of extracted chlorophyll a concentrations (Supplementary Data 3). In 2015, the deepest (>35 m) fluorescence maxima were observed in the area represented by stations O-7, N-11, V31, and K16, whereas in 2016, at V27, V15, N2P, and N-2. In 2015, the shallowest (<15 m) chlorophyll a maxima were found at stations V13 and V27, while in 2016, they were found at N4, H13, K7, O-7, and V13.
Cell Numbers and Species Distribution
Considering the entire investigated period, there were no significant differences in protist community composition (abundance data) with respect to latitude (NP-MANOVA, R2 = 0.021, p = 0.085) even though the communities displayed different patterns of latitudinal variability in both years (interaction term between latitude and year in NP-MANOVA, R2 = 0.074, p = 0.001). The largest intergroup to intragroup protist community structure variance occurred at the 6°C threshold (Figure 4).
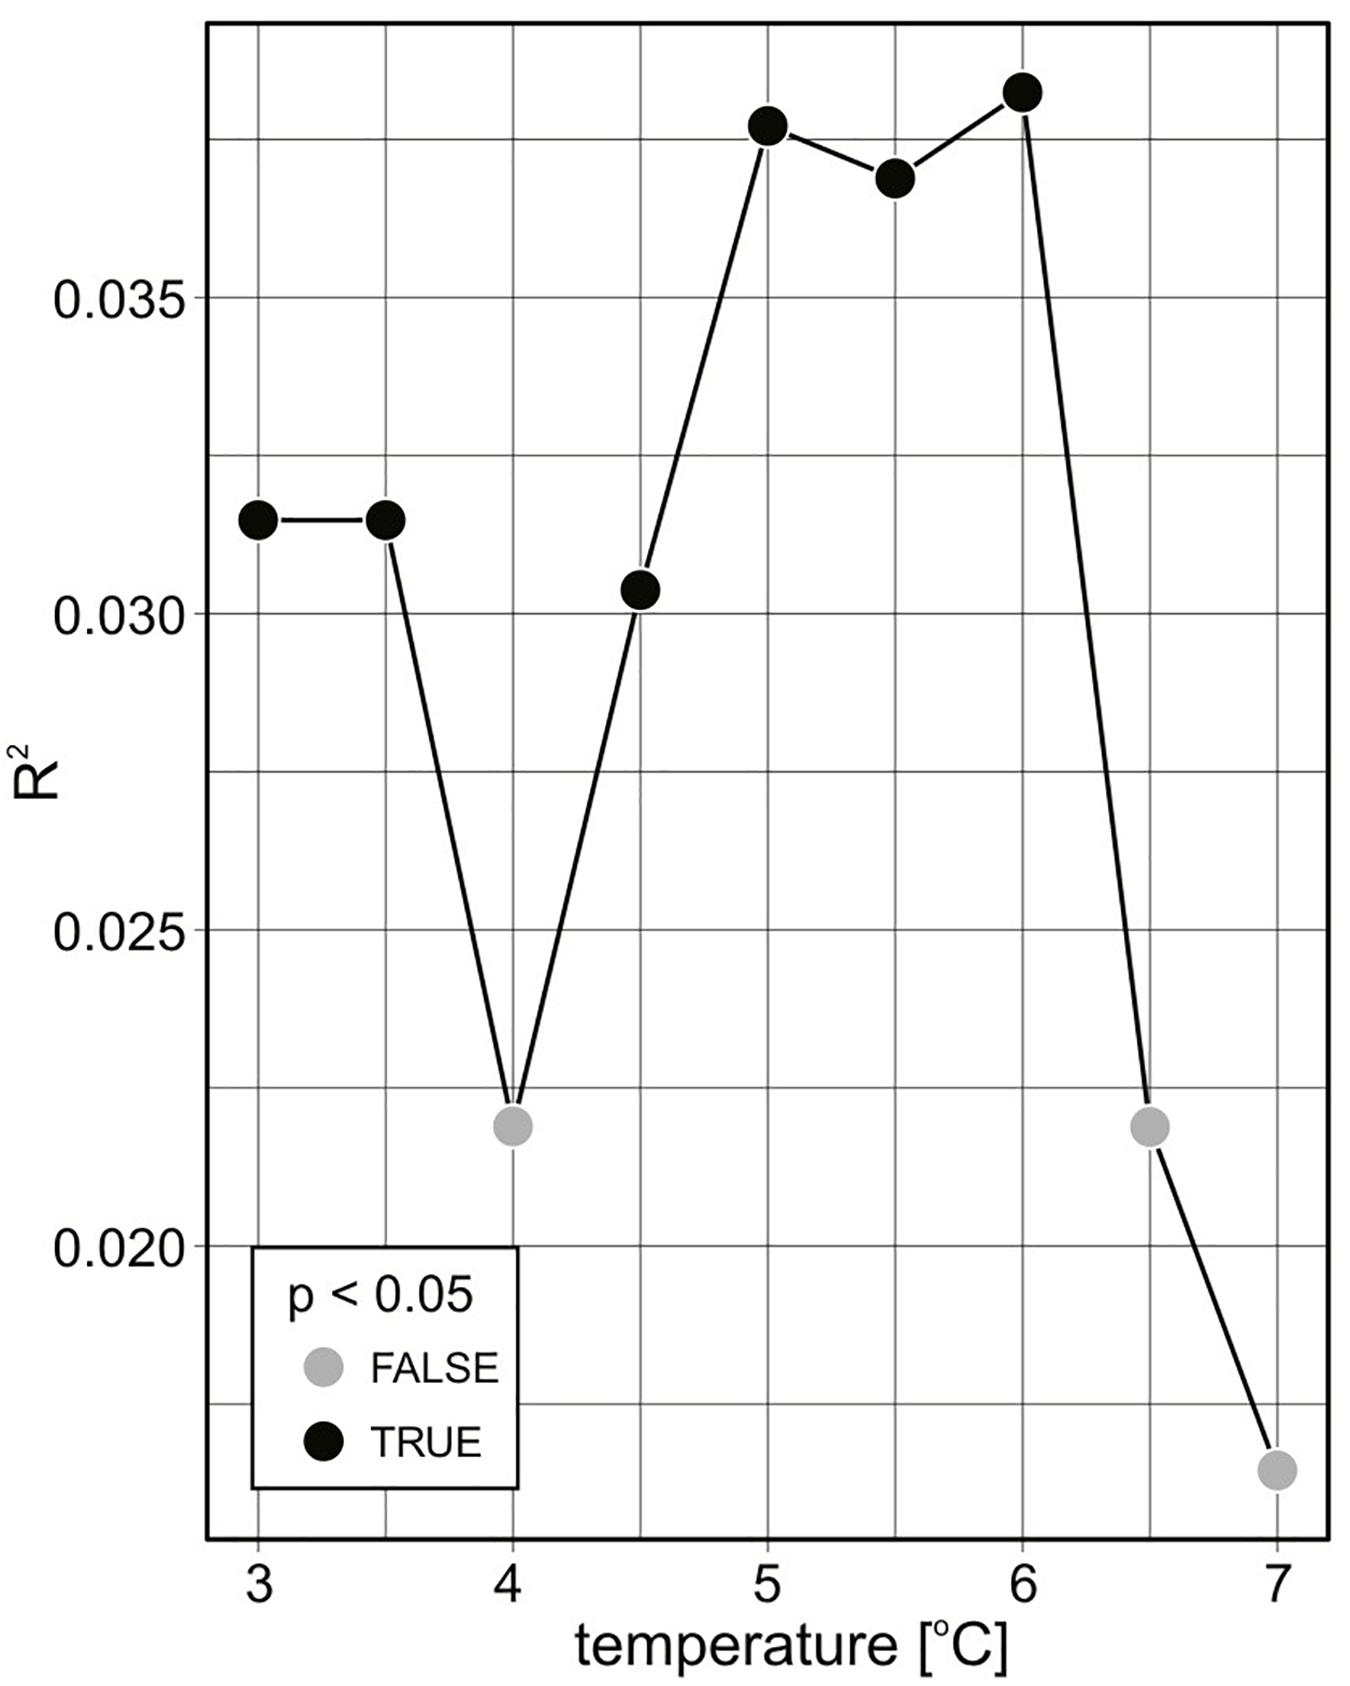
Figure 4. Differences in protist community composition variability (2-year abundance data) in various seawater temperatures [°C] expressed using NP-MANOVA R2 and p-values.
In both summers, the protistan communities, dominated by nanoplankton, were characterized by considerable spatial variability in the qualitative and quantitative (size and trophic) structures (Figures 3B, 5A). While the share of heterotrophs was higher in the warmer domain in both analyzed years, the contribution of phototrophs varied inter-annually (2015 vs 2016). In 2015, phototrophs were more abundant in warmer waters mainly due to numerous (mostly microplanktonic) Bacillariophyceae, while in 2016—in colder waters primarily because of high numbers of nanoplanktonic Prymnesiophyceae (Figures 5B,C).
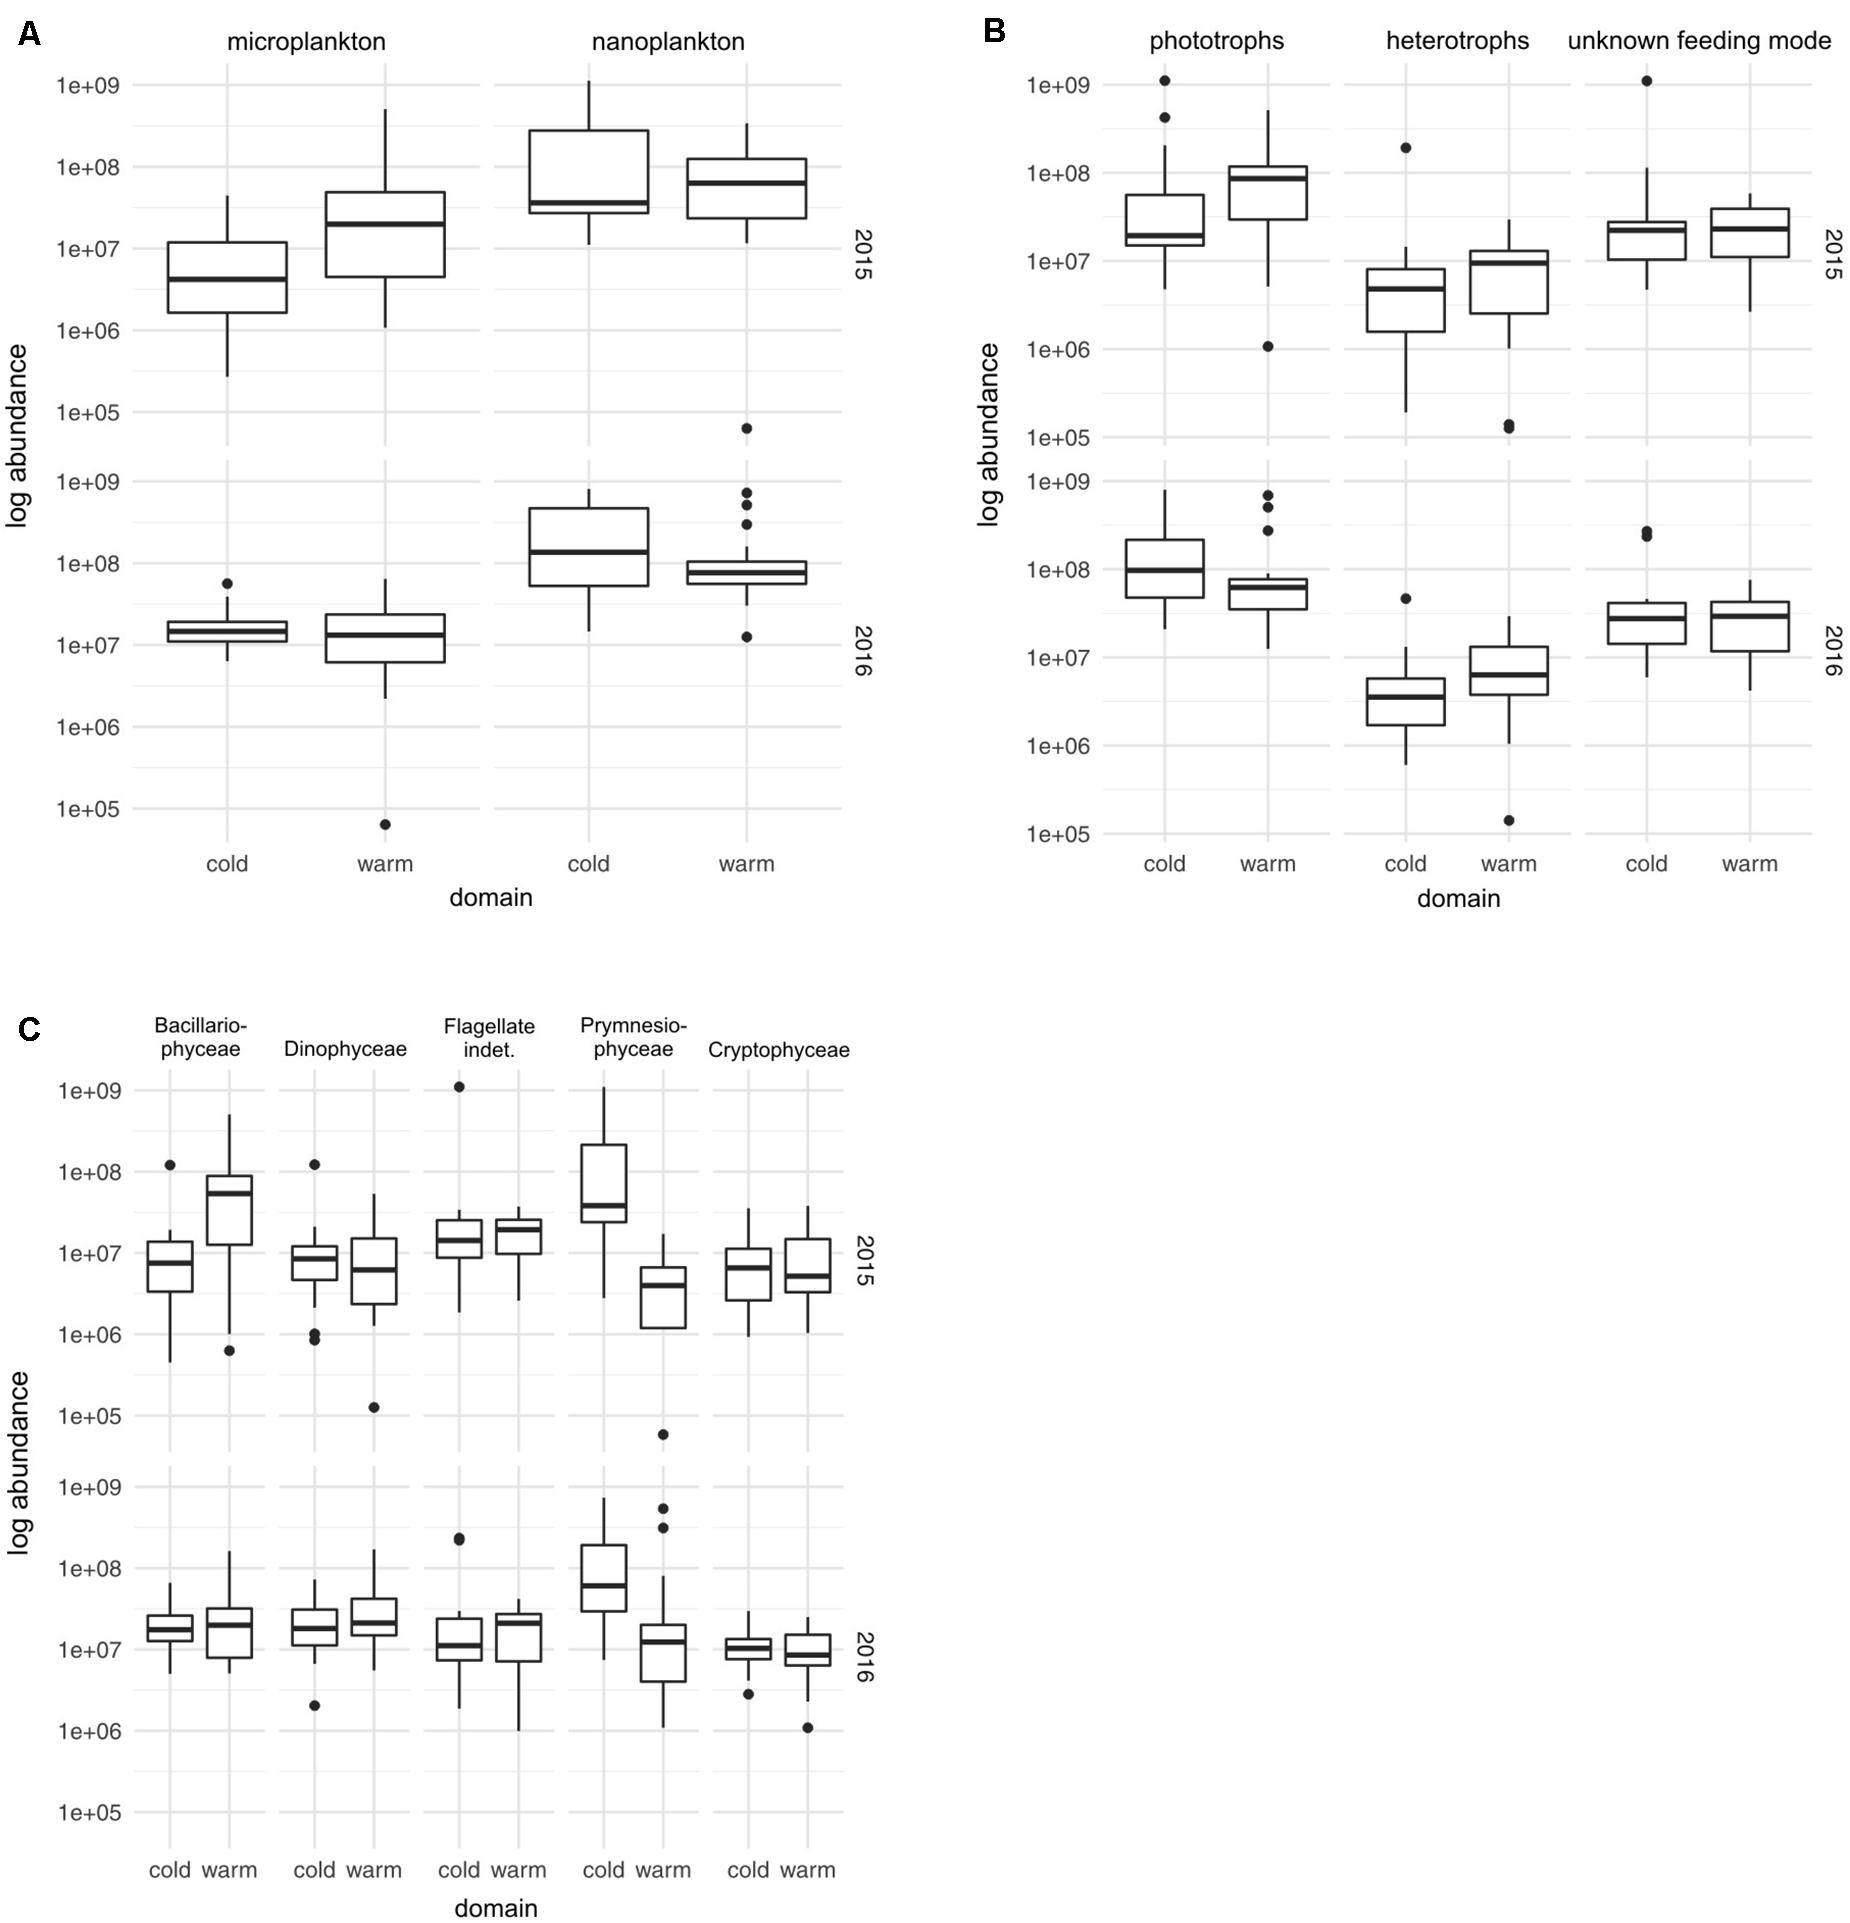
Figure 5. Box plots of the abundance (a log scale) of nanoplanktonic and microplanktonic protists (A), of phototrophs, heterotrophs, and protists with unknown feeding mode (B) and of the major protist groups (>5% of the total protist abundance) (C) recorded in the colder and warmer water domains (at a 6°C threshold) in the summers of 2015 and 2016.
In 2015, the highest abundances were observed at the sampling stations V31 (1.14 × 10⁹ cells m–3) and N-11 (1.13 × 10⁹ cells m–3) mainly due to the numerous indeterminate biflagellates (3–7 μm) of unknown feeding mode (96.84%) and phototrophic P. pouchetii (97.78%), respectively (Figure 3B; the percent contributions of all taxa to the total abundance at individual sampling stations are available online as Supplementary Data 2). The relatively high abundances (>2.70 × 10⁸ cells m–3) were also noted in descending order in the regions represented by stations V4, H10, V27, N2P, M4, S10, and K16 (Figure 3B). At areas of sampling stations V4, H10, N2P, and M4, the total abundance was dominated by Bacillariophyceae (77.66–97.76%; Figure 6), especially Pseudo-nitzschia cf. pseudodelicatissima, Thalassiosira spp. of size class 10–30 μm, and Eucampia groenlandica. At station V27, the community was predominated by P. pouchetii (79.78% of the overall abundance), whereas further north at station S10, the community was composed of Dinophyceae (mainly Gymnodinium sp. 5–10 μm, Prorocentrum minimum, and indeterminate thecate species of size 10–20 μm), and Bacillariophyceae (Pseudo-nitzschia cf. pseudodelicatissima, Thalassiosira spp. 10–20 μm) (approximately 36% of each group). In turn, at station K16, the dominant group was Choanoflagellatea (Monosiga marina; 71.11%).
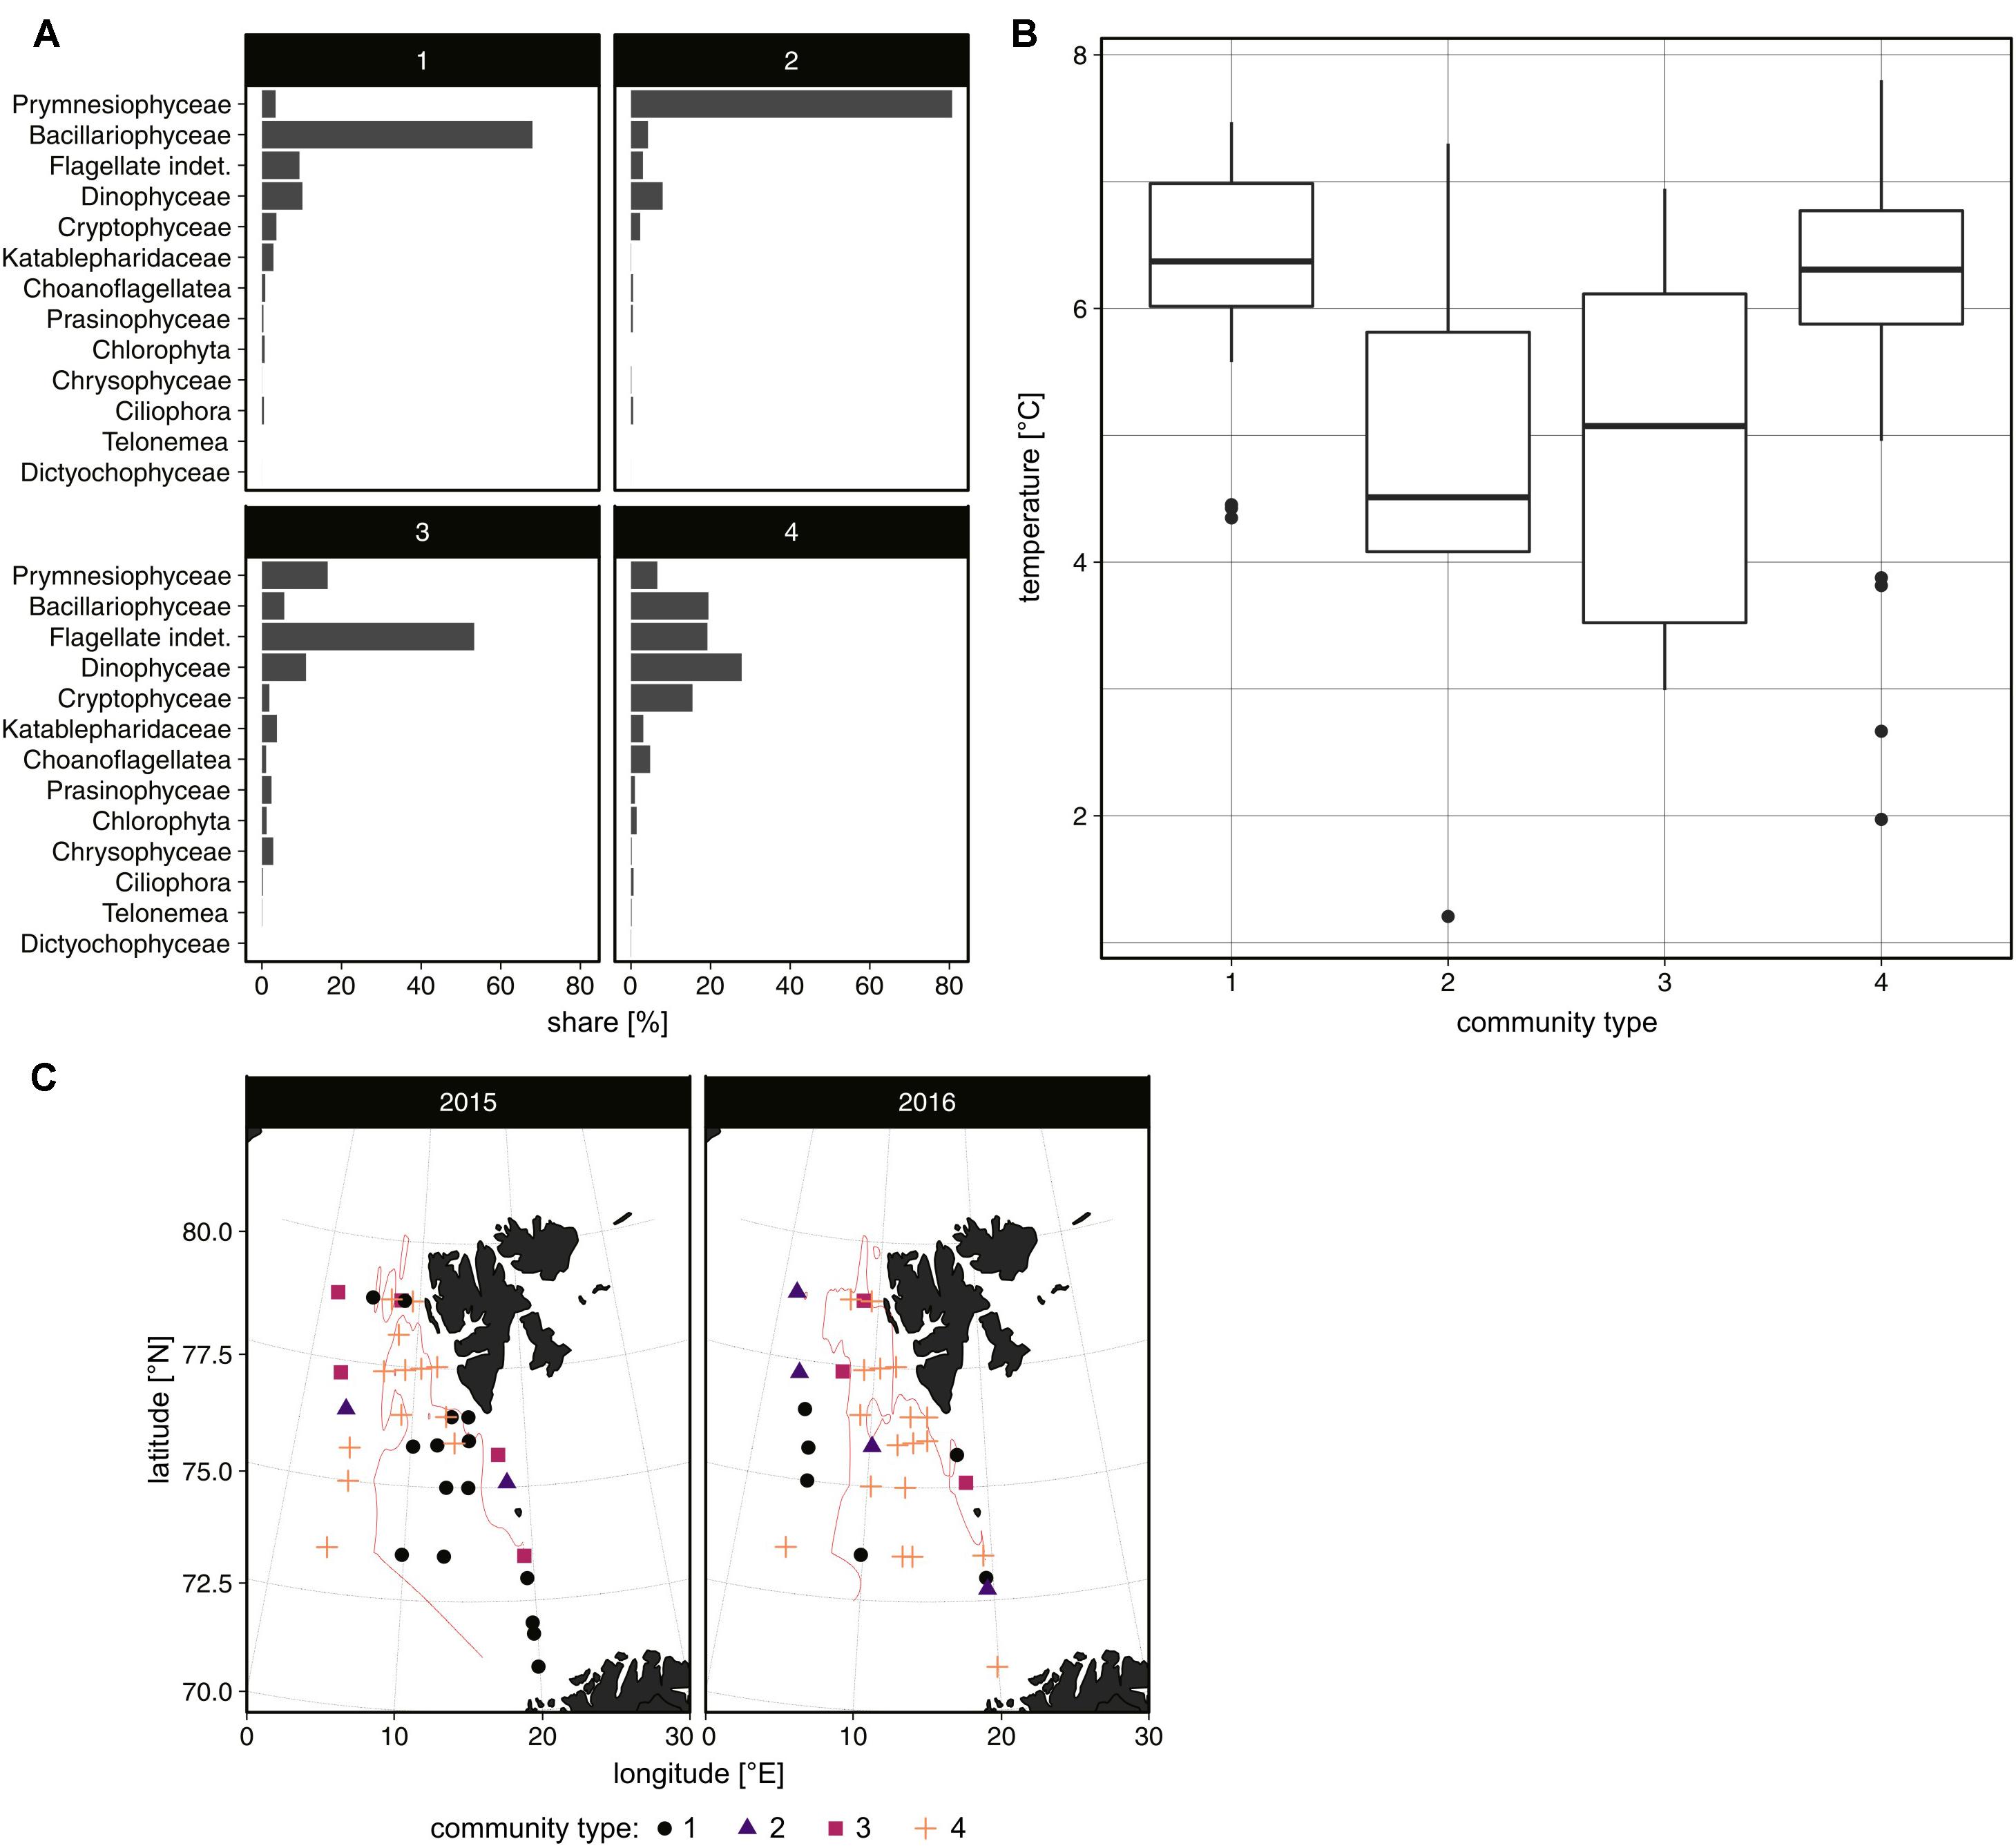
Figure 6. The share [%] of protist groups in individual community types determined by k-means analysis (A), the temperature range in their areas of occurrence (B) (both based on 2-year abundance data), and their spatial distribution in the area in the summers of 2015 and 2016 (C).
In 2016, the highest abundances were recorded at stations S16 (0.83 × 10⁹ cells m–3), O-9 (0.76 × 10⁹ cells m–3), and EB2-14 (0.69 × 10⁹ cells m–3) mainly due to the high share (71.24–91.65%) of P. pouchetii (Figure 3B; Supplementary Data 2). Relatively abundant communities (>0.31 × 10⁹ cells m–3) were also found along the Barents Sea Opening at stations V12, V27, and V31, as well as in the eastern Fram Strait (S10). At V12, the community was primarily composed of prymnesiophytes (57.06%; mainly Chrysochromulina sp.) and Dinophyceae (31.19%; mostly Gymnodinium sp. and Peridiniales indet., both of size 10–20 μm). At V27, indeterminate flagellates predominated (43.17%; especially biflagellates 3–7 μm), Prymnesiophyceae (35.42%; P. pouchetii), and Dinophyceae (13.28%; mostly Gymnodinium sp. 10–20 μm, Pronoctiluca pelagica, Gymnodinium wulffii, and Gymnodinium sp. 5–10 μm). The abundance of protists at S10 mainly consisted of indeterminate biflagellates (3–7 μm; 49.55%) and P. pouchetii (36.71%). At V31, high protist numbers constituted mainly of Bacillariophyceae (54.02%; especially Thalassiosira sp. 10–20 μm), P. pouchetii (25.85%), and Dinophyceae (17.20%; primarily Gymnodinium galeatum, Gymnodinium spp. 5–20 μm, and Peridiniales indet. 10–20 μm).
Community Types
Based on 2-year data analysis, we distinguished four types of summer protist communities in the investigated area (Figure 6A). The community predominated by Bacillariophyceae, as well as composed of a wide range of flagellated forms (Dinophyceae, Cryptophyceae, Flagellate indet.) and, to a lesser extent, Bacillariophyceae, was recorded mainly in warmer waters (>6°C; Figures 6B,C). In turn, the community formed primarily by Prymnesiophyceae (mainly colonial P. pouchetii) and those characterized by the dominance of indeterminate nanoplanktonic flagellates was mostly associated with colder waters.
Discussion
Hydrography
Since 1987, oceanographic measurements during the open ocean part of r/v Oceania cruise under the AREX program have been collected at the stations presented herein. Collected time series of water properties were studied in the aspect of long-term changes in the ocean climate in the Nordic Seas and the Fram Strait (e.g., Jankowski, 1991; Druet, 1993; Piechura et al., 2002; Schauer et al., 2008; Walczowski and Piechura, 2011; Beszczynska-Moller et al., 2012; Walczowski et al., 2012, 2017). Due to its time resolution, this series is considered as representative for temporal variability of the AW properties in the area. On its basis, it can be assumed that the oceanographic conditions in both summers were in line with the long-term (1997–2016) means (Walczowski et al., 2017) and were consistent with the ongoing Arctic warming trend (Huang et al., 2017).
In both summers, the water masses in the area were characterized by the comparable meridional extent of warm and saline AW and location of the Arctic Front (Walczowski et al., 2017). The major hydrographical feature that distinguished both years was a stronger inflow of colder and less saline Arctic waters from the Barents Sea to the area in 2015, which shaped the hydrographic patterns along the West Spitsbergen Shelf and in waters between Bear Island and Sørkapp. Due to this input, the mean AW temperature throughout the whole studied region was slightly lower than that in 2016, when the recirculation of warmer AW in the northern Fram Strait was recorded. However, if the northern (above 74.5°N) and southern (below 74.5°N) parts are considered independently, the southern region was warmer in 2015. A more detailed description of the hydrological and physical characteristics of the Nordic Seas and the Fram Strait based on simultaneously performed r/v Oceania-based measurements is presented in Walczowski et al. (2017).
Protistan Plankton Composition
The 153 planktonic protist taxa observed during the present study corresponded to previous investigations in the European Arctic (Markowski and Wiktor, 1998; Owrid et al., 2000). The observed taxa were characteristic of summer Atlantic communities (Weslawski et al., 1993; Hasle and Heimdal, 1998; Hegseth and Sundfjord, 2008), which are commonly observed in both shelf and open-ocean environments over a wide latitudinal range from polar to temperate waters (e.g., Halldal and Halldal, 1973; Eilertsen et al., 1989; Keck et al., 1999; Wiktor and Wojciechowska, 2005; Piwosz et al., 2009; Poulin et al., 2011; Kubiszyn et al., 2014, 2017; Piquet et al., 2015). The total protist biodiversity, as well as the biodiversity of the individual groups, was comparable between the two summers but was slightly higher in 2016.
Since our study covered waters through seven degrees of latitude (>700 km), we could expect that different physical and biological processes taking place at every location, through photosynthesis and the interactions of the food web components, will cause large fluctuations in protists’ structure. The results showed that the investigated area was indeed characterized by high spatial variability of most of the parameters (chlorophyll a, protist abundance, taxonomic composition) probably due to ever-changing environmental conditions, as light and nutrients change, and hydrographic mesoscale processes.
Similar to previous protist studies in the West Spitsbergen area (e.g., Hirche et al., 1991; Owrid et al., 2000; Seuthe et al., 2011; Piwosz et al., 2015), the communities were dominated mainly by nanoplanktonic phototrophs, which, combined with eukaryotic picoplankton (Iversen and Seuthe, 2011), are one of the most important contributors to primary production in the eastern Fram Strait (Eilertsen et al., 1989). Based on our data, the highest protist abundances were observed along the frontal zones, which are regions of strong density gradients where the physical and chemical properties of the surface mixed layer enhance protist biomass and productivity (Dylmer et al., 2015). On the eastern side, the hydrographic front was visible on the shelf, separating warm AW carried by the WSC from cold and freshened waters of the Sørkapp Current, whereas the Arctic Front was located west of the WSC at about 7°E (Walczowski et al., 2017). In waters supplied by the Bjørnøya and Sørkapp Currents, exceptionally high protist numbers [mostly the colonies of P. pouchetii, as well as mono- and biflagellates of indeterminate taxonomic affinity, which, considering the results of Piwosz et al. (2015), are most probably the flagellated solitary form of P. pouchetii] were likely caused by an import of cells together with the outflow of water masses from the Barents Sea and/or massive local growth on “new nutrients”; analogous observations were documented in June 1991 by Markowski and Wiktor (1998) and Owrid et al. (2000).
Implications of Hydrography on Protistan Plankton
While physical processes associated with AW inflow into the Arctic have been the subject of an extensive study, the implications of water hydrography for planktonic protists remain poorly examined (Vernet et al., 2019). In particular, studies on in situ high-spatial resolution changes in the community structure from Norway’s coast into the Arctic Ocean are especially rare. One of the main problems of plankton research in this area is logistical difficulties with sampling, which are caused by large waves and strong oceanic currents. Considering the frequent incompleteness in plankton sampling during previous open-ocean AREX cruises, mostly resulting from harsh weather conditions, we state that the protist sample collection presented herein, which practically covers the entire poleward flow of AW in the eastern Nordic Seas and the Fram Strait, is a very good result, which, to the best of our knowledge, has no equivalent in previous protistan in situ studies in the area.
Contrary to the expectations, there were no significant differences in protist community composition (abundance data) in terms of latitude (70.99 to 78.84°N); less than 10% of the variability was explained by the north–south extension (based on NP-MANOVA analyses). Our initial assumptions were supported, inter alia, by the results of Monti and Minocci (2013), who showed a meridional increase in both the abundance and number of microzooplankton taxa in the waters from northern continental Norway to Svalbard (65°N–78°N). This result, however, was more likely to be obtained because the study was limited to a certain plankton size class (20–200 μm; represented by heterotrophic dinoflagellates, foraminifers, ciliates, micrometazoans) collected along a longitudinally oriented (approximately 7–15°E) transect, where the hydrographic conditions gradient was stronger and more pronounced. In our case, an interplay (mixing and transformation) of various water masses most likely affected protist communities to the degree that prevented the observation of similar geographical patterns.
Interestingly, the results of further MANOVA (NP-MANOVA) between the protist structure and the seawater temperature revealed the division of the communities into two domains related to warmer and colder waters at a 6°C threshold. The communities in the colder water (<6°C) domain were represented primarily by Prymnesiophyceae in both summers, especially the colonial stage of P. pouchetii and, presumably, its motile stage (biflagellates indet. 3–7 μm). The quantitative importance of P. pouchetii, which is considered a marginal ice species (Gradinger and Baumann, 1991), was previously shown in the North Atlantic and Arctic waters by Owrid et al. (2000); Hegseth and Sundfjord (2008), and Degerlund and Eilertsen (2010), among others. It is commonly believed that the increase in P. pouchetii (and other small pico- and nanoplankton species) in the last two decades is directly related to the warm anomaly in the European Arctic (Nöthig et al., 2015). However, it should be noted that high abundances of this species have also been reported in the Fram Strait during the 1980s–1990s (i.e., before warming intensification; Smith et al., 1987). Thus, Phaeocystis blooms are not a new feature in this region, but their prevalence certainly deserves further studies. Due to the low bioavailability (cell size is in the lower range of optimum filtration efficiency) and low nutritive value of this species for calanoid copepods (Huntley et al., 1987), investigations on trophic interactions between Phaeocystis and zooplankton in the warming Arctic are particularly needed.
Contrary to the colder domain, with the domination of Phaeocystis in the two evaluated summers, we observed clear inter-annual differences in community composition of the warmer (>6°C) domain. In 2015, in the largest part of the investigated area (up to the southern tip of Spitsbergen), the protist community was dominated by Bacillariophyceae, while Dinophyceae, Cryptophyceae, and indeterminate nanoflagellates predominated more northward (to the west of Spitsbergen). In turn, in 2016, flagellates dominated the whole domain; a similar situation was reported in the summer of 2012 (Gluchowska et al., 2017).
Does Only Temperature Matter in Differentiating Summer Protist Community?
In our opinion, the aforementioned inter-annual differences in the summer protist community composition in the warmer water domain may be closely related to the variations in the phenology within the growing season. Because the summer protistan community structure depends on processes taking place during the spring bloom (inter alia, vertical mixing process, an influx of nutrients to the photic zone, number and efficiency of resting spores and resting cell germination, species competition, and mortality ratio), the observed differences could be predetermined a few months earlier and lasted until summer. Due to the lack of biological in situ data allowing us to track the initiation and progression of the spring bloom, we analyzed the satellite-derived 8-day and monthly (March–August) averaged chlorophyll a (a proxy for phototrophic protist biomass) satellite grid images derived from the MODIS (Aqua) satellite (resolution of 4 km) for the area between latitudes 70, 80°N, and longitudes 0, 20°E, which were extracted from the NASA’s OceanColor Web2 (data not shown; access date: November 15, 2019). High temporal and spatial resolutions selected for the satellite-based datasets were chosen to minimize the effect of the common heavy cloudy conditions over the Nordic Seas in the summertime. According to these data, the onset of the spring bloom in both investigated years took place at a similar time, i.e., in the first half of April. Driven by the light regime, the bloom started north of Norway (at a latitude of approximately 70°N) and gradually shifted northward with the seasonal lengthening of daylight at the increasingly higher latitudes. Comparing both analyzed years, the remotely sensed chlorophyll a concentrations in 2016, when record-high air and sea surface temperatures were observed (González-Pola et al., 2018), were noticeably higher throughout the growing season (spring–summer) in most of the examined area. Considering the recent findings of Mayot et al. (2020), different phytoplankton bloom phenology, driven by the various springtime Arctic ice flux and salinity-based water column stratification, may have substantial consequences on the timing and quantity of biological carbon pump and the production of higher trophic levels. Although we cannot say what hydrographic and atmospheric conditions prevailed in the studied area in the springs of 2015 and 2016 [except that the ice export through the Fram Strait was low in both years; Mayot et al. (2020)], it seems likely that the generally warmer conditions may benefit more intense phototrophs development, leading to faster depletion of nutrients and, thus, an earlier shift into the post-bloom community stage, which is indicated by the domination of flagellates in the warmer domain (observed in this study). Additionally, it cannot be ruled out that the structure of different taxonomic communities was also a result of the species transport with the inflow of water from distant areas to the north and south of the actual study site and corresponds to the phenology in the places where these water masses originated. However, T-S diagrams for both summers (not shown) did not indicate considerable variability in AW that could support different seeding population scenarios.
We are also mindful that the protist composition, as constituted by the interaction of photo- and heterotrophs, may also be affected by different grazing pressures by micro- and mesozooplankton [as demonstrated, among others, in Hirche et al. (1991) and Owrid et al. (2000)]. Due to rapid doubling rates of microzooplankton (especially ciliates and dinoflagellates), as well as their adaptation to utilize particles one order of magnitude smaller (Sheldon et al., 1972), it is assumed that microzooplankton has more of direct control on protist loss rates than mesozooplankton grazing (Friedland et al., 2016). Nevertheless, mesozooplankton, by having a significant impact on microzooplankton via predation, can also disrupt the balance between the gain and loss of protist abundances and produce rapid changes in community dynamics (Behrenfeld and Boss, 2014). Although we did not observe substantial variability in microplanktonic heterotrophic protist abundance within the investigated summers (mostly associated with the warmer domain), we cannot exclude the possibility that these differences would be visible after considering the protists with indeterminate feeding modes (a few taxa of the Gymnodinium and Gyrodinium genera and the Peridiniales order), as well as mixotrophs, widespread in the marine plankton (Stoecker et al., 2017). Interestingly, the study by Bałazy (2019) presented different copepodite structures of Calanus spp. (important protist consumers) in a warm (Atlantified) Kongsfjorden in the summers of 2015 and 2016. In 2016, the Calanus population throughout the examined period (early July–mid-August) was predominated by young stages. According to the author, this could have been caused by the influx of juvenile forms with the advection of AW to the shelf and may have suggested very good conditions for zooplankton reproduction and development in the West Spitsbergen area in the summer of 2016. A minor role of Bacillariophyceae in the warmer waters in summer 2016, as well as more numerous zooplankton fecal pellets observed at the time, somehow speaks to the validity of this assumption. Although this result may indicate potentially differentiating impacts on protists by zooplankters, the lack of open-ocean mesozooplankton data prevents us from testing this scenario. Noteworthy, the earlier mesoplankton studies (AREX 2001–2014) suggested that its community structure is subjected to strong year-to-year fluctuations, which are most likely related to the natural 6-year cycle of WSC hydrographical property changes described in Walczowski et al. (2012) (Sławomir Kwaśniewski, personal communication, November 19, 2019). Hence, differences in protistan plankton structure described herein may be associated with this cycle and the aforementioned physical/biological coupling. Further investigations are needed to distinguish whether they are caused by natural variability or climate change in the Nordic Seas and the Fram Strait.
Recommendations for Future Studies
Although we observed relationships between protist distribution and seawater temperature, our results indicate that other factors alone or combined additionally affect the summer communities in the area. To better understand these dependencies, future protist studies should relate to mesoscale phenomena, be supplemented by at least mesozooplankton data and water chemistry, and have an equivalent in springtime. Because recent satellite-derived and bio-optical in situ surveys suggested rapid expansion of temperate phototrophic protists (mainly coccolithophores) in the Arctic (e.g., Dylmer et al., 2015; Neukermans et al., 2018; Kowalczuk et al., 2019), it would also be reasonable to confirm these suppositions by microscopic studies. Our research does not support these findings.
Concluding Remarks and Outlook
Several interesting conclusions have arisen from this study, indicating significant variability in protist community structures of the studied area in the successive summers, most likely due to different phenologies, supporting the importance of in situ studies to determine potential future ecosystem shifts in response to climate change.
Specifically:
(1) differentiation of the protistan plankton structure into two separated domains at the 6°C threshold
(2) domination of Phaeocystis (colonial and flagellated cells) in the colder domain in two evaluated summers
(3) higher abundance of heterotrophic protists in the warmer domain in both investigated years
(4) the possible earlier shift of the communities into the post-bloom stage in the warmer 2016, indicated by the domination of flagellates in the early summer
Given the recently demonstrated beneficial effects of warming on picoeukaryotes including Micromonas pusilla (Hoppe et al., 2018) and bacteria (Maranger et al., 2015), as well as our findings, we hypothesize that the further climate change of the European Arctic seas (especially the Atlantic domain) will favor the dominance of small, mobile protists. Restructuring of communities toward pico- and nanoplankton will likely lengthen the carbon pathway through the food web by increasing the significance of heterotrophic protists and, thus, will result in increased microbial loop activity. Such a scenario has been already speculated by Vernet et al. (2017) based on the model results. Importantly, these protists due to their small size may not be efficiently utilized by mesozooplankton (Levinsen et al., 2000). Therefore, the predicted changes in protistan plankton community composition, with the increasing role of microplanktonic grazers and detritus as a source of carbon to higher trophic levels (both pelagic and benthic), may lead to partial energy dissipation in the marine trophic network.
Data Availability Statement
All datasets generated for this study are included in the article/Supplementary Material.
Author Contributions
AK contributed to obtaining the funding for the research, project coordination, designing the field study, organizing and leading the field investigation, sample collection, analysis of chlorophyll a and protist communities, data processing, and manuscript writing. JMiW contributed to statistical data processing/analysis and to the statistical part of the manuscript. MM contributed to temperature and salinity measurements, hydrography data treatment/visualization and to the hydrographic part of the manuscript. JMaW contributed to designing the field study, substantive care over the project implementation, and manuscript editing. All authors contributed to the article and approved the submitted version.
Funding
The presented research was carried out as part of the implementation of the IO PAN statutory task (I.5.7) and with financial support from the Ministry of Science and Higher Education (AREX Project, 3547/Norway/2016/2) and the National Science Center (Let’s Sea Project, 2015/17/N/NZ8/01642; DWINS Project, 2016/21/N/ST10/02920).
Conflict of Interest
The authors declare that the research was conducted in the absence of any commercial or financial relationships that could be construed as a potential conflict of interest.
Acknowledgments
We would like to thank two reviewers and the editor HJ for their thorough review of the manuscript and constructive comments. Also, we wish to express our sincere gratitude to Prof. Waldemar Walczowski (IO PAN) for substantial assistance with the hydrographic data discussion. The assistance of the crew of r/v “Oceania,” particularly of Roman Obuchowski and Krzysztof Rosiński, specialists in research equipment, and of the scientific staff from the Institute of Oceanology, Polish Academy of Sciences, Sopot, especially Dr. Przemysław Makuch, during the cruise is very much appreciated.
Supplementary Material
The Supplementary Material for this article can be found online at: https://www.frontiersin.org/articles/10.3389/fmars.2020.00557/full#supplementary-material
Footnotes
References
Bałazy, K. (2019). The Phenology of Key Calanus Species in the Context of Food Demand of Little Auk (Alle Alle) Nesting on Spitsbergen. PhD Dissertation, Institute of Oceanology Polish Academy of Sciences Sopot.
Behrenfeld, M. J., and Boss, E. S. (2014). Resurrecting the ecological underpinnings of Ocean plankton blooms. Annu. Rev. Mar. Sci. 6, 167–194. doi: 10.1146/annurev-marine-052913-021325
Beszczynska-Moller, A., Fahrbach, E., Schauer, U., and Hansen, E. (2012). Variability in Atlantic water temperature and transport at the entrance to the Arctic Ocean, 1997-2010. ICES J. Mar. Sci. 69, 852–863. doi: 10.1093/icesjms/fss056
Bosse, A., Fer, I., Søiland, H., and Rossby, T. (2018). Atlantic water transformation along its poleward pathway across the Nordic Seas. J. Geophys. Res. Oceans 123, 6428–6448. doi: 10.1029/2018JC014147
Brakstad, A., Våge, K., Håvik, L., and Moore, G. W. K. (2019). Water mass transformation in the Greenland Sea during the period 1986–2016. J. Phys. Oceanogr. 49, 121–140. doi: 10.1175/JPO-D-17-0273.1
Calbet, A. (2008). The trophic roles of microzooplankton in marine systems. ICES J. Mar. Sci. 65, 325–331. doi: 10.1093/icesjms/fsn013
Cavalieri, D., Parkinson, C., Gloersen, P., and Zwally, H. J. (1996). Sea Ice Concentrations from Nimbus-7 SMMR and DMSP SSM/I-SSMIS Passive Microwave Data. 19782007. Digital Media. Boulder, CO: National Aeronautics and Space Administration Distributed Active Archive Center at the National Snow and Ice Data Center. Avaliable at: http://nsidc.org/data/nsidc-0051.html (Accessed 8 April 2020).
Degerlund, M., and Eilertsen, H. C. (2010). Main species characteristics of phytoplankton spring blooms in NE Atlantic and Arctic waters (68–80° N). Estuaries Coasts 33, 242–269. doi: 10.1007/s12237-009-9167-7
Drange, H., Dokken, T., Furevik, T., Gerdes, R., Berger, W., Nesje, A., et al. (2005). “The Nordic seas: an overview,” in The Nordic Seas: An Integrated Perspective, eds H. Drange, T. Dokken, T. Furevik, R. Gerdes, and W. Berger (Washington DC: AGU Monograph 158), 1–10. doi: 10.1029/158gm02
Druet, C. (1993). Polar marine research (2). The results of Polish oceanographic investigations focused on interannual variability of the Greenland sea energoactive zones. Stud. Mater. Oceanol. 65, 3–223.
Dylmer, C. V., Giraudeau, J., Hanquiez, V., and Husum, K. (2015). The coccolithophores Emiliania huxleyi and Coccolithus pelagicus: extant populations from the Norwegian–Iceland seas and Fram Strait. Deep Sea Res. Part I Oceanogr. Res. Pap. 98, 1–9. doi: 10.1016/j.dsr.2014.11.012
Edler, L. (1979). Recommendations on methods for marine biological studies in the Baltic sea, Phytoplankton and chlorophyll. Balt Mar. Biol. Publ. 5, 1–38.
Edler, L., and Elbrächter, M. (2010). The Utermöhl method for quantitative phytoplankton analysis. Microscopic and molecular methods for quantitative phytoplankton analysis. Manuals and guides 55. Intergov. Oceanogr. Commun. 55, 13–20.
Eilertsen, H. C., Tande, K. S., and Taasen, J. P. (1989). Vertical distributions of primary production and grazing by Calanus glacialis Jaschnov and C. hyperboreus Krøyer in Arctic Waters (Barents Sea). Polar Biol. 9, 253–260. doi: 10.1007/bf00263773
Foissner, W., and Hawksworth, D. L. (eds) (2009). “Protist Diversity and Geographical Distribution,” in Topics in Biodiversity and Conservation. Dordrecht: Springer.
Friedland, K. D., Record, N. R., Asch, R. G., Kristiansen, T., Saba, V. S., Drinkwater, K. F., et al. (2016). Seasonal phytoplankton blooms in the North Atlantic linked to the overwintering strategies of copepods. Elem. Sci. Anth. 4:000099. doi: 10.12952/journal.elementa.000099
Gluchowska, M., Trudnowska, E., Goszczko, I., Kubiszyn, A. M., Blachowiak-Samolyk, K., Walczowski, W., et al. (2017). Variations in the structural and functional diversity of zooplankton over vertical and horizontal environmental gradients en route to the Arctic Ocean through the Fram Strait. PLoS One 12:e0171715. doi: 10.1371/journal.pone.0171715
González-Pola, C., Larsen, K. M. H., Fratantoni, P., Beszczynska-Moller, A., and Hughes, S. L. (eds) (2018). ICES Report on Ocean Climate 2016. ICES Cooperative Research Report No. 339. Copenhagen: International Council for the Exploration of the Sea, 110.
Gradinger, R. R., and Baumann, M. E. M. (1991). Distribution of phytoplankton communities in relation to the large-scale hydrographical regime in the Fram Strait. Mar. Biol. 111, 311–321. doi: 10.1007/bf01319714
Halldal, P., and Halldal, K. (1973). Phytoplankton, chlorophyll, and submarine light conditions in Kings Bay. Spitsbergen, July 1971. Norw. J. Bot. 20, 99–108.
Hansen, B., and Østerhus, S. (2000). North Atlantic–Nordic seas exchanges. Prog. Oceanogr. 45, 109–208. doi: 10.1016/s0079-6611(99)00052-x
Hansen, E., Gerland, S., Granskog, M. A., Pavlova, O., Renner, A. H. H., Haapala, J., et al. (2013). Thinning of Arctic sea ice observed in Fram Strait: 1990–2011. J. Geophys. Res. Oceans 118, 5202–5221. doi: 10.1002/jgrc.20393
Hasle, G. R., and Heimdal, B. R. (1998). The net phytoplankton in Kongsfjorden, Svalbard, July 1988, with general remarks on species composition of Arctic phytoplankton. Polar Res. 17, 31–52. doi: 10.3402/polar.v17i1.6605
Hegseth, E. N., Assmy, P., Wiktor, J., Kristiansen, S., Leu, E., Piquet, A. M.-T., et al. (2019). “Phytoplankton seasonal dynamics in Kongsfjorden, Svalbard and the adjacent shelf,” in The Ecosystem of Kongsfjorden, Svalbard, Advances in Polar Ecology 2, eds H. Hop and C. Wiencke (Cambridge: Springer), 173–228.
Hegseth, E. N., and Sundfjord, A. (2008). Intrusion and blooming of Atlantic phytoplankton species in the high Arctic. J. Mar. Syst. 74, 108–119. doi: 10.1016/j.jmarsys.2007.11.011
Hegseth, E. N., and Tverberg, V. (2013). Effect of Atlantic water inflow on timing of the phytoplankton spring bloom in a high Arctic fjord (Kongsfjorden, Svalbard). J. Mar. Syst. 11, 94–105. doi: 10.1016/j.jmarsys.2013.01.003
Hirche, H. J., Baumann, M. E. M., Kattner, G., and Gradinger, R. (1991). Plankton distribution and the impact of copepod grazing on primary production in Fram Strait. Greenland sea. J. Mar. Syst. 2, 477–494. doi: 10.1016/0924-7963(91)90048-y
Hodal, H., Falk-Petersen, S., Hop, H., Kristiansen, S., and Reigstad, M. (2012). Spring bloom dynamics in Kongsfjorden, Svalbard: nutrients, phytoplankton, protozoans and primary production. Polar Biol. 35, 191–203. doi: 10.1007/s00300-011-1053-7
Holliday, N. P., Hughes, S. L., Bacon, S., Beszczynska-Moller, A., Hansen, B., Lavin, A., et al. (2008). Reversal of the 1960s to 1990s freshening trend in the northeast North Atlantic and Nordic Seas. Geophys. Res. Lett. 35:L03614. doi: 10.1029/2007GL032675
Holm-Hansen, O., and Riemann, B. (1978). Chlorophyll a determination: improvements in methodology. Oikos 30, 438–447. doi: 10.2307/3543338
Hoppe, C. J. M., Flintrop, C. M., and Rost, B. (2018). The Arctic picoeukaryote Micromonas pusilla benefits synergistically from warming and ocean acidification. Biogeosciences 15, 4353–4365. doi: 10.5194/bg-15-4353-2018
Huang, J., Zhang, X., Zhang, Q., Lin, Y., Hao, M., Luo, Y., et al. (2017). Recently amplified arctic warming has contributed to a continual global warming trend. Nat. Clim. Chang. 7, 875–879. doi: 10.1038/s41558-017-0009-5
Huntley, M., Tande, K., and Eilertsen, H. C. (1987). On the trophic fate of Phaeocystis pouchetii (Hariot). II. Grazing rates of Calanus hyperboreus (Krøyer) on diatoms and different size categories of Phaeocystis pouchetii. J. Exp. Mar. Biol. Ecol. 110, 197–212. doi: 10.1016/0022-0981(87)90001-3dsew
Iversen, K. R., and Seuthe, L. (2011). Seasonal microbial processes in a high-latitude fjord (Kongsfjorden, Svalbard): I. Heterotrophic bacteria, picoplankton and nanoflagellates. Polar Biol. 34, 731–749. doi: 10.1007/s00300-010-0929-2
Jankowski, A. (1991). Heat flux and wind momentum flux evaluation in certain regions of the Norwegian Sea in summer 1987 (based on results of AREX–87 cruise). Stud. Mater. Oceanol. 58, 77–89.
Keck, A., Wiktor, J., Hapter, R., and Nilsen, R. (1999). Phytoplankton assemblages related to physical gradients in an Arctic, glacier-fed fjord in summer. ICES J. Mar. Sci. 56, 203–214. doi: 10.1006/jmsc.1999.0631
Kowalczuk, P., Sagan, S., Makarewicz, A., Meler, J., Borzycka, K., Zabłocka, M., et al. (2019). Bio-optical properties of surface waters in the Atlantic water inflow region off Spitsbergen (Arctic Ocean). J. Geophys. Res. Ocean 124, 1964–1987. doi: 10.1029/2018jc014529
Kubiszyn, A. M., Piwosz, K., Wiktor, J. M. Jr., and Wiktor, J. M. (2014). The effect of inter-annual Atlantic water inflow variability on the planktonic protist community structure in the West Spitsbergen waters during the summer. J. Plankton Res. 36, 1190–1203. doi: 10.1093/plankt/fbu044
Kubiszyn, A. M., Wiktor, J. M., Wiktor, J. M. Jr., Griffiths, C., Kristiansen, S., and Gabrielsen, T. M. (2017). The annual planktonic protist community structure in an ice-free high Arctic fjord (Adventfjorden, West Spitsbergen). J. Mar. Syst. 169, 61–72. doi: 10.1016/j.jmarsys.2017.01.013
Lalande, C., Bauerfeind, E., Nöthig, E. M., and Beszczynska-Moller, A. (2013). Impact of a warm anomaly on export fluxes of biogenic matter in the eastern Fram Strait. Prog. Oceanogr. 109, 70–77. doi: 10.1016/j.pocean.2012.09.006
Latarius, K., and Quadfasel, D. (2016). Water mass transformation in the deep basins of the Nordic Seas: analyses of heat and freshwater budgets. Deep Sea Res. Patt I 114, 23–42. doi: 10.1016/j.dsr.2016.04.012
Lauvset, S. K., Brakstad, A., Våge, K., Olsen, A., Jeansson, E., and Mork, K. A. (2018). Continued warming, salinification and oxygenation of the Greenland Sea gyre. Tellus A 70, 1–9. doi: 10.1080/16000870.2018.1476434
Leu, E., Søreide, J. E., Hessen, D. O., Falk-Petersen, S., and Berge, J. (2011). Consequences of changing sea-ice cover for primary and secondary producers in the European Arctic shelf seas: timing, quantity, and quality. Prog. Oceanogr. 90, 18–32. doi: 10.1016/j.pocean.2011.02.004
Levinsen, H., Turner, J. T., Nielsen, T. G., and Hansen, B. W. (2000). On the trophic coupling between protists and copepods in arctic marine ecosystems. Mar. Ecol. Prog. Ser. 204, 65–77. doi: 10.3354/meps204065
Maranger, R., Vaqué, D., Nguyen, D., Hébert, M. P., and Lara, E. (2015). Pan-Arctic patterns of planktonic heterotrophic microbial abundance and processes: controlling factors and potential impacts of warming. Prog. Oceanogr. 139, 221–232. doi: 10.1016/j.pocean.2015.07.006
Markowski, D., and Wiktor, J. (1998). Phytoplankton and water masses in the European subarctic Polar front zone. Oceanologia 40, 51–64.
Mayot, N., Matrai, P. A., Arjona, A., Bélanger, S., Marchese, C., Jaegler, T., et al. (2020). Springtime export of Arctic sea ice influences phytoplankton production in the Greenland Sea. J. Geophys. Res. Oceans 125:e2019JC015799. doi: 10.1029/2019JC015799
Mayzaud, P., Boutoute, M., Noyon, M., Narcy, F., and Gasparini, S. (2013). Lipid and fatty acids in naturally occurring particulate matter during spring and summer in a high arctic fjord (Kongsfjorden. Svalbard). Mar. Biol. 160, 383–398. doi: 10.1007/s00227-012-2095-2
Möller, F., and Bernhard, M. (1974). A sequential approach to the counting of plankton organisms. J. Exp. Mar. Biol. Ecol. 15, 49–68. doi: 10.1016/0022-0981(74)90063-x
Monti, M., and Minocci, M. (2013). Microzooplankton along a transect from northern continental Norway to Svalbard. Polar Res. 32:19306. doi: 10.3402/polar.v32i0.19306
Neukermans, G., Oziel, L., and Babin, M. (2018). Increased intrusion of warming Atlantic water leads to rapid expansion of temperate phytoplankton in the Arctic. Glob. Change Biol. 24, 2545–2553. doi: 10.1111/gcb.14075
Nöthig, E. M., Bracher, A., Engel, A., Metfies, K., Niehoff, B., Peeken, I., et al. (2015). Summertime plankton ecology in Fram Strait – a compilation of long-and short-term observations. Polar Res. 34:23349. doi: 10.3402/polar.v34.23349
Oksanen, J., Blanchet, F. G., Friendly, M., Kindt, R., Legendre, P., McGlinn, D., et al. (2017). Vegan: Community Ecology Package. R Package Version 2.4-3. Avaliable at: https://CRAN.R-project.org/package=vegan. (accessed March 12, 2019).
Owrid, G., Socal, G., Civitarese, G., Luchetta, A., Wiktor, J., Nöthig, E. M., et al. (2000). Spatial variability of phytoplankton, nutrients and new production estimates in the waters around Svalbard. Polar Res. 19, 155–171. doi: 10.3402/polar.v19i2.6542
Piechura, J., Osiński, R., Petelski, T., and Woźniak, S. B. (2002). Heat and salt fluxes in the West Spitsbergen current area in summer. Oceanologia 44, 307–321.
Piquet, A. M. T., Maat, D. S., Confurius-Guns, V., Sintes, E., Herndl, G. J., van de Poll, W. H., et al. (2015). Springtime dynamics, productivity and activity of prokaryotes in two Arctic fjords. Polar Biol. 39, 1749–1763. doi: 10.1007/s00300-015-1866-x
Piwosz, K., Spich, K., Całkiewicz, J., Weydmann, A., Kubiszyn, A. M., and Wiktor, J. M. (2015). Distribution of small phytoflagellates along an Arctic fjord transect. Environ. Microbiol. 17, 2393–2406. doi: 10.1111/1462-2920.12705
Piwosz, K., Walkusz, W., Hapter, R., Wieczorek, P., Hop, H., and Wiktor, J. (2009). Comparison of productivity and phytoplankton in a warm (Kongsfjorden) and a cold (Hornsund) Spitsbergen fjord in mid-summer 2002. Polar Biol. 32, 549–559. doi: 10.1007/s00300-008-0549-2
Poulin, M., Daugbjerg, N., Gradinger, R., Ilyash, L., Ratkova, T., and von Quillfeldt, C. (2011). The pan-Arctic biodiversity of marine pelagic and Sea-ice unicellular eukaryotes: a first-attempt assessment. Mar. Biodivers. 41, 13–28. doi: 10.1007/s12526-010-0058-8
R Core Team (2017). R: A Language and Environment for Statistical Computing. Vienna: R Foundation for Statistical Computing.
Rudels, B., Korhonen, M., Schauer, U., Pisarev, S., Rabe, B., and Wisotzki, A. (2015). Circulation and transformation of Atlantic water in the Eurasian Basin and the contribution of the Fram Strait inflow branch to the Arctic Ocean heat budget. Prog. Oceanogr. 132, 128–152. doi: 10.1016/j.pocean.2014.04.003
Saloranta, T. M., and Svendsen, H. (2001). Across the Arctic front west of Spitsbergen: high-resolution CTD sections from 1998-2000. Polar Res. 20, 177–184. doi: 10.1111/j.1751-8369.2001.tb00054.x
Schauer, U., Beszczynska-Moller, A., Walczowski, W., Fahrbach, E., Piechura, J., and Hansen, E. (2008). “Variation of measured heat flow through the Fram Strait between 1997 and 2006, in Arctic-Subarctic Ocean fluxes,” in Defining the role of the Northern Seas in Climate, eds R. R. Dickson, J. Meincke, and P. Rhines (Dordrecht: Springer), 65–85. doi: 10.1007/978-1-4020-6774-7_4
Schauer, U., Fahrbach, E., Østerhus, S., and Rohardt, G. (2004). Arctic warming through the Fram Strait: oceanic heat transport from 3 years of measurements. J. Geophys. Res. 109:C06026. doi: 10.1029/2003JC001823
Seuthe, L., Iversen, K. R., and Narcy, F. (2011). Microbial processes in a high-latitude fjord (Kongsfjorden, Svalbard): II. Ciliates and dinoflagellates. Polar Biol. 34, 751–766. doi: 10.1007/s00300-010-0930-9
Sheldon, R. W., Prakash, A., and Sutcliffe, W. H. (1972). The size distribution of particles in the Ocean 1. Limnol. Oceanogr. 17, 327–340. doi: 10.4319/lo.1972.17.3.0327
Smith, W. O., Baumann, M. E. M., Wilson, D. L., and Aletsee, L. (1987). Phytoplankton biomass and productivity in the marginal ice zone of the Fram Strait during summer 1984. J. Geophys. Res. 92, 6777–6786. doi: 10.1029/JC092iC07p06777
Smoła, Z. T., Tatarek, A., Wiktor, J. M., Wiktor, J. M., Kubiszyn, A. M., and Wêsławski, J. M. (2017). Primary producers and production in Hornsund and Kongsfjorden – comparison of two fjord systems. Pol. Polar Res. 38, 351–373. doi: 10.1515/popore-2017-0013
Søreide, J. E., Leu, E., Berge, J., Graeve, M., and Falk-Petersen, S. (2010). Timing of blooms, algal food quality and Calanus glacialis reproduction and growth in a changing Arctic. Glob. Change Biol. 16, 3154–3163. doi: 10.1111/j.1365-2486.2010.02175.x
Stoecker, D. K., Hansen, P. J., Caron, D. A., and Mitra, A. (2017). Mixotrophy in the marine plankton. Annu. Rev. Mar. Sci. 9, 311–335. doi: 10.1146/annurev-marine-010816-060617
Utermöhl, H. (1958). Zur vervollkommnung der quantitativen phytoplankton-methodik. Mitt. Int. Ver. Theor. Angew. Limnol. 9, 1–38. doi: 10.1080/05384680.1958.11904091
Vernet, M., Ellingsen, I. H., Seuthe, L., Slagstad, D., Cape, M. R., and Matrai, P. A. (2019). Influence of phytoplankton advection on the productivity along the Atlantic Water Inflow to the Arctic Ocean. Front. Mar. Sci. 6:583. doi: 10.3389/fmars.2019.00583
Vernet, M., Richardson, T. L., Metfies, K., Nöthig, E. M., and Peeken, I. (2017). Models of plankton community changes during a warm water anomaly in arctic waters show altered trophic pathways with minimal changes in carbon export. Front. Mar. Sci. 4:160. doi: 10.3389/fmars.2017.00160
Walczowski, W. (2010). Atlantic water in the Nordic Seas - properties, variability, climatic significance. Oceanologia 52, 319–324. doi: 10.5697/oc.52-2.325
Walczowski, W. (2013). Frontal structures in the West Spitsbergen current margins. Ocean Sci. 9, 957–975. doi: 10.5194/os-9-957-2013
Walczowski, W., Beszczynska-Moller, A., Wieczorek, P., Merchel, M., and Grynczel, A. (2017). Oceanographic observations in the Nordic Sea and Fram Strait in 2016 under the IO PAN long-term monitoring program AREX. Oceanologia 59, 187–194. doi: 10.1016/j.oceano.2016.12.003
Walczowski, W., and Piechura, J. (2011). Influence of the West Spitsbergen current on the local climate. Int. J. Climatol. 31, 1088–1093. doi: 10.1002/joc.2338
Walczowski, W., Piechura, J., Goszczko, I., and Wieczorek, P. (2012). Changes in Atlantic water properties: an important factor in the European Arctic marine climate. ICES J. Mar. Sci. 69, 864–869. doi: 10.1093/icesjms/fss068
Walczowski, W. (2014). “Atlantic water in the nordic seas,” in Properties, Variability, Climatic Importance, GeoPlanet: Earth and Planetary Sciences (Berlin: Springer International Publishing), 174.
Walczowski, W. (2014). Atlantic Water in the Nordic Seas. Properties, Variability, Climatic Importance. Dordrecht: Springer International Publishing. doi: 10.1007/978-3-319-01279-7
Wiktor, J. (1999). Early spring microplankton development under fast ice covered fjords of Svalbard. Arctic. Oceanologia 41, 51–72.
Keywords: protists, hydrography, Atlantic water, Nordic Seas, Fram Strait
Citation: Dąbrowska AM, Wiktor JM Jr, Merchel M and Wiktor JM (2020) Planktonic Protists of the Eastern Nordic Seas and the Fram Strait: Spatial Changes Related to Hydrography During Early Summer. Front. Mar. Sci. 7:557. doi: 10.3389/fmars.2020.00557
Received: 17 December 2019; Accepted: 17 June 2020;
Published: 27 July 2020.
Edited by:
Houshuo Jiang, Woods Hole Oceanographic Institution, United StatesReviewed by:
Eva-Maria Nöthig, Alfred Wegener Institute Helmholtz Centre for Polar and Marine Research (AWI), GermanyElizabeth Harvey, University of New Hampshire, United States
Copyright © 2020 Dąbrowska, Wiktor, Merchel and Wiktor. This is an open-access article distributed under the terms of the Creative Commons Attribution License (CC BY). The use, distribution or reproduction in other forums is permitted, provided the original author(s) and the copyright owner(s) are credited and that the original publication in this journal is cited, in accordance with accepted academic practice. No use, distribution or reproduction is permitted which does not comply with these terms.
*Correspondence: Anna Maria Dąbrowska, (Formerly Anna Maria Kubiszyn) ZGFicm93c2thQGlvcGFuLmdkYS5wbA==