 Jacco C. Kromkamp
 Ed Morris
 Rodney M. Forster
- 1Royal Netherlands Institute for Sea Research, Department of Estuarine and Delta Systems, Utrecht University, Utrecht, Netherlands
- 2Vizzuality, Madrid, Spain
- 3Hull Marine Laboratory, Department of Biological and Marine Sciences, University of Hull, Hull, United Kingdom
Carbon fixation by microphytobenthic algae of intertidal flats often dominates the total primary production of turbid, temperate estuaries. Whilst remote sensing can accurately measure the spatial distribution of photosynthetic biofilms at the mesoscale (1–300 m), variability at smaller scales requires in-situ investigation. Here, changes in biomass and photosynthetic activity of microphytobenthos (MPB) at the micro-scale (<1 m) were investigated. Biomass of MPB was estimated from repeated high resolution spectral measurements carried out at intervals along a short transect. Whilst the mean concentration of MPB remained constant over time, considerable variability in the spatial and temporal dimensions was measured. The biofilm grew and diminished along the transect over time, and net growth and loss rates could be established under natural conditions. Daily vertical migration was observed for the first time in an undisturbed sediment, and was modeled as a function of solar elevation and tidal angle. Top down factors such as grazing, or physical disturbance, played an important role in the changes in biomass. Photosynthetic activity was measured with portable fluorometers: one device used an artificial light source, the other measured the effective photosystem-II quantum efficiency (ΔF/Fm′) in-situ with solar irradiance. No evidence was found for photoinhibition, with Fv/Fm values consistently high, indicating an ability of the diatom biofilm to remain productive under periods of high irradiance. The maximum rate of photosynthesis reached with artificial light was rarely achieved in-situ, even with full solar exposure. There was, however, a very good agreement between the predicted rate at ambient irradiance, and that actually measured. Composite photosynthesis-irradiance curves over the whole experimental period were similar, and showed the same initial slopes, but the maximum rate of relative photosynthetic electron transport (rETRm) based on the in-situ measurement was lower. When total depth-averaged primary production during low tide was calculated, the differences between methods varied between 5 and 13%, and were smallest when surface irradiance values were highest. These results show that the protocol used to measure the photosynthetic activity of the MPB had only minor importance on the overall productivity estimate compared to accurate knowledge of photosynthetically active biomass and irradiance.
Introduction
Benthic microalgal communities are important ecological players on intertidal estuarine sediments. They can be responsible for a significant fraction of the total estuarine primary production (MacIntyre et al., 1996; Underwood and Kromkamp, 1999; Christianen et al., 2017), providing a range of ecosystem services (Hope et al., 2019), such as provision of a highly nutritious food source that can be used directly or indirectly by higher trophic levels including important wading bird populations (Kuwae et al., 2008). Microphytobenthos (MPB) can also be considered important ecosystem engineers as the presence of surface biofilms gives enhanced resistance against erosion (Paterson, 1989; Paterson and Black, 1999; Decho, 2000; Underwood and Paterson, 2003). This effect is most prominent on muddy, cohesive diatom-dominated sediments, where the excretion of extracellular polymeric substances improves the stabilization of mudflats (Smith and Underwood, 2000; Tolhurst et al., 2003). Of particular note here are microbial communities dominated by epipelic, pennate diatoms – biofilms of this type can accumulate multiple layers of cells with areal chlorophyll concentrations of over 200 mg m–2 (Forster et al., 2006; Sahan et al., 2007; Jesus et al., 2009).
Whilst the seasonal appearance of intertidal MPB blooms can display a remarkable synchronicity at the sea-basin scale (van der Wal et al., 2010), geostatistical analysis of in-situ data and remote sensing images has shown that MPB show spatial patchiness at a range of smaller distances (Ibrahim et al., 2014). Semivariograms constructed on MPB samples typically show a range (distance at which samples are not spatially autocorrelated) of 50–500 m (Morris, 2005; Orvain et al., 2012; Ibrahim et al., 2014). There are few estimates of microscale variability in MPB biomass i.e., at distances less than the typical spread of replicate samples at a point station (1–3 m).
In addition to spatial variability in the horizontal dimension, MPB of mud-dominated tidal flats exhibit a pronounced vertical variability due to migrations of diatom cells toward and away from the surface. The vertical migration may be driven by an endogenous clock as cells only come to the surface during low tide, and only when the low tide is during the day: at night cells remain below the sediment surface (Pinckney and Zingmark, 1991; Serôdio et al., 1997; Jesus et al., 2006). Due to the changes in photosynthetic biomass exposed to the light, vertical migration is a strong driver of daily primary production (Kwon et al., 2012; Haro et al., 2019). In addition to the tidally driven migration, epipelic diatoms may also change depth in relation to the light intensity and avoid too high light conditions (Cartaxana et al., 2008). The fact that, even after prolonged exposure to high light, effective photosynthetic quantum efficiencies can still be high prompted Kromkamp et al. (1998) to propose the concept of vertical “micro-migration” where cells at the surface migrate to slightly deeper layers in the sediment in order to prevent over-exposure to damaging irradiances or CO2-limitation, whereas others cells migrate to the surface. Thus, the biofilm at the sediment surface is a dynamic, productive system where cells at the very surface are continuous being replaced by others (Marques da Silva et al., 2017). In contrast to vegetated coastal environments such as seagrass beds and salt marshes, very few estimates of the contribution of MPB to coastal primary production, or long-term carbon storage (“blue carbon”) are available (Cahoon, 1999 for global MPB; Howard et al., 2017 for coastal vegetation).
Several techniques to measure the photosynthetic activity and primaryproduction of MPB are available (see Kromkamp and Forster (2006) for a review onmethodologies), which together with consideration of theabove-mentioned spatio-temporal variability, may lead to betterglobal estimates of MPB carbon fixation (Forster and Kromkamp, 2006). Measurements of variable fluorescence, using pulse-amplitude modulated (PAM) type fluorimeters have been used widely to assess the photosynthetic activity of intact MPB biofilms (Barranguet and Kromkamp, 2000; Cruz and Serôdio, 2008; Perkins et al., 2010). The advantage of this technique is that the photosynthetic activity can be assessed rapidly, making many measurements possible during a single low tide emersion period. Several different means of measuring the cardinal parameters of the photosynthesis-irradiance relationship using the variable fluorescence technique have been developed. Theoretically, “rapid light curves” measured on undisturbed biofilms, without a prior dark acclimation, and with short light steps, should measure photosynthetic rates close to that in-situ. Previous work has shown that the physiological information derived from photosynthesis-irradiance curves depends on the methodology used (Perkins et al., 2006; Serôdio et al., 2013). Following measurement of electron transport rates, conversion of relative rates of photosynthesis to depth integrated carbon-fixation rate is complicated because the variable fluorescence technique requires calibration. In experiments on the electron requirement for carbon fixation, Barranguet and Kromkamp (2000) obtained a conversion factor of 0.043 when the depth-integrated rates of relative electron transport was regressed against depth-integrated rates of carbon-fixation obtained from short-term 14C-incubations on MPB suspended in water. However, it can be expected that this value will depend on the environmental conditions (Lawrenz et al., 2013). Quantifying the light absorbed by the surface biofilm is difficult but taking the baseline fluorescence level (Fo) as a proxy for the light absorbed has shown to be a useful approach (Serôdio, 2003). Méléder and co-workers have developed an optical primary production model based on hyperspectral reflectance (Méléder et al., 2018; Launeau et al., 2018), but the model needs further validation with in-situ data.
Here, a 2-week period of intensive, non-destructive optical measurements of an intertidal mudflat is used to address unknowns in three key areas of MPB ecology: spatial and temporal variability of surface photosynthetic biofilms, patterns of vertical migration allowing biofilm formation on the sediment surface, and environmental controls of photosynthesis in undisturbed MPB biofilms in the field in relation to the use of variable fluorescence. The development of small-scale patchiness and photosynthetic activity was measured quasi-continuously during a spring-neap cycle in a temperate estuarine setting. High resolution optical measurements were used to track changes in surface photosynthetic biomass, and photosynthesis was measured using a rapid light curve (RLC) with sequential increases in irradiance, together with measurement of photosystem-II quantum efficiency under naturally fluctuating solar irradiance. As the latter gives an instantaneous measurement of the photosynthetic activity it should be possible to assess if the standard sequential RLCs give the same information, or that the method introduces artifacts. Together, the data set allows the investigation of the effect of patchiness and changing environmental conditions during the spring-neap cycle on the photosynthetic activity.
Materials and Methods
Study Site
The experiment took place during May 2003 at a site in the Kapelle Bank, in the Westerschelde estuary (Figure 1). The site was located close to the foot of a dyke (Netherlands National Grid, RD 056368, 386506 or WGS84: N 51°27.539′E 003°58.078′), at a shore height with equal immersion and emersion times of approximately 6 h. At the beginning of the experiment on 15 May the whole of this intertidal bay had a dense cover of epipelic diatoms. The measurements were taken approximately 5 m from the foot of the dike. A sampling bridge was constructed from wooden pallets and bricks in order to reach the site without causing disturbance (Figure 2).
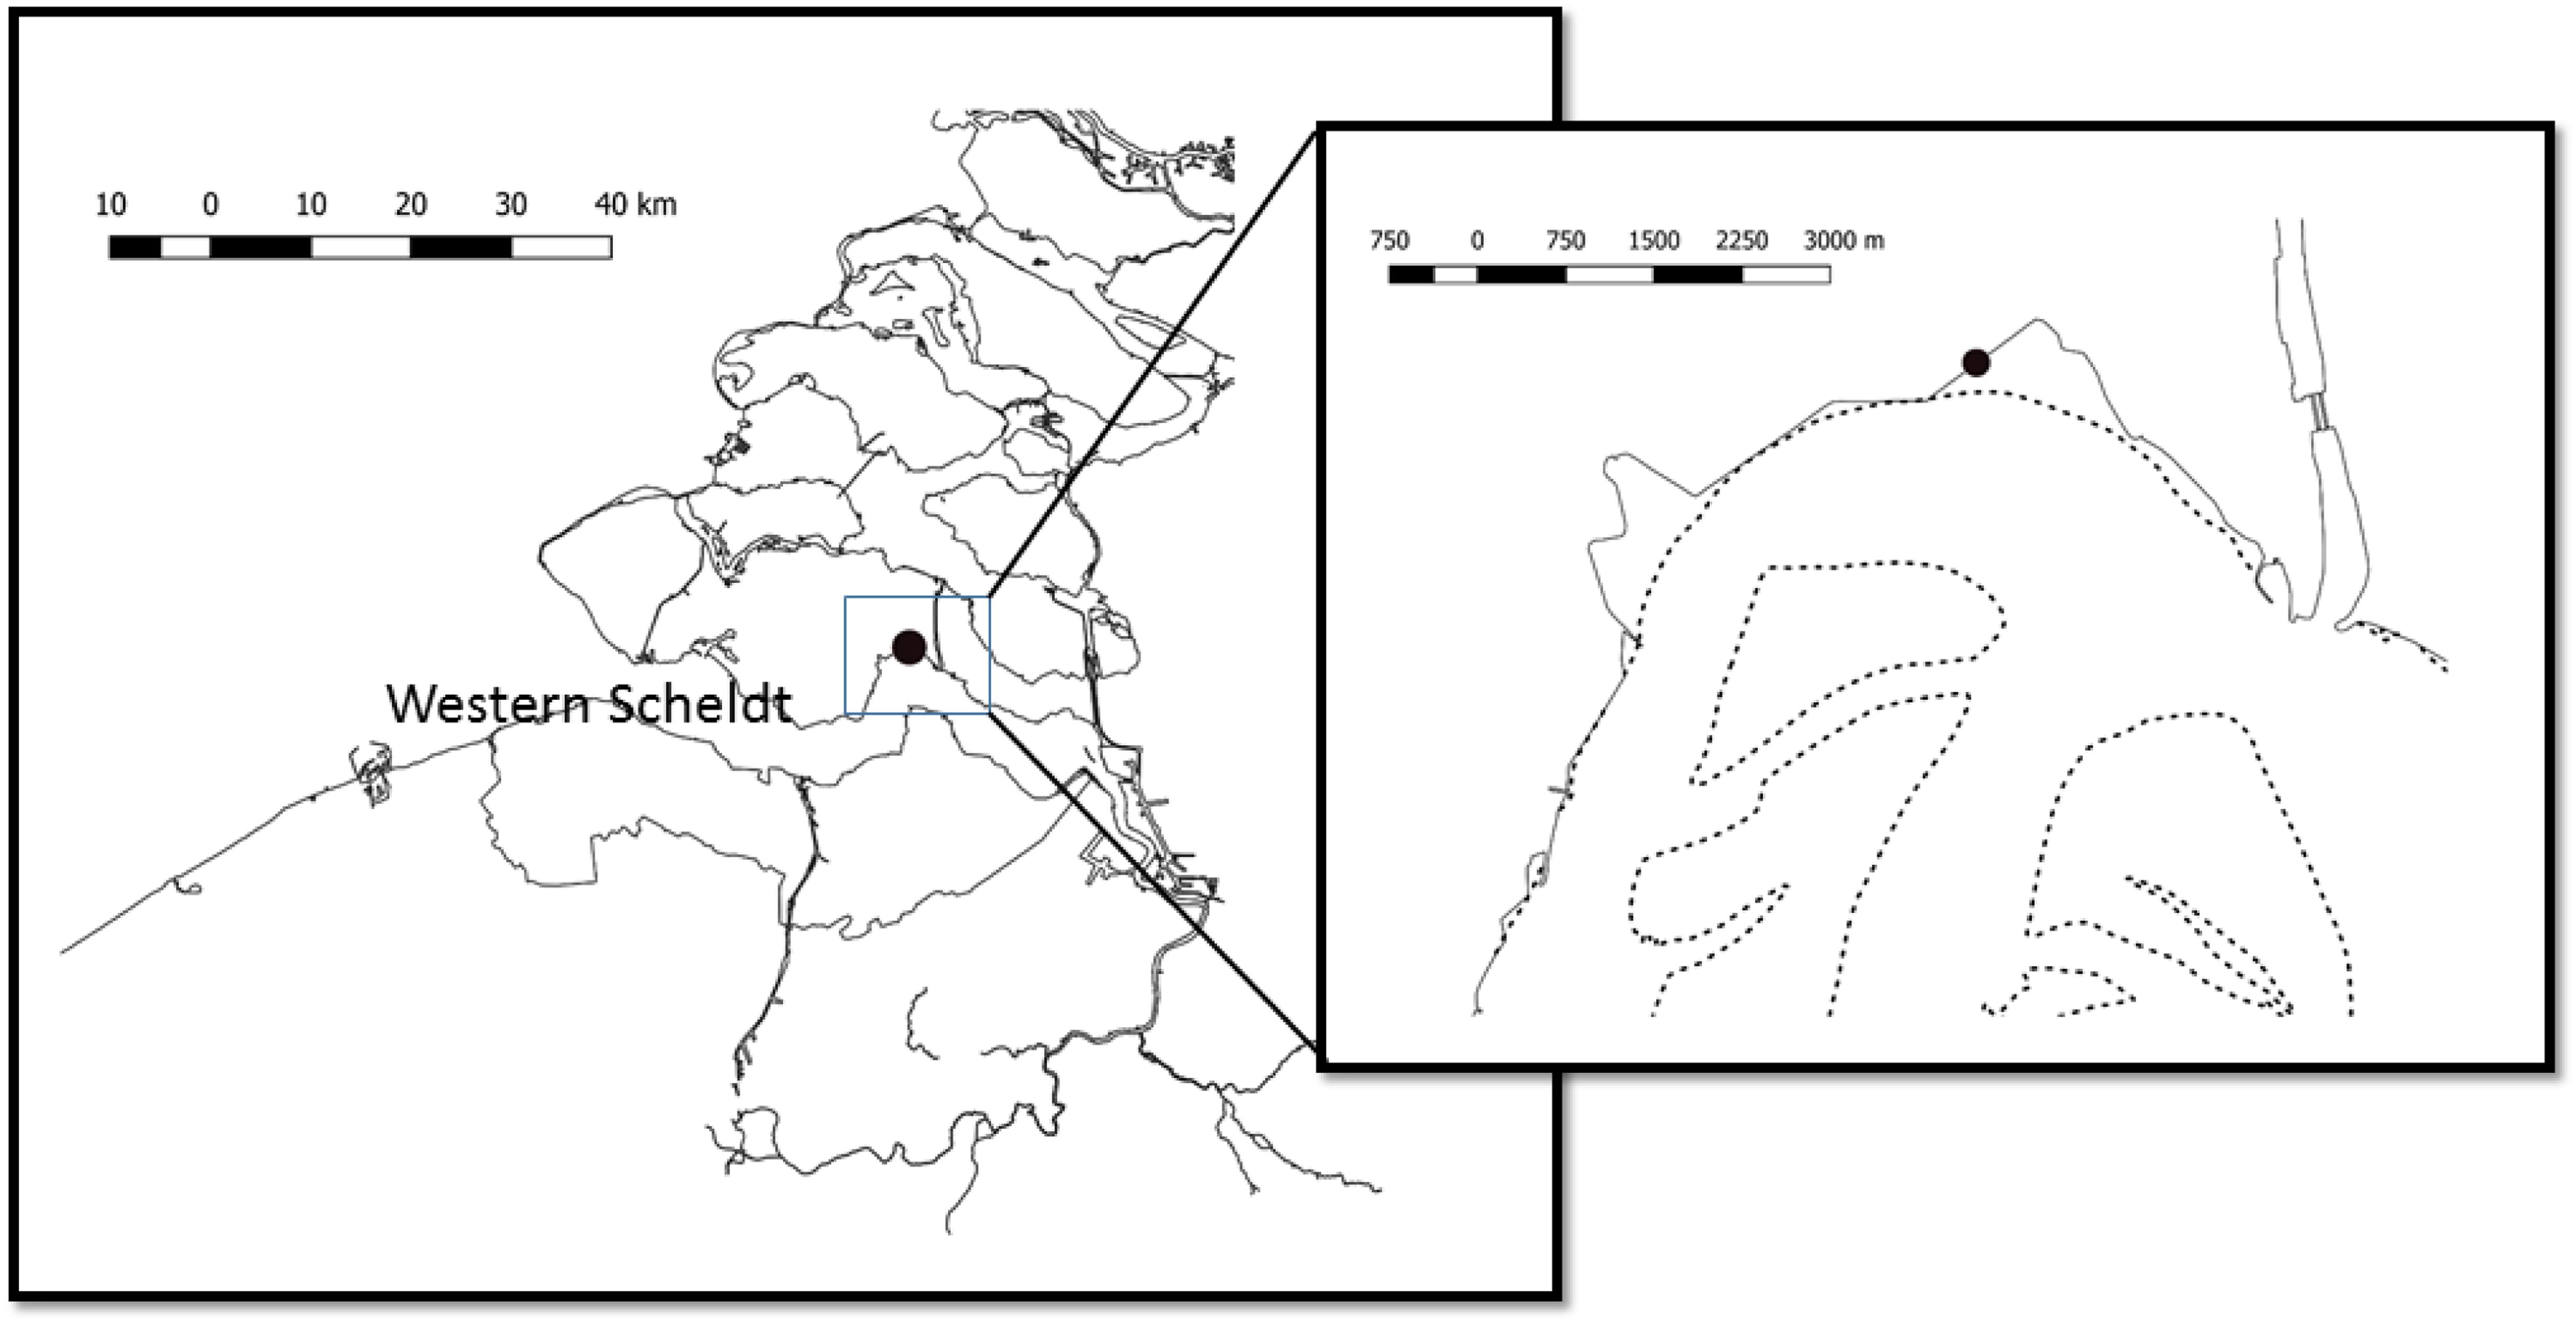
Figure 1. Location of the study site at the Kapelle Bank within the Westerschelde (Western Scheldt) estuary in the south-west of Netherlands. The dotted lines show the mean low tide line delimiting intertidal flats.

Figure 2. Setup of the sampling platform showing the removable “bridge” to the 1-m transect marked by the vertical frame to the left of the image.
A frame was placed at the front of the sampling bridge, creating a 1.05 m long transect along which detailed hyperspectral reflectance measurements were made at eight evenly spaced positions along the transect in order to follow the dynamics in MPB biomass. The bridge was removed after every sampling in order to prevent changes in current velocity during the high water period. Two anchor points ensured that the frame was always in the exact same location. Sampling was done at 2-day intervals for a period of 2 weeks during daytime low tides, with 15 min-to-hourly measurement intervals. The final sampling was on 28 May. Fluorescence measurements for photosynthetic activity were measured just outside the frame in order not to disturb the biomass dynamics along the 1 m transect.
Measurements
Two optical techniques were used to quantify MPB biomass: chlorophyll fluorescence (Honeywill et al., 2002; Jesus et al., 2005; Kromkamp et al., 2006), and hyperspectral reflectance (Forster and Jesus, 2006; Kromkamp et al., 2006). The advantage of the latter technique is that the signal is not influenced by fluorescence quenching in bright light, which can lead to an underestimation of the real chlorophyll concentration at the sediment surface. Indices based on hyperspectral reflectance measurements (such as the normalized difference vegetation index (NDVI; Kromkamp et al., 2006) have been shown to correlate very well with measured chlorophyll concentrations of the sediment surface, thus opening the applicability of remote sensing techniques to study spatial distribution patterns of MPB over large scales using drones or satellite remote sensing (van der Wal et al., 2010; Daggers et al., 2018; Launeau et al., 2018).
Reflectance Measurements
Hyperspectral reflectance was measured with a Ramses ARC-VIS spectrometer (TriOS optical sensors, Germany) with a 7° field of view as Lus/Lur where Lu is the reflected upwelling radiance from the sediment and the reflectance standard, respectively. A white polystyrene plate served as standard. The reflectance of this plate was calibrated against a white Spectralon reflectance standard with 99% reflectance (Labsphere Inc., North Sutton, NH, United States). The spectral characteristics of polystyrene plate differed less than 5% as compared to the Spectralon standard (Kromkamp et al., 2006). Dynamic changes in MPB biomass during low tide were followed using the normalized difference vegetation index (NDVI) which was calculated as NDVI = (R750 – R675)/(R750 + R675) where R750 and R675 are the measured reflectances at 750 and 675 nm, respectively. A linear relationship between NDVI and chlorophyll-a (chl a) concentrations (as mg chla m–2) was found by Kromkamp et al. (2006). Although NDVI values could be converted to chl a using the relationship published in that paper specific for the Westerschelde mud habitat (Grid YA, chl a = 437 × NDVI + 21), we choose to present the raw NDVI values as a proxy for MPB biomass to facilitate comparison with other MPB remote sensing studies. Reflectance measurements were performed at 15 cm intervals along the 1.05 m transect with duplicate measurements at hourly intervals. In total, 826 reflectance spectra were collected over 2 weeks.
Relative growth rate was estimated as the change in NDVI for a sampling position between successive measurement events at time 1 and time 2:
Vertical migration of the biomass was predicted using the model of Pinckney and Zingmark (1991). A standardized tide angle was obtained by multiplying the time interval between the time of measurement and the previous time of high tide with a conversion factor, which was obtained from the time interval between successive high tides divided by 360°. The sun angle at a particular time was calculated by dividing the time interval between local sunrise and sunset by 180° and multiplying this difference with the same conversion factor. Three NDVI proxies were calculated: (1) The measured normalized average NDVI along the transect where the initial value upon arrival at the site immediately after tidal emersion was set to 1. (2) The raw predicted NDVI: this property was calculated as [(A × tide + sun angle) + B] + (C × sun angle) + D, where A (=2.020073), B (0.452419), C (0.375736), and D (0.452149) are fit constants. (3) The normalized predicted NDVI. The Solver function of Microsoft Excel was used to optimize the model fit over the 2-week period by optimizing the values of A, B, C, and D.
Variable Fluorescence Measurements
Photosynthetic activity was measured in two ways:
(1) A Diving-PAM (Walz GmbH, Germany) measured at 5 min intervals the in-situ activity of the undisturbed MPB biofilm. This was done by placing the optical fiber of the Diving-PAM in a customized holder with a 45° angle very close to a randomly selected area of the sediment surface. The angle of the fiber ensured that the fiber did not cast a shadow on the sediment. At the same time the ambient solar irradiance was measured using the light sensor of the Diving-PAM which was cross calibrated against a LiCor LI-190R photosynthetically active radiation (PAR) quantum sensor.
(2) Rapid light curves were made using a Mini-PAM (Walz GmbH, Germany) with 15 min dark acclimation and 30 s light steps. The optical fiber of the MiniPAM was placed in a custom-made dark chamber in such a way that the tip of the fiber was held vertically 4 mm above the sediment surface. At this distance the irradiance values generated by the RLC protocol of the mini-PAM using an internal halogen light source were calibrated using the same LiCor LI-190R as used for calibrating the Diving-PAM PAR values.
The measurement of minimal and maximum fluorescence was done before(Fo) and during a saturating flash (Fm) using previously optimized instrument settings for both variants of the method.
Quality control: fluorescence values below the detection limit of the fluorimeters were removed. The quantum yield (Fv/Fm in the dark-acclimated state, or ΔF/Fm′ in the light, Kromkamp and Forster, 2006) was calculated from Fv = Fm – Fo after subtraction of a blank value determined on chlorophyll-free sediment. After QC, a total of 709 dark-adapted Fv/Fm measurements, 793 ΔF/Fm’ measurements in natural sunlight, and 109 RLCs with artificial light were measured over 2 weeks. Data were stored in a relational database to enable linkages to be built between environmental data and optical data. The data in this paper can be obtained from the following http://www.vliz.be/en/imis?module=datasetanddasid=1213. Results were summarized into 1-h time blocks for further analysis.
The relative rate of photosystem-II electron transport (rETR) was calculated as rETR = PAR × YII, where YII is the effective quantum efficiency measured by the variable fluorescence technique (Kromkamp and Forster, 2006). The RLCs were fitted using the model of Webb et al. (1974). The parameters describing the fit are rETRm (the maximum rate of rETR) and αrETR (the initial slope), Ek (the irradiance at which rETR saturated was calculated as rETRm/αrETR. In addition, αrETR was also calculated using linear regression through the initial points of the RLC, as the fitting of the data especially at high light influenced the value of the initial slope.
Statistical analyses were carried out in R (R Core Team, 2018) using R-studio (RStudio Team, 2020).
Ancillary Measurements
Air temperatures were measured with a thermometer whereas sediment temperatures were measured with a DivingPAM temperature probe placed in the surface layer. Solar irradiance values were recorded with a LiCor-LI190R-PAR quantum sensor in the field, and a LI-1000 datalogger on the roof of the institute located 10 km from the field site. Rain data from the nearest station at Vlissingen was obtained from the Dutch Meteorological Office (KNMI, available at https://climexp.knmi.nl/data/rxrx 310.dat).
Results
Meteorological Conditions During the Study
The measurement series started on spring tides centered on 15 to 20 May, during which time the prevailing weather conditions were overcast skies with light rainfall and cool daily mean air temperatures of between 11.1 and 14.2°C (Figure 3). Overcast conditions continued as tidal range decreased toward neap tides centered on 22 to 26 May, before a period of clearer skies, light winds, no precipitation, and increasing air temperature became established for the remainder of the experiment (Figure 3). Mud surface temperature (MST) tracked air temperature on cloudy days, but absorption of solar energy caused an additional warming on days with high PAR, resulting in warming of the surface to over 25°C. An empirical linear relationship was established relating MST to PAR over the duration of the study, with 43 paired temperature data points:
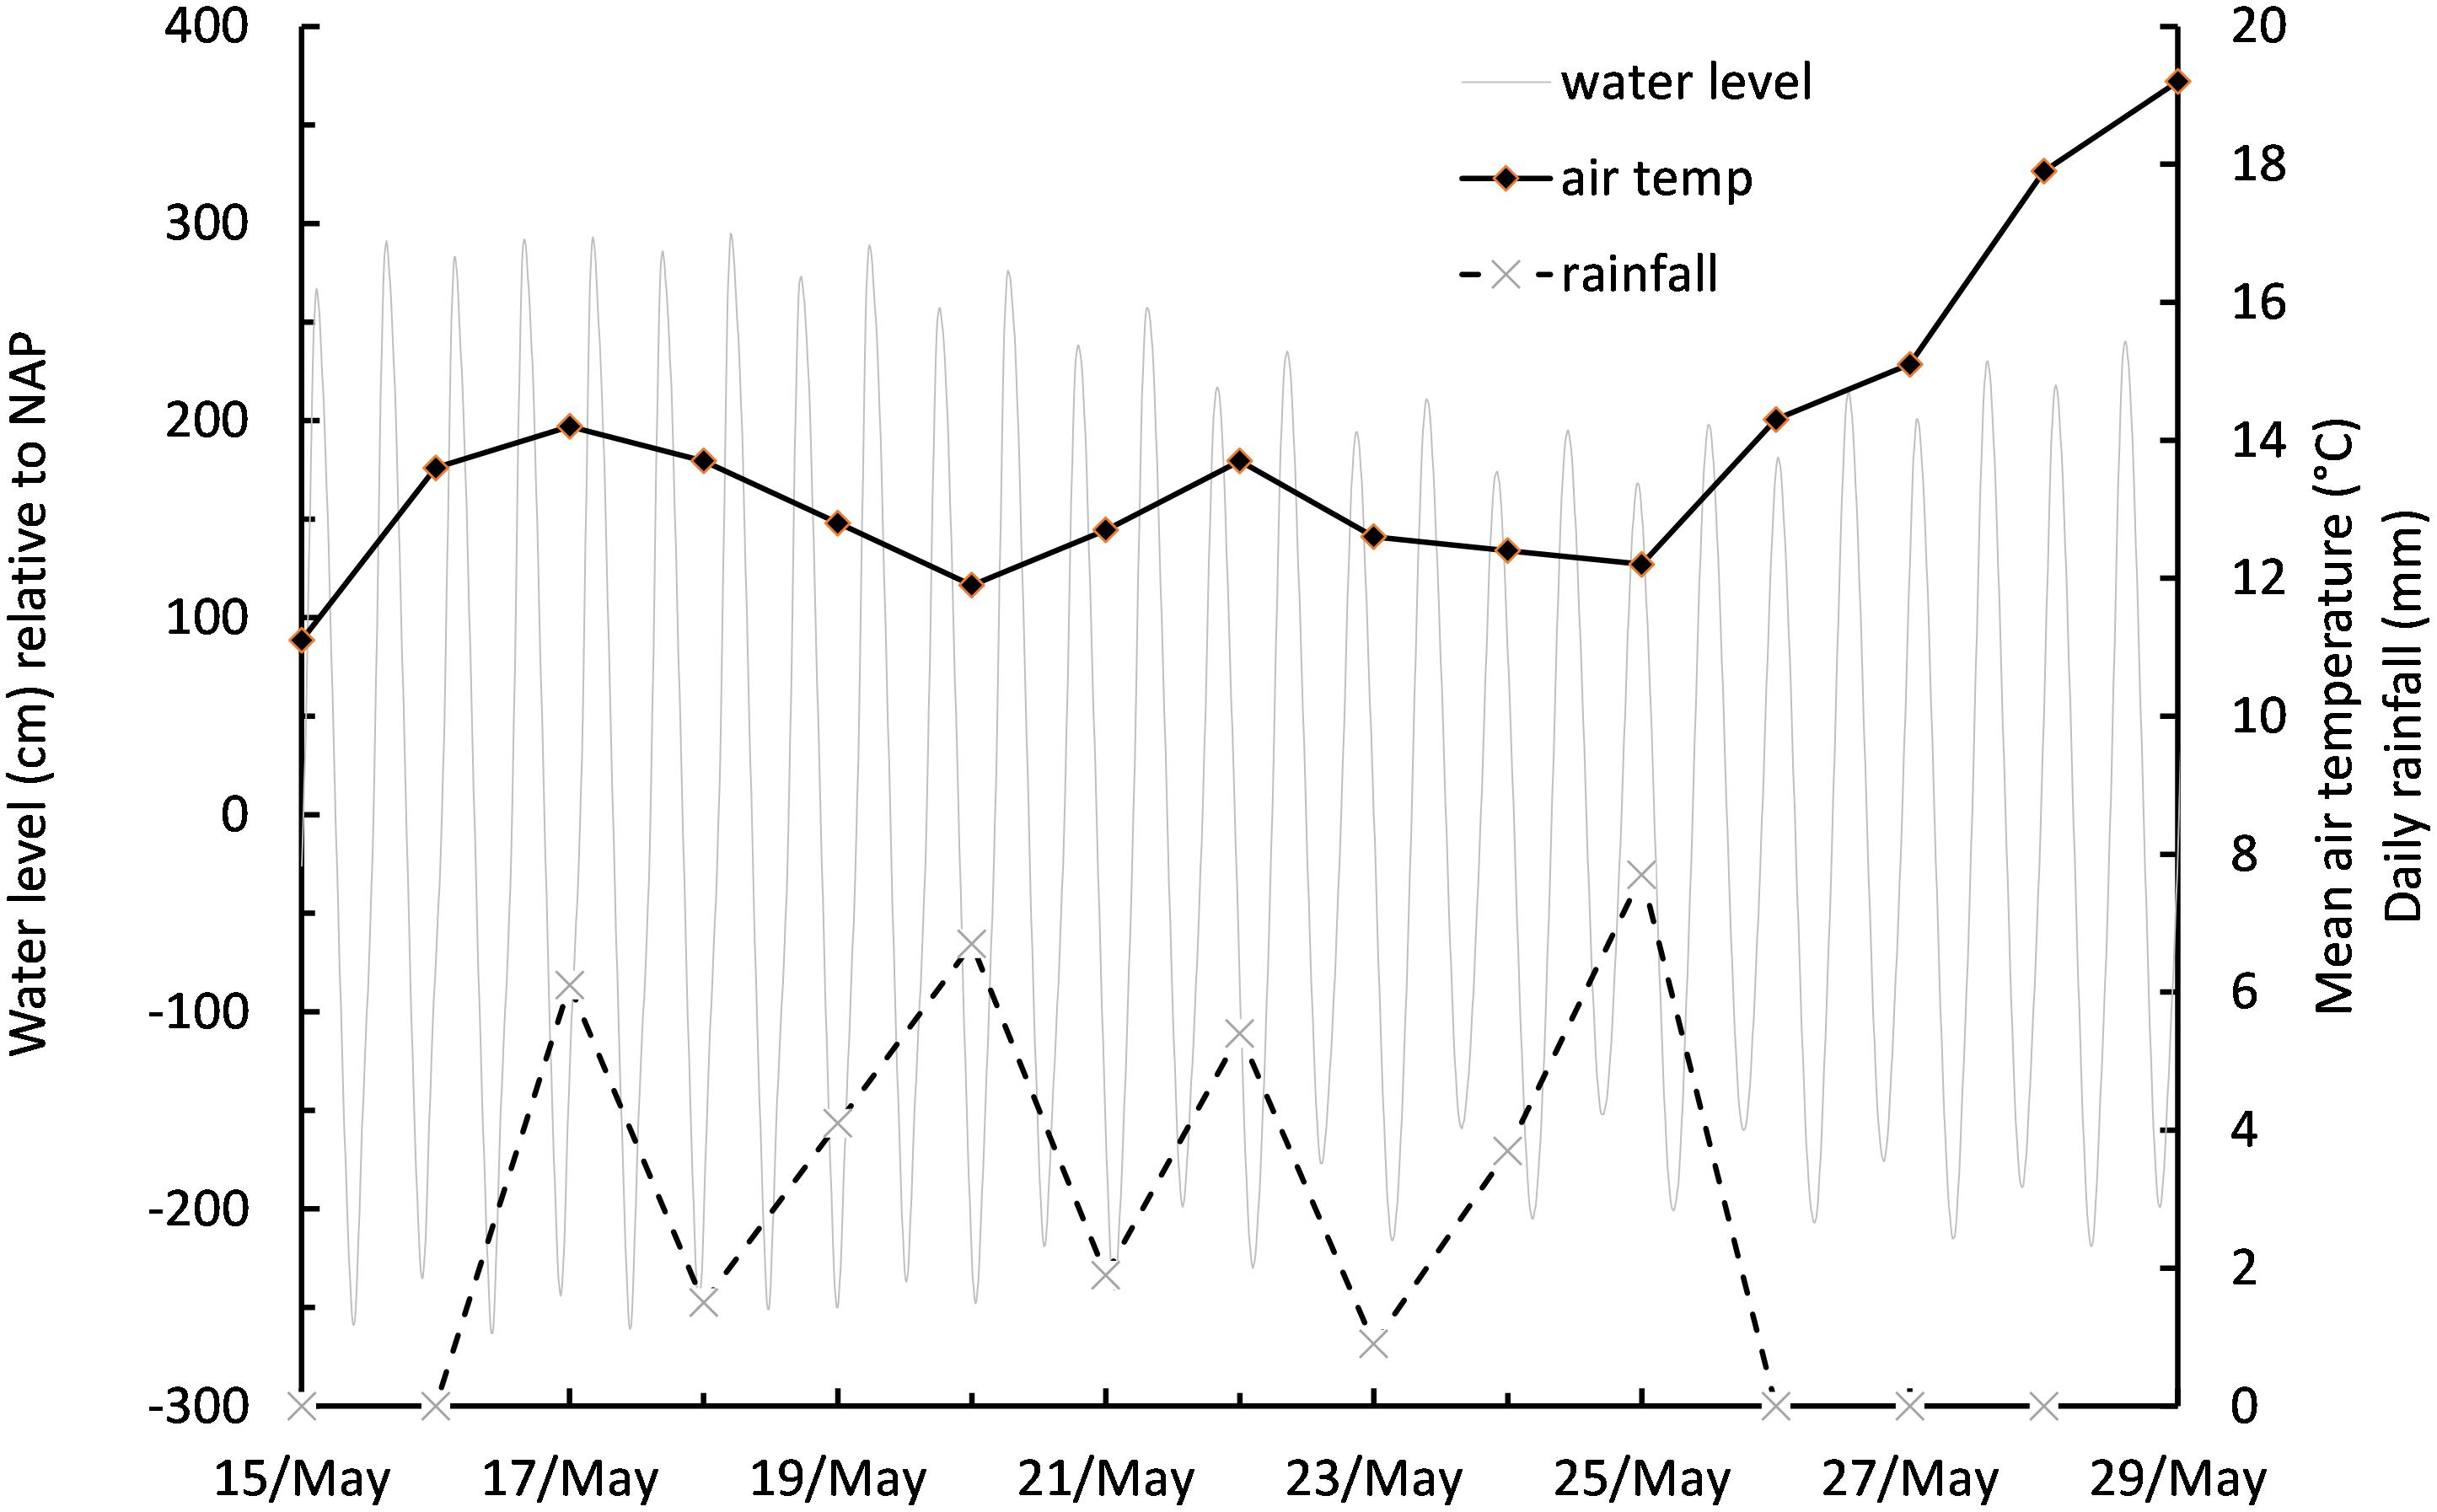
Figure 3. Meteorological and tidal conditions during the measurement period from May 15 to May 28.
MST = b+(a∗PAR); where b is the initial temperature of the mud surface upon emersion (10°C), and a is a scaling factor of 0.012. r2 of the relationship was 0.73.
Changes in MPB Biomass
An average NDVI of 0.269 (with a standard deviation 0.134, lowest value 0.051, highest value 0.690) was estimated for the whole study period, across all times and grid positions. Conversion to chl a resulted in a mean value of 138 mg m–2, which was within the expected range for the spring growth period of MPB at this and other temperate intertidal sites. However, within the overall mean NDVI value over 14 days was hidden a great deal of variability both spatially (at microscale) and temporally (hourly, daily).
Microscale spatial variability was estimated from the coefficient of variability (CV; standard deviation/mean) values along the transect line for each measurement day. Initially, CV was low with values of between 26 and 29% for the period 15 May to 19 May, then variability increased sharply to 63% on the following measurement day (21 May). This was due to a rise in NDVI at position 7, with falls in NDVI at all other positions (Figures 4, 5). Spatial variability then decreased to 60% on 23 May and decreased further to 40% by the final measuring day. The mean spatial CV across the experimental period was 42%.
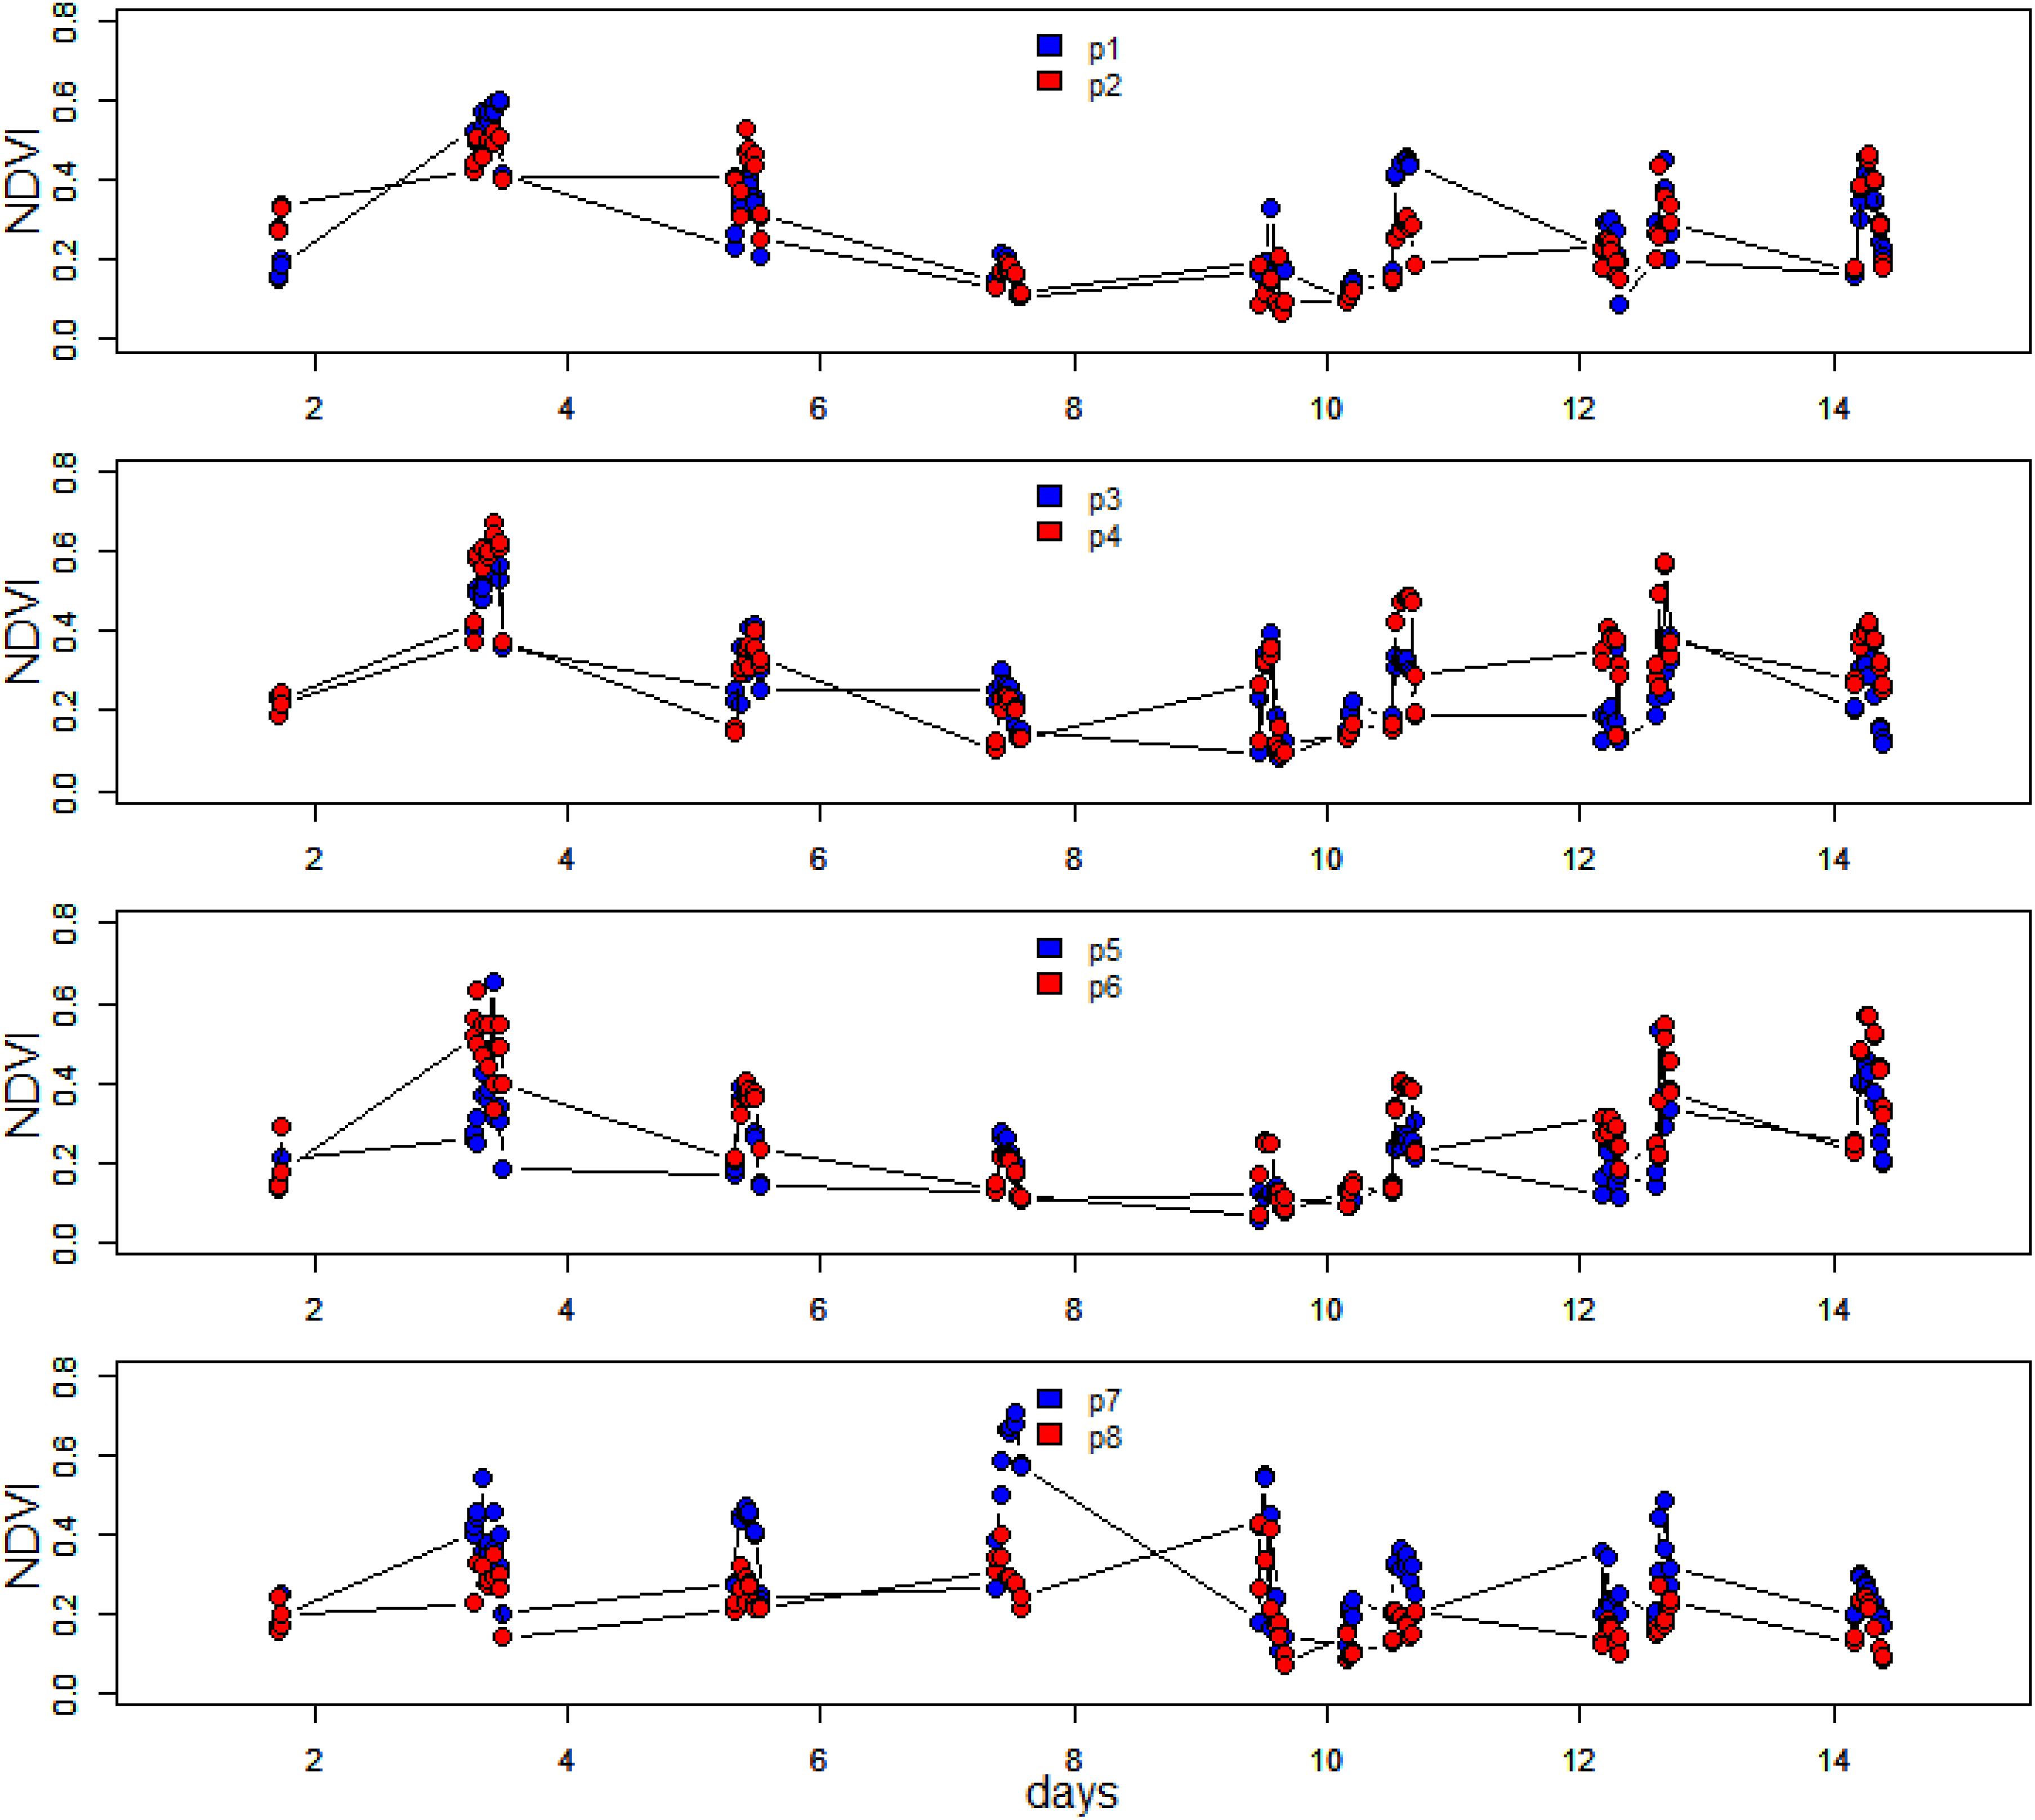
Figure 4. Time series of hourly averaged NDVI over the spring-neap-spring measuring period at the eight different positions along the 1-m transect. The site was sampled every 2 days.
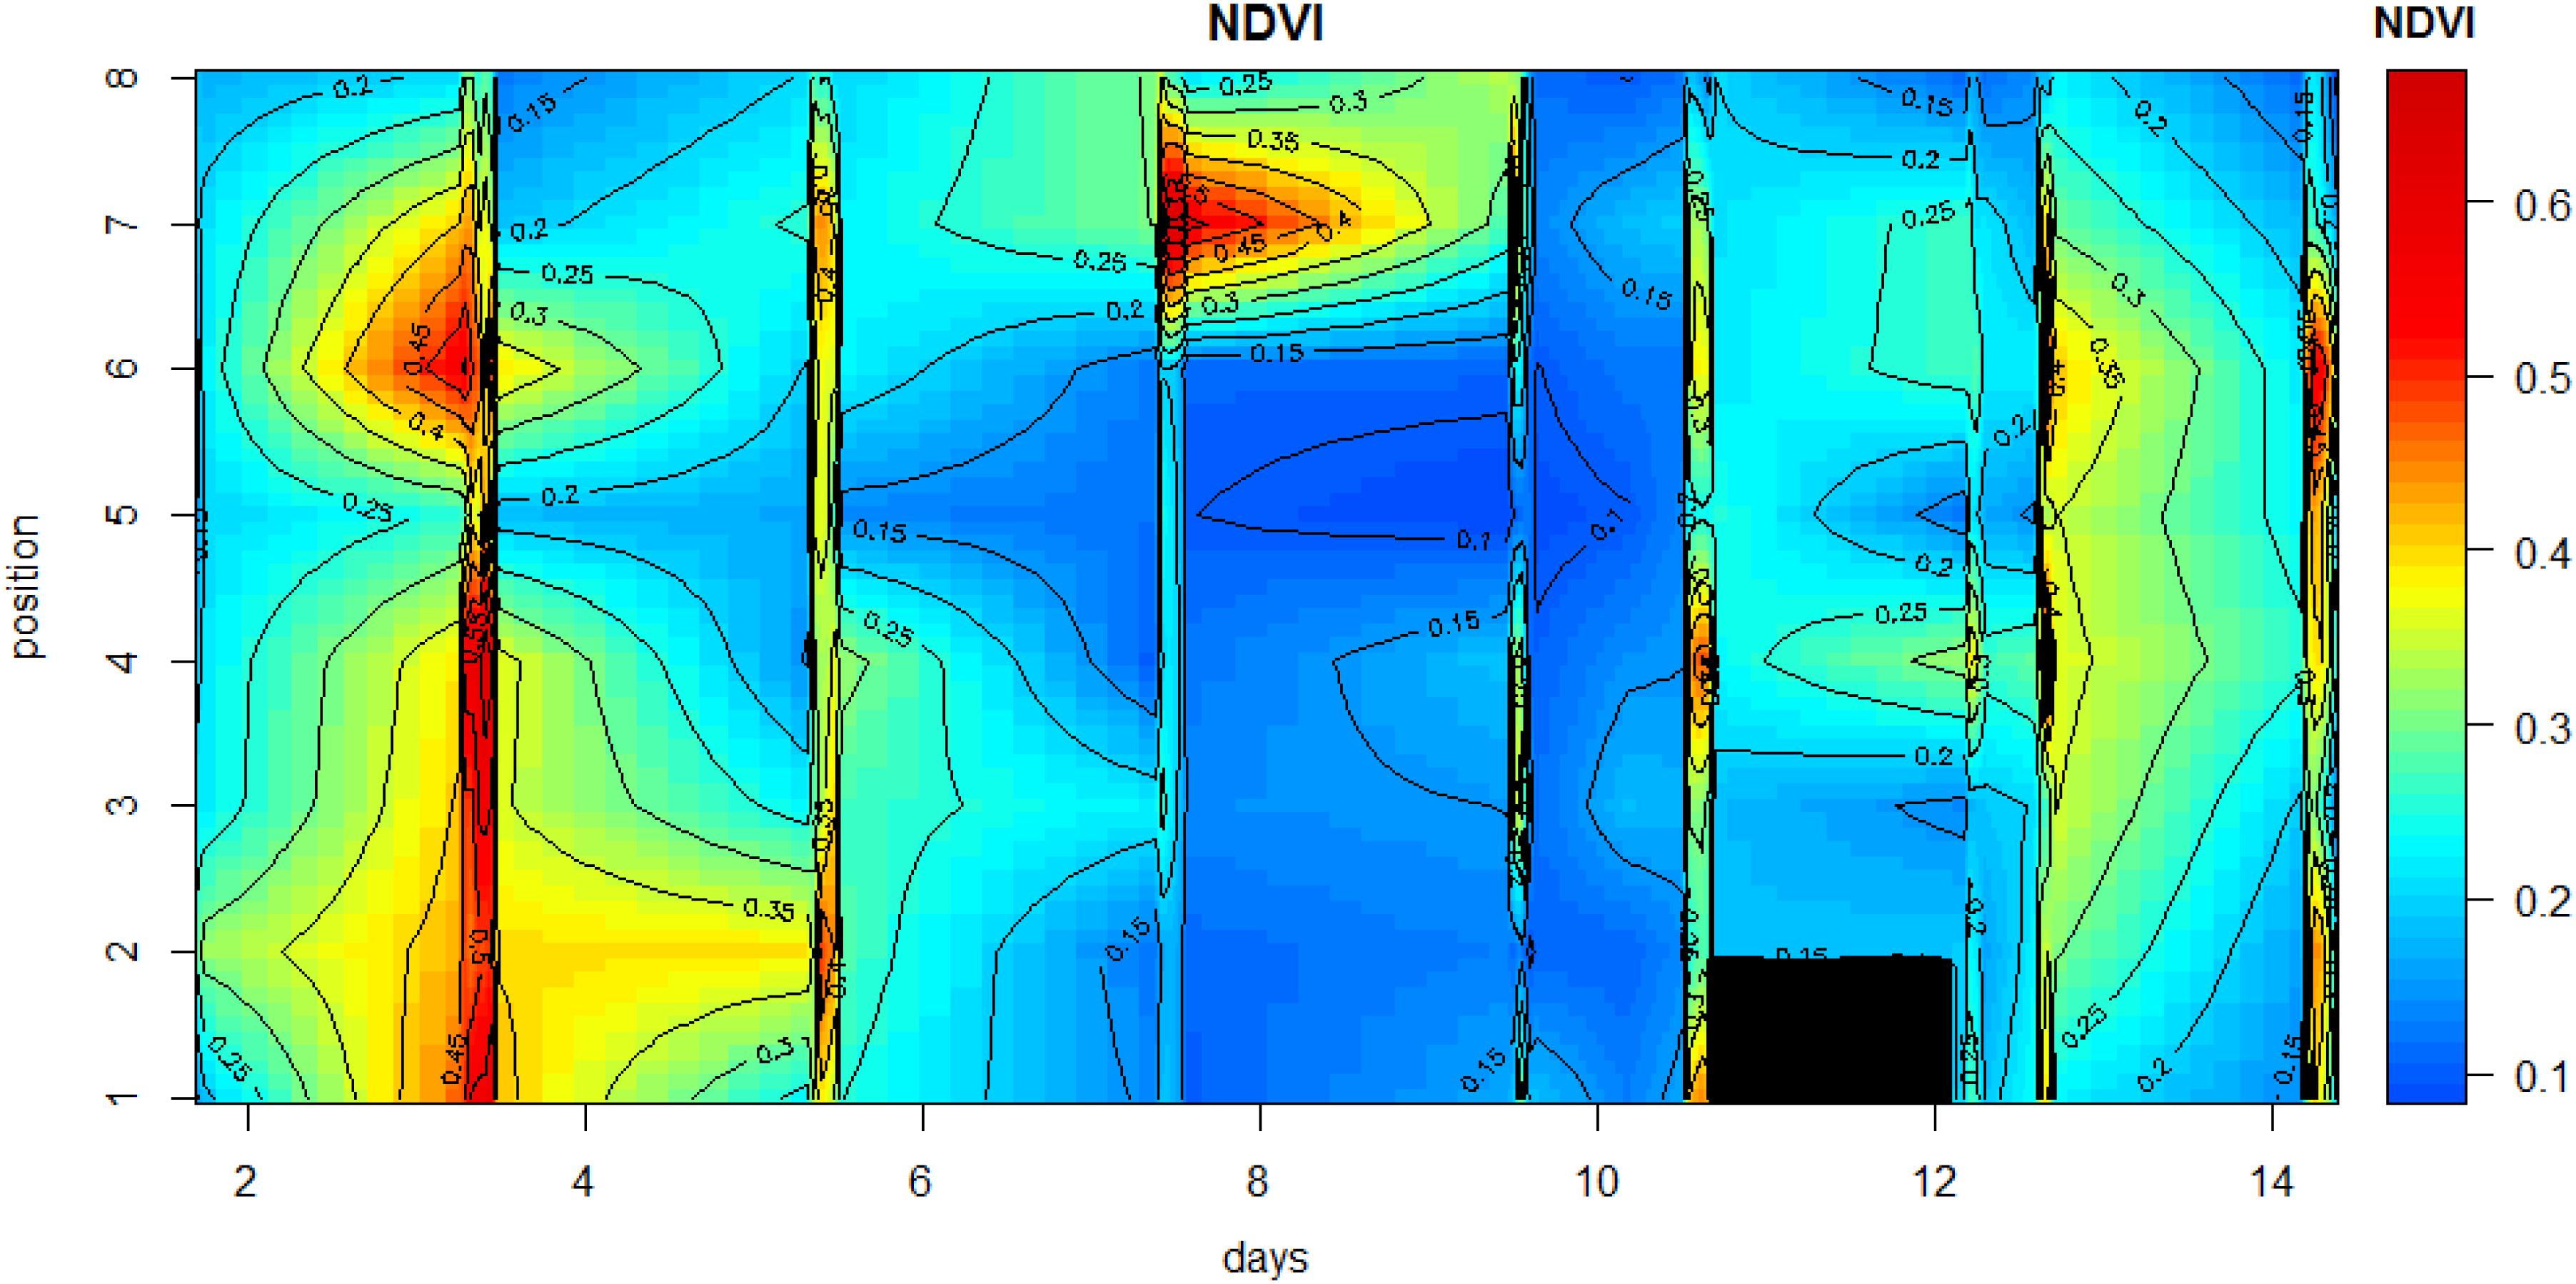
Figure 5. Contour plot of the changes in NDVI along the 1-m transect during the measuring period. The days on which no measurements were carried out were omitted from the data plot in order to avoid gaps in the plot.
Other than positions 3 and 8, which decreased in NDVI over the spring-neap cycle, all other positions showed an increase in biomass (Figure 4), however, biomass was generally lowest around day 6 to 8, after which some increase was noticeable again. Analysis of the position-specific relative growth rate between successive sampling events showed that the number of events with a decreased NDVI (27 events with RGR from −0.51 to 0 d–1) was approximately equal to the number of events with a positive growth rate (30 events with RGR from 0 to 0.57 d–1). The spatial patterns become more obvious when the NDVI data are plotted as a contour plot (Figure 5). Growth rate was positive with a mean value of 0.38 d–1 for all positions over the first 2 days, followed by a 6-day period of declining NDVI from 19 to 23 May (Figures 4, 5), then a phase of weak positive growth through to 28 May. Integrating NDVI values over the whole 2-week period gave an overall growth rate of 0.02 d–1, resulting in an increase in NDVI of 40% in 2 weeks. The mean temporal CV across the experimental period was 47%.
It was apparent from Figure 4, where within-day values are shown, that a pronounced daily variability in NDVI at the different positions along the 1 m transect was also present. Further examination showed a clear and predictable pattern, with an increase in values in the first 2 h following exposure of the tidal flat, followed by a later decrease before the tide returned. The extent and shape of the profile varied per location and day. For detailed analysis, the daily pattern of NDVI at position 2 was plotted for 4 days throughout the series with different incident irradiance levels (Figure 6), thus showing the extent of dynamic behavior due to vertical migration and giving a clear demonstration of how quickly the surface photosynthetic biomass can change.
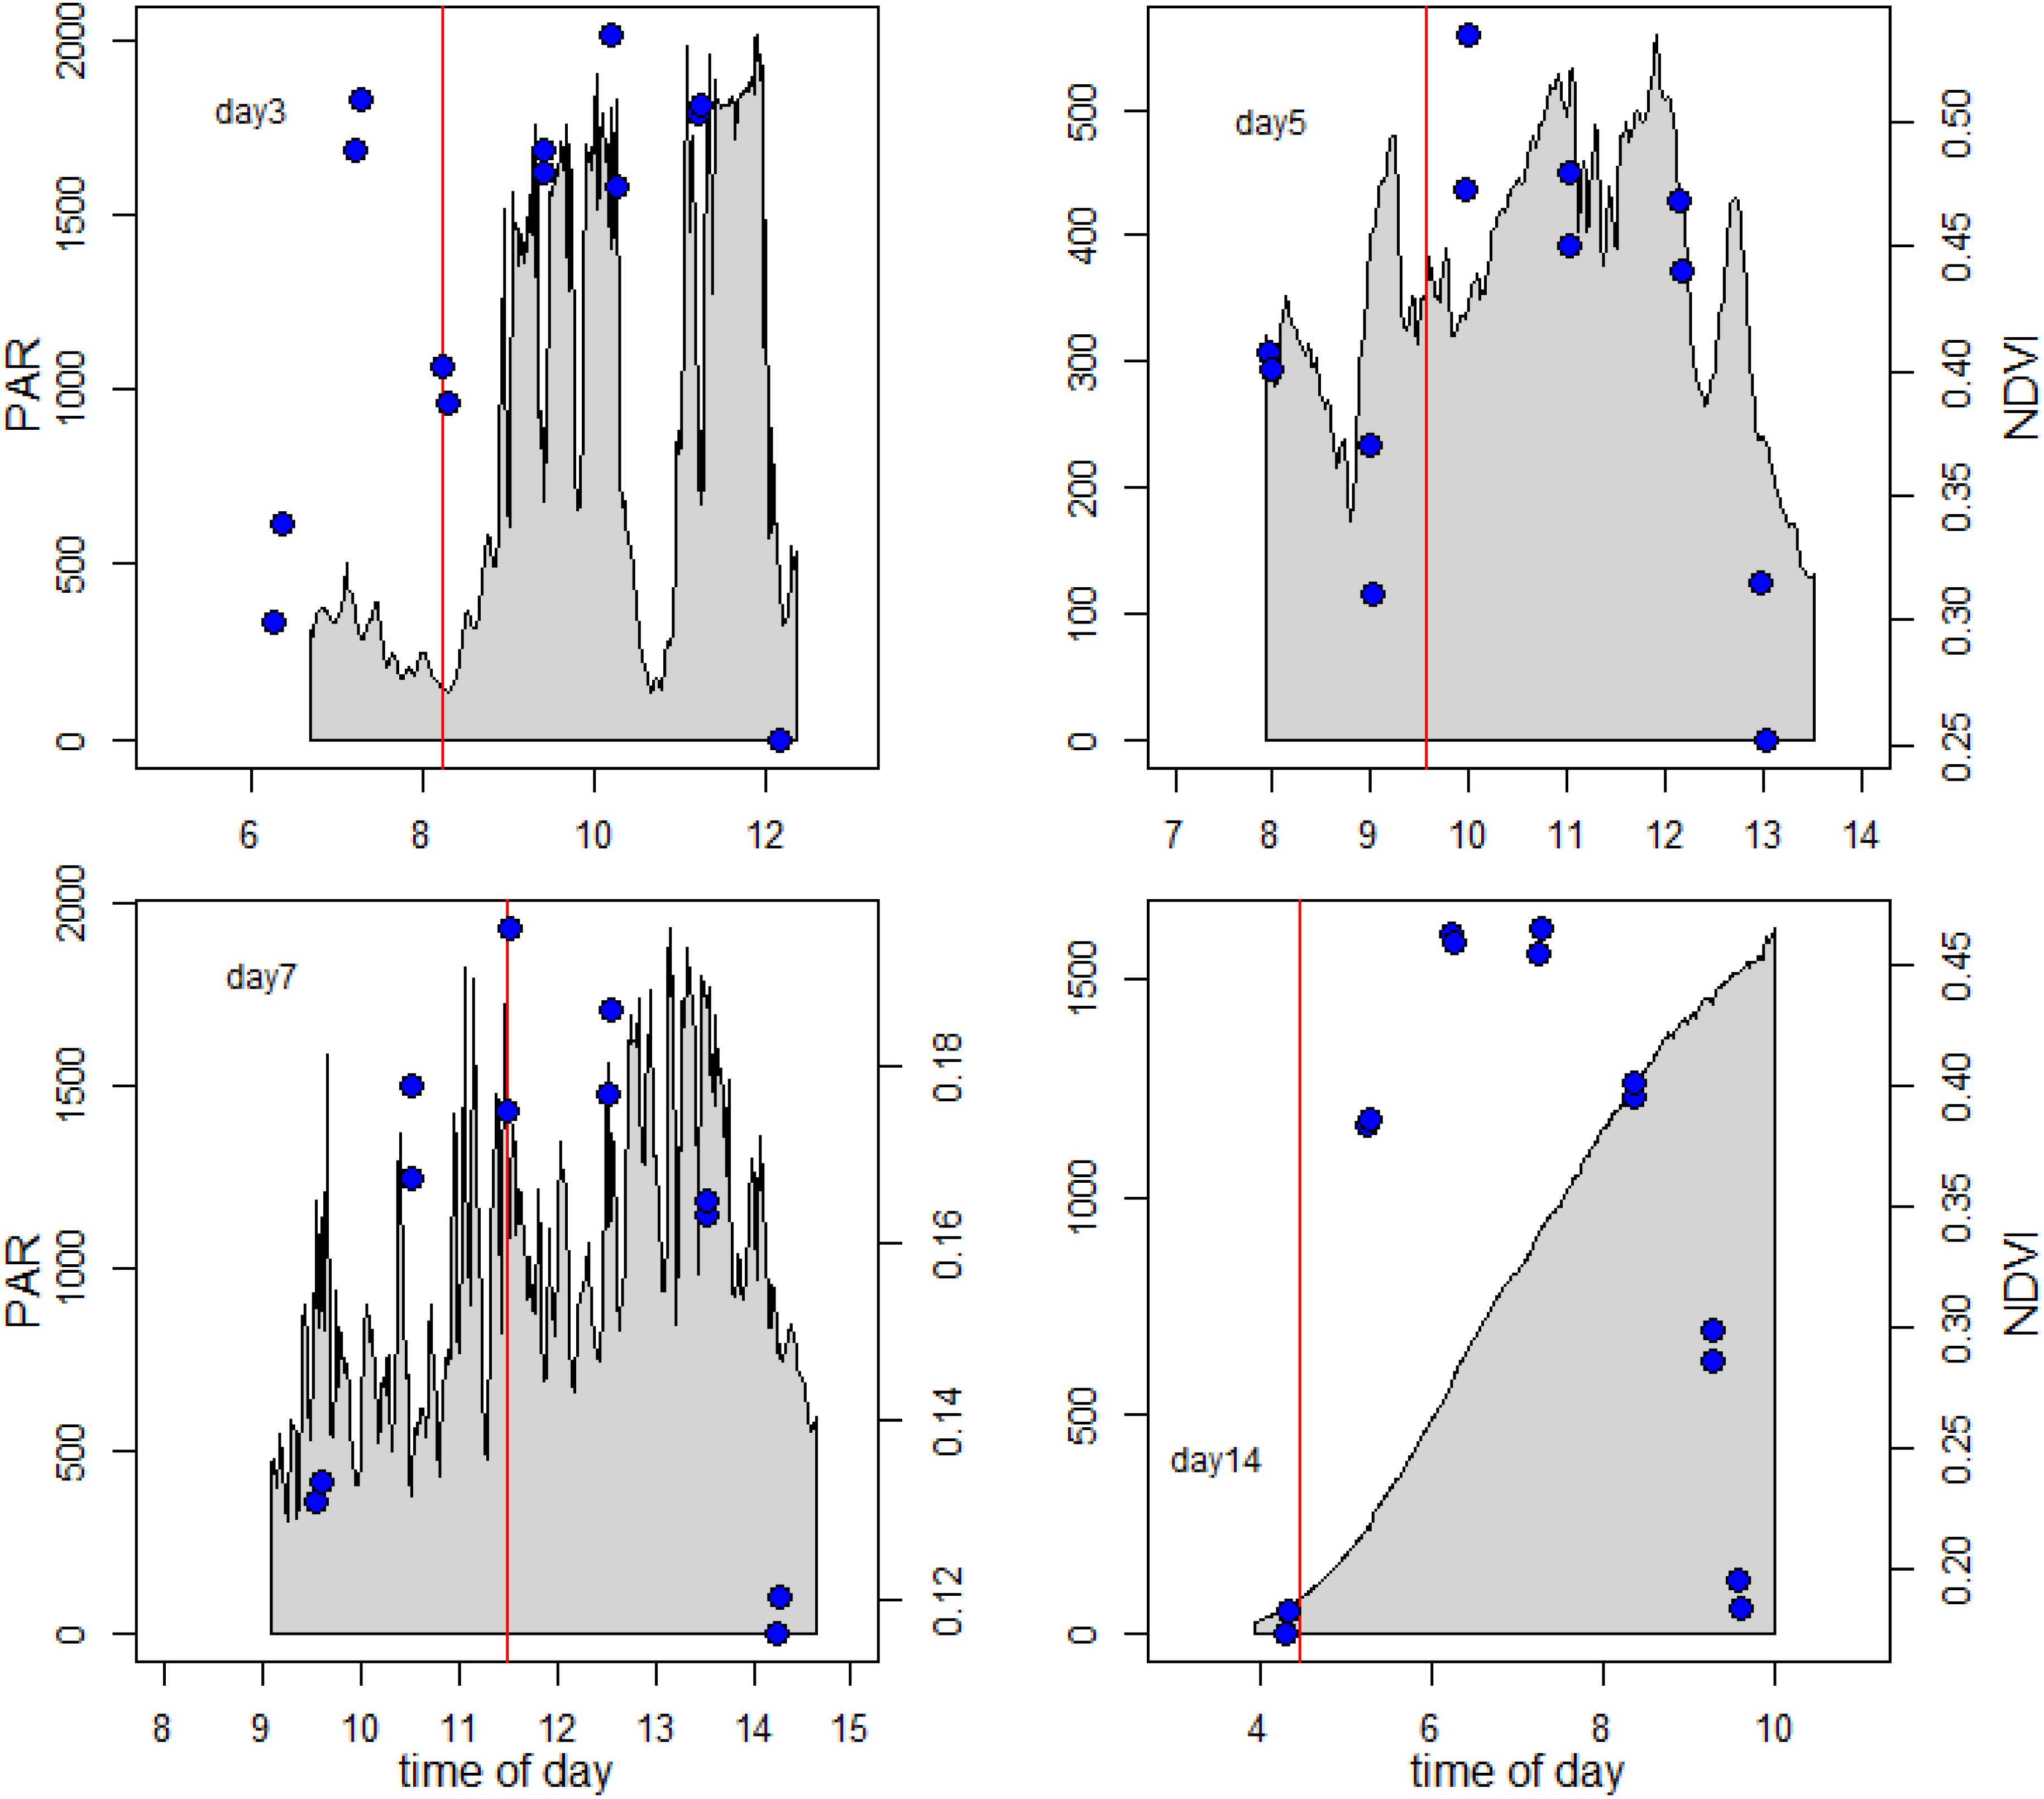
Figure 6. Vertical migration patterns. The blue symbols show the measured NDVI data. The gray area shows the surface solar irradiance during the measuring period. The vertical red line gives the time of low tide.
The examples in Figure 6 clearly suggested that the timing of the migration was coupled to both the timing of the low tide and time of day, as the maximum recorded NDVI values were intermediate between the times of low tide (marked with red line), and time of peak irradiance. Temporary decreases in NDVI, for example at 09:00 on day 5 (19 May) were occasionally observed in association with a decrease in solar irradiance due to clouds, but this was not consistent. A large decrease in irradiance around 11:00 on Day 3 (17 May) was not followed by a decrease in NDVI. On day 14 the mudflat was visited early in the morning at sunrise and it was noticed that the algae had already migrated to the sediment surface during the end of night, with a NDVI value of 0.25.
To further investigate the dependency on tidal state and time of day, the change in NDVI was calculated for each tidal period in relation to the initial NDVI value upon first exposure. A predicted NDVI for each time point was then calculated using tidal and solar elevation coefficients according to Pinckney and Zingmark (1991) (see section “Materials and Methods” for details). Graphs of measured versus predicted NDVI clearly showed that the timing of the migration was more coupled strongly to the timing of the tide (Figure 7), with a weaker association with solar elevation. Instances of NDVI rising as solar elevation was decreasing were recorded on the afternoon and evening tides of day 12 and 14. Deviations from the predicted values occurred on days 3, 9, and 10 (Figure 7). The predicted level of surface biomass failed to appear on day 3 and day 9, whereas biomass on day 10 was higher than predicted from the initial values. Plotted as a function of the measured normalized NDVI values, the predicted values from tidal and sun angle modeling show a correlation (Figure 8; r2 = 0.59 n = 103). The role of the tidal cycle alone as the leading factor in determining the pattern of surface biomass was demonstrated by a high r2 of 0.56 when solar angle was excluded. Excluding the anomalous days 3, 9, and 10 improved the r2 value to 0.87.
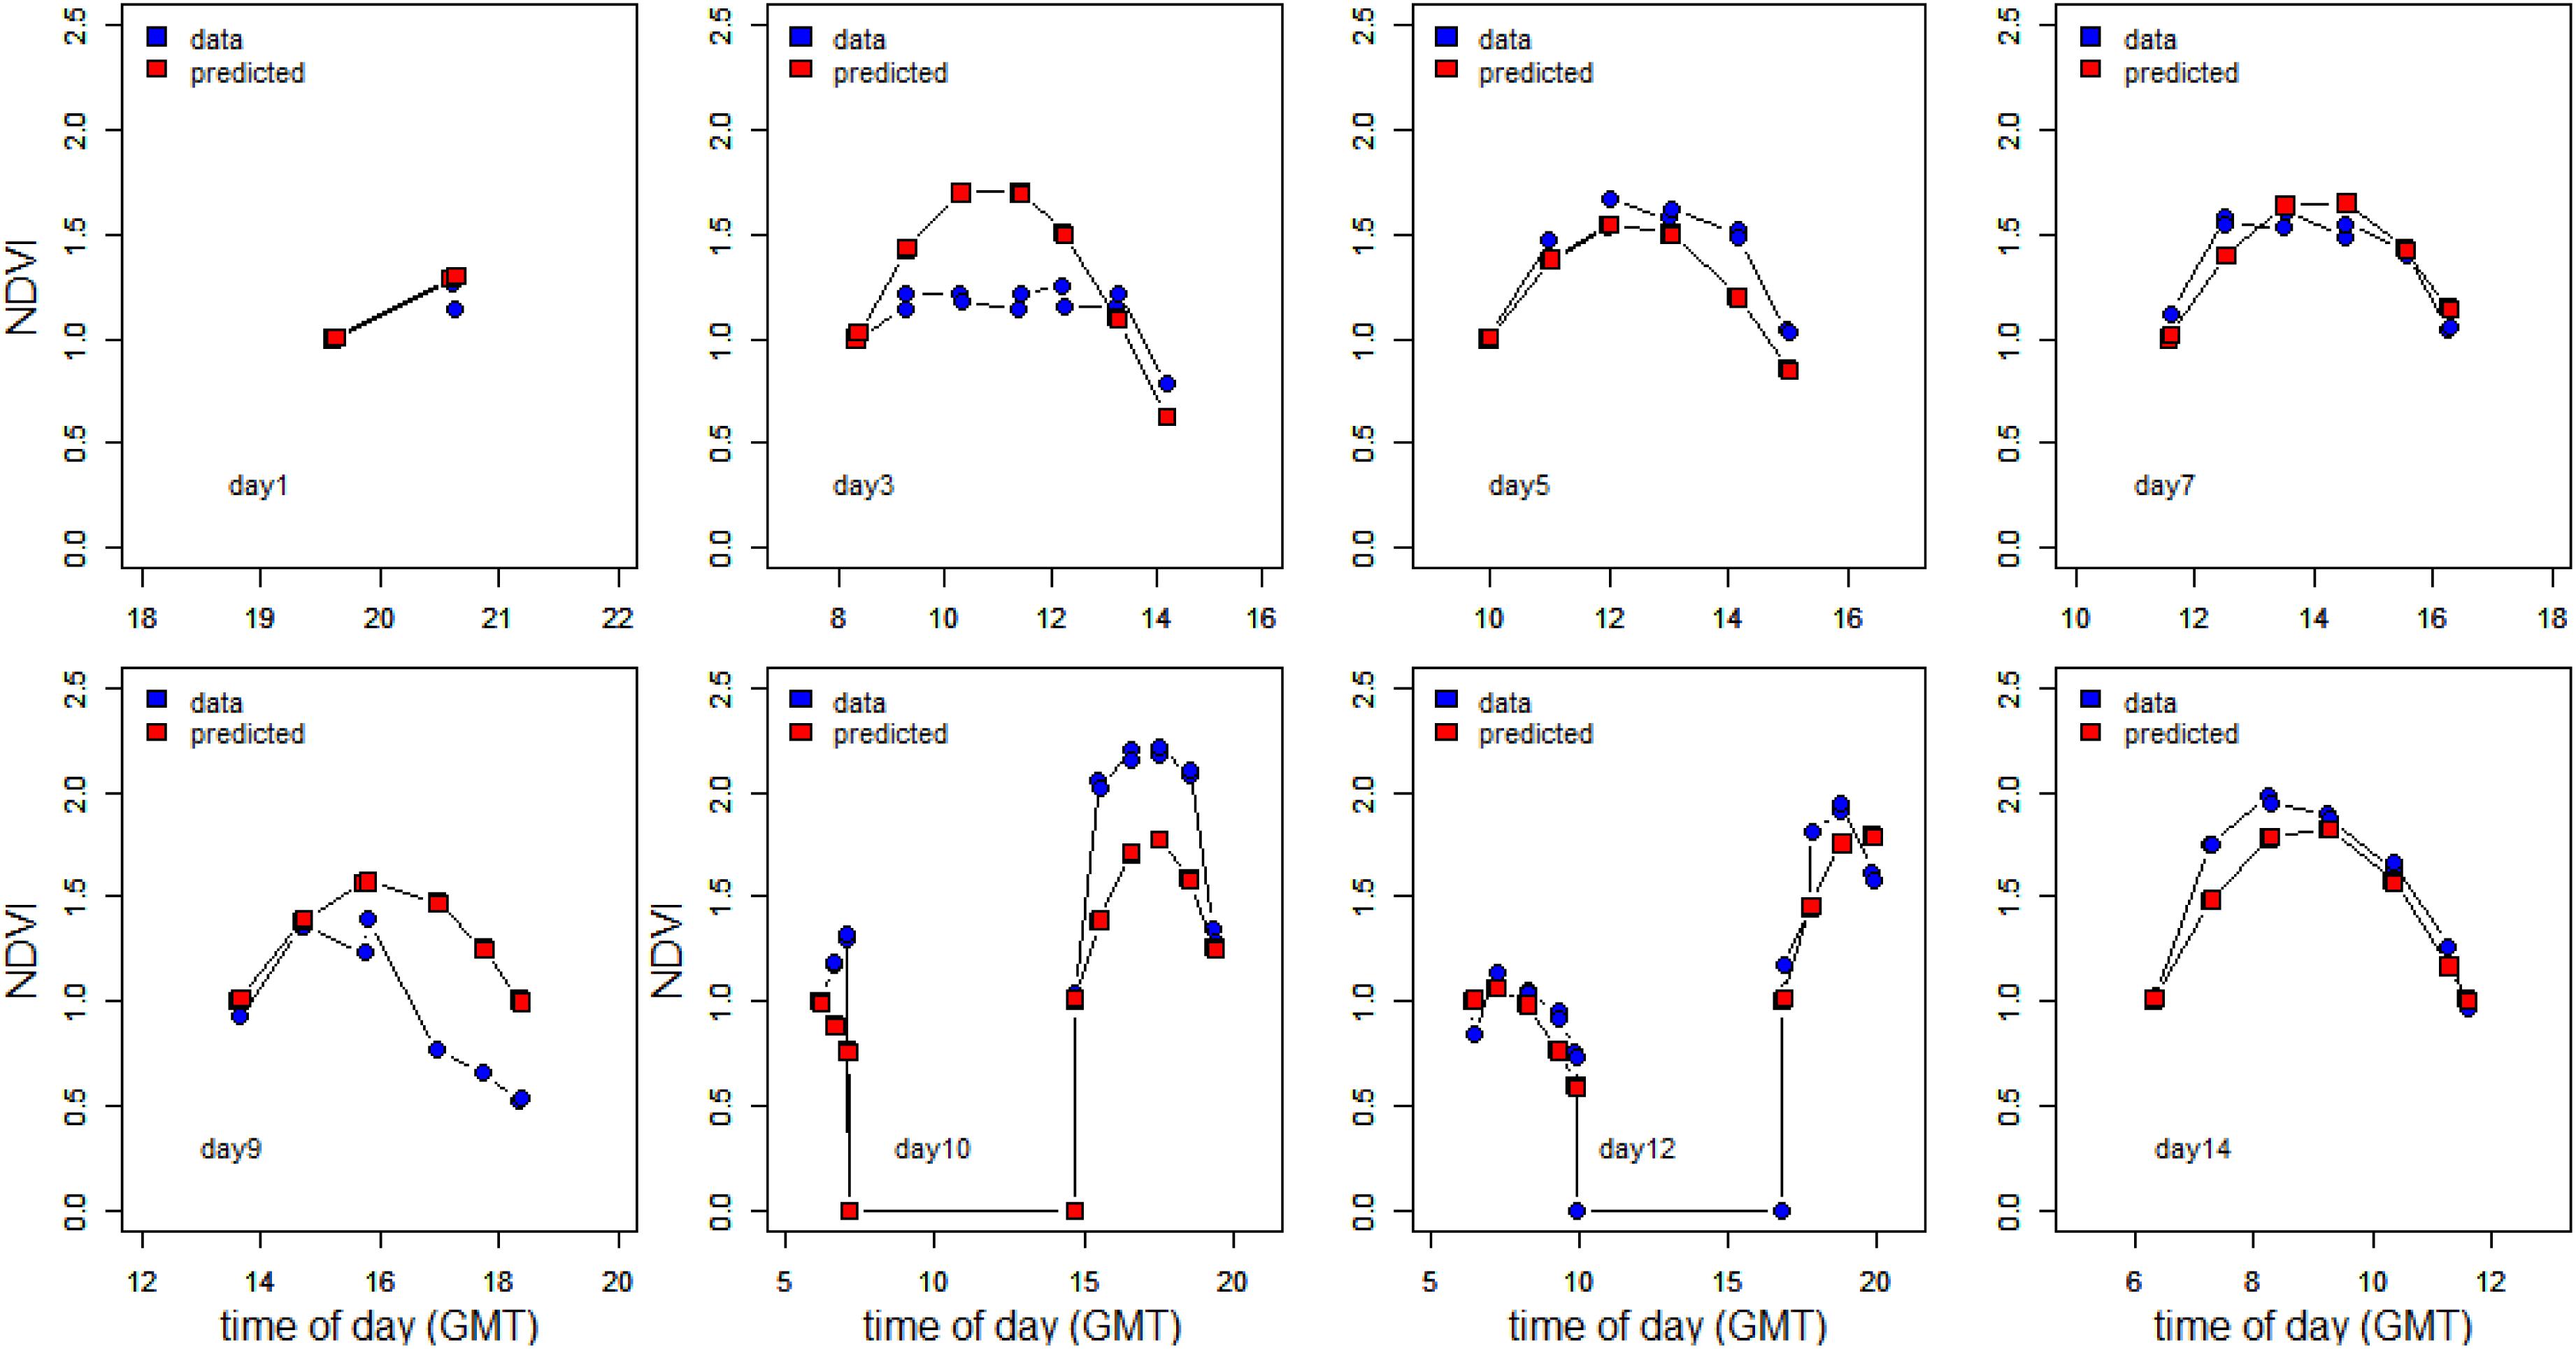
Figure 7. Measured vs. predicted NDVI values. The NDVI values were normalized to the initial values measured immediately after emersion of the tidal flat.
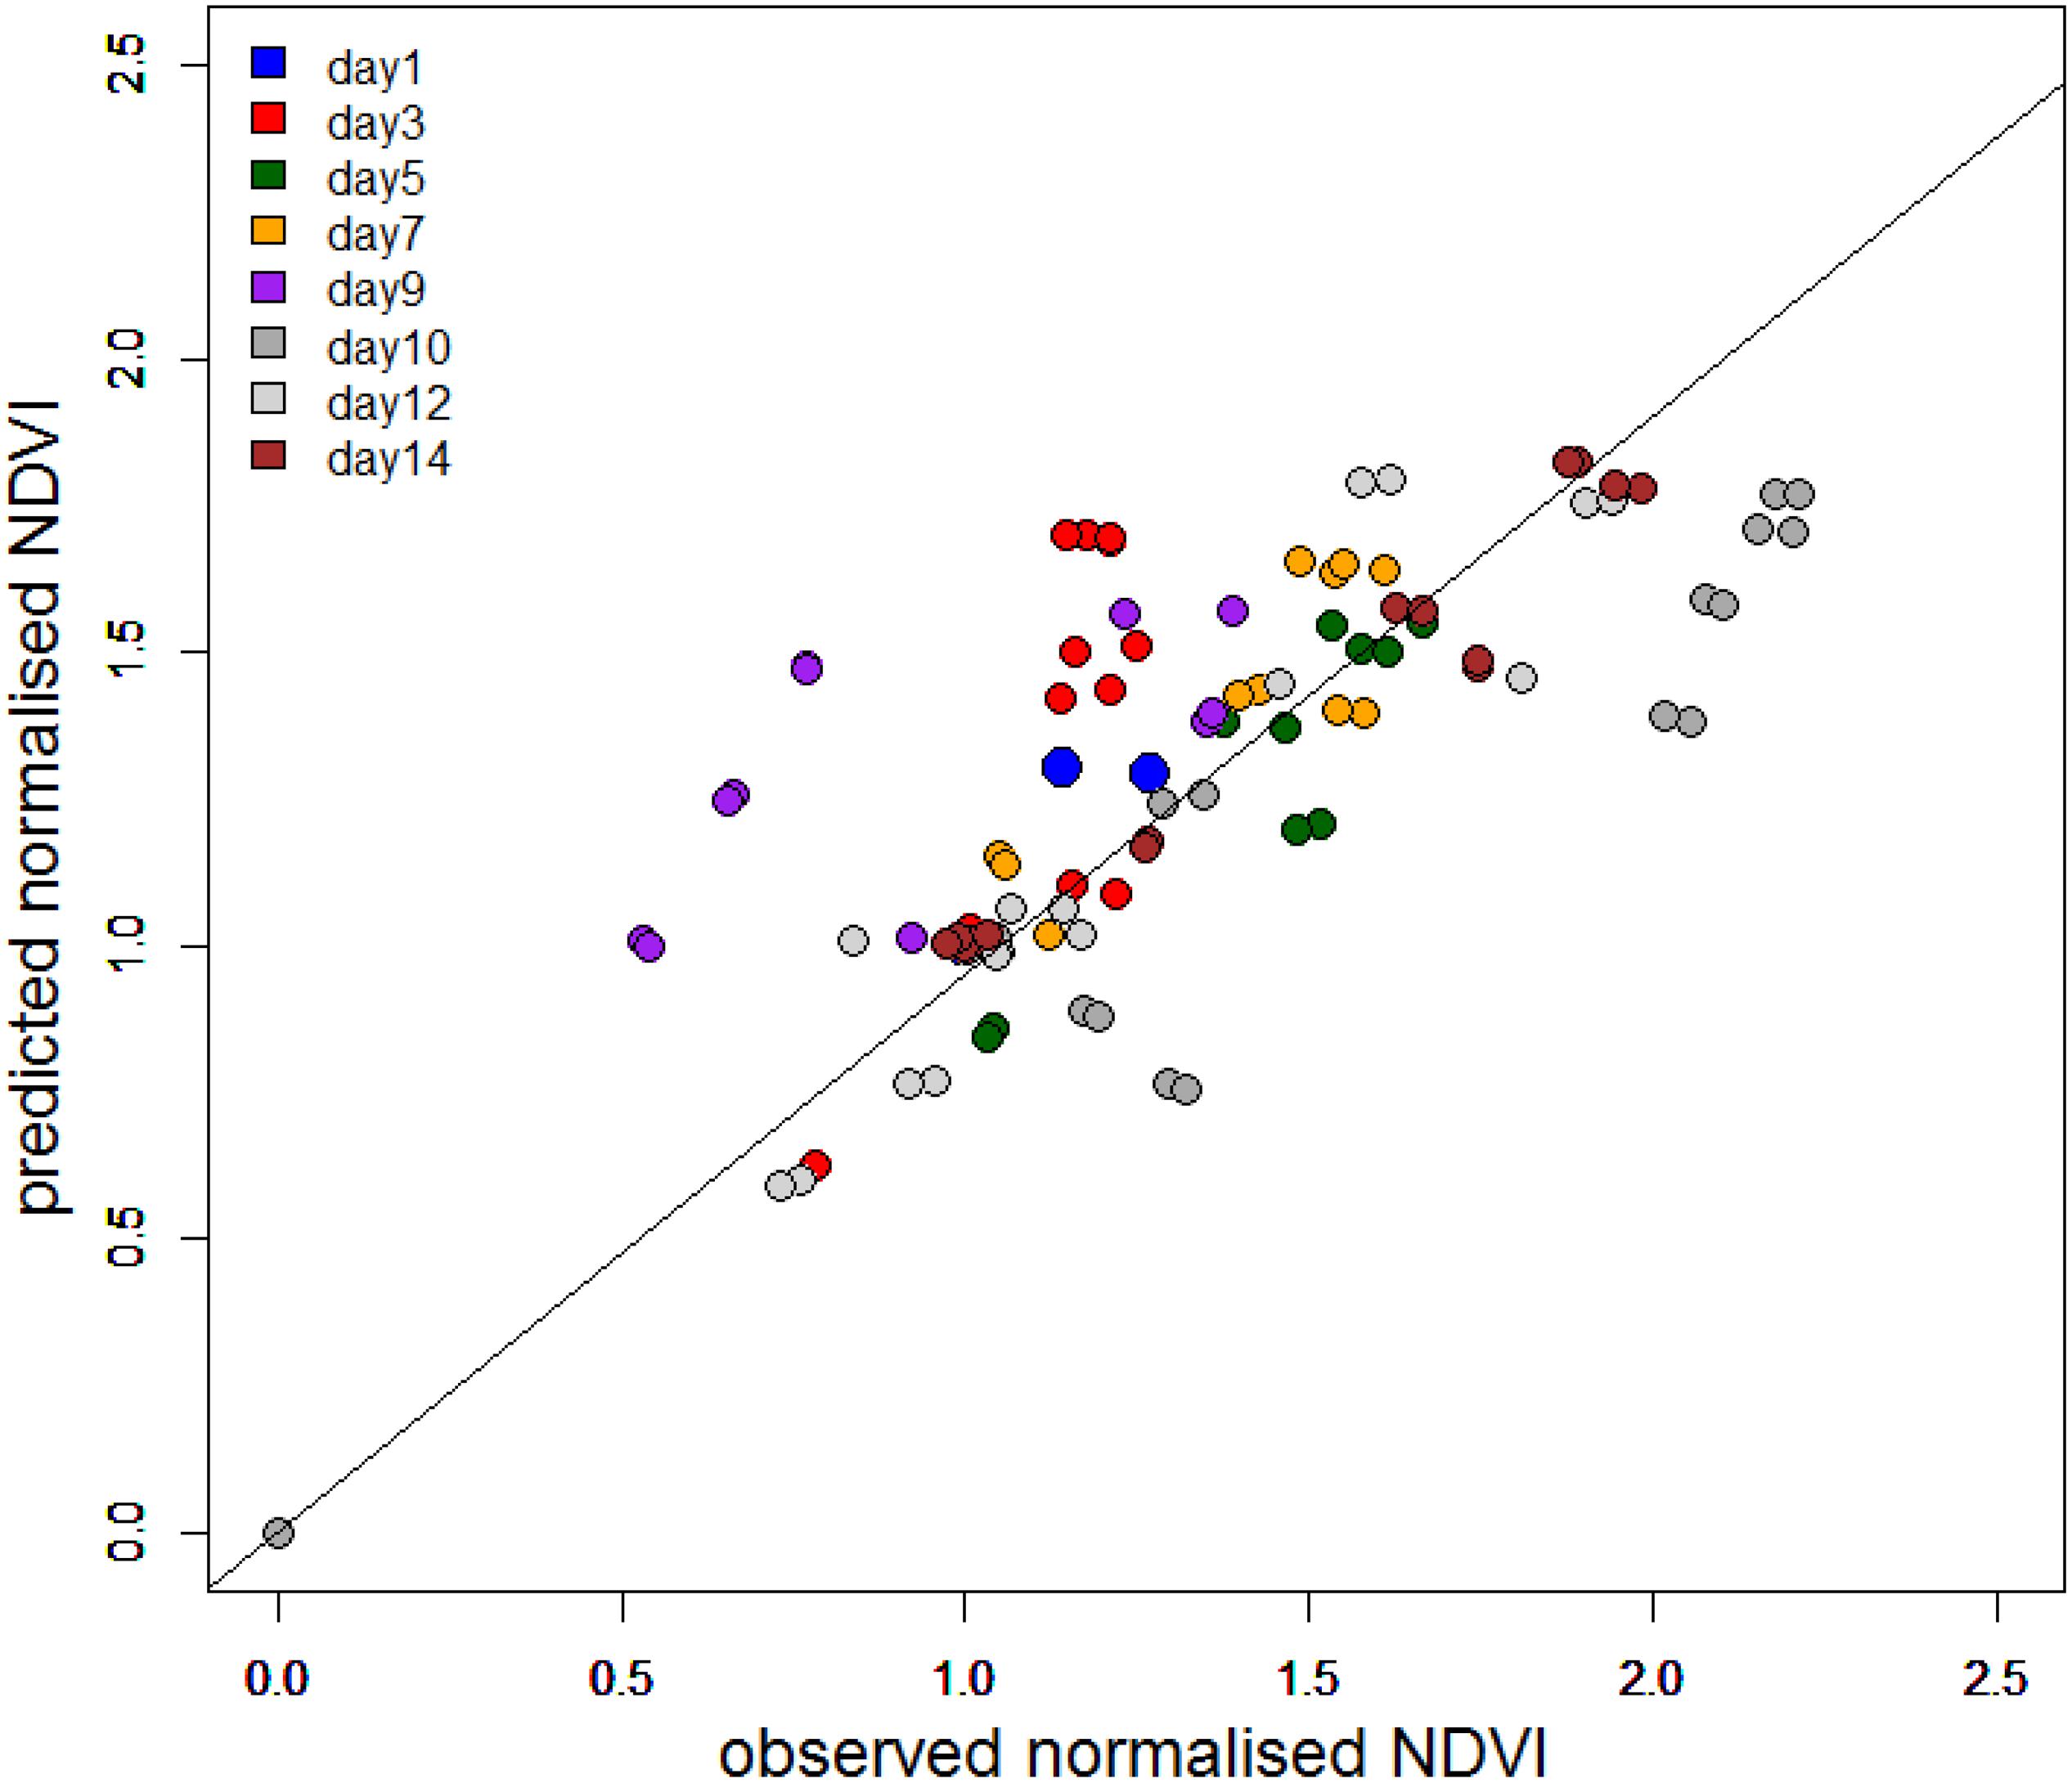
Figure 8. Predicted normalized NDVI using the model of Pinckney and Zingmark (1991) against normalized NDVI from field measurements.
Photosynthetic Activity
Maximum quantum efficiencies (dark-acclimated Fv/Fm) during the low tide periods are plotted in Figure 9. Sampling started on the evening tide of Day 1 (15 May) with high Fv/Fm values (above 0.75). On day 3, Fv/Fm values were high during the initial phase of the morning low tide as the irradiance was still low (see Supplementary Figure S1). When the irradiance rapidly rose to >1500 μmol photons m–2 s–1 around 9:00, Fv/Fm decreased over time to 0.68. Fv/Fm values remained consistently high (up to 0.77) during the early morning and late evenings of the entire experiment, although small differences were noticeable between days. Fv/Fm on day 5 was higher than on day 7 which correspond to the fact that irradiance values reached higher values on day 7 than on day 5 (Supplementary Figure S1), but differences were small and values never were smaller than 0.66. Days 9 and 10 had similar irradiance values and the Fv/Fm values were also very similar. Days 12 and 14 showed a small decline in Fv/Fm, during the morning low tide period, which was more pronounced in day 14 as the low tide extended more into the morning when Fv/Fm decreased steadily from 0.75 at 4:30 to 0.66 at 9:30. Both days had clear skies and irradiance rose steady to 1500 μmol photons m–2 s–1 during the end of the morning low tide at day 14.
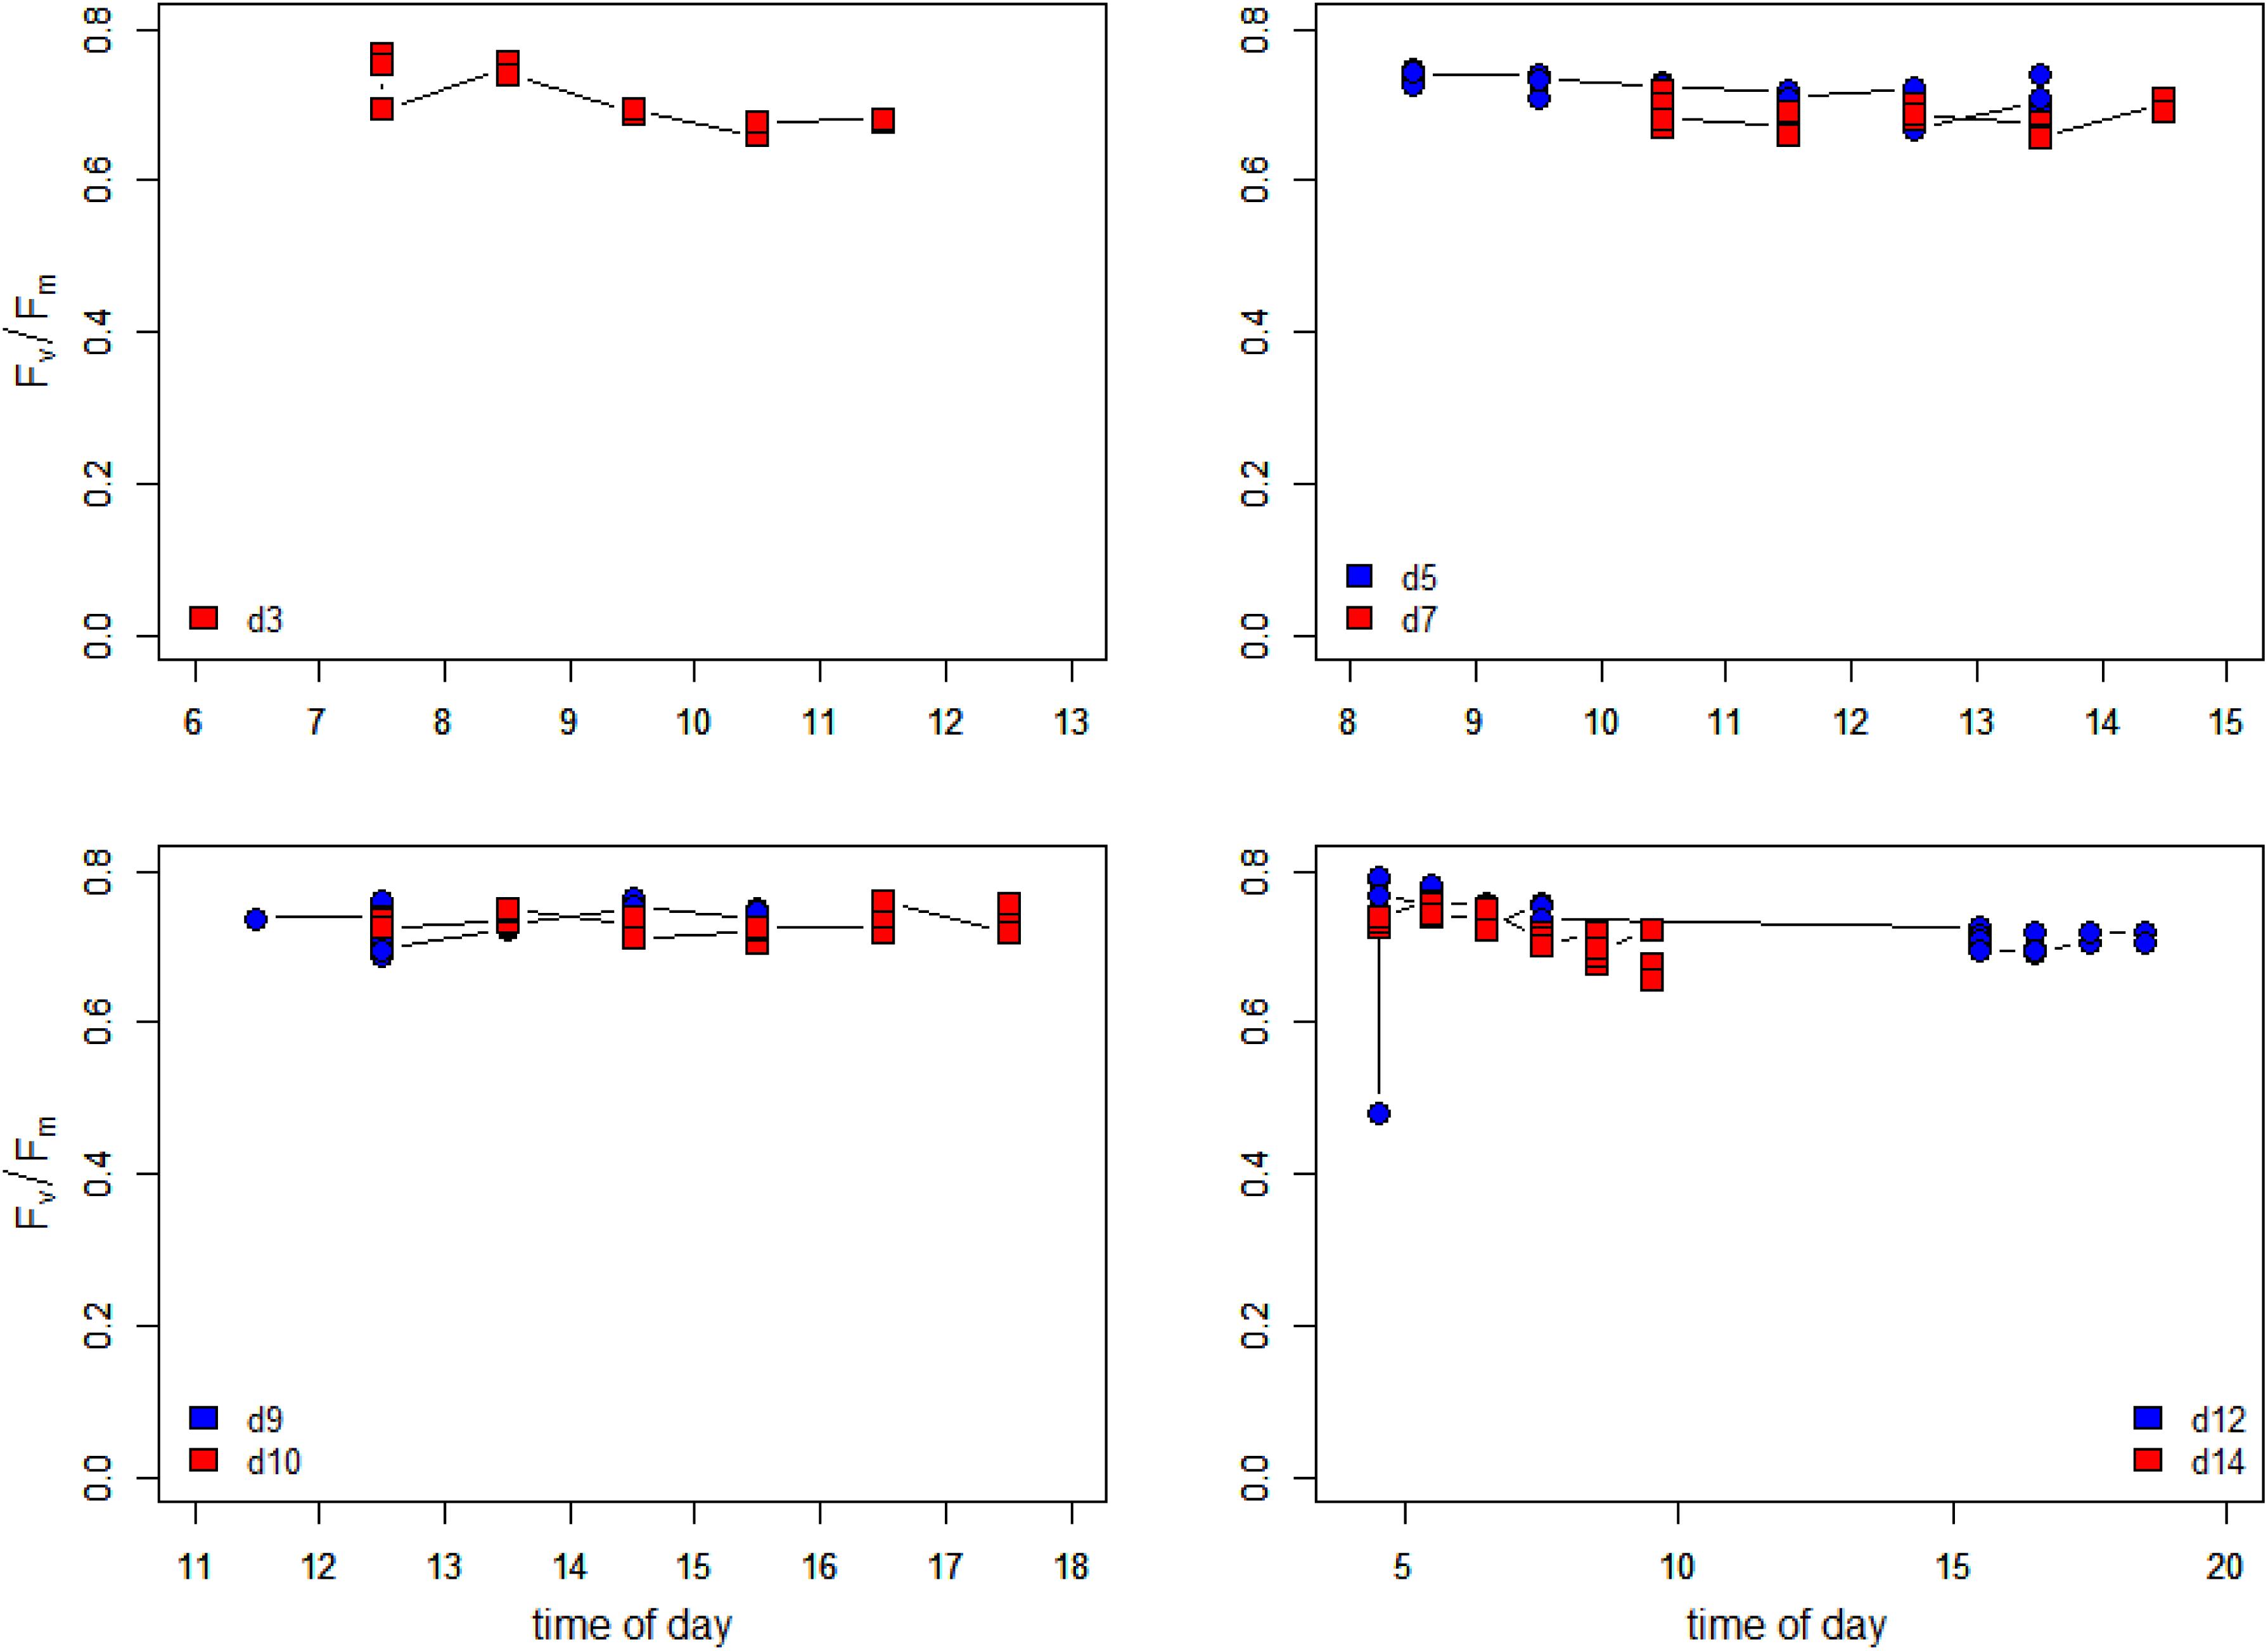
Figure 9. Changes in the maximum PSII efficiency (dark-acclimated Fv/Fm) during the days of the measurements. Data are the average of hourly time blocks.
Rapid light curves (RLC) were measured between 5 and 18 times per day during the low tide phase. The initial slope of the RLC showed more variability than dark-acclimated Fv/Fm, with values lower during periods of high PAR (Supplementary Figure S2). In contrast, the maximum rates of light-saturated relative photosynthetic electron transport (rETRm) had a mean value of 592 units, but showed considerable variability, as shown as a function of time during low tide (Figure 10). For example, during the morning of day 3 it can be seen that the hourly mean rETRm almost doubled over 5 h from 350 to ∼ 700 (relative units). During this period light intensities were rather low (<500 μmol photons m–2 s–1, see Supplementary Figure S1). Between 9:00 and 11:00 rETRm transiently dropped to 460–512 units, and this coincided with a period of higher irradiance (>1200 μmol photons m–2 s–1, see Supplementary Figure S1). Values recovered later in the afternoon when the surface irradiance decreased again. On day 5, which was overcast with PAR values <500 μmol photons m–2 s–1, rETRm remained relatively stable at a value of 540 to 620 except for two higher values at 9:00 and 12:00. On day 7, rETRm remained relatively stable from 10:00 to 13:00 then rose to the highest value recorded in the 2 week period of 933 units at 14:00 (datapoint off upper limit of Figure 10 y-axis). On days 9 and 10, rETRm varied around 600, except for a low value of 330 units at 15:00. The first low tide of day 12 showed a threefold increase in rETRm (but with fluctuations), which coincided with the morning increase in irradiance on a cloudless day. Interestingly, this increase occurred despite a very small decrease in Fv/Fm, showing that Fv/Fm is a poor predictor for the photosynthetic potential. The same pattern was seen on the morning low tide of day 14 with values increasing from 540 to 850 units. The afternoon period of decreasing irradiance during the second low tide on day 12 showed decreasing rETRm. Although the daily values in rETRm were rather similar, the differences between the days were significant (Wilcoxon text, W = 9801, p-value < 2.2e–16). In a multiple regression, mud temperature at the time of measurement was weakly positively related to ETRmax but instantaneous irradiance did not have a significant effect. rETRm and αrETR were not related (Supplementary Figure S3), indicating Ek-independent photoacclimation (Behrenfeld et al., 2004).
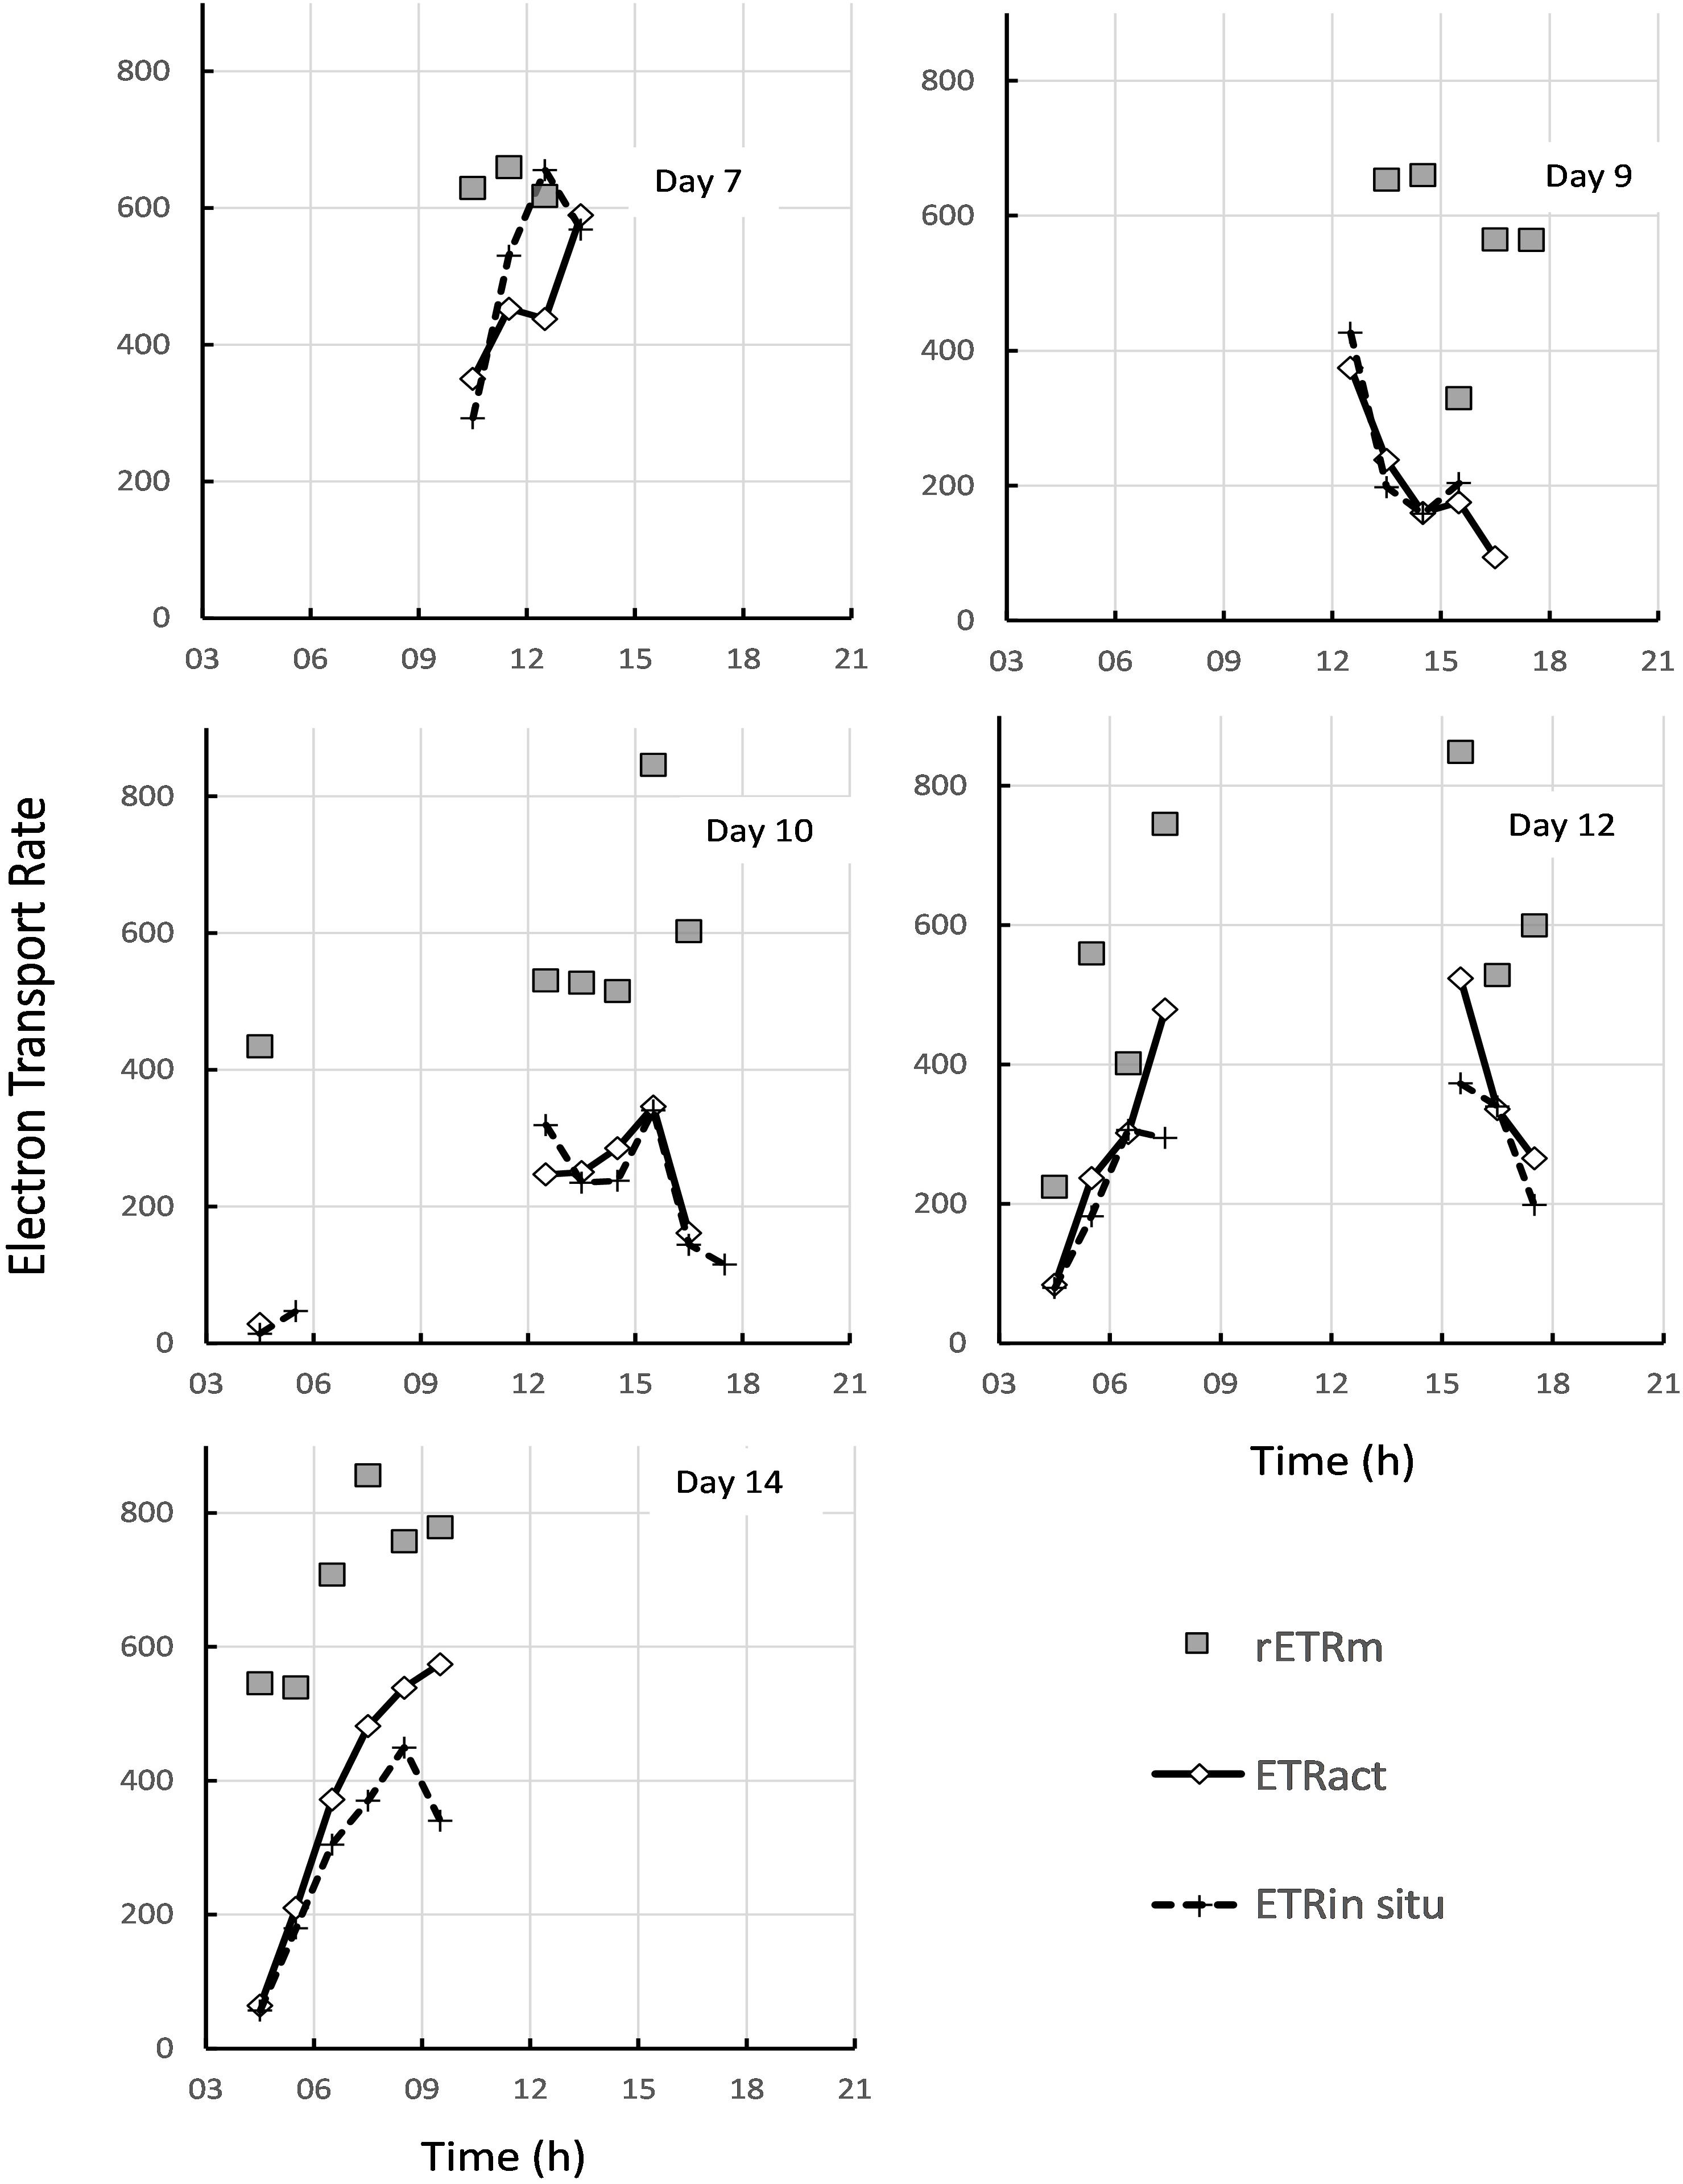
Figure 10. Comparison of the theoretical maximum rate of electron transport rETRm estimated from rapid light curves (gray squares), with the estimated in-situ ETR in ambient light (gray diamonds), and the actual in-situ rate measured directly in ambient solar irradiance (dashed line with crosses).
The light saturation parameter Ek is shown in Supplementary Figure S4. As the variability in the αrETR was rather limited and not related to changes in rETRm, changes in Ek followed those in rETRm closely.
Apart from measuring the light-dependent photosynthetic activity with RLCs using the inbuilt light source of a portable fluorimeter, the in-situ quantum efficiency of the surface biofilm with natural solar irradiance was measured using a second PAM instrument. Simultaneous recording of the solar irradiance allowed the calculation of the in-situ rETR from light-acclimated PSII yields. From the artificial light RLCs taken within the same hourly time interval the rETR at the same light intensity as that recorded for solar-exposed biofilms was calculated, and the two rates compared to each other (Figure 10). On day 1, the solar in-situ measurements were missing. On day 3 the rETR measured at 7:00 and 10:00 were identical, but for the other time points the rETR rates calculated from the RLCs were slightly higher than the ones based on the in-situ measurements (Figure 10). Nevertheless, the daily pattern in photosynthetic activity was rather similar. On days 5, 9, and 10 the results of both measurements were virtually identical. On day 7 the estimates of rETR at 10:00, 11:00 and 13:00 GMT were similar but at 12:00 and 14:00 rETR derived from the RLCs were lower than those based on the in-situ measurements (thus the opposite results as compared to day 3). On day 12, rETR based on the RLCs of the last time point of the morning low tide and the first point of the afternoon low tide gave higher values than the ones based on the in-situ measurements, and on day 14 the RLCs gave in general slightly higher rETR values than the ones determined with the solar in-situ measurements. But in all cases, both approaches gave the same daily patterns and the results were often very similar. It is apparent from Figure 10 that the theoretical maximum rate of electron transport, rETRm, was rarely reached, even with solar irradiances over 1000 μmol photons m–2 s–1. Complete light saturation was only reached on days 3 and 7 (Figure 10), and all other days showed that the operationally achieved rate of electron transport was well below the theoretical maximum.
The two independent measurements of rETR were plotted as a single “composite” RLC (Figure 11). Both curves were similar, but the in-situ composite RLC with solar irradiance had a higher αrETR and a lower rETRm when compared to the same data obtained from the RLC made with the artificial light source and step-wise increases in irradiance. The values of both type of measurements were fitted according to the photosynthesis model of Webb et al. (1974) in order to get the RLC parameters describing the relationships between the surface incident PAR and the relative rate of photosynthetic electron transport (Table 1). To test if these differences were significant, a non-linear method in R which included the method as factor was applied. The results showed that the initial slopes of the synthetic light curves (αrETR) between the two methods were not significantly different. The differences in the maximum rate of rETR were significant (p = 0.034) (see Supplementary Table S1 for details).
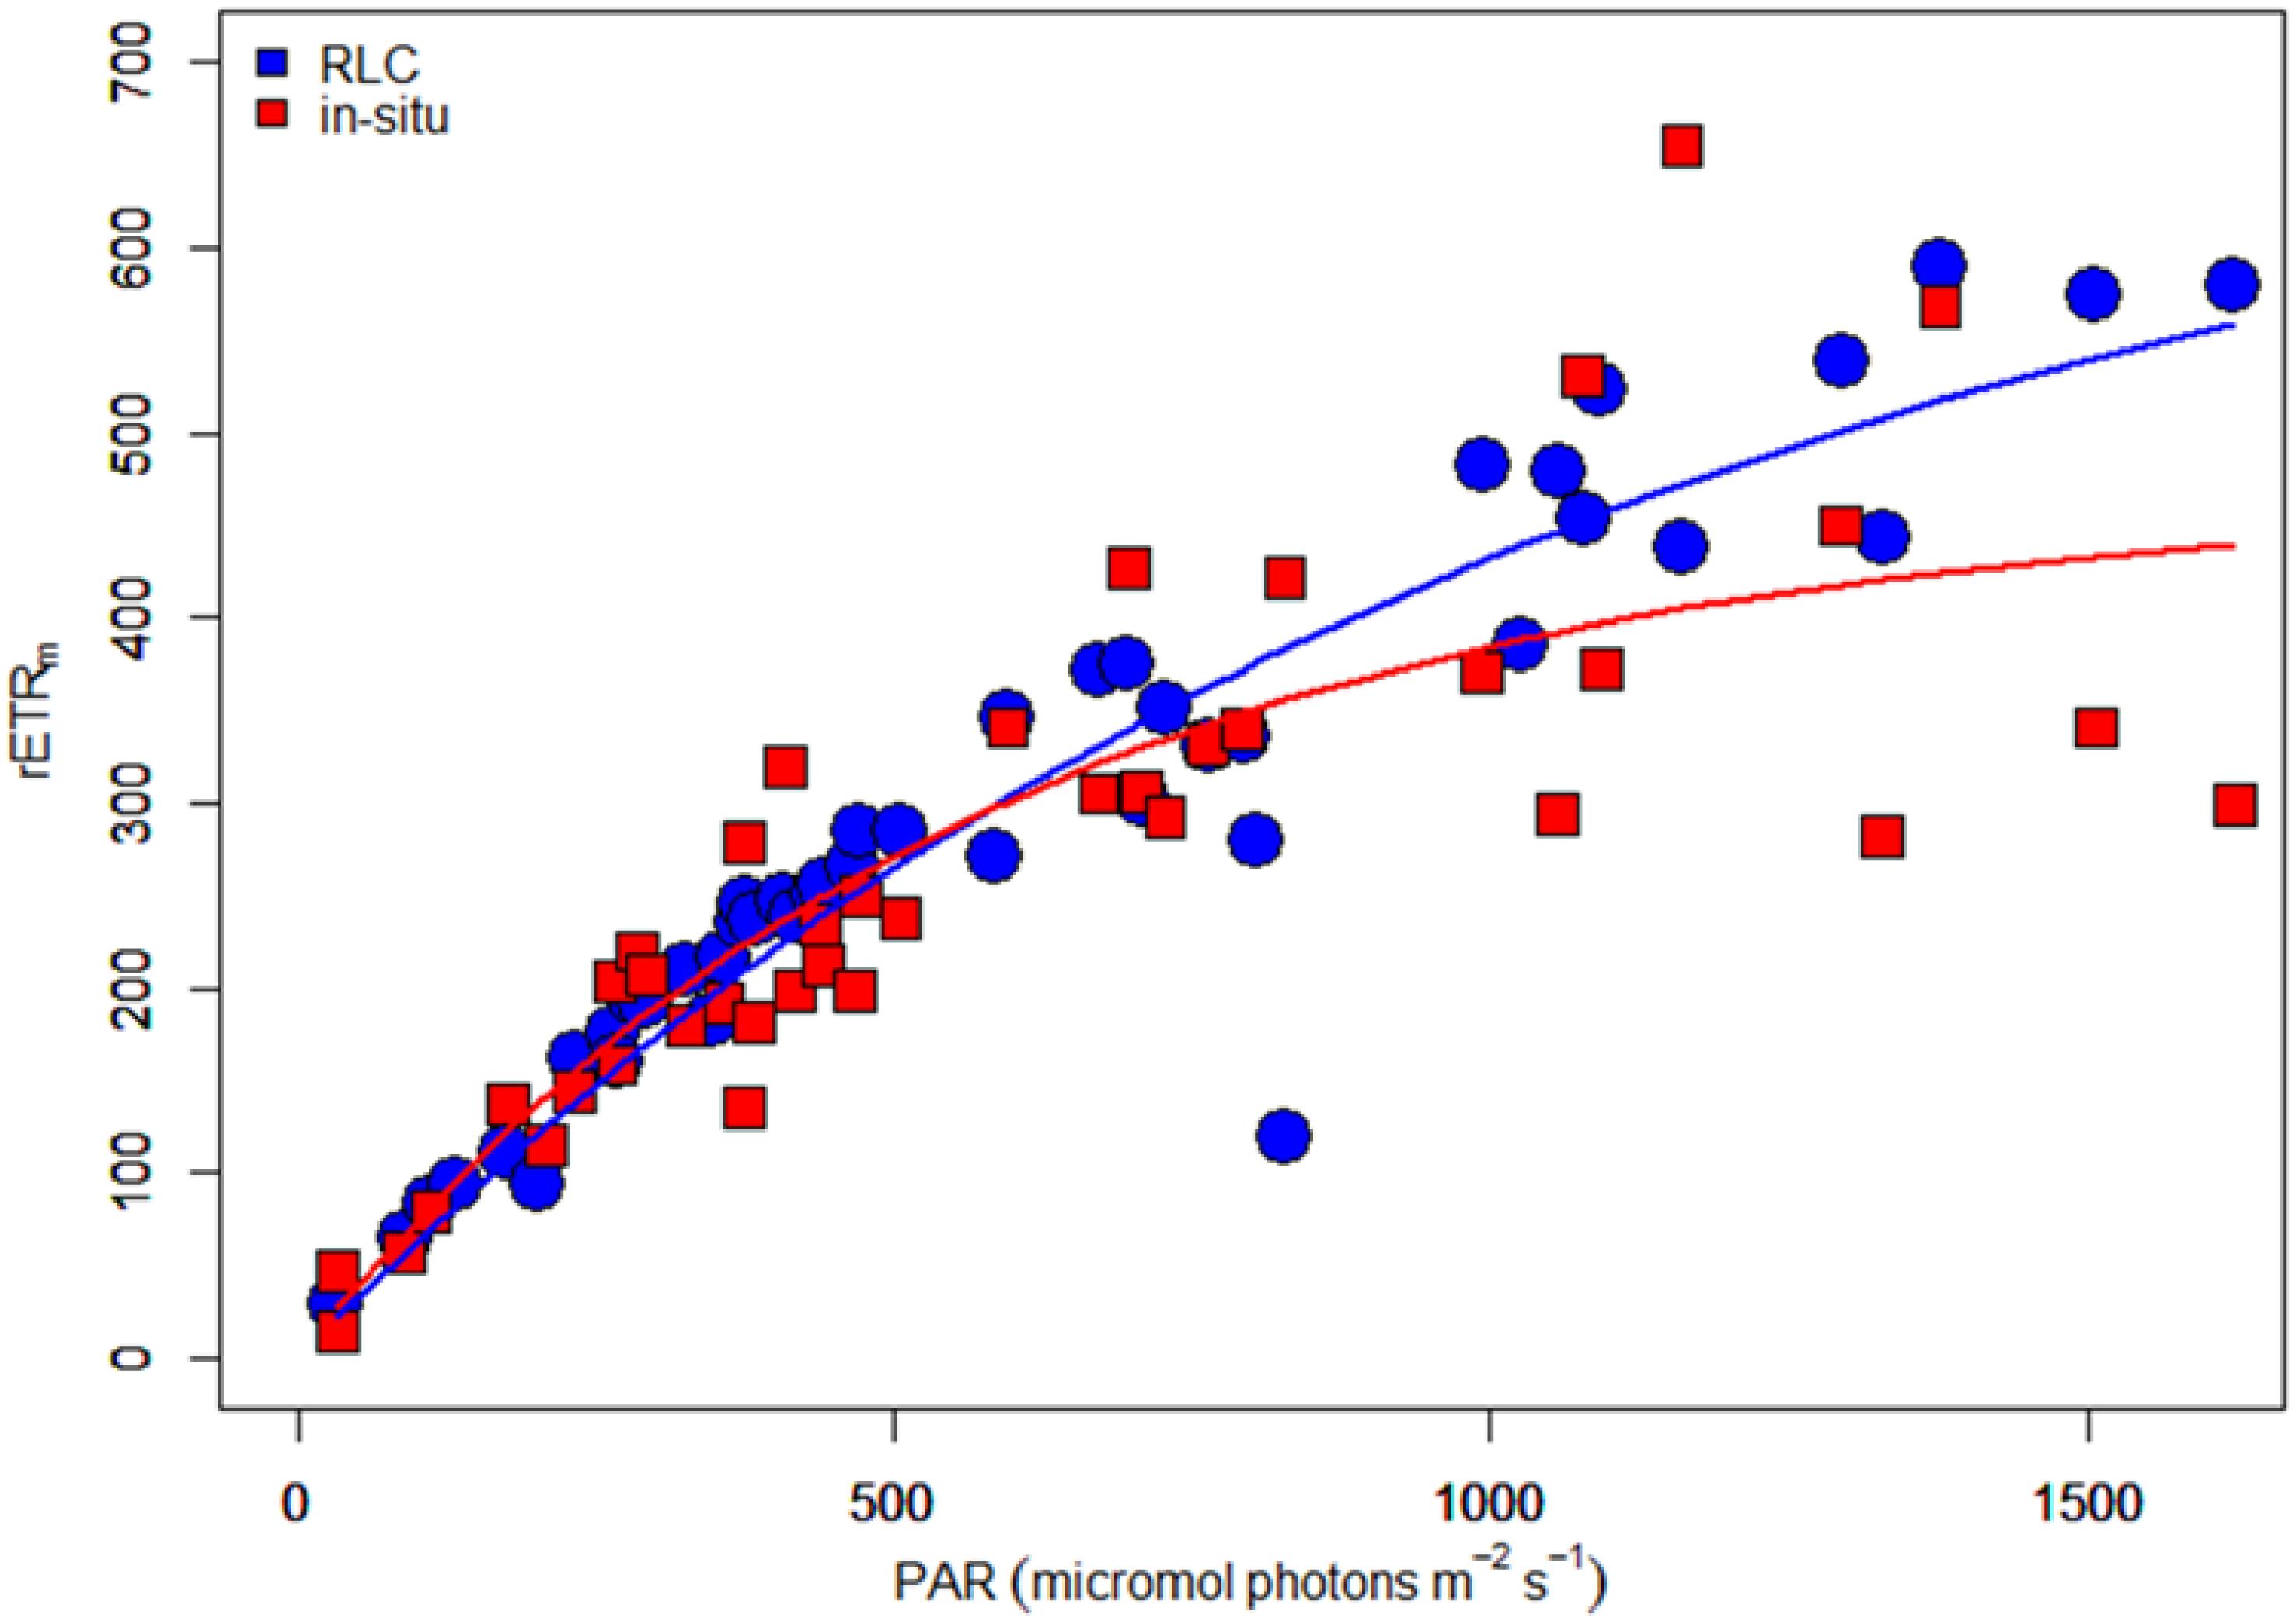
Figure 11. “Composite” rapid light curves (electron transport rate versus irradiance) based on data obtained with sequential steps of increasing artificial light (blue dots) or naturally varying ambient solar irradiance data (red squares). The lines give the predicted rETR rates obtained from a fit of the data to the equation of Webb et al. (1974).
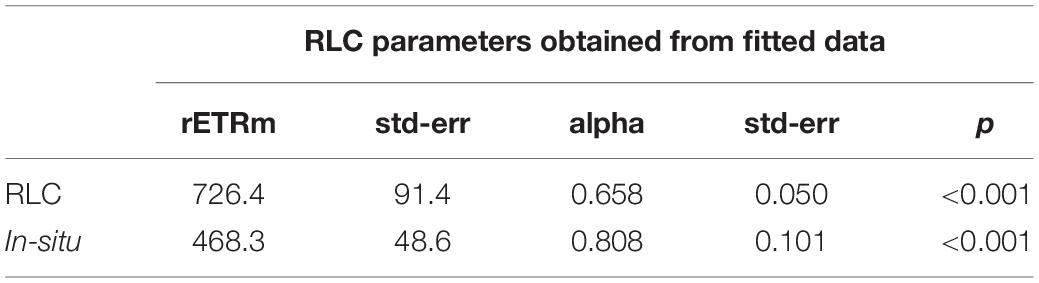
Table 1. Fit parameters [obtained using the model of Webb et al. (1974) for the composite RLC shown inFigure 11].
To investigate the effect of different method choice on daily sediment integrated primary production we modeled 3 days (day 3, 5, and 7) using the hourly averaged irradiance and assumed a light attenuation coefficient within the sediment of 2.5 mm–1 or 3 mm–1 (Forster and Kromkamp, 2006). This was done using the fit parameters describing the RLCs shown in Table 1. The results of this exercise show that if the data from the RLCs are used (RLCfit), the total depth-integrated production rate during the low tide period is lower than the results obtained from the in-situ derived fit-constants. At first glance this might seem surprising, as the rETRm based on the RLC data is higher than the one obtained from the in-situ measurements, but the crossover points of both curves is approximate 600 μmol photons m–2 s–1, so as long as the surface irradiance <600 μmol photons m–2 s–1 the higher αrETR of the in-situ fitted data will return higher productivity values, and this was observed (although they were not significantly different as the αrETR values were not significantly different). The difference depended on the surface irradiance: on day 5 irradiance values were lowest, and the productivity obtained from the RLC-fitted data was 87% from those based on the in-situ data. With higher irradiance, the difference was smaller: on day 3 several hours exceeded 1500 μmol photons m–2 s–1 and in this case the difference was within ∼ 5%. The differences in the estimates were independent of the Kd-value (Table 2).
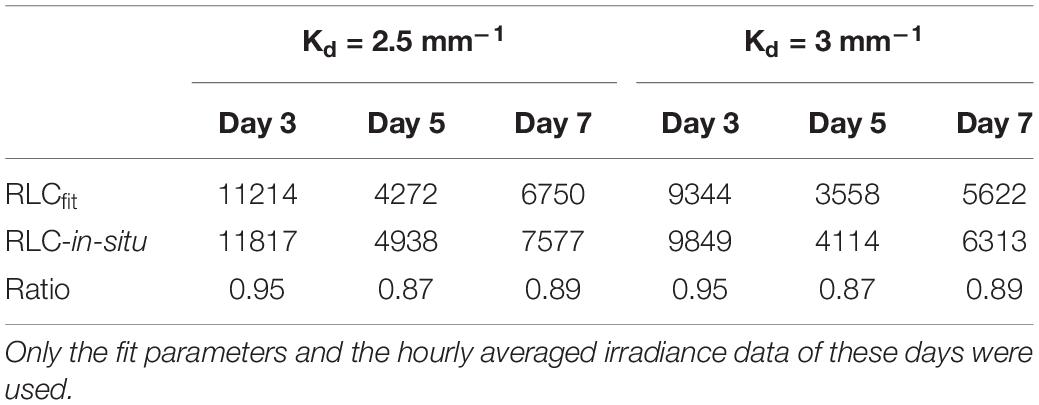
Table 2. Total depth integrated relative photosyntheti celectron transport rates (relative units) for the low tide periodshown in days 3, 5, and7 (Figure 5).
Discussion
The aim of this work had three components: (1) to investigate the nature of microscale patchiness of diatom-dominated biofilms over a typical growth period (spring-neap tidal cycle), (2) to investigate the nature of vertical migration under natural conditions and (3) to quantify the rate of photosynthesis over an extended period, and to compare different measuring approaches (artificial light given as sequential light curves versus steady-state photosynthesis in natural solar irradiance). The work took place during the spring growth period when diatom-dominated biofilms are a major ecological feature of temperate soft-sediment intertidal zones (van der Wal et al., 2010). A conspicuous surface biofilm was well-established over the entire tidal flat at the start of the measurement period, and observations of the wider area around the experiment suggested that biomass was maintained at a constant level throughout the spring-neap-spring cycle. A revisit of the site in June showed that the surface biofilm had greatly decreased, leaving no visible patches of MPB. For the one-meter transect itself, although there was no net increase or decrease in mean photosynthetic biomass during the sampling period, continuous changes in the surface concentration were evident in space and time.
Using NDVI as proxy, the extent of microscale variability was revealed to be of similar magnitude in space and in time. The picture made visible by the contour plot clearly shows that local high patches of biomass can disappear quickly and establish themselves at a nearby but different location. The overall patterns showed some dependency on the tide: at the start and end of the experiment the low tides were in general in the middle of the day whereas on days 10–14 the low tides were in the early morning and evening. Nevertheless, high biomass could develop under both tidal conditions as shown when days 3 and 5 (low tide during the middle of the day) and day 12 and 14 (high tide at the middle of the day) were compared. Tidal phase is not the only factor explaining the biomass development. The correlation between maximum NDVI and total light exposure was very weak and not significant (r2 = 0.11, p = 0.47). It is likely that the spatial dynamics in MPB biomass were mainly the result of varying local grazing pressure. Periods of increasing microphytobenthic biomass, due to growth and division of diatom cells, were matched by periods of loss due to grazing, bioturbation (leading to deep burial of cells), or resuspension events. Net growth rate estimated from successive reflectance measurements at 2-day intervals showed maximum values of 0.38 d–1, equivalent to a doubling time of 1.8 days. In comparison, an MPB growth rate of 0.46 d–1 was recorded during early growth of a diatom biofilm in a tidal mesocosm tank from which all grazers had been removed (Morris et al., 2008). Loss rates were of the same order as growth rates, and the dominance of growth or loss could change within a distance of 10 cm. For example, position 6 had a decrease in NDVI of −0.32 d–1 between 21 and 23 May, whereas its neighboring position 7 increased by 0.23 d–1.
At present, there are no suitable remote imaging systems with sufficient spatial, temporal and spectral resolution to enable the dynamics revealed here using in-situ instruments to be investigated over wider scales. Medium resolution satellite images of 10 to 30 m pixel size can be obtained from Landsat-8 and Sentinel-2, but cloud-free images are usually available only once or twice per month. Further investigation of microscale MPB population dynamics may be possible using repeated imaging over successive tidal cycles with high-resolution cameras or scanners mounted on unmanned aerial vehicles, or fixed cameras at a suitable height with narrow-band wavelength filters to capture red/infrared spectral differences. Accurate geo-correction would be essential in order to locate pixels in exactly the same position for calculation of growth and loss rates over time. If such methods were to be used, a complete semi-variogram covering all spatial scales from cm to km could be constructed, allowing not only patch size to be further defined, but carbon fixation estimates at the tidal flat scale to be improved.
The MPB community in these plots clearly showed a vertical migration pattern, with the regular appearance and disappearance of the surface biofilm being easily visible to the naked eye, and quantifiable by means of repeated spectral measurements. The amount of chlorophyll present in the surface biofilm increased by a factor of 1.5 to 2 during low tide, before decreasing just before immersion. It is still unknown whether this cycle is determined by a daily oscillator or by a tidal cycle or both. Haro et al. (2019) presented evidence, based on a Fourier analysis of the daily patterns, that the vertical migration in the absence of tides was controlled by an endogenous circadian rhythm that was entrained by the photoperiod and that the vertical migration behavior could immediately be reset by the photoperiod. However, the authors state that the influence of an in-situ tidal signal cannot be discarded. Pinckney and Zingmark (1991), however, were able to model the migratory behavior of MPB as a function of both tidal and sun angles, suggesting both factors play a role. This is corroborated by our results that also clearly show that the timing of the migration shifts with the tide. Whether these differences were related to decreases in irradiance during cloud cover events, causing negative phototaxis, is not clear, as low irradiance per se did not always cause a decrease in NDVI. A cellular tidal clock is most likely involved although it cannot be excluded that the diurnal clock determining the circadian rhythm is reset daily by the shifting tides and thus compensates for the shift in the tide. Clearly more experimental work is needed to resolve this question, and to explain occasions when anomalous migration patterns were observed. On days 9 and 10 a bell-shaped migration curve was observed, but it was the magnitude of migration which differed from the prediction, whereas NDVI values on day 3 changed little throughout the tidal cycle until the final hour of emersion. The spectral reflectance technique would be most suitable for use in migration investigations, giving an unambiguous high-frequency estimate of chlorophyll concentration in the surface biofilm. A good relationship was established between measured and modeled NDVI values using the Pinckney and Zingmark (1991) approach. If tidal and solar data are available for a site, further refinement of relationships such as this could be used to extrapolate the daily dynamics of MPB biofilms from single-point measurements i.e., a midday satellite overpass.
It was observed that the cells reached the surface within 1–2 h and stayed at the surface for about 3–4 h. As NDVI values at the beginning of low tide or at the end of the low tide were low, most of the MPB population appeared to consist of species able to perform vertical migration. In contrast to several other authors (Serôdio et al., 2006; Perkins et al., 2010) we did not observe downward migration as a result of high light intensities. This does not mean that the cells were not affected by the high irradiances: clear signs of downregulation of αrETR were observed on sunny days (e.g., days 3, 12, and 14), but this downregulation did not occur when the irradiance conditions fluctuated rapidly (e.g., day 7 on Supplementary Figure S2). The question whether this decrease in αrETR signifies photoinhibition (i.e., caused by damage to the photosystem-II) or dynamic downregulation cannot be answered with certainty as we did not study recovery kinetics of αrETR in low light or measured intact and damaged D1-proteins, but the fact that Fv/Fm had very high values, and was essentially constant over the period, makes it likely that dynamic downregulation is the cause of this decrease in αrETR. The diatom biofilm was able to remain productive under prolonged periods of high irradiance.
The maximum rates of relative photosynthetic electron transport showed greater variability during the day than light-limited photosynthesis (αrETR). In general, rETRm had lowest values immediately after tidal exposure, and increased following the upward migration of cells to the surface. Activation of the RuBisCO enzyme following a prolonged period of dark acclimation is the most likely cause of this increase (MacIntyre and Geider, 1996). During the low tide period, increases and decreases of up to threefold were measured within short time intervals. These changes in rETRm were not related to decreases in Fv/Fm, which stayed rather constant, or to changes in αrETR. The use of an artificial light source to generate RLCs has the advantage that the light steps given are known and repeatable, but the light received at the sediment surface does depend on a highly accurate positioning of the fiber-optic cable with respect to the surface biofilm (in these experiments – 4 mm distance). Small errors in positioning, for example if the supporting plastic chamber sinks into the soft sediment, can potentially reduce the distance to the sediment and increase the irradiance received. This would cause an underestimation of ETR.
A potential problem with using fluorescence measurements on the surface biofilm is that variable fluorescence originating below the surface (“deep layer fluorescence”) will cause an overestimation of the true effective quantum efficiency which can cause serious overestimation of the true rate of electron transport at higher irradiance (Forster and Kromkamp, 2004; Serôdio, 2004). A similar observation has been made for corals (Wangpraseurt et al., 2019). This degree of overestimation is also dependent on the vertical distribution of MPB in the sediment as it changes the amount of cells in the photic layer in the sediment, and Morelle et al. (2018) suggested a method to correct for this artifact. In addition, the vertical migration itself has been shown to influence photosynthetic activity and productivity as the biomass of the MPB in the photic zone will change as a result of the migratory behavior (Cartaxana et al., 2008). Optical artifacts would lead to a positive relationship between Fo and rETRm but in the field measurements here, a negative relationship with Fo was found (rETRm = −0.606 × Fo + 843, r2 = 0.32, p < 0.0001).
Of the other factors likely to play a role in the dynamic behavior of rETRm, temperature was the most important one as a correlation between sediment temperature and rETRm was observed. A measurement of the true mud surface temperature within the dark chamber used for light curve measurements was not made, instead an estimate of the adjacent temperature of solar-exposed mud was made. It is likely that the temperature within the chamber cooled during the short period of measurement, and hence a recommendation for future measurements of this type would be to add a miniature seawater-proof thermistor to the instrument.
Rapid light curves have the advantage that they can be used to measure the photosynthetic properties quickly, but the information retrieved from RLCs depend very much on the protocol used as explained in the introduction (see Perkins et al. (2010) for an extensive review on this topic). Two techniques were used to measure the photosynthetic activity of the diatom biofilms: (1) Normal (sequential) rapid light curves, with a 30 s light step and a 1 min dark acclimation period. (2) in-situ measurements of the effective PSII quantum efficiency (ΔF/Fm’) which was converted to relative rates of photosynthetic electron transport by multiplying it with the solar irradiance. These latter measurements thus measured the “real” photosynthetic activity as the biofilm was not shaded or touched in any way, and the incident irradiance was known with high accuracy (i.e., no artifact due to distance from the light course). The sequential RLCs used a maximum irradiance of 2000 μmol photons m–2 s–1 to generate light-saturated photosynthetic electron transport. rETRm measured in this way was almost always higher than the instantaneous ETR measured under ambient irradiance, indicating that on the majority of tidal exposures photosynthesis was not fully light-saturated. When ETR from RLCs was calculated for the same irradiance as the in-situ solar, results show clearly that both methods gave nearly identical results as can be seen in Figure 10: both types of measurements follow the same daily patterns. The shape of the ETR-irradiance curves were very similar, but the RLC-based data showed a significantly higher rETRm and a slightly lower αrETR. Spectral differences between the halogen light source of the PAM instrument, and natural sunlight, may account for some of the differences, as well as the temperature difference between inside and outside of the RLC chamber mentioned above. Calculation of the total primary production over depth during a low tide period for the irradiances measured during the period showed that the in-situ measurements gave between 5 and 13% higher production estimates (due to the higher light affinity, αrETR), and that the differences became smaller with higher surface irradiance (a result of the “crossing over” of the LC, see Figure 11). The results also showed that spatial differences in biomass did not affect the shape of the LC and that basically the photosynthetic parameters did not change during the 14-day spring-neap-spring cycle, despite the fact that occasional differences in rETRm during the day were observed. From a modeling perspective, the fact that the cardinal parameters of photosynthesis changed little during this period would simplify the scaling-up of production estimates. We can thus conclude that the RLC-protocol that was used can be obtained to generate a synoptic map of RLC-parameters at different sites and different environment conditions. In-situ reflectance and fluorescence techniques can be used alongside remote sensing in order to better quantify the productivity of intertidal soft sediment systems.
Data Availability Statement
The data in this article can be obtained from the following: http://www.vliz.be/en/imis?module=datasetanddasid=1213.
Author Contributions
JK and RF wrote the manuscript with contributions from EM. RF designed the database in which the data was stored. All authors contributed to the article and approved the submitted version.
Funding
This work was carried for the HIMOM project, funded by a grant from the 5th European Framework Programme (Contract No. EVK-CT-2001-00052).
Conflict of Interest
The authors declare that the research was conducted in the absence of any commercial or financial relationships that could be construed as a potential conflict of interest.
Supplementary Material
The Supplementary Material for this article can be found online at: https://www.frontiersin.org/articles/10.3389/fmars.2020.00562/full#supplementary-material
References
Barranguet, C., and Kromkamp, J. (2000). Estimating primary production rates from photosynthetic electron transport in estuarine microphytobenthos. Mar. Ecol. Prog. Ser. 204, 39–52. doi: 10.3354/meps204039
Behrenfeld, M. J., Prasil, O., Babin, M., and Bruyant, F. (2004). In search of a physiological basis for covariations in light-limited and light-saturated Photosynthesis1. J. Phycol. 40, 4–25. doi: 10.1046/j.1529-8817.2004.03083.x
Cahoon, L. B. (1999). The role of benthic microalgae in neritic ecosystems. Oceanogr. Mar. Biol. Annu. Rev. 37, 47–86.
Cartaxana, P., Brotas, V., and Serôdio, J. (2008). Effects of two motility inhibitors on the photosynthetic activity of the diatoms Cylindrotheca closterium and Pleurosigma angulatum. Diatom Res. 23, 65–74. doi: 10.1080/0269249x.2008.9705737
Christianen, M. J. A., Middelburg, J. J., Holthuijsen, S. J., Jouta, J., Compton, T. J., van der Heide, T., et al. (2017). Benthic primary producers are key to sustain the Wadden Sea food web: stable carbon isotope analysis at landscape scale. Ecology 98, 1498–1512. doi: 10.1002/ecy.1837
Cruz, S., and Serôdio, J. (2008). Relationship of rapid light curves of variable fluorescence to photoacclimation and non-photochemical quenching in a benthic diatom. Aquat. Bot. 88, 256–264. doi: 10.1016/j.aquabot.2007.11.001
Daggers, T. D., Kromkamp, J. C., Herman, P. M. J., and van der Wal, D. (2018). A model to assess microphytobenthic primary production in tidal systems using satellite remote sensing. Rem. Sens. Environ. 211, 129–145. doi: 10.1016/j.rse.2018.03.037
Decho, A. W. (2000). Microbial biofilms in intertidal systems: an overview. Cont. Shelf Res. 20, 1257–1273. doi: 10.1016/s0278-4343(00)00022-4
Forster, R. M., Créach, V., Sabbe, K., Vyverman, W., and Stal, L. J. (2006). Biodiversity-ecosystem function relationship in microphytobenthic diatoms of the Westerschelde estuary. Mar. Ecol. Prog. Ser. 311, 191–201. doi: 10.3354/meps311191
Forster, R. M., and Jesus, B. (2006). Field spectroscopy of estuarine intertidal habitats. Int. J. Rem. Sens. 27, 3657–3669. doi: 10.1080/01431160500500367
Forster, R. M., and Kromkamp, J. C. (2004). Modelling the effects of chlorophyll fluorescence from subsurface layers on photosynthetic efficiency measurements in microphytobenthic algae. Mar. Ecol. Prog. Ser. 284, 9–22. doi: 10.3354/meps284009
Forster, R. M., and Kromkamp, J. C. (2006). Upscalling primary production-Estimating benthic primary production: scaling up from point measurements to the whole estuary. Verh. K. Ned. Akad. Wet. 2, 109–122.
Haro, S., Bohórquez, J., Lara, M., Garcia-Robledo, E., González, C. J., Crespo, J. M., et al. (2019). Diel patterns of microphytobenthic primary production in intertidal sediments: the role of photoperiod on the vertical migration circadian rhythm. Sci. Rep. 9, 1–10.
Honeywill, C., Paterson, D. M., and Hagerthey, S. E. (2002). Determination of microphytobenthic biomass using pulse- amplitude modulated minimum fluorescence. Eur. J. Phycol. 37, 485–492. doi: 10.1017/s0967026202003888
Hope, J. A., Paterson, D. M., and Thrush, S. F. (2019). The role of microphytobenthos in soft-sediment ecological networks and their contribution to the delivery of multiple ecosystem services. J. Ecol. 108, 815–830. doi: 10.1111/1365-2745.13322
Howard, J., Sutton-Grier, A., Herr, D., Kleypas, J., Landis, E., Mcleod, E., et al. (2017). Clarifying the role of coastal and marine systems in climate mitigation. Front. Ecol. Environ. 15:1451. doi: 10.1002/fee.1451
Ibrahim, E., Adam, S., De Wever, A., Govaerts, A., Vervoort, A., and Monbaliu, J. (2014). Investigating spatial resolutions of imagery for intertidal sediment characterization using geostatistics. Cont. Shelf Res. 85, 117–125. doi: 10.1016/j.csr.2014.05.012
Jesus, B., Brotas, V., Marani, M., and Paterson, D. M. (2005). Spatial dynamics of microphytobenthos determined by PAM fluorescence. Estuar. Coast. Shelf Sci. 65, 30–42. doi: 10.1016/j.ecss.2005.05.005
Jesus, B., Brotas, V., Ribeiro, L., Mendes, C. R., Cartaxana, P., and Paterson, D. M. (2009). Adaptations of microphytobenthos assemblages to sediment type and tidal position. Cont. Shelf Res. 29, 1624–1634. doi: 10.1016/j.csr.2009.05.006
Jesus, B., Perkins, R., Consalvey, M., Brotas, V., and Paterson, D. (2006). Effects of vertical migrations by benthic microalgae on fluorescence measurements of photophysiology. Mar. Ecol. Prog. Ser. 315, 55–66. doi: 10.3354/meps315055
Kromkamp, J., Barranguet, C., and Peene, J. (1998). Determination of microphytobenthos PSII quantum efficiency and photosynthetic activity by means of variable chlorophyll fluorescence. Mar. Ecol. Prog. Ser. 162, 45–55. doi: 10.3354/meps162045
Kromkamp, J. C., and Forster, R. M. (2006). Photosynthesis in marine diatom assemblages-Developments in microphytobenthos primary productivity studies. Verh. K. Ned. Akad. Wet. 2, 9–30.
Kromkamp, J. C., Morris, E. P., Forster, R. M., Honeywill, C., Hagerthey, S., and Paterson, D. M. (2006). Relationship of intertidal surface sediment chlorophyll concentration to hyperspectral reflectance and chlorophyll fluorescence. Estuar. Coasts 29, 183–196. doi: 10.1007/bf02781988
Kuwae, T., Beninger, P. G., Decottignies, P., Mathot, K. J., Lund, D. R., and Elner, R. W. (2008). Biofilm grazing in a higher vertebrate: the western sandpiper Calidris mauri. Ecology 89, 599–606. doi: 10.1890/07-1442.1
Kwon, B. O., Khim, J. S., Park, J., Ryu, J., Kang, S. G., and Koh, C. H. (2012). Short-term variability of microphytobenthic primary production associated with in situ diel and tidal conditions. Estuar. Coast. Shelf Sci. 112, 236–242. doi: 10.1016/j.ecss.2012.07.029
Launeau, P., Méléder, V., Verpoorter, C., Barillé, L., Kazemipour-Ricci, F., Giraud, M., et al. (2018). Microphytobenthos biomass and diversity mapping at different spatial scales with a hyperspectral optical model. Rem. Sens. 10:716. doi: 10.3390/rs10050716
Lawrenz, E., Silsbe, G., Capuzzo, E., Ylöstalo, P., Forster, R. M., Simis, S. G. H., et al. (2013). Predicting the electron requirement for carbon fixation in seas and oceans. PLoS One 8:e58137. doi: 10.1371/journal.pone.0058137
MacIntyre, H. L., and Geider, R. J. (1996). Regulation of rubisco activity and its potential effect on photosynthesis during mixing in a turbid estuary. Mar. Ecol. Prog. Ser. 144, 247–264. doi: 10.3354/meps144247
MacIntyre, H. L., Geider, R. J., and Miller, D. C. (1996). Microphytobenthos - the ecological role of the secret garden of unvegetated, shallow-water marine habitats. 1. distribution, abundance and primary production. Estuaries 19, 186–201.
Marques da Silva, J., Cruz, S., and Cartaxana, P. (2017). Inorganic carbon availability in benthic diatom communities: photosynthesis and migration. Philos. Trans. R. Soc. B Biol. Sci. 372:20160398. doi: 10.1098/rstb.2016.0398
Méléder, V., Jesus, B., Barnett, A., Barillé, L., and Lavaud, J. (2018). Microphytobenthos primary production estimated by hyperspectral reflectance. PLoS One 13:e0197093. doi: 10.1371/journal.pone.0197093
Morelle, J., Orvain, F., and Claquin, P. (2018). A simple, user friendly tool to readjust raw PAM data from field measurements to avoid over- or underestimating of microphytobenthos photosynthetic parameters. J. Exp. Mar. Bio. Ecol. 503, 136–146. doi: 10.1016/j.jembe.2018.02.007
Morris, E. (2005). Quantifying Primary Production of Microphytobenthos: Application of Optical Methods. Ph. D. Thesis, University of Groningen. Groningen.
Morris, E. P., Forster, R., Peene, J., and Kromkamp, J. C. (2008). Coupling between Photosystem II electron transport and carbon fixation in microphytobenthos. Aquat. Microb. Ecol. 50, 301–311. doi: 10.3354/ame01175
Orvain, F., Lefebvre, S., Montepini, J., Sébire, M., Gangnery, A., and Sylvand, B. (2012). Spatial and temporal interaction between sediment and microphytobenthos in a temperate estuarine macro-intertidal bay. Mar. Ecol. Prog. Ser. 458, 53–68. doi: 10.3354/meps09698
Paterson, D. M. (1989). Short-term changes in the erodibility of intertidal cohesive sediments related to the migratory behaviour of epipelic diatoms. Limnol. Oceanogr. 34, 223–234. doi: 10.4319/lo.1989.34.1.0223
Paterson, D. M., and Black, K. S. (1999). “Water flow, sediment dynamics and benthic biology,” in Advances in Ecological Research, eds D. M. Paterson and K. Black (Cambridge, MA: Academic Press Inc), 155–193. doi: 10.1016/s0065-2504(08)60193-2
Perkins, R. G., Kromkamp, J. C., Serôdio, J., Lavaud, J., Jesus, B., Mouget, J. L., et al. (2010). “The application of variable chlorophyll fluorescence to microphytobenthic biofilms,” in Chlorophyll a Fluorescence in Aquatic Sciences: Methods and Applications, eds D. A. Duggett, O. Prasil, and M. A. Borowitzka (Dordecht: Springer), 277–292.
Perkins, R. G., Mouget, J. L., Lefebvre, S., and Lavaud, J. (2006). Light response curve methodology and possible implications in the application of chlorophyll fluorescence to benthic diatoms. Mar. Biol. 149, 703–712. doi: 10.1007/s00227-005-0222-z
Pinckney, J., and Zingmark, R. (1991). Effects of tidal stage and sun angles on intertidal benthic microalgal productivity. Mar. Ecol. Prog. Ser. 76, 81–89. doi: 10.3354/meps076081
R Core Team (2018). R: A Language and Environment for Statistical Computing. Vienna: R Foundation for Statistical Computing.
RStudio Team (2020). RStudio: Integrated Development for R. Boston, MA: RStudio, PBC. Available online at: http://www.rstudio.com/
Sahan, E., Sabbe, K., Creach, V., Hernandez-Raquet, G., Vyverman, W., Stal, L., et al. (2007). Community structure and seasonal dynamics of diatom biofilms and associated grazers in intertidal mudflats. Aquat. Microb. Ecol. 47, 253–266. doi: 10.3354/ame047253
Serôdio, J. (2003). A chlorophyll fluorescence index to estimate short-term rates of photosynthesis by intertidal microphytobenthos. J. Phycol. 39, 33–46. doi: 10.1046/j.1529-8817.2003.02043.x
Serôdio, J. (2004). Analysis of variable chlorophyll fluorescence in microphytobenthos assemblages: implications of the use of depth-integrated measurements. Aquat. Microb. Ecol. 36, 137–152. doi: 10.3354/ame036137
Serôdio, J., Coelho, H., Vieira, S., and Cruz, S. (2006). Microphytobenthos vertical migratory photoresponse as characterised by light-response curves of surface biomass. Estuar. Coast Shelf Sci. 68, 547–556. doi: 10.1016/j.ecss.2006.03.005
Serôdio, J., Da Silva, J. M., and Catarino, F. (1997). Nondestructive tracing of migratory rhythms of intertidal benthic microalgae using in vivo chlorophyll a fluorescence. J. Phycol. 33, 542–553. doi: 10.1111/j.0022-3646.1997.00542.x
Serôdio, J., Ezequiel, J., Frommlet, J., Laviale, M., and Lavaud, J. (2013). A method for the rapid generation of nonsequential light-response curves of chlorophyll fluorescence. Plant Physiol. 163, 1089–1102. doi: 10.1104/pp.113.225243
Smith, D. J., and Underwood, G. J. C. (2000). The production of extracellular carbohydrates by estuarine benthic diatoms: the effects of growth phase and light and dark treatment. Eur. J. Phycol. 35, 173–182.
Tolhurst, T. J., Jesus, B., Brotas, V., and Paterson, D. M. (2003). “Diatom migration and sediment armouring — an example from the Tagus Estuary, Portugal,” in Migrations and Dispersal of Marine Organisms, eds M. B. Jones, A. Ingólfsson, G. V. Helgason, E. Ólafsson, K. Gunnarsson, and J. Svavarsson (Berlin: Springer), 183–193. doi: 10.1023/b:hydr.0000008474.33782.8d
Underwood, G. J. C., and Kromkamp, J. (1999). Primary production by phytoplankton and microphytobenthos in estuaries. Adv. Ecol. Res. 29, 93–153. doi: 10.1016/s0065-2504(08)60192-0
Underwood, G. J. C., and Paterson, D. M. (2003). The importance of extracellular carbohydrate production by marine epipelic diatoms. Adv. Bot. Res. 40, 183–240. doi: 10.1016/s0065-2296(05)40005-1
van der Wal, D., van den Dool, A. W., and Herman, P. M. J. (2010). Spatial synchrony in intertidal benthic algal biomass in temperate coastal and estuarine ecosystems. Water 13, 338–351. doi: 10.1007/s10021-010-9322-9
Wangpraseurt, D., Lichtenberg, M., Jacques, S. L., Larkum, A. W. D., and Kühl, M. (2019). Optical properties of corals distort variable chlorophyll fluorescence measurements. Plant Physiol. 179, 1608–1619. doi: 10.1104/pp.18.01275
Keywords: microphytobenthos, microscale variability, surface biofilm, photosynthetic activity, chlorophyll fluorescence, vertical migration, photosynthetic electron transport, estuary
Citation: Kromkamp JC, Morris E and Forster RM (2020) Microscale Variability in Biomass and Photosynthetic Activity of Microphytobenthos During a Spring-Neap Tidal Cycle. Front. Mar. Sci. 7:562. doi: 10.3389/fmars.2020.00562
Received: 06 December 2019; Accepted: 18 June 2020;
Published: 22 July 2020.
Edited by:
Vona Meleder, Université de Nantes, FranceReviewed by:
Elena Maggi, University of Pisa, ItalyJames L. Pinckney, University of South Carolina, United States
Copyright © 2020 Kromkamp, Morris and Forster. This is an open-access article distributed under the terms of the Creative Commons Attribution License (CC BY). The use, distribution or reproduction in other forums is permitted, provided the original author(s) and the copyright owner(s) are credited and that the original publication in this journal is cited, in accordance with accepted academic practice. No use, distribution or reproduction is permitted which does not comply with these terms.
*Correspondence: Jacco C. Kromkamp, amFjY28ua3JvbWthbXBAbmlvei5ubA==; Rodney M. Forster, ci5mb3JzdGVyQGh1bGwuYWMudWs=