 Ross Coppin
 Christo Rautenbach
 Timothy John Ponton
 A. J. Smit
- 1Department of Biodiversity and Conservation Biology, University of the Western Cape, Bellville, South Africa
- 2South African Environmental Observation Network, Elwandle Coastal Node, Port Elizabeth, South Africa
Macroalgal morphological variation is determined to a large extent by a combination of environmental factors, with wave exposure and temperature perhaps the main influences, as they are key environmental properties to which a species becomes locally adapted. Macroalgae have shown to exhibit different responses to different magnitudes of exposure to waves, such as reduction in overall size and strength increasing traits. In terms of temperature, warmer environments have been shown to reduce the overall size of resident and transplanted species. However, none of the past studies have identified specific wave and temperature metrics responsible for the morphological adaptation macroalgae exhibit. Past research has often used simple or two-dimensional models of wave exposure, which do not take into account important aspects of the nearshore environment such as wave breaking, refraction and diffraction. Furthermore, past studies have often used satellite-derived datasets as sources for temperature data, however, such data have been shown to have large bias when applied to the nearshore environment. This study used in situ temperature data and wave power metrics calculated from a 3D-numerical model to identify specific temperature and wave metrics responsible for morphological adaptation of the kelp, Ecklonia maxima and Laminaria pallida. Between temperature and wave exposure, the results identify wave exposure as the main influencer of morphological adaptation while identifying specific wave metrics. Furthermore, the results show differences in wave metrics between species; and between deep and shallow populations.
Introduction
Kelps are a group of large seaweeds of the order Laminariales (Ochrophyta), which despite their relatively low taxonomic diversity of species in genera (Bolton, 2010), form the basis of one of the most productive ecosystems globally (Mann, 1973; Krumhansl and Scheibling, 2012). Kelps generally have a dependence on cool-temperate and arctic seawater temperatures (Dayton, 1985; Bolton, 2010; Cavanaugh et al., 2011; Mohring et al., 2014), and dominate the nearshore biomass within the rocky shallow coasts in both hemispheres (Steneck et al., 2002). Their size and complex morphology provide a heterogeneous habitat structure (Steneck et al., 2002) that accommodate a multitude of turf and sub-canopy seaweed species, and diverse assemblages of sessile and mobile invertebrates and vertebrates (Mann, 1973; Steneck et al., 2002), each depending on a wide suite of ecological services provided by kelp forests (Dayton, 1985; Gaines and Roughgarden, 1987; Paul and Steneck, 1993; Levin, 1994; Anderson et al., 1997; Willis and Anderson, 2003). Wave exposure and temperature are regarded as important environmental drivers of kelp forests, and play a role in their distribution (Gorman et al., 2013), abundance (Dayton et al., 1998; Cavanaugh et al., 2011), diversity (Wing et al., 2007; Wernberg and Goldberg, 2008), composition (Dayton, 1985; Leliaert et al., 2000; Harley et al., 2012; Norderhaug et al., 2012), growth (Cousens, 1982) and productivity (Dayton et al., 1998; Krumhansl and Scheibling, 2012; Pedersen and Nejrup, 2012).
Given that kelps are cool-temperate organisms which are vulnerable to dislodgement under high wave exposure scenarios, increases in storm frequency and magnitude, and changes in ocean temperature, pose a direct threat to their survival; which is a concern considering that these variables are known to be affected by climate change (Weisse, 2010; Rose et al., 2012; Rummukainen, 2012; Russo et al., 2014; Reguero et al., 2019). Warmer temperatures reduces the resilience of kelp individuals to storm disturbance (Wernberg et al., 2010), causes fragmentation through weakening tissues (Simonson et al., 2015) and reduces growth and productivity (Zimmerman and Kremer, 1986; Gerard, 1997; Bearham et al., 2013; Gao et al., 2013); while storms and high wave energy dislodge and break kelps (Seymour et al., 1989; Graham, 2004; Byrnes et al., 2011). Despite these threats and disturbances kelps persist across a broad range of environments which is largely due to their morphological plasticity (Fowler-Walker et al., 2006; Wernberg and Vanderklift, 2010). A study by Wernberg et al. (2003) investigated the morphology of Ecklonia radiata (C.Agardh) J.Agardh in order to quantify the morphological variation and whether it was dependent on spatial differences along the Australian coast. They found no correlation between spatial distance and morphological similarity; rather the morphology of the kelps was representative of multiple environmental forcings on different morphological characters at different spatial scales (Wernberg et al., 2003).
Although multiple environmental factors play a role in kelp morphological adaptation, wave exposure and temperature have been identified as the main influencers across various kelp species (Hurd, 2000; Denny and Gaylord, 2002; Thomsen et al., 2004; Fowler-Walker et al., 2005; Wernberg and Thomsen, 2005; Mabin et al., 2013; Bekkby et al., 2014). For example, a study by Serisawa et al. (2002) compared the morphology of Ecklonia cava Kjellman growing at warmer and cooler sites, and showed wrinkling of the blade and reduced size to be a characteristic of higher temperature ranges. Warmer temperature affects important kelp physiological processes such as photosynthesis and respiration, which influences growth and productivity and ultimately leads to a reduction in size (Zimmerman and Kremer, 1986; Gerard, 1997; Bearham et al., 2013; Gao et al., 2013). Past research has shown that in highly wave exposed areas kelp morphology tends to take on characteristics which reduce drag, increase strength and increase flexibility (Hurd, 2000; Denny and Gaylord, 2002; Thomsen et al., 2004; Fowler-Walker et al., 2005). For example, a study by Wernberg and Thomsen (2005) examined the consistency of wave exposure as a driver of E. radiata across a broad geographic range, and showed trends toward drag-reducing (small size, narrow laterals and blades, low spinosity) and increased strength (large holdfast, thick stipe and thick blades and lamina) at high wave exposure sites.
Measures of wave exposure in ecological studies often incorporate integrative measures of hydrodynamic conditions at a particular site which are based on cartographical models of exposure. Cartographical models of wave exposure are “fetch-based-models” which measure the length of open water associated with a particular site in a straight line, and are regarded as simple measures of wave exposure. Advances in numerical modeling based on physical/linear wave theory incorporate more complexity (wind forcing, wave-wave interactions, wave breaking, diffraction and variation in wave direction) into the models and allow for a quantitative, reproducible approach for characterizing the hydrodynamic environment. Although Mabin et al. (2013) investigated kelp morphological characteristics using a 2D WAM model, currently no studies investigating macroalgal morphological characteristics in relation to the wave environment have incorporated 3D spectral numerical modeling. Furthermore no studies have identified specific wave metrics that drive kelp morphological characteristics, which the current work will aim to achieve. Other considerations such as possible differences in morphology between sub-canopy and canopy species, and shallow and deep water kelp populations have not been considered using advanced numerical and statistical tools. Due to the complex effects of environmental drivers on kelp morphology, one can also expect differences in morphology between deep and shallow water populations of the same species. Deep and shallow water environments may differ in abiotic processes such as the degree of water column mixing (Smit et al., 2013), solar heating (Dunne and Brown, 2001; Dellatorre et al., 2012), and effects of wave dampening (Kobayashi et al., 1993; Dubi and Tørum, 1995; Ma et al., 2013).
The kelps Laminaria pallida Greville and Ecklonia maxima (Osbeck) Papenfuss are important habitat forming seaweeds that exist around the coast of South Africa and offer a unique opportunity to investigate the drivers of macroalgal morphological characteristics between canopy and sub-canopy species, as well as between deep and shallow water environments. Although both these species exist in the sub-tidal, L. pallida dominates deeper waters while E. maxima forms dense surface canopies in the shallow sub-littoral. Therefore, E. maxima may be exposed to variations in wind driven surface waves, swell waves and temperature, while L. pallida is exposed to variations in swell waves, wave exposure and temperature due to differences in depth. Molloy and Bolton (1996) investigated the effect of depth and wave exposure on L. pallida and showed that depth had a greater effect than wave exposure when considering all the morphological characteristics; when considering individual characteristics, however, wave exposure had the most significant effect on blade thickness. Another study by Rothman et al. (2017) investigated the changes in morphology in shallow populations of L. pallida and E. maxima along the South African coastline and into Namibia; E. maxima exhibited no morphological changes along the coast but the stipes of L. pallida become increasingly hollow further north along the coastline. The authors suggested that turbidity in relation to light attenuation was the environmental driver responsible for this change.
The aim of this study is, therefore, to understand how temperature and wave exposure can influence the morphology of sub-canopy and canopy kelps, as well as between deep and shallow populations of the same species. The current study will also aim to identify specific temperature and wave metrics which drive kelp morphological characteristics. This will be achieved by initially understanding the variation in temperature and waves using a numerical model. The numerical model will then be used as a basis for investigating the consequences for morphological characteristics of E. maxima and L. pallida using advanced statistical tools.
Materials and Methods
Site Selection
Sites were chosen to represent an array of temperature and wave gradients, as indicated in Figure 1. St. Helena Bay and Betty’s Bay constituted the north-western and south-eastern boundary sites, respectively. These sites are roughly 300 km apart, lie within separate marine provinces (Smit et al., 2017), and span the majority of the south-west coast, in varying thermal and wave energy regimes. The region is dominated by kelp communities that persist in contrasting abiotic environments. The west coast region has been termed cool-temperate, which is defined as a region where mean monthly temperatures are always above 10°C and below 15°C (Smit et al., 2013). East of Cape Point marks the beginning of an overlap or transition area, which is also referred to as the Benguela-Agulhas Transition Zone (Smit et al., 2013). The Agulhas Marine Province is characterized by a wide temperature range of up to 7°C difference between mean monthly temperatures between summer and winter and is classified as warm-temperate (Smit et al., 2013).
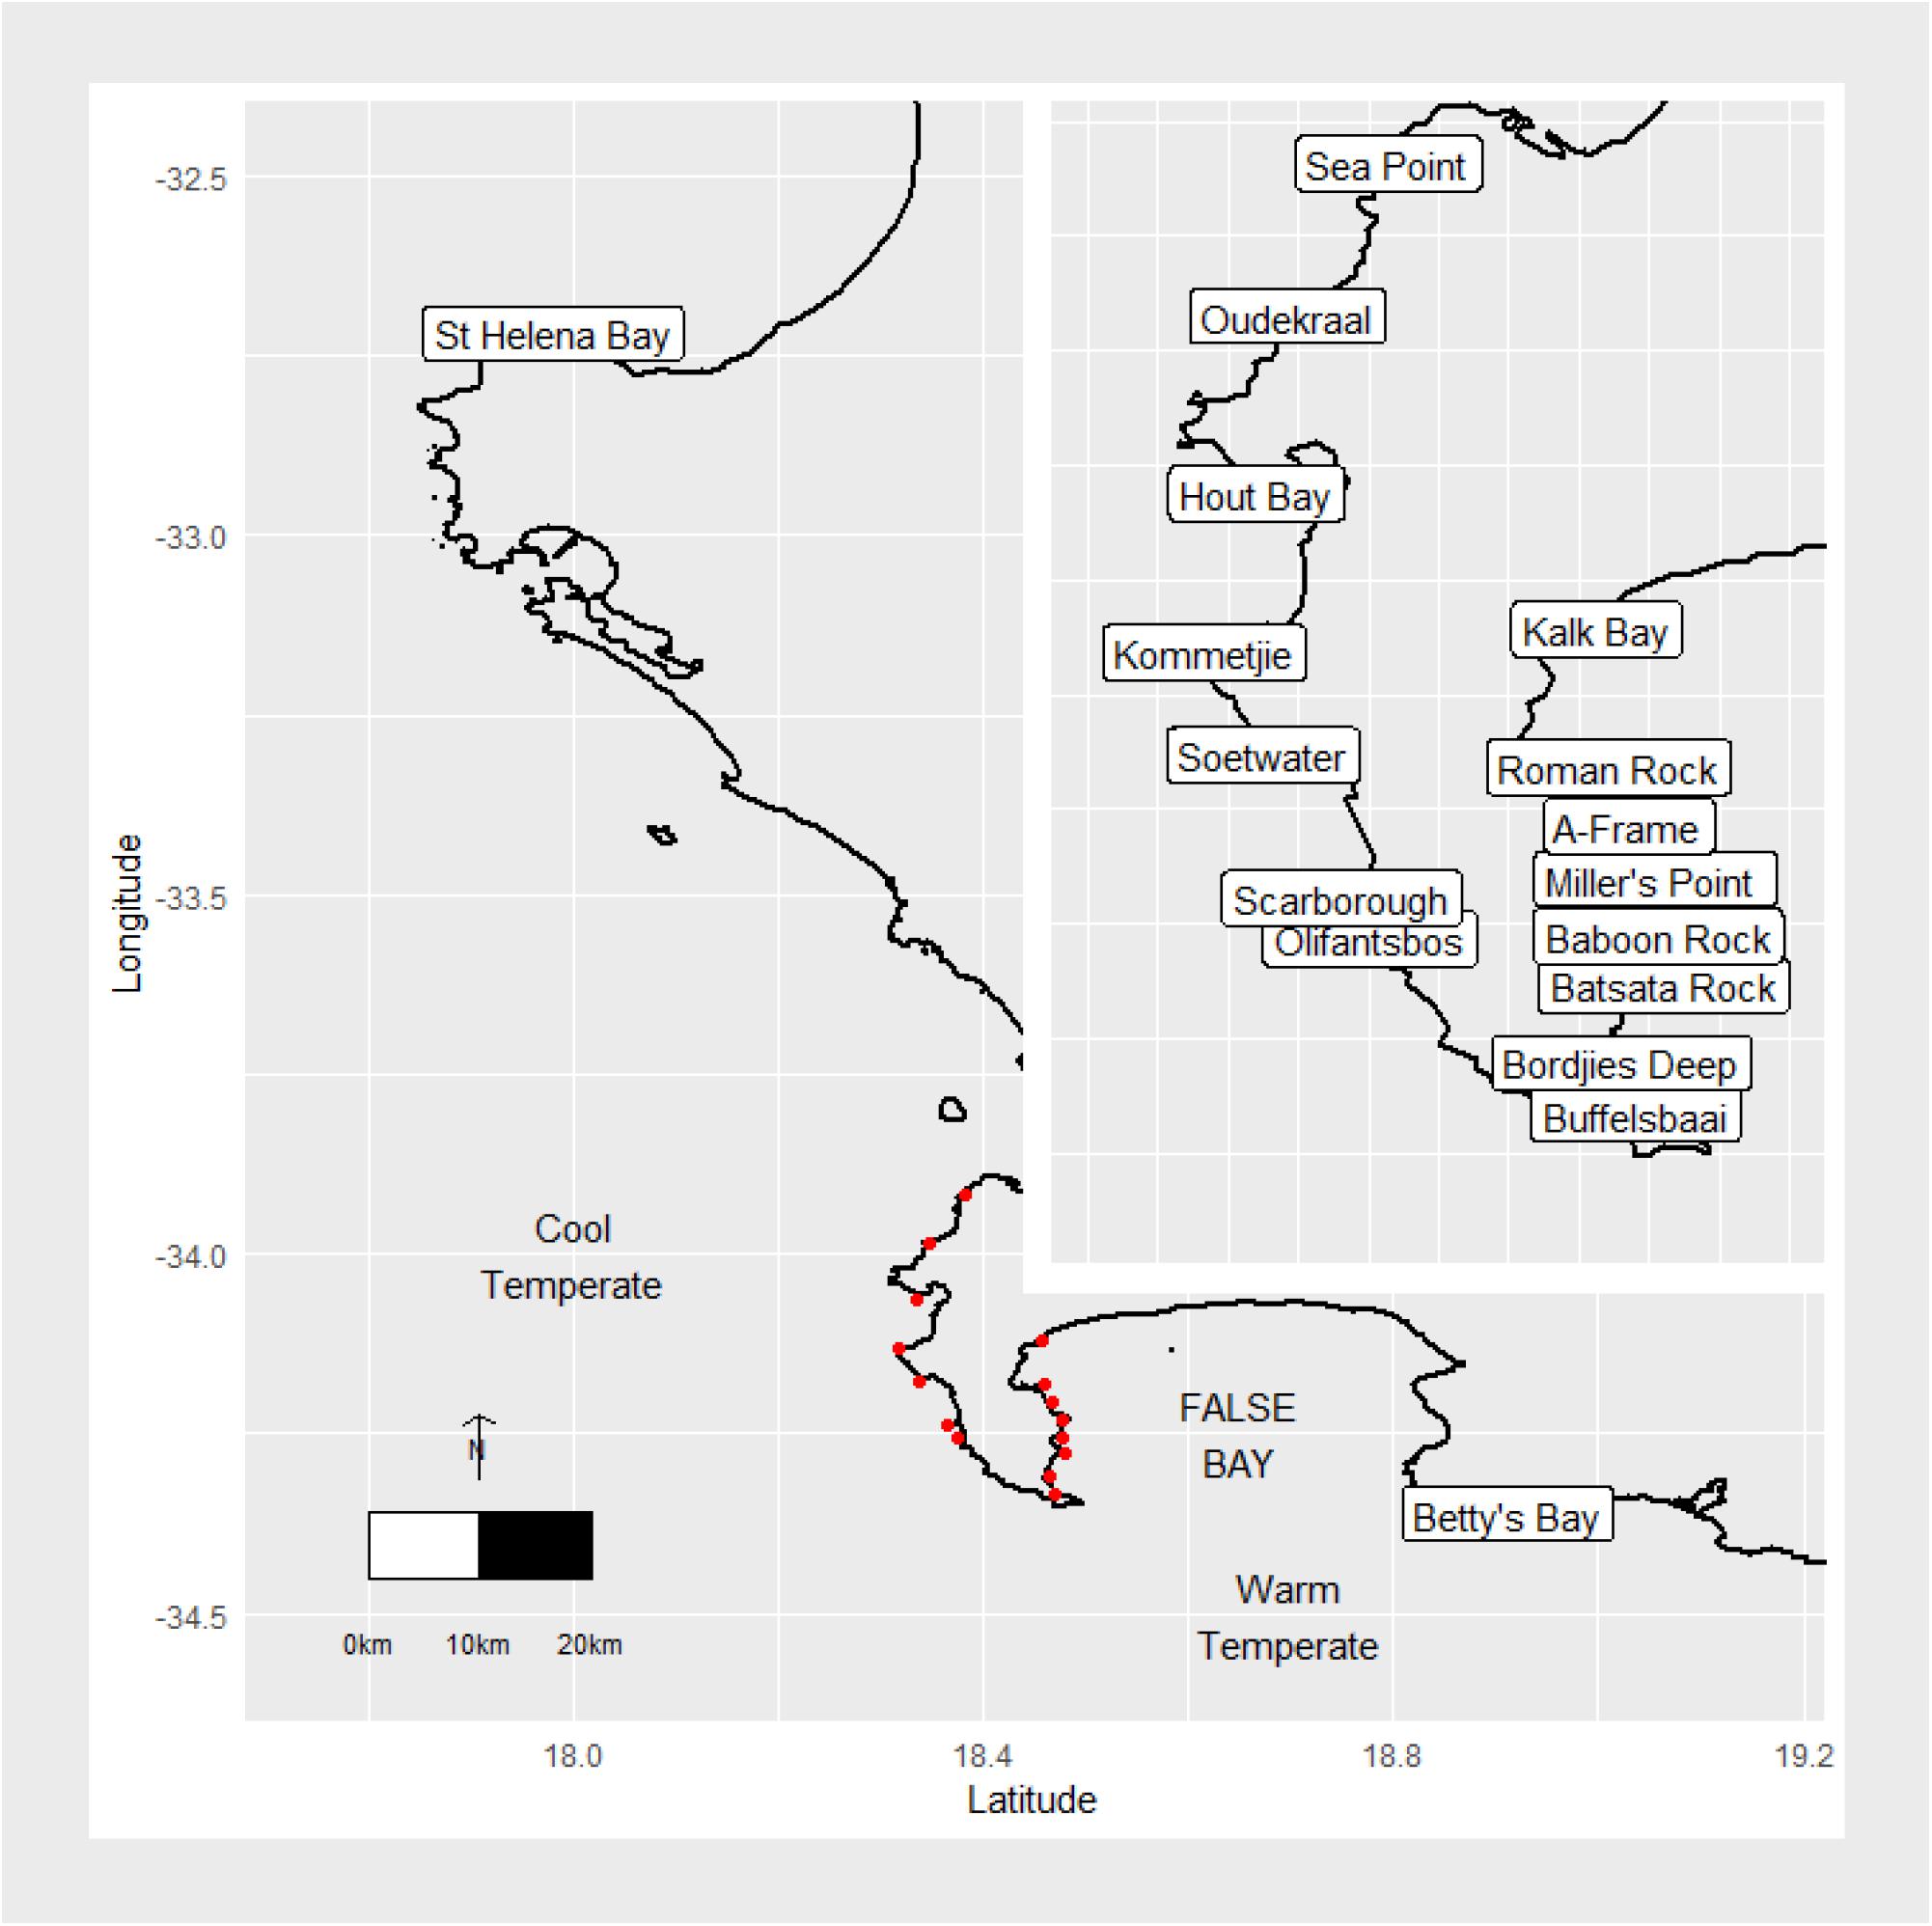
Figure 1. Map of the study area and sampling sites. The red dots represent study sites around the Cape Peninsula.
The annual and seasonal patterns in both wind and swell direction influence the thermal regime around the coastline by inducing upwelling. Upwelling brings deep, cool nutrient-rich water to coastal areas which causes a decrease in temperature (Cram, 1970; Gill and Clarke, 1974; Andrews and Hutchings, 1980; Field et al., 1980; Blanke et al., 2002; Rouault et al., 2010). The wind speed and wind direction help drive upwelling in summer on the western side of the Cape Peninsula, where southerly winds blow parallel to the coast and trigger upwelling events (Field et al., 1980; Rouault et al., 2010). This is not the case for False Bay, which is shielded from the dominating wind and swell that the Cape Peninsula is subjected to. In the summer months, upwelling becomes more favorable in False Bay due to the change in swell and wind direction, causing lower temperatures to dominate during this time (Andrews and Hutchings, 1980; Rouault et al., 2010). Due to the Cape Peninsula temperate latitude, winter months bring an increased frequency of frontal depressions that originate from the Southern Ocean (Reason et al., 2006). These low pressures are joined by large swells with increased wave energy. The nearshore environment, with the accompanied biota, therefore experiences high wave energy events, with increased frequency in winter (Veitch et al., 2019). The large peninsula acts as an obstruction for large south westerly swells, providing decreased wave energy along the west side of False Bay (Shipley, 1964). Conversely, the west coast of Cape Point is battered by these large swells. Multiple sites, therefore, exist where kelps grow in diverse temperature and wave energy climates, in close proximity and on the same side. The topography and elevation along the Cape Peninsula channel and shield winds along False Bay. This is, however, absent in winter, when strong northerly winds are prevalent from St. Helena Bay to Betty’s Bay (Andrews and Hutchings, 1980; Field et al., 1980; Jury, 1980; Jury et al., 1985).
Abiotic Environment
In order to compare abiotic variables for sites around the coast, large historical databases for temperature, wave energy and wind were accessed.
Temperature
Shallow water temperatures were sourced from The South African Coastal Temperature Network (SACTN) website1. In terms of nearshore temperature, in situ data are preferred over satellite sea surface temperature (SST), which have shown to exhibit large biases (Smit et al., 2013). The underwater temperature recorders (UTRs) are attached to concrete mooring blocks or railway line sections deployed in the shallow at ∼3 m depth. The UTRs were comprised of Starmon Mini recorders (Star-Oddi, Reykjavik, Iceland/Onset Hobo® U22-001) accurate to ±0.2°C. All in situ temperature data were reduced to a time-coded, continuous series of monthly means over various time-scales (Smit et al., 2013). It was decided that the annual time-scale would be used for analysis. Linear interpolated SST were calculated for sites where in situ recorders were absent. These data were used to group sites into “Cool temperate” and “Warm temperate” categorizations to investigate the possible effect of thermal regime on kelp morphological characteristics.
Wave Environment
Wave model variable data formed part of the South African Coastal Vulnerability Assessment, presented to the Department of Environmental Affairs (DEA) and produced by the Council for Scientific and Industrial Research (CSIR) (Rautenbach, 2015). The South African wave climate was modeled via 20 spectral numerical wave models that simulated the offshore wave climate to the nearshore. The boundary conditions of these models were obtained by using the NOAA Wave Watch III (WWIII) model output, distributed via the National Centers for Environmental Prediction (NCEP) product (Office of the Director 2000; Environmental Modeling Center/Marine Modeling Branch 2005). The particular hindcast product utilized during the DEA-CSIR study spans 1994–2013 at a 3-hour resolution. These data were then used to model swell propagation into the coastal models while wind waves (seas) were generated via stationary computations in the Simulating Waves in the Nearshore SWAN model (Booij et al., 1997). The assumption of stationary computations is acceptable as the model domains were small enough so the temporal variation of the model boundary was slower than the time it takes for that boundary condition to propagate to the coast. SWAN allows one to extract wave variables from specific gridded locations in the nearshore. For False Bay, a resolution of 200 meters was modeled and output produced at both the 7 m and 15 m isobaths. A 200 m resolution was used as the False Bay computational grid was nested within a larger 1 km resolution grid. This allowed for a computational effective wave resolution of increasing resolution, from the NCEP, low resolution output to nested, high resolution coastal output. For Table Bay and east of Cape Hangklip the resolution was 500 m and also had output at the 7 and 15 m isobaths. These contour outputs were chosen in the original study by the CSIR as most engineering run-up calculations require wave parameter information at these contour depths and were the main focus of the original study. For this study the 7 m contours were used. These data were then used to calculate over all wave power (kW/m) as this was considered the best measure of overall wave exposure. Annual wave power was plotted and categorized into different wave exposure categories which ranged from fully sheltered to extremely exposed.
Collection of Kelp Morphological Characteristics
The morphological characteristics of both species are presented in Figure 2. Laminaria pallida is characterized by a single smooth blade which is divided longitudinally into sections, and develops from a single meristematic region located at the junction between the blade and the stipe (Dyer, 2018). This species has a solid stipe along the south-west coast but develops a hollow stipe along the west coast northward and into Namibia (Rothman et al., 2017). Ecklonia maxima consists of a single primary blade which develops above a gas-filled float and a hollow stipe below. Secondary blades are produced laterally from the primary blade from several meristematic regions along the margins of the primary blade (Dyer, 2018). Both species are held to the substrate by finger-like haptera, collectively known as the holdfast.
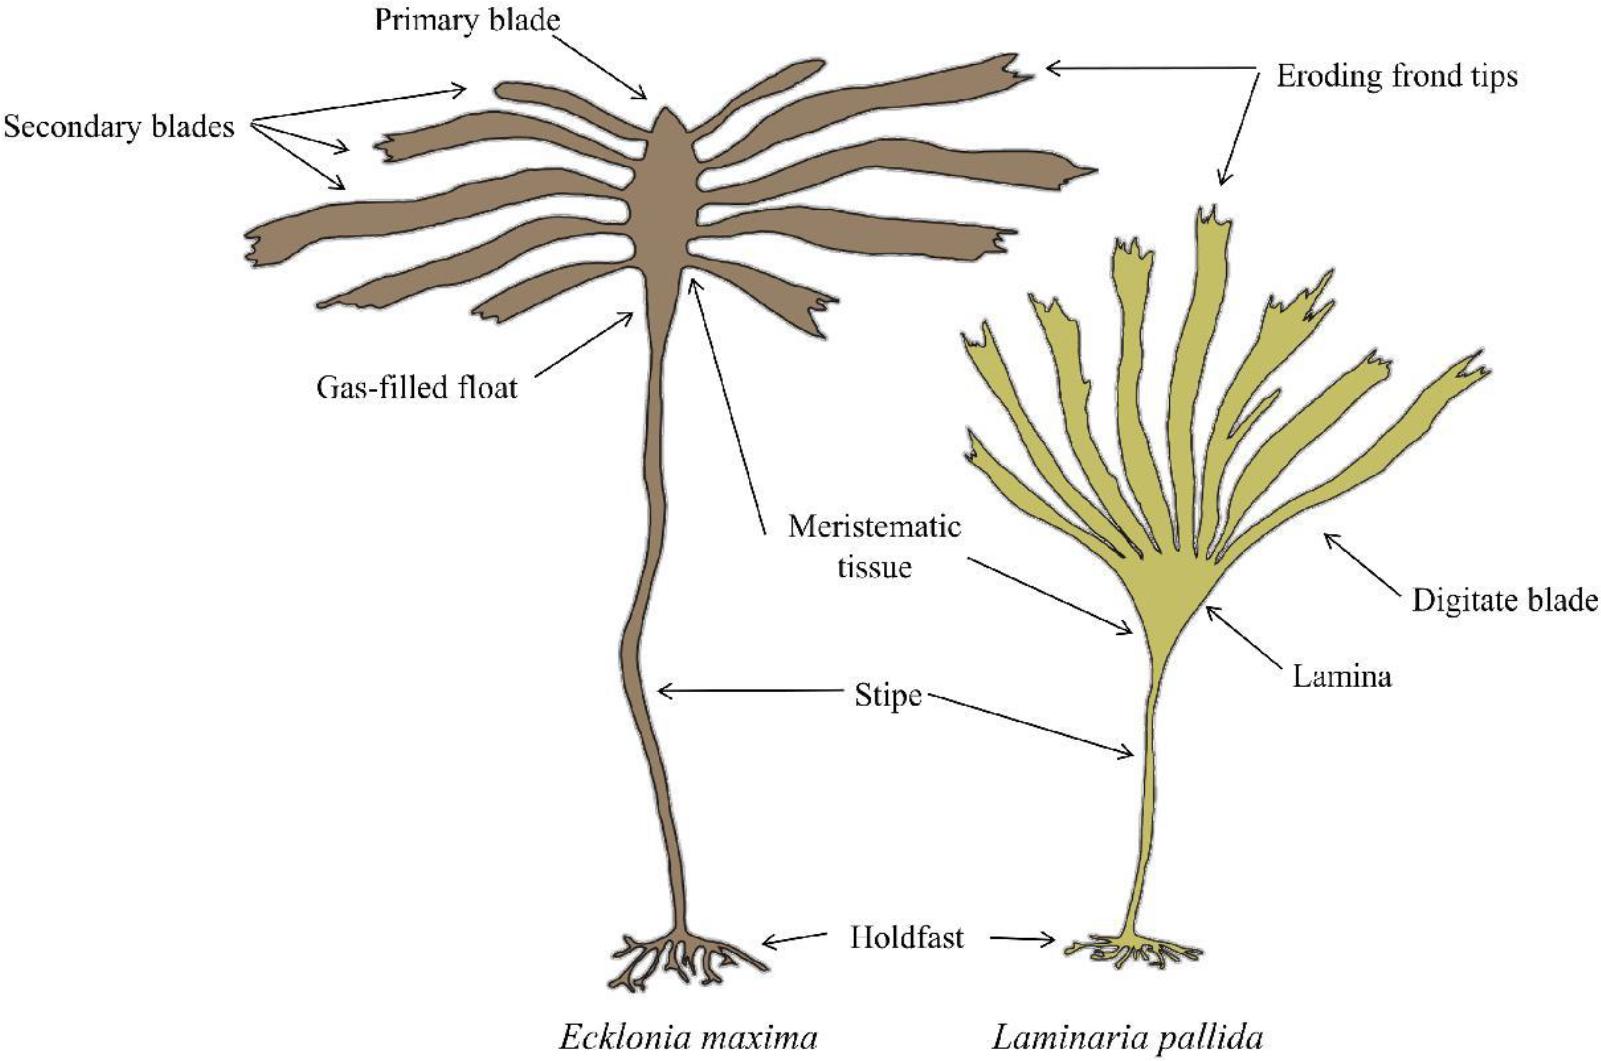
Figure 2. Schematic of Laminaria pallida and Ecklonia maxima morphology (Dyer, 2018).
Morphological measurements of L. pallida and E. maxima were collected at 18 sites along the Western Cape coast of South Africa (Figure 1) between October 2014 and April 2015. AlgaeBase was used to confirm the latest taxonomic associations for each species (Guiry and Guiry, 2019). Divers sampled kelp individuals by means of SCUBA for deeper populations and freediving for shallower populations. The sampled individuals were then taken ashore and the relevant morphological measurements taken. In each instance only the 13 largest individuals were sampled to ensure that only mature and fully grown sporophytes were measured. The age of E. maxima was determined by size, presence at the surface as well as a darker coloration of the stipe; as this occurs with age. In the case of L. pallida, the individuals with the longest stipe were selected which is considered a reasonable estimate of age. In each case the age of the individuals was estimated visually before the individual was sampled. In instances where one of the species was not present a site, the nearest population of the missing species was sampled. Because the macroalgae differ in morphological features, species-specific morphological characteristics were included and are presented in Table 1. The stipe length for E. maxima was considered to be the portion of the plant just below the pneumatocyst and just above the holdfast. Stipe circumference was measured just above the holdfast for both species. Between February 2017 and November 2018, morphological measurements for E. maxima individuals in shallow water (<1 m) at seven sites along the Western Cape coast of South Africa were also collected. The same morphological characteristic measurements were taken as for the deeper E. maxima, and this allowed comparison between morphological characteristics between deep and shallow individuals within sites. Measurements were not collected for L. pallida in the shallow depths, as this species is largely absent from the shallow in this portion of the South African coastline.
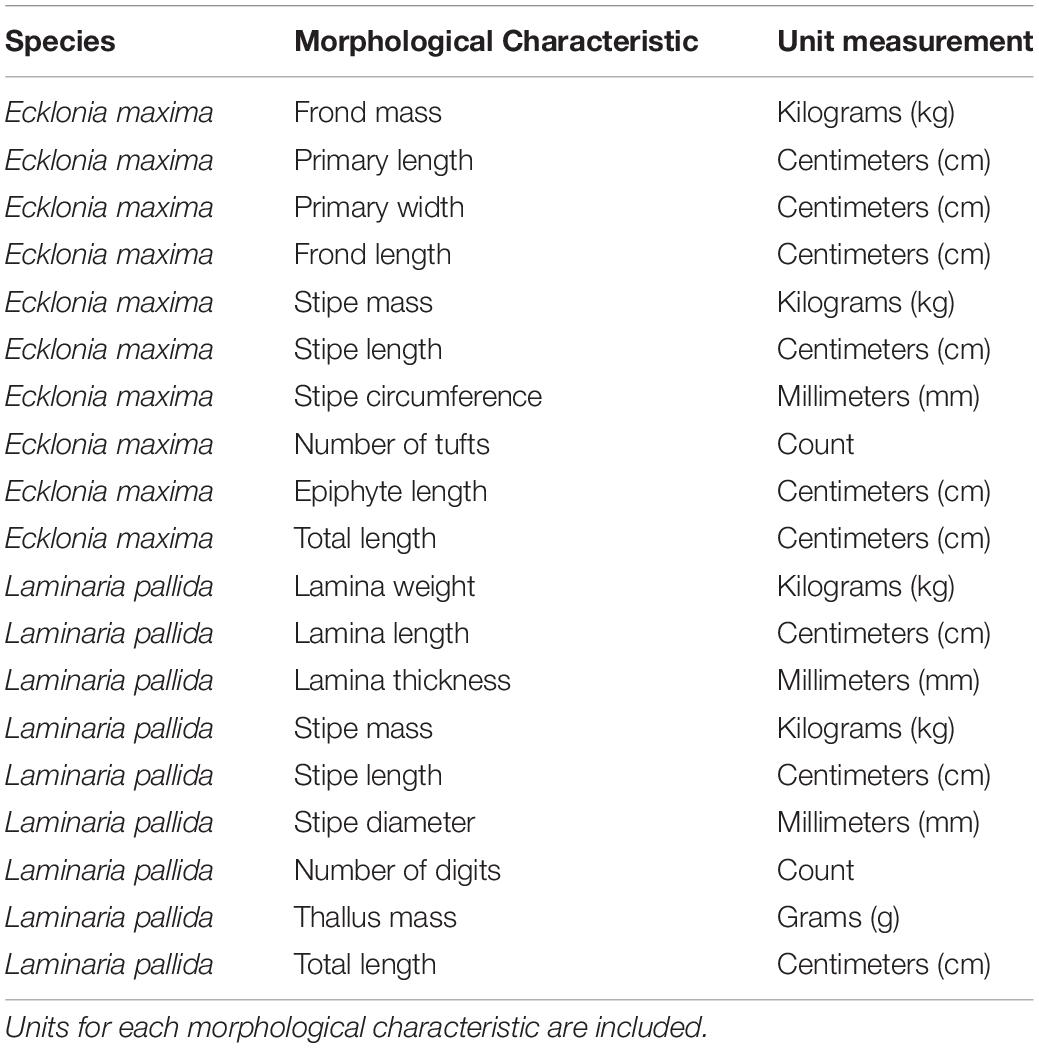
Table 1. A list of morphological measurements that were collected for Ecklonia maxima and Laminaria pallida.
Statistical Analyses
Summary statistics were calculated for each site and region for each of the environmental variables considered in this study, and are presented in Table 2. The associated abbreviations used are also presented in Table 2. In addition, annual median wave and wind direction were also calculated. The median was calculated for wind and wave direction, as issues arise when calculating the mean and standard deviation for compass metrics. Summary statistics for wind was not plotted and instead are discussed, as the data were course relative to the other environmental variables considered in this study.
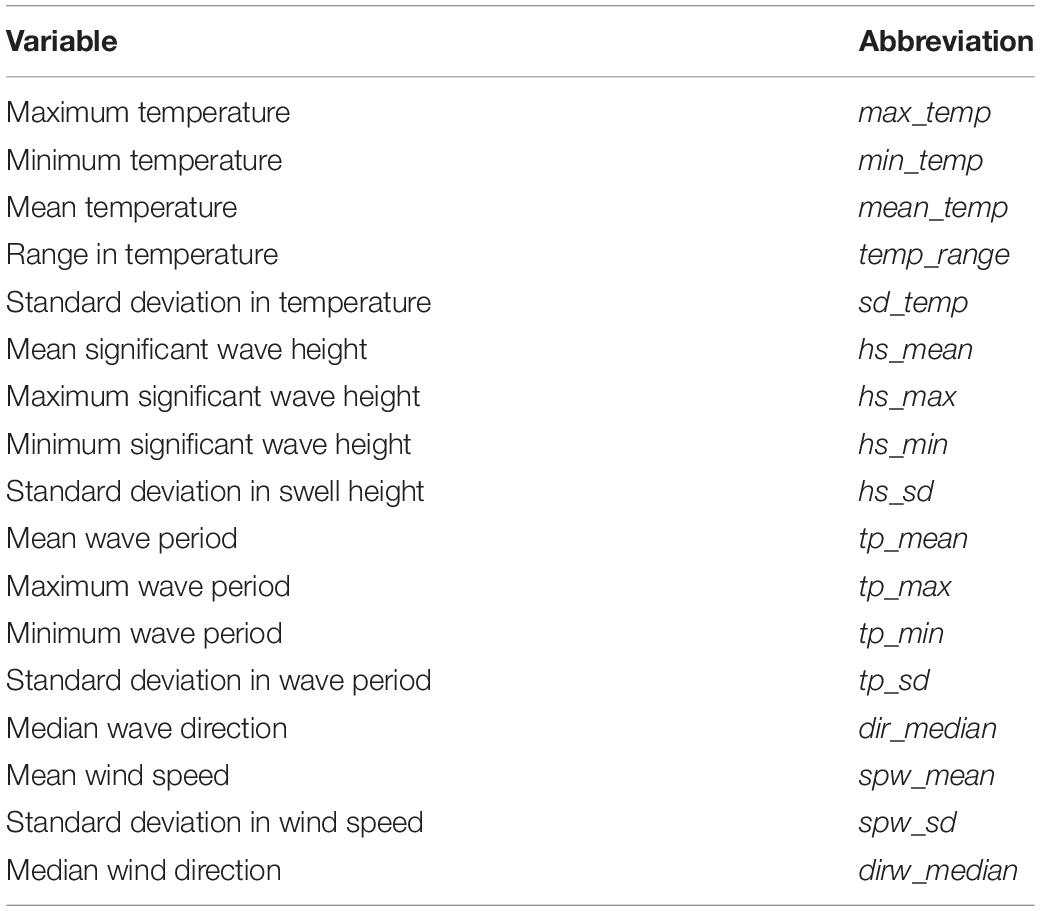
Table 2. A list of measured environmental variables (temperature, waves and wind) and their associated abbreviations.
Morphological characteristics in relation to temperature and wave exposure were investigated using non-parametric statistical methods. Morphological characteristics were placed into categories according to temperature regime and wave exposure class for each species and population of kelp in this study. The appropriate category was determined by kelp’s sampling location along the coastline and the according wave exposure and temperature category assigned to that species and/or population. The R software package ggplot2 was used for graphical output and non-parametric analyses. Significant differences between temperature regimes and across wave exposure categories were tested with Wilcox tests and Kruskal -Wallis tests, respectively, and notched boxplots allowed comparison between individual categories of wave exposure. The alpha level used to define significance was p = 0.05. Boxplots were created using the software package ggplot2 (Wickham, 2009). In order to investigate specific drivers of morphological characteristics a distance-based redundancy analysis (db-RDA) was performed using the rda function in the vegan software package (Oksanen et al., 2015) in R (R Core Team, 2014; RStudio Team, 2020). The abiotic data covered all study sites for both species of kelp. Both morphology and abiotic data (temperature, waves and wind) were standardized using the decostand function in the vegan software package; morphology data were used as response variables and the abiotic data as explanatory variables. A list of the abbreviations used and the associated metrics are presented in Table 2. To determine the explanatory variables that best describe patterns in the response data, a full RDA was performed using a complete set of explanatory variables. Forward selection was then used to reduce the number of explanatory variables, as well as prevent the inflation of overall Type I error. To further improve the model, pairwise coefficients and Variance Inflation Factor (VIF) were calculated to identify variables with high multicollinearity. The computation of the parsimonious RDA was followed by permutation tests of the adjusted R2 to assess significance of constraints.
Results
Abiotic Environment
Temperature
The mean annual coastal water temperature for the study sites located on the western side of the peninsula ranged from 14.5 ± 0.9°C (mean ± SD) at St. Helena Bay, the most northern site on the western side of the peninsula, to 14.6 ± 0.3°C at Olifantsbos, the most southern site on the western side of the peninsula (see Figure 3A). For sites located on the eastern side of the peninsula (within False Bay), the annual mean coastal water temperatures ranged from 15.5 ± 0.9°C at Buffelsbaai to 15.0 ± 0.9°C at Betty’s Bay, the most eastern site on the coastline in this study (see Figure 3A).
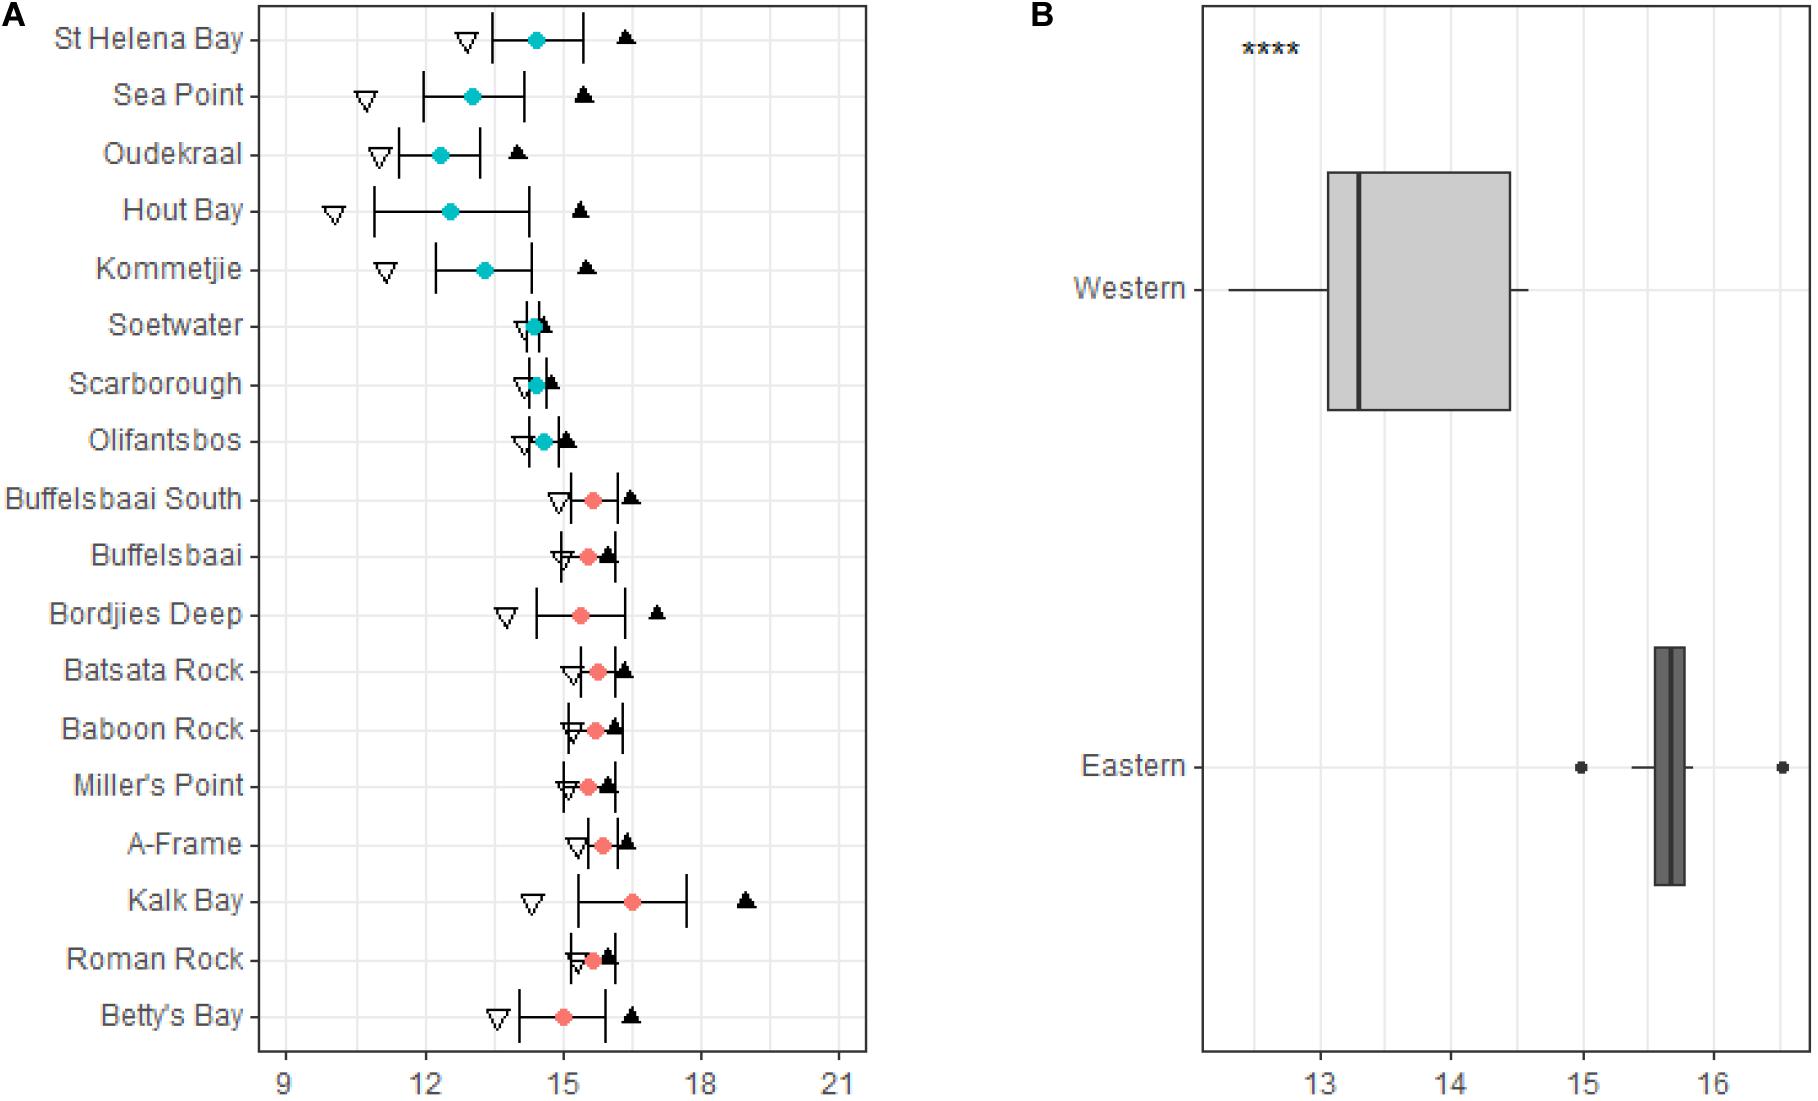
Figure 3. Annual temperature variables at the collection sites around the Cape Peninsula are represented in panel (A), with sites in order from north to south. Temperature variables include minimum represented by inverted triangles, mean represented by blue and red dots which represent the western and eastern side of the peninsula, respectively, maximum by black triangles, and whiskers standard deviation. Summary of temperature data for sites grouped by region are represented in panel (B). Significance levels are as follows: * represents ≤0.05, ** represents ≤0.01, *** represents ≤0.001, **** represents ≤0.0001.
In general, the mean temperature increases for sites located within False Bay with less variation around the mean temperature compared to sites on the western side of the peninsula (see Figure 3A). This is verified by statistical difference based on region, which shows a significantly lower (p < 0.05, Figure 3B) mean temperature and less variation in temperature for sites located on the western side of the peninsula compared to sites on the eastern side.
Wave Environment
Our data show the western side of the peninsula experiences higher significant wave heights and variation in wave heights compared to the eastern side of the peninsula (see Figure 4A). Mean significant wave height ranged from 0.5 ± 0.2 m (mean ± SD) at St. Helena Bay to 2.3 ± 0.7 m at Olifantsbos on the western side of the peninsula, and on the eastern side of the peninsula it ranged from 0.9 ± 0.4 m at Buffelsbaai to 1.9 ± 0.6 m at Betty’s Bay (see Figure 4A). The maximum significant wave height ranged from 1.4 m at St. Helena Bay to 4.7 m at Olifantsbos on the western side of the peninsula, and on the eastern side ranged from 2.6 m at Buffelsbaai to 4.2 m at Betty’s Bay. Mean peak period for sites on the western side of the peninsula ranged from 10.3 ± 3.5 s at St. Helena Bay to 11.0 ± 2.0 s at Olifantsbos, and ranged from 10.6 ± 3.0 s at Buffelsbaai to 10.8 ± 2.2 s at Betty’s Bay (see Figure 4B). The data show no trend in mean peak period for the coastline. These data show that the western side of the peninsula has a lower variation (SD) compared to the eastern side, with Miller’s Point showing the highest variation across timescales. Maximum peak period ranged from 18.9 s at St. Helena Bay to 18.4 s at Olifantsbos for the western side of the peninsula, and ranged from 18.0 s at Buffelsbaai to 18.0 s at Betty’s Bay on the eastern side of the peninsula. When wave variables were grouped by region significant differences were found for both mean significant swell height and mean peak period. The western region experiences a significantly higher mean significant swell height (p < 0.05; see Figure 4C) and mean peak period (p < 0.05; see Figure 4D).
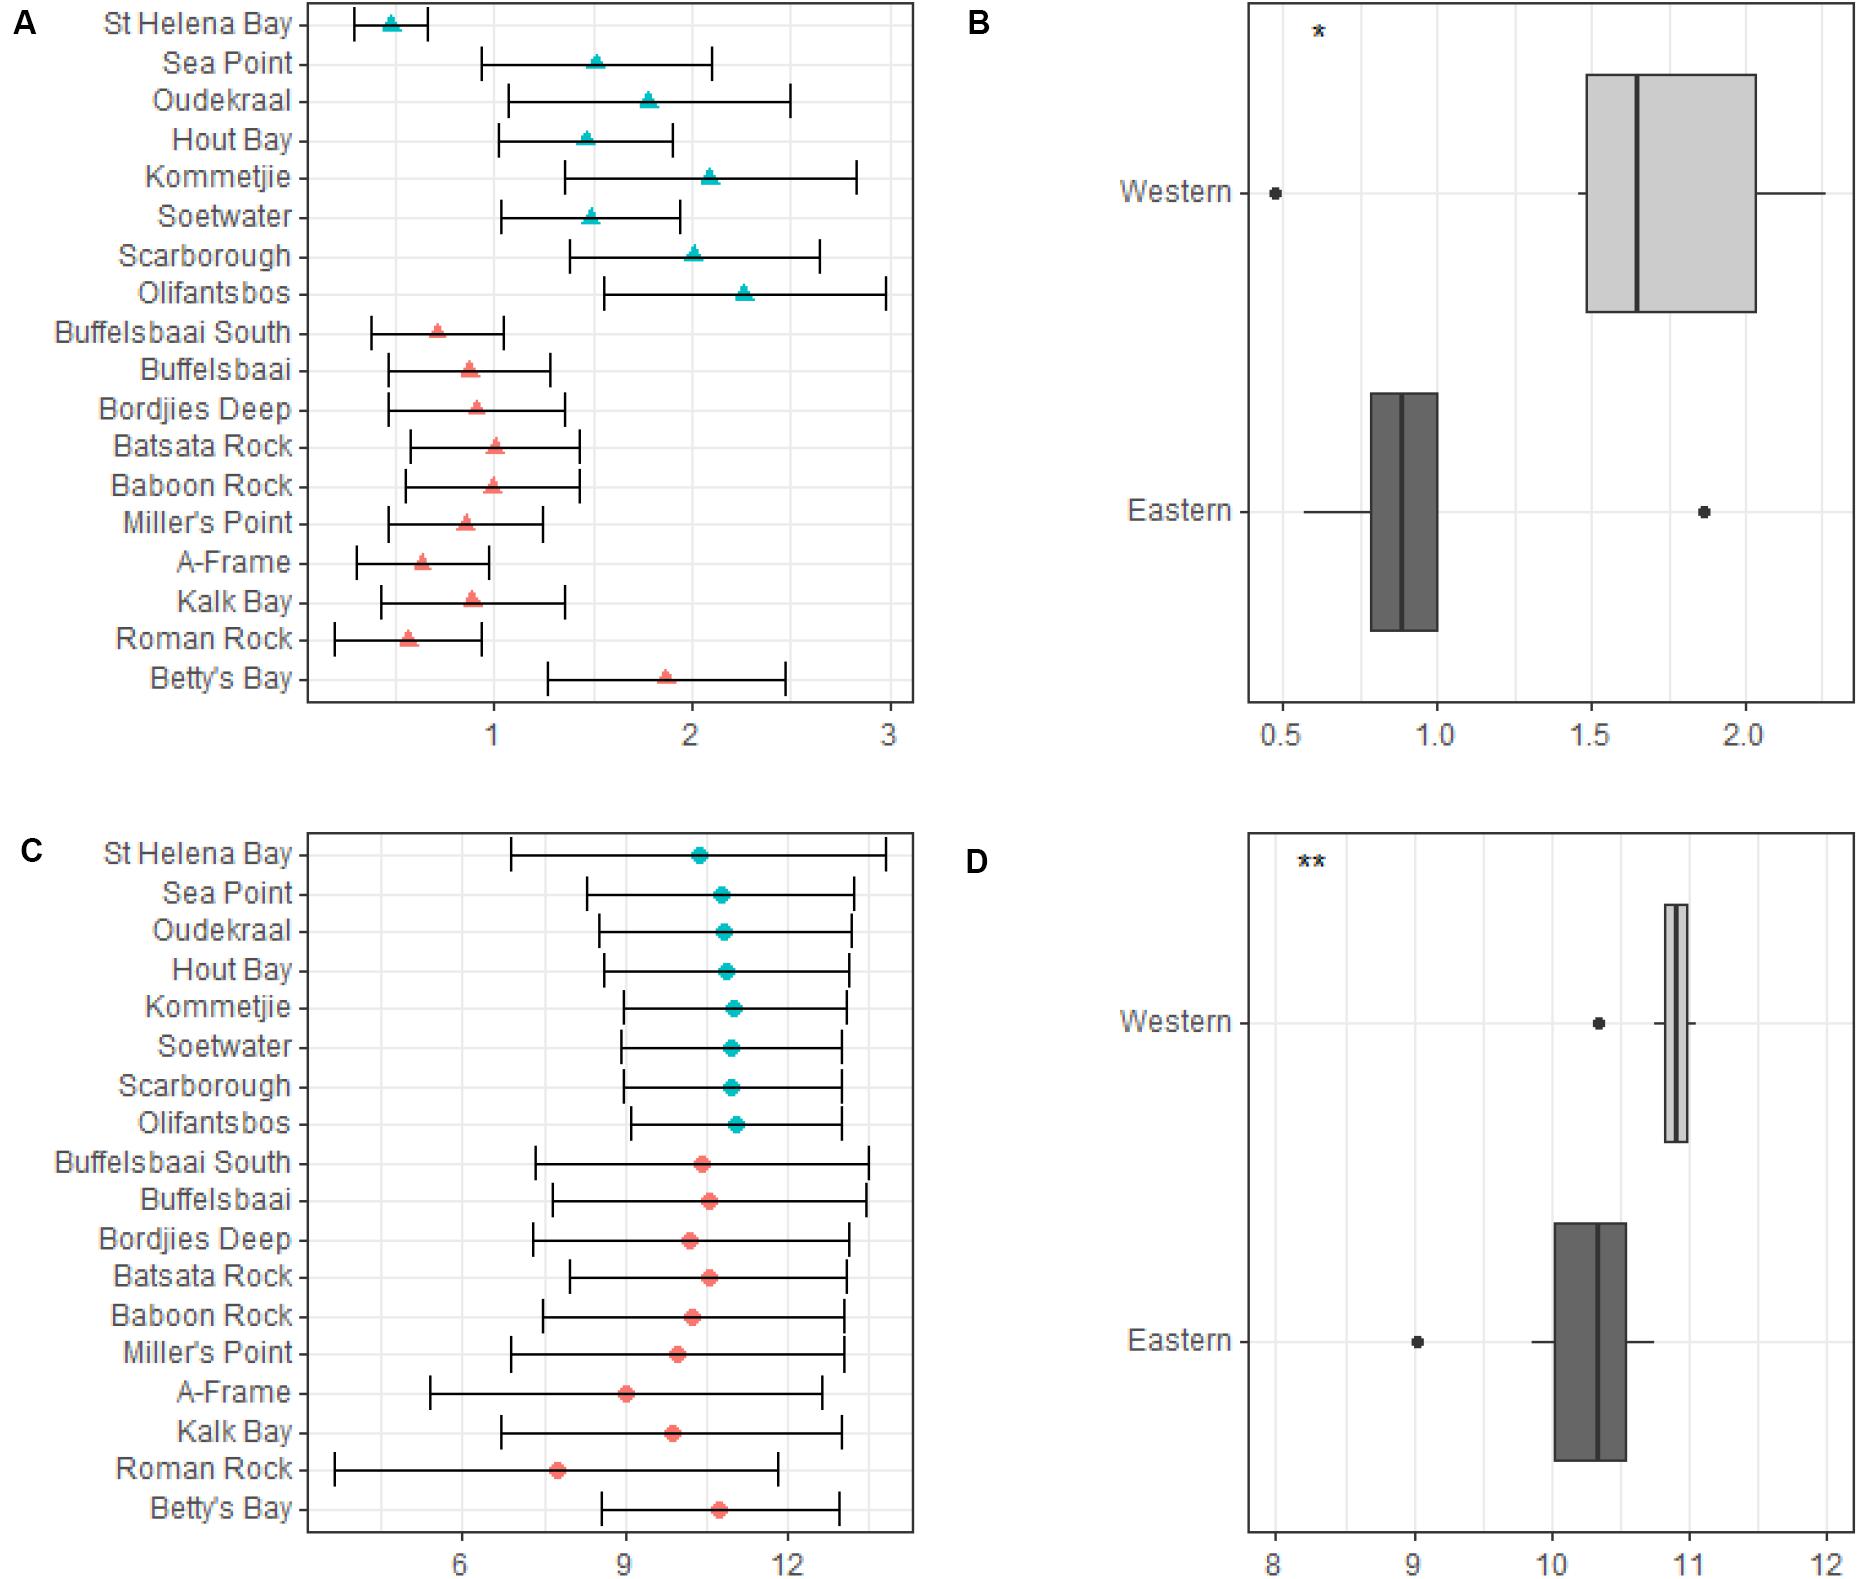
Figure 4. Mean significant wave height (meters) and mean significant peak period (seconds) across sites and by region. Annual mean significant wave height across sites is presented in panel (A) and is represented by solid triangles and standard deviation by the whiskers. Differences in annual mean significant wave height between regions are presented in panel (B). Annual mean significant peak period across sites is presented in panel (C) and is represented by solid dots and standard deviation by whiskers. Differences in annual mean significant peak period between regions are presented in panel (D). Significance levels are as follows: * represents ≤0.05, ** represents ≤0.01, *** represents ≤0.001, **** represents ≤0.0001.
Data for median wave direction showed no trend across timescales, however, the variation (SD) in wave direction is lower on the western side of the peninsula compared to the eastern side both annually and for winter. Summer data were the exception and showed lower variation for the eastern side of the peninsula (see Appendix).
In Figure 5A the total coastal wave exposure of the Cape Peninsula is given in terms of wave energy (kW per meter wave crest length). The classification from fully sheltered to extremely exposed is based on the total wave energy upper and lower limits (see Figure 5B). The western periphery of the Cape Peninsula is almost continuously exposed to high wave exposures while the eastern periphery of the peninsula (western coastline of False Bay) revealed sheltered wave exposures (see Figure 5). There the marked seasonality, with higher energy waves during winter, may be clearly observed once more.
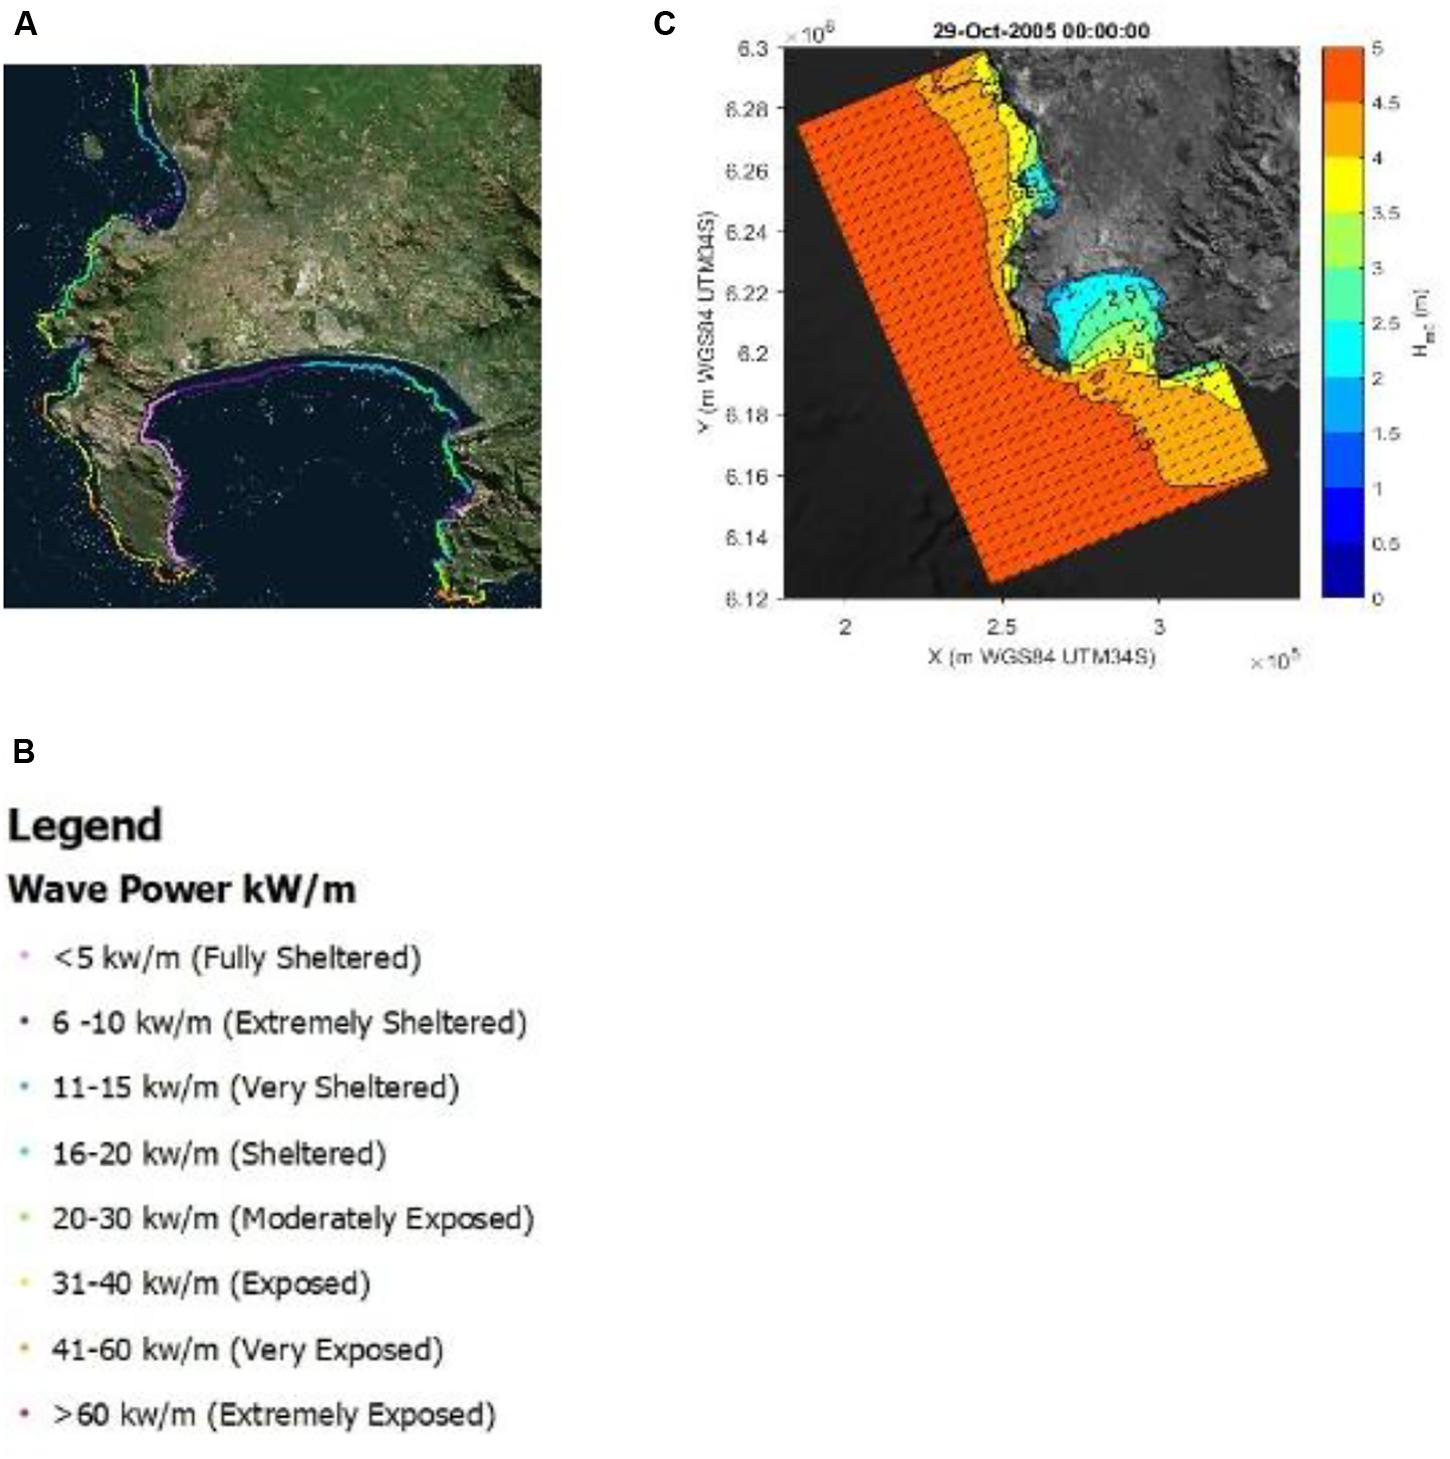
Figure 5. The total coastal wave exposure of the Cape Peninsula is given in terms of wave energy (kW per meter wave crest length) is presented in panel (A) and the associated legend in panel (B). The propagation of a typical offshore wave spectrum is given as produced from a single time-step in SWAN, is represented in panel (C).
To clarify the averaged wave exposure map presented in Figure 5A, the propagation of a typical offshore wave spectrum as produced from a single time-step in SWAN is presented in Figure 5C. Tracing the wave height contours into False Bay its clear why this bay’s western periphery is predominantly sheltered.
Drivers of Kelp Morphological Characteristics
Significant differences were found between cool temperate and warm temperate regimes for most L. pallida morphological characteristics with lamina length, number of digits and thallus mass the exceptions (see Figure 6). Certain morphological characteristics such as stipe mass, stipe length, total length and stipe diameter had significantly higher means for kelp from the cool temperate regime when compared to kelp from the warm temperate regime (p < 0.05; see Figure 6). Conversely, lamina weight and lamina thickness had significantly lower means for kelp from the cool temperate regime compared to kelp from the warm temperate regime. When L. pallida morphological characteristics were grouped to wave exposure categories Kruskal-Wallis tests revealed significant differences amongst categories for most morphological characteristics with lamina length, number of digits and thallus mass the exceptions (see Figure 7). The morphological characteristics that were significantly different amongst sites exhibited similar patterns, with increasing mean values from the fully sheltered to extremely sheltered categories and a decrease in mean values for the remainder of the categories. Two morphological characteristics, namely lamina thickness and stipe diameter, both exhibited higher variations for the exposed categories compared to other morphological characteristics.
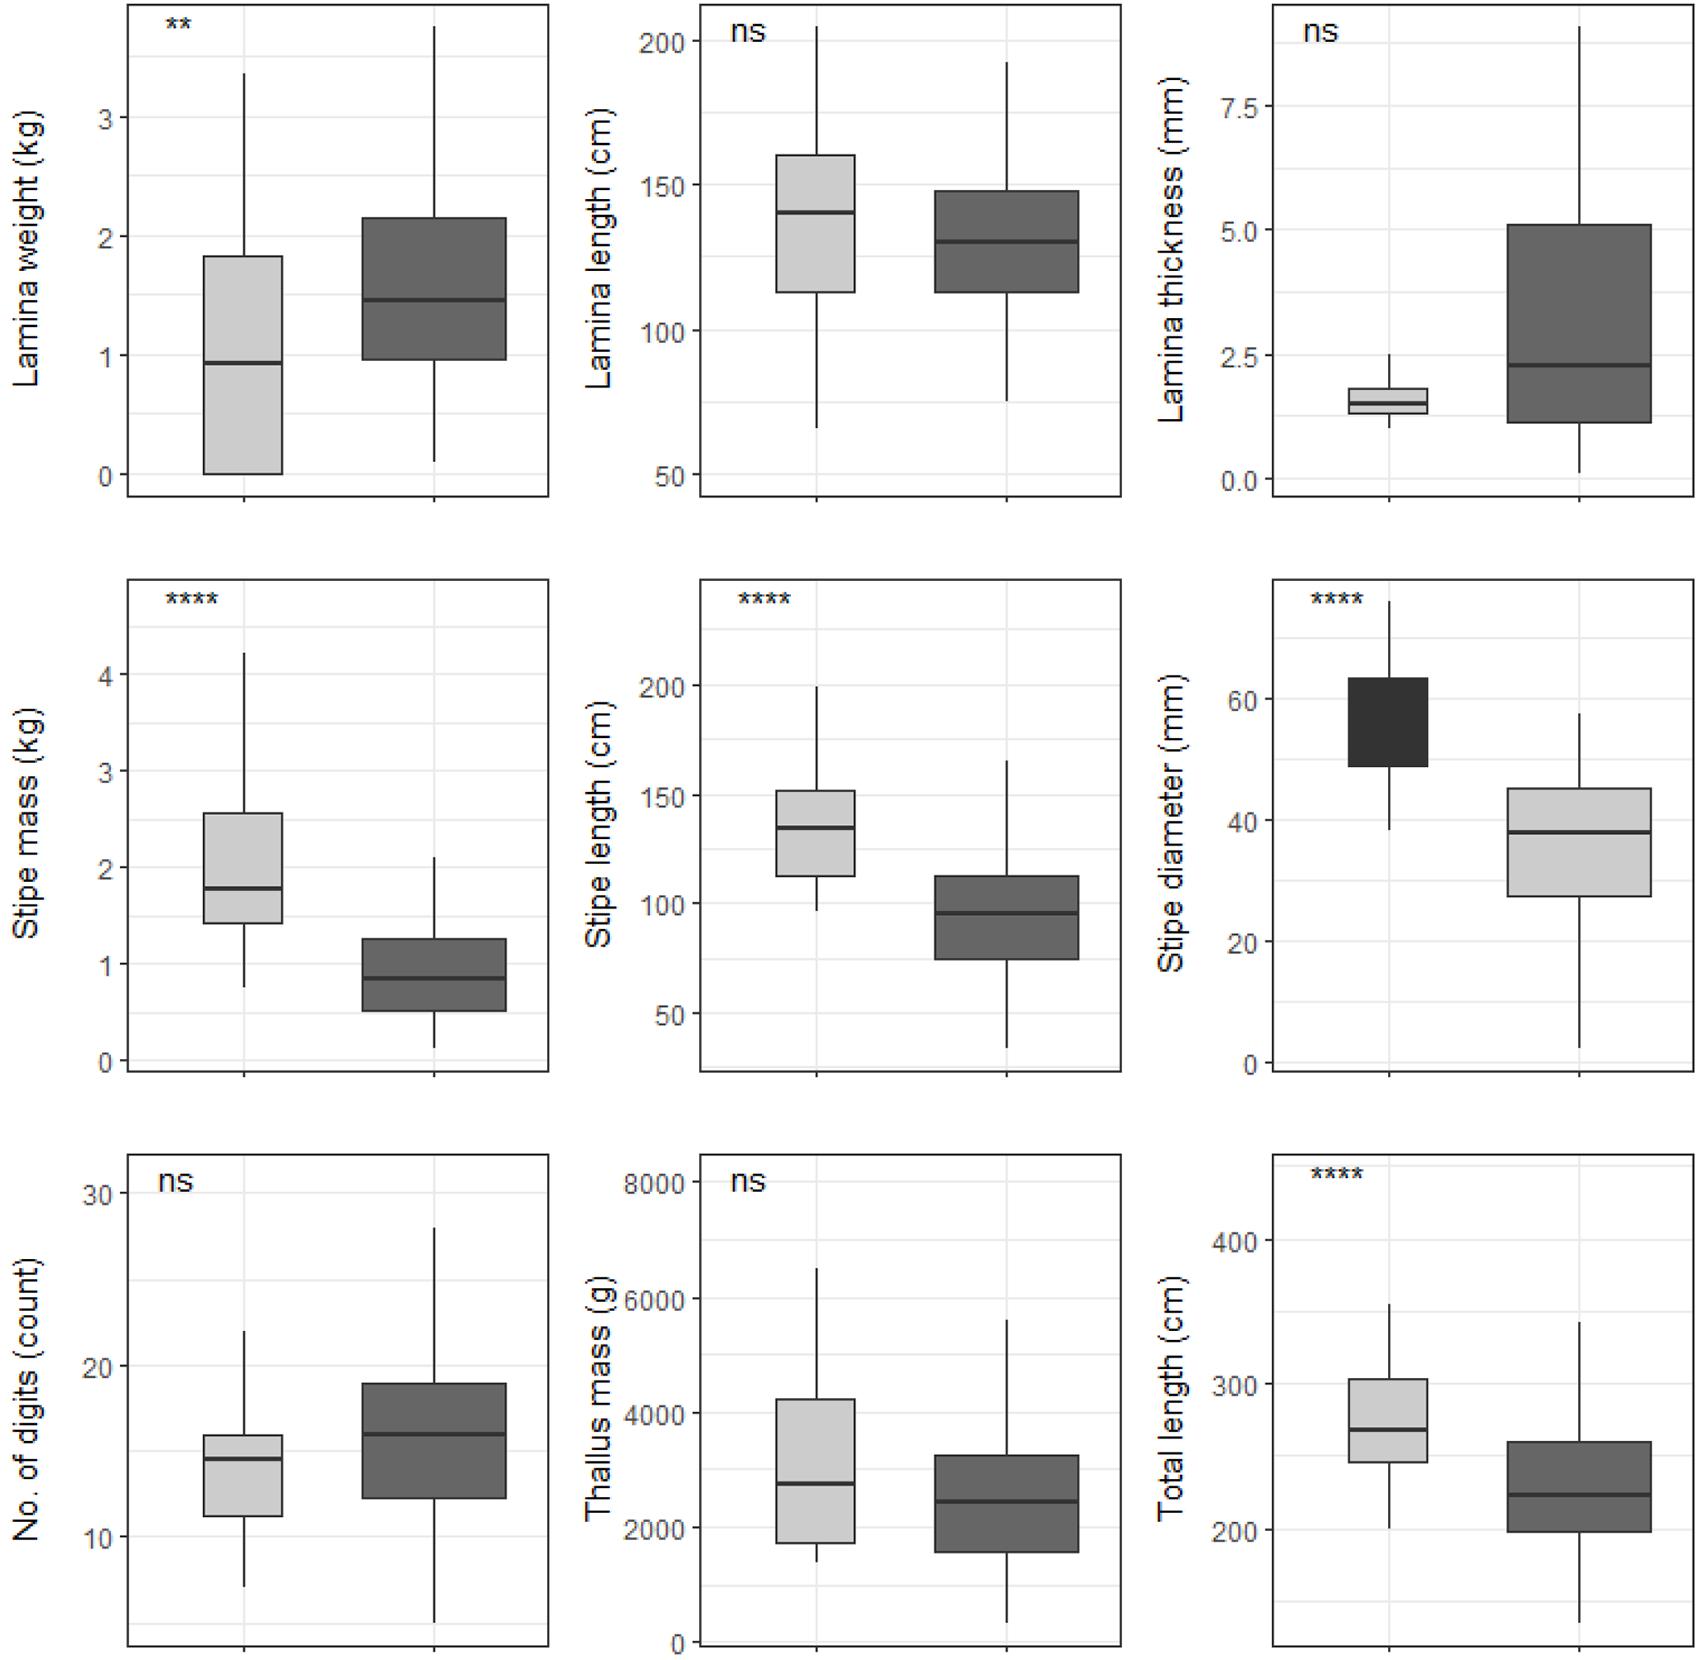
Figure 6. Boxplots representing L. pallida morphological characteristics grouped by temperature regime measured around the Western Cape coastline, with the y-axis depicting the specific morphology measured, with units provided. The lower and upper “hinges” correspond to the first and third quartiles. The whiskers represent the range, solid black lines represent the median and black dots are outliers. Light gray boxes represent cool-temperate and dark gray warm-temperate. Significance levels are as follows: * represents ≤0.05, ** represents ≤0.01, *** represents ≤0.001, **** represents ≤0.0001.
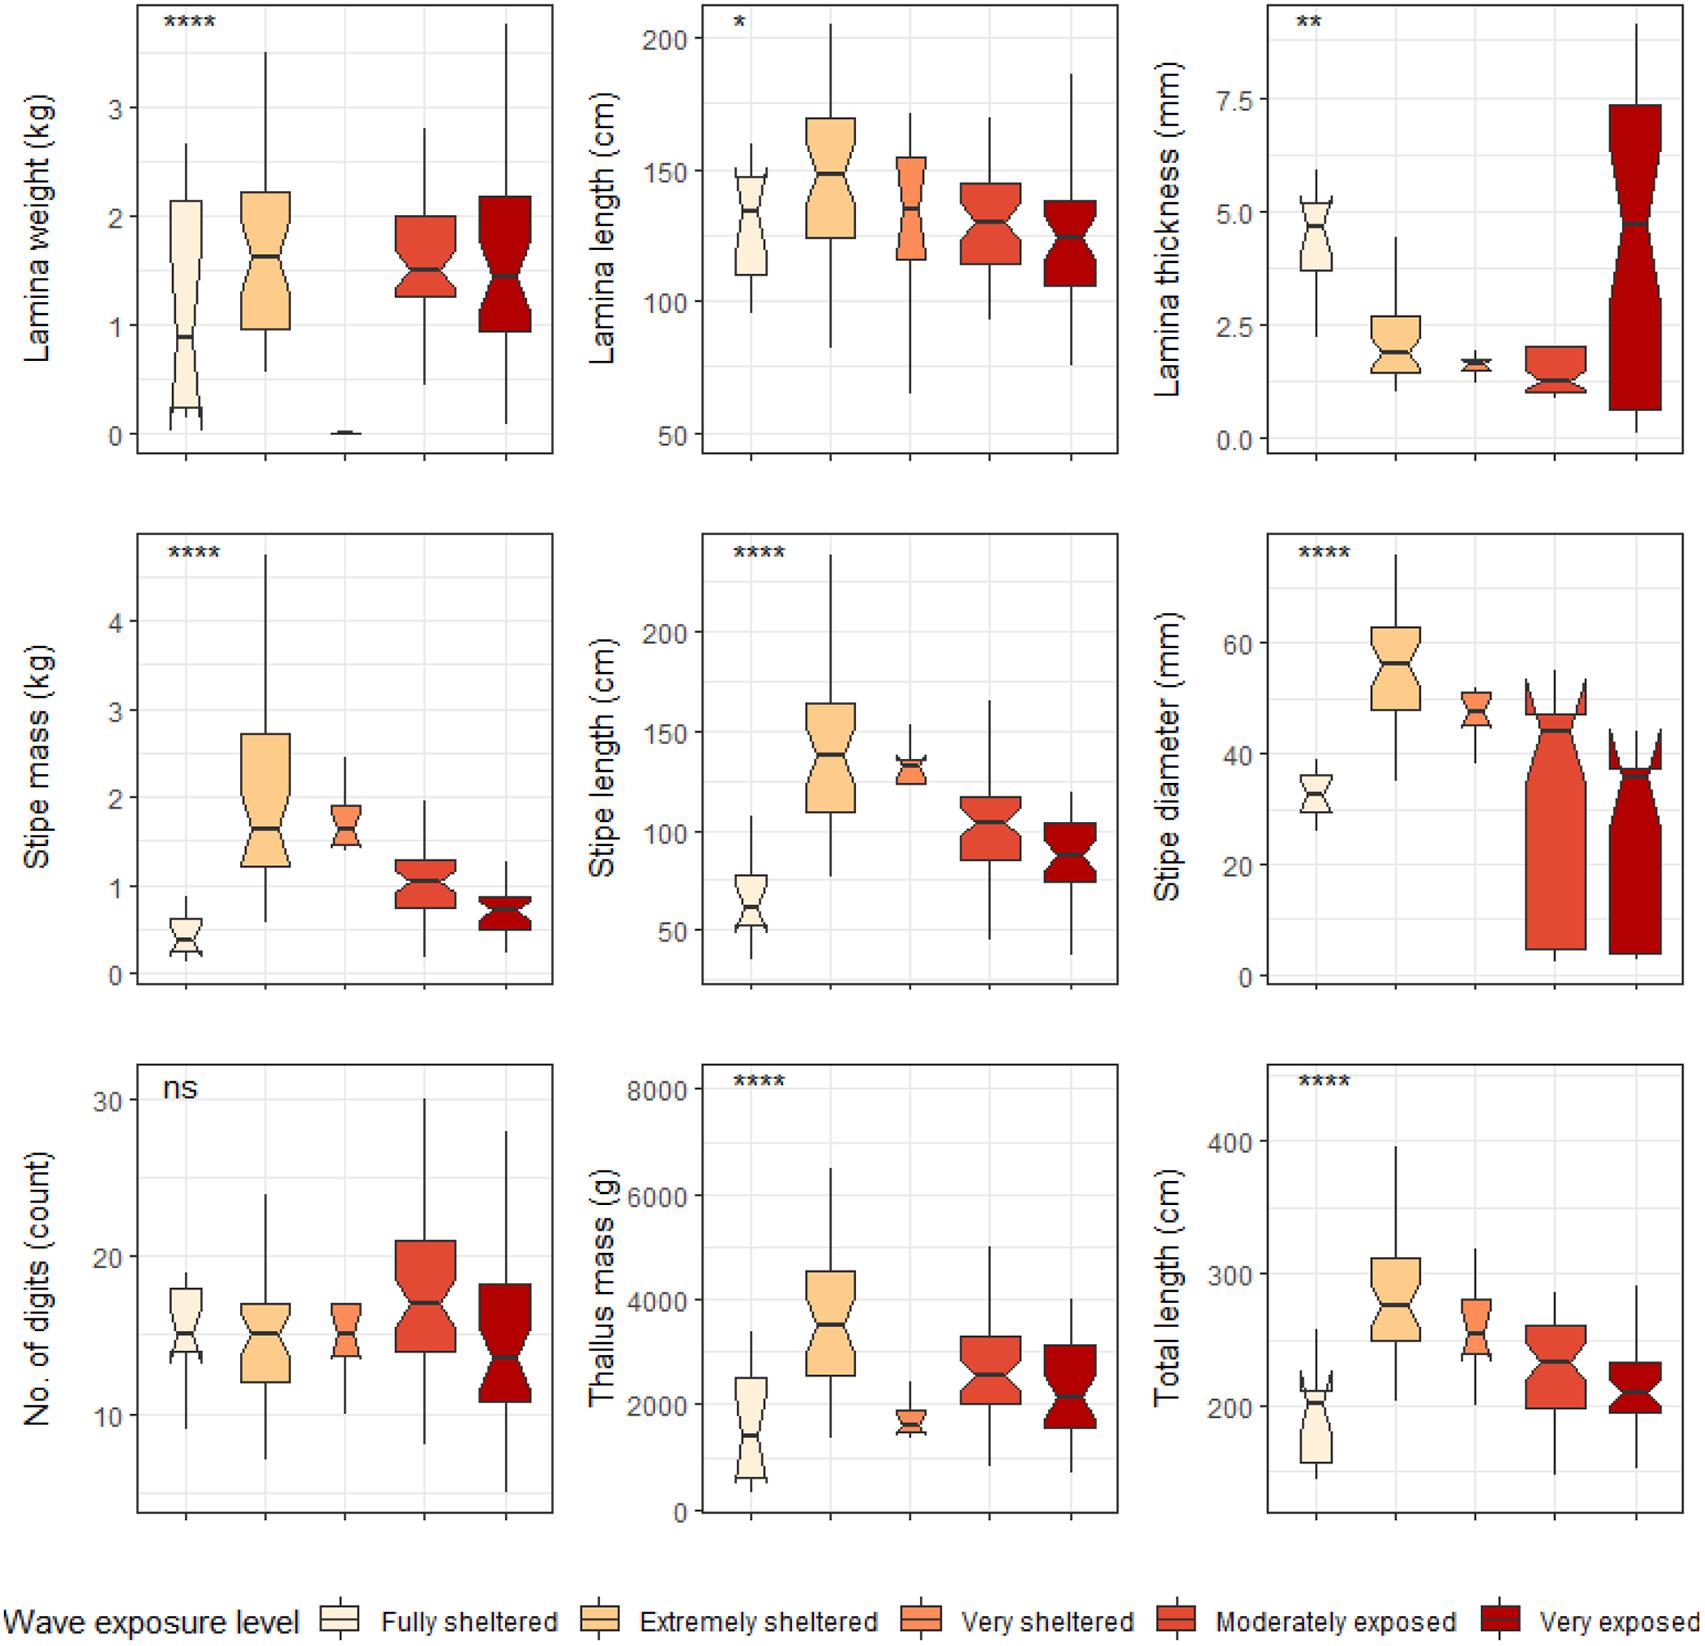
Figure 7. Boxplots representing L. pallida morphological characteristics grouped by wave exposure category measured around the Western Cape coastline, with the y-axis depicting the specific morphology measured, with units provided. The lower and upper hinges correspond to the first and third quartiles. The whiskers represent the range, solid black lines represent the median and black dots are outliers. Significance levels are as follows: * represents ≤0.05, ** represents ≤0.01, *** represents ≤0.001, **** represents ≤0.0001.
Six out of the ten deep E. maxima morphological characteristics showed differences between cool temperate and warm temperate regime except for frond mass, frond length, stipe mass and epiphyte length. Mean values for primary length, primary width and stipe circumference were significantly higher for kelp from the cool temperate regime than for kelp from the warm temperate regime (see Figure 8). The remaining morphological characteristics, stipe length, number of tufts and total length had significantly lower means for kelp from cool temperate compared to kelp from the warm temperate regime (p < 0.05; see Figure 8). Significant differences amongst wave exposure categories were found for all morphological characteristics of deep E. maxima populations (see Figure 9). Certain morphological characteristics showed a gradual increase in mean value with increasing degree of wave exposure. The remaining morphological characteristics exhibited decreased means for only the higher wave exposure categories, followed by a sharp increase in mean value for the highest wave exposure category.
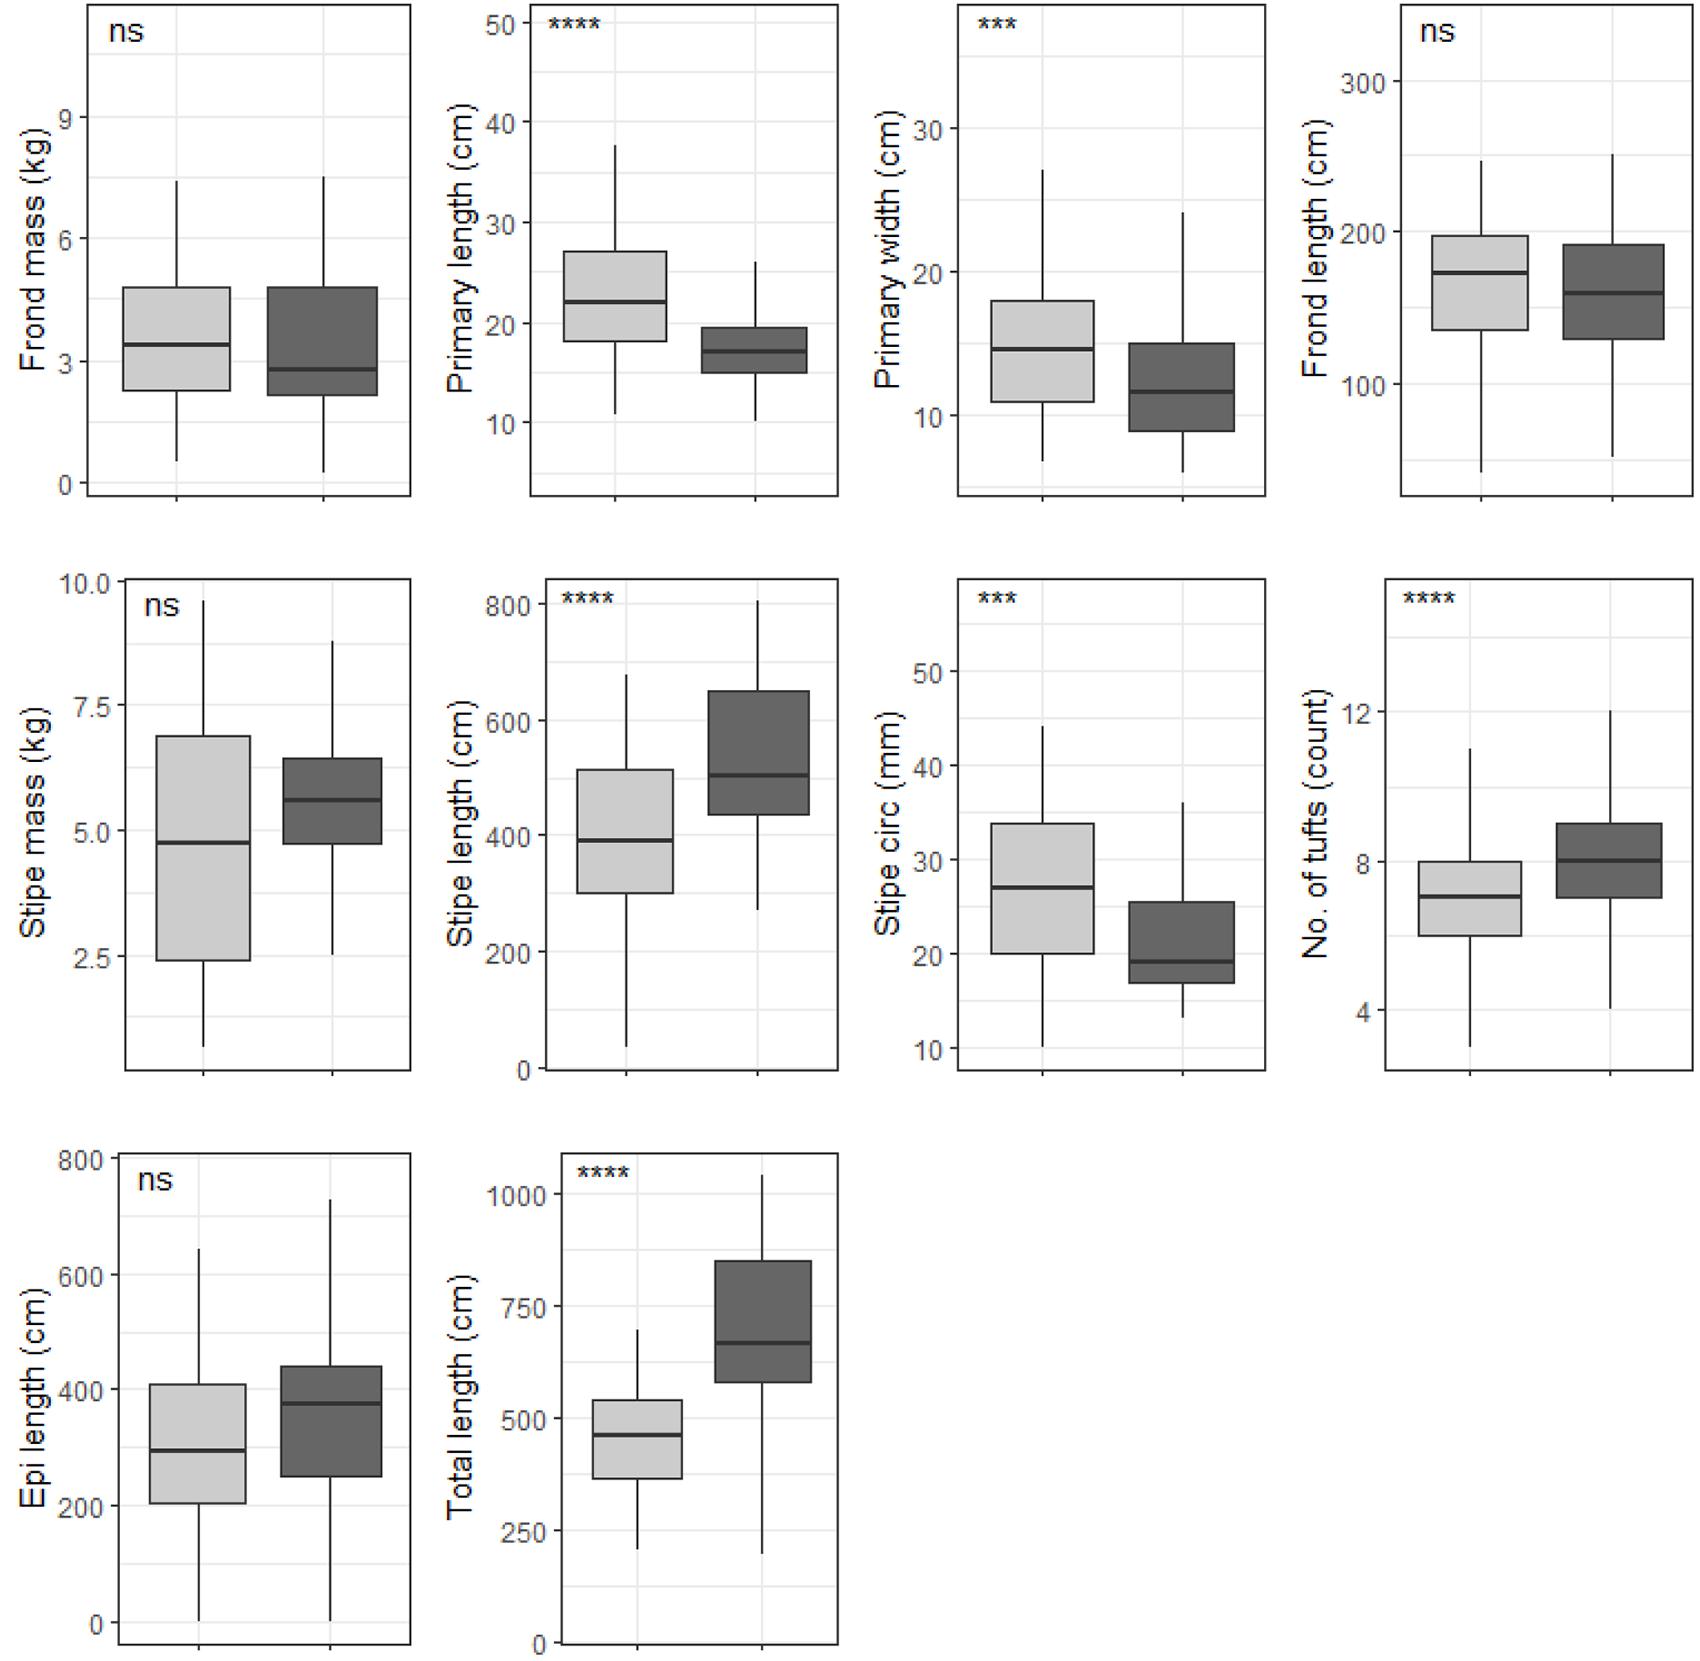
Figure 8. Boxplots representing deep population E. maxima morphological characteristics grouped by temperature regime measured around the Western Cape coastline, with the y-axis depicting the specific morphology measured, with units provided. The lower and upper hinges correspond to the first and third quartiles. The whiskers represent the range, solid black lines represent the median and black dots are outliers. Light gray boxes represent cool-temperate and dark gray warm-temperate. Significance levels are as follows: * represents ≤0.05, ** represents ≤0.01, *** represents ≤0.001, **** represents ≤0.0001.
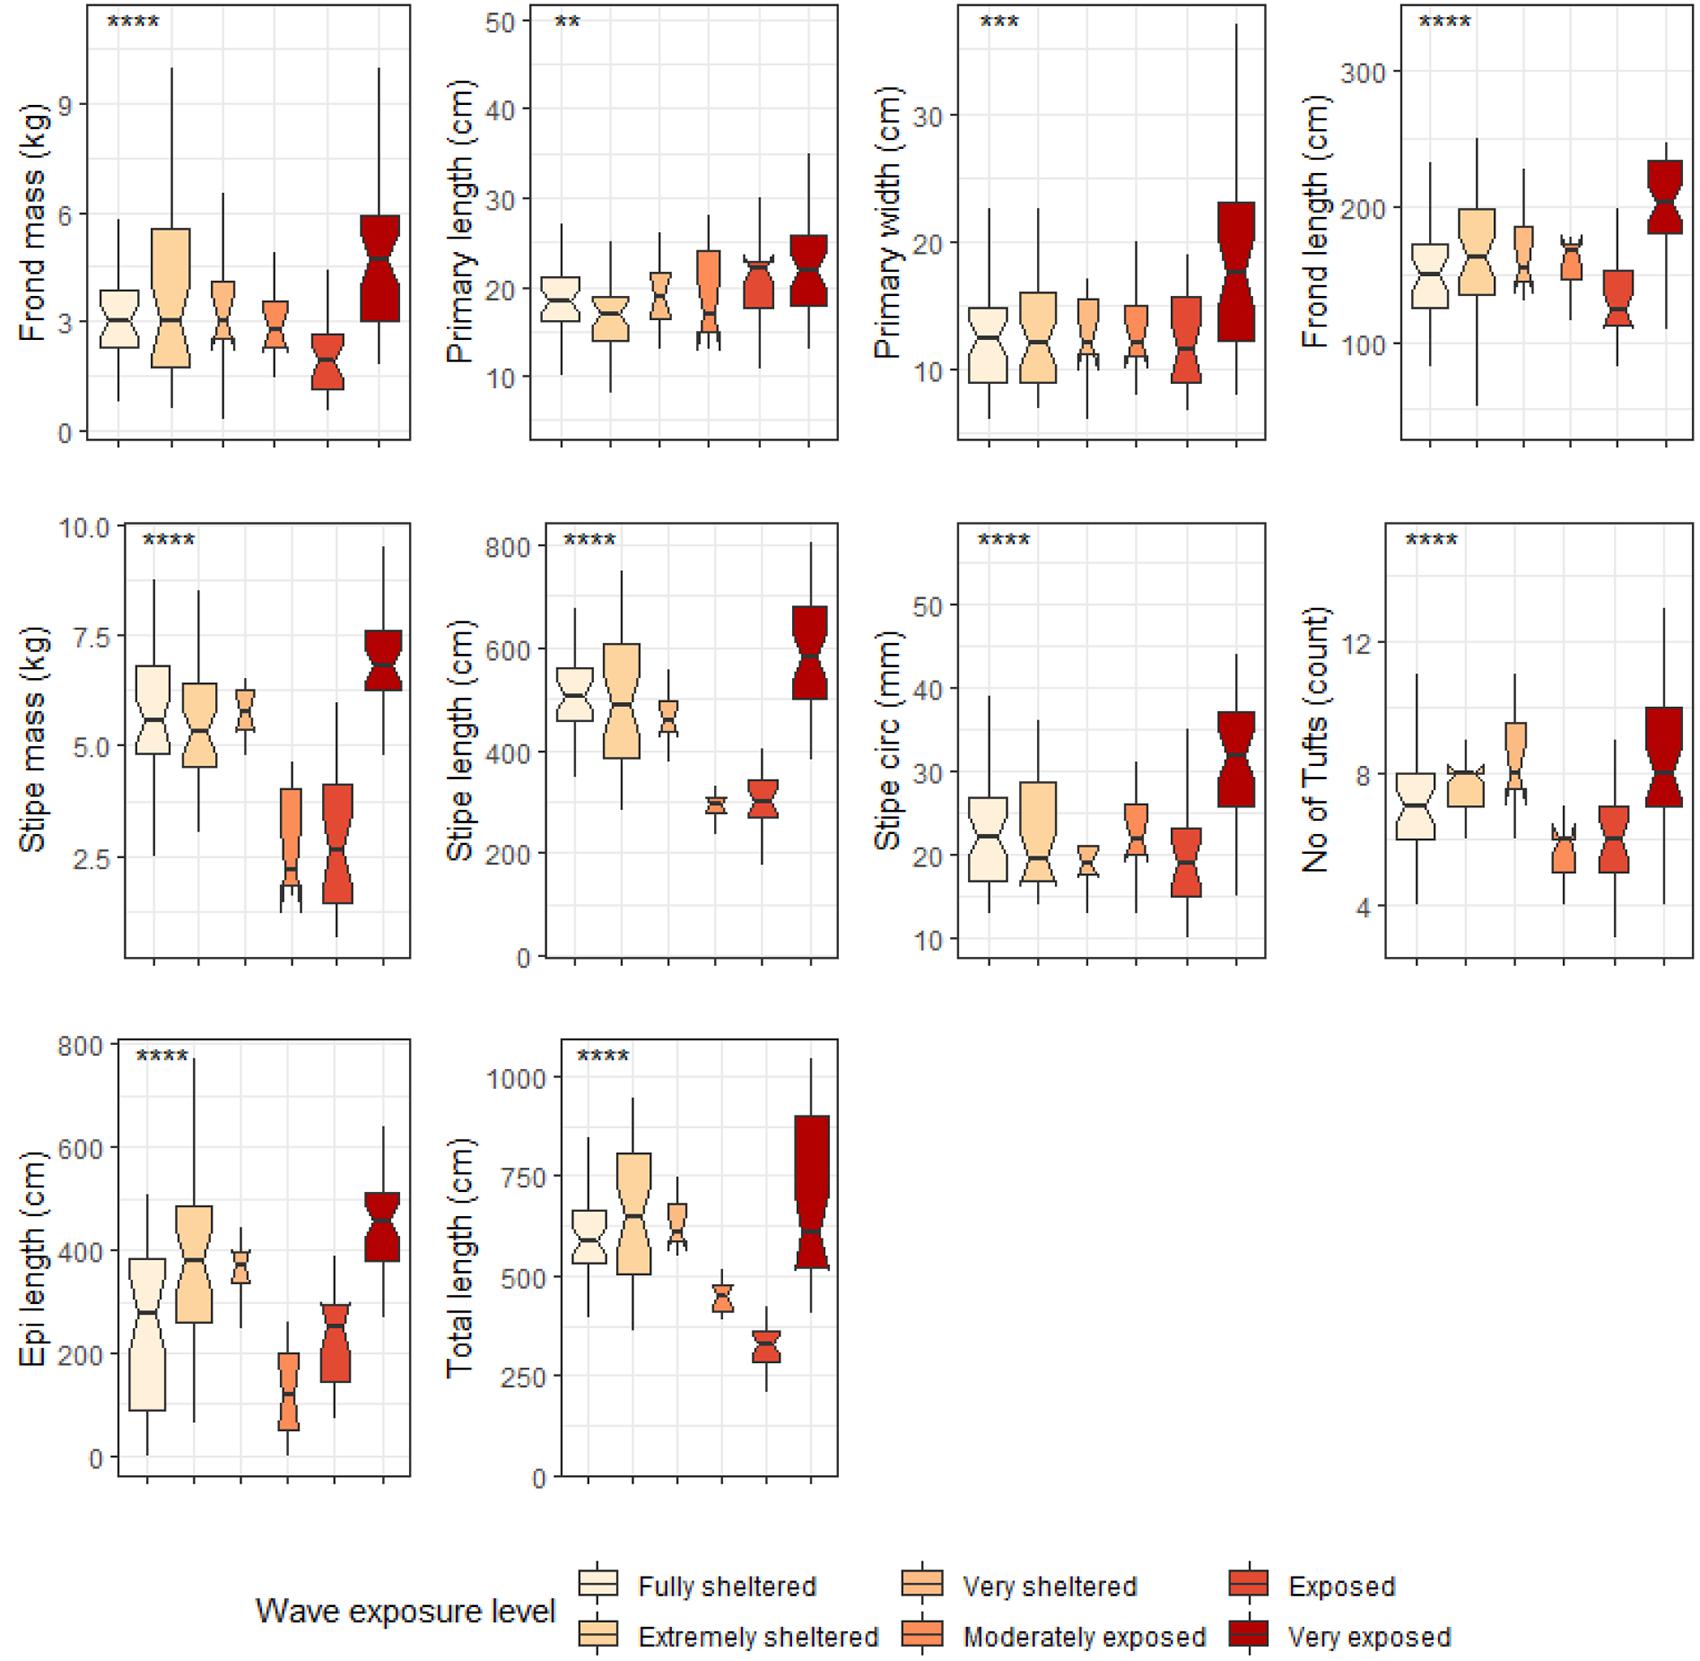
Figure 9. Boxplots representing deep E. maxima morphological characteristics grouped by wave exposure category measured around the Western Cape coastline, with the y-axis depicting the specific morphology measured, with units provided. The lower and upper hinges correspond to the first and third quartiles. The whiskers represent the range, solid black lines represent the median and black dots are outliers. Significance levels are as follows: * represents ≤0.05, ** represents ≤0.01, *** represents ≤0.001, **** represents ≤0.0001.
When grouped by temperature regime, shallow E. maxima exhibited significant differences between temperature regimes for frond mass, primary length, primary width, frond length, stipe mass, stipe length, stipe circumference and total length (p < 0.05; see Figure 10). All of the significantly different morphological characteristics, except primary length, had lower values for the western region compared to the eastern region. When shallow E. maxima were grouped by wave exposure category significant difference were found for all morphological characteristics (p < 0.05; see Figure 11). In general, values of the various morphological characteristics increase for the lower wave exposure categories, followed by a sharp decrease and a gradual increase in value.
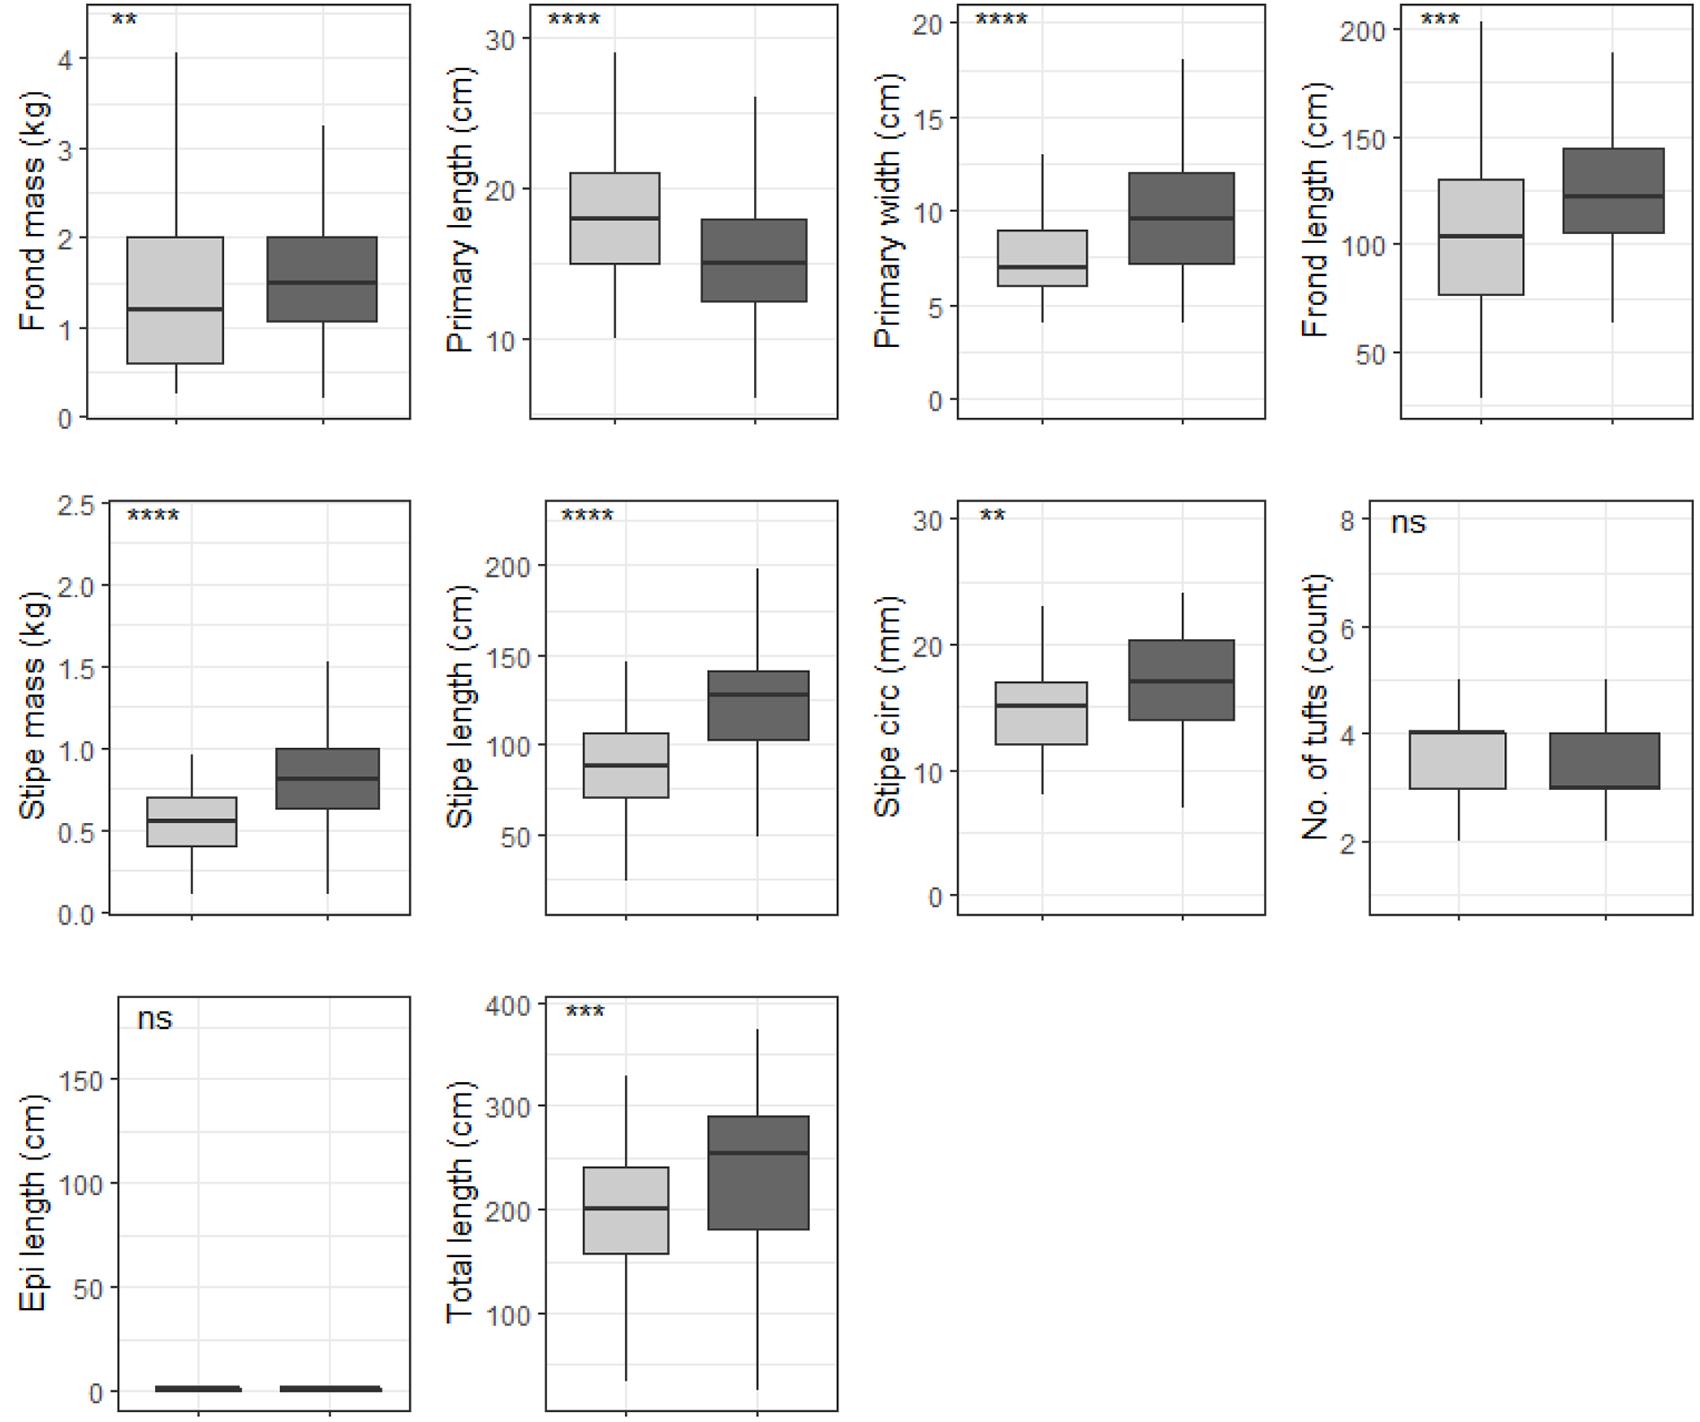
Figure 10. Boxplots representing shallow E. maxima morphological characteristics grouped by temperature regime measured around the Western Cape coastline, with the y-axis depicting the specific morphology measured, with units provided. The lower and upper hinges correspond to the first and third quartiles. The whiskers represent the range, solid black lines represent the median and black dots are outliers. Light gray boxes represent cool-temperate and dark gray warm-temperate. Significance levels are as follows: * represents ≤0.05, ** represents ≤0.01, *** represents ≤0.001, **** represents ≤0.0001.
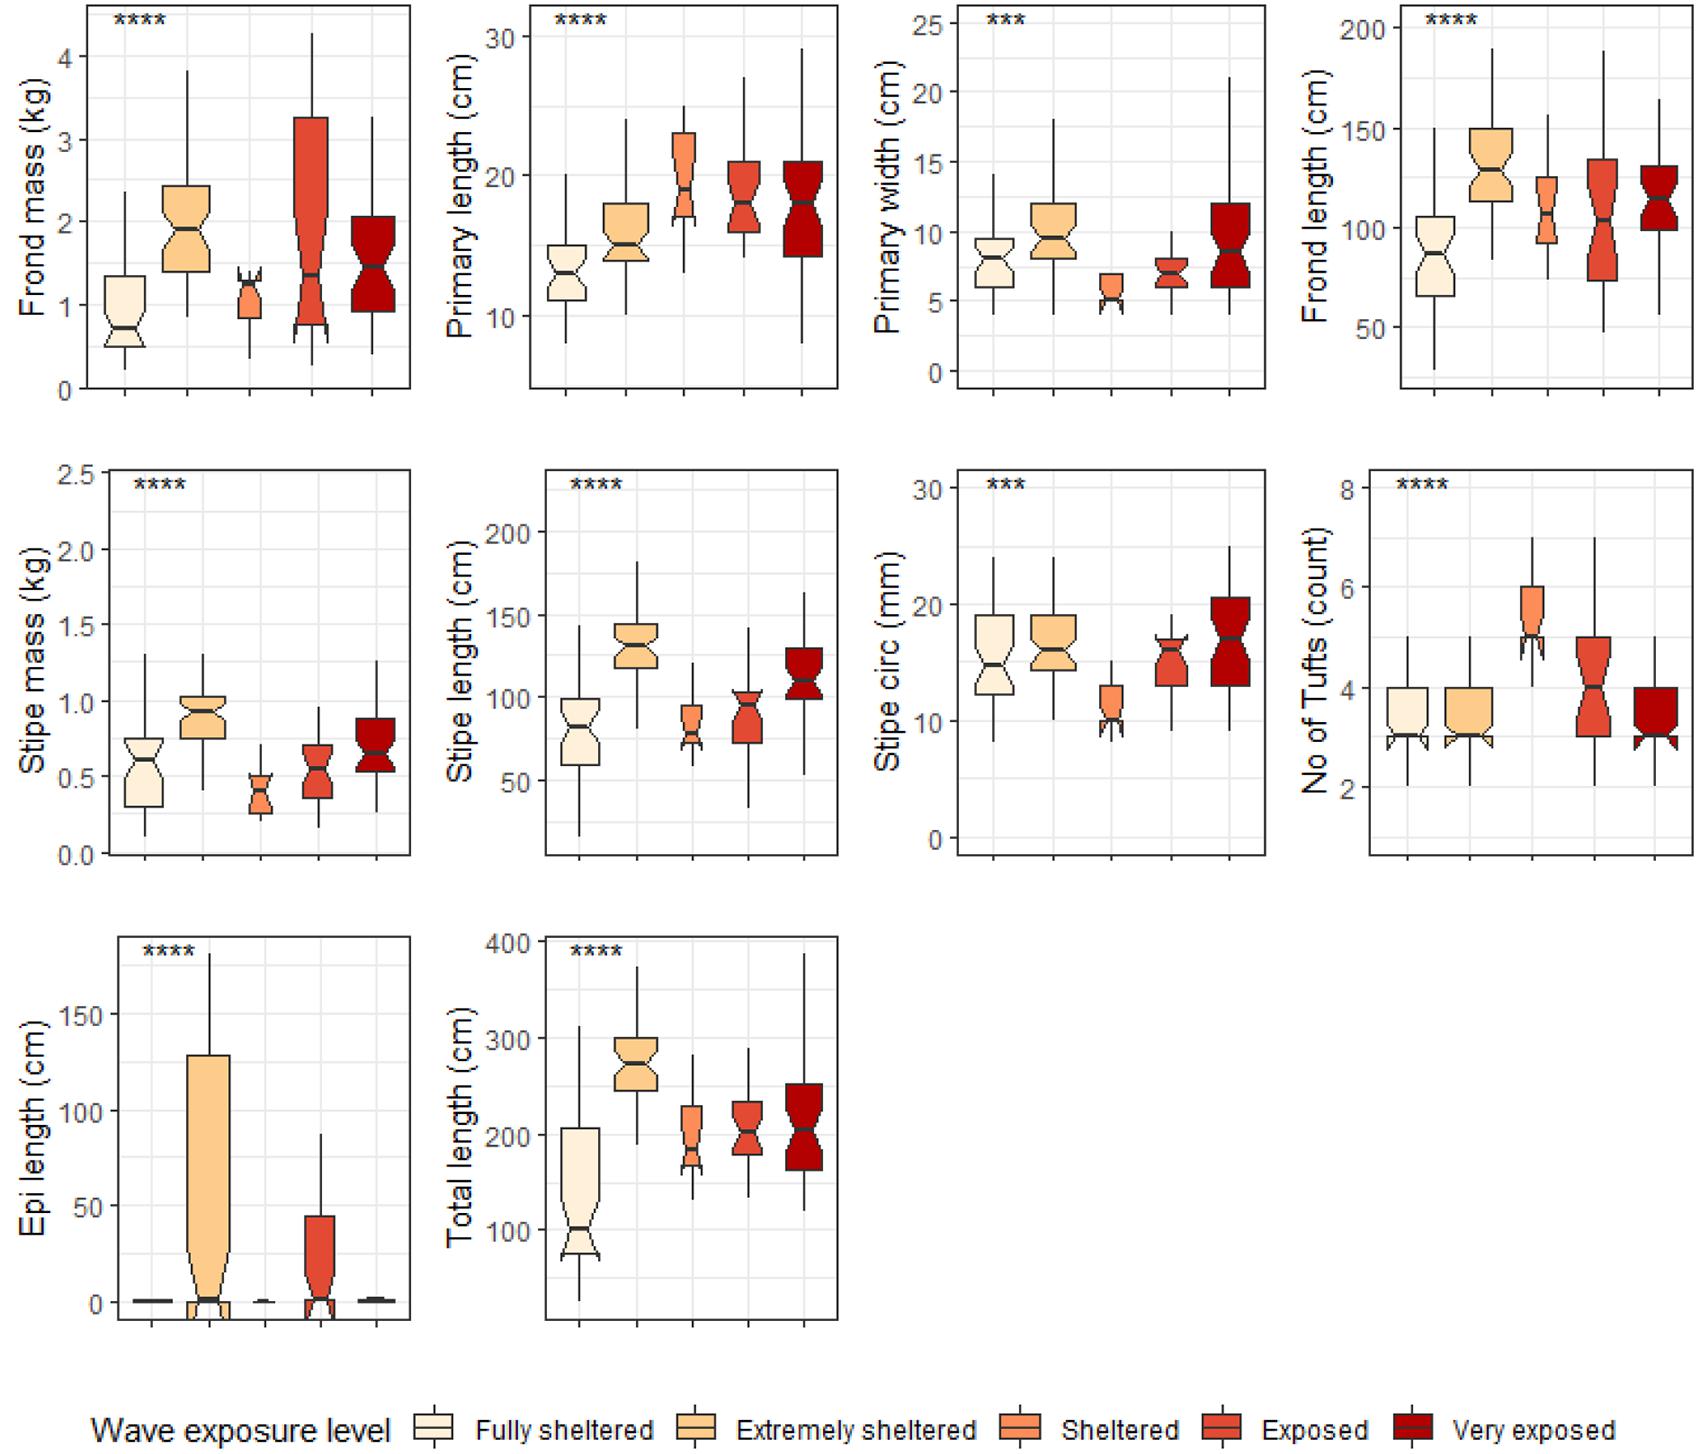
Figure 11. Boxplots representing shallow E. maxima morphological characteristics grouped by wave exposure category measured around the Western Cape coastline, with the y-axis depicting the specific morphology measured, with units provided. The lower and upper hinges correspond to the first and third quartiles. The whiskers represent the range, solid black lines represent the median and black dots are outliers. Significance levels are as follows: * represents ≤0.05, ** represents ≤0.01, *** represents ≤0.001, **** represents ≤0.0001.
Abiotic Drivers of L. pallida Morphological Characteristics
Forward selection, assessment of VIF and an examination of pairwise Pearson correlation coefficients allowed us to retain the most parsimonious descriptors of L. pallida morphological characteristics with an adjusted R2 of 0.49, explaining 72% of the variation (global permutation test on final model: d.f = 1, F = 8.51, p = 0.008; Figure 12A). RDA1 was the only significant axis in the model and explained 48% of the variation while RDA2 was not significant and explained 63% of the variation. Total length, stipe length, stipe diameter and stipe mass were positively influenced (i.e., increased size corresponding with the environmental driver) by mean significant wave height and median swell direction for kelp mostly from the western region and negatively influenced (i.e., decreased size corresponding with the environmental driver) by peak period standard deviation and mean temperature for kelp from the eastern region. Although sites from the western region did not cluster as closely as eastern region study sites, grouping according to region was still evident.
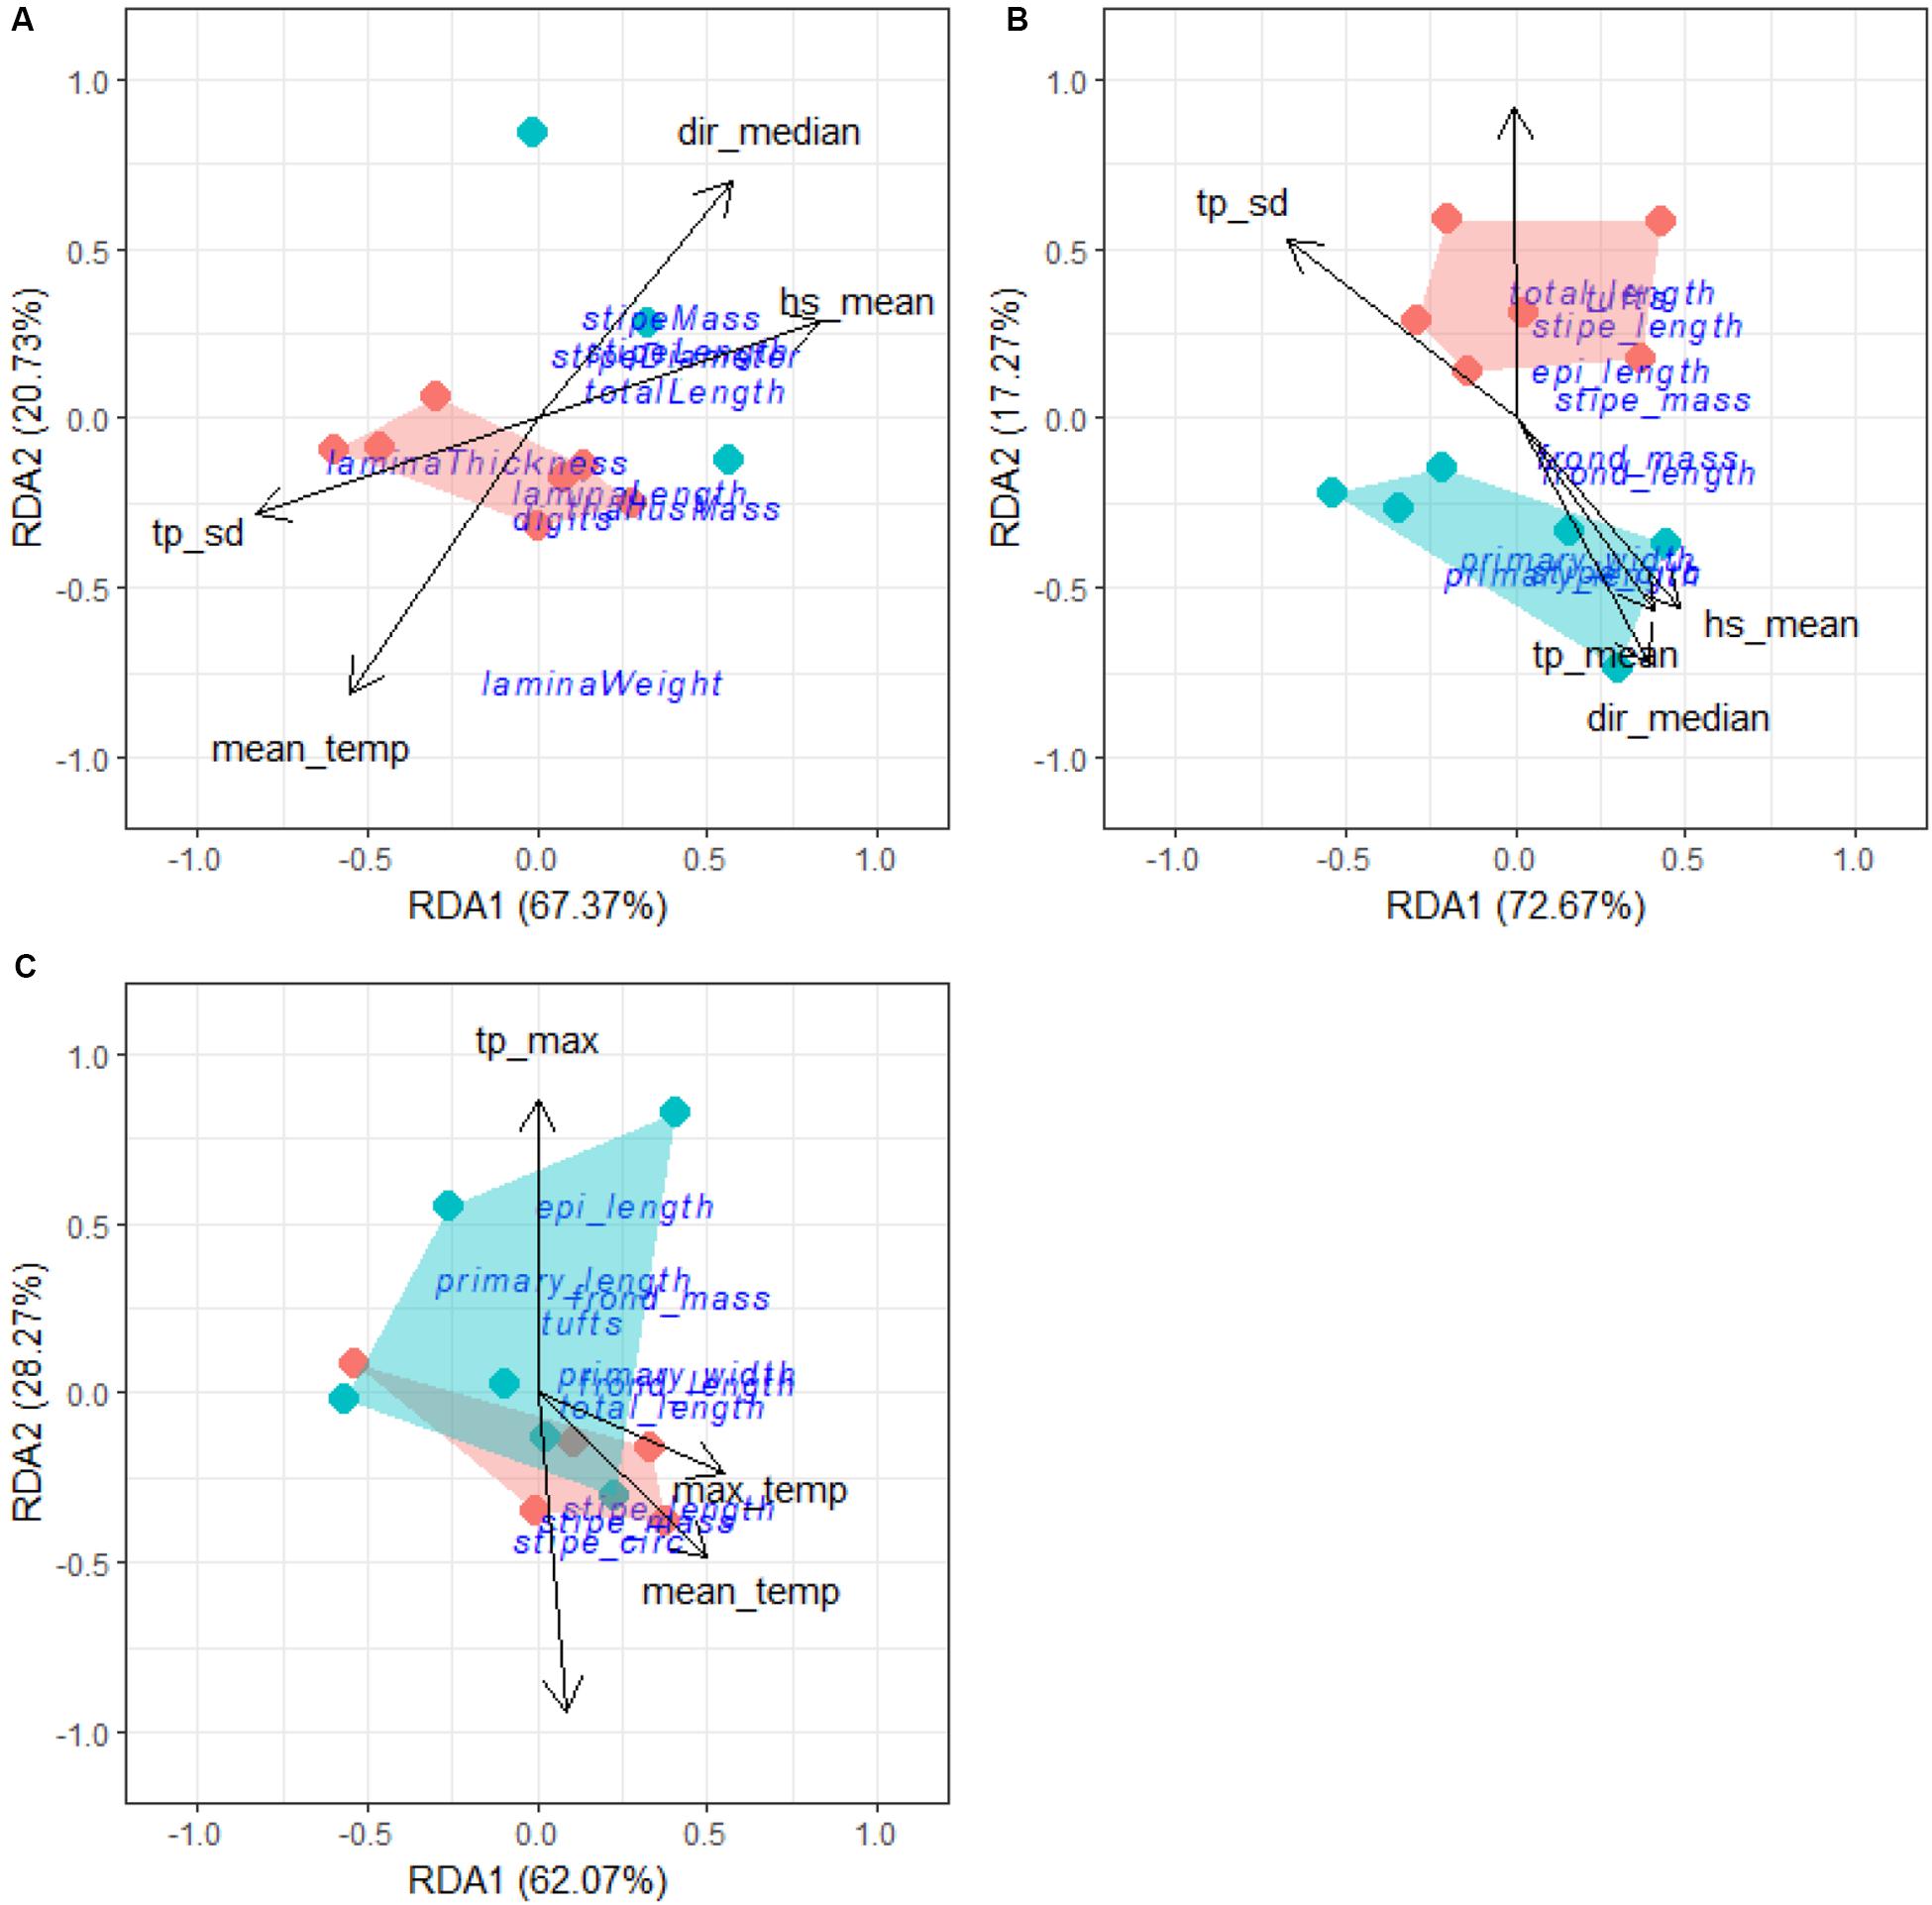
Figure 12. RDA output for L. pallida (A), deep E. maxima (B) and shallow E. maxima (C). The blue cluster represents sites from the western region and the red represents sites from the eastern region.
Abiotic Drivers of E. maxima Morphological Characteristics
The same approaches to identify the descriptors for L. pallida were employed for both populations of E. maxima. Forward selection, assessment of VIF and Pearson correlation coefficients allowed us to retained as the most parsimonious descriptors of deep E. maxima morphological characteristics with an adjusted R2 of 0.39, explaining 67% of the variation (global permutation test on final model: d.f = 5, F = 2.4, p = 0.026; Figure 12B). RDA1 was the only significant axis in the model (p = 0.03) and explained 72% of the variation. Primary length, primary width and stipe circumference were positively influenced by mean significant wave height, mean peak period and median swell direction for kelp from the western region. The remaining morphological characteristics were positively influenced by minimum temperature and negatively influenced by peak period standard deviation for kelp from the eastern region.
Forward selection, assessment of VIF and Pearson correlation coefficients allowed us to retain the most parsimonious descriptors of shallow E. maxima morphological characteristics with an adjusted R2 of 0.36, explaining 61% of the variation (global permutation test on final model: d.f = 4, F = 2.41, p = 0.013, Figure 12C). The model consisted of one significant axis, RDA1 (p = 0.02) and explained 62% of the variation. Stipe length, stipe mass and stipe circumference were positively influenced by maximum temperature and mean temperature along RDA1, and explained 50 and 55% of the variation, respectively. The remaining morphological characteristics were positively influenced by maximum peak period and negatively influenced by median wind direction along RDA2 and explained 86 and 94% of the variation, respectively. There was overlapping of clusters according to region with no clear patterns in sites evident.
Discussion
This study considered important drivers of the morphology of Ecklonia maxima and Laminaria pallida around the Cape Peninsula. These abiotic variables, namely temperature and wave exposure, have been identified in previous research on other brown algae species such as E. radiata and M. pyrifera (Thomsen et al., 2004; Fowler-Walker et al., 2005, 2006; Wernberg and Thomsen, 2005; Wing et al., 2007; Stewart et al., 2009; Miller et al., 2011; Pedersen and Nejrup, 2012). The complex geomorphology of the Western Cape coastline creates an ideal natural laboratory for studies of kelps in interaction with their environment. Unlike previous research, this study used a complex numerical model to provide the various variables of wave exposure, which is based on linear wave theory to calculate overall wave exposure. We also considered wind in addition to temperature and wave variables, since wind is an important component of wind-driven surface gravity waves (Holthuijsen, 2010). The results show that specific variables of wave exposure are the main drivers of kelp morphology with temperature playing only a minor role. The morphological adaptation was also shown to be associated with the magnitude of wave exposure which had only been inferred in previous studies. Finally, the investigation of differences in morphological characteristics between shallow and deep populations of E. maxima suggests that in low wave exposure environments the role of temperature as a morphological driver increases; this is particularly the case for False Bay.
There were clear patterns and clines in both the temperature and wave exposure data. The thermal and wave exposure regimes around the Cape Peninsula are driven by a complex interaction between wind, temperature and wave metrics, which do not act independently but instead influence one another. The hydrodynamic regime is modulated by the relative sheltering against the predominant south-westerly swell direction and the size of the fetch for local wave generation. The direction of the dominant swell changes to the south west in winter, generated by strong low pressures that originate from the southern ocean (Reason et al., 2006), which False Bay is sheltered from Shipley (1964), Atkins (1970), Dufois and Rouault (2012). In summer, these swells rotate anticlockwise and are able to enter False Bay, providing an increased variability of swell height and peak period in this region. It should be noted that what is classified as sheltered around the South African coastline (a high energy coastline) might be classified as exposed in other regions of the world (Leliaert et al., 2000; Norderhaug et al., 2012). It is due to the near consistent south-westerly swell and the complex orography around the peninsula that the wave energy distribution around the Cape Peninsula varies significantly over a small geographical area. The directional sheltering effect of the Cape Peninsula, against the dominant swell direction is clearly observed in the wave exposure maps. It should be mentioned that some of the annual winter frontal depression systems pass the Cape Peninsula from the west to east, resulting in wave propagating toward the continent from much more southerly directions. This results in positive and negative wave exposure anomalies all around the peninsula. Increased wind speed at sites along the west side of the peninsula in a southerly direction trigger upwelling events along the western side of the peninsula (Field et al., 1980; Rouault et al., 2010). In general, the western side of the peninsula is more exposed than the eastern side (False Bay) and experiences significantly higher mean significant swell height and mean significant peak period. This was also reflected in the wave exposure categories which show a trend of decreasing wave exposure (wave power) around the peninsula and into False Bay. There are also differences between the types of waves that each side of the peninsula experiences. We provide strong support that variations in the environmental variables, particularly wave exposure variables, are driving kelp morphological characteristics around the Cape Peninsula. Morphological adaptation due to water motion may manifest in a number of ways in high wave energy environments. For instance, reduction of blade thickness, blade elongation, increase of stipe length, increase in stipe circumference and force of attachment (Friedland and Denny, 1995; Denny et al., 1997; Denny and Gaylord, 2002; Wernberg and Thomsen, 2005; Fowler-Walker et al., 2006; Bekkby et al., 2014) have been identified in previous studies. Although this study did not measure force of attachment, other morphological responses to temperature and wave variables were evident. Species-specific responses are evident in both wave exposure and temperature. In cool temperate environments L. pallida tended to show increases in certain morphological characteristics (stipe mass, stipe length and stipe diameter) while in the warm-temperate environments these were significantly lower. This was also true for deep E. maxima populations, which had longer, thinner stipes for kelp from the warm temperate compared to kelp from the cool temperate. Reduction in certain morphological characteristics has been attributed to temperature by Serisawa et al. (2002) in the kelp E. cava, which was smaller and shorter in warmer sites compared to cooler sites. The reduction in size of adult may be a response to low nutrient conditions, which has been shown to reduce growth rate and overall morphology (Simonson et al., 2015). Warmer temperatures are associated with low nutrient concentrations (Waldron and Probyn, 1992) and the low frequency of upwelling conditions in False Bay (low nutrient supply) coupled with warmer temperatures may be a contributing factor. It should be noted, however, that from these analyses that in general the cool temperate region is more exposed to waves than that of the warm-temperate region. Therefore, the significantly larger morphological characteristics for kelp from the cool temperate region may overlap with responses to wave exposure. The response of kelp morphological characteristics to wave exposure was evident and both species exhibit tactics based on the magnitude of wave exposure. Strength increasing traits were exhibited for lower exposure levels while a “go-with-the-flow” tactic for moderate levels of wave exposure. This suggests that how morphological characteristics manifest themselves is dependent on the magnitude of wave exposure. When grouped by wave exposure category, L. pallida characteristics showed a significant increase in length for the “extremely sheltered” category compared to the fully sheltered category, which may be a “go-with-the-flow” tactic (Denny et al., 1997; Hurd, 2000; Denny and Gaylord, 2002). Kelp are able to increase flexibility by increasing stipe length which increases the extension capabilities of kelp to a passing wave (Hurd, 2000; Denny and Gaylord, 2002). However, increasing stipe length is only beneficial under lower exposure levels as a long stipe actually increases overall drag on the plant under high wave exposure (Denny et al., 1997; Denny and Gaylord, 2002). This is reflected in the L. pallida morphology which shows an overall reduction of morphological characteristics suggesting a size reducing tactic to cope with higher levels of wave exposure. The results suggest that deep E. maxima populations exhibit a different response, as well as a higher wave exposure threshold. Unlike L. pallida, E. maxima exhibits a size reducing tactic with increasing wave exposure by decreasing stipe mass, stipe length, stipe circumference, total length and frond length. A magnitude related response has been suggested by Wernberg and Vanderklift (2010) who investigated the temporal and spatial variations of various environmental drivers of the kelp E. radiata. The authors identified wave exposure as the most important driver of kelp morphological characteristics and that the type of response elicited is dependent on the magnitude of wave exposure.
A size reduction tactic has been shown before (Hurd, 2000; Denny and Gaylord, 2002; Fowler-Walker et al., 2005, 2006) and is regarded as a strategy to reduce overall drag on the plant. However, E. maxima morphological characteristics changed significantly as wave exposure increases. When grouped to the higher wave exposure levels, E. maxima morphology exhibited a strength and flexibility increasing trait. Furthermore, the morphological response of E. maxima to wave exposure only occurs at the “Moderately exposed” level compared to L. pallida which exhibits a response at a lower wave exposure level. This suggests that E. maxima can tolerate higher exposure levels before having to exhibit a morphological response. The redundancy analysis performed confirms the patterns and responses observed as well as identifying specific temperature and wave variables as drivers of kelp morphology. Kelp morphology characteristics are largely wave driven for both species but differ in terms of specific temperature and wave metrics.
The wave metrics identified in this study are important components of determining overall wave power, which will vary seasonally in the region based on the swell direction. The differences in temperature metrics between E. maxima and L. pallida point to underlying differences in nutrient availability. Low temperatures are often associated with upwelling events which bring cool, nutrient rich water into the nearshore. False Bay has comparatively little upwelling events compared to the western side of the peninsula, and so nutrients may be a limiting factor for E. maxima populations within False Bay, hence the identification of minimum temperature as a influencer. Mean temperature identified as a driver for L. pallida may be related to diurnal temperature fluctuations in the water column. Solar heating of the water surface in combination with wind-driven transport causes fluctuations within the water column, which can occur daily or seasonally (Kaplan et al., 2003). Vertical mixing of the water column for inshore regions are driven by several abiotic processes: (1) turbulence of breaking waves inside or outside of the surf zone; (2) convective mixing through a combination of cooling and evaporation; (3) wind driven currents; and (4) tidal mixing (Smit et al., 2013). These abiotic processes cause effective vertical mixing of surface and deeper water stratification which leads to a homogeneous thermal environment, which in this study may be interpreted as the mean temperature. Therefore, the homogeneous thermal regime of inshore regions may be a reason why mean temperature is driver of L. pallida morphological characteristics. The difference in canopy type between the species may be the reason why E. maxima is driven by multiple wave metrics compared to L. pallida. Since E. maxima are a canopy-kelp, it is exposed to all components of a wave compared to L. pallida which occurs deeper in the water column.
Although temperature plays an important role in distribution (Bolton, 2010; Miller et al., 2011; Rinde et al., 2014) of kelp and physiological functioning of adults and gametophytes (Gerard, 1997; Steneck et al., 2002; Bearham et al., 2013; Mohring et al., 2014; Smale and Moore, 2017), there is little evidence in this study that temperature is an important driver of morphological variation. However, we suggest that temperature plays a larger role in determining kelp morphology at sites where wave energy is low enough not to elicit a response in morphological characteristics. Temperature metrics influence stipe length and frond length in shallow E. maxima individuals located at sites within False Bay; which was not the case for deeper E. maxima individuals as well as L. pallida which were largely driven by wave variables. The shallow E. maxima individuals may not experience the same amount of wave energy as do deeper populations. This may be due to wave dampening from deeper populations of E. maxima, which attenuate the wave energy entering coastal environments (Jackson, 1984; Kobayashi et al., 1993; Mork, 1996). The morphological variations in characteristics for deep E. maxima populations are not seen for shallow E. maxima populations. The lack of variation in shallow E. maxima populations was also found in previous research by Rothman et al. (2017) who identified light as a significant driver. This influence of light may suggest photosynthetic ability and nutrient uptake as important drivers in shallow environments. Wave exposure may be reduced in shallow environments due to the wave damping effect of deep kelp and seaweed populations (Jackson, 1984; Kobayashi et al., 1993; Mork, 1996) thereby reducing the need to adapt morphological characteristics to reduce drag. Furthermore, the reduction in differences between deep and shallow E. maxima at wave exposed sites on the western of the peninsula compared to sites in False Bay provides further evidence that wave exposure may not be an important driver of shallow E. maxima populations in this study. Increased temperatures corresponded with a reduction in stipe circumference, frond length, stipe length, total length and stipe mass resulting in slim or “skinny” kelp individuals, which supports findings from previous research by Mabin et al. (2013), Serisawa et al. (2002). These findings were confirmed by the redundancy analysis which showed the contribution of wave variables as a driver of kelp morphological characteristics was lower compared to temperature variables. The sites do cluster by region but almost overlap entirely; further indicating wave variables are not the main driver. Although wave variables were not identified as an important driver, it is important to note the wave variables identified in the RDA differ to deep E. maxima. The identification of median wind direction suggests that surface gravity waves as a driver compared to swell waves identified for L. pallida and E. maxima.
Kelps living in warmer environments have been shown to have a lower resilience to disturbance, such as storms (Wernberg et al., 2010). The kelps in False Bay may therefore be more vulnerable to dislodgment under high wave exposure scenarios compared to kelps on the western side of the Cape Peninsula, which experiences higher wave energy on a regular basis. In South Africa, the main contributing factors to the hydrodynamic environment are the Southern Annular Node (SAM) and El Niño Southern Oscillation (ENSO), while the latter is also the main source of variability (Veitch et al., 2019). These climate systems are expected to alter storm frequency and magnitude under future climate scenarios, which may increase the overall wave power around the Cape Peninsula. The magnitude-specific response of the kelp species to wave exposure in this study suggests there is a limit to morphological adaptation in reducing the probability of dislodgement. Therefore, if this limit is reached and exceeded in future climate scenarios, kelp populations may risk being reduced over time. Furthermore, although recent studies suggest a cooling trend of coastal waters around South Africa (Rouault et al., 2010; Smit et al., 2013), the impact of marine heat waves may reduce the resilience of kelps to storms and high wave energy. Although this study identifies specific wave and temperature metrics that drive morphological adaptation and suggests a possible wave exposure threshold, it does not identify the metrics or magnitude of wave exposure required to dislodge kelp. Therefore, future studies should consider using advanced numerical methods to investigate the specific wave power needed to dislodge kelp, and ideally, given a specific set of morphological measures. These types of studies in conjunction with forecasting studies can be used to determine the vulnerability of kelp populations to future climate scenarios.
Conclusion
Past research shows that macroalgal morphological characteristics are largely driven by a wave exposure while others have suggested a complex interaction between various environmental variables. We confirm that wave variables are the main driver of kelp morphological characteristics in both E. maxima and L. pallida populations around the Cape Peninsula, and differences in morphological characteristics between shallow and deep populations of E. maxima may reflect differences in hydrodynamic and temperature regimes. This study also confirms the findings of previous research which shows morphological adaptation is dependent on the magnitude of wave exposure, but also provides quantitative, reproducible measure of wave exposure while identifying the specific wave metrics and wave energy thresholds involved. Furthermore, the current study highlights the need to understand how kelp populations, which are not exposed to high wave energy and morphological characteristics are largely driven by temperature, are vulnerable to changes in storm frequency and magnitude. Kelp populations located in low wave energy environments, such as False Bay, may be more vulnerable to increased storm frequency and magnitude in future climate scenarios.
Data Availability Statement
The datasets generated for this study are available on request to the corresponding author.
Author Contributions
RC conceptualized the scope of the research reported in this manuscript, collected samples, undertook the majority of numerical and statistical analyses, made the first round of interpretation, and did the majority of the writing. AS and CR provided the guidance in terms of writing, statistical analyses, and overall presentation of the manuscript. All authors contributed to the article and approved the submitted version.
Funding
This research was funded by the South African National Research Foundation (http://www.nrf.ac.za). Funding number is CSRP170430229220. Aside from funding provided, the funders had no role in the study design, data collection and analysis, decision to publish, or preparation of the manuscript.
Conflict of Interest
CR was employed by the company MetOcean Solutions Ltd.
The remaining authors declare that the research was conducted in the absence of any commercial or financial relationships that could be construed as a potential conflict of interest.
Acknowledgments
We thank A. J Smit and Christo Rautenbach for their guidance on this project. We also thank Robert Schlegel and Robert Williamson for their help coordinating the honors class of 2014–2015, in particular Jesse Smith, Janine Greuel, Tevya Lotriet, and Rudy Philander. The work would have not been possible without the dataset from the CSIR report 2014 where the processed data is available at the following DOIs: 10.15493/DEFF.10000004 and 10.15493/DEFF.10000003. Finally, we thank the South African Coastal Temperature Network (SACTN) for access the temperature data used in this study.
Supplementary Material
The Supplementary Material for this article can be found online at: https://www.frontiersin.org/articles/10.3389/fmars.2020.00567/full#supplementary-material
Footnotes
References
Anderson, R. J., Carrick, P., Levitt, G. J., and Share, A. (1997). Holdfasts of Adult Kelp Ecklonia Maxima provide refuges from grazing for recruitment of juvenile kelps. Mar. Ecol. Progr. Ser. 159, 265–273. doi: 10.3354/meps159265
Andrews, W. R. H., and Hutchings, L. (1980). Upwelling in the Southern Benguela Current. Progr. Oceanogr. 9, 1–81. doi: 10.1016/0079-6611(80)90015-4
Atkins, G. R. (1970). Winds and current patterns in False Bay. Trans. R. Soc. S. Afr. 39, 139–148. doi: 10.1080/00359197009519109
Bearham, D., Vanderklift, M. A., and Gunson, J. R. (2013). Temperature and light explain spatial variation in growth and productivity of the Kelp Ecklonia radiata. Mar. Ecol. Progr. Ser. 476, 59–70. doi: 10.3354/meps10148
Bekkby, T., Rinde, E., Gundersen, H., Norderhaug, K. M., Gitmark, J. K., and Christie, H. (2014). Length, strength and water flow: relative importance of wave and current exposure on morphology in Kelp Hyperborea. Mar. Ecol. Progr. Ser. 506, 61–70. doi: 10.3354/meps10778
Blanke, B., Roy, C., Penven, P., Speich, S., McWilliams, J., and Nelson, G. (2002). Linking Wind and Interannual Upwelling Variability in a Regional Model of the Southern Benguela. Geophys. Res. Lett. 29:41. doi: 10.1029/2002gl015718
Bolton, J. J. (2010). The biogeography of kelps (Laminariales, Phaeophyceae): a global analysis with new insights from recent advances in molecular phylogenetics. Helgoland Mar. Res. 64, 263–279. doi: 10.1007/s10152-010-0211-6
Booij, N., Holthuijsen, L. H., and Ris, R. C. (1997). “The “SWAN” wave model for shallow water,” in Proceedings of the 25th International Conference on Coastal Engineering1996, Orlando, FL, 668–676.
Byrnes, J. E., Reed, D. C., Cardinale, B. J., Cavanaugh, K. C., Holbrook, S. J., and Schmitt, R. J. (2011). Climate-Driven Increases in Storm Frequency Simplify Kelp Forest Food Webs. Glob. Change Biol. 17, 2513–2524. doi: 10.1111/j.1365-2486.2011.02409.x
Cavanaugh, K. C., Siegel, D. A., Reed, D. C., and Dennison, P. E. (2011). Environmental Controls of Giant-kelp Biomass in the Santa Barbara Channel, California. Mar. Ecol. Progr. Ser. 429, 1–17. doi: 10.3354/meps09141
Cousens, R. (1982). The Effect of Exposure to Wave Action on the Morphology and Pigmentation of Ascophyllum nodosum (L.) Le Jolis in South-Eastern Canada. Bontanica Mar. 25, 191–195.
Cram, D. L. (1970). A suggested origin for the cold surface water in central False Bay. Trans. R. Soc. S. Afr. 39, 129–137. doi: 10.1080/00359197009519108
Dayton, P. K. (1985). Ecology of Kelp Communities. Ann. Rev. Ecol. Syst. 16, 215–245. doi: 10.1146/annurev.es.16.110185.001243
Dayton, P. K., Tegner, M. J., Edwards, P. B., and Riser, K. L. (1998). Sliding baselines, ghosts, and reduced expectations in kelp forest communities. Ecol. Appl. 8, 309–322. doi: 10.1890/1051-0761(1998)008[0309:sbgare]2.0.co;2
Dellatorre, F. G., Pisoni, J. P., Barón, P. J., and Rivas, A. L. (2012). Tide and Wind Forced Nearshore Dynamics in Nuevo Gulf (Northern Patagonia, Argentina): potential implications for cross-shore transport. J. Mar. Syst. 96, 82–89. doi: 10.1016/j.jmarsys.2012.02.004
Denny, M., and Gaylord, B. (2002). The Mechanics of Wave-swept Algae. J. Exp. Biol. 205(Pt 10), 1355–1362.
Denny, M., Gaylord, B., and Cowen, E. (1997). Flow and Flexibility: II. The Roles of sSize and Shape in Determining Wave Forces on the Bull Kelp Nereocystis luetkeana. J. Exp. Biol. 200, 3165–3183.
Dufois, F., and Rouault, M. (2012). Sea Surface Temperature in False Bay (South Africa): towards a better understanding of its seasonal and inter-annual variability. Continental Shelf Res. 43, 24–35. doi: 10.1016/j.csr.2012.04.009
Dunne, R., and Brown, B. (2001). The Influence of Solar Radiation on Bleaching of Shallow Water Reef Corals in the Andaman Sea, 1993–1998. Coral Reefs 20, 201–210.
Dyer, D. C. (2018). “Stable Isotope Ecology of South African Kelp Forests.” Ed J. Bolton, R. Anderson, and A. J. Smit, Ph.D. thesis, University of Cape Town.
Field, J. G., Griffiths, C. L., Linley, E. A., Carter, R. A., and Zoutendyk, P. (1980). Upwelling in a Nearshore Marine Ecosystem and its Biological Implications. Estuar. Coast. Mar. Sci. 11, 133–150. doi: 10.1016/S0302-3524(80)80037-5
Fowler-Walker, M. J., Connell, S. D., and Gillanders, B. M. (2005). To What Extent do Geographic and Associated Environmental Variables correlate with Kelp Morphology Across Temperate Australia? Mar. Freshw. Res. 56, 877–887. doi: 10.1071/MF05042
Fowler-Walker, M. J., Wernberg, T., and Connell, S. D. (2006). Differences in kelp morphology between wave sheltered and exposed localities: morphologically plastic or fixed traits? Mar. Biol. 148, 755–767. doi: 10.1007/s00227-005-0125-z
Friedland, M. T., and Denny, M. W. (1995). Surviving Hydrodynamic Forces in a Wave-swept Environment: consequences of Morphology in the Feather Boa Kelp, Egregia menziesii (Turner). J. Exp. Biol. 190, 109–133. doi: 10.1016/0022-0981(95)00038-s
Gaines, S. D., and Roughgarden, J. (1987). Fish in offshore kelp forests affect recruitment to intertidal barnacle populations. Science 235, 479–481. doi: 10.1126/science.235.4787.479
Gao, X., Endo, H., Taniguchi, K., and Agatsuma, Y. (2013). Combined Effects of Seawater Temperature and Nutrient Condition on Growth and Survival of Juvenile Sporophytes of the Kelp Undaria Pinnatifida (Laminariales; Phaeophyta) Cultivated in Northern Honshu, Japan. J. Appl. Phycol. 25, 269–275. doi: 10.1007/s10811-012-9861-x
Gerard, V. A. (1997). The Role of Nitrogen Nutrition in High-Temperature Tolerance of the Kelp, Laminaria Saccharina (Chlorophyta). J. Phycol. 33, 800–810. doi: 10.1111/j.0022-3646.1997.00800.x
Gill, A. E., and Clarke, A. J. (1974). Wind-induced Upwelling, Coastal Currents and Sea-level Changes. Deep Sea Res. Oceanogr. Abstr. 21, 325–345. doi: 10.1016/0011-7471(74)90038-2
Gorman, D., Bajjouk, T., Populus, J., Vasquez, M., and Ehrhold, A. (2013). Modeling Kelp Forest Distribution and Biomass along Temperate Rocky Coastlines. Mar. Biol. 160, 309–325. doi: 10.1007/s00227-012-2089-0
Graham, M. H. (2004). Effects of Local Deforestation on the Diversity and Structure of Southern California Giant Kelp Forest Food Webs. Ecosystems 7, 341–357.
Guiry, M. D., and Guiry, G. M. (2019). AlgaeBase: World-Wide Electronic Publication. Galway: National University of Ireland.
Harley, C., Anderson, K. M., Demes, K. W., Jorve, J. P., Kordas, R. L., Coyle, T., et al. (2012). EFfects of Climate Change on Global Seaweed Communities. J. Phycol. 48, 1064–1078. doi: 10.1111/j.1529-8817.2012.01224.x
Holthuijsen, L. H. (2010). Waves in Oceanic and Coastal Waters. Cambridge: Cambridge University Press.
Hurd, C. L. (2000). Water motion, marine macroalgal physiology, and production. J. Phycol. 36, 453–472. doi: 10.1046/j.1529-8817.2000.99139.x
Jackson, G. A. (1984). Internal wave attenuation by coastal kelp stands. J. Phys. Oceanogr. 14, 1300–1306. doi: 10.1175/1520-04851984014<1300:IWABCK<2.0.CO;2
Jury, M. R. (1980). Characteristics of summer wind fields and air-sea interactions over the Cape Peninsula upwelling region (Doctoral dissertation, University of Cape Town).
Jury, M. R., Kamstra, F., and Taunton-Clark, J. (1985). Synoptic summer wind cycles and upwelling off the southern portion of the cape peninsula. S. Afr. J. Mar. Sci. 3, 33–42. doi: 10.2989/025776185784461090
Kaplan, D. M., Largier, J. L., Navarrete, S., Guiñez, R., and Castilla, J. C. (2003). Large diurnal temperature fluctuations in the nearshore water column. Estuar. Coast. Shelf Sci. 57, 385–398. doi: 10.1016/s0272-7714(02)00363-3
Kobayashi, N., Raichle, A. W., and Asano, T. (1993). Wave attenuation by vegetation. J. Waterway Port Coast. Ocean Eng. 119, 30–48.
Krumhansl, K. A., and Scheibling, R. E. (2012). Production and fate of kelp detritus. Mar. Ecol. Progr. Ser. 467, 281–302. doi: 10.3354/meps09940
Leliaert, F., Anderson, R. J., Bolton, J., and Coppejans, E. (2000). Subtidal Understorey Algal Community Structure in Kelp Beds around the Cape Peninsula (Western Cape, South Africa). Bot. Mar. 43, 359–366. doi: 10.1515/BOT.2000.036
Levin, P. S. (1994). Fine-scale temporal variation in recruitment of a temperate demersal fish: the importance of settlement versus post-settlement loss. Oecologia 97, 124–133. doi: 10.1007/bf00317916
Ma, G., Kirby, J. T., Su, S.-F., Figlus, J., and Shi, F. (2013). Numerical study of turbulence and wave damping induced by vegetation canopies. Coast. Eng. 80, 68–78. doi: 10.1016/j.coastaleng.2013.05.007
Mabin, C. J. T., Gribben, P. E., and Fischer, A. (2013). Variation in the morphology, reproduction and development of the habitat-forming kelp Ecklonia radiata with changing temperature and nutrients. Mar. Ecol. Progr. 483, 117–131. doi: 10.3354/meps10261
Mann, K. H. (1973). Seaweeds: their productivity and strategy for growth. Science 182, 975–981. doi: 10.1126/science.182.4116.975
Miller, S. M., Hurd, C. L., and Wing, S. R. (2011). Variations in Growth, Erosion, Productivity, and Morphology of Ecklonia Radiata (Alariaceae; Laminariales) Along a Fjord in Southern New Zealand. J. Phycol. 47, 505–516. doi: 10.1111/j.1529-8817.2011.00966.x
Mohring, M. B., Wernberg, T., Wright, J. T., Connell, S. D., and Russell, B. D. (2014). Biogeographic variation in temperature drives performance of kelp gametophytes during warming. Mar. Ecol. Progr. Ser. 513, 85–96. doi: 10.3354/meps10916
Molloy, F. J., and Bolton, J. J. (1996). The effects of wave exposure and depth on the morphology of inshore populations of the namibian kelp, Laminaria schinzii Foslie. Bot. Mar. 39, 525–531.
Mork, M. (1996). The effect of kelp in wave damping. Sarsia 80, 323–327. doi: 10.1080/00364827.1996.10413607
Norderhaug, K. M., Christie, H., Andersen, G. S., and Bekkby, T. (2012). Does the Diversity of Kelp Forest Macrofauna Increase with Wave Exposure? J. Sea Res. 69, 36–42. doi: 10.1016/j.seares.2012.01.004
Oksanen, J., Blanchet, F. G., Kindt, R., Legendre, P., Minchin, P. R., O’hara, R. B., et al. (2015). Package ‘Vegan’.” Community Ecology Package, Version 2 (9).
Paul, A. X., and Steneck, R. (1993). Kelp beds as habitat for american lobster Homarus americanus. Mar. Ecol. Progr. Ser. 100:127. doi: 10.3354/meps100127
Pedersen, M. F., and Nejrup, L. B. (2012). Effects of wave exposure on population structure, demography, biomass and productivity of the Kelp Laminaria hyperborea. Mar. Ecol. Progr. Ser. 451, 45–60. doi: 10.3354/meps09594
Rautenbach, C. (2015). “Southern African coastal vulnerability assessment,” in Proceedings of the 5th CSIR conference Southern African Coastal Vulnerability Assessment, ed. CSIR (Anusandhan Bhawan: CSIR).
Reason, C. J. C., Landman, W., and Tennant, W. (2006). Seasonal to Decadal Prediction of Southern African Climate and Its Links with Variability of the Atlantic Ocean. Bull. Am. Meteorol. Soc. 87, 941–956. doi: 10.1175/bams-87-7-941
Reguero, B. G. I, Losada, J., and Méndez, F. J. (2019). A recent increase in global wave power as a consequence of oceanic warming. Nat. Commun. 10:205.
R Core Team (2014). R: A Language and Environment for Statistical Computing. Vienna: R Foundation for Statistical Computing. Available online at: http://www.R-project.org/
RStudio Team (2020). RStudio: Integrated Development for R. RStudio Boston, MA: PBC. Available online at: http://www.rstudio.com/
Rinde, E., Christie, H., Fagerli, C. W., Bekkby, T., Gundersen, H., Norderhaug, K. M., et al. (2014). The Influence of Physical Factors on Kelp and Sea Urchin Distribution in Previously and Still Grazed Areas in the NE Atlantic. PLoS One 9:e222. doi: 10.1371/journal.pone.0100222
Rose, T. H., Smale, D. A., and Botting, G. (2012). The 2011 Marine Heat Wave in Cockburn Sound, Southwest Australia. Ocean Sci. 8, 545–550. doi: 10.5194/os-8-545-2012
Rothman, M. D., Bolton, J. J., Stekoll, M. S., Boothroyd, C. J. T., Kemp, F. A., and Anderson, R. J. (2017). Geographical Variation in Morphology of the Two Dominant Kelp Species, Ecklonia maxima and Laminaria pallida (Phaeophyceae, Laminariales), on the West Coast of Southern Africa. J. Appl. Phycol. 29, 2627–2639. doi: 10.1007/s10811-017-1255-7
Rouault, M., Pohl, B., and Penven, P. (2010). Coastal Oceanic Climate Change and Variability from 1982 to 2009 around South Africa. Afr. J. Mar. Sci. 32, 237–246. doi: 10.2989/1814232x.2010.501563
Rummukainen, M. (2012). Changes in Climate and Weather Extremes in the 21st Century. Wiley Interdiscipl. Rev. 3, 115–129. doi: 10.1002/wcc.160
Russo, S., Dosio, A., Graversen, R. G., Sillmann, J., Carrao, H., Dunbar, M. B., et al. (2014). Magnitude of Extreme Heat Waves in Present Climate and Their Projection in a Warming World. J. Geophys. Res. 119, 12–500.
Serisawa, Y., Akino, H., Matsuyama, K., Ohno, M., Tanaka, J., and Yokohama, Y. (2002). Morphometric Study of Ecklonia cava (Laminariales, Phaeophyta) sporophytes in two localities with different temperature conditions. Phycol. Res. 50, 193–199. doi: 10.1111/j.1440-1835.2002.tb00151.x
Seymour, R. J., Tegner, M. J., Dayton, P. K., and Parnell, P. E. (1989). Storm Wave Induced Mortality of Giant Kelp, Macrocystis Pyrifera, in Southern California. Estuar. Coast. Shelf Sci. 28, 277–292. doi: 10.1016/0272-7714(89)90018-8
Simonson, E. J., Scheibling, R. E., and Metaxas, A. (2015). Kelp in Hot Water: I. warming seawater temperature induces weakening and loss of kelp tissue. Mar. Ecol. Progr. Ser. 537, 89–104. doi: 10.3354/meps11438
Smale, D. A., and Moore, P. J. (2017). Variability in kelp forest structure along a latitudinal gradient in ocean temperature. J. Exp. Mar. Biol. Ecol. 486, 255–264. doi: 10.1016/j.jembe.2016.10.023
Smit, A. J., Bolton, J. J., and Anderson, R. J. (2017). Seaweeds in two oceans: beta-diversity. Front. Mar. Sci. 4:404. doi: 10.3389/fmars.2017.00404
Smit, A. J., Roberts, M., Anderson, R. J., Dufois, F., Dudley, S., Bornman, T., et al. (2013). A coastal seawater temperature dataset for biogeographical studies: large biases between in situ and remotely-sensed data sets around the coast of South Africa. PLoS One 8:e81944. doi: 10.1371/journal.pone.0081944
Steneck, R. S., Graham, M. H., Bourque, B. J., Corbett, D., Erlandson, J. M., Estes, J. A., et al. (2002). Kelp forest ecosystems: biodiversity, stability, resilience and future. Environ. Conserv. 29, 436–459. doi: 10.1017/S0376892902000322
Stewart, H. L., Fram, J. P., Reed, D. C., Williams, S. L., Brzezinski, M. A., Maclntyreb, S., et al. (2009). Differences in Growth, Morphology and Tissue Carbon and Nitrogen of Macrocystis pyrifera within and at the Outer Edge of a Giant Kelp Forest in California, USA. Mar. Ecol. Progr. Ser. 375, 101–112. doi: 10.3354/meps07752
Thomsen, M. S., Wernberg, T., and Kendrick, G. A. (2004). The Effect of Thallus size, life stage, aggregation, wave exposure and substratum conditions on the forces required to break or dislodge the small kelp Ecklonia radiata. Bot. Mar. 47, 454–460.
Veitch, J., Rautenbach, C., Hermes, J., and Reason, C. (2019). The cape point wave record, extreme events and the role of large-scale modes of climate variability. J. Mar. Syst. 198:103185. doi: 10.1016/j.jmarsys.2019.103185
Waldron, H. N., and Probyn, T. A. (1992). Nitrate supply and potential new production in the benguela upwelling system. S. Afr. J. Mar. Sci. 12, 29–39. doi: 10.2989/02577619209504688
Weisse, R. (2010). Marine Climate and Climate Change: Storms, Wind Waves and Storm Surges. Berlin: Springer Science & Business Media.
Wernberg, T., Coleman, M., Fairhead, A., Miller, S., and Thomsen, M. (2003). Morphology of Ecklonia radiata (Phaeophyta: Laminarales) Along its Geographic Dstribution in South-Western Australia and Australasia. Mar. Biol. 143, 47–55. doi: 10.1007/s00227-003-1069-9
Wernberg, T., and Goldberg, N. (2008). Short-Term Temporal Dynamics of Algal Species in a Subtidal Kelp Bed in Relation to Changes in Environmental Conditions and Canopy Biomass. Estuar. Coast. Shelf Sci. 76, 265–272. doi: 10.1016/j.ecss.2007.07.008
Wernberg, T., and Thomsen, M. S. (2005). The effect of wave exposure on the morphology of Ecklonia radiata. Aquat. Bot. 83, 61–70. doi: 10.1016/j.aquabot.2005.05.007
Wernberg, T., and Vanderklift, M. A. (2010). Contribution Of temporal and spatial components to morphological variation in the kelp ecklonia (Laminariales). J. Phycol. 46, 153–161. doi: 10.1111/j.1529-8817.2009.00772.x
Wernberg, T., Thomsen, M. S., Tuya, F., Kendrick, G. A., Staehr, P. A., and Toohey, B. D. (2010). Decreasing resilience of kelp beds along a latitudinal temperature gradient: potential implications for a warmer future. Ecol. Lett. 13, 5–94.
Willis, T. J., and Anderson, M. J. (2003). Structure of cryptic reef fish assemblages: relationships with habitat characteristics and predator density. Mar. Ecol. Progr. Ser. 257, 209–221. doi: 10.3354/meps257209
Wing, S. R., Leichter, J. J., Perrin, C., Rutger, S. M., Bowman, M. H., and Cornelisen, C. D. (2007). Topographic shading and wave exposure influence morphology and ecophysiology of Ecklonia radiata (C. Agardh 1817) in Fiordland, New Zealand. Limnol. Oceanogr. 52, 1853–1864. doi: 10.4319/lo.2007.52.5.1853
Zimmerman, R. C., and Kremer, J. N. (1986). In Situ Growth and Chemical Composition of the Giant Kelp, Macrocystis Pyrifera: response to temporal changes in ambient nutrient availability. Mar. Ecol. Progr. Ser. 27, 277–285. doi: 10.3354/meps027277
Appendix
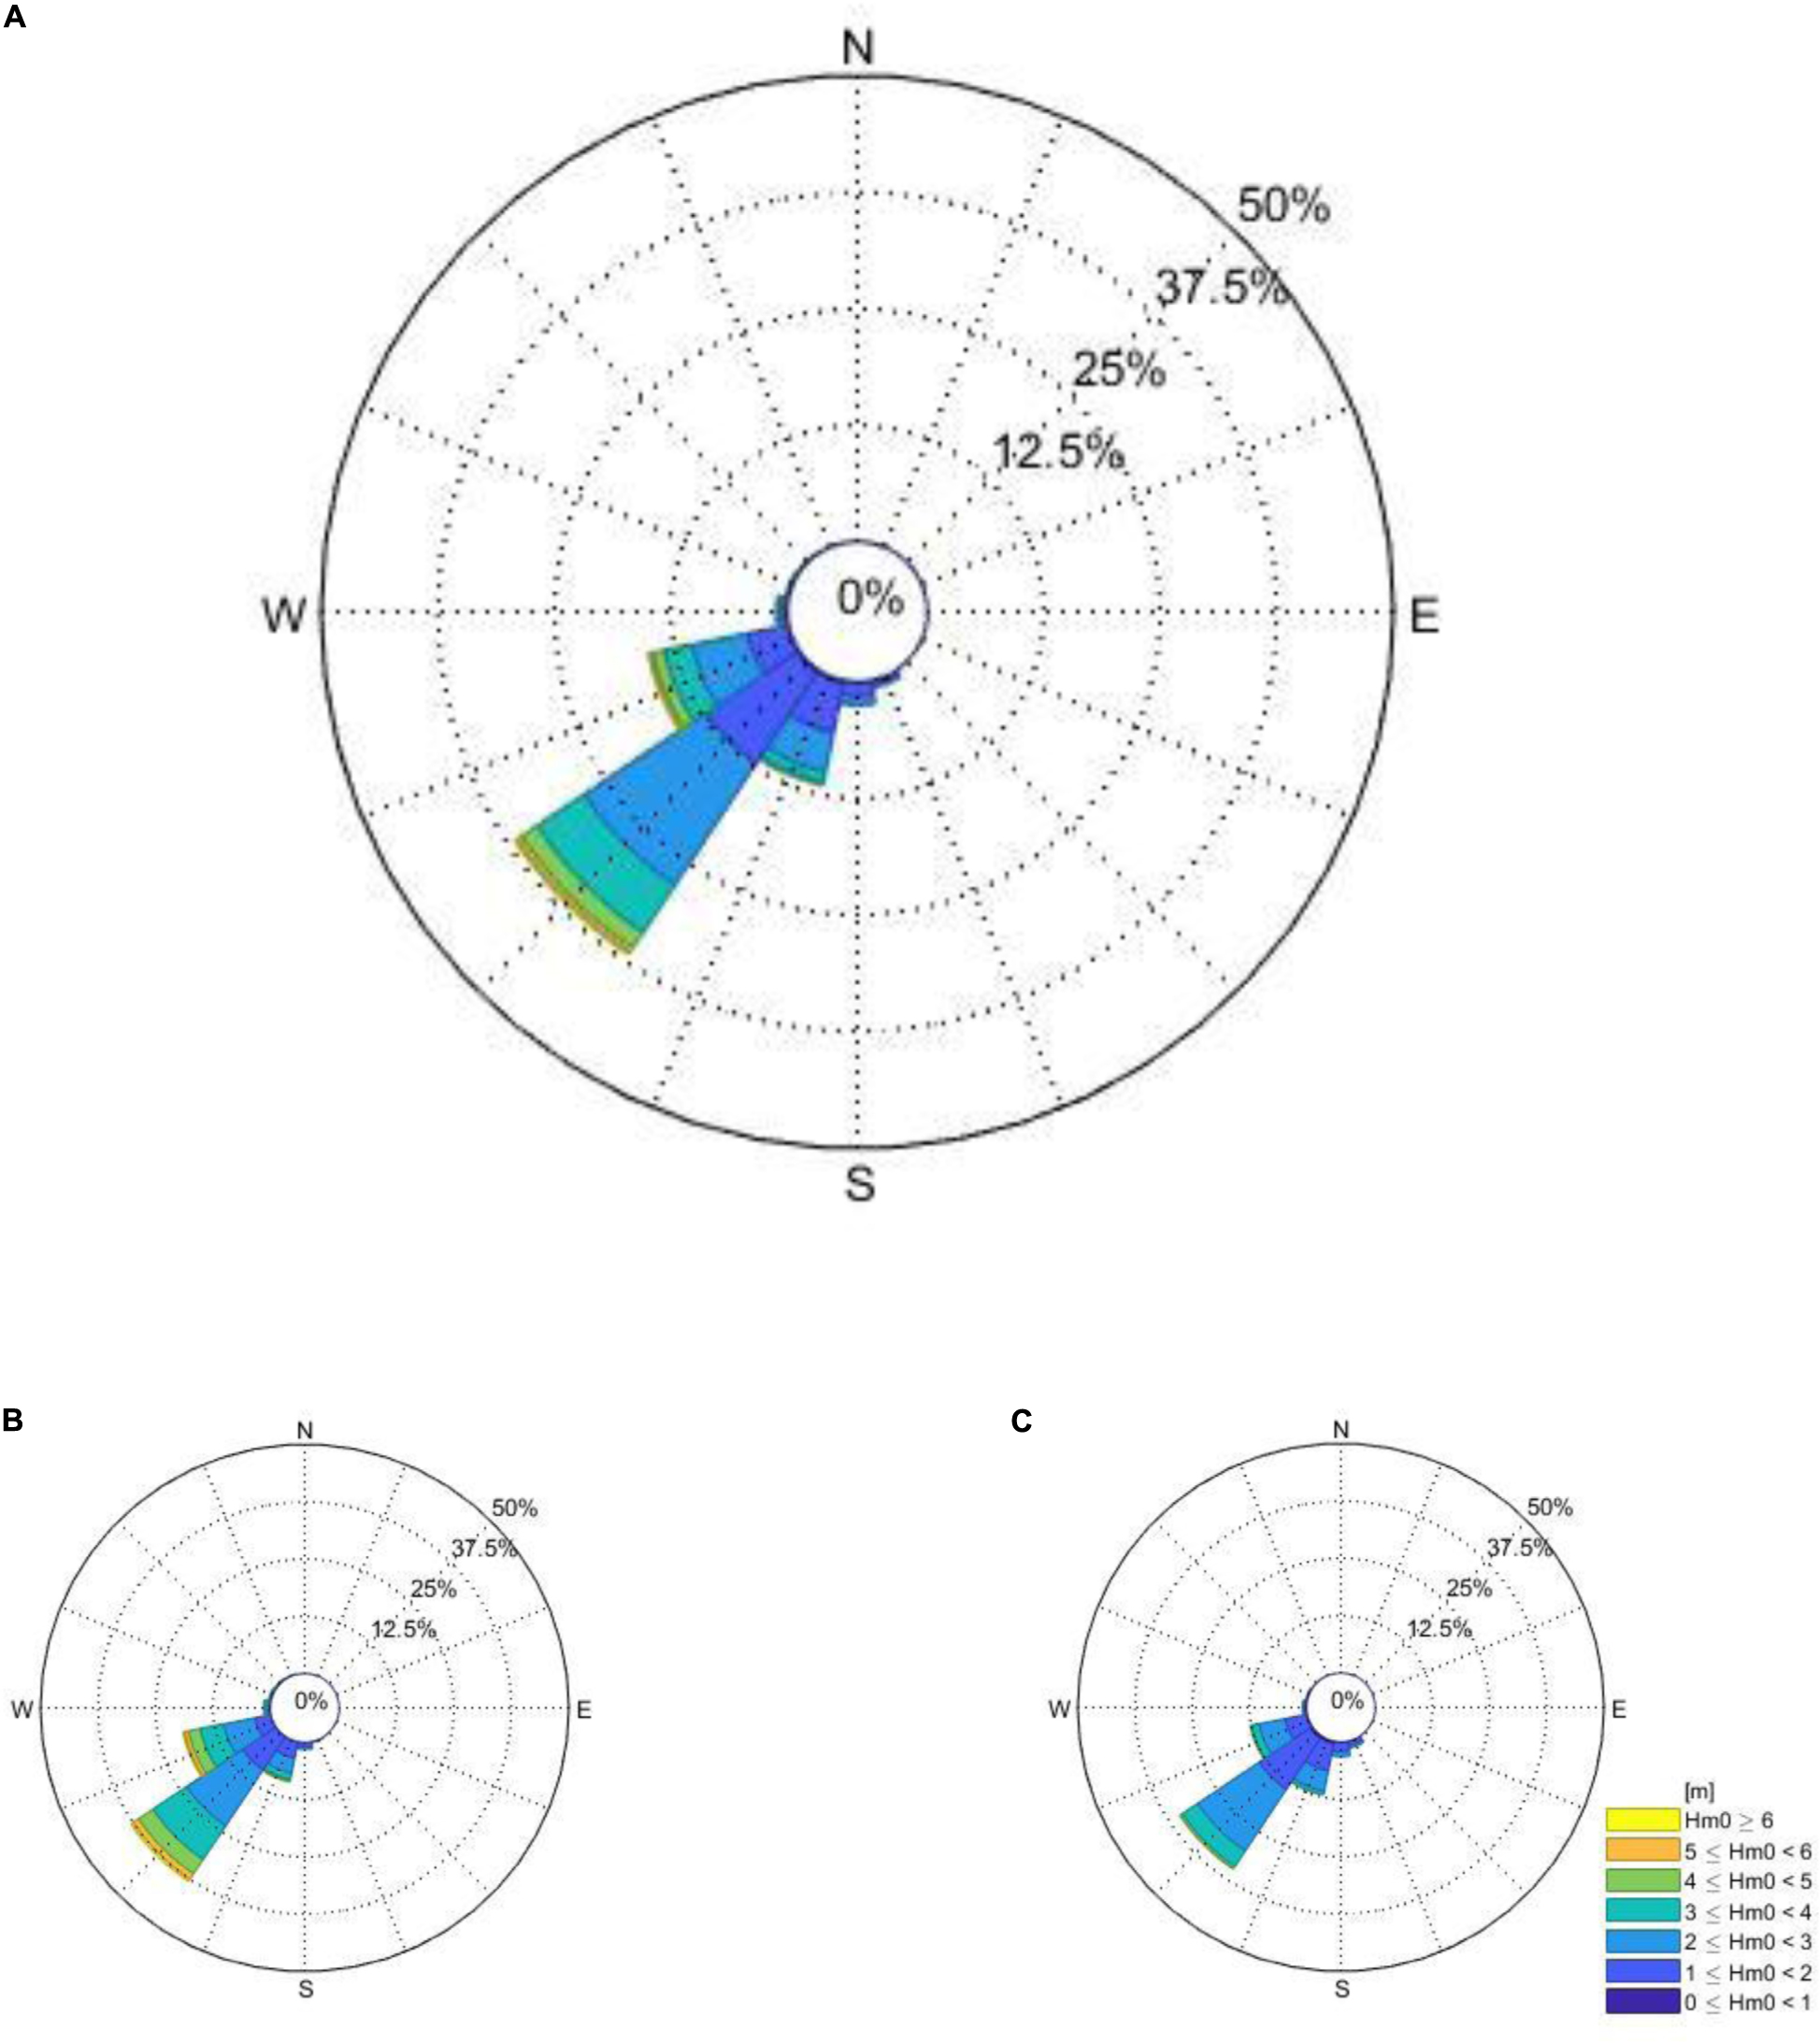
Figure A1. The total and seasonal wave roses of the directional wave buoy just offshore from Cape Town is given for years 2000 till end of 2017 (the period for which the directional wave spectra was available). The total (A), Austral winter (B), and Austral summer (C) are presented, respectively.
Keywords: kelp, wave exposure, temperature, morphological adaptation, MetOcean, numerical model
Citation: Coppin R, Rautenbach C, Ponton TJ and Smit AJ (2020) Investigating Waves and Temperature as Drivers of Kelp Morphology. Front. Mar. Sci. 7:567. doi: 10.3389/fmars.2020.00567
Received: 03 December 2019; Accepted: 22 June 2020;
Published: 15 July 2020.
Edited by:
Stelios Katsanevakis, University of the Aegean, GreeceReviewed by:
Stein Fredriksen, University of Oslo, NorwayTom William Bell, University of California, Santa Barbara, United States
Trine Bekkby, Norwegian Institute for Water Research (NIVA), Norway
Copyright © 2020 Coppin, Rautenbach, Ponton and Smit. This is an open-access article distributed under the terms of the Creative Commons Attribution License (CC BY). The use, distribution or reproduction in other forums is permitted, provided the original author(s) and the copyright owner(s) are credited and that the original publication in this journal is cited, in accordance with accepted academic practice. No use, distribution or reproduction is permitted which does not comply with these terms.
*Correspondence: Ross Coppin, Y29wcGlucm9zc0BnbWFpbC5jb20=
†Present address: Christo Rautenbach, MetOcean Solutions – A Division of Metservice, Raglan, New Zealand