 Ryan M. Pearson
 Jason P. van de Merwe
 Michael K. Gagan
 Rod M. Connolly
- 1Australian Rivers Institute – Coast and Estuaries, School of Environment and Science, Griffith University, Gold Coast, QLD, Australia
- 2School of Earth and Environmental Sciences, The University of Queensland, Brisbane, QLD, Australia
- 3Research School of Earth Sciences, The Australian National University, Canberra, ACT, Australia
Many ecological investigations rely on understanding the movement of animals through marine environments. Most available tracking techniques are invasive (e.g., tissue sampling) and require extensive effort and/or cost (e.g., capture-mark-recapture or satellite telemetry). The isotopic compositions of barnacle shells (δ13C and δ18O) are known to record the ambient water temperature and salinity conditions in which they grew. Thus, isotopic analysis of “hitchhiking” barnacles on animals or objects has the potential to yield information about their movement between water bodies of varying isotopic properties. We present, for the first time, isotopic data for barnacle shell samples that grew on a satellite-tracked sea turtle host. The satellite telemetry record, together with documented barnacle growth rates, allowed for sequential samples from individual barnacle shells to be assigned a specific time and location for direct comparison of isotope values to environmental conditions. We developed models that allow barnacle shell δ13C and δ18O to be linked, with a high degree of predictability, to sea surface temperature (SST) and salinity (SSS). Our sea turtle case study demonstrated how these models can be used to create isoscapes, allowing hosts to be tracked in space and time at higher resolution than most attempts to use soft-tissue isotopes for a similar purpose, and at considerably lower cost than satellite telemetry. The conceptual advance presented here could be applied widely to understand the movement of any animal or object that carries hitchhiking barnacles.
Introduction
Conservation efforts for threatened taxa generally rely, to some extent, on understanding the movement and habitat use of target species (e.g., Scott et al., 2012; Mazor et al., 2016). Recent decades have seen an increase in the use of isotope analyzes for these purposes (e.g., Vander Zanden et al., 2015; Peavey et al., 2017; Fleming et al., 2018; Marcus et al., 2019). Studies of this nature have predominantly focused on analysis of the tissues of the animals themselves (e.g., Vander Zanden et al., 2016; Pearson et al., 2017), but recent research has furthered understanding of how hitchhiking barnacles can be used to understand marine migrations (e.g., Detjen et al., 2015; Pearson et al., 2019, 2020; Taylor et al., 2019). For example, Pearson et al. (2019) demonstrated that barnacle shell isotope values could distinguish between foraging areas in Eastern Australia to a resolution of at least 400 km. This resolution is finer than most soft-tissue isotope studies have been able to achieve (Pearson et al., 2019), and was conducted in an area where soft-tissue techniques have been demonstrated ineffective for the same purpose (Coffee et al., 2020). Barnacle analyses limit the need for invasive sampling procedures on threatened animals and opens potential new lines of investigation, including hindcasting of the movement of anything that carries hitchhiking barnacles.
The isotopic compositions of marine biogenic carbonates (e.g., corals, foraminifera, fish otoliths) vary along environmental gradients making them useful for recreating climatic conditions (e.g., Reddin et al., 2018) and identifying the geographic origins of migrating fauna (e.g., Killingley, 1980; Trueman et al., 2012; Pearson et al., 2019). For example, δ18O values vary with temperature and salinity in carbonates formed by several marine taxa (Urey, 1948; Devereux, 1967; Killingley and Berger, 1979; Gagan et al., 1998; Pearson et al., 2019). The isotope values in marine biogenic carbonates are largely moderated by oxygen isotope ratios in seawater (δ18Osw), which increase linearly with salinity (Schmidt et al., 2007), alongside temperature (e.g., Killingley and Newman, 1982). This relationship is well established for regions where the annually averaged δ18O of rainfall is relatively constant, particularly in the tropics (Schmidt et al., 2007), but is not well understood in many other marine regions (Pearson et al., 2020).
In general, carbonate δ18O values are predictable if δ18Osw and temperature (at the time of shell formation) are both known, along with the nature of the relationship between them Killingley and Newman (1982). For example, paleotemperature equations for various organisms, including mollusks (Epstein et al., 1953), barnacles (Killingley and Newman, 1982), foraminifers (Erez and Luz, 1983), and brachiopods (Brand et al., 2013), allow conversion between carbonate δ18O, δ18Osw, and temperature if two of these parameters are known. Furthermore, many biogenic carbonates are formed sequentially, often in distinct layers, allowing changes in temperature and salinity (via δ18Osw) to be reconstructed through time (Killingley, 1980; Killingley and Lutcavage, 1983; Pearson et al., 2019).
Carbonate-secreting organisms (e.g., barnacles) that hitchhike on larger animals or objects (e.g., marine debris) as they undergo migrations provide an opportunity to recreate the movement of the host through water bodies of different characteristics (Pearson et al., 2020). This has been attempted using δ18O in barnacle carbonate to reconstruct the movement of host turtles (Killingley and Lutcavage, 1983; Detjen et al., 2015) and whales (Killingley, 1980). However, until recently, there was no incorporation of barnacle growth rates into models to date samples, and no validation of calculations with spatio-temporal variation measured in-water. Pearson et al. (2019) recently incorporated barnacle growth rates (as defined by Doell et al., 2017) with δ13C and δ18O values in barnacle shells from host sea turtles to distinguish between sea turtle foraging areas with relatively high accuracy where foraging areas had sufficient geographic separation.
To calculate temperatures and salinities using this method, and then estimate an origin for dated samples from barnacle shells, it is first necessary to have a robust understanding of the regional relationships between temperature, salinity, δ18Osw, and barnacle δ18O values. However, the availability of δ18Osw data with sufficient temporal coverage to enable these assessments is limited. Improving this understanding should allow development of isoscapes (maps of the geographic distribution of isotope values, e.g., Espinasse et al., 2019) that reflect specific time periods and allow potential areas of origin to be identified for each sample, and thus migration pathways to be recreated.
Similar to δ18O values, there is a relationship between salinity and dissolved inorganic carbon (DIC) isotopes in seawater (Gillikin et al., 2006), which then propagates into carbonates (e.g., mollusk shell; Killingley and Lutcavage, 1983; Figure 1). This relationship remains untested and undefined for barnacle shell carbonates but has been demonstrated in other marine biogenic carbonates (Gillikin et al., 2006). This suggests that it may be possible to develop linear relationships with environmental variables and create δ13C isoscapes for barnacle shell. The combination of δ18O and δ13C isoscapes could serve to refine the resolution that is achievable in recreating the movement of the host through water bodies of different isotopic characteristics.
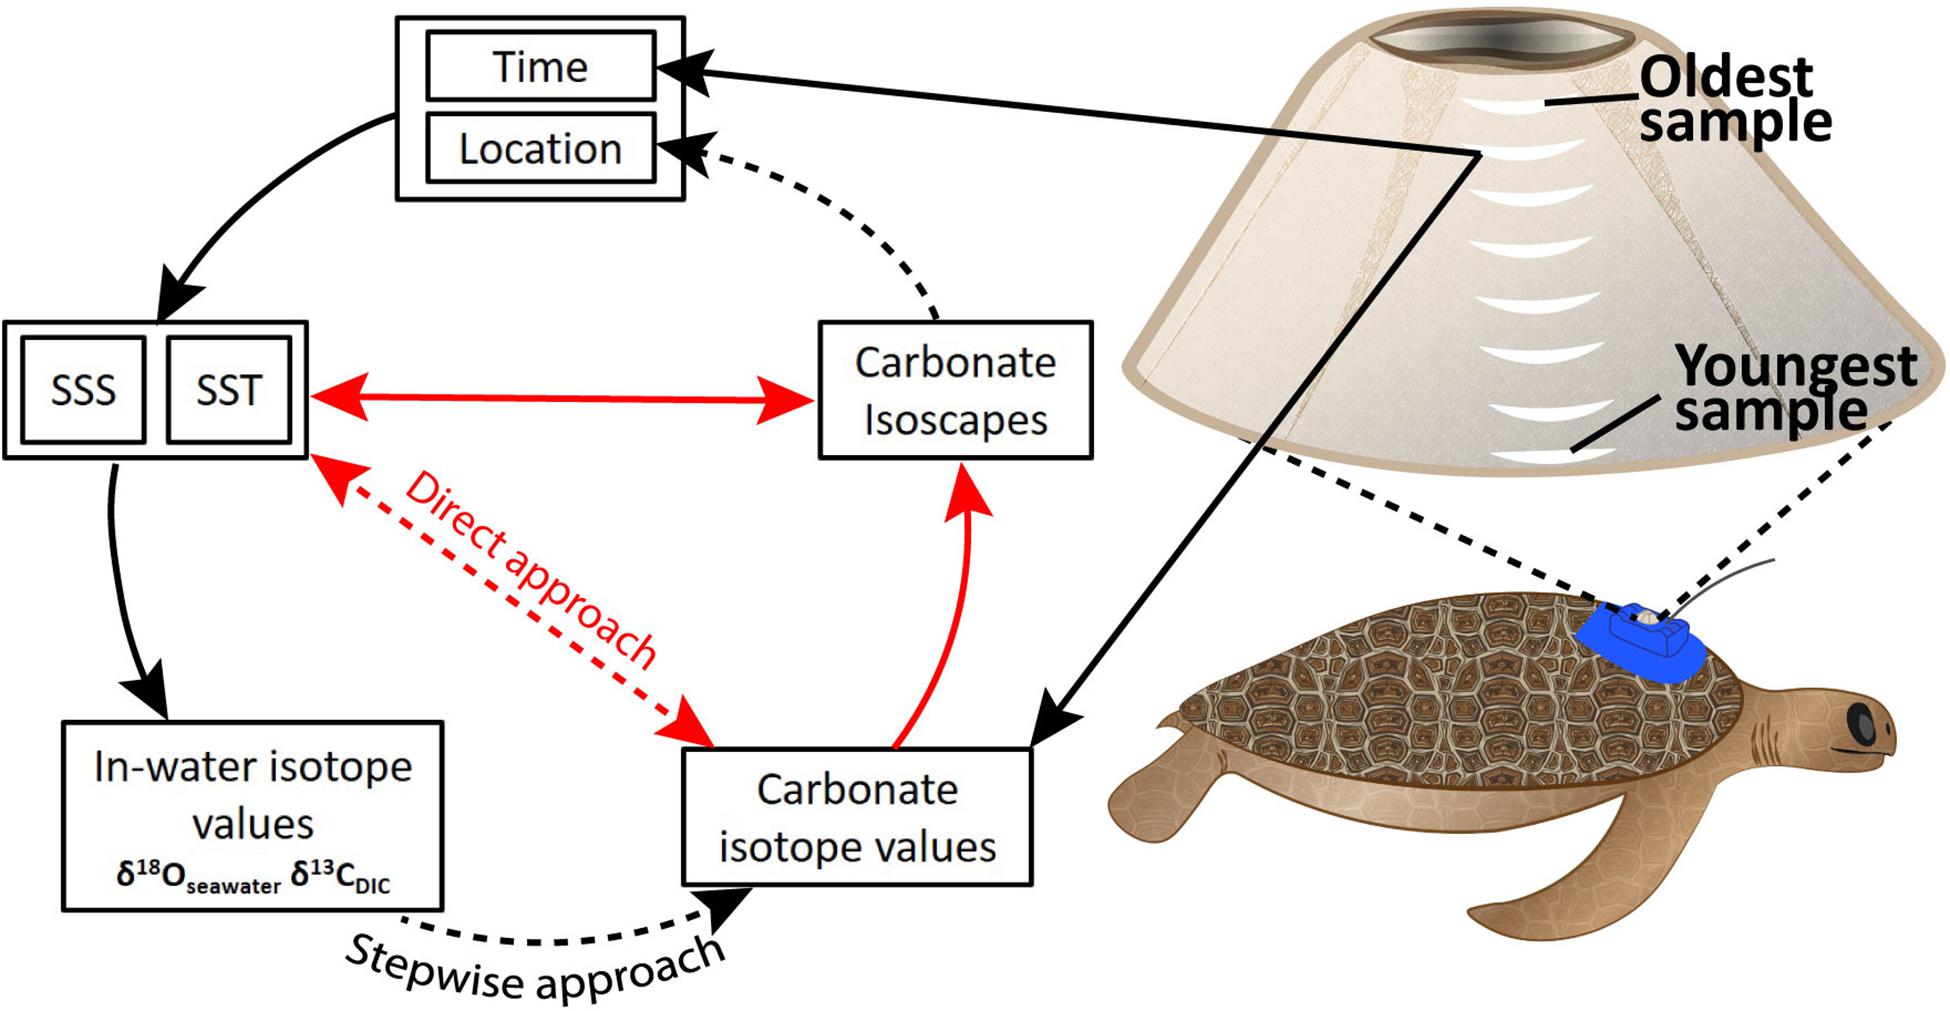
Figure 1. Theoretical framework describing the relationships between time, location, salinity, temperature, and isotopes in seawater, dissolved inorganic carbon (DIC), and carbonate from barnacle shell. Direct physico-chemical relationships exist between SSS, SST, and δ18O/δ13C isotope values for seawater and dissolved carbon (in-water isotope values). In-water isotope values affect carbonate isotope values in barnacle shell. These relationships informed the stepwise approach we explored. Our direct approach attempted to bypass need of knowledge around in-water isotope values by describing a direct relationship between SST, SSS, and carbonate isotope values. Black arrows indicate known relationships. Red arrows show mathematical relationships related to spatial ecology and paleoclimatology. Dashed arrows show relationships we were aiming to describe regionally in this study. SSS: sea surface salinity. SST, sea surface temperature. Carbonate isotope values refers to δ18O and δ13C values in barnacle carbonate.
Here, we aimed to define the relationships between δ18O and δ13C values in barnacle shell with environmental parameters (SST and SSS; Figure 1) specific to the marine waters on the northwest shelf of Western Australia. We also defined the relationship between δ18Osw and salinity in the region by using carbonate δ18O values and SST as proxies to estimate δ18Osw values via the balanomorph barnacle paleotemperature equation (Killingley and Newman, 1982). We then used these relationships to develop isoscapes for commensal barnacle shell, accounting for temporal variation in salinity and δ18Osw values across the region (Figure 1).
Methods
In December 2015, a satellite tag was attached to a nesting loggerhead turtle (Caretta caretta) in Coral Bay, south of Exmouth in Western Australia (Figure 2). The movement of this turtle was tracked for ∼8 months while it migrated >3,000 km to the area offshore of Darwin in Australia’s Northern Territory (Figure 2). At this point, the turtle was opportunistically recovered, creating a unique opportunity to collect samples post-tracking after a considerably long migration. Thus, a turtle barnacle (Chelonibia testudinaria; the only one available) was removed from the satellite tag itself, and sent to the authors for stable isotope analysis.
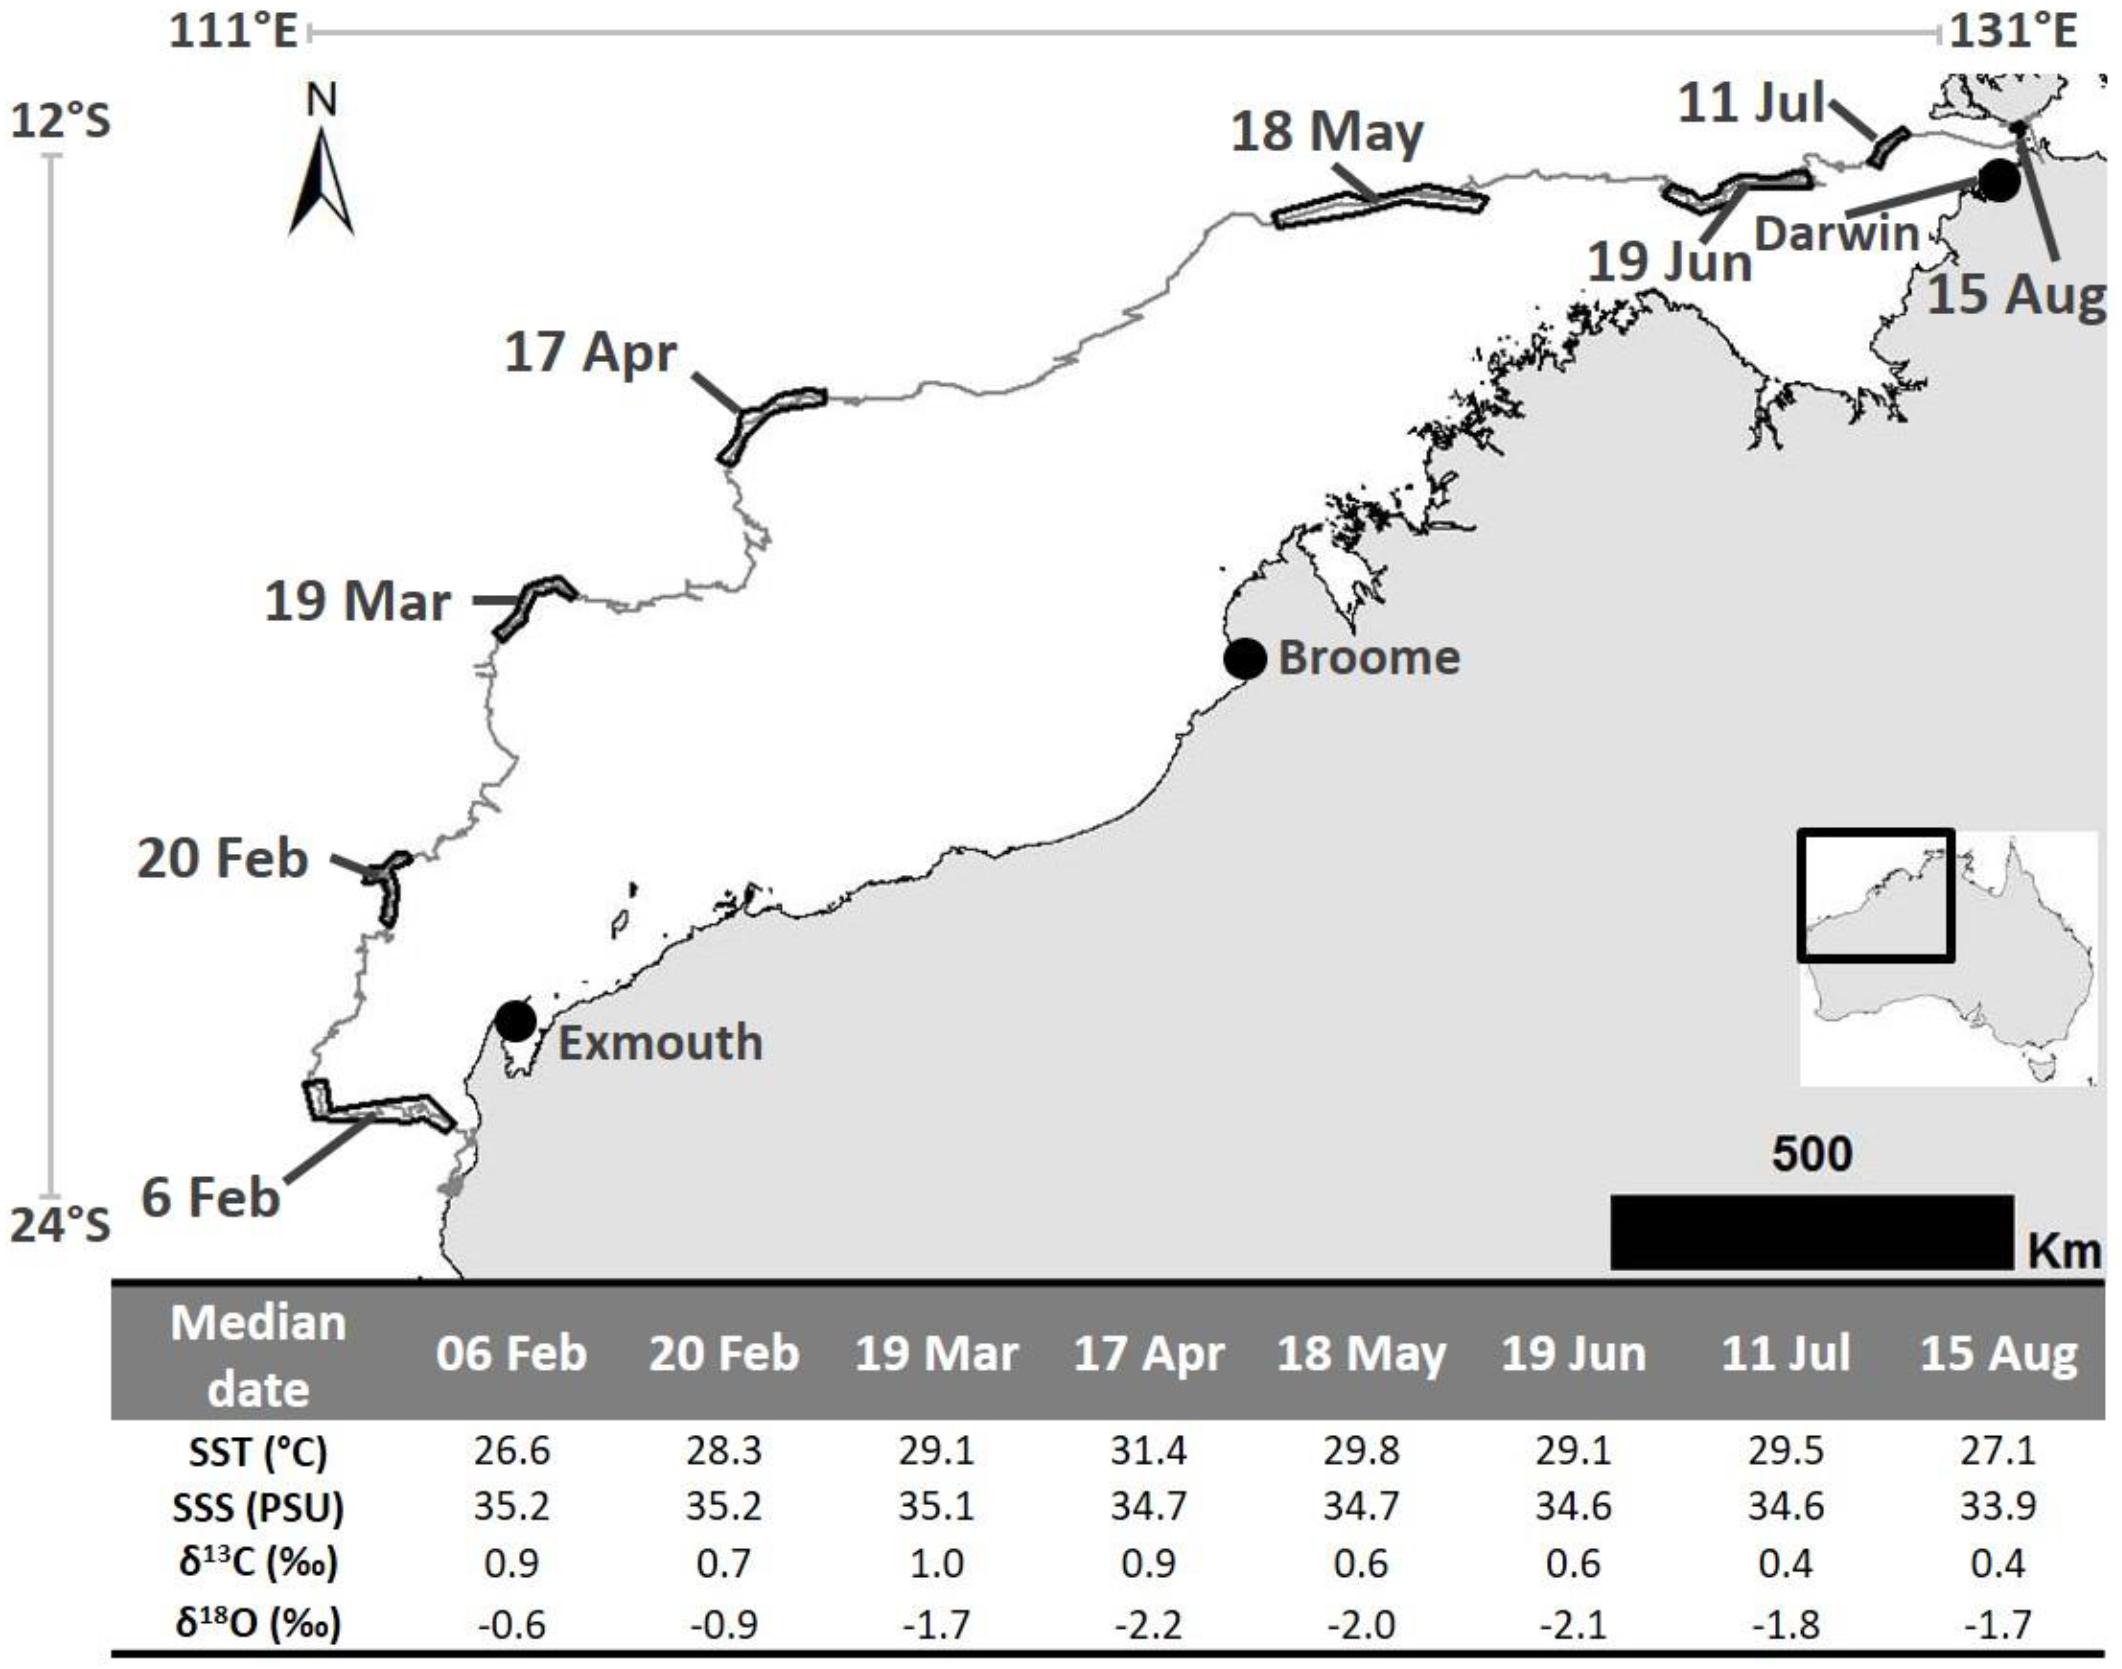
Figure 2. The 2016 post-nesting migration pathway of a loggerhead turtle that was tagged on the Western Australian coast and traveled to near Darwin. Dated black outlines on telemetry track represent the location at which each barnacle shell sample was expected to have been created. Table at base shows calculated (median date and mean SST and SSS) and analyzed parameters (δ13C and δ18O values) for each sample. Satellite telemetry data were obtained from the Gnaraloo Turtle Conservation Program for the Gnaraloo Wilderness Foundation.
Eight shell sub-samples were extracted, dated (using the growth rates established by Doell et al., 2017), and analyzed for δ13C and δ18O values using the sampling and analysis protocol described by Pearson et al. (2019). We then identified the location of the host turtle (using the satellite telemetry tracking data) during the period represented by each dated barnacle shell sample (Figure 2). SST and SSS values were then extracted (in ArcMAP) for the times and locations at which each shell sample was estimated to have formed. SST data were from satellite derived raster layers (IMOS, 2016) and SSS data were from netCDF files provided by the Bureau of Meteorology based on the OceanMaps models (Brassington et al., 2012).
Stepwise Approach: Defining the δ18Osw Relationship With Salinity
Existing methods for converting between temperature and carbonate δ18O values require knowledge of δ18Osw values. Seawater δ18O data are not readily available, but can be estimated from salinity data if the regional relationship between salinity and δ18Osw values is known. The relationship between salinity and δ18Osw values has not been quantified for NW Australia. However, the relationship can be established by deriving δ18Osw values from shell δ18O values (produced at known temperatures) using the balanomorph barnacle paleotemperature equation (BBPE), defined by Killingley and Newman (1982) as follows:
For this study, we used temperature from remote data and δ18O values from barnacle carbonate to estimate δ18Osw values with Eq. (2) below, a rearranged form of the BBPE:
The BBPE was generated via analysis of δ18O values from balanomorph barnacles collected from multiple places globally (Killingley and Newman, 1982). The relationship between temperature and δ18O values was consistent between species and regions, thus we consider it to be generally applicable. Following calculation of δ18Osw values for each sample, we then used linear regression to define the relationship between δ18Osw values and SSS for the region.
Direct Approach: Defining the Relationship Between Barnacle δ13C and δ18O Values With SST and SSS
To reduce the need to have specific knowledge of δ18Osw values for understanding marine movement using barnacle isotopes in this region, we used linear regression to quantify a relationship between SST, SSS, and each of the isotopes measured directly. The measured barnacle isotope value (for δ18O and δ13C separately) was used as the dependent variable and available SST and SSS were used as predictors into a linear regression. The resulting equation was then used to predict the barnacle isotope values that could be expected in shells growing under the same environmental conditions.
Barnacle Age and Sample Dating
The barnacle sampled for this study has a rostro-carinal diameter of 38.9 mm and a curved rostrum length of 18 mm. Using these values in the von Bertalanffy growth equation for Chelonibia testudinaria barnacles (described by Doell et al., 2017) resulted in an estimated age of 222 days at the time of collection. Collection of the barnacle occurred on 28 August 2016, which means it settled on the turtle (on the satellite tag) on ∼19 January 2016. This was 41 days after tag application a time when the host turtle was still in close proximity to the nesting beach (<10 km). This suggests that the information stored in the oldest shell material is representative of the conditions nearby the origin and that the full migration distance is accounted for within the life of the barnacle.
The eight samples extracted from this barnacle for analysis were at ∼2 mm intervals along the rostrum surface (example in Figure 1). Dating of these samples resulted in ∼1 month of shell growth (median date) between each sample. The oldest sample had a median date of 6 February 2016 (range: 4–8 Feb.; highest sample on barnacle in Figure 1) and the youngest was 15 August 2016 (range: 11–20 Aug.; lowest sample on barnacle in example in Figure 1). We note here that C. testudinaria growth rates have not been explicitly measured in north Western Australian waters and that applying the Doell et al. (2017) growth model to this barnacle may result in slight mis-assignment of age. However, as noted in Doell et al. (2017), growth rates for this species appear to be similar for distant regions [e.g., eastern Australia (Doell et al., 2017) and eastern United States (Sloan et al., 2014)], thus we believe that our application of the Doell et al. (2017) growth model is justified. This is especially true given the estimated age is near to, and not older, than the time at which the tag was applied.
Creating Barnacle Isoscapes
In this study, we developed time-specific isoscapes (maps of the geographic distribution of isotope values) for use in predicting the region of formation for any barnacle shell sample. The isoscapes were generated from our modeled relationships between barnacle shell δ18O and δ13C values, and the two key environmental parameters, SST and SSS. Mean SST (IMOS, 2016) and SSS (Brassington et al., 2012) data were extracted for each latitudinal-longitudinal cell (0.1° × 0.1°) for the time-interval encompassed by each shell sample. We then calculated the expected shell δ18O and δ13C values for each cell and time period (Table 1) and mapped these values using ArcMap 10.1 to create the isoscapes. The first δ18O isoscape was based on values derived using a stepwise process, whereby we used salinity to estimate δ18Osw values and then the used these calculated values alongside temperature in the BBPE to calculate δ18O values. The second (direct approach) was from the model describing the direct relationship with SST and SSS, without the need for δ18Osw values. The δ13C isoscape used only the direct relationship because no equation yet exists that describes the relationship for barnacle shell δ13C values, salinity and temperature to allow for a stepwise approach for δ13C values. However, as described earlier, established relationships between temperature, salinity, δ13CDIC and δ13C values in carbonates (e.g., Killingley and Lutcavage, 1983; Gillikin et al., 2006) suggest that a direct relationship should be quantifiable.
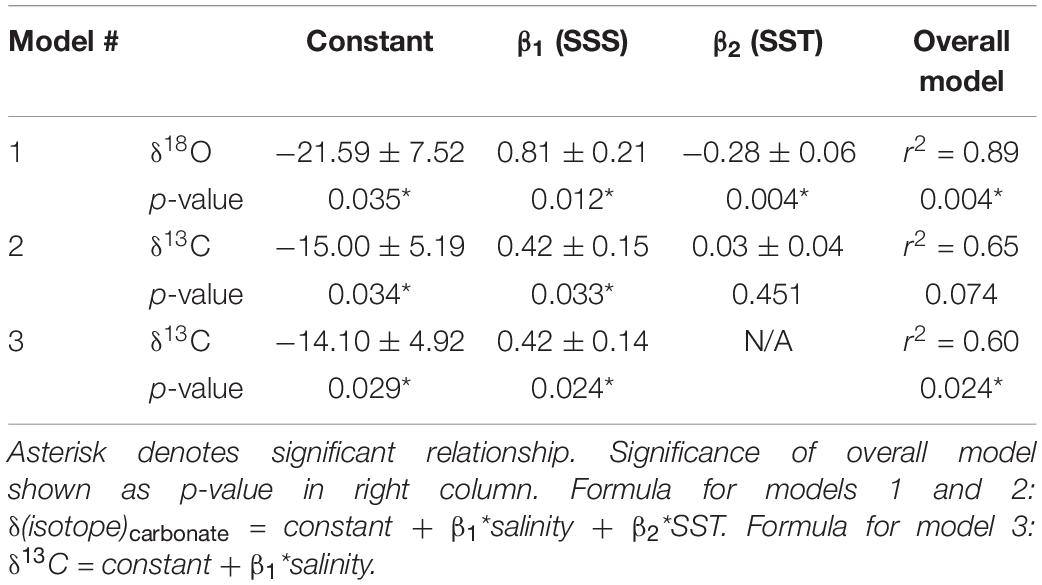
Table 1. Linear regression defining model parameters (SE) that can be used to predict barnacle shell δ18O and δ13C values (‰) from sea surface temperature and salinity.
Results and Discussion
Observations of Environmental Parameters and Isotope Values
Barnacle shell δ18O values ranged from −2.16 to −0.57 ‰ and δ13C values ranged from 0.36 to 0.96 ‰ (Figure 2). Temperatures ranged from 26.6 to 31.4°C (Figure 2). The lowest and highest temperatures corresponded with the highest and lowest δ18O values, respectively. SSS ranged from 33.9 to 35.2 PSU (Figure 2). SSS was highest nearer the southern end of the migration (35.2 PSU where the second sample was formed) and lowest (33.9 PSU) in the vicinity of the re-capture location (i.e., where the last sample was formed near Darwin) (Figure 2).
Stepwise Approach: Defining the δ18Osw Relationship With Salinity
Here we describe the relationship between SSS and δ18Osw values in NW Australia using δ18Osw values calculated via the BBPE (constrained by available SST data). The rearranged BBPE (Eq. 2) returned estimates of δ18Osw values ranging from −0.60 to 0.44 ‰ (SMOW). Regression analysis returned a strong linear relationship between the calculated δ18Osw values and SSS (r2 = 0.71; Supplementary Figure S1). All parameters were significant: overall model (p = 0.009), constant (−28.2; p = 0.009), and gradient (0.81; p = 0.009). Thus, the best-fit linear relationship between SSS and δ18Osw values in NW Australia was described by Eq. (3):
Schmidt et al. (2007) expected that the relationship between salinity and δ18Osw values in the west Pacific warm pool/Indian Ocean region would have a generally steeper gradient (>0.4‰/PSU) than in other regions due to the region’s role in exporting water vapor to the extra-tropics. Our linear equation for NW Australia aligned well with these expectations, returning a gradient of 0.81‰/PSU, which is steeper than both the global tropical (0.25‰/PSU) and NW Atlantic extra-tropical (0.57‰/PSU) slopes provided by Schmidt et al. (2007).
The intercept of −28.2‰ is lower than expected, given that this reflects the freshwater “end-member” rainfall δ18O value in the region, which is generally in the range of −5 to 15 ‰ (e.g., Hughes and Crawford, 2012; Munksgaard et al., 2019). The exact cause of this difference is unknown, but it could be due, in part, to highly seasonal evaporative processes (as suggested by Schmidt et al., 2007), related to the role that this subtropical region plays in exporting water vapor to the extra-tropics. For example, high surface-ocean evaporation in the southern sector of the NW shelf would increase δ18Osw values in the uppermost waters, thus increasing δ18Osw values (perhaps making it locally higher relative to model estimates of regional SSS). The increased isotopic contrast in δ18Osw values and modeled SSS would enhance the δ18Osw/SSS slope relationship, resulting in lower end-member intercept for rainfall. Despite this unexpected result, we believe the equation to be representative for the turtle’s migration route across NW shelf waters during the time-period encompassed.
Established equations in other regions also have intercepts that are considerably lower than rainfall δ18O values in their respective regions. For example, rainfall in the NW Atlantic extra-tropics is approximately between −2.5 and −7.5 ‰, but the equation for this region has an intercept of −19.5 ‰. The equation for the global tropics (Schmidt et al., 2007) also has an intercept lower than expected from rainfall records.
Direct Approach: Defining Relationships Between Barnacle Isotopes (δ18O, δ13C) and Environmental Parameters (SST, SSS) Directly
Linear regressions for each isotope also showed strong relationships with SST and SSS. For barnacle δ18O values, the overall model was significant (p = 0.004; r2 = 0.89), as were both temperature (p = 0.004) and salinity (p = 0.012; Table 1). This agreed with expectations that both temperature and salinity (indirectly via changes in δ18Osw values) are strongly influential in driving barnacle δ18O values.
For barnacle δ13C values, the model including both temperature and salinity had an r2 = 0.65, but was not significant (p = 0.074). The salinity term was significant (p = 0.033) in this model, but the temperature term was not (p = 0.451). Therefore, we repeated the regression analysis with salinity alone, which resulted in a significant model (p = 0.024) and a significant relationship with salinity (p = 0.024), but accounted for slightly less of the variation in the data than the model including temperature (r2 = 0.60; Table 1). This model allowed isoscapes for barnacle δ13C values to be created for the first time, from remotely collected (estimated) salinity data. However, we present both models because, while the temperature parameter was not significant for carbon, temperature is still expected to have some effect on δ13C values. Also, the overall model, including temperature (r2 = 0.65), accounted for more variation in the data than the salinity only model did (r2 = 0.60), despite being non-significant overall. Thus, it is possible that a small temperature effect exists, but that the temperature range and replication in our data were insufficient to return a statistically significant effect.
Therefore, we suggest that temperature should still be considered in future models aimed at analysing δ13C values in barnacle shell. In either case, it appears that every unique temperature/salinity combination resulted in a unique combination of δ13C and δ18O values in barnacle shell. That is, the temperature and salinity can be calculated if both δ13C and δ18O values are known, and vice versa (Figure 1).
Oxygen and Carbon Isoscapes for Northwest Australia
Here we show examples of isoscapes that can be produced using the models we have presented. Two of these are the first examples of isoscapes (for both δ13C and δ18O) in barnacle shell that do not require prior knowledge of the isotopic composition of seawater. This simplification of the methodological process should allow for faster analysis in future research than has been possible thus far. For the purpose of demonstrating this capability, we selected an example period matching the dates represented within the most recent layer of the barnacle we sampled. In theory, similar isoscapes can be created for any time period for which both SST and SSS are known in this region.
All isoscapes showed relatively low values in the north, and generally increased with latitude (Figure 3). We used the linear relationship with SSS only (i.e., no temperature) for both the δ18Osw and the δ13C isoscapes, which resulted in empirically different, but very similar spatial patterns for the time period selected (12–18 Aug, 2016) (Figures 3A,B). The two δ18O carbonate isoscapes included both salinity and temperature in the calculations, but in different ways (using the stepwise and direct approaches). This resulted in the same general spatial patterns, but a slight offset in values (Figures 3C,D). The isoscape requiring stepwise equations and more variables (δ18Osw; Figure 3C) returned consistently lower values than the direct approach (Model 1; Figure 3D), but only slightly (mean difference within cells = 0.21 ‰). For all carbonate isoscapes presented (Figures 3B–D), values within the region of formation align well with isotope values measured from the barnacle shell (Figure 2), thus suggesting that this technique could be used effectively to hindcast sea turtle movement where these regional relationships are known.
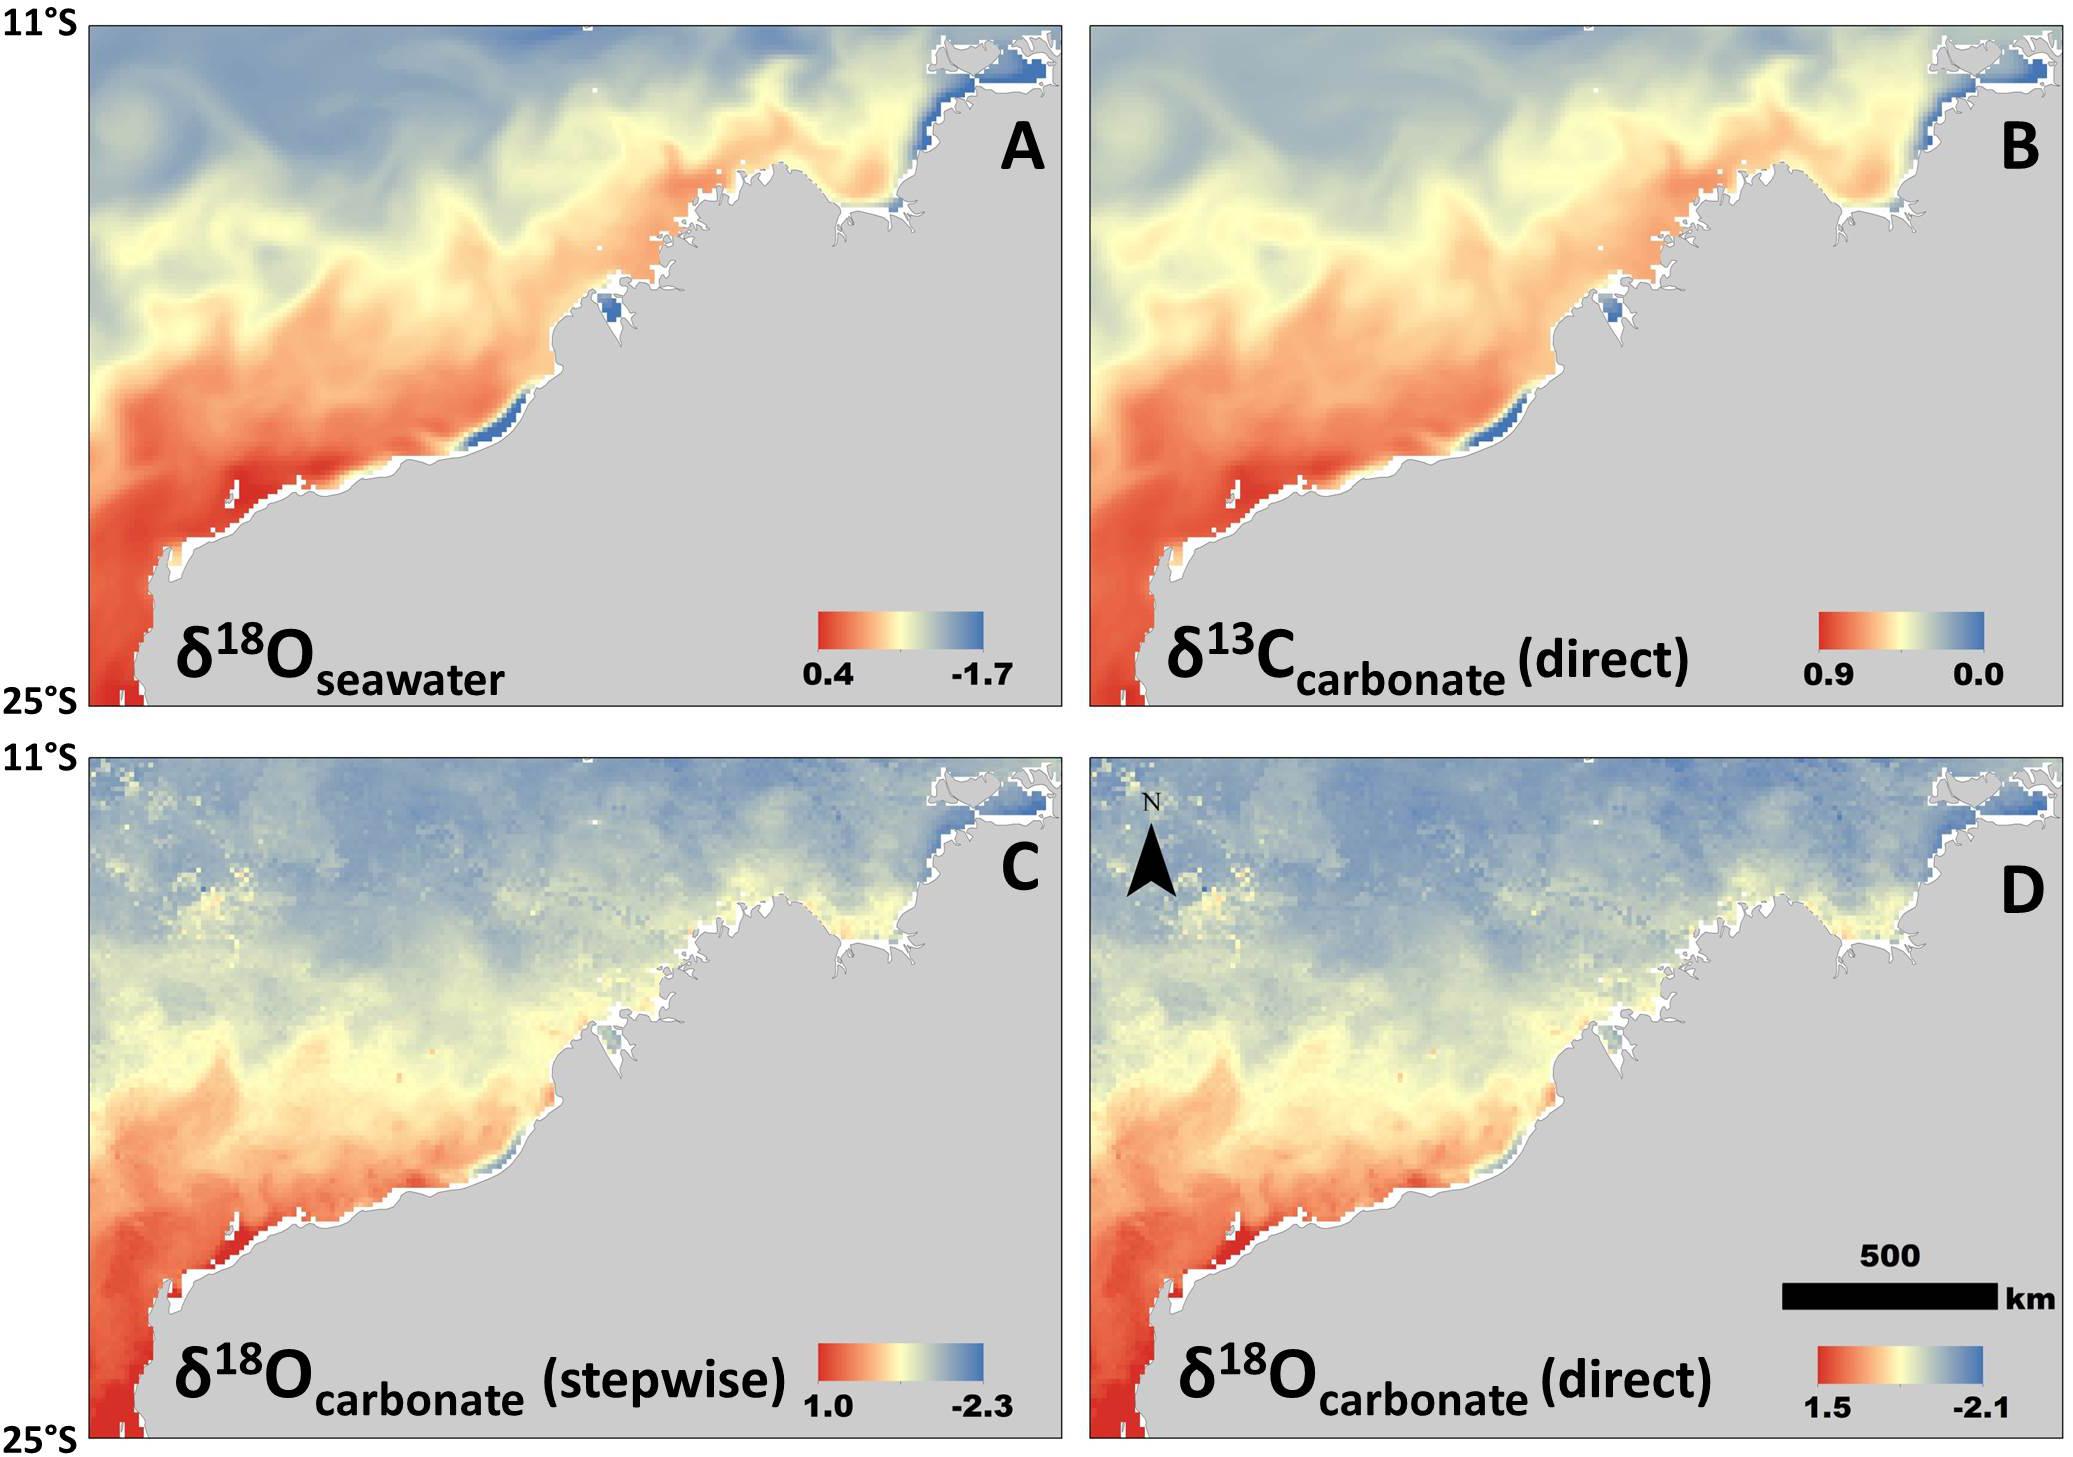
Figure 3. Isoscapes generated from newly derived relationships between isotopes, salinity, and temperature. All are examples of spatial variation during the same period (in this case mean values for 11–20 August, 2016, selected for example only). (A) Isoscape of δ18Osw values. (B) Isoscape of δ13C values generated from the model that does not include a temperature parameter (Model 3; Table 1). (C) Carbonate δ18O (stepwise method) isoscape derived from δ18Osw-salinity relationship and then generated using the BBPE. (D) Isoscape of carbonate δ18O values generated directly from linear regression (Model 1; Table 1) without BBPE or δ18Osw values. All isotope values in permille (‰).
Future Applications
This study presented a unique opportunity to collect and analyze barnacle shell samples that grew while the host turtle was being satellite tracked. We acknowledge that experimental replication is low due to the novelty of this opportunity, but we nevertheless showed strong relationships between SST and SSS and barnacle shell isotopes that align well with information derived from relevant literature. However, future studies should aim to broaden the scope of similar analyses and further validate these relationships, especially when investigating new regions. Further, the equations we presented describe consistent relationships with no variability (i.e., no uncertainty parameter in the model). We showed strong relationships, but acknowledge that variability is visible in the data, likely due to a combination of factors (e.g., averaging remotely collected data and variability in barnacle growth rates resulting in mismatches between sample age and data), and should be accounted for in future studies that validate and apply these models. This could be achieved by applying a buffer that accounts for uncertainties (e.g., analytical error; SE in models) around calculated isotope values when aligning measured values with isoscapes. Another possible technique, applied in terrestrial research, is to use the residuals of the regression when making isoscapes (Hobson et al., 2012; Cryan et al., 2014).
Creating isoscapes that align with the growth period of each shell sample is vital to support the accurate assignments of geographic origin with the highest resolution, especially in coastal areas where SSS and SST may change rapidly. Natural variation in barnacle growth rates could also potentially result in incorrect date assignments. However, given the age estimate suggested that the barnacle sampled here started growing after the satellite tag was applied (passing the “logic test”), and provided seemingly robust relationships between barnacle shell isotopes, SSS, and SST, that are consistent with previous work, we therefore suggest that our dating process is sufficiently accurate in this case.
Applying this framework in other regions may be possible in multiple ways, with appropriate validation needed to provide insight into the accuracy of each approach. The direct approach will be the most useful in regions with a paucity of knowledge about in-water isotope values and their relationship with SSS. In regions where the relationship between SSS and δ18Osw values is well established, however, it may be possible to apply and individually validate, each approach by testing whether isoscapes generated are providing an accurate depiction of the location of known-origin host animals.
The resolution to which origins are able to be identified will vary throughout the world based on SSS and SST spatio-temporal dynamics. In the study region, for example, we would expect only moderate resolutions to be achievable because there is a relatively moderate gradient in SST and SSS across space and time when compared with other regions globally (Pearson et al., 2020). Temperate latitudes and areas nearby large freshwater inputs (e.g., near the mouth of the Amazon river) are likely to provide finer spatial resolution than the coastal areas of Western Australia, due to large differences in SSS and/or SST across relatively small spatial scales (Pearson et al., 2020). Similarly, vast areas of open ocean are likely to provide very low resolution due to broad similarities in physico-chemical properties (Pearson et al., 2020).
Conclusion
The results of this study defined the relationship between stable isotopes in barnacle shell and the environmental conditions under which the shell was formed in the northern coastal waters of Western Australia. These relationships fill important gaps in the understanding of stable isotope dynamics (for both barnacle carbonate and seawater), especially in this region. These newly defined relationships have allowed δ13C isoscapes for barnacle shell to be produced for the first time and provided more robust δ18O isoscapes calculated from remotely available input data in a simplified way. It was previously difficult to predict temporal variation in barnacle isotopes in regions where this relationship was unknown (Detjen et al., 2015; Pearson et al., 2020), predominantly away from the tropics and NW Atlantic extra-tropics. While further validation with independent samples is still needed, our findings improve understanding of the spatial and temporal variation that can be expected in both δ13C and δ18O values in barnacle shells.
The simplified model presented for δ18O values in barnacle shell, which does not require direct knowledge of δ18Osw values, made it possible to create time-specific isoscapes from remotely collected temperature and salinity data. This study also provides a framework that can be applied directly to understand the movement of hosts carrying balanomorph barnacles or replicated to generate similar models that will be useful in other regions. This framework, with appropriate validation, could also be applied to other barnacle species, alongside sufficient knowledge of the rate of shell formation, to understand the movement of any animal or object that carries hitchhiking barnacles through marine waters.
Data Availability Statement
The datasets generated for this study are available on request to the corresponding author.
Ethics Statement
Ethical review and approval was not required for this animal study because the target animals sampled were invertebrates (barnacles). The barnacle samples were opportunistically collected from a sea turtle host by members in a separate project (Gnaraloo wilderness foundation) that was focused on satellite tracking sea turtles. The satellite tracking project was conducted under a Regulation 17 license issued by DPaW under the Wildlife Conservation Act 1950 (WA), but was not in the domain of any of the authors of this current study.
Author Contributions
RP, RC, and JM contributed to the conception and design of the study. RP completed the laboratory sampling, performed the statistical analysis, organized the database, and wrote the first draft of the manuscript. MG completed the isotope analyses. All authors contributed to the article and approved the submitted version.
Funding
This work was partially supported by the Jill Landsberg Trust Fund Scholarship, awarded to RP by the Ecological Society of Australia.
Conflict of Interest
The authors declare that the research was conducted in the absence of any commercial or financial relationships that could be construed as a potential conflict of interest.
Acknowledgments
We thank Karen Hattingh, Aub Strydom, the Gnaraloo Turtle Conservation Program and the Gnaraloo Wilderness Foundation for organizing and providing access to the satellite telemetry data used in this study and Joan Cowley, Heather Scott-Gagan and Joe Cali for technical support in the RSES Stable Isotope Laboratory.
Supplementary Material
The Supplementary Material for this article can be found online at: https://www.frontiersin.org/articles/10.3389/fmars.2020.00596/full#supplementary-material
References
Brand, U., Azmy, K., Bitner, M. A., Logan, A., Zuschin, M., Came, R., et al. (2013). Oxygen isotopes and MgCO3 in brachiopod calcite and a new paleotemperature equation. Chem. Geol. 359, 23–31. doi: 10.1016/j.chemgeo.2013.09.014
Brassington, G., Freeman, J., Huang, X., Alves, O., Pugh, T., and Oke, P. (2012). Ocean Model, Analysis and Prediction System: Version 2.
Coffee, O., Booth, D., Thia, J., and Limpus, C. (2020). When isotopes fail: importance of satellite telemetry and multi-site validation when estimating the foraging grounds of migratory species. Mar. Ecol. Prog. Ser. 633, 197–206. doi: 10.3354/meps13179
Cryan, P. M., Stricker, C. A., and Wunder, M. B. (2014). Continental-scale, seasonal movements of a heterothermic migratory tree bat. Ecol. Appl. 24, 602–616. doi: 10.1890/13-0752.1
Detjen, M., Sterling, E., and Gómez, A. (2015). Stable isotopes in barnacles as a tool to understand green sea turtle (Chelonia mydas) regional movement patterns. Biogeosciences 12, 7081–7086. doi: 10.5194/bg-12-7081-2015
Devereux, I. (1967). Temperature measurements from oxygen isotope ratios of fish otoliths. Science 155, 1684–1685. doi: 10.1126/science.155.3770.1684
Doell, S. A., Connolly, R. M., Limpus, C. J., Pearson, R. M., and van de Merwe, J. P. (2017). Using growth rates to estimate age of the sea turtle barnacle Chelonibia testudinaria. Mar. Biol. 164:222.
Epstein, S., Buchsbaum, R., Lowenstam, H. A., and Urey, H. C. (1953). Revised carbonate-water isotopic temperature scale. Geol. Soc. Am. Bull. 64, 1315–1326.
Erez, J., and Luz, B. (1983). Experimental paleotemperature equation for planktonic foraminifera. Geochim. Cosmochim. Acta 47, 1025–1031. doi: 10.1016/0016-7037(83)90232-6
Espinasse, B., Hunt, B. P., Batten, S. D., and Pakhomov, E. A. (2019). Defining isoscapes in the Northeast Pacific as an index of ocean productivity. Glob. Ecol. Biogeogr. 29, 246–261. doi: 10.1111/geb.13022
Fleming, A. H., Kellar, N. M., Allen, C. D., and Kurle, C. M. (2018). The utility of combining stable isotope and hormone analyses in marine megafauna research. Front. Mar. Sci. 5:338. doi: 10.3389/fmars.2018.00338
Gagan, M. K., Ayliffe, L. K., Hopley, D., Cali, J. A., Mortimer, G. E., Chappell, J., et al. (1998). Temperature and surface-ocean water balance of the mid-Holocene tropical western Pacific. Science 279, 1014–1018. doi: 10.1126/science.279.5353.1014
Gillikin, D. P., Lorrain, A., Bouillon, S., Willenz, P., and Dehairs, F. (2006). Stable carbon isotopic composition of Mytilus edulis shells: relation to metabolism, salinity, δ 13 C DIC and phytoplankton. Organ. Geochem. 37, 1371–1382. doi: 10.1016/j.orggeochem.2006.03.008
Hobson, K. A., Van Wilgenburg, S. L., Wassenaar, L. I., and Larson, K. (2012). Linking hydrogen (δ 2H) isotopes in feathers and precipitation: sources of variance and consequences for assignment to isoscapes. PLoS One 7:e35137. doi: 10.1371/journal.pone.0035137
Hughes, C. E., and Crawford, J. (2012). A new precipitation weighted method for determining the meteoric water line for hydrological applications demonstrated using Australian and global GNIP data. J. Hydrol. 464, 344–351. doi: 10.1016/j.jhydrol.2012.07.029
IMOS (2016). IMOS - SRS Satellite - SST L3S - 06 Day Composite - Day and Night Time Composite. Available online at: https://portal.aodn.org.au (accessed September 12, 2017).
Killingley, J. (1980). Migrations of California gray whales tracked by oxygen-18 variations in their epizoic barnacles. Science 207, 759–760. doi: 10.1126/science.207.4432.759
Killingley, J., and Newman, W. (1982). O-18 fractionation in barnacle calcite - a barnacle paleotemperature equation. J. Mar. Res. 40, 893–902.
Killingley, J. S., and Berger, W. H. (1979). Stable isotopes in a mollusk shell: detection of upwelling events. Science 205, 186–188. doi: 10.1126/science.205.4402.186
Killingley, J. S., and Lutcavage, M. (1983). Loggerhead turtle movements reconstructed from 18O and 13C profiles from commensal barnacle shells. Estua. Coast. Shelf Sci. 16, 345–349. doi: 10.1016/0272-7714(83)90152-x
Marcus, L., Virtue, P., Nichols, P. D., Ferreira, L. C., Pethybridge, H., and Meekan, M. G. (2019). Stable isotope analysis of dermis and the foraging behavior of whale sharks at Ningaloo reef, Western Australia. Front. Mar. Sci. 6:546. doi: 10.3389/fmars.2019.00546
Mazor, T., Beger, M., Mcgowan, J., Possingham, H. P., and Kark, S. (2016). The value of migration information for conservation prioritization of sea turtles in the Mediterranean. Glob. Ecol. Biogeogr. 25, 540–552. doi: 10.1111/geb.12434
Munksgaard, N. C., Kurita, N., Sánchez-Murillo, R., Ahmed, N., Araguas, L., Balachew, D. L., et al. (2019). Data descriptor: daily observations of stable isotope ratios of rainfall in the tropics. Sci. Rep. 9, 1–7.
Pearson, R. M., van de Merwe, J. P., and Connolly, R. M. (2020). Global oxygen isoscapes for barnacle shells: application for tracing movement in oceans. Sci. Tot. Environ. 705, 1–9.
Pearson, R. M., van de Merwe, J. P., Gagan, M. K., Limpus, C. J., and Connolly, R. M. (2019). Distinguishing between sea turtle foraging areas using stable isotopes from commensal barnacle shells. Sci. Rep. 9:6565.
Pearson, R. M., van de Merwe, J. P., Limpus, C. J., and Connolly, R. M. (2017). Realignment of sea turtle isotope studies needed to match conservation priorities. Mar. Ecol. Prog. Ser. 583, 259–271. doi: 10.3354/meps12353
Peavey, L. E., Popp, B. N., Pitman, R. L., Gaines, S. D., Arthur, K. E., Kelez, S., et al. (2017). Opportunism on the high seas: foraging ecology of olive ridley turtles in the eastern Pacific ocean. Front. Mar. Sci. 4:348. doi: 10.3389/fmars.2017.00348
Reddin, C. J., Kocsis, ÁT., and Kiessling, W. (2018). Marine invertebrate migrations trace climate change over 450 million years. Glob. Ecol. Biogeogr. 27, 704–713. doi: 10.1111/geb.12732
Schmidt, G. A., Legrande, A. N., and Hoffmann, G. (2007). Water isotope expressions of intrinsic and forced variability in a coupled ocean-atmosphere model. J. Geophys. Res. Atmosp. 112:D10103.
Scott, R., Hodgson, D. J., Witt, M. J., Coyne, M. S., Adnyana, W., Blumenthal, J. M., et al. (2012). Global analysis of satellite tracking data shows that adult green turtles are significantly aggregated in Marine Protected Areas. Glob. Ecol. Biogeogr. 21, 1053–1061. doi: 10.1111/j.1466-8238.2011.00757.x
Sloan, K., Zardus, J. D., and Jones, M. L. (2014). Substratum fidelity and early growth in Chelonibia testudinaria, a turtle barnacle especially common on debilitated loggerhead (Caretta caretta) sea turtles. Bull. Mar. Sci. 90, 581–597. doi: 10.5343/bms.2013.1033
Taylor, L. D., O’dea, A., Bralower, T. J., and Finnegan, S. (2019). Isotopes from fossil coronulid barnacle shells record evidence of migration in multiple Pleistocene whale populations. Proc. Natl. Acad. Sci. U.S.A. 116, 7377–7381. doi: 10.1073/pnas.1808759116
Trueman, C. N., Mackenzie, K., and Palmer, M. (2012). Identifying migrations in marine fishes through stable-isotope analysis. J. Fish Biol. 81, 826–847. doi: 10.1111/j.1095-8649.2012.03361.x
Urey, H. C. (1948). Oxygen isotopes in nature and in the laboratory. Science 108, 489–496. doi: 10.1126/science.108.2810.489
Vander Zanden, H. B., Bolten, A. B., Tucker, A. D., Hart, K. M., Lamont, M. M., Fujisaki, I., et al. (2016). Biomarkers reveal sea turtles remained in oiled areas following the Deepwater Horizon oil spill. Ecol. Appl. 26, 2145–2155. doi: 10.1002/eap.1366
Keywords: Chelonibia, cirripedia, conservation, isotope, migration, movement, satellite telemetry, sea turtle
Citation: Pearson RM, van de Merwe JP, Gagan MK and Connolly RM (2020) Unique Post-telemetry Recapture Enables Development of Multi-Element Isoscapes From Barnacle Shell for Retracing Host Movement. Front. Mar. Sci. 7:596. doi: 10.3389/fmars.2020.00596
Received: 22 January 2020; Accepted: 29 June 2020;
Published: 16 July 2020.
Edited by:
Jeffrey C. Mangel, Prodelphinus, PeruReviewed by:
Hannah B. Vander Zanden, United States Geological Survey (USGS), United StatesMariela Pajuelo, Thompson Earth Systems Institute, University of Florida, United States
Copyright © 2020 Pearson, van de Merwe, Gagan and Connolly. This is an open-access article distributed under the terms of the Creative Commons Attribution License (CC BY). The use, distribution or reproduction in other forums is permitted, provided the original author(s) and the copyright owner(s) are credited and that the original publication in this journal is cited, in accordance with accepted academic practice. No use, distribution or reproduction is permitted which does not comply with these terms.
*Correspondence: Ryan M. Pearson, ci5wZWFyc29uQGdyaWZmaXRoLmVkdS5hdQ==