 Sandra Rybicki
 Katell G. Hamon
 Sarah Simons
 Axel Temming3
- 1Institute of Sea Fisheries, Johann Heinrich von Thünen Institute, Bremerhaven, Germany
- 2Wageningen Economic Research, Wageningen, Netherlands
- 3Institute of Marine Ecosystem and Fishery Science, University of Hamburg, Hamburg, Germany
Environmental, political, and economic conditions influence fishermen’s decisions, which in turn have consequences on the profitability of fishing fleets. We applied the bio-economic model FishRent to understand the response of eight fleets operating in the Northeast Atlantic mackerel and North Sea autumn spawning herring fishery to a number of scenarios, including changes in recruitment, the quota allocation key, and disruptions in fish and fuel prices. In all scenarios, both the Irish and German fleets were close to the break-even point, making them more vulnerable to additional disturbances than other fleets. Yet, these events are expected to occur simultaneously and a larger margin between costs and revenue would enhance the fleets resilience. The replacement of the historical quota allocation key to countries by an allocation according to biomass distribution negatively affected the German fleet most (−450% profitable within 1 year from 2020 to 2021), followed by the Dutch and Danish fleets (−175% profitable on average among those fleets), while the United Kingdom and Ireland increased their profitability by more than 250%. The differences among fleets highlights the sensitivity of a historical allocation key revision. In case of a continued herring recruitment failure, the profitability of most fleets targeting herring decreased but none of the fleets had to disinvest. Declines in fish prices (16% for frozen mackerel and herring, 81% for fresh herring, and 105% for fresh mackerel on average) and increases in fuel prices (17% on average) forced the United Kingdom, Icelandic, and large-scale (>40 m) Irish fleets to reduce their number of vessels by up to 40%.
Introduction
It is well established that many aspects, such as changes in the environment, economy and political decisions, influence the behavior of fishermen and hence the profitability of fleets (e.g., Pascoe et al., 2008; Hamon et al., 2014; Maynou et al., 2014; Bartelings et al., 2015; Spijkers and Boonstra, 2017). The pelagic fisheries for Northeast Atlantic (NEA) mackerel and North Sea autumn spawning (NSAS) herring have very high economic value in the European (EU) pelagic fishery sector, i.e., 21% (herring) and 32% (mackerel) of total value (pelagic EU fleets, average of 2013–2017; Scientific, Technical, and Economic Committee for Fisheries [STECF], 2019). Hence, they are listed as the most important species in terms of landed weight and are within the top five species regarding landed value (Scientific, Technical, and Economic Committee for Fisheries [STECF], 2018). Moreover, the EU pelagic sector employed 23% of fishermen on average from 2012 to 2016 (Scientific, Technical, and Economic Committee for Fisheries [STECF], 2019). For job security reasons as well as the growing demand for food with increasing human population, it is important to evaluate the magnitude of current environmental, economic and political changes.
In case of NSAS herring, for example, continued low recruitment is expected to have a large impact on the corresponding fisheries and their economic performance. Recent low recruitment has occurred, despite high biomass levels (e.g., Nash et al., 2009; ICES, 2018b). Two main causes are suggested for this problem: (a) A shift in the planktonic community of the North Sea due to oceanic climate changes, which results in less food availability and suitability impairing the survival of young NSAS herring larvae (Gröger et al., 2009; Payne et al., 2009), and (b) Changes in the physical environment, such as increasing bottom-water temperatures close to the main spawning areas, affecting the development times and metabolic rates of herring larvae (e.g., Nash and Dickey-Collas, 2005; Corten, 2013).
In addition to low recruitment, recent changes in biomass distribution caused problems regarding access rights in the NEA. Currently, total allowable catches (TACs) are partitioned among EU countries by applying a fixed allocation key called the “relative stability.” It was defined based on three principles: (1) Traditional fishing activities between 1973 and 1978, (2) the establishment of Exclusive Economic Zones (EEZs) and the corresponding loss of potential fishing grounds in third countries’ waters, and (3) the enlargement of the EU, which involved prioritizing countries particularly dependent on fisheries (Hoefnagel et al., 2015; Penas Lado, 2016; Sobrino and Sobrido, 2017). Every year, EU countries receive a fixed share of the EU quotas based on the stock-specific relative stability, then quotas are swapped within the EU in order to match the expected catch. The increased usage of quota swaps is already a sign of economic interests not being entirely met (Hoefnagel et al., 2015; Penas Lado, 2016; Hoefnagel and de Vos, 2017). The growing problem is, however, that several conditions have changed over time: new fishing strategies, changes in demand, the evolution of fleets, and changes in stock productivity and their distribution (Sobrino and Sobrido, 2017). In the case of NSAS herring, most of the biomass occurs in the United Kingdom EEZ during the main fishing season in autumn and winter. This causes questions regarding access rights and represents a major topic in discussions about Brexit (Doering et al., 2017). These factors do not only affect members of the EU. The NEA mackerel stock was noticed to shift and/or expand to the North-west since approximately 2007 (Astthorsson et al., 2012; Bruge et al., 2016; ICES, 2018c). Since 2012, mackerel catch off Iceland and Greenland increased significantly (Hannesson, 2013). In 2014, the EU, Norway, and the Faroe Islands agreed on a joint management strategy for 2015 and the subsequent 5 years, which Iceland and Greenland did not join yet (ICES, 2018c). These are all indications that access rights and the relative stability principle might need to be reconsidered by, for example, matching the changing biological dynamics. For the respective pelagic fisheries, altering the relative stability principle might be substantial.
Furthermore, fish and fuel prices have a great impact on fleet profitability and large year-to-year differences are common. Influenced by a number of causes (e.g., natural disasters, political disputes, and overfishing) price shocks may be a result. In recent years, political decisions also had an impact on fish prices. After the Brexit vote, the pound dropped in 2016 and 2017 affecting the exchange rate and fish prices in general (Scientific, Technical, and Economic Committee for Fisheries [STECF], 2018). Currently, European fish prices increased, especially in case of herring (EUMOFA, 2018). This trend started in 2014 and by 2017, they had reached 10% higher prices than in 2013. Between 2009 and 2014, during the NEA mackerel “war,” Iceland joined into the mackerel fishery due to an increased abundance within their EEZ. This lead to a decrease in mackerel market prices as the catch volume increased drastically (Scientific, Technical, and Economic Committee for Fisheries [STECF], 2012; Jensen et al., 2015; EUMOFA, 2018). Yet, these shocks can not only affect fish but also fuel prices, which in turn have one of the largest effects on fleet profitability as fuel cost account for 15–22% of total costs. Additionally, a strategy “for a climate neutral Europe by 2050” was released in 2018 by the European Commission (EC) seeking innovation techniques that significantly reduce the greenhouse gas emissions by 80% in the time frame of 1991 to 2050 (European Commission, 2018). In case of the fishing industry a respective regulation is already in force since 2015, prohibiting fishing vessels to use crude oil in the Emission Control Areas (ECAs) and hence reducing the emission of sulfur oxides. This covers the EEZs of the North and Baltic Sea as well as of North America (Biermann et al., 2015). Additionally, a sulfur content reduction in marine fuels was enforced outside ECAs from January 1st 2020, only leaving the more expensive marine gasoil as compliant fuel option for European fleets (Kazokoglu and Jakštas, 2019).
Bio-economic models can be used to estimate the effects of the major sources of impacts to a fishery. Traditional bio-economic models are static and based on modeling fish populations solely as total biomass, disregarding reproductive success, age-specific growth, and catchability (Schaefer, 1954; Doll, 1988; Pan et al., 2007; Bjørndal and Munro, 2012; Tahvonen et al., 2013). Recently, dynamic age-structured bio-economic models were used as tools for fisheries management. They incorporate and integrate anthropogenic as well as natural processes to generate a better understanding of feedback mechanisms between the two systems (Bastardie et al., 2013; Tahvonen et al., 2013; Maynou et al., 2014; Simons et al., 2015; Pascoe et al., 2016; Nielsen et al., 2017; Da-Rocha et al., 2017). Equilibrium or “end-to-end” models such as Atlantis, Ecosim with Ecopath (EWE) or SMART, usually have an increased focus on the complexity of the whole ecosystem, including food webs, detailed functional groups and different human uses (e.g., Fulton et al., 2015; Wang et al., 2015; D’Andrea et al., 2020). In this study, we however apply the simulation and optimization model, FishRent, which is more focused on certain aspects of a system. It links an age-structured population model with highly resolved catch and effort data as well as the detailed cost structure of different fleets (Salz et al., 2011; Simons et al., 2015). It has been previously used to study the impact of different management measures on demersal European fleets (Bartelings et al., 2015; Simons et al., 2015). In this study, it was adopted and applied to the NEA mackerel and NSAS herring fishery concentrating on Danish, Dutch, German, Irish, United Kingdom, and Icelandic fleets. First, we compared the costs structure of those fleets in order to understand the underlying data and illustrate possible differences. With the support of the FishRent model, we then investigated the following factors with regard to their impact on the profitability of those eight fleets targeting the two focus species: (1) changes in recruitment, (2) a quota repartition key adaptation according to biomass distributions, and (3) variations in fish and fuel prices.
Materials and Methods
Model Description
FishRent includes the economics of multiple fleets (basic agent), the impact of fishing on stock development, and the temporal interplay between fleets and fish stocks (Salz et al., 2011; Simons et al., 2015; Figure 1). The model is written in the General Algebraic Modeling System (GAMS) and uses the CONOPT solver (for a detailed description see Drud, 1994) to calculate effort, maximizing the annual profit of a fishery given the current ecological, regulatory and economic conditions (Figure 1). To avoid unrealistic interannual variation of effort, future simulated effort of individual fleets may vary between a lower and upper limit set at 60% of historically observed total effort and historically observed maximal total effort per vessel (for more detail see Supplementary Table S3).
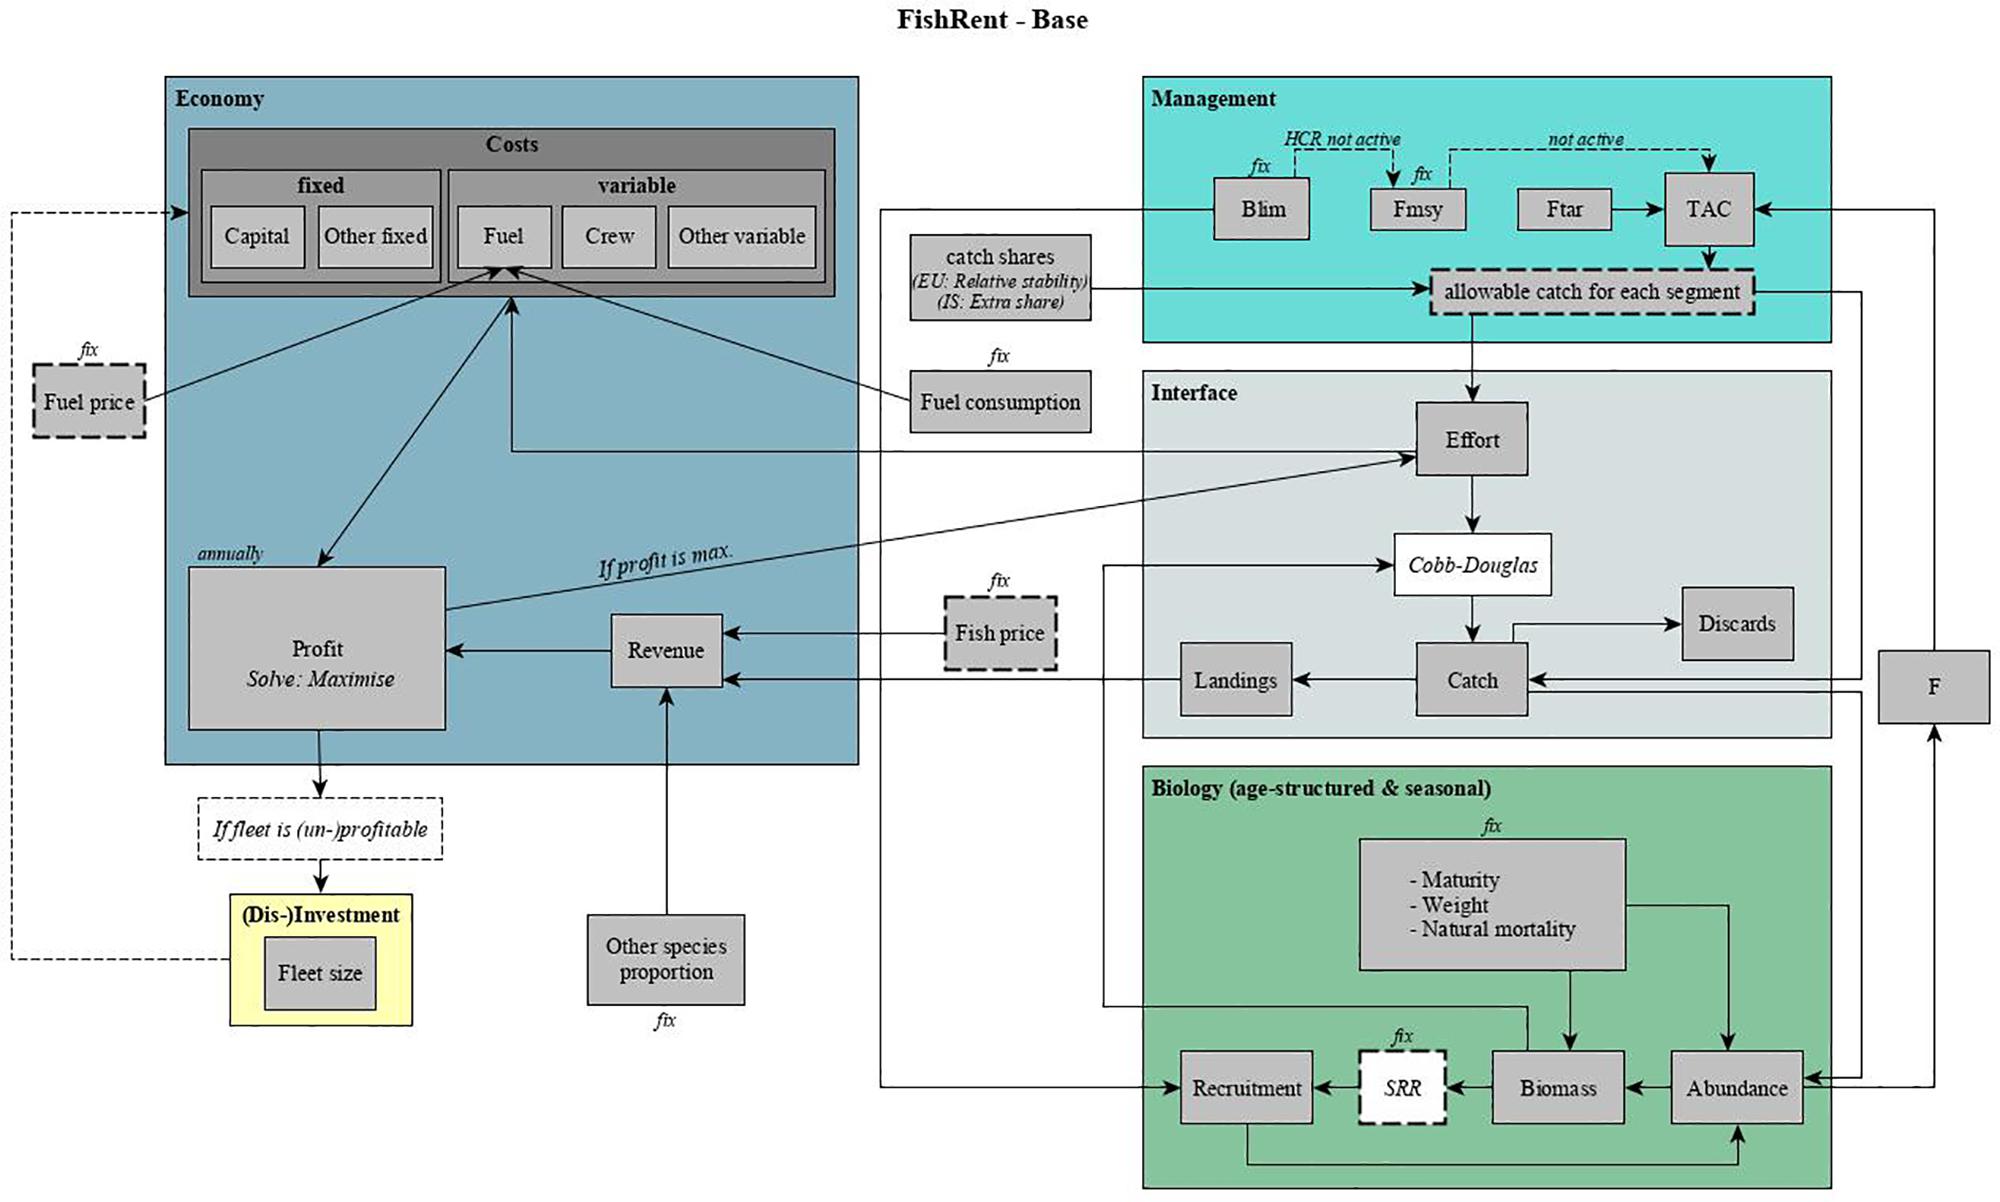
Figure 1. Schematic of the model process and the interaction between different sub-modules in FishRent. The effort is calculated until the maximum profit for all modeled fleet segments is estimated. This is used to calculate the catch by using the Cobb–Douglas production function, which has then an impact on the abundance, fishing mortality (F), biomass and, by applying and stock-recruitment relationship (SRR) function, recruitment calculation for the next time step. Boxes with bold dashed outlines signify parameters that were changed according to different scenarios.
Economy
The calculation of profitability includes: (1) revenue of fishing activities, (2) Capital and other fixed costs (e.g., insurance, administration, maintenance, accountancy costs, interest payments and annual depreciation costs), and (3) operating costs including fuel, crew, and other variable costs (e.g., income tax, expendables, landings, and sales costs) (Salz et al., 2011; Bartelings et al., 2015; Simons et al., 2015). Catch and fish prices determine revenue and effort, revenue and fuel price determine the operating costs (see Equations S1–S7 in Supplementary Material), whereas the number of active vessels sets the level of fixed costs. Discarding was not considered in this study since reported discards by pelagic fleets are usually extremely low. More information concerning parameter estimations can be found in Supplementary Material S2.
(Dis-)investment
Depending on the profitability of each fleet, fleet size can increase or decrease (in terms of number of vessels) after the first modeled year. If fleets are profitable, reach their effort capacity, and are below their maximum investment limit, they can invest into new vessels. If fleets are unprofitable, they are allowed to disinvest to a maximum of 10% per year.
Interface
The fishing effort as well as the total stock biomass are used in the Cobb–Douglas catch production function, which assumes a non-linear relationship between catch and effort as well as between catch and stock size (Equation 1; Frost et al., 2009).
where Ct,i,j is catch, ct,i,j is the catchability coefficient of ith age, and jth fleet at time t. Et,j is the fishing effort of jth fleet at time t, CBt,i is the biomass at ith age at time t, and α1j and β1j determine the degree of non-linearity in the relation of catch and effort for a given stock size (Salz et al., 2011; García et al., 2014). The application of the Cobb-Douglas function is of particular importance in case of pelagic fisheries, because fish usually form large schools and a non-linear relationship between effort and biomass levels in the catch is common (Frost et al., 2009; Cruz-Rivera et al., 2018). The settings of the two parameters α1 and β1 have a significant influence on the estimation of maximum profitability and the remaining results, which is why a sensitivity analysis of those parameters was performed (see Supplementary Material S2).
Biology
With the calculated catch, the number of individuals Nt,i is estimated using Pope’s approximation (Pope, 1972; Equation 2).
where wt,i is weight at age and sj is the catch share. Catch share is a multiplier that determines total catch, hence accounting for the remaining fishing mortality by fleets not included in the model. It is the proportion of each fleets catch from the TAC, also including Iceland, i.e., representing their quota shares (see Supplementary Table S4). The instantaneous natural mortality rate is represented by Mi. Both catch share and natural mortality are constant over time.
In addition, 1000 random stochastic iterations are computed while applying the stock-recruitment (SR) function in order to include a standard error for recruitment and SSB. Median recruitment and spawning stock biomass (SSB) values are then used for further calculations. For NEA mackerel the Beverton and Holt SR function was applied using all years available at the time of the study (1980–2016) (Beverton and Holt, 1957; Equation 3; Supplementary Table S1 and Supplementary Figure S2), because this showed the best fit to SR data (ICES, 2019a). For herring a restricted (Blim) hockey-stick SR function was chosen for years 2002–2016, following Payne et al. (2009) and ICES WKPELA (ICES, 2018a; Equation 4a and 4b; Supplementary Figure S3).
Else
The parameters α2, β2 and Blim are species specific (Table 1). D is a standard normal deviate and CV is the coefficient of variation (CV = standard deviation/mean), which was estimated based on historical stock sizes for herring from 2012 to 2016 and for NEA mackerel from 2012 to 2014 (ICES, 2018b, 2019a). At the end of each year, all individuals within one age class are transferred to the next and those older than the maximum age are aggregated in the last age class.
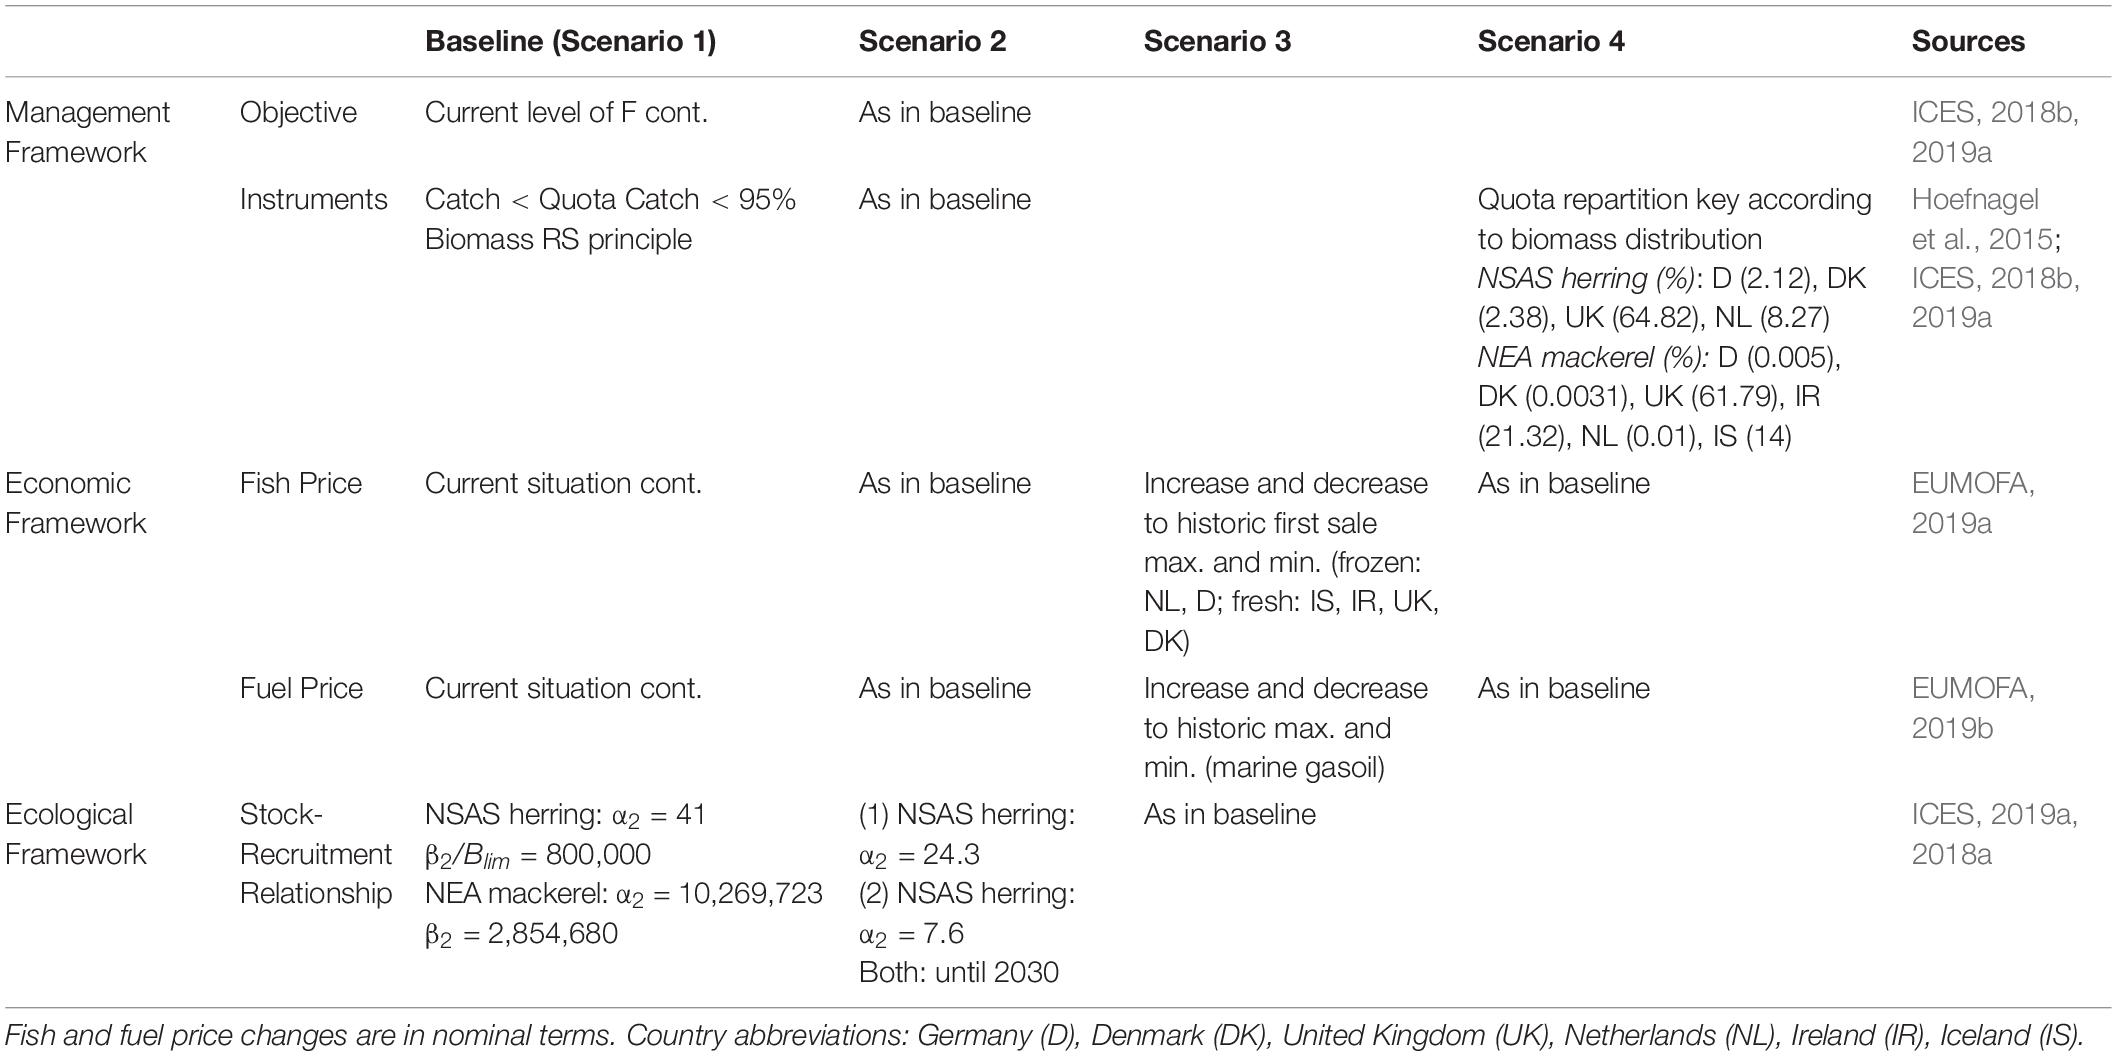
Table 1. Overview of the baseline scenario and the specific parameter changes for the three alternative scenarios.
Moreover, the age-specific fishing mortality Ft,i is calculated using the estimated number of individuals from before (Equation 5).
Management
Within the European Union, the TAC is now supposed to be set according to the MSY approach. Within the start years (average 2012–2014), fishing mortality (F) of mackerel was 32% higher than the advised Fmsy (ICES, 2019a). This is mainly due to the fact, that no internationally agreed quotas existed as well as no harvest control rules being active at this time, which still has not changed. As to NSAS herring, fishing mortality was on average 44% below the advised Fmsy since 2007 (ICES, 2018b). In the scenarios of this study, we decided to keep the level of the actual fishing mortalities by adding a multiplier (the average F/Fmsy ratio of the last eight years from 2008 onward) to the advised Fmsy (Equation 6).
Ftar is not age-class specific. Thus, in order to account for an age-structured stock, partial fishing mortalities at age (Ftact,i) are calculated by using the fishing mortality of the average age classes that are considered to be fully exploited in the assessments (; Equation 7).
Together with the natural mortality (Mi) a total mortality rate, called Ztact,i can be determined. These two parameters combined with the abundance and weight at age are used in the Baranov Catch equation in order to calculate a catch according to Ftar (Baranov, 1918; Supplementary Figure S4; Equation 8).
This is used as the new TAC on a species level for the next year. Ftar is not adjusted annually in any scenario, again due to the fact that for neither of the two species a harvest control rule is currently in place. In general, all fleets are not allowed to fish more than their quota, which is a fixed proportion (i.e., the previously introduced catch shares) of the TAC. This is an additional restriction to the effort limits wherein the model is allowed to operate. Moreover, total catch cannot be larger than 95% of the total biomass of the stock.
Data and Settings
FishRent was run for a period of 16 years (2014–2030) using five fleets (one Dutch, United Kingdom, and German as well as two Danish) targeting both NEA mackerel and NSAS herring directly and three fleets (one Icelandic and two Irish) exclusively targeting NEA mackerel (Figure 2). Only fleets where mackerel and herring constituted more than 25% of the total landings value for at least one of the two species were considered in the modeling approach. Fleets consist of multiple vessels and were classified by vessel length (vl in meters) using two categories ranging from 24 to 40 m and over 40 m as well as two predominant gear types [pelagic trawlers (TM) and purse seiners (PS)]. This uses the classification of the European data collection framework as implemented by the Scientific, Technical and Economic Committee for Fisheries (Scientific, Technical, and Economic Committee for Fisheries [STECF], 2018). Detailed economic data (e.g., costs, effort, profit etc.) was received directly from national labs, also averaged over the years 2012 to 2014. Although Norway is also a major fishing nation targeting NEA mackerel and NSAS herring, we did unfortunately not receive any data in the detail and resolution needed for the model.
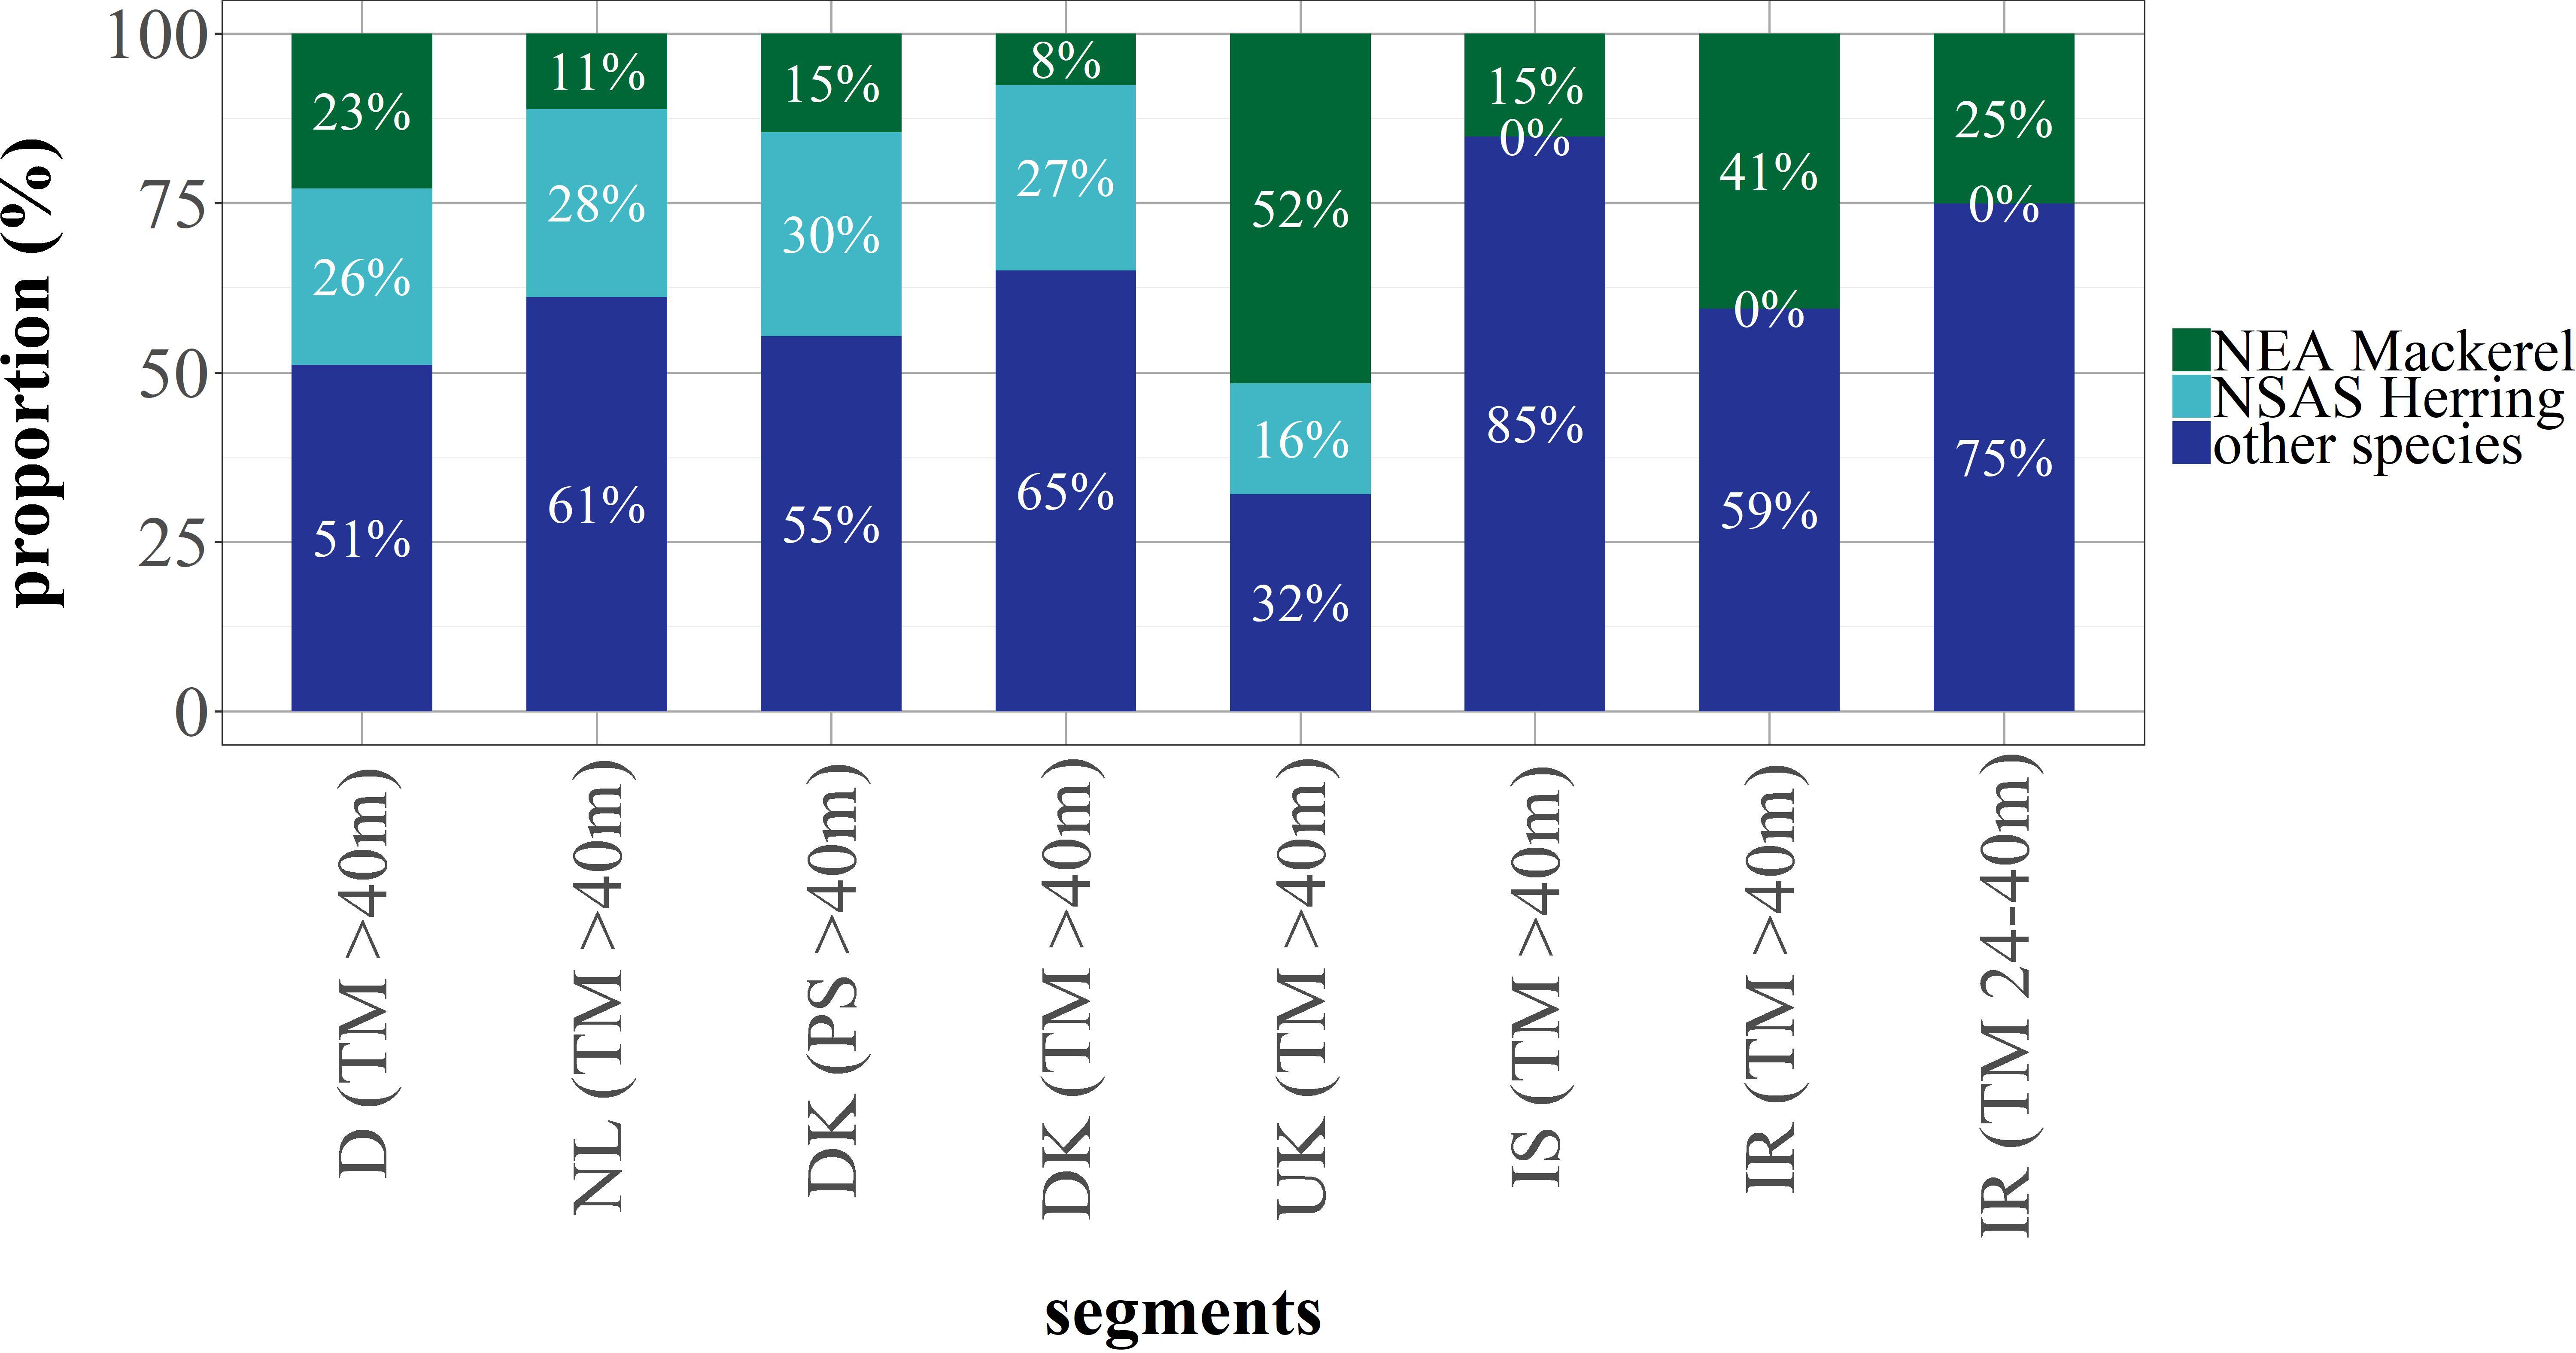
Figure 2. Catch composition of NSAS herring (%, light blue), NEA mackerel (%, green) and other species (%, dark blue) for the eight modeled fleets at the starting point (2014). The proportion of other species stays fixed throughout the model runs.
In order to set up the model, detailed biological data at age such as abundance, natural mortality and weight as well as spawning stock biomass (SSB) and recruitment was incorporated from the most recent stock assessments at the beginning of this study (ICES, 2018b, 2019a). Data for mackerel was however updated due a significant change in the scientific assessment at the beginning of 2019 (ICES, 2019a). In the new assessment, biological data was adjusted due to a different weighting procedure of three scientific surveys, which lead to the tagging data having a larger influence on the assessment results than before (ICES, 2019a). Hence, a much more positive perception of the population was estimated, also leading to an improved catch advice for the NEA mackerel stock. We used the default average of 3 years (2012–2014) as biological input for the starting year 2014. For NSAS herring, an average of 5 years (2012–2016) was chosen due to significant biological changes after 2014, especially in fishing mortality and weight at age (ICES, 2018b).
Scenarios
Scenario 1: The Baseline
In the baseline scenario, FishRent projects the optimal behavior of fishermen in order to maximize the fleets profitability for 16 years using current conditions of F, the quota repartition key, fish and fuel prices, and the SR relationships. It is the basis for the other scenarios (Table 1).
Scenario 2: Reduced Recruitment of NSAS Herring
As continued low recruitment of NSAS herring may have a large impact on the corresponding fisheries and their economic performance, different magnitudes of reduced recruitment were tested: (1) Extreme and (2) Medium. This was done by adjusting the density-independent parameter α2 (i.e., the amount of recruits per unit of biomass) in the SR relationship. For the extreme setting, the lowest historic recruitment-SSB-ratio observed since 2002 was determined, which occurred in 2003 (ICES, 2018b; Table 1). This is also the period considered in the SR relationship of the NSAS herring assessment. The resulting value of α2 = 7.6 was then used as a target for the final modeling year 2030. For the second (medium) setting, the mean between the current (α2 = 41) and the extreme was applied to be attained until 2030, which was α2 = 24.3 (Table 1).
Scenario 3: Fish and Fuel Price Variations
Fish and fuel prices and their effect on the fleets are hard to predict. In this study, historic first sale fish and marine gasoil price time-series data (2008–2016) were obtained from the European Market Observatory for Fisheries and Aquaculture Products (EUMOFA) data portal (EUMOFA, 2019a, b; Tables 1, 2). First sale price for fish was available for either fresh or frozen products. For the German and Dutch fleets, herring and mackerel first sale prices for frozen products were used, whereas for the remaining six fleets (Ireland, Iceland, United Kingdom, and Denmark) fresh first sale prices were incorporated. The information about the main processing type (fresh or frozen) being used by each fleet was also obtained from national labs. The most rapid change in price over the mentioned time period was identified for each focus species and fleet. This was, on average, a year-to-year change (EUMOFA, 2019a, b). Hence, historic price peaks and low points then replaced the original start values as a sudden, from year-to-year change from year 2020 onward (Tables 1, 2). This year was chosen as a reference year, as it marks a point where historic biological effects are less predominant, hence showing actual effects of the price alterations. Fish and fuel price scenarios were run separately as well as in combinations (e.g., low fish, high fuel price, and vice versa).
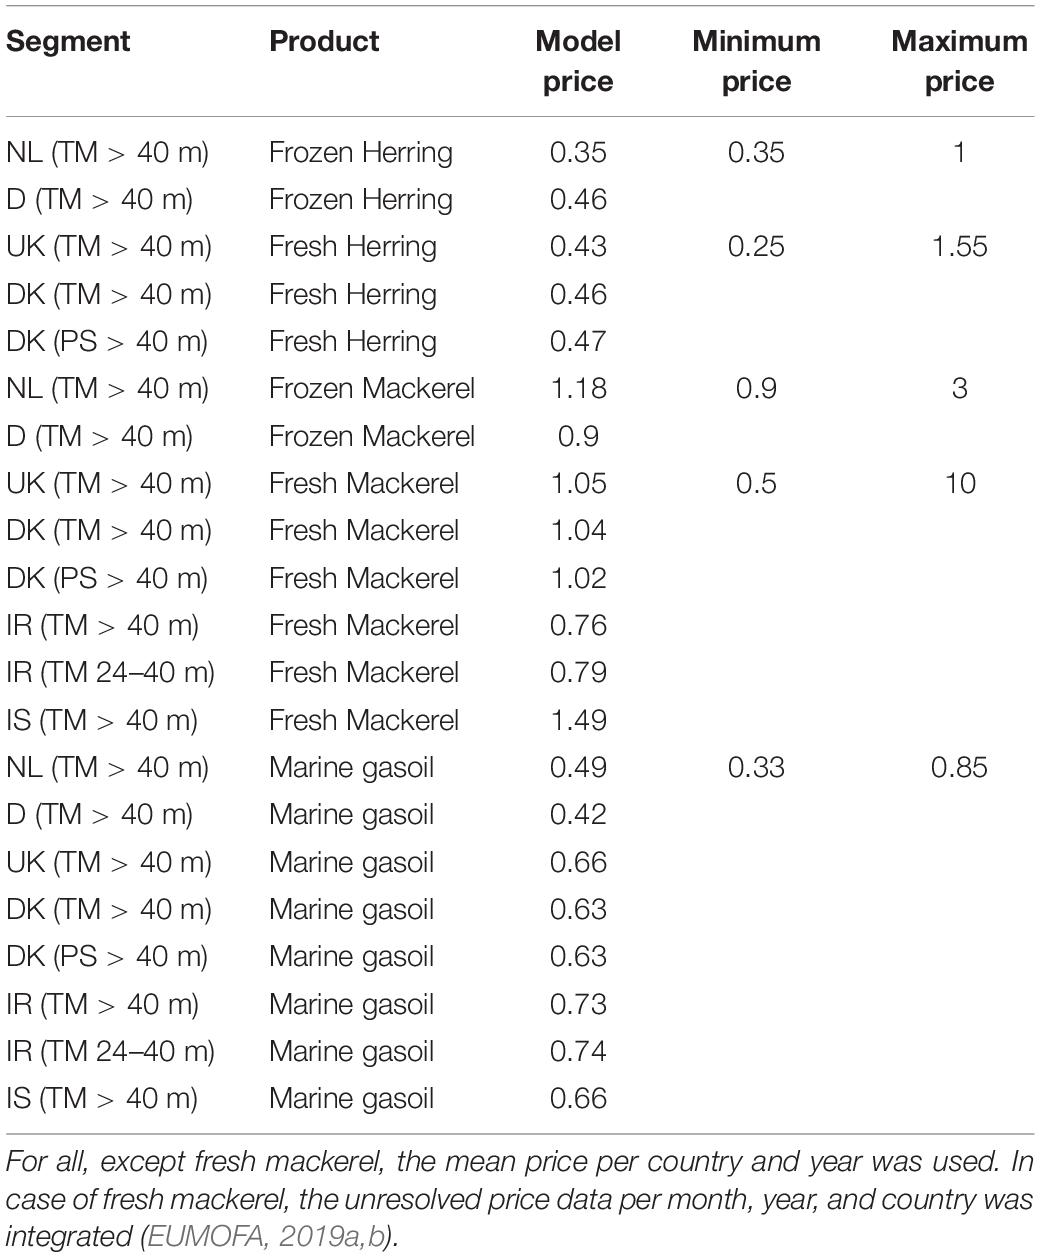
Table 2. Model prices for each fleet [fish prices (€kg–1): landings value divided by landings weight, fuel prices (€l–1): fuel price divided by fuel consumption] also shown are nominal historic prices (extremes) of first sale for fish (€kg–1) and marine gasoil (€l–1) in between 2008 and 2019.
Scenario 4: Adapting the Quota Repartition Key
An alternative approach other than the relative stability (RS) principle was employed, primarily reflecting political forcing such as Brexit or the “mackerel war” (Ørebech, 2013; European Parliament, 2017; Table 1). This was an attempt to adapt the quota repartition key to the current biomass distribution of both focus species. For this, two different approaches had to be used, one for each species. For NSAS herring, total biomass was calculated from abundance data in each ICES rectangle (mean 2012–2017) of the North Sea International Bottom Trawl Survey (NS-IBTS of the 3rd quarter; “CPUE per age and subarea” downloaded from DATRAS on the 10th of March 2019), which was standardized. Weight-at-age (kg) in the stock data (mean 2012–2017) from the HAWG Report (ICES, 2018b) was then applied to the standardized abundance-at-age data in order to obtain a standardized biomass within the North Sea area. The proportions of NSAS herring biomass in each EEZ of the modeled fleets were then determined by using a geospatial intersect operation in ArcGIS (Version 10.5.1) and were finally used as each fleets new quota repartition key (Figures 3, 4 and Table 1).
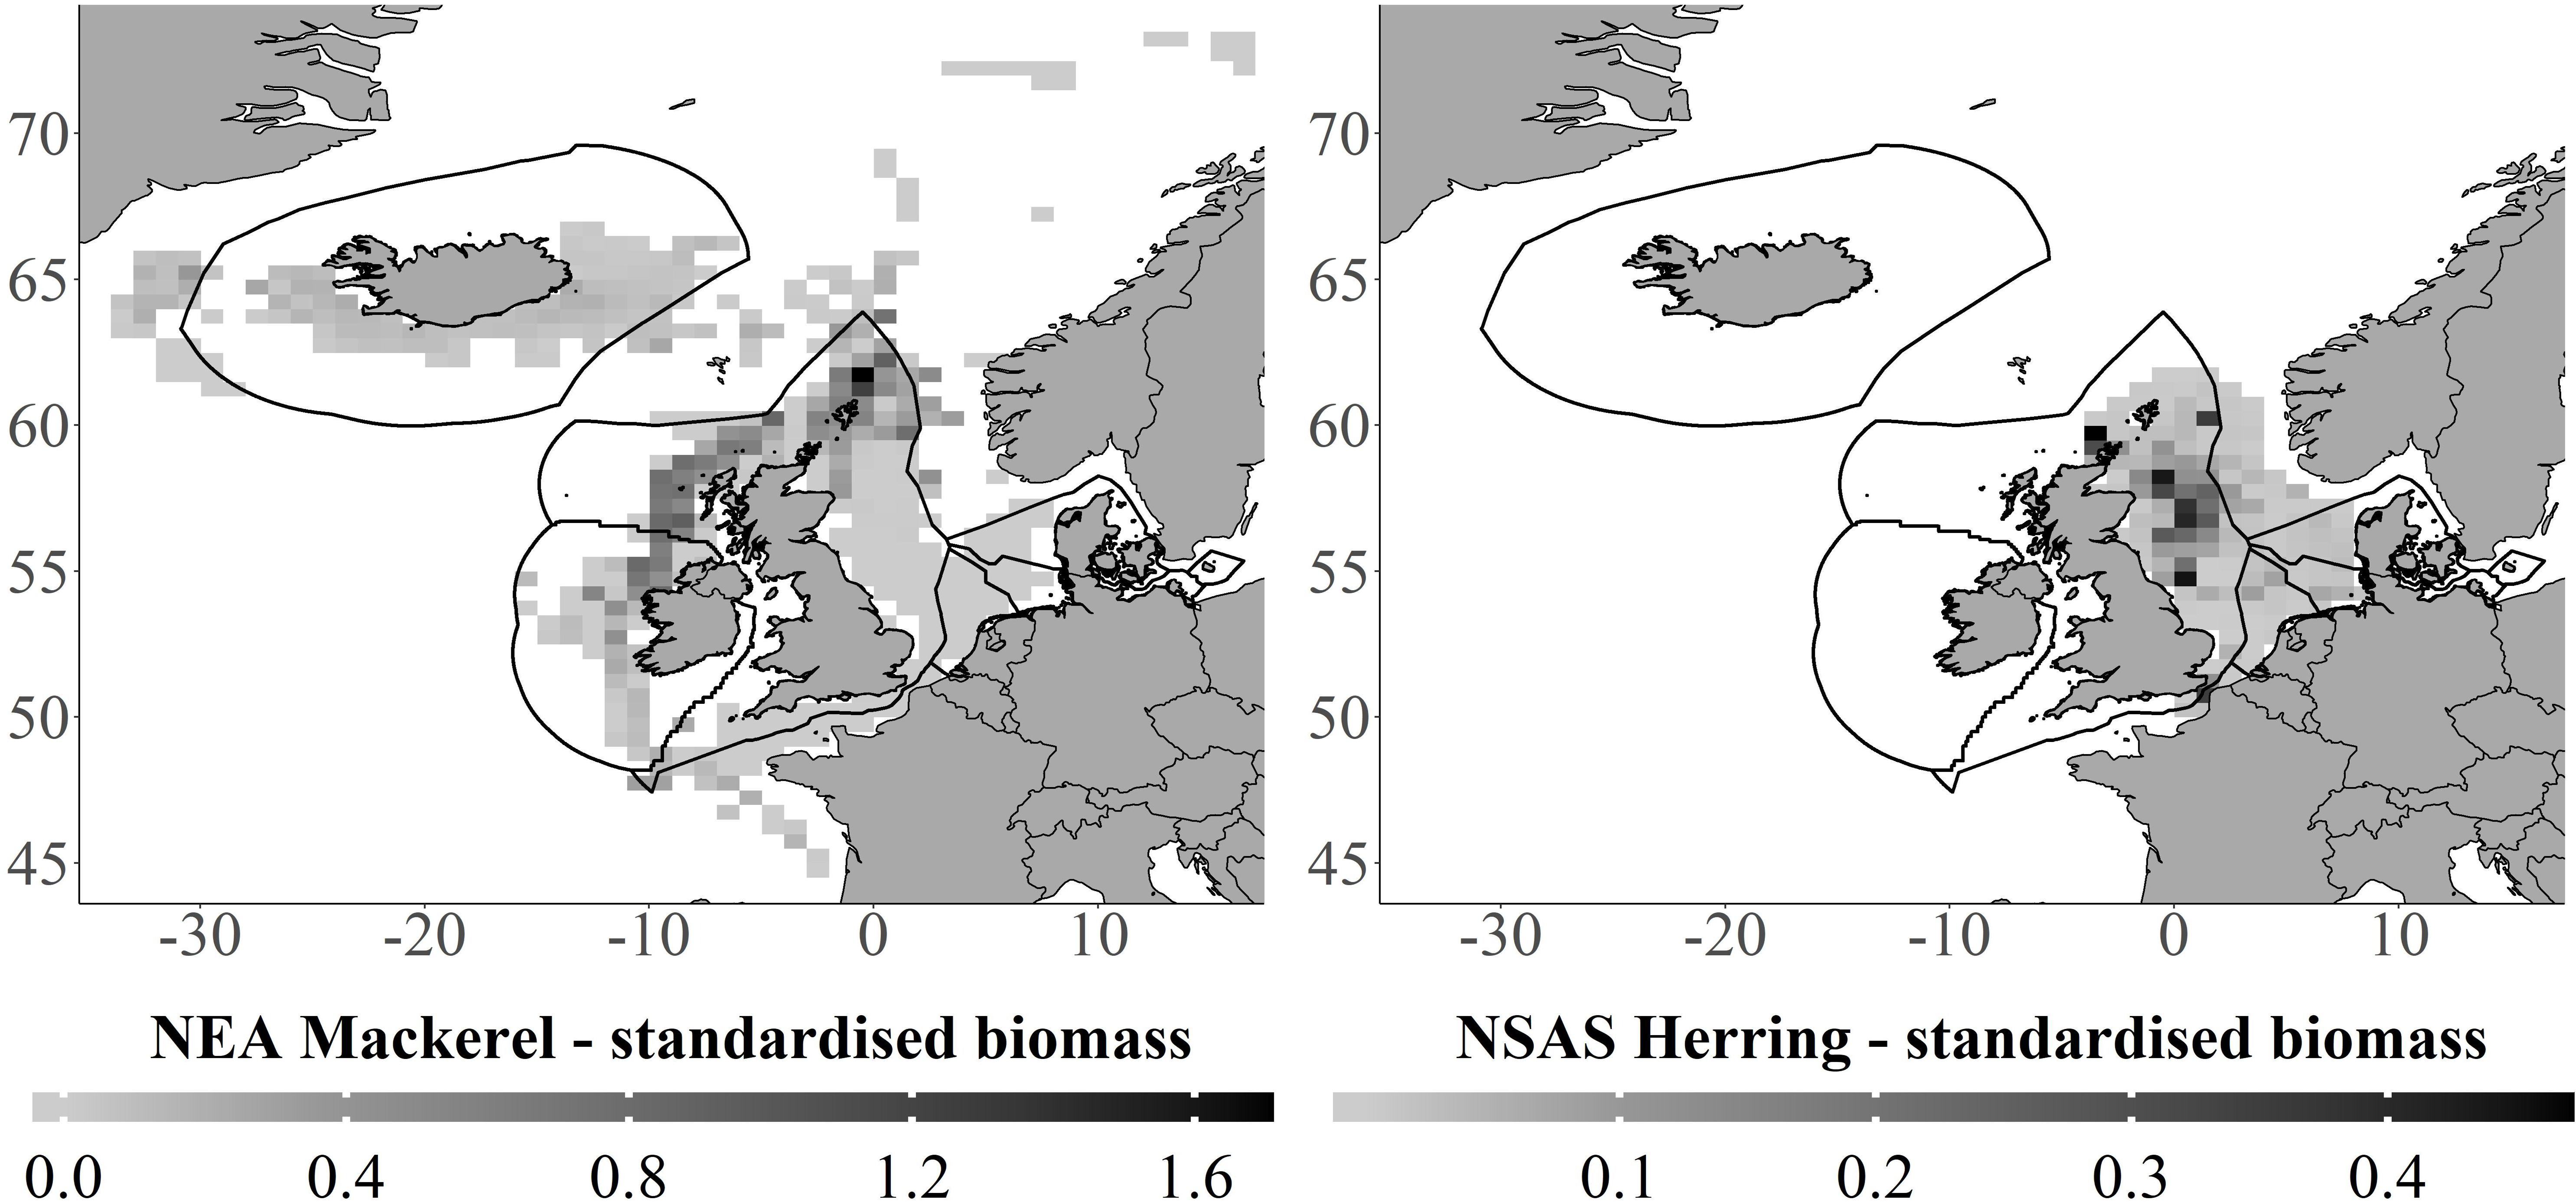
Figure 3. Standardized biomass: NSAS Herring (mean 2012–2017) calculated from the NS-IBTS (3rd quarter) standardized CPUE per age and subarea and NEA mackerel (mean 2012–2014) calculated from the standardized commercial CPUE of each modeled fleet segment. Shown are all age classes summarized (ICES, 2018b, 2019a).
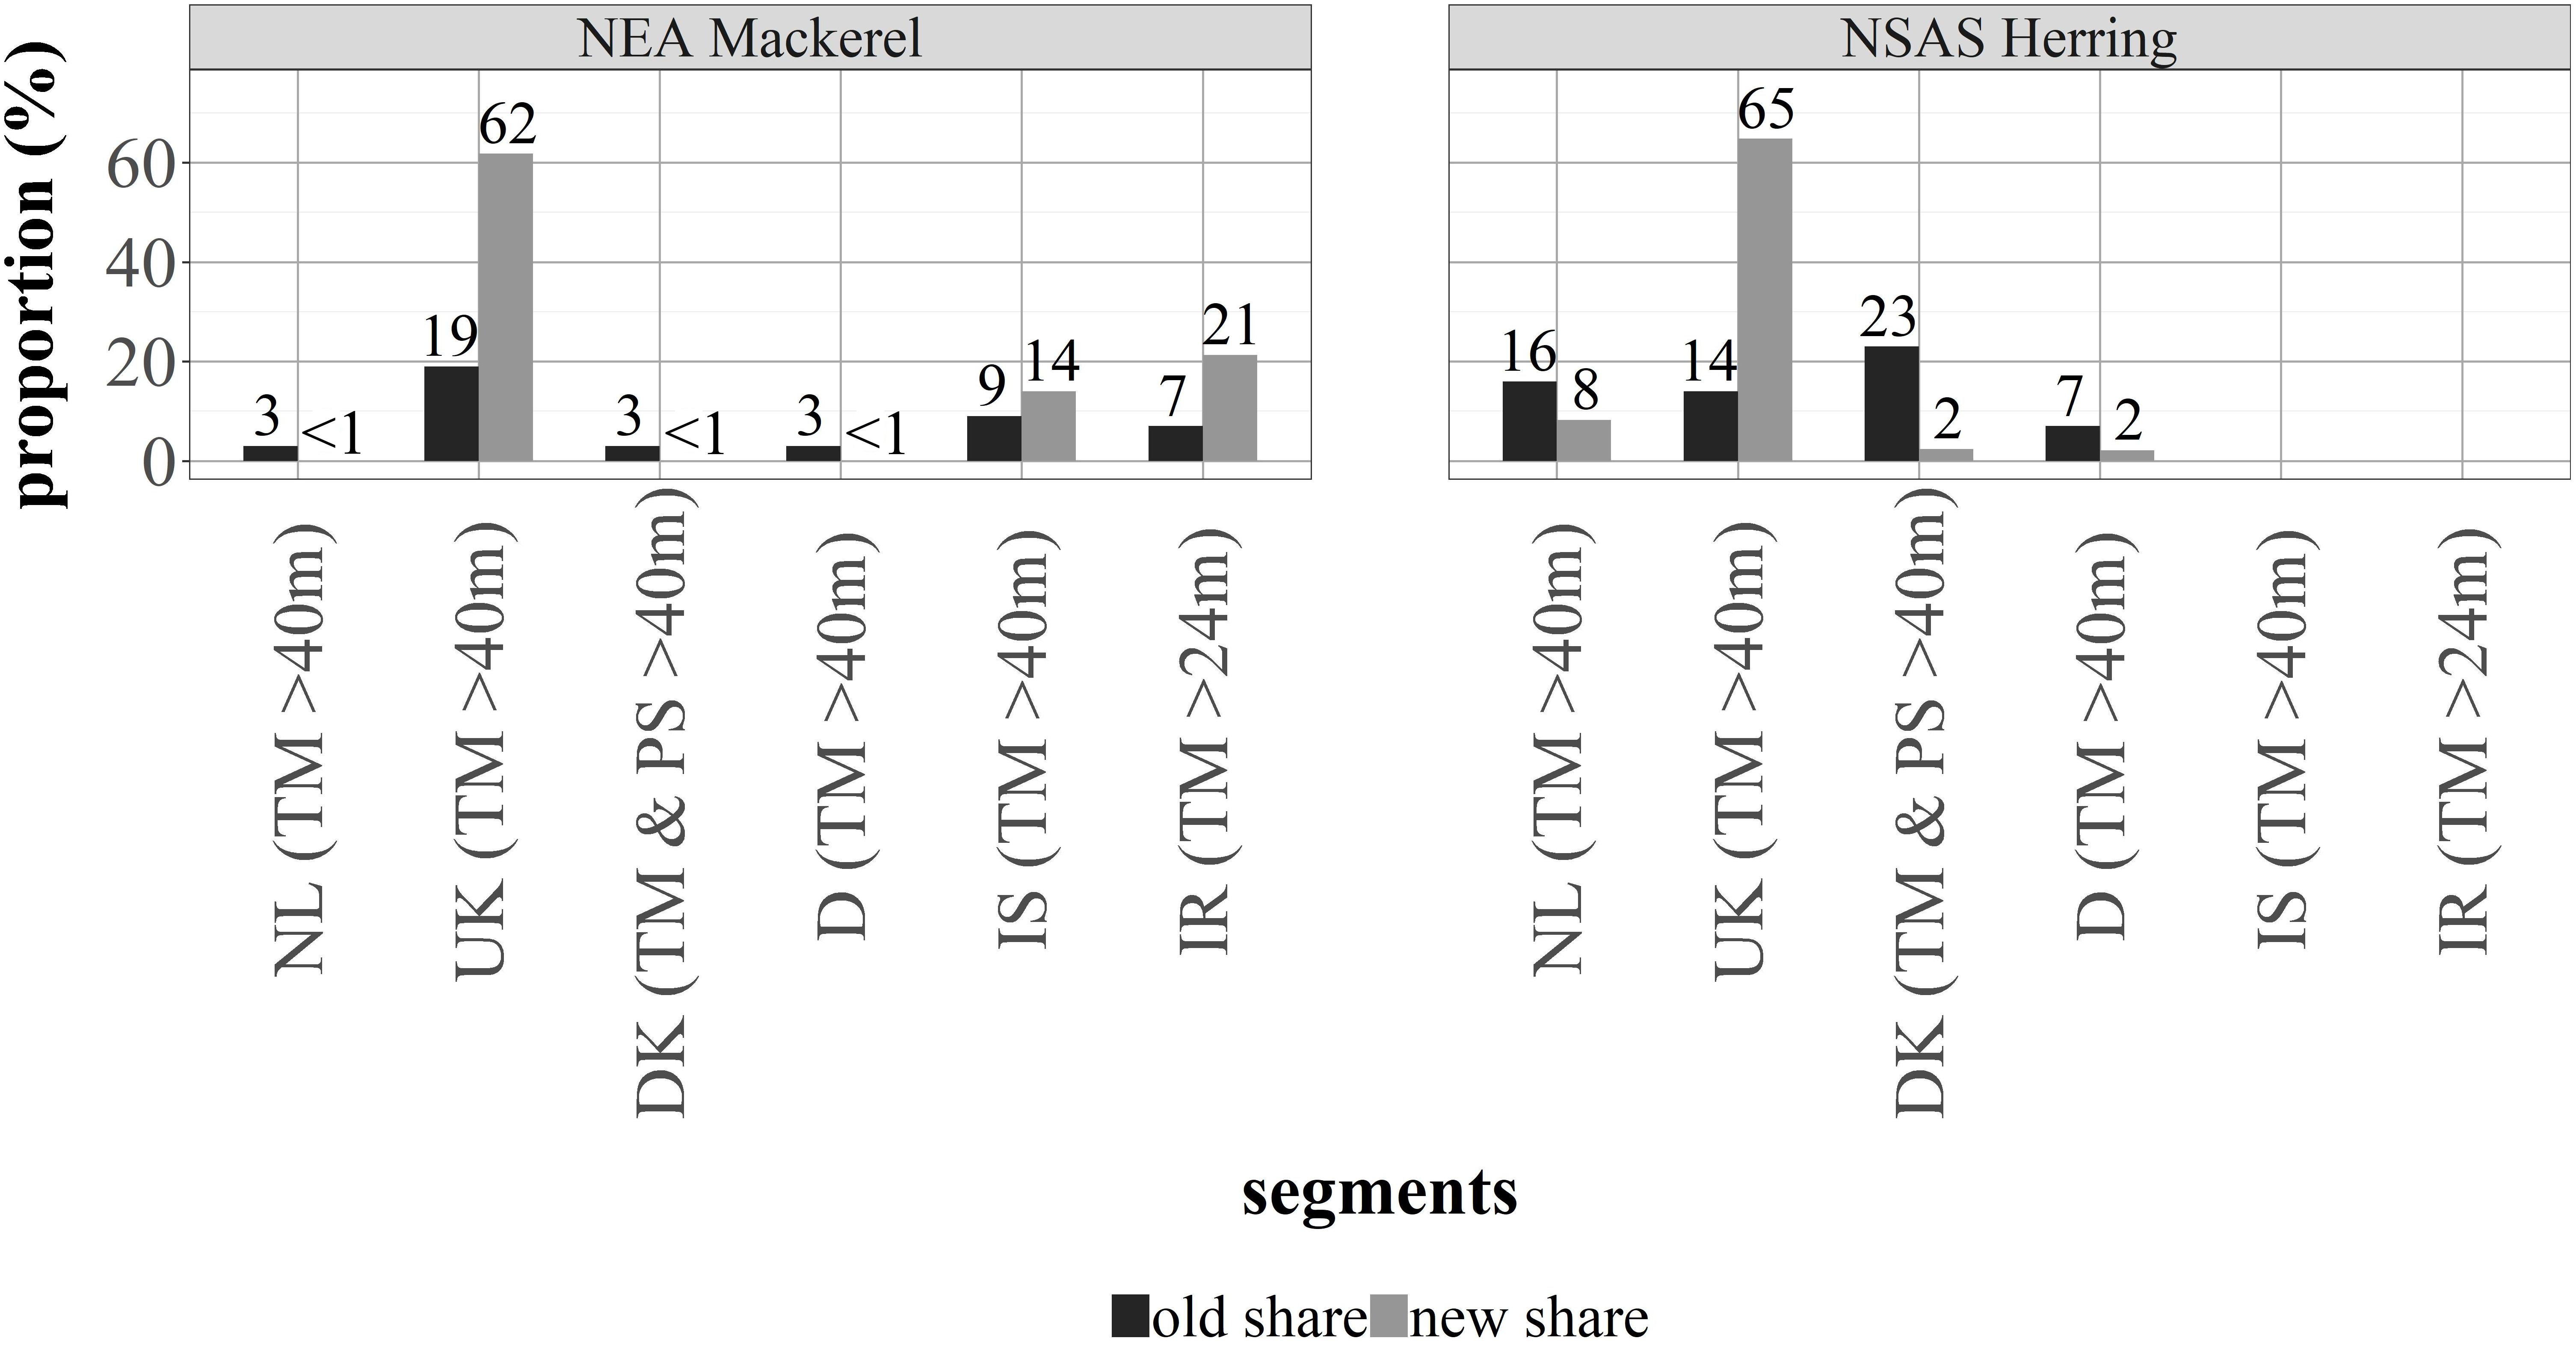
Figure 4. Old (for all fleets catching > 25% of both species, black) and new (gray) quota partition keys (%) for NSAS herring and NEA mackerel.
For NEA mackerel, it was difficult to find standardized abundance or biomass data including not only the European EEZs but the whole NEA, i.e., also the entire Icelandic EEZ. However, as Iceland is included as a modeled fleet and as mackerel now keeps migrating into the Icelandic EEZ, this area is of high importance for future management strategies and should also be incorporated into the analysis. Therefore, catch- and effort-at-age data of the modeled fleets were used to calculate catch-per-unit-effort (CPUE), which was in turn standardized in order to account for the different gear techniques applied by the fleets. This standardized CPUE was used as a proxy to calculate the standardized biomass (Figures 3, 4; ICES, 2019a). The approach assumes that fishermen would, through experience and sonar techniques, always know where schooling fish is located. In reality, this behavior can actually be observed when targeting pelagic species with well-developed sonar techniques. The approach should thus provide a rough estimate of mackerel proportions in each EEZ at the time when the modeled fleets target mackerel in order to see the main effects of implementing an adapted quota repartition key.
Results
All economic results presented in the following section are either given as percentage change over time or, in case of absolute numbers, aggregated into clusters of more than 10 vessels where appropriate.
Cost Structure of Modeled Fleets – The Input
The cost structure of the eight modeled fleets was investigated and showed unexpected differences (Figure 5). Capital costs, which also include annual depreciation costs, varied from 6% of total costs (Iceland) to 34% (Denmark). A similar observation could be made concerning fixed costs, which include insurances, administration and accountancy as well as fees such as harbor dues. The Danish fleets showed the smallest fixed costs share of only 4% per kg landed fish, whereas the United Kingdom fleet had the largest share of fixed costs (32%) (Figure 5). Crew costs share, on the other hand, were very similar among fleets (average: 26% per kg landed fish) and seemed to be independent from vessel sizes and fishing technique. The same applies to the fuel (18% on average of the fleets) and repair costs share (12% on average). The only exception was the Irish fleet (24–40 m) with a fuel and repair costs share of only 6% per kg landed. Variable costs share, containing income tax, expandable material, landing and sales fees, subsistence and travel expenses as well as radio costs, was on average 10% per kg landed fish. Again, only the Danish fleets stood out with only 5% of variable costs share. In general, the Netherlands and Germany had the largest amount of costs compared to the other modeled fleets, followed by Iceland, the Danish, United Kingdom, and Irish fleets (Figure 5).
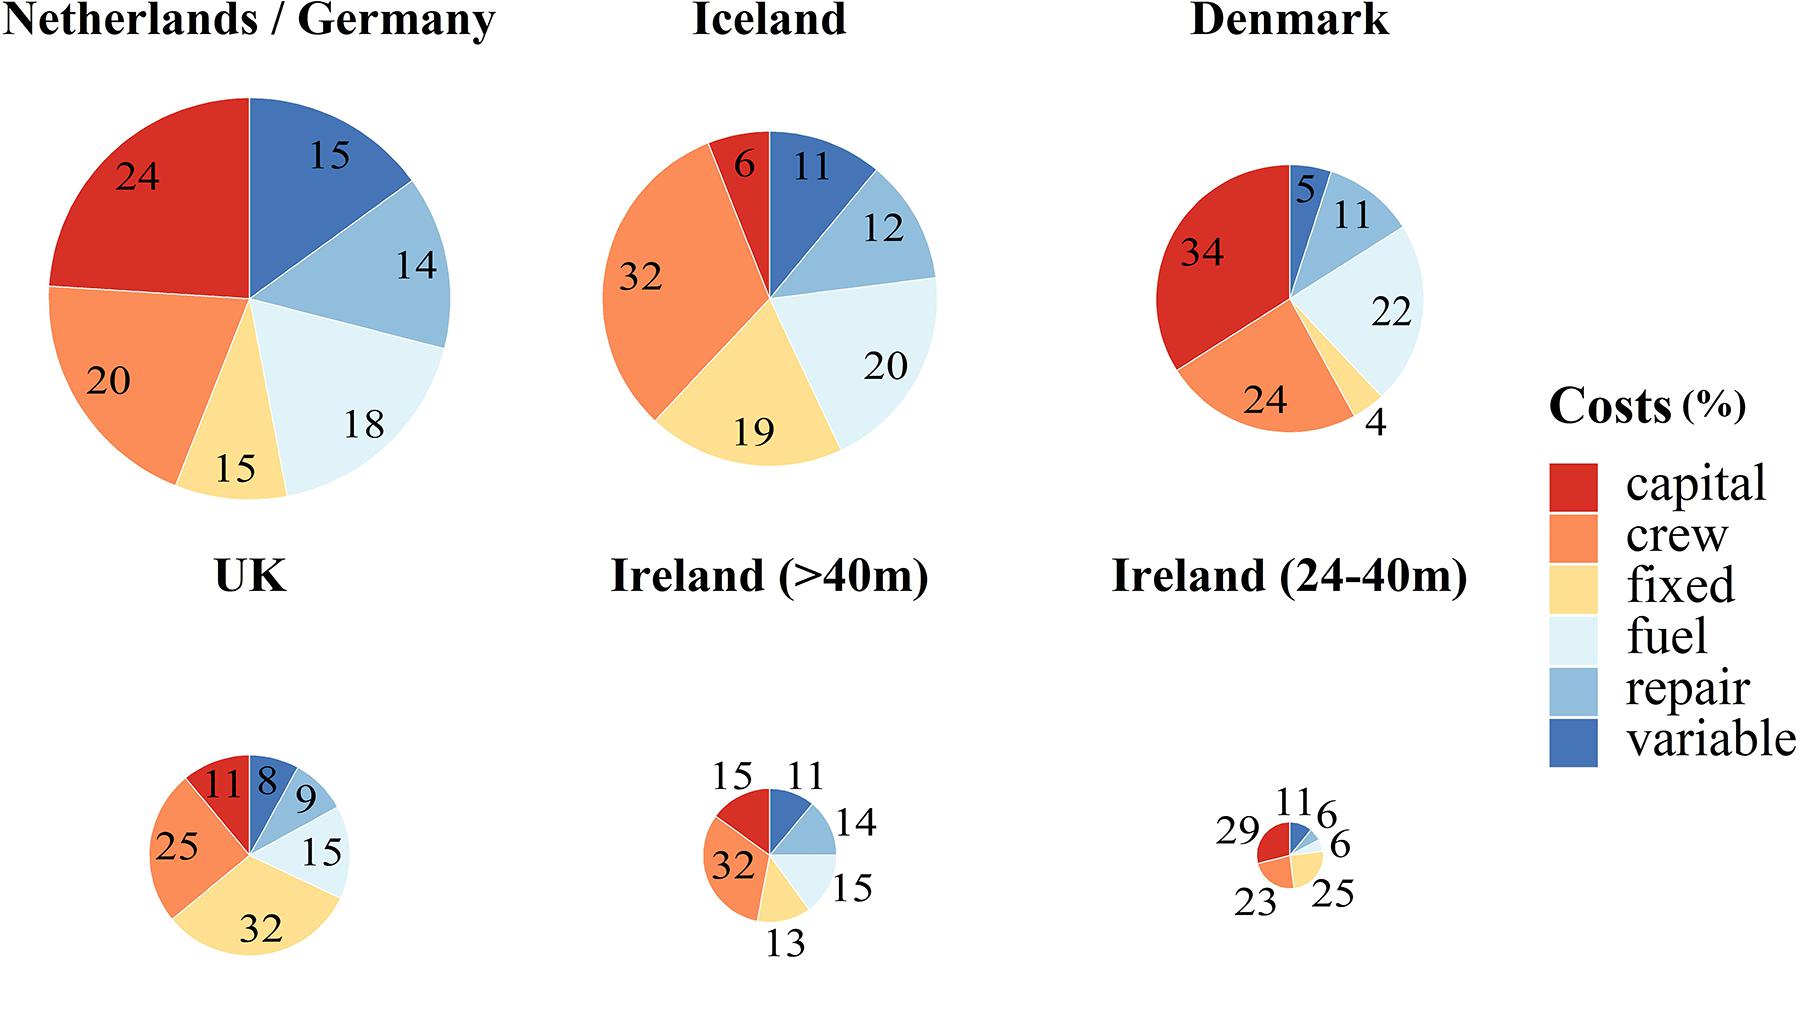
Figure 5. Cost structure [proportion (%) per kg landed] of the eight modeled fleets, average of years 2012 to 2014. The size of each pie chart shows the proportion of total costs per vessel in comparison to the other segments. Due to data privacy reasons the Dutch and German fleets as well as the two Danish fleets were aggregated (all segments shown here contain > 10 vessels). The cost structure of the Icelandic fleet was estimated by using United Kingdom costs structure.
As to the relation of total costs and revenue per kg of landings, revenue of seven out of eight fleets was 57% higher on average than the total costs per kg landed (Figure 6). One exception was the large-scale Irish fleet (>40 m) with only 13% difference between revenue and total costs. This fleet received 0.13 €kg–1 more on average than the other seven fleets, but had a significantly higher proportion of total costs at the same time (0.25 €kg–1 more on average). This made the large-scale Irish fleet more vulnerable to any negative effects implemented than the other modeled fleets. The two fleets with the largest difference between total costs and revenue (0.22 €kg–1) and therefore being least vulnerable to harmful impacts were the smaller Irish (24–40 m) and the United Kingdom fleets.
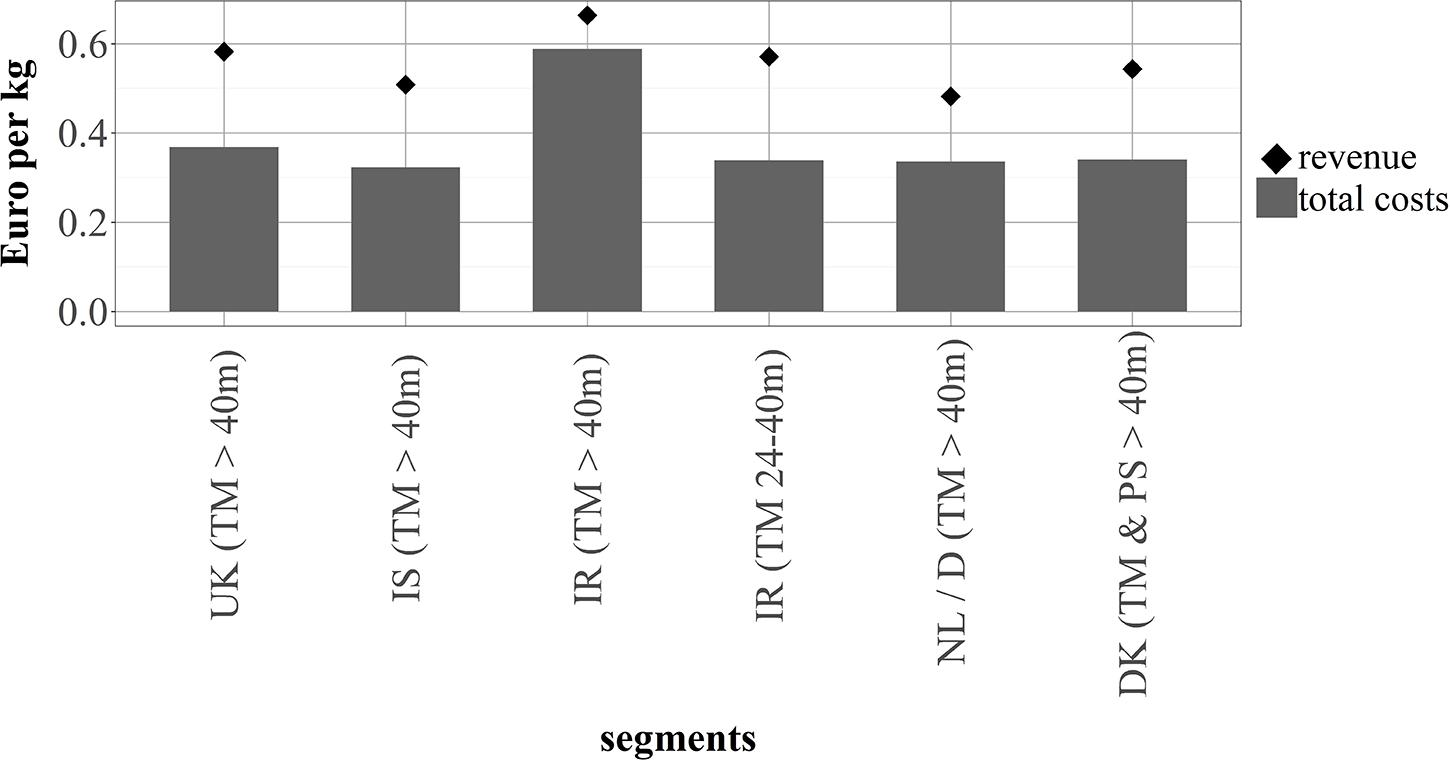
Figure 6. Total costs and revenue (Euro per kg landed) of the eight modeled fleets with an average of years 2012 to 2014. This also includes revenue from other species caught by those segments. Due to data privacy reasons the Dutch and German fleets as well as the two Danish fleets were aggregated (all segments shown here contain > 10 vessels). The cost structure of the Icelandic fleet was estimated by using United Kingdom costs structure.
Scenario 1: The Baseline
Biology
When comparing the baseline scenario to data of the corresponding mackerel assessment reports, trends were similar and model results were also within the 95% CI (Figure 7). The trend of NSAS herring SSB output from the baseline scenario decreased from 3,000 ktons in 2014 to 2,500 ktons in 2018, similarly to the observed data from the assessment but remained 35% higher on average (Figure 7).
Figure 7. Comparison of the baseline scenarios SSB in tons (median of 1000 iterations; gray) with its 95% CI in comparison to the assessments SSB in tons (black). This was performed for NSAS herring with data from the 2018 assessment report (ICES, 2018b) as well as for NEA mackerel with data from the updated assessment in 2019 (ICES, 2019a).
Further, when examining the biological results of the baseline scenario until 2030, a decrease in SSB from nearly 5,000 ktons in 2014 to 4,000 ktons from 2017 on could be noticed for NEA mackerel (Figure 8). As to NSAS herring SSB decreased from 3,000 ktons to 2,000 ktons in 2020, after which year this level was maintained (Figure 8). This is a level that corresponds to the average historic trend between 1996 and 2013. Hence, the SSB peaks observed in historic data between 2012 and 2014 seemed to represent rather exceptional years caused by high recruitment in 2009 and 2013.
Figure 8. Biological output (SSB and median recruitment) as well as TAC and F from the baseline scenario for NSAS herring (green) and NEA mackerel (blue). The Beverton-Holt SR relationship was used for mackerel (α2 = 10,269,723, β2 = 2,854,680) and the restricted hockey-stick relationship for herring (α2 = 41; β2 = Blim = 800,000t). SSB is shown with the 95% CI calculated from 1000 iterations; median recruitment is shown without the corresponding CI, because it displayed enormous variations from nearly none up to 2.5 trillion with some peaks even higher in case of herring. After 2010, TAC values for mackerel represent the sum of unilateral quotas as no international agreed quotas exist. Start year of the model was 2014 (red line). Horizontal solid lines represent the MSY and dashed lines represent the precautionary limit of F and SSB for NSAS herring (green) and NEA mackerel (blue).
Moreover, as SSB decreased, the TAC of both NEA mackerel and NSAS herring also declined until after 2020 it became relatively stable (Figure 8). Both SSB and Ftar influence the TAC level. Yet, the latter has less influence in all scenarios because it is kept on a similar level as the actually observed F of the last few years.
Economy
As a result of the biomass decline of NEA mackerel and NSAS herring in the baseline scenario, total catch of the modeled fleets decreased (Figure 9, gray bars). The fleets affected most within the first three years were the two Irish, the Icelandic, and the United Kingdom fleets. From the two focus species, the United Kingdom fleet catches mainly mackerel but the Irish and Icelandic fleets catch exclusively mackerel (Figure 2). Those four fleets caught between 15 and 25% less in 2017 compared to the start year 2014. Until 2030, the United Kingdom catch decreased by another 5%. The fleets targeting primarily NSAS herring were not affected as fast: The German fleet was impacted most, catching 10% less in 2017 and 19% less in 2030. Catch of the other three fleets was <10% less in 2017 and up to 20% less in 2030 compared to the start year in 2014. All fleets responded by decreasing their total and fishing effort. By 2017, the large-scale Irish fleet (>40 m) was already up to 100% less profitable (Figure 9). The profitability of the two Danish fleets was affected least and only decreased by 25% in 2030, whereas most other fleets were 40% less profitable compared to the start year.
Figure 9. Economic output of each modeled fleet from the baseline scenario: fishing effort (feffort), catch, and profit in 2017 and 2030 relative to the start year 2014.
Scenario 2: Reduced NSAS Herring Recruitment
When reducing the parameter α2 (i.e., the amount of recruits per unit of biomass) in the SR relationship of NSAS herring, a 23% decrease in recruitment with the moderate setting of 24.3 could be observed in 2030 compared to the baseline scenario and a 58% decrease with the extremer setting of 7.6. This consequently led to a reduction in total abundance, SSB and total stock biomass, the extent depending on the degree of change (More information can be found in Supplementary Figures S5, S6). The α2 = 24.3 setting lead to 18% less SSB until 2030 compared to the baseline scenario, whereas in the α2 = 7.6 setting SSB decreased by 48%. Changes in α2 had by far the most influence on herring SSB compared to all other scenarios and affected catch and the related economic parameters of the fleets accordingly (Figure 10).
Figure 10. (A) Change in profitability of eight modeled fleets compared to the baseline scenario when reducing recruitment (scenario 2 - green shades, here results of both settings of alpha are shown: alpha = 24.3 is the medium setting and alpha = 7.6 the extreme setting), lowering fish price (scenario 3 – dark blue), and increasing fuel price (scenario 3 – light blue). A different scale was used for the large scale (>40 m) Irish fleet in (B).
Fleets catching NSAS herring all decreased in profitability over time compared to the baseline scenario (Figure 10). The Icelandic and Irish fleets do not show large differences. As to the other five fleets, the influence of the α2 = 24.3 scenario on profitability was not as strong as in the α2 = 7.6 setting: Profit in the former only decreased in between 5 and 30%. The α2 = 7.6 setting had a larger effect on fleet profitability, where the Dutch and Danish fleets had a 45% reduction of profit on average and the German fleet even up to 80% (Figure 10).
Scenario 3: Fish Price and Fuel Price Variations
Alterations of fish and fuel prices had very large impacts on revenue and cost structure of all fleets, but not so much on the SSB of the stocks compared to baseline scenario. For simplification purposes, the following section will only address the two most threatening settings of low fish and high fuel price. Further detail concerning combinations of fish and fuel price can be found in Supplementary Figures S8, S9.
In general, most fleets were much more affected by low fish prices than by high fuel prices, although fuel cost increased by at least 25% under the latter scenario (Figures 10A,B). Here, we focus on the change in profitability, for further detail see Supplementary Figure S6. The large-scale (>40 m) Irish fleet appeared to be the most sensitive to the fish and fuel price variations in general (Figure 10B). Their profit decreased from 11 million euros (MEUR) in 2014 to 0.5 MEUR in 2030 (-700% compared to the baseline scenario) with low fish prices. Therefore, they tried to be more profitable by reducing their total effort and fleet size by 30%. The United Kingdom and Icelandic fleets also reduced their fleet size by 38 and 60% respectively until 2030 in the low fish price setting. They however increased the days operating per vessel and therefore did not have to reduce their overall total effort as well as catch. Yet, their profitability decreased by 90% compared to the baseline scenario. By disinvesting, the large-scale Irish and the United Kingdom fleets could reach profitability again after five years, whereas the Icelandic fleet was not able to achieve profitability until 2030 and continued to disinvest. All other fleets decreased in profitability and, to increase catch and receive more revenue, increased their effort in comparison to the baseline scenario until they were limited by their quota. This in turn increased operating costs and significantly reduced their margin between total costs and revenue to the point of break-even. In the end, especially the Danish fleets were very close to unprofitability, just managing to maintain themselves. The Dutch fleet was the least affected when reducing fish price. Their profitability only decreased by 30% until 2030 compared to the baseline scenario (Figure 10A).
The German fleet, however, seemed to be much more sensitive to fuel price changes. Increasing fuel price dissipated all profit (−100%) compared to the baseline scenario than just reducing fish price (−40%; Figure 10A). Fuel costs also increased by 100% compared to the baseline scenario in 2030, which was 70% more than for the other fleets.
Scenario 4: Adapting the Quota Repartition key
The analysis of the spatial biomass distributions showed the largest proportions of NEA mackerel and NSAS herring situated in the United Kingdom EEZ, followed by Ireland and Iceland. Since the biomass proportion of both species was very low in the Danish, German, and Dutch EEZs, the share for those countries was also very low (<1% for mackerel, <3% for herring; Table 1). Fleets from Denmark, Germany, and the Netherlands were immediately unprofitable when implementing the reallocated quotas (Figure 11A). Consequently, they tried to catch a larger amount of herring and mackerel than their allowed quota limit in order to stay profitable, which is why the model could not find an optimal or feasible solution for this scenario. Further results concerning profitability should therefore be considered with care.
Figure 11. Change in profitability of eight modeled fleets compared to 2020 (A,B) when implementing new catch shares in 2021. In 2020, the old catch shares were still intact. A different scale was used for the large scale (>40 m) Irish fleet in (B).
The Danish and Dutch fleets were already up to 250% less profitable within the first year of reallocated catch shares (i.e., 2021; Figure 11A). The German fleet was affected the most with profit decreasing by 450% in 2021 compared to 2020. Interestingly, the Icelandic fleet was also almost 100% less profitable within one year although gaining a 5% higher catch share. However, they increased fishing effort massively (by 120%) at the same time, which affected fuel costs accordingly (for further detail see Supplementary Figure S7). The Irish, especially the large-scale, and United Kingdom fleets on the other hand, had the most advantages by far and turned out to be more than 250% more profitable within one year (Figures 11A,B). The modeled large-scale Irish fleet and the United Kingdom fleet received most of the mackerel share. The former, for example, had 6% in 2020 and received three times the share in 2021. Catching more than double the amount in 2021 than in 2020, they increased their profitability from approximately -1.2 to 31.6 MEUR (+2500% compared to 2020) within 1 year. Compared to the large-scale Irish fleet, the effect was not as large when examining the UK fleets profitability but still considerable: They also received 3–4 times the share of NEA mackerel and NSAS herring and caught more than triple the amount of both species together. Yet, they were six times more profitable in 2021 than in 2020, increasing profit from approximately 59 MEUR to 392 MEUR (+500%) (Figure 11A). Neither the Irish nor the United Kingdom fleets caught the full amount of newly available quota as they were limited by the maximum allowable effort.
In general, when comparing the five scenarios, alterations of the quota repartition key had the largest impacts on all fleets. For the Dutch, Danish, and German fleet, this was substantial causing these fleets to be unprofitable immediately. For the Irish and United Kingdom fleets this scenario was most profitable on the other hand. The second strongest effects on the Danish, United Kingdom, Icelandic, and Irish fleets were variations in fish price. The second largest impact on the Dutch fleet, on the other hand, had the low recruitment scenario and on the German fleet the reduced fuel price scenario. In contrast, the lowest effects on profitability of the Icelandic and Irish fleets had the NSAS herring recruitment reduction scenarios. Changing fuel price, however, had least impacts on the Danish, United Kingdom, and Dutch fleets.
Discussion
Pre-analysis: Cost Structure of Modeled Fleets
In order to be able to interpret the model outcomes from the different scenarios a data pre-analysis was conducted. Although all vessels were >24 m in length the cost structure differed in some cases.
Fixed Costs
One example were fixed costs (incl. insurances, administration, accounting and harbor dues): The United Kingdom and Irish fleets as well as the Icelandic fleet had a very high share in fixed costs (15% of revenue on average) compared to the German, Dutch, and Danish fleets (4% of revenue on average). This difference can be explained by the various fishing techniques used. The German and Dutch fleets, for example, use pelagic freezer trawlers that can actively trawl for a longer period of time while processing the catch directly on board. Refrigerated Seawater (RSW) trawlers as used by the United Kingdom, Irish, Danish, and Icelandic fleets, on the other hand, apply tanks filled with water in order to cool the fish caught and need to return to the harbor more often as the storage capacity is smaller (KNARR, 2019a, b). They might therefore have a higher share of fixed costs due to more frequent discharges in the harbor. The difference is also reflected in vessel sizes: The freezer trawler, with a much larger storage capacity, are around 110m in size, whereas the RSW trawler tend to be around 50–60 m.
Fuel and Repair Costs
The storage capacity and technique, on the other hand, does not seem to affect fuel and repair costs share. Usually freezer trawler cover a much larger area in contrast to the RSW trawler, which need to stay closer to the harbor. Hence, one might expect the former to have a larger amount of fuel costs share compared to the latter; however, both were in between 10–13% of revenue. Hence, the large area covered by freezer-trawler and the effort of more frequent returning trips to the fishing grounds by the RSW trawler seem to outweigh each other, generating this similarity. One exception was the smaller Irish fleet (24–40 m), which had a fuel cost share of 3% of revenue. This is due to the smaller number of sea days compared to the >40 m fleets (approximately 13% less), which might in turn be a reason why their fixed costs share was the second largest of all fleets (25% of revenue).
Crew Costs
The crew costs share was also surprisingly similar amongst all fleets (av.: 16% of revenue), independent of vessel size. Freezer trawler were expected to have a lower share of crew costs compared to RSW vessels, being floating factories and using automated processing machines that substitute labor to some extent (KNARR, 2019a, b). Onboard freezer trawler, labor costs are not entirely fishing but also processing labor and enables corresponding companies to reduce their labor costs on land. Findings of Tietze et al. (2001, 2005), suggest a decline in labor cost share between 1995 and 2003 with increasing technological advances: For example, between 1995 and 1997, labor costs share of the German pelagic trawler fleet (90–120 m in length) made up 44% of total costs (Tietze et al., 2001). In 2002 and 2003, it was only 36% (Tietze et al., 2005) and in this study even less (18% of total costs as an average of 2012-2014 combined with the Dutch fleet). Concerning the Dutch fleet only, crew costs in general seemed to decrease by 22% from 2008 until 2016 (Scientific, Technical, and Economic Committee for Fisheries [STECF], 2017). At the same time number of vessels were half in 2016 compared to 2008, but the total number of crew members also decreased by 27%. Crew costs can, however, also be influenced by other parameters than just technological advances. These are usually fish prices as well as the amount of fish caught. This is mainly because the major proportion of the salary depends on the amount of fish caught. Crew members receive a certain proportion of the catch value, depending on the position they hold.
Capital Costs
The share of capital costs, which include depreciation and interest, was similar amongst six out of eight fleets ranging from 14–21% of revenue. Two fleets, Iceland and the United Kingdom, however, only had a capital cost share between 4 and 7% of revenue. This can occur due to four possibilities: (1) High proportion of self-financing, (2) cost transfers within companies operating pan-European, (3) better terms of credit, and (4) high vessel ages that are maintained with the company’s own holdings. In case of the United Kingdom, average vessel age increased over time, but this is also valid for all other fleets (Scientific, Technical, and Economic Committee for Fisheries [STECF], 2017). Additionally, the average United Kingdom vessel age is the lowest: 13 years between 2008 and 2016, which indicates a larger capital cost share due to newer vessels and a larger amount of depreciation. For most other fleets, on the other hand, average vessel age was more than 19 years in the same time-period (Scientific, Technical, and Economic Committee for Fisheries [STECF], 2017). Therefore, the first two possibilities mentioned before may be the most likely concerning the United Kingdom. First, a high proportion of financing from own resources is possible if vessels are mainly owned by large-scale, pan-European operating companies through a process called “quota hopping.” It is usually defined as the process where companies buy vessels and flag them in other countries. Second, profit and cost transfers within those large-scale companies are also common. In Germany, depreciations (included in capital costs) as well as subsidiary profits can be transferred to the parent company through a so-called profit transfer agreement (Gelder and Spaargaren, 2011). This can be a reason why the German fleet had a smaller capital costs share and was close to the break-even point in all scenarios, whereas the Dutch fleet was far more profitable with a much larger share of capital costs.
In case of Iceland, the actual cost data was lacking. From all modeled fleets, the United Kingdom fleet had most similarities to the Icelandic fleet especially in terms of the amount of fishing days per vessel and vessel age. Moreover, both fleets use primarily RSW trawlers to catch mackerel. Hence, the United Kingdom costs structure was used to estimate capital, other fixed, crew, repair, fuel, and variable costs for the Icelandic fleet. This might therefore generate a relatively small share of capital costs for Iceland as well as the United Kingdom.
A more detailed discussion of capital costs and problems concerning their estimation can be found in Supplementary Material S1.
Robustness of the Biology Module
FishRent is an age-structured profit maximization model, not a stock assessment model, and the baseline scenario does not represent a status quo. Hence, modeled fleets will always aspire to be as profitable as possible under the given circumstances. How fleets actually behaved in reality does, however, not always have to represent the most profitable decision. Other external factors may have occurred which could not be influenced by fishermen (i.e., storms, vessel break-down). Moreover, the assumptions in the model do not always correspond with the knowledge of the fishermen, who rather fish according to past experience. This might have then affected fishing mortality in another way than estimated by the model, in turn also affecting the biomass differently.
In the biological output from the baseline model recruitment, abundance, and biomass of both NEA mackerel and NSAS herring decreased and stayed stable after 2020. This stable pattern occurs due to the amount of 1000 random iterations for recruitment and SSB and the consequent usage of the median. The calculated confidence intervals (CI’s) show how large the error might actually be, which is extremely high especially for herring from nearly none up to 2.5 trillion. Yet, this is still in line with the 95% CI from assessment reports (ICES, 2018b, 2019a). Moreover, the SSB trend of the baseline scenario was similar for both species compared to the assessment. Some differences could still be noticed, particularly concerning herring SSB. A reason for differences between the baseline scenario and assessment values is the usage of an optimization routine in FishRent. This is not included in assessments, as these try to describe the actual condition of the population in order to recommend a sustainable management advice, not what would be most profitable for the fleets. Unfortunately, it was not possible to incorporate any data prior to 2012 in this study, which is why baseline model outputs to assessment values could not be compared to a longer time-period. To get a clearer picture of how well the model results reflect the observed trend of assessments it would be recommendable to include a larger number of years. Yet, for the years that could be used, the differences are only small and fit well to what has been observed. This indicates that the decisions made by the model of what is most optimal in terms of profitability also fits roughly to decisions made by fishermen in reality.
(Dis-)Investment
In the decrease in fish price setting from the price variation scenario, three fleets disinvested and therefore reduced their vessel numbers because they were unprofitable, i.e., the costs were higher than the revenue. In reality, fishermen or companies would not directly sell their vessels in case a fishery turns unprofitable. The system is very inertial, which is partly due to the fact that licensing for quotas is needed, making it particularly difficult to sell large vessels in Europe. In the model, also several conditions control fleet size changes: First, (dis-)investment can only occur after the first modeled year. Second, if fleets are profitable, reached their effort capacity and are below their maximum investment limit, they can invest into new vessels. Third, if fleets are unprofitable, they are allowed to disinvest a maximum of 10% per year. The investment limits in this model version were determined by the maximal change of investment and disinvestment observed within the last 10 years (Scientific, Technical, and Economic Committee for Fisheries [STECF], 2016). This approach was also used by Bartelings et al. (2015) and Simons et al. (2015). Yet, Frost et al. (2013) note the sparseness of empirical evidence for the investment behavior of fleets, but also emphasize the importance of such module in economic models that display long-term resource rent developments. Disinvestment in these model runs are therefore interpreted as a sign of overcapacity within a fleet.
Scenarios
In this study, the scenario affecting the profitability of all fleets the most was the adaptation of the quota repartition key scenario according to the biomass distribution of NEA mackerel and NSAS herring. The degree of profitability largely depended on the newly calculated shares and hence the amount of mackerel and herring each fleet was allowed to catch. Not many other studies have been conducted in a similar way. Léopold et al. (2013) evaluated the biological and economical success of spatial collective quotas concerning an artisanal sea cucumber fishery in New Caledonia. Their results showed a higher stock resilience, buffering effects of market fluctuations and periodic overfishing. Holland already stated in Holland (2004), that costs (e.g., for monitoring and enforcement) may be higher when implementing spatial fishery quotas, although such management may provide a more optimal usage of resources. In the case of the NEA mackerel and NSAS herring fishery, the German, Dutch, and Danish fleets would, however, lose two highly important fisheries. The United Kingdom and Irish fleets, on the other hand, would gain a significant amount of both species also increasing their value massively.
Moreover, in a real quota repartition key adaptation process the fixed proportion of other species included in the revenue calculation might also change and therefore have a different effect on the revenue of the pelagic fleets. Actually, this might worsen the situation for the Dutch, German, and Danish fleets since other pelagic species caught by those fleets (e.g., blue whiting, horse mackerel, and sprat) also primarily occur in Irish, Faroese, and United Kingdom waters (Doering et al., 2017). Another possibility to provide more flexibility to the relative stability principle, would be the more widespread use of individual transferrable quotas (ITQs), shifting more responsibilities back toward the industry. However, this system is controversial, raising concerns about the concentration of fishing rights in larger companies (Hoefnagel et al., 2015). Implementing an ITQ system and determining its effects on the pelagic fleets as a more flexible application of the relative stability principle might be another scenario worth considering for future modeling work.
The second strongest effects were associated with the fish and fuel price alteration scenario. One fleet that stood out, because it was the only one showing more extreme reactions when altering fuel price than fish price, was the German fleet. This was because the share of fuel costs was 6% higher than for the others. Moreover, the starting fish price (an average of the years 2012–2014) was already at 0.46 €kg–1 for frozen herring and 0.90 €kg–1 for frozen mackerel. Therefore, the difference between frozen herring start price and the low-level historic price (herring: 0.35€kg–1, mackerel: 0.90 €kg–1; Table 2) was only 31% and none in case of mackerel. For all other fleets, fish prices were reduced by at least 70% to reach the low historic price of our scenario. The effect of reducing fish prices thus did not have a very large effect on the German fleet compared to altering fuel price. Additionally, the German as well as the large-scale Irish fleets were close to the break-even point from the beginning, making them more vulnerable to further disturbances than other fleets in all scenarios. The large-scale Irish fleet additionally received the smallest value per kg fresh mackerel (0.76 €kg–1). Hence, the difference to the low fish price scenario was by 52%. Furthermore, their margin between revenue and total costs per kg was only 0.10 €kg–1, whereas for the others it was on average double (0.21 €kg–1). These are all reasons for the extreme sensitivity of the large-scale Irish fleet to any alteration induced by the scenarios tested, most of all lowering the fish price.
Both, fish and fuel prices alterations, where implemented as a sudden event. In our results, the Dutch fleet was affected least by any changes implemented into the model. The quota concentration and enterprise enlargement imply profit and costs transfers, as already discussed earlier. This could be a reason for their larger revenue-costs margin compared to the other fleets, which nearly reached their break-even point until 2030. This enhances their resilience to any additional impacts that may occur and often these events do not appear one at a time. Yet, one shock where a massive disinvestment in the Dutch fleet due to high fuel prices coinciding with low fish prices was actually observed, occurred after the latest financial crisis. While cutter companies were still resilient during other economic crises, many could not overcome this one (Hoefnagel and de Vos, 2017). Especially, the larger pelagic companies had the resources to buy quotas of the insolvent cutter companies because they either merged with a quota holding enterprise, bought the whole enterprise or held already quotas themselves (Hoefnagel and de Vos, 2017). This situation further increased quota concentration within the Netherlands.
Additionally, fuel prices increased since the mid-90s, reducing economic benefits of the fleets. Jones et al. (2015) found fuel prices to have increased from 0.65 £l–1 in 1992 to 1.20£l–1 (1.76 €l–1) in 2007 when using global cost of fishing database for the United Kingdom. This is more than the upper fuel price of 0.85 €l–1 that we used in our scenarios, indicating that a longer time-series might be worth considering to test for the effects of potential fuel price shocks on the profitability of the pelagic fishery. Cheilari et al. (2013), on the other hand, identified a fuel cost increase from 0.25 €l–1 in 2002 to 0.63 €l–1 in 2008 using data from data of the Annual Economic Report in 2010. This is more in accordance to our assumptions. They estimated the effects of the fuel price crises on the economic performance on 54 European fishing fleets and found the number of vessels as well as landings decreasing over time because of increasing fuel prices. The situation of fuel prices is likely to worsen from 2020 on, which is when marine crude oil will be prohibited, and companies have to buy the much more expensive marine gasoil (Kazokoglu and Jakštas, 2019). In this case, stakeholders expect a fuel price increase of up to 30%. This is 14% more than what we tested for in the fuel price increase scenario. As to our results, this will mainly affect the large-scale Irish and German fleets than others, as these are also the fleets with the smallest revenue-costs margin.
Compared to the other scenarios, the recruitment scenarios had the least impact on the fleets. Yet, the current level of NSAS herring recruitment is already relatively low and can still become a serious problem for the fleets mainly targeting this species, i.e., the Dutch, German, and the Danish fleets. The medium recruitment reduction setting would decrease profitability of these fleets compared to the baseline scenario but not to a substantial level. However, the low recruitment reduction setting did have drastic consequences, especially for the German fleet. A further reduction of NSAS herring recruitment in future is possible in context with warming oceans. Lynam et al. (2005), for example, suggest the existence of a negative correlation between climate variations, jellyfish abundance and herring survival. In 2007, a special ICES working group concluded that poor recruitment is likely to be linked to increased water temperatures at the spawning sites that raise metabolic rates and therefore food demand. At the same time, less food was available (ICES, 2007). Studies of Hufnagl and Peck (2011) as well as Fässler et al. (2011) also indicate an increased larval mortality due to elevated water temperatures in the central and northern North Sea after 2002. Finally, results of the European Horizon 2020 project “Climate change and European aquatic RESources” already showed a further decrease of NSAS herring biomass and a reduced habitat suitability in the whole North Sea area, which is even more pronounced in the south due to increasing water temperatures until 2050 (CERES D2.3, 2019).
Although the recruitment scenarios were primarily applied to NSAS herring, the decrease in NEA mackerel SSB should also be considered. It is not a major decrease (from 4800 ktons to 4100 ktons) but has an impact on the fleets nevertheless. It occurs due to the current overfishing of the stock due to a much larger TAC [approximately 35% (mean 2012–2014)] than advised by ICES (ICES, 2019a). Additionally, Iceland continues to set their own unilateral quota, therefore adding more fishing pressure onto the stock (ICES, 2019a, b).
Conclusion
We adapted a dynamic and integrated age-structured bio-economic model, FishRent, to the economically valuable pelagic fishery targeting NEA mackerel and NSAS herring. Those fleets are currently exposed to many changes in the environment, policy and economics. In order for them to be able to adapt in time, it is important to determine the magnitudes of those changes. This study showed the continued decrease of recruitment and the associated effects on fleet profitability. We further demonstrated the magnitude of possible price shocks on pelagic European fleets illustrating the potential behavior of fishermen in order to cope with these impacts.
One lesson learned from the application of these scenarios is the relevance of the relative stability revision not only in terms of recent political questions concerning access rights as seen in the Brexit debate, but also regarding climate change. For several pelagic fisheries, a spatial quota reallocation according to biomass distributions would be a severe problem. Other management options, such as ITQ systems embedded into co-management, that introduce higher flexibility to the relative stability principle might be worth considering. The effects of such measures should, however, be tested first.
In this regard, it would be necessary to introduce spatial scales into the current model version. The NEA region could be further divided into the northern NEA, southern NEA and the North Sea area. Again, NEA mackerel is a highly migratory species and has been observed to expand further to the North-west since 2007 (ICES, 2019b). With such a regional split of the model, one could simulate the observed expansion of mackerel toward the North-west and the subsequent effects on the fleet behavior. This provides possibilities to test for changes in management and alternative strategies concerning the international disagreement of quotas in the context of climate change spatial dynamics.
Data Availability Statement
Detailed economic, catch and effort data analyzed in this study was obtained from EU national labs as well as the Marine and Freshwater Institute in Reykjavík (Iceland). More data can be accessed from the STECF (open source). Biological data was obtained from ICES assessments and is open access. Requests to access these datasets should be directed to Anna Ólafsdóttir (MRI, YW5uYS5vbGFmc2RvdHRpckBoYWZvZ3ZhdG4uaXM=), Matt Elliott (MMO, bWF0dC5lbGxpb3R0QG1hcmluZW1hbmFnZW1lbnQub3JnLnVr), Arina Motova (Seafish, QXJpbmEuTW90b3ZhQHNlYWZpc2guY28udWs=), Josefine Egekvist (DTU Aqua, anN2QGFxdWEuZHR1LmRr), Kim Normark Andersen (DST, S05PQGRzdC5kaw==), Emmet Jackson (BIM, RW1tZXQuSmFja3NvbkBiaW0uaWU=), Hans Gerritsen (Marine Institute IR, aGFucy5HZXJyaXRzZW5ATWFyaW5lLmll), Katell Hamon (WUR, a2F0ZWxsLmhhbW9uQHd1ci5ubA==), Jörg Berkenhagen (TI-SF, am9lcmcuYmVya2VuaGFnZW5AdGh1ZW5lbi5kZQ==), and Torsten Schulze (TI-SF, dG9yc3Rlbi5zY2h1bHplQHRodWVuZW4uZGU=).
Author Contributions
All the authors contributed to the conception and design of the study, manuscript revision, read and approved the submitted version. SR wrote and designed the first draft of the manuscript.
Funding
This project received funding from the European Union’s Horizon 2020 Research and Innovation Program under grant agreement No. 678193 (CERES – Climate change and European Aquatic Resources). This document reflects only the authors’ view. The European Commission is not responsible for the dissemination of CERES project results and for any use that may be made of the information.
Conflict of Interest
The authors declare that the research was conducted in the absence of any commercial or financial relationships that could be construed as a potential conflict of interest.
Acknowledgments
First, many thanks are given to the numerous researchers of the national labs for providing catch, effort and economic data as well as their expert knowledge (in no particular order): MMO, MRI, Seafish, DTU Aqua, DST, TI-SF, Marine Institute IR, and BIM. Also, acknowledgments are given to Anna Ólafsdóttir (MRI), Jens Ulleweit, and Norbert Rohlf for plenty of information concerning the biology of NEA mackerel and herring as well as Marc Taylor and Alexander Kempf for their modeling expertise (all TI-SF, no specific order). Last but not least, many thanks for a lot of feedback and new ideas are given to Martin Pastoors (PFA), Dr. Uwe Richter (Doggerbank Seefischerei GmbH), Miriam Püts, Bernhard Kühn, and the Thünen Journal Club.
Supplementary Material
The Supplementary Material for this article can be found online at: https://www.frontiersin.org/articles/10.3389/fmars.2020.00625/full#supplementary-material
References
Astthorsson, O., Valdimarsson, H., Gudmundsdottir, A., and Óskarsson, G. (2012). Climate-related variations in the occurrence and distribution of mackerel (Scomber scombrus) in Icelandic waters. ICES J. Mar. Sci. 69, 1289–1297. doi: 10.1093/icesjms/fss084
Baranov, F. I. (1918). On the question of the biological basis of fisheries. Nauchnge Issledovaniya Ikhtiologicheskii Instituta Izvestiya 1, 81–128.
Bartelings, H., Hamon, K., Berkenhagen, J., and Buisman, F. C. (2015). Bio-economic modelling for marine spatial planning application in North Sea shrimp and flatfish fisheries. Environ. Model. Softw. 74, 156–172. doi: 10.1016/j.envsoft.2015.09.013
Bastardie, F., Nielsen, J. R., and Miethe, T. (2013). DISPLACE: a dynamic, individual-based model for spatial fishing planning and effort displacement - integrating underlying fish population models. Can. J. Fish. Aquat. Sci. 71, 366–386. doi: 10.1139/cjfas-2013-0126
Beverton, R. J. H., and Holt, S. J. (1957). On the dynamics of exploited fish populations. Fish Invest. Lond. Ser. 2, 519–533.
Biermann, F., Ehrlich, L., Growitsch, C., and Leschus, L. (2015). Neue Schwefelemissions-Regulierungen in Emission Control Areas. Auswirkungen auf die Kraftstoffpreise. Hamburgisches: Hamburgisches WeltWirtschafts Institut (HWWI).
Bjørndal, T., and Munro, G. (2012). The Economics & Management of World Fisheries, 1st Edn, Oxford: Oxford University Press.
Bruge, A., Alvarez, P., Fontán, A., Cotano, U., and Chust, G. (2016). Thermal niche tracking and future distribution of atlantic mackerel spawning in response to ocean warming. Front. Mar. Sci. 3:86. doi: 10.3389/fmars.2016.00086
CERES D2.3 (2019). CERES Deliverable Report 2.3: Report on CC Predictions for Targeted Fish And Shellfish Species At Required Spatial And Temporal Scales, According to Scenarios Agreed in T1.2. Sailley, S. (main author), Bossier, S., Catalán, I.A., Christensen, A., Hansen Eide, C., Damalas, D., Huret, M., Maynou, F., Navodaru, I., Nielsen, J.R., Peck, M.A., Pinnegar, J.K., and Reglero, P. (main contributors). Available online at: https://ceresproject.eu/ (accessed February 22, 2020).
Cheilari, A., Guillen, J., Damalas, D., and Barbas, T. (2013). Effects of the fuel price crisis on the energy efficiency and the economic performance of the European Union fishing fleets. Mar. Policy 40, 18–24. doi: 10.1016/j.marpol.2012.12.006
Corten, A. (2013). Food for thought - recruitment depressions in North Sea herring. ICES J. Mar. Sci. 70, 1–15. doi: 10.1093/icesjms/fss187
Cruz-Rivera, E., Ramírez, H., and Vasilieva, O. (2018). Catch-to-stock dependence: the case of small pelagic fishery with bounded harvesting effort. Natural Resour. Model. 91, 760–781. doi: 10.1111/rnm.12193
D’Andrea, L., Parisi, A., Fiorentino, F., Garofalo, G., Gristina, M., Cataudella, S., et al. (2020). SMARTR: an R package for spatial modelling of fisheries and scenario simulation of management strategies. Methods Ecol. Evolut. 11, 859–868. doi: 10.1111/2041-210X.13394
Da-Rocha, J., Prellezo, R., Sempere, J., and Taboada Antelo, L. (2017). A dynamic economic equilibrium model for the economic assessment of the fishery stock-rebuilding policies. Mar. Policy 81, 185–195. doi: 10.1016/j.marpol.2017.03.029
Doering, R., Kempf, A., Belschner, T., Berkenhagen, J., Bernreuther, M., Hentsch, S., et al. (2017). Research for PECH Committee - BREXIT Consequences for the Common Fisheries Policy-Resources and Fisheries - a Case Study, European Parliament, Policy Department for Structural and Cohesion Policies. Brussels: European Parliament.
Doll, J. (1988). Traditional economic models of fishing vessels: a review with discussion. Mar. Resour. Econom. 5, 99–123. doi: 10.1086/mre.5.2.42628924
EUMOFA (2018). The EU Fish Market 2018 Edition. Available online at: http://www.eumofa.eu/ (accessed 10 September 2019).
EUMOFA (2019a). Monthly First Sale 2007-2020. Available online at: http://www.eumofa.eu/web/eumofa/bulk-download (accessed 13 June 2019).
EUMOFA (2019b). Monthly Marine Gasoil Price. Available online at: http://www.eumofa.eu/bulk-download-page (accessed 13 June 2019).
European Commission (2018). The Commission Presents Strategy For A Climate Neutral Europe By 2050 - Questions And Answers. Brussels: European Commission.
European Parliament (2017). Research for PECH Committee - Common Fisheries Policy and BREXIT. Legal Framework For Governance, European Parliament, Policy Department For Structural And Cohesion Policies. Brussels: European Commission.
Fässler, S. M. M., Payne, M. R., Brunel, T., and Dickey-Collas, M. (2011). Does larval mortality influence population dynamics? An analysis of North Sea herring (Clupea harengus) time series. Fish. Oceanogr. 20, 530–543. doi: 10.1111/j.1365-2419.2011.00600.x
Frost, H., Andersen, J., Hoff, A., and Thøgersen, T. (2009). The EIAA Model: Methodology, Definitions And Model Outline. Copenhagen: Institute of Food and Resource Economics.
Frost, H., Andersen, P., and Hoff, A. (2013). Management of complex fisheries: lessons learned from a simulation model. Can. J. Agric. Econ. 61, 283–307. doi: 10.1111/cjag.12014
Fulton, E. A., Bax, N. J., Bustamante, R. H., Dambacher, J. M., Dichmont, C., Dustan, P. K., et al. (2015). Modelling marine protected areas: insights and hurdles. Philos. Trans. R. Soc. B 370, 1–17. doi: 10.1098/rstb.2014.0278
García, D., Prellezo, R., Sánchez, S., Andrés, M., and Urtizberea, A. (2014). Technical manual for FLBEIA A R Package To Conduct Bio-Economic Impact Assessments Using FLR (Version 1.1). Available online at: http://flbeia.azti.es/wp-content/uploads/2014/01/ManualFLBEIA.pdf (accessed 29 April 2019).
Gelder, J. W., and Spaargaren, P. (2011). Company Structures, Financing And Costs Of Dutch Pelagic Freezer Trawler Companies. Profundo Economic Research. Final Report. 47pp. Available online at: https://d3jo9v3q67jiro.cloudfront.net/2016/07/04161122/Company-structures-financing-and-costs-of-Dutch-.-Greenpeace.pdf (accessed December 12, 2019).
Gröger, J. P., Kruse, G. H., and Rohlf, N. (2009). Slave to the rhythm: how large-scale climate cycles trigger herring (Clupea harengus) regeneration in the North Sea. ICES J. Mar. Sci. 67, 454–465. doi: 10.1093/icesjms/fsp259
Hamon, K. G., Frusher, S. D., Little, L. R., Thébaud, O., and Punt, A. E. (2014). Adaptive behaviour of fishers to external perturbations: simulation of the tasmanian rock lobster fishery. Rev. Fish Biol. Fish. 24, 577–592. doi: 10.1007/s11160-013-9302-1
Hannesson, R. (2013). Implicit Cooperation? The Northeast Atlantic Mackerel Fishery. SNF Working Paper No. 14/13. Bergen: Institute for Research in economics and business administration.
Hoefnagel, E., and de Vos, B. (2017). Social and economic consequences of 40 years of Dutch quota management. Mar. Policy 80, 81–87. doi: 10.1016/j.marpol.2016.09.019
Hoefnagel, E., de Vos, B., and Buisman, E. (2015). Quota swapping, relative stability, and transparency. Mar. Policy 57, 111–119. doi: 10.1016/j.marpol.2015.03.012
Holland, D. S. (2004). Spatial fishery rights and marine zoning: a discussion with reference to management of marine resources in New England. Mar. Resour. Econ. 19, 21–40. doi: 10.1086/mre.19.1.42629417
Hufnagl, M., and Peck, M. A. (2011). Physiological individual-based modelling of larval Atlantic herring (Clupea harengus) foraging and growth: insights on climate-driven life-history scheduling. ICES J. Mar. Sci. 68, 1170–1188. doi: 10.1093/icesjms/fsr078
ICES (2007). Report of the Study Group on Recruitment Variability in North Sea Planktivorous Fish (SGRECVAP), 7-11 May 2007, ICES Document CM 2007/LRC: 07. 69. Plymouth: ICES.
ICES (2018a). Report of the Benchmark Workshop on Pelagic Stocks (WKPELA 2018), 12-16 February 2018, ICES HQ. ICES CM 2018/ACOM: 32. Copenhagen: ICES.
ICES (2018b). Report of the Herring Assessment Working Group for the Area South of 62°N (HAWG). 29-31 January 2018 and 12-20 March 2018. ICES HQ. ICES CM 2018/ACOM: 07. Copenhagen: ICES.
ICES (2018c). Report of the Working Group of Widely Distributed Stocks (WGWIDE), 28 August - 3 September 2018, ICES CM 2018/ACOM: 23. Torshavn: ICES.
ICES (2019a). Norway Special Request For Revised 2019 Advice On Mackerel (Scomber Scombrus) In Subareas 1-8 and 14, and in Division 9.1 (the Northeast Atlantic and adjacent Waters). In Report of the ICES Advisory Committee, 2019. ICES Advice 2019, sr.2019.09. Copenhagen: ICES.
ICES (2019b). Working group on widely distributed stocks (WGWIDE). ICES Sci. Rep. 36:948. doi: 10.17895/ices.pub.5574
Jensen, F., Frost, H., Thøgersen, T., Andersen, P., and Andersen, J. (2015). Game theory and fish wars: the case of the Northeast Atlantic mackerel fishery. Fish. Res. 172, 7–16. doi: 10.1016/j.fishres.2015.06.022
Jones, M., Dye, S., Pinnegar, J., Warren, R., and Cheung, W. (2015). Using scenarios to project the changing profitability of fisheries under climate change. Fish Fish. 16, 603–622. doi: 10.1111/faf.12081
Kazokoglu, C., and Jakštas, T. (2019). IMO 2020 Regulation and the Potential Effects to the Refining and Shipping Markets. Vilnius: NATO Energy Security Centre of Excellence.
KNARR (2019a). Pelagic Freezer Trawler. Available online at: https://www.knarrmaritime.com/pelagic-freezing (accessed 05 August 2019).
KNARR (2019b). Pelagic RSW. Available online at: https://www.knarrmaritime.com/pelagic-rsw (accessed 05 August 2019).
Léopold, M., Cornuet, N., Andréfouët, S., Moenteapo, Z., Duvauchelle, C., Raubani, J., et al. (2013). Comanaging small-scale sea cucumber fisheries in New Caledonia and Vanuatu using stock biomass estimates to set spatial catch quotas. Environ. Conserv. 40, 367–379. doi: 10.1017/S037689291300009X
Lynam, C. P., Heath, M. R., Hay, S. J., and Brierley, A. S. (2005). Evidence for impacts by jellyfish on North Sea herring recruitment. Mar. Ecol. Prog. Ser. 298, 147–167. doi: 10.3354/meps298157
Maynou, F., Martínez-Baños, P., Demestre, M., and Franquesa, R. (2014). Bio-economic analysis of the Mar Menor (Murcia, SE Spain) small-scale lagoon fishery. J. Appl. Ichthyol. 30, 978–985. doi: 10.1111/jai.12460
Nash, R. D. M., and Dickey-Collas, M. (2005). The influence of life history dynamics and environment on the determination of year class strength in North Sea herring (Clupea harengus L.). Fish. Oceanogr. 14, 279–291. doi: 10.1111/j.1365-2419.2005.00336.x
Nash, R. D. M., Dickey-Collas, M., and Kell, L. T. (2009). Stock and recruitment in North Sea herring (Clupea harengus); compensation and depensation in the population dynamics. Fish. Res. 95, 88–97. doi: 10.1016/j.fishres.2008.08.003
Nielsen, J. R., Thunberg, E., Holland, D., Schmidt, J., Fulton, E., Bastardie, F., et al. (2017). Integrated ecological-economic fisheries models - Evaluation, review and challenges for implementation. Fish Fish. 19, 1–29. doi: 10.1111/faf.12232
Ørebech, P. (2013). The “lost mackerel” of the north east atlantic - the flawed system of trilateral and bilateral decision-making. Intern. J. Mar. Coast. Law 28, 1–31. doi: 10.1163/15718085-12341276
Pan, H., Failler, P., and Floros, C. (2007). A Regional Computable General Equilibrium Model For Fisheries. CEMARE Research Paper no.163. Portsmouth: University of Portsmouth.
Pascoe, S., Arnason, R., and Lindebo, E. (2008). Quantitative economic analysis in European fisheries: models of fleet behaviour and catchability. Aquat. Living Resour. 21, 223–225. doi: 10.1051/alr:2008041
Pascoe, S., Kahui, V., Hutton, T., and Dichmont, C. (2016). Experiences with the use of bioeconomic models in the management of Australian and New Zealand fisheries. Fish. Res. 183, 539–548. doi: 10.1016/j.fishres.2016.01.008
Payne, M. R., Hatfield, E., Dickey-Collas, M., Falkenhaug, T., Gallego, A., Gröger, J., et al. (2009). Recruitment in a changing environment: the 2000s North Sea herring recruitment failure. ICES J. Mar. Sci. 66, 272–277. doi: 10.1093/icesjms/fsn211
Penas Lado, E. (2016). The Common Fisheries Policy - The Quest for Sustainability. Hoboken, NJ: John Wiley & Sons.
Pope, J. G. (1972). An investigation of the accuracy of virtual population analysis using cohort analysis. Intern. Commission Northwest Atlant. Fish. Res. Bull. 9, 65–74.
Salz, P., Buisman, E., Soma, K., Frost, H., Accadia, P., and Prellezo, R. (2011). FISHRENT: Bio-Economic Simulation And Optimisation Model For Fisheries. LEI Report 2011–2024, ISBN/EAN: 978-90-8615-514-9.
Schaefer, M. B. (1954). Some aspects of the dynamics of populations important to the management of commercial marine fisheries. Bull. Inter. Am. Trop. Tuna Comm. 1, 27–56.
Scientific, Technical, and Economic Committee for Fisheries [STECF] (2012). The 2012 Annual Economic Report on the EU Fishing Fleet (STECF-12-10). 2012, EUR 25452 EN, JRC 73332. Luxembourg: Publications Office of the European Union.
Scientific, Technical, and Economic Committee for Fisheries [STECF] (2016). The 2016 Annual Economic Report on the EU Fishing Fleet (STECF-16-11). Luxembourg: Publications Office of the European Union.
Scientific, Technical, and Economic Committee for Fisheries [STECF] (2017). The 2017 Annual Economic Report on the EU Fishing Fleet (STECF-17-12). Luxembourg: Publications Office of the European Union.
Scientific, Technical, and Economic Committee for Fisheries [STECF] (2018). The 2018 Annual Economic Report on the EU Fishing Fleet (STECF-18-07). Luxembourg: Publications Office of the European Union.
Scientific, Technical, and Economic Committee for Fisheries [STECF] (2019). The 2019 Annual Economic Report on the EU Fishing Fleet (STECF-19-06). Luxembourg: Publications Office of the European Union.
Simons, S. L., Döring, R., and Temming, A. (2015). Combining area closures with catch regulations in fisheries with spatio-temporal variation: bio-economic implications for the North Sea saithe fishery. Mar. Policy 51, 281–292. doi: 10.1016/j.marpol.2014.08.017
Sobrino, J. M., and Sobrido, M. (2017). “The common fisheries policy: a difficult compromise between relative stability and the discard ban,” in The Future of the Law of the Sea. Bridging Gaps Between National, Individual and Common Interests, ed. G. Andreone (Cham: Springer), 23–43. doi: 10.1007/978-3-319-51274-7_2
Spijkers, J., and Boonstra, W. J. (2017). Environmental change and social conflict: the northeast Atlantic mackerel dispute. Reg. Environ. Chang. 17, 1835–1851. doi: 10.1007/s10113-017-1150-4
Tahvonen, O., Quaas, M., Schmidt, J., and Voss, R. (2013). Optimal Harvesting of an Age-Structured Schooling Fishery. Environ. Resour. Econ. 54, 21–39. doi: 10.1007/s10640-012-9579-x
Tietze, U., Prado, J., Le, Ry, J.-M., and Lasch, R. (2001). Techno-Economic Performance of Marine Capture Fisheries And The Role Of Economic Incentives, Value Addition And Changes Of Fleet Structure. Findings of a Global Study And An Interregional Workshop. FAO Fisheries Technical Paper, 421. Rome: FAO.
Tietze, U., Thiele, W., Lasch, R., Thomsen, B., and Rihan, D. (2005). Economic Performance And Fishing Efficiency Of Marine Capture Fisheries. FAO Fisheries Technical Paper, 482. Rome: FAO.
Keywords: bio-economic model, Northeast Atlantic, pelagic fishery, mackerel, herring
Citation: Rybicki S, Hamon KG, Simons S and Temming A (2020) To Fish or Not to Fish – Economic Perspectives of the Pelagic Northeast Atlantic Mackerel and Herring Fishery. Front. Mar. Sci. 7:625. doi: 10.3389/fmars.2020.00625
Received: 22 April 2020; Accepted: 08 July 2020;
Published: 28 July 2020.
Edited by:
Fabio A. Madau, University of Sassari, ItalyReviewed by:
Tommaso Russo, University of Rome Tor Vergata, ItalyBrian R. MacKenzie, Technical University of Denmark, Denmark
Copyright © 2020 Rybicki, Hamon, Simons and Temming. This is an open-access article distributed under the terms of the Creative Commons Attribution License (CC BY). The use, distribution or reproduction in other forums is permitted, provided the original author(s) and the copyright owner(s) are credited and that the original publication in this journal is cited, in accordance with accepted academic practice. No use, distribution or reproduction is permitted which does not comply with these terms.
*Correspondence: Sandra Rybicki, c2FuZHJhLnJ5Ymlja2lAdGh1ZW5lbi5kZQ==; c2FuZHJhLnJ5Ymlja2lAZ214LmRl