 Benjamin B. Lee
 Eric J. Schott
 Donald C. Behringer
 Jamie Bojko
 Andrew Kough6
 Louis V. Plough
- 1University of Maryland Center for Environmental Science, Horn Point Laboratory, Cambridge, MD, United States
- 2University of Maryland Center for Environmental Science, Institute of Marine and Environmental Technology, Baltimore, MD, United States
- 3Fisheries and Aquatic Sciences, University of Florida, Gainesville, FL, United States
- 4Emerging Pathogens Institute, University of Florida, Gainesville, FL, United States
- 5School of Health & Life Sciences, Teesside University, Tees Valley, United Kingdom
- 6Haerther Center for Conservation Research, John G. Shedd Aquarium, Chicago, IL, United States
The blue crab Callinectes sapidus is one of the most widely studied marine crustaceans due to its high economic value and ecological significance. Despite extensive research on the blue crab in North America, many questions remain about the distribution and abundance of the species in the subtropics and tropics. In many places, C. sapidus is sympatric with morphologically similar Callinectes spp., which has implications for seafood mislabeling. To enable rapid identification of the species, we designed and tested two PCR-based assays targeting the 12S rRNA mitochondrial gene. The first assay discriminates C. sapidus from other Callinectes spp. via post-PCR restriction digestion (PCR-RFLP) and the second assay discriminates among multiple Callinectes spp. through High Resolution Melting (HRM) analysis and supervised machine learning analyses. A total of 58 DNA samples from five Callinectes spp. (validated via 12S gene sequencing) were used for assay testing. The PCR RFLP assay was 100% accurate identifying C. sapidus from other Callinectes spp. HRM analysis of amplicons showed good discrimination among species, with distinct clusters formed between species with higher sequence homology. Linear discriminant analysis (LDA) classification of HRM curves was quite successful given the small dataset available, producing ∼90–91% mean accuracy in classification over all species with 100-fold cross validation. Much of the error came from misclassifications between C. similis and C. danae, which are ∼99% similar in sequence for the amplicon; collapsing them into a single class increased overall classification success to 94%. Error also arose from C. bocourti classifications, which had a reference set containing only three samples. Classification accuracy of C. sapidus alone via HRM was 97.5%. Overall, these assays show great promise as rapid and inexpensive methods to identify Callinectes spp. and have application for both ecological research and seafood identification or labeling.
Introduction
The blue crab Callinectes sapdius is widely distributed across the Western Atlantic, ranging from the northern tip of Argentina to Cape Cod in Massachusetts (Williams, 1974), though observations have been made as far north as Nova Scotia, Canada1. Throughout its range, C. sapidus is ecologically and economically important, supporting major fisheries, with 97,896 metric tons harvested in 2016 (Food and Agriculture Organization of the United Nations, 2017). In the central range of C. sapidus there are up to nine additional Callinectes spp., which have similar morphological characteristics and are often mis-identified as C. sapidus (Williams, 1974; Weber et al., 2003; Robles et al., 2007). Adult Callinectes spp. are distinguished by multiple gross morphological characteristics including the abundance, shape, and arrangement of the frontal teeth, anterolateral teeth, granulation of the carapace, and copulatory structures (Williams, 1974). The reliability of these morphological characters for species delineation has been questioned (Williams, 1974; Schubart et al., 2001; Robles et al., 2007) and ongoing debate exists around the designation or existence of certain sub-species based on subtle morphological differences (e.g., C. maracaiboensis; Weber et al., 2003; Robles et al., 2007). Distinguishing between Callinectes species at earlier life-history stages based on morphology is even more challenging because differences in their morphology can be subtle or plastic (Williams, 1974; Ogburn et al., 2011). Misidentifications of Callinectes spp. megalopae as C. sapidus likely led to erroneous inferences of temporal and spatial genetic differentiation for C. sapidus in the Gulf of Mexico (Kordos and Burton, 1993; Sullivan and Neigel, 2017). Finally, uncertainty in the distributions of some of the lesser-studied Callinectes spp. (Williams, 1974; Norse, 1977; Millikin and Williams, 1984), especially in Central America and the Caribbean, can make directed sampling of C. sapidus from these regions difficult.
Molecular phylogenetic analyses of DNA sequence data from Callinectes crabs, in concert with morphological data, has improved the resolution of evolutionary relationships among species. This provides a basis for the reliable identification of Callinectes spp. across its range and in regions where it is invasive (e.g., the Mediterranean Sea; Nehring, 2011; Katsanevakis et al., 2014; Mancinelli et al., 2017). Robles et al. (2007) provided the first comprehensive phylogenetic analysis of the genus, sequencing two mitochondrial ribosomal RNA loci (16S and 12S). The phylogeny revealed two major lineages: the first comprising C. danae, C. similis, C. exasperatus, C. larvatus, C. ornatus, and the second comprising C. affinis, C. bocourti, C. rathbunae contreras, C. sapidus, and C. toxotes, which supports the existence of major morphological differences (length of the gonopods) between the lineages. Robles et al. (2007) also found that C. maracaiboensis could not be reliably differentiated from C. bocourti, thus confirming previous suggestions by Schubart et al. (2001) that it did not warrant separate species designation. With the Callinectes phylogeny better resolved, recent genetic work in the genus has focused on examining phylogeographic patterns of C. sapidus across its range, confirming high within-region gene flow (McMillen-Jackson and Bert, 2004; Feng et al., 2017) and prominent genetic divergences across the equator (Yednock and Neigel, 2014; Plough, 2017; Rodrigues et al., 2017; Macedo et al., 2019; Windsor et al., 2019). The increasing number of applied and evolutionary studies on the blue crab means that reliable and rapid species identification is paramount.
Although DNA sequencing provides a fairly reliable method for species identification among Callinectes spp., rapid and cost-effective tools are emerging that could allow more high-throughput identification of samples. One classic alternative to sequence-based identification of species is PCR-based restriction fragment length polymorphism (PCR-RFLP) analysis, which identifies species based on sequence polymorphism(s) that can be detected by restriction enzyme digestion of a PCR amplicon (e.g., Pourzand and Cerutti, 1993; Telenti et al., 1993). This approach has frequently been used for species identification in both ecological and applied food authentication contexts as a cheaper alternative to DNA sequencing (Russell et al., 2000; Girish et al., 2005; Rasmussen and Morrissey, 2008; Scarano and Rao, 2014; Verrez-Bagnis et al., 2018). Although PCR-RFLP analysis is quite robust, assays designed for multiple species often require multiple enzymes, increasing the cost and lowering the resolution of the assay because of the inability to resolve small differences in restriction fragment sizes on agarose gels (Berry and Sarre, 2007; Fajardo et al., 2010).
High Resolution Melting (HRM) curve analysis is a rapid and sensitive PCR-based species identification method that has risen in popularity over the last decade in the food and agricultural research industries. HRM analysis detects sequence differences in PCR amplicons based on their melting behavior across a range of temperatures at high resolution, which is assessed by changes in fluorescence of DNA intercalating dyes on a quantitative PCR instrument (e.g., Berry and Sarre, 2007; Jeong et al., 2010; Winder et al., 2011; Ramón-Laca et al., 2014; Simko, 2016). The technique is so sensitive that it can detect single base differences (single nucleotide polymorphisms, SNPs) in sequences and is used for mutation screening and SNP genotyping (e.g., Garritano et al., 2009). HRM analysis has been widely used in the food research industry for identification of plant or animal materials due to its high throughput potential (Odell et al., 2005; Jeong et al., 2010; Malewski et al., 2010; Ramón-Laca et al., 2014; Simko, 2016; Pereira et al., 2017, 2018). The use of multiple amplicons or barcodes (multi Bar-HRM) in a multiplexed reaction is also possible, and successfully discriminated ∼30 distinct plant families (Ballin et al., 2019). Combining the power of HRM with clustering statistics or supervised machine learning approaches allows further discrimination of highly similar sequences in a probabilistic framework (Reja et al., 2010; Winder et al., 2011; Bowman et al., 2017). HRM is beginning to be used for identification of marine species in the seafood industry (Fitzcharles, 2012; Jin et al., 2015; Fernandes et al., 2018; Verrez-Bagnis et al., 2018). Blue crab researchers, as well as the fisheries industry, could benefit from a rapid and cost-effective method for reliable identification of species within the Callinectes genus.
In this study, we developed and tested two PCR-based approaches for rapid, high-throughput identification of Callinectes spp. targeting the mitochondrial 12S rRNA gene, which has previously been used for phylogenetic analysis of the genus (Robles et al., 2007) and has extensive sequence data available in NCBI Genbank. Both the PCR-RFLP assay and High Resolution Melting (HRM) analysis of PCR amplicons were applied to samples of C. sapidus and other Callinectes spp. collected from across North, South and Central America. We also used unsupervised clustering statistics and supervised classification (i.e., machine learning) approaches to discriminate among sample melt curves and successfully classify to species, validating the utility of such an approach for future identification of species in the Callinectes genus.
Materials and Methods
Sample Collection
Crabs that were putatively identified as C. sapidus (“blue crab”) based on morphological features (e.g., carapace coloration and granulation, frontal teeth; Williams, 1974) were collected from 10 locations across the Western Atlantic (Figure 1): Cedar Key FL, Long Key FL, Celestùn Mexico, Sergipe Brazil (Brazil-North), Rio Grande Do Sul Brazil (Brazil-South), Carolina Puerto Rico, Point Seraphine St. Lucia, Gulf of Paria Trinidad and Tobago, Choptank River MD, and the Virginia portion of the Chesapeake Bay (VA; See Table 1 for additional sampling and site information). Samples were initially preserved in 50–95% ethanol after collection, but for a number of samples from South America and the Caribbean, they were shipped from collection sites to Baltimore, MD, United States in plastic bags with ethanol soaked-paper towels, due to restrictions on international shipping of large volumes of ethanol. Shipping times were typically less than 1 week. Upon receipt at the Institute of Marine and Environmental Technology in Baltimore, MD, United States they were either frozen at −20°C or submerged in 95% ethanol until extraction. Crabs collected in Florida were collected under Florida Fish and Wildlife Conservation Commission Special Activity License SAL-18-1991-SR. Crabs collected in Virginia were from the winter dredge survey jointly conducted by the Virginia Institute of Marine Science and the Maryland Department of Natural resources under Virginia Marine Resources Commission Scientific Collection permit #17-090 (to Micheal Seebo, Virginia Institute of Marine Science). Crabs from Maryland (Choptank River) were obtained from local fishermen. Collections of crabs from outside of the United States were made by scientific collaborators from the local country and thus, no additional permits were required beyond the scientific collections permits held by the collaborators.
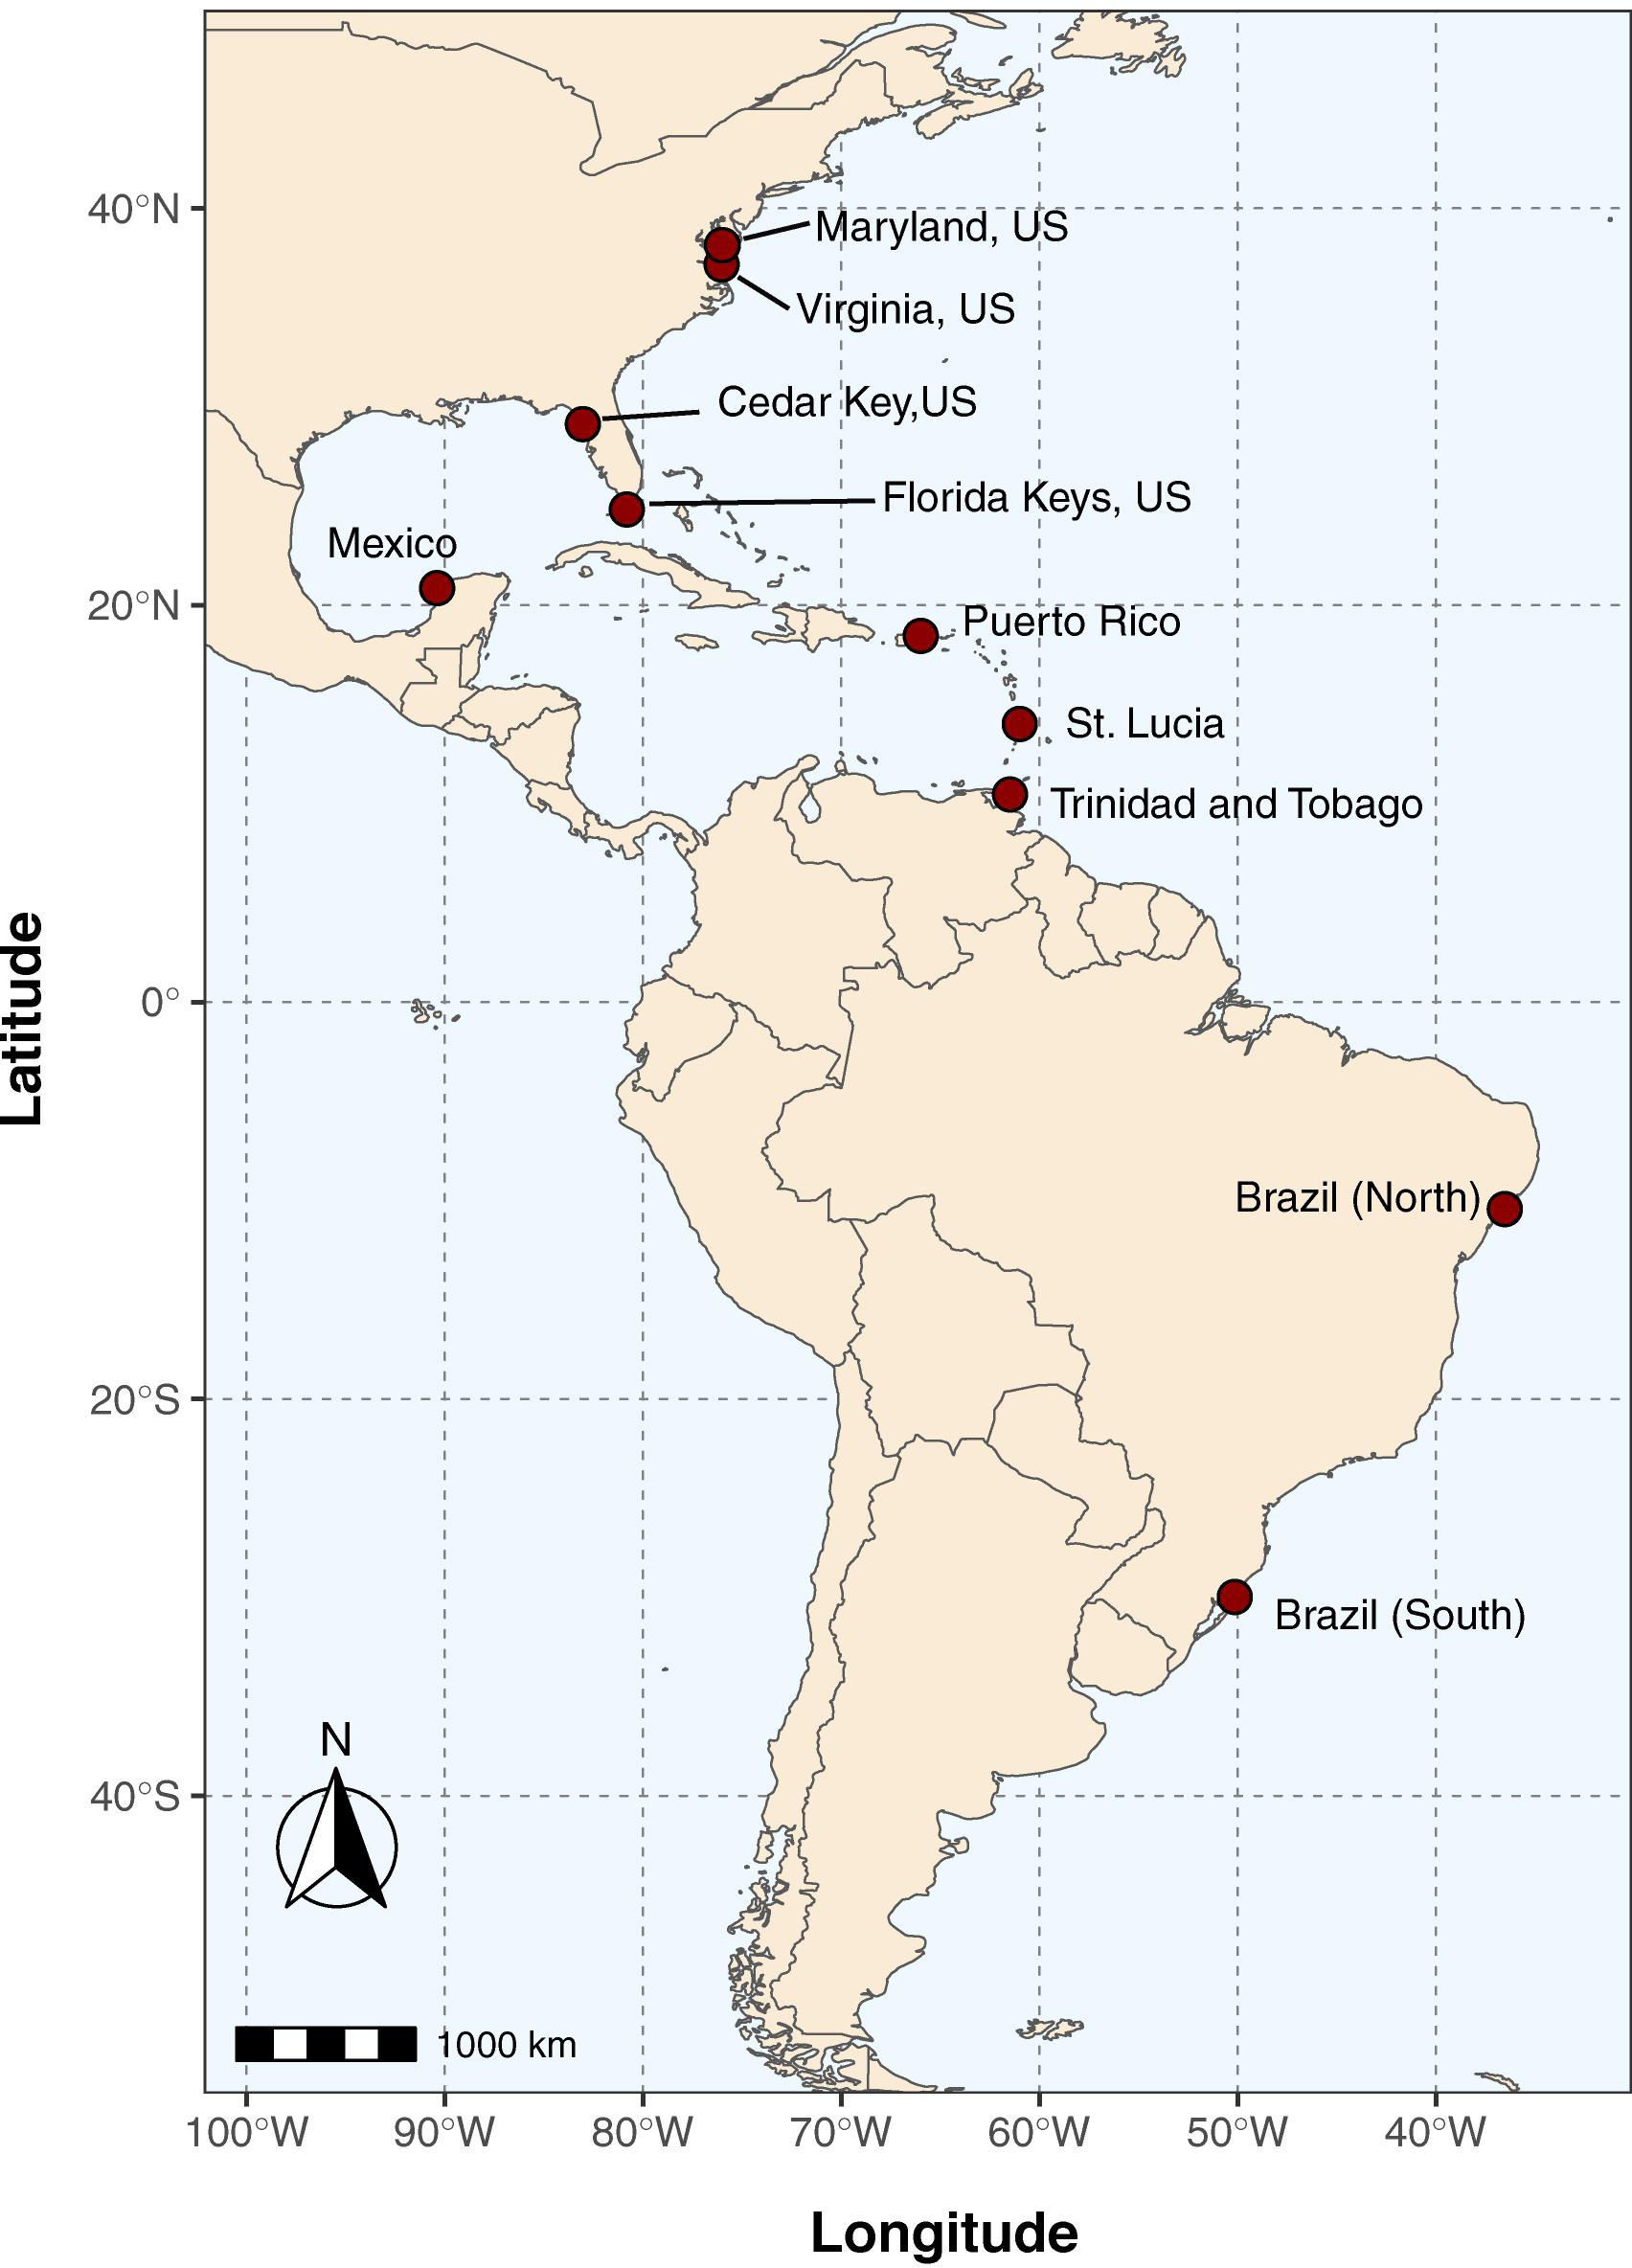
Figure 1. Map of collection locations for Callinectes spp. See Table 1 for sample date, location details, and GPS coordinates at each site.
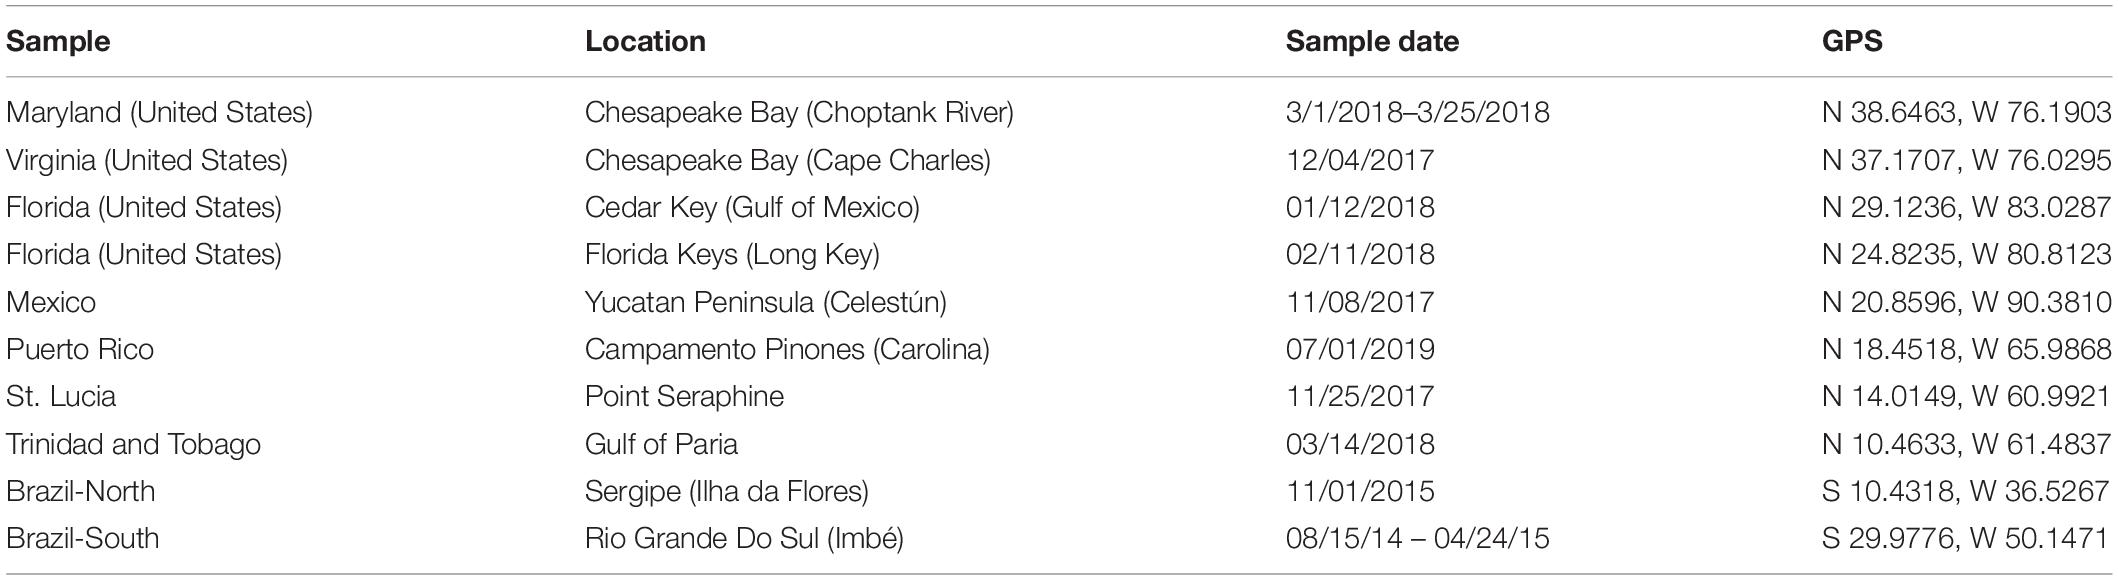
Table 1. Sampling information for Callinectes species.
DNA Extractions, PCR, and Initial Sequencing of the 12S Region
DNA was extracted from a walking leg from each individual using the Omega E.Z.N.A. Blood and tissue kit (Omega BioTek, Norcross, GA, United States) with an overnight incubation at 56°C. A ∼500 bp region of the 12S gene was amplified for each crab specimen with the 12sai (5′-AAACTAGGATTAGATACCCCTATTAT-3′) and 12H2 (5′-ATGCACTTTCCAGTACATCTAC-3′) primer set to determine the species identity (Kocher et al., 1989; Schubart and Koller, 2005). Thermal cycler reactions were performed on a Bio-Rad T100 PCR machine in 25 μL volumes with 12.5 μL 2× Phusion HotStart Mastermix (New England Biolabs), 1.25 μL of each primer at a concentration of 10 μM, 8 μL of water and 2 μL of sample DNA at a concentration of 10–20 ng/μL. PCR cycling conditions were as follows: an initial denaturation step at 95°C for 10 min followed by 40 cycles of 95°C for 1 min, 48°C for 1 min, and 72°C for 2 min, which was followed by a final extension period of 72°C for 10 min and a final hold at 12°C. PCR products were electrophoresed on a 1% agarose gel, stained with ethidium bromide, and imaged on a UVP Geldocit-2 instrument to confirm amplification and expected size. PCR products were then sent to the Arizona State University (ASU) DNA lab for bi-directional Sanger sequencing on an ABI 3730 XL capillary sequencer. Forward and reverse reads were aligned using ChromasPro v. 2.1.8 (Technelysium Pty Ltd., Australia) or Benchling (benchling.com). Trimmed consensus reads (341–461 bp) were identified via the NCBI BLAST+ web portal (Camacho et al., 2008), searching against the non-redundant “nt” database to identify the closest matching species based on sequence homology. This initial sequencing and BLAST identification permitted confirmation of species identity for collected crabs. Verified sequences were then used to design and validate the PCR restriction digestion and HRM-based species identification assays.
Restriction Fragment Length Polymorphism Assay
To design the 12S rRNA PCR-RFLP assay, at least one sequence from each of 13 Callinectes spp. (including C. maracaiboensis) and three species of Portunid crab: Portunus armatus (formerly Portunus pelagicus), P. sanguinolentis, and P. trituberculatus, “blue swimming crabs” often mislabeled as Chesapeake blue crab in processed crab meat; Warner et al., 2015) were downloaded from Genbank and aligned with 12S sequences from our crab samples to identify a novel primer set that would amplify all species but would contain diagnostic SNPs within the region that would discriminate among species in a digest or HRM-based assay. Across the ∼450 bp region, three nucleotide positions were identified in which there was a fixed difference between C. sapidus and all other crab species (Supplementary Datasheet 1). One of these positions (143; File S1) included the recognition site (in C. sapidus) for the restriction enzyme Ssp1 (AATATT). Primers were then designed using Primer 3 (Untergasser et al., 2012) to generate a 180 base pair PCR product within the 12S rRNA gene that included this SNP, but did not have any other Ssp1 cut sites, making the assay simple to interpret: digested or not digested. Digestion with Ssp1 yields two fragments for C. sapidus (size 113, 67 bp) or a single fragment for all other crab species (180 bp). Primers for this assay were: Csap1-F (5′-AAAAATTTGGCGGTGGTTC-3′) and Csap1-R (5′-ATTAGATCAAGGTGCAGCTTATG-3′). The Csap1 amplicon was produced using the GoTaq® Flexi PCR reagent kit (Promega, Madison, WI, United States) in volumes of 25 μl with the following reagents: 0.5 μL of each 10 μM primer, 40–60 ng of template DNA, 5 μl of 5X PCR buffer, 2 μl of 25 mM of MgCl2, 0.5 μl of 10 mM dNTPS, and 1 unit of 5 U/μl Taq polymerase. The PCR cycle conditions consisted of an initial activation step at 95°C for 2 min, and then 25 cycles of 95°C for 30 s, 58°C for 30 s, and 72°C for 30 s, and a final extension of 72°C for 5 min, then a hold at 12°C.
For the digestions of the amplicons, 4 μl of PCR product were added to a digestion master mix consisting of: 0.5 μL of 5,000 units/μL SspI (NEB), 2.0 μL of 10x NEB Cut Smart Buffer, 13.5 μL of water (20 μL total), and incubated at 37°C for 30 min to 3 h. Digestion products were analyzed on 1% agarose gels stained with ethidium bromide on the UVP Gel Doc-It 2 system. We also explored using post-PCR melt curve analysis (Xu et al., 2015) to determine the digestion status of amplicons without the need for gel analysis. Here, 5 μl of SYBR green 2X master mix (Bio-Rad) was added to 20 μL of the digested product, which was then run through a “standard” melt curve protocol (i.e., not high resolution), in which the sample was held at 65°C for 1 min and then increased in temperature from 65 to 95°C at a rate of 0.5°C/5 s with imaging at each increment performed on the Bio-Rad CFX 96 qPCR machine and data processed in the CFX Manager Software v. 3.1. For the 30 min digest incubations (which produced partial digestion; see section “Results” Figure 2), a PCR product was considered to be “digested” if it produced two fluorescence peaks in the melt curve profile (one for the original 180 bp amplicon that was partially digested, and one for the smaller set of ∼67 and 113 bp fragments) or not digested if it only had a single peak in fluorescence (single 180 bp amplicon melting peak). Digest status for each sample was compared to sequence-verified crabs from populations likely to have a mix of Callinectes spp. (e.g., Trinidad and Tobago, St. Lucia; see Table 1) which were amplified, digested, and melted to determine species identification. While the RFLP assay was designed using published sequences from three Portunus spp., we did not have DNA or tissue from these species, so the assay was not tested directly on Portunus crab DNA.
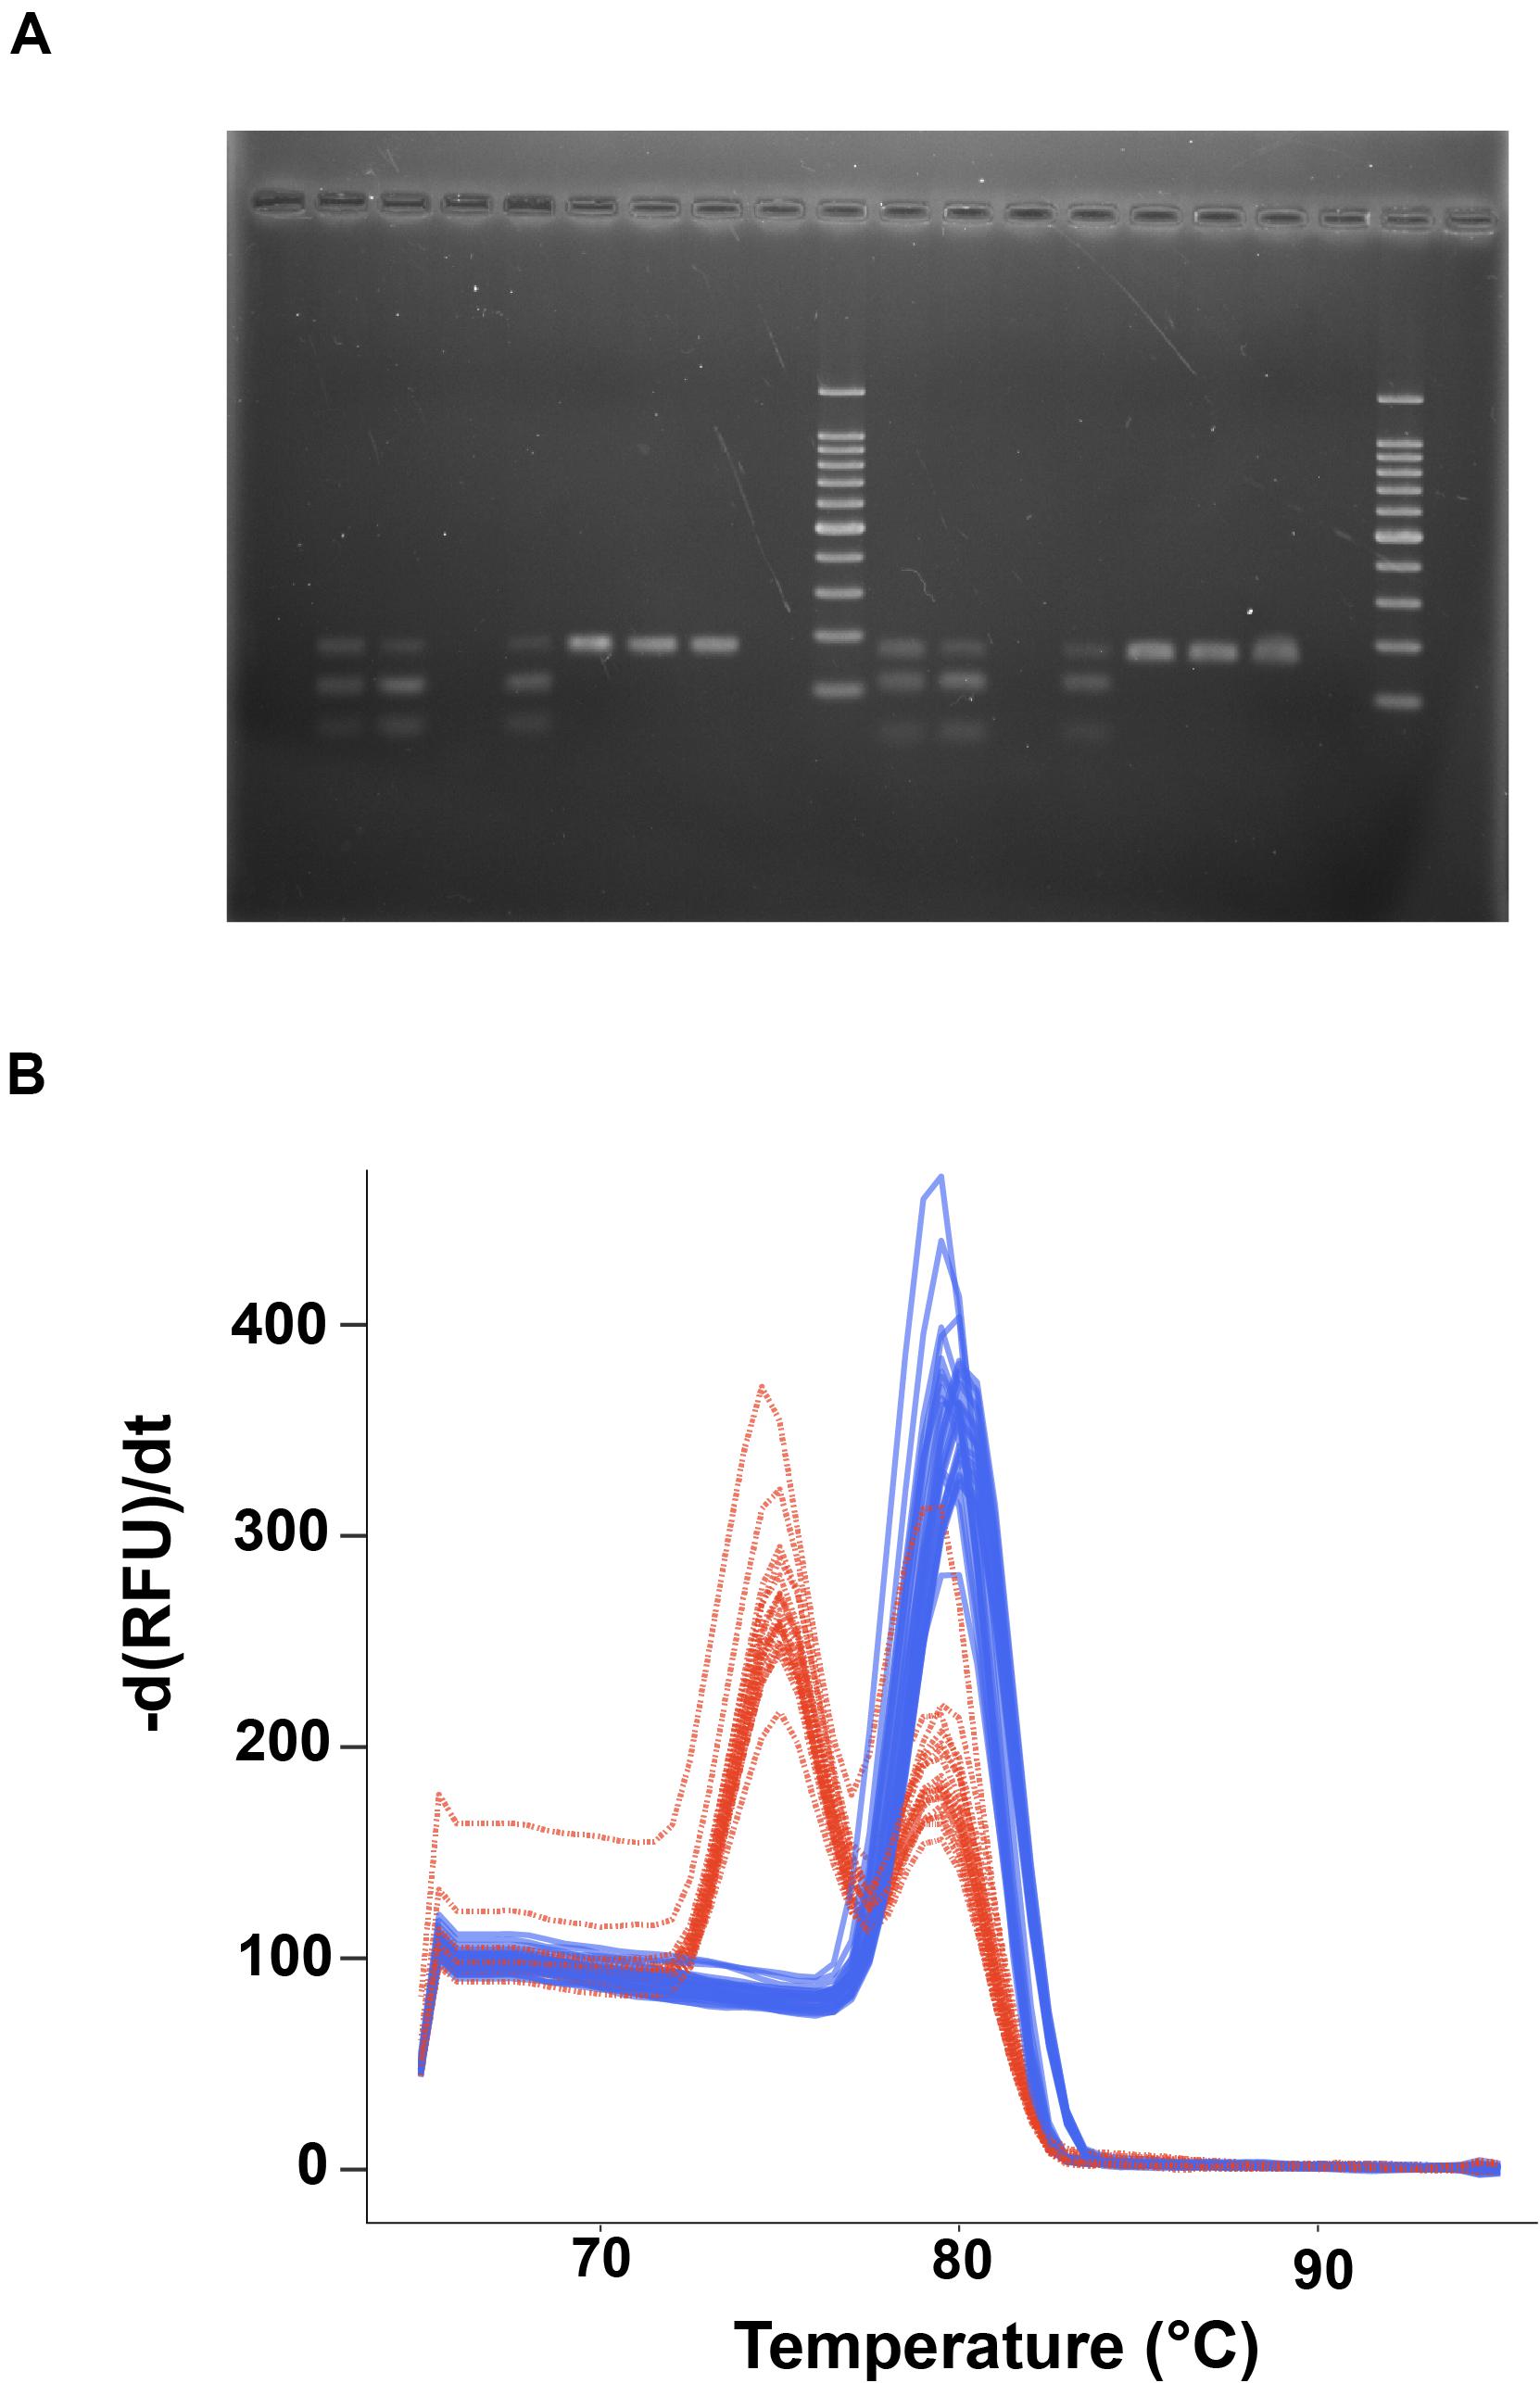
Figure 2. Callinectes species identification using restriction digestion of PCR products. (A) Agarose gel image of digest results for C. sapidus samples (lanes 2,3,5, 11,12,14) and non-sapidus Callinectes crabs (C. danea, lanes 6–8,15–17). Lane 10 is a 100 bp ladder (Promega), with markers every 100 bp from 100 to1000 bp, and at 1500 bp at the top of the ladder. (B) Plot of the negative derivative of fluorescence (relative fluorescence units, RFU) vs. temperature (-d(RFU)/dt) from a standard qPCR melt curve analysis of post-digestion 12S CSap1 PCR products. Red curves are from C. sapidus samples and show two melt peaks indicative of partial digestion of the amplicon (melt peaks at 80°C for the uncut amplicon, 74°C for the digested fragments), blue curves are from non-sapidus species and show a single melt peak from uncut, single amplicons (at 80°C).
High Resolution Melting Assay
A High Resolution Melting (HRM) assay was developed to identify Callinectes spp. using sequence-specific differences in the melt profiles of PCR amplicons from different species (Berry and Sarre, 2007; Simko, 2016). HRM assays use EvaGreen, a sensitive intercalating dye and fine-scale temperature increments (0.1°C) to discern nucleotide-level differences that alter the melt profiles. The Csap1 primers used for the PCR-RFLP assay were also used for HRM assay. Amplifications were performed in 20 μl volumes with 10 μL of Bio-Rad 2× Precision Melt Master mix, 2 μL of each primer at 10 μM, and 40–50 ng of total DNA and run on a Bio-Rad CFX 96 qPCR instrument with the following protocol. First, a standard PCR amplification program was run with initial denaturation at 95°C for 2 min followed by 40 amplification cycles of 95°C for 10 s, 58°C for 30 s, and 72°C 30 s. After amplification, a High Resolution Melting program was run which initialized with a 30 s hold at 95°C, a 60 s hold at 60°C, and then an increase in temperature from 70 to 95°C at a rate of 0.1°C/10s, with fluorescence recording at each 0.1°C degree increase. Melt curve data were analyzed with the Bio-Rad Precision Melt Curve analysis software and the relative fluorescence unit (RFU) values from all non-negative samples were normalized by adjusting the start (pre-melt) and end (post-melt) fluorescence signals to be at 1 and 0, respectively, so that all curves were on the same scale.
Analysis of HRM Data
Sixty-four normalized melt curves from six Callinectes spp. were imported as a dataset into R (R Core Team, 2018), with each sample as a distinct row and each column containing the normalized RFU values at a given temperature. This dataset included amplicons created from a synthesized ∼450 bp 12S rRNA oligo for C. similis and duplicates of the DNA of 5 individual crabs amplified on separate qPCR runs, bringing the total number of samples analyzed for HRM from 58 to 64. A difference curve for each sample was then calculated by subtracting a vector of the normalized RFU values for a given sample (a row) from a “reference” sample row, which was either a single sample or the mean of multiple samples from the same classification or species. A number of different reference samples (i.e., different species melt curves used as reference) were tested for their effect on species classification (assignment) from melt curves (see below). The difference curves were then trimmed to a temperature range that maximized the differences in the melt curves among samples and was then directly used to examine differences in melt profiles among species (Figure 3).
Figure 3. Plot of HRM difference curves for samples from five Callinectes spp. Curves represent the change (delta, Δ) in relative fluorescence units (RFUs) across temperatures relative to a reference sample (C. sapidus from Maryland), which plots at zero across all temperatures (no difference from itself). Curves for each sample are colored by Callinectes spp. group, which is based on NCBI BLAST results for ∼500 bp 12S rRNA Sanger sequence reads.
To examine cluster tendency of the melt curve data and thus the potential power of the multivariate curve data to discriminate among species, we estimated the Hopkins statistic (a measure of clusterability) in the R package factoextra (Kassambara and Mundt, 2017) and then performed principle components analysis (PCA), and hierarchical k means (hybrid) clustering of the data. To determine the optimal number of clusters, we employed four visual methods (silhouette, elbow, and gap statistic methods, and the Hubert index), all of which were calculated in factoextra or nbclust package (Charrad et al., 2014) and a Bayesian information criterion (BIC) approach in the Mclust package (Scrucca et al., 2016). The most consistent value of K identified (majority consensus) was used in the hybrid k-means clustering.
Next, we employed a machine learning classification approach, linear discriminant analysis (LDA) from the R package MASS (Venables and Ripley, 2002), to classify species based on the change in multivariate fluorescence values across temperatures (melt curve data). LDA is frequently used as a dimensionality reduction technique in machine learning and classification and has been explored for analysis of HRM data in previous studies (e.g., Reja et al., 2010; Athamanolap et al., 2014). LDA models were created using class (species) information for all samples based on 12S rRNA Sanger sequence-based identification (C. sapidus, C. danae, C. similis, C. larvatus, or C. bocourti). Species assignment success of LDA models was assessed via cross validation, randomly sampling the 64 samples into training and validation sets (½ the samples each) 100 times and assessing assignment success and sources of error. We created LDA models with varying reference curves (different species used as references to generate the difference curves), and with different species groups. We first examined classification success for all five species, then examined classification of just four groups, combining C. similis and C. danae into one group due to high similarity in their 12S sequences and melt curves (see section “Results”). Then we examined the impact of using different reference samples to generate the difference curve on the LDA classification success. We also examined the effect of varying the resolution of the temperature data analyzed (i.e., RFU values every 0.1, 0.5 or 1.0 degree C) on classification success. Finally, we used a Random Forest classification approach (Breiman, 2001) to classify melt curves though the R package RandomForest (Liaw and Wiener, 2002) as a complementary ML approach. Random Forest classification success was reported as the out-of-bag error (and its standard error) with 10-fold cross validation. A detailed set of scripts for formatting of HRM data, difference curve generation and plotting of data, as well as code for LDA analysis and cross-validation, are available in Supplementary Material (Supplementary Datasheet 2). Raw HRM data are included in Supplementary Material (Supplementary Datasheet 3). R version 3.5.2 was used for all clustering and machine learning classification analyses (R Core Team, 2018) and all plots were produced in the R package ggplot2 (Wickham, 2016).
Results
12S Sequencing Results
A 460 bp amplicon of the 12S locus was sequenced from a total of 58 crabs from across the range of C. sapidus. Comparing sequences to the GenBank non-redundant “nt” database via NCBI BLAST, n = 32 (55%) of sequences showed very high homology to published sequences for the blue crab C. sapidus (highest e-values for C. sapidus sequences) with >97% identity across >89% of the query (Table 1, Supplementary Datasheet 4). Callinectes sapidus was identified from all collection locations except for Ilha da Flores, Sergipe Brazil (Brazil-North), and all crabs from the Chesapeake Bay (Maryland and Virginia, United States) were identified as C. sapidus (Table 2, Supplementary Datasheet 4). The rest of the sequences (n = 26) had highest BLAST matches (highest e-values) to other Callinectes spp. (>97% identity), suggesting that they were not C. sapidus. Twenty-three of the 26 non-sapidus samples showed much lower percent identity to C. sapidus (91–92%) and were identified as C. similis, C. danae, or C. larvatus (Table 2, Supplementary Datasheet 4). Callinectes similis were identified from Florida Keys (Long key) and St. Lucia samples, C. larvatus were identified primarily in the St. Lucia samples but also from a single crab in the Florida Keys, and C. danae were identified in samples from St. Lucia, Trinidad and Tobago, and Brazil (Sergipe and Rio Grande do Sul). The other three non-sapidus sequences, all from Puerto Rico, were identified as C. bocourti (highest BLAST e-value) but still had relatively high homology to C. sapidus sequences in GenBank (96–98% sequence identity; Supplementary Datasheet 4). All 12S sequences were deposited to Genbank (accession #’s: MT199888–MT199946).
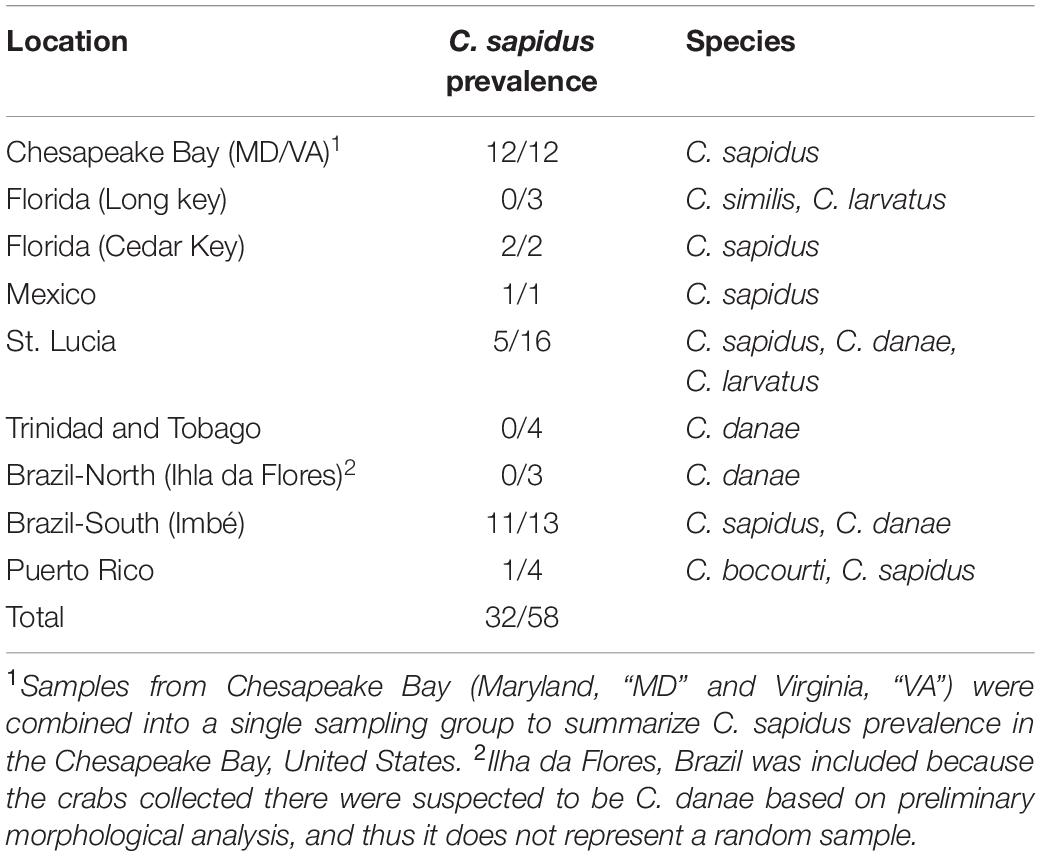
Table 2. Species composition of Callinectes spp. crabs across sample locations based on sequencing of 12S rRNA gene.
Restriction Digest Assay Results
The PCR-RFLP assay for a 180 bp portion of the 12S rRNA gene was tested for its ability to discriminate blue crab (C. sapidus) from other Callinectes spp. Initial tests were conducted using sequence-verified controls of C. sapidus and C. danae. Agarose gel images of the 30 min digestions confirmed that C. sapidus amplicons were partially digested and produced two fragments; one at ∼180 bp (the original amplicon, not completely digested), and another fragment <100 bp (Figure 2A). Callinectes danae amplicons, on the other hand, were not digested (one 180 bp fragment; Figure 2A). The 30 min enzyme incubations produced partially digested products which were sufficient to resolve sequence (species) differences, while the 3 h digestions produced more completely digested fragments from C. sapidus (∼67 and 113 bp; Supplementary Datasheet 5). Next, digested PCR products from both a 30 min and 3 h digestion were incubated with SYBR green PCR mastermix and run through a standard qPCR melt protocol to assess digestion assay results without agarose gel analysis. In Figure 2B, we show SYBR melt profiles for 52 digested samples (30 min) from a variety of populations (e.g., Trinidad and Tobago, Mexico, Chesapeake Bay, United States) and two distinct curve profiles were observed: a single peak with a melt temperature of ∼80°C (blue lines) that represents the undigested 180 bp fragment (Callinectes spp. other than C. sapidus) and a two-peak profile (red lines) with melt peaks at ∼75°C and 80°C that represents the partially digested PCR product for C. sapidus amplicons (smaller fragments and the intact 180 bp amplicons). An enzyme incubation time of 3 h produced a full digestion with a singular peak at 75°C for C. sapidus amplicons (Supplementary Datasheet 5). We observed that 100% of the sequence-verified samples from all 5 species digested as expected based on their sequence identification (i.e., two melt peaks for C. sapidus, one melt peak for other Callinectes spp.).
High Resolution Melt Analysis
Sixty-four 12S amplicon melt curves were used to test the ability of the high-resolution melt (HRM) assay to discriminate among species. First, difference curves were generated for all normalized melt curves based on a C. sapidus reference (Csap 1; Supplementary Datasheet 4) and Figure 3 shows species-specific patterns of melting (change in fluorescence) from 70° to 79° C. Based on the Hopkins statistic (H = 0.0879), melt profile data (difference curves) had high clustering tendency (cf. a random expectation of ∼0.5) indicating they could be useful for discriminating among species. Tests for the optimal number of k-means clusters within the HRM curves indicated that between 3 and 6 clusters were possible, with k = 4 or k = 5 clusters representing majority of methods (majority consensus). Using k = 4, hierarchical k-means clustering revealed fairly strong or consistent clustering of individual melt profiles within species groups (Figure 4A). C. sapidus samples were grouped across two distinct clusters that were quite distant from the other species clusters, but included a single C. bocourti individual. C. danae and C. similis samples belonged to a single cluster and C. larvatus and the remaining C. bocourti samples clustered together forming the final group. Geographic distance did not correlate with the two C. sapidus clusters. Principle components analysis (PCA) produced similar patterns of melt curve clustering within species, but with significant overlap between them (Figure 4B). Data points from C. sapidus samples, which made up the largest proportion of samples across all species, had a fairly large spread across the first two principle components, overlapping significantly with the 95% confidence ellipse and cluster of C. bocourti samples. Callinectes larvatus samples had the narrowest 95% confidence ellipse and clustered distinctly from all other species, while C. danae and C. similis had significant overlap of data points and appeared to form a single, large cluster.
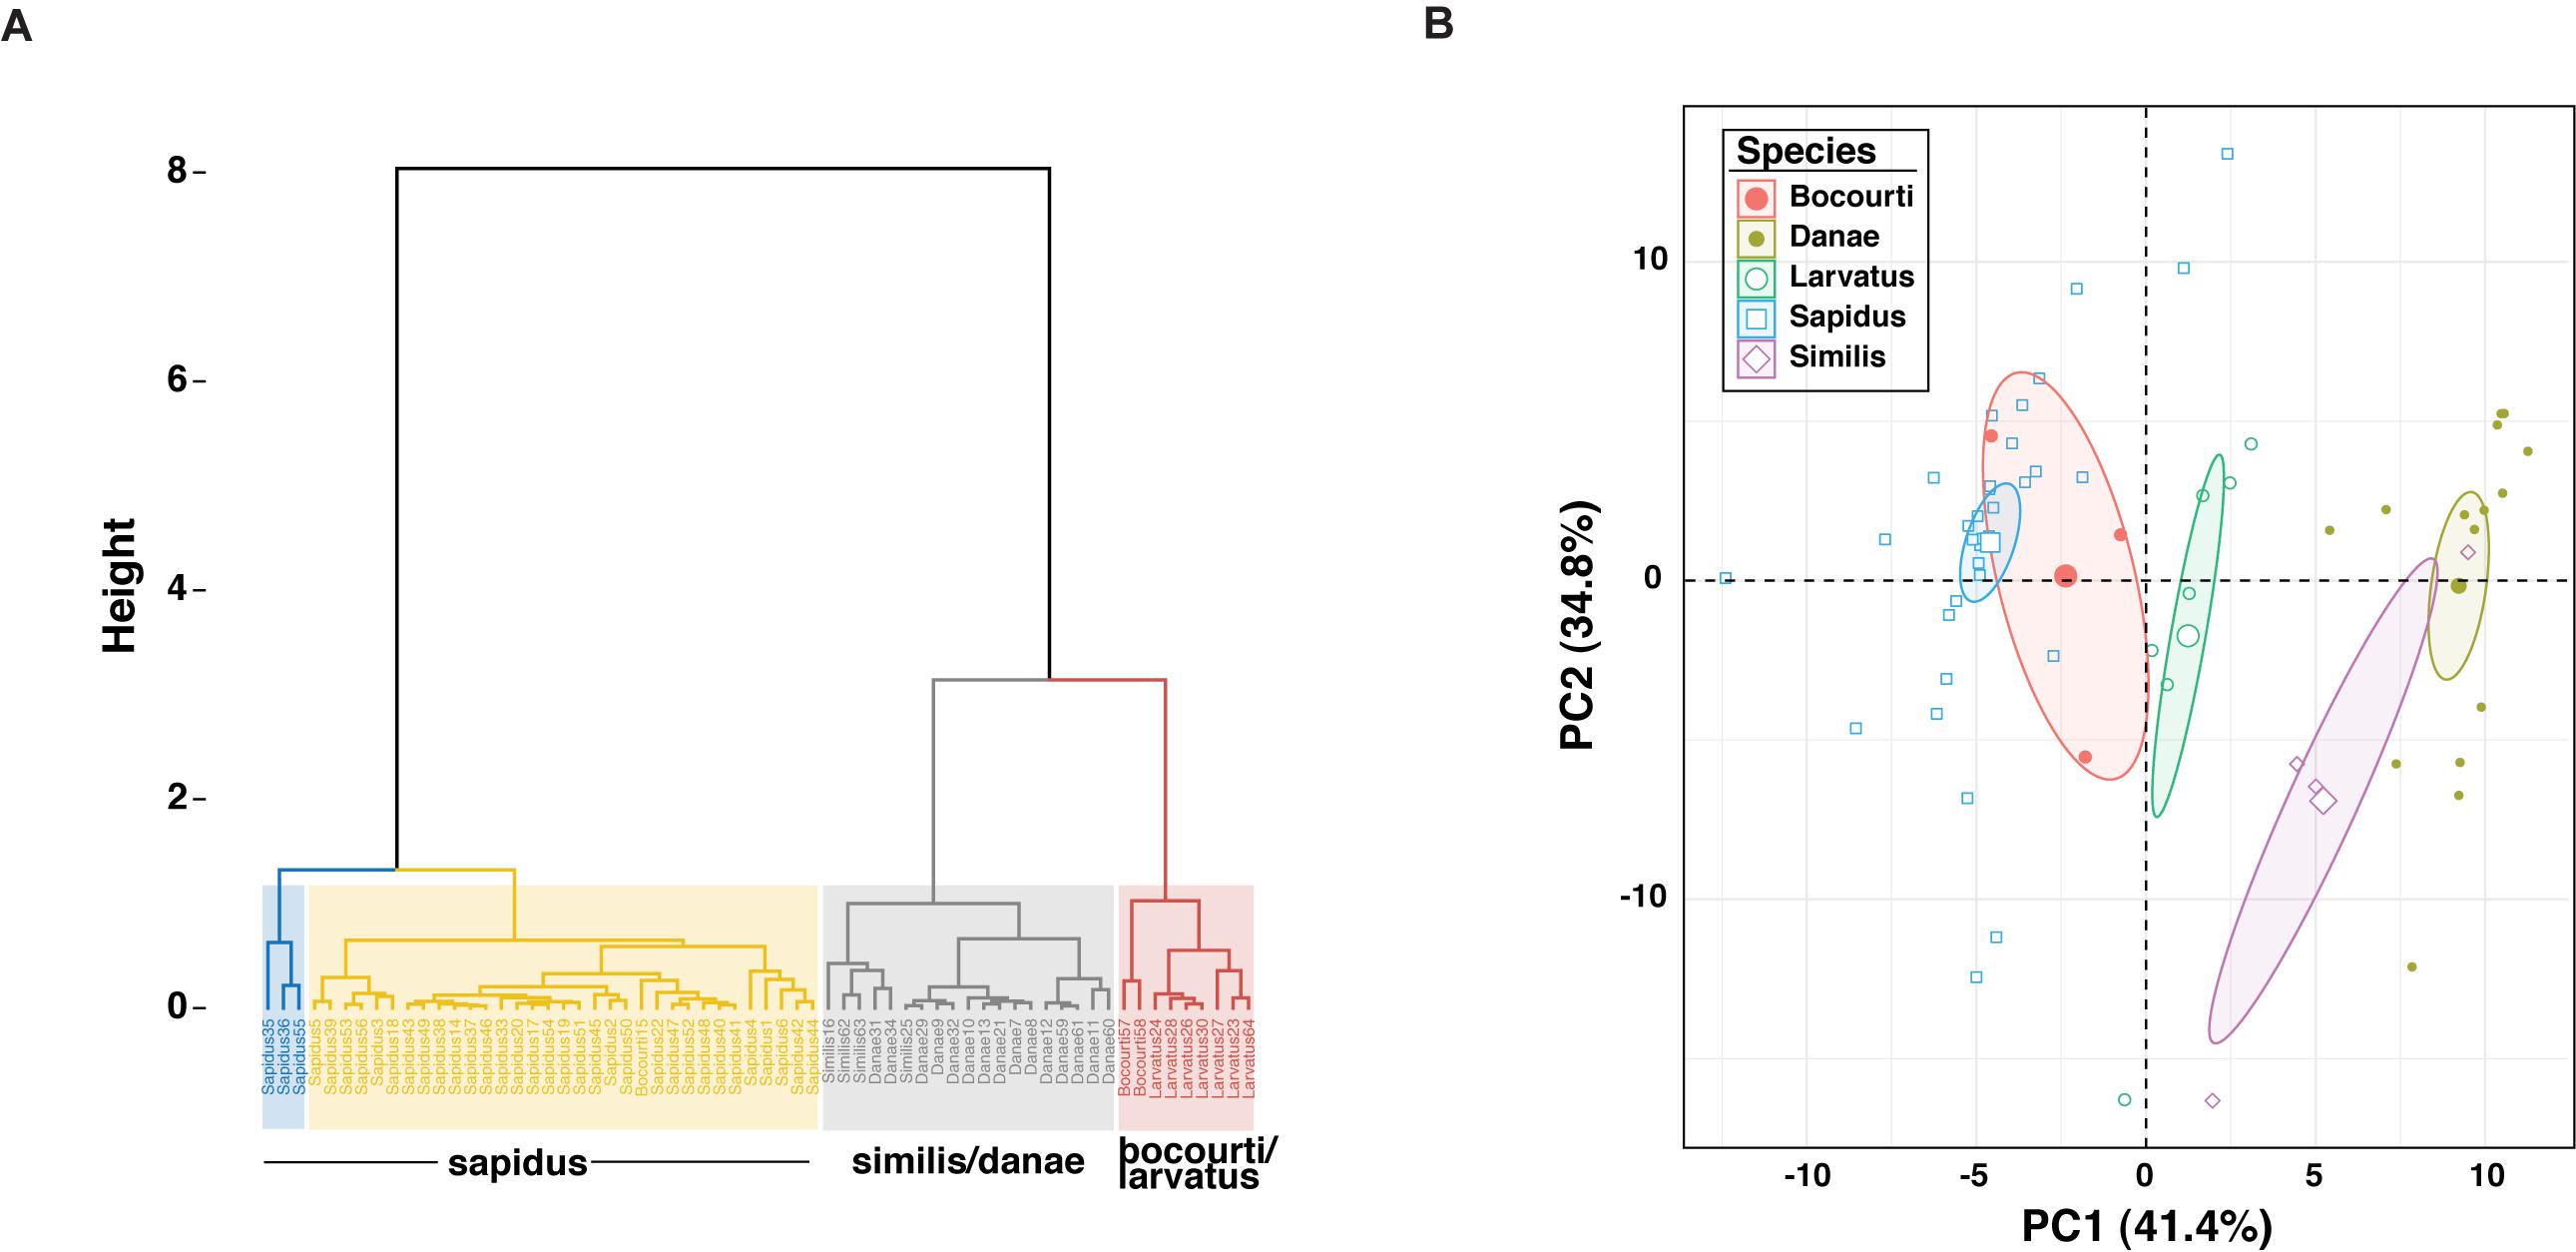
Figure 4. Cluster and PCA results for high resolution melt curve (HRM) data. (A) Shows the hierarchical K-means clustering results for the 64 melt curves for k = 4 clusters. Individual samples are named by their 12S Sanger sequence-based species identification (C. sapidus, Sapidus; C. danae, Danae; C. similis, Similis; C. bocourti, Bocourti; C. larvatus, Larvatus) and the species composition of each cluster is summarized in the text below each cluster. C. sapidus HRM data were resolved into two separate clusters (blue and yellow), while C. similis and C. danae formed a single cluster (gray) as did C. bocourti/larvatus (red). (B) Shows PCA results for the HRM data, with samples from each species identified as a distinct color. Ellipses represent the 95% confidence ellipses. Each axis displays the proportion of the total variability explained by each principle component or PC.
To test the predictive power of the HRM curve data, we used linear discriminant analysis (LDA) to perform supervised classification of the difference curves for Callinectes spp. identification. Randomly dividing the 64 samples into training and validation sets (½ each) 100 times, LDA was able to robustly discriminate among classes (Figure 5), and assignment success among the five Callinectes spp. averaged 89.6% (median 91.7%) using a C. sapidus reference (Figure 6). Using other species samples as difference curve references produced very similar rates of mean classification success: classification success was 89.6% for C. danae and C. similis references and 88.4% for C. bocourti and C. larvatus references (Figure 6). Variance in the mean assignment success across training/validation sets appeared to be highest for the C. larvatus reference. Interestingly, reducing the resolution or increment of the temperature data used from 0.1°C to 0.5°C to 1.0°C (i.e., fewer data points) appeared to slightly increase the classification success for runs with a C. sapidus reference (Figure 6). Mean classification success increased from 89.6% (median 91.7%) for a step size of 0.1°C to 92% (median 93.8%) for a step size of 1°C. These differences were not statistically significant, however (ANOVA P > 0.05). Sources of classification error were not random among the species. Classifications of C. bocourti individuals (true species identity) to the wrong species (erroneous classifications) occurred at a rate of almost 75% (most often to C. sapidus; Figure 7) and C. similis individuals were assigned incorrectly to C. danae at a rate of ∼40% of and to C. larvatus at a rate of ∼5%. Callinectes danae, C. sapidus, and C. larvatus individuals were correctly classified at higher rates (∼80–98%): C. sapidus was classified correctly at a rate of 97.3%. After collapsing C. similis and C. danae into a single group, overall species classification success with LDA increased to a mean of 93.9% (median 96.9%, “simDan” group in the box and whisker plot; Figure 6). Using RandomForest classification with all five species (C. sapidus reference) or with C. similis and C. danae collapsed (four species groups), a similar correct classification rate of 93 or 95.2% was achieved, respectively (0.07 or 0.05 out of bag cross-validation error, respectively).
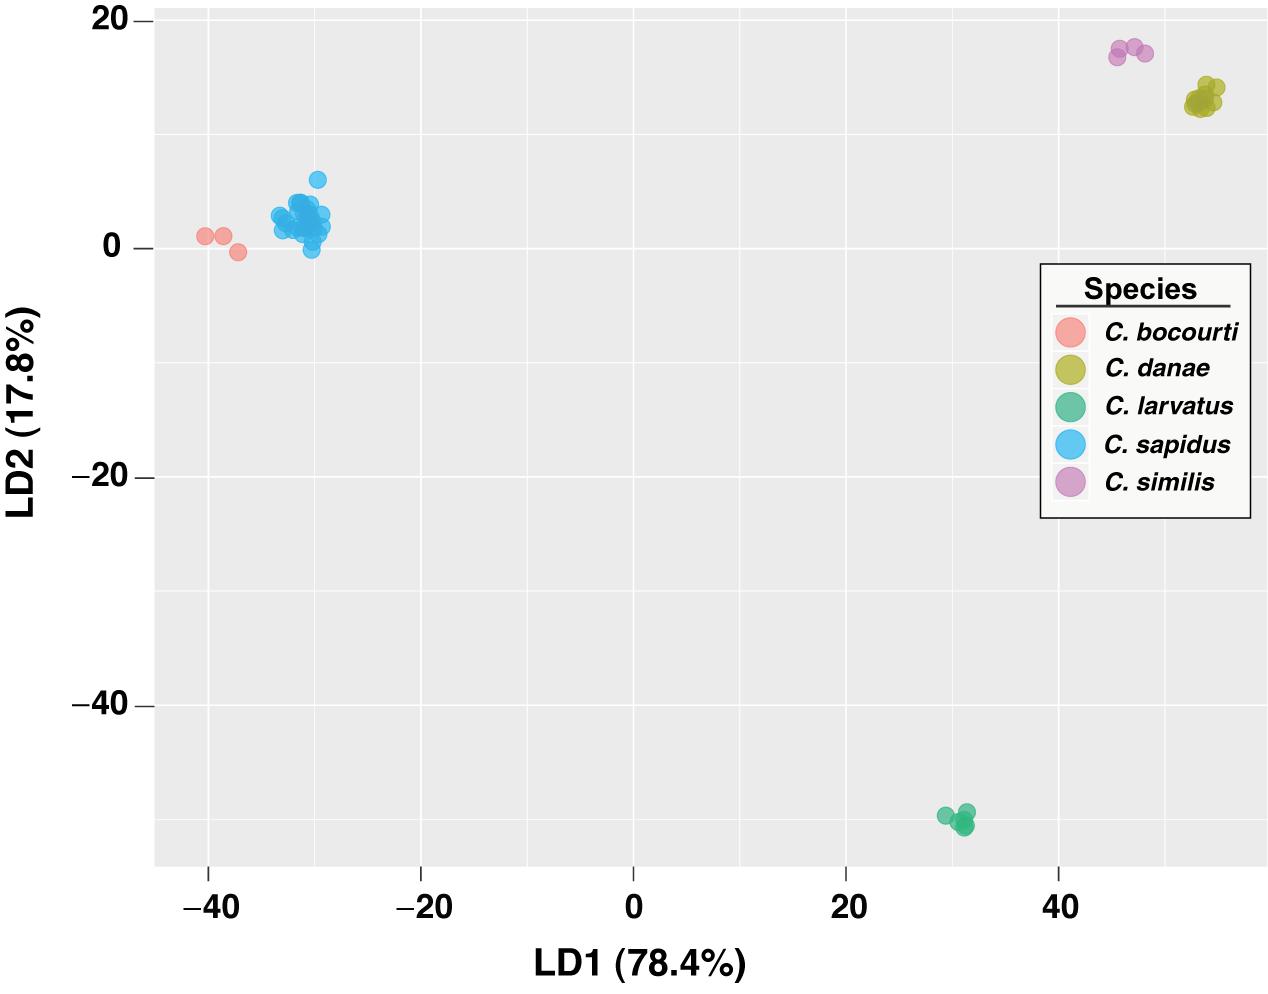
Figure 5. LDA plot of HRM curves for Callinectes spp. samples. Classification results are shown for the first two LD functions from a single LDA model, randomly using half of the data for training and the other half for validation/prediction. Each axis displays the proportion of the variance accounted for by a discriminant function (LD1 or LD2), relative to the total variance.
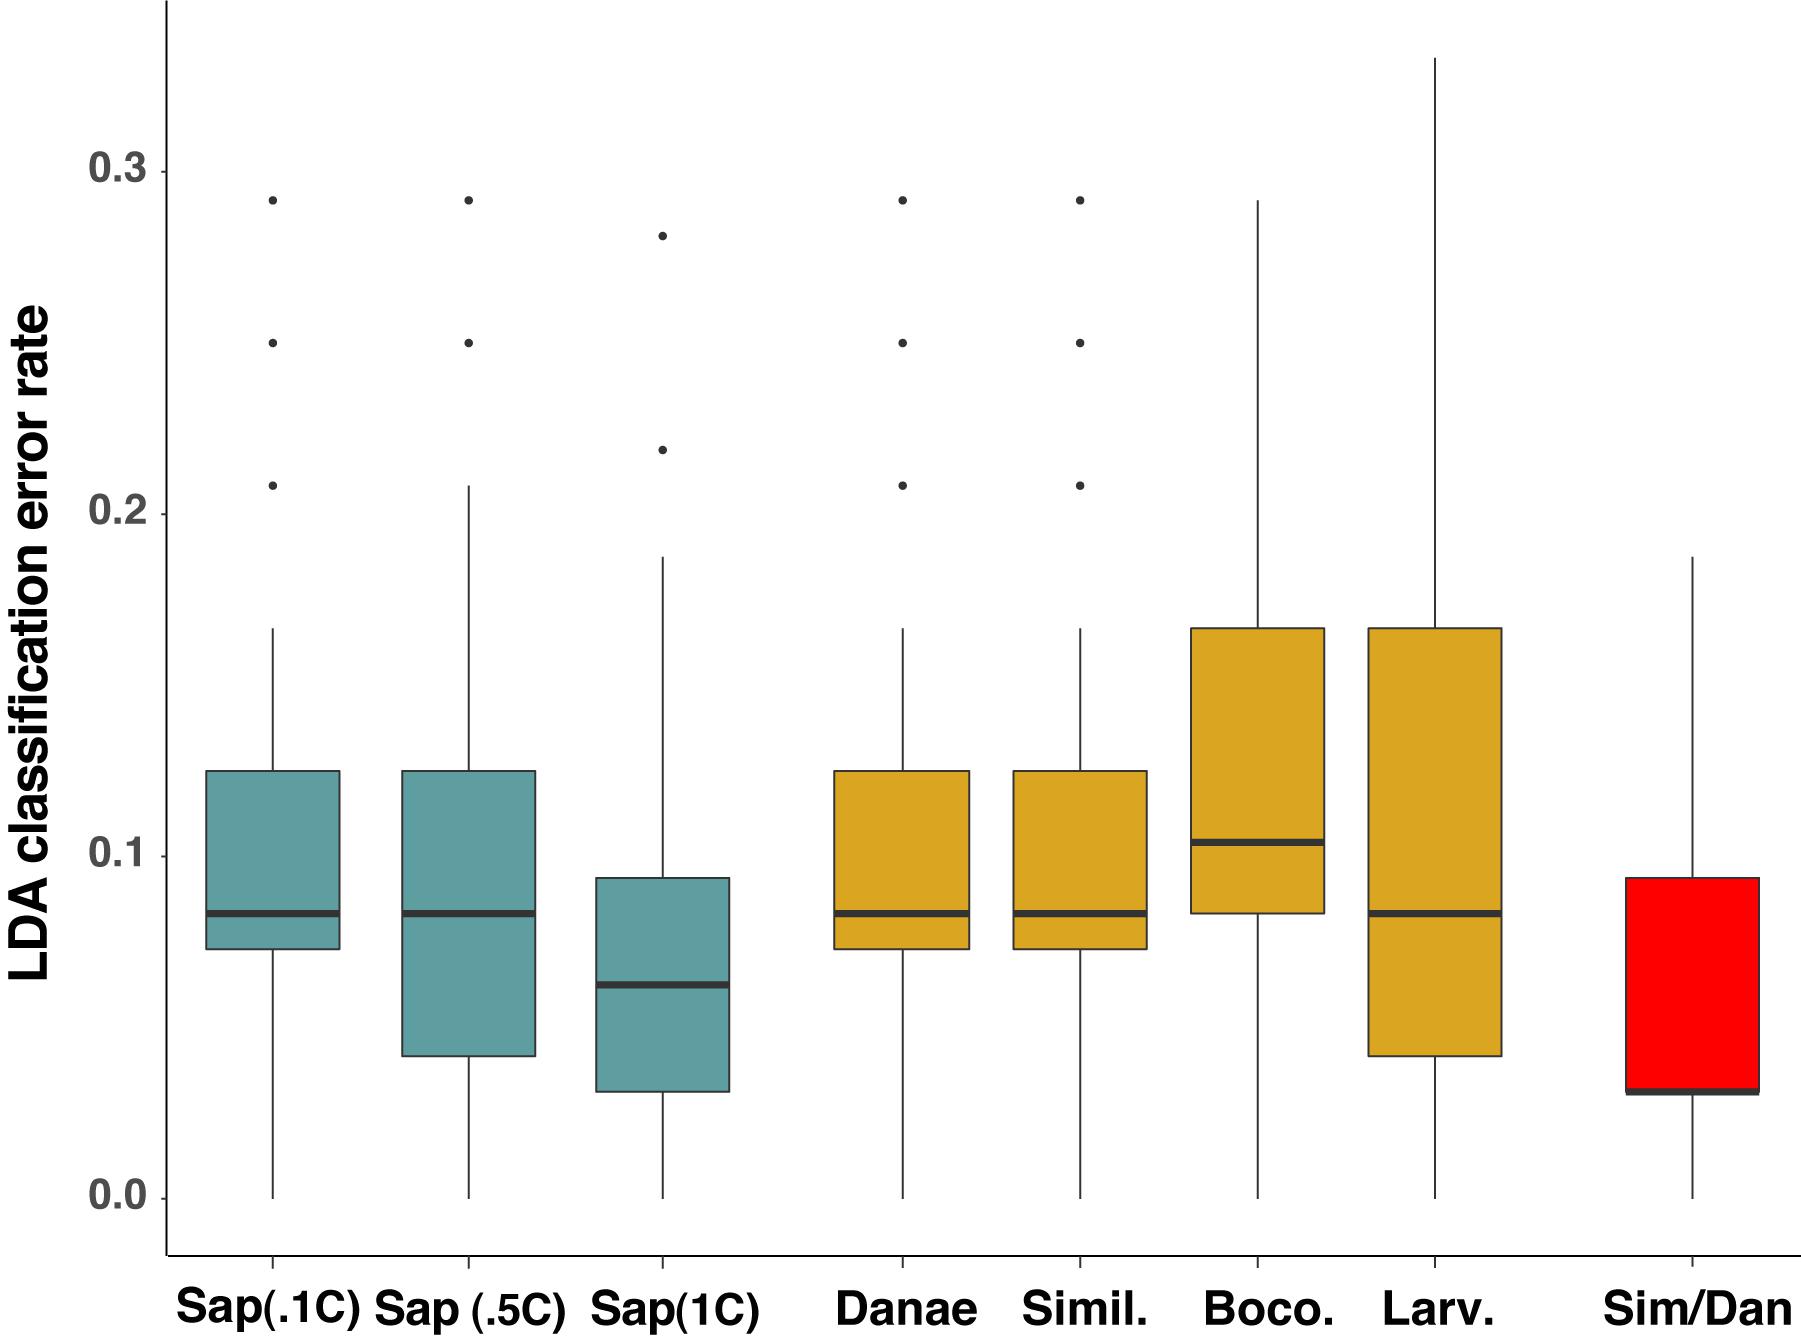
Figure 6. Linear discriminant analysis (LDA) classification error rates for different reference species, data resolutions, and groupings. Median error rates (thick black line within boxes) for LDA models run with C. sapidus (Sap.) as a reference are plotted in blue, with each group representing a different level of Tm resolution: RFU values every 0.1°C (Sap.1C); 0.5°C (Sap.5C); and 1°C resolution (Sap 1C). Gold boxes represent median classification error for LDA models in which the four other Callinectes species were used as references: C. danae (Danae), C. similis (Simil.), C. bocourti (Boco.), and C. larvatus (Larv.). The red box (Sim/Dan) represents the median error rate when C. similis and C. danae were combined into one group for species assignment in LDA. Classification error data for each reference or temperature resolution setting run in LDA are the result of 100 random simulations of the data split into training and validation sets. Box and whisker plots present the median error rates (thick line in box), 1st and 3rd quartiles (top and bottom of the box), 1.5x the interquartile range (IQR; the whiskers) and outlier points (individually plotted points).
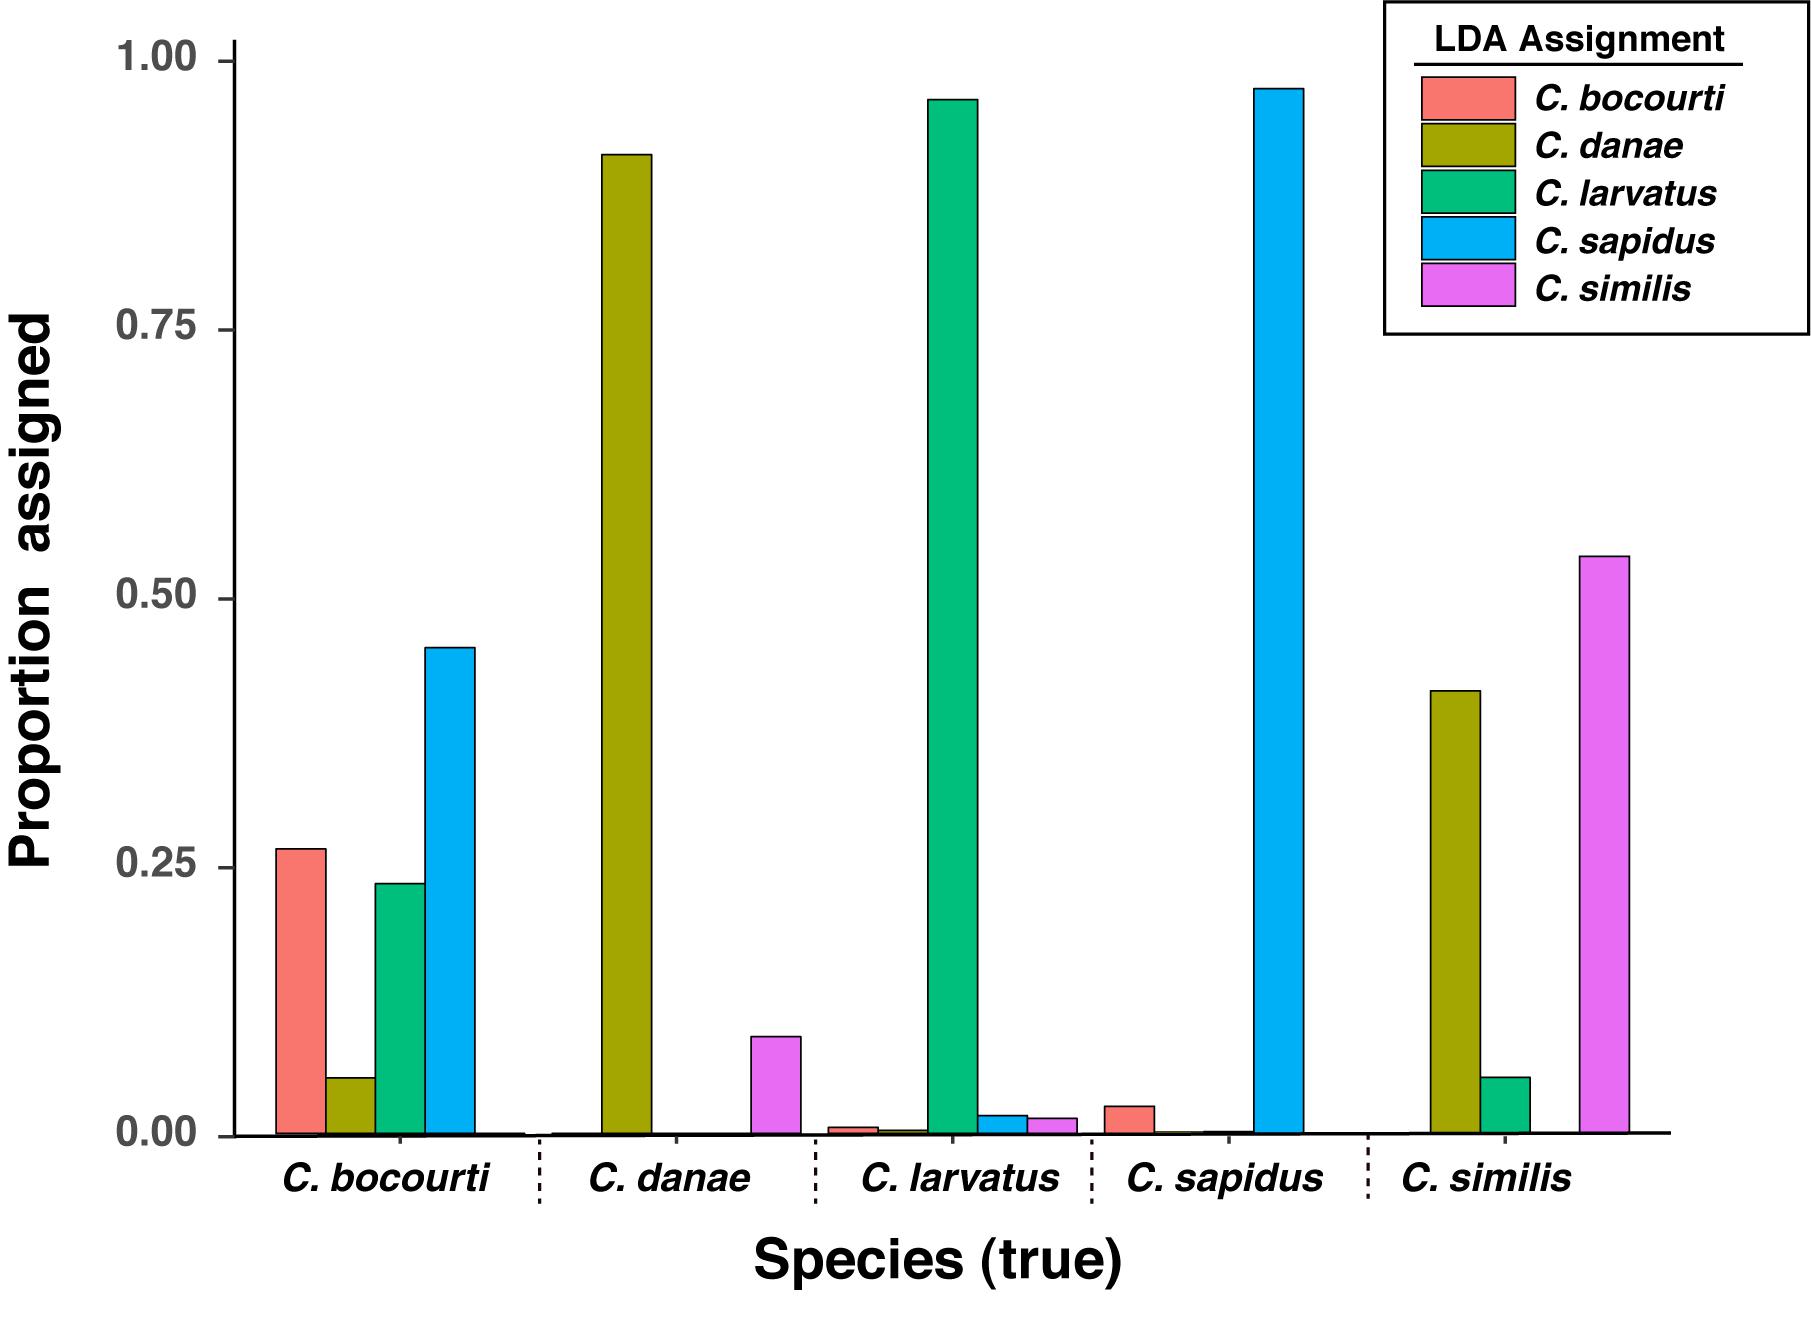
Figure 7. Linear discriminant analysis (LDA) assignment rates for HRM difference curve data across known species. Assignment data are the result of LDA classifications for 100 resampling events of the data set split randomly and equally into training and validation sets.
Discussion
We developed a simple and rapid restriction digestion assay for the 12S rRNA gene to identify blue crab C. sapidus DNA from other species in the genus and explored High Resolution Melt (HRM) analysis for multiple species identification among Callinectes spp. Given the challenges associated with using morphological characters to distinguish C. sapidus from other species in the genus (e.g., Weber et al., 2003; Robles et al., 2007), a rapid, unbiased species identification tool has application for both ecological research (Sullivan and Neigel, 2017) and for species identification in the seafood marketplace (Warner et al., 2015). Species verification is a pressing need in processed crab fishery products, where substitutions are common and can be difficult to track without molecular tools (Warner et al., 2015; Luque and Donlan, 2019). The two assays we designed for this study were extensively validated across a range of geographic samples and performed well as a species delineation diagnostic. Below, we discuss the performance of the two assays, and consider their possible future application.
Restriction Digestion Assay for High-Throughput Identification of Callinectes sapidus
The restriction digestion assay we developed for the 12S rRNA gene reliably discriminated between C. sapidus and other Callinectes spp., providing a 100% correct assignment in 58 Sanger sequence-validated samples. The correct species assignments for crab samples from across the geographic ranges of Callinectes spp. suggests that species-level SNPs in the targeted 12S region are stable within the genus and that the primer design and assay are robust. This assay was developed to also amplify fished crabs from the Portunus genus (P. armatus, P. sanguinolentis and P. trituberculatus), sometimes referred to as “blue swimmer crabs” in the seafood marketplace and commonly mislabeled as “blue crab” C. sapidus (Warner et al., 2015). Based on published 12S sequence data, Portunus spp. have the same diagnostic SNP as the other non-sapidus Callinectes spp., suggesting that this assay could be used to distinguish C. sapidus tissue from “blue swimmer crabs.” However, we were not able test the PCR-RFLP on DNA from Portunus spp., so the performance of this assay for these species still remains to be validated. We also showed that the digestion status of the 12S rRNA amplicons can be visualized using standard agarose gels or detected using the melt curve analysis function of a real time thermocycler after the addition of SYBR green dye (mastermix) to the digested products. The latter is a much faster approach, requiring only a 15 min melt curve analysis vs. a roughly 2 h process to pour, run, and image digested amplicons on an agarose gel. Partial digestion from a 30 min incubation was sufficient to determine the cut status with either method and 96 DNA samples can be tested for species status in as little as 2 h. Previous studies with poultry and red meat have found the PCR-RFLP analysis was able to effectively distinguish species from the DNA of meat cooked in a wide variety of methods, thus it is possible that PCR-RFLP would also work on steamed or boiled crab meat (Girish et al., 2005, 2007). In the future, this assay could be applied to bulk or mixed crab samples (i.e., testing of processed crab meat products such as crab cakes; Warner et al., 2015), where the presence of an uncut amplicon would indicate tissue/DNA from at least one other species besides C. sapidus.
HRM-Based Identification of Callinectes Species
The second objective of this study was to develop an assay that could rapidly identify multiple Callinectes spp. using high resolution melt (HRM) analysis of the 12S amplicons. Overall, individual melt curves showed good discrimination among species and linear discriminant analysis (LDA) of HRM difference curves successfully classified the five Callinectes sp. at an average or median rate of 89–92% among the cross-validation trials. Importantly, classifications of C. sapidus samples were accurate at a rate of 97.3%. Most of the error in classifications came from misclassifications of C. bocourti as C. sapidus or from classification error between C. danae and C. similis (Figure 7). Callinectes bocourti has the highest level of sequence similarity to C. sapidus compared with the rest of the Callinectes spp. we sampled (∼98%), which may have contributed to the misclassifications among the two species. However, it is likely that high error in the assignment of C. bocourti (and not C. sapidus) was driven by the lack of reference samples for this species. With only three C. bocourti samples available for HRM analysis, LDA training models were likely uninformative for this species. In fact, C. bocourti samples were incorrectly classified to all four of the other species despite apparent differences among thier HRM difference curves (Figure 4). It is likely that with additional C. bocourti reference samples, classification of this species based on 12S melt curves would be improved.
The other major source of HRM curve classification error came from mis-assignments between C. danae and C. similis, which have ∼99% sequence similarity at the 12S locus. Therefore, a different or additional set of genetic markers (e.g., multi-bar HRM; Ballin et al., 2019) might provide better discriminatory power for HRM analysis of these two species. Interestingly, the patterns of error were not equally shared across the two species, as C. danae samples were much more likely to be classified correctly (91.3% to C. danae, 8.9% to C. similis), while C. similis samples were only assigned correctly (to C. similis) at a rate of 54% (41.2% to C. danae, 5.2% to C. larvatus). The apparent asymmetry in the correct assignment may be due to differences in the number of reference sequences for each species: only three sequence-confirmed samples of C. similis were obtained for the HRM analysis vs. 15 samples of C. danae. It is therefore likely that the training models were much more robust for C. danae (and other species with higher sample sizes, such as C. sapidus) for any given cross validation run of the LDA model. In general, the sample sizes for the training or reference sets for all species were low, with only 64 total samples available for LDA analysis of HRM curves. Additional data points, especially for lesser represented species, would likely have increased classification success overall. Still, given the low reference sample sizes for two of the five species, species classification accuracy was relatively high (∼90%) and increased to ∼95% when combining C. danae and C. similis into a single class.
Another potential source of HRM-based classification error was low DNA quality of the crab samples. All tissue samples from outside of the United States (e.g., Trinidad and Tobago, St. Lucia, Brazil) were initially preserved in ethanol, but were shipped wrapped in ethanol-soaked paper towels at 10°C–25°C, which may have compromised tissue preservation during shipping to our lab in Baltimore (United States), reducing the quality of extracted DNA. A number of other studies using HRM analysis for individual SNP genotyping have noted that DNA quality can greatly impact the quality and reliability of HRM genotyping (e.g., Garritano et al., 2009, but see Fitzcharles, 2012; Fernandes et al., 2018). It is possible that variation in the initial quality of DNA extractions may have increased the intra-species variation in melt profiles, reducing discriminatory power of the LDA models. However, we did not see major differences in the shape of melt curves or in the amplification efficiency of C. sapidus samples, which were collected from multiple locations (North, South and Central America) and subjected to a variety of preservation and shipping conditions, including local samples from Virginia (United States) that were preserved immediately upon collection in 95% ethanol or frozen at −20°C prior to extraction. In fact, melt curve profiles seemed rather robust given the wide variety of starting tissue amounts, preservation methods, and shipping times. This suggests that the HRM approach may be useful for species identification across a range of tissue qualities and sample preservation states such as cooked crab samples or frozen/thawed tissues in the seafood marketplace, though this remains to be explored.
Interestingly, reducing the resolution of the data used in the LDA of HRM data (i.e., larger increments in temperature between which fluorescence was observed) resulted in an increase in classification success. This is a somewhat surprising finding because higher resolution temperature data should, theoretically, provide finer-scale characterization of the subtle differences in fluorescence measured across temperatures. For species-level discrimination among sequences (often > 3 SNP differences) it is possible that the higher resolution data actually results in additional noise and that fewer measurements across the temperature range more accurately distinguish melt profiles. If 0.5°C resolution melt data is adequate or even optimal for species-level discrimination in the Callinectes genus, it suggests that most conventional qPCR machines could be used for melt analysis and more specialized HRM analysis instruments might not be needed (which have finer melt curve capabilities, e.g., 0.2°C or 0.1°C). However, it is important to note that our experiments varying the temperature increment were done “in silico” by subsampling data points from an HRM analysis. Moreover, we used a dye/mastermix (Bio-Rad Precision Melt Mix) specifically designed for HRM analysis which contains the very sensitive EvaGreen dye. If standard SYBR dye was used (as is typical for standard melt curve analysis) it is possible that results would be different. Future studies could determine if a standard melt curve (0.5°C resolution) with SYBR dye and difference curve analysis could reliably identify species within the Callinectes genus. For example, Berry and Sarre (2007) were able to discriminate PCR amplicons from six vertebrate carnivore species using SYBR green dye at a melt step rate of 0.5°C. The possibility of using lower cost dyes/reagents, lower resolution melt analysis, and open-access R scripts for data analysis may make HRM assays more cost efficient and accessible.
Overall, HRM analysis provided a cost-effective and rapid approach to identify Callinectes species. Additional reference samples for lesser-sampled species and a larger dataset overall would likely improve species classification success with LDA, making this tool more useful and reliable for species identification. Inclusion of the remainder of the species in the Callinectes genus would also expand the utility of this tool. Finally, successful classifications using larger temperature increments (0.5 to 1°C) suggest that standard qPCR instruments (non-HRM) may be useful for species classification of Callinectes from melt curve data, though this will require future study.
Data Availability Statement
The datasets presented in this study can be found in online repositories. The names of the repositories and accession numbers can be found in the article/ Supplementary Material.
Author Contributions
BL helped design the study, contributed to initial drafting and revising of the manuscript, performed all of the laboratory work, and assisted with all data analyses and statistics. LP conceived of the study, helped design it, was involved in all data analysis and statistical analyses, and was involved in initial drafting and subsequent revisions of the manuscript. DB, JB, AK, and ES procured crab samples and were involved with drafting and revisions of the manuscript. All authors contributed to the article and approved the submitted version.
Funding
This study was supported with funding from the National Science Foundation Division of Biological Oceanography grant numbers 1658396 (DB) and 1658466 (LP and ES).
Conflict of Interest
The authors declare that the research was conducted in the absence of any commercial or financial relationships that could be construed as a potential conflict of interest.
Acknowledgments
We would like to thank all of the fishermen and researchers who provided samples for us to develop this tool. Specimens were collected from Trinidad and Tobago with assistance from G. Seepersad and O. Maharaj and under permission from the Trinidad and Tobago Fisheries Division. Specimens collected from Mexico were obtained with the assistance of A. Aguilar-Perera under the authority of the Universidad Autónoma de Yucatán. Samples from St. Lucia were obtained under the authority of St. Lucia Department of Fisheries. Samples from Brazil were obtained under the authority of the Federal University of Rio Grande do Sul. Samples from Puerto Rico were obtained from commercial fishermen. We also thank Mingli Zhoa from UMCES-IMET for providing samples, sequencing identification information and feedback, and Micheal Seebo at the Virginia Institute of Marine Science for providing samples from the winter dredge survey in Virginia.
Supplementary Material
The Supplementary Material for this article can be found online at: https://www.frontiersin.org/articles/10.3389/fmars.2020.00633/full#supplementary-material
Footnotes
References
Athamanolap, P., Parekh, V., Fraley, S. I., Agarwal, V., Shin, D. J., Jacobs, M. A., et al. (2014). Trainable high resolution melt curve machine learning classifier for large-scale reliable genotyping of sequence variants. PLoS One 9:e109094. doi: 10.1371/journal.pone.0109094
Ballin, N. K., Onaindia, J. O., Jawad, H., Fernandez-Carazo, R., and Maquet, A. (2019). High-resolution melting of multiple barcode amplicons for plant species authentication. Food Control 105, 141–150. doi: 10.1016/j.foodcont.2019.05.022
Berry, O., and Sarre, S. D. (2007). Gel-free species identification using melt-curve analysis. Mol. Ecol. Notes 7, 1–4. doi: 10.1111/j.1471-8286.2006.01541.x
Bowman, S., Mcnevin, D., Venables, S. J., Roffey, P., and Gahan, M. E. (2017). Species identification using high resolution melting (HRM) analysis with random forest classification. J. Forensic Sci. 618, 1–16.
Camacho, C., Coulouris, G., Avagyan, V., Ma, N., Papadopoulos, J., Bealer, K., et al. (2008). BLAST+: architecture and applications. BMC Bioinform. 10:421. doi: 10.1186/1471-2105-10-421
Charrad, M., Ghazzali, N., Boiteau, V., and Niknafs, A. (2014). NbClust: an R package for determining the relevant number of clusters in a data set. J Stat. Softw. 61, 1–36.
Fajardo, V., González, I., Rojas, M., García, T., and Martín, R. (2010). A review of current PCR-based methodologies for the authentication of meats from game animal species. Trends Food Sci. Technol. 21, 408–421. doi: 10.1016/j.tifs.2010.06.002
Feng, X., Williams, E. P., and Place, A. R. (2017). High genetic diversity and implications for determining population structure in the blue crab Callinectes sapidus. J. Shellfish Res. 36, 231–242. doi: 10.2983/035.036.0126
Fernandes, T. J., Costa, J., Beatriz, M., Oliveira, P. P., and Mafra, I. (2018). COI barcode-HRM as a novel approach for the discrimination of hake species. Fish. Res. 197, 50–59. doi: 10.1016/j.fishres.2017.09.014
Fitzcharles, E. M. (2012). Rapid discrimination between four Antarctic fish species, genus Macrourus, using HRM analysis. Fish. Res. 127–128, 166–170. doi: 10.1016/j.fishres.2012.02.002
Food and Agriculture Organization of the United Nations (2017). Species Fact Sheet: Callinectes Sapidus (Rathbun, 1896). FAO Fisheries and Aquaculture Department. Available online at: http://www.fao.org/fishery/species/2632/en (accessed July 18, 2020).
Garritano, S., Gemignani, F., Voegele, C., Nguyen-Dumont, T., Le Calvez-Kelm, F., De Silva, D., et al. (2009). Determining the effectiveness of high resolution melting analysis for SNP genotyping and mutation scanning at the TP53 locus. BMC Genet. 10:5. doi: 10.1186/1471-2105-10-5
Girish, P. S., Anjaneyulu, A. S. R., Viswas, K. N., Santhosh, F. H., Bhilegaonkar, K. N., Agarwal, R. K., et al. (2007). Polymerase chain reaction - restriction fragment length polymorphism of mitochondrial 12S rRNA gene: a simple method for identification of poultry meat species. Vet. Res. Commun. 31, 447–455. doi: 10.1007/s11259-006-3390-5
Girish, P. S., Anjaneyulu, A. S. R., Viswas, K. N., Shivakumar, B. M., Anand, M., Patel, M., et al. (2005). Meat species identification by polymerase chain reaction-restriction fragment length polymorphism (PCR-RFLP) of mitochondrial 12S rRNA gene. Meat Sci. 70, 107–112. doi: 10.1016/j.meatsci.2004.12.004
Jeong, H., Jo, Y. D., Park, S., and Kang, B. (2010). Identification of capsicum species using SNP markers based on high resolution melting analysis. Genome 53, 1029–1040. doi: 10.1139/G10-094
Jin, Y., Li, Q., Kong, L., Yu, H., and Zhong, X. (2015). High-resolution melting (HRM) analysis: a highly sensitive alternative for the identification of commercially important Crassostrea oysters. J. Molluscan Stud. 81, 167–170. doi: 10.1093/mollus/eyu077
Kassambara, A., and Mundt, F. (2017). Factoextra: Extract and Visualize the Results of Multivariate Data Analyses. R Package Version 1.0.5. Available online at: https://CRAN.R-project.org/package = factoextra (accessed March 15, 2020).
Katsanevakis, S., Wallentinus, I., Zenetos, A., Leppakoski, E., Çinar, M. E., Ozturk, B., et al. (2014). Impacts of marine invasive alien species on ecosystem services and biodiversity: a pan-european review. Aquat. Invas. 9, 391–423. doi: 10.3391/ai.2014.9.4.01
Kocher, T. D., Thomas, W. K., Meyer, A., Edwards, S. V., Pääbo, S., Villablanca, F. X., et al. (1989). Dynamics of mitochondrial DNA evolution in animals. Amplification and sequencing with conserved primers. Proc. Natl. Acad. Sci. U.S.A. 86, 6196–6200. doi: 10.1073/pnas.86.16.6196
Kordos, L. M., and Burton, R. S. (1993). Genetic differentiation of Texas Gulf coast populations of the blue crab, Callinectes sapidus. Mar. Biol. 117, 227–233. doi: 10.1007/BF00345667
Luque, G. M., and Donlan, J. (2019). The characterization of seafood mislabeling: a global meta-analysis. Biol. Conserv. 236, 556–570. doi: 10.1016/j.biocon.2019.04.006
Macedo, D., Caballero, I., Mateos, M., Leblois, R., McCay, S., and Hurtado, L. A. (2019). Population genetics and historical demographic inferences of the blue crab Callinectes sapidus in the US based on microsatellites. PeerJ 7:e7780. doi: 10.7717/peerj.7780
Malewski, T., Draber-mo, A., Pomorski, J., Łoś, M., and Bogdanowicz, W. (2010). Identification of forensically important blowfly species (Diptera: Calliphoridae) by high-resolution melting PCR analysis. Int. J. Legal Med. 124, 277–285. doi: 10.1007/s00414-009-0396-x
Mancinelli, G., Chainho, P., Cilenti, L., Falco, S., Kapiris, K., Katselis, G., et al. (2017). The Atlantic blue crab Callinectes sapidus in southern European coastal waters: distribution, impact and prospective invasion management strategies. Mar. Pollut. Bull. 119, 5–11. doi: 10.1016/j.marpolbul.2017.02.050
McMillen-Jackson, A. L., and Bert, T. M. (2004). Mitochondrial DNA variation and population genetic structure of the blue crab Callinectes sapidus in the eastern United States. Mar. Biol. 145, 769–777.
Millikin, M. R., and Williams, A. B. (1984). Synopsis of Biological Data On The Blue Crab, Callinectes sapidus Rathbun. NOAA Technical Report NMFS 1, FAO Fisheries Synopsis No. 138. Silver Spring, MD: NOAA.
Nehring, S. (2011). “Invasion history and success of the American blue crab Callinectes sapidus in European and adjacent waters,” in In The Wrong Place - Alien Marine Crustaceans: Distribution, Biology And Impacts, eds B. S. Galil, P. F. Clark, and J. T. Carlton (Cham: Springer), 607–624. doi: 10.1007/978-94-007-0591-3_21
Norse, E. A. (1977). Aspects of the zoogeographic distribution of Callinectes (Brachyura: Portunidae). Bull. Mar. Sci. 27, 440–447.
Odell, I. D., Cloud, J. L., Ascp, M. T., Seipp, M., and Wittwer, C. T. (2005). Rapid species identification within the mycobacterium chelonae - abscessus group by high-resolution melting analysis of hsp65 PCR products. Am. J. Clin. Pathol. 123, 96–101. doi: 10.1309/WDR082X9FFJBQQGB
Ogburn, M. B., Stuck, K. C., Heard, R. W., Wang, S. W., and Forward, R. B. Jr. (2011). Seasonal variability in morphology of blue crab, Callinectes sapidus, megalopae and early juvenile stage crabs, and distinguishing characteristics among co-occurring portunidae. J. Crust. Biol. 31, 106–113. doi: 10.1651/09-3241.1
Pereira, L., Gomes, S., Barrias, S., Fernandes, J. R., and Martins-Lopes, P. (2018). Applying high-resolution melting (HRM) technology to olive oil and wine authenticity. Food Res. Int. 103, 170–181. doi: 10.1016/j.foodres.2017.10.026
Pereira, L., Gomes, S., Castro, C., Eiras-Dias, J. E., Brazao, J., Graca, A., et al. (2017). High Resolution Melting (HRM) applied to wine authenticity. Food Chem. 216, 80–86. doi: 10.1016/j.foodchem.2016.07.185
Plough, L. V. (2017). Population-genomic analysis of the blue crab (Callinectes sapdius) using genotyping-by-sequencing. J. Shellf. Res. 36, 249–262.
Pourzand, C., and Cerutti, P. (1993). Genotypic mutation analysis by RFLP/PCR. Mutat. Res. 1288, 113–121. doi: 10.1016/0027-5107(93)90213-y
R Core Team (2018). R: A Language And Environment For Statistical Computing. Vienna: R Foundation for Statistical Computing.
Ramón-Laca, A., Gleeson, D., Yockney, I., Perry, M., Nugent, G., and Forsyth, D. M. (2014). Reliable discrimination of 10 ungulate species using high resolution melting analysis of faecal DNA. PLoS One 9:e92043. doi: 10.1371/journal.pone.0092043
Rasmussen, R. S., and Morrissey, M. T. (2008). DNA-based methods for the identification of commercial fish and seafood species. Compr. Rev. Food Sci. Food Saf. 7, 280–295. doi: 10.1111/j.1541-4337.2008.00046.x
Reja, V., Kwok, A., Stone, G., Yang, L., Missel, A., Menzel, C., et al. (2010). ScreenClust: Advanced statistical software for supervised and unsupervised high resolution melting (HRM) analysis. Methods 50, S10–S14.
Robles, R., Schubart, C. D., Conde, J. E., Carmona-Suárez, C., Alvarez, F., Villalobos, J. L., et al. (2007). Molecular phylogeny of the American Callinectes stimpson, 1860 (Brachyura: Portunidae), based on two partial mitochondrial genes. Mar. Biol. 150, 1265–1274. doi: 10.1007/s00227-006-0437-7
Rodrigues, M. A., Dumont, L. F. C., dos Santos, C. R. M., D’Incao, F., Weiss, S., and Froufe, E. (2017). Two distinct mtDNA lineages of the blue crab reveal large-scale population structure in its native Atlantic distribution. Estuar. Coast. Shelf Sci. 197, 45–53. doi: 10.1016/j.ecss.2017.08.004
Russell, V. J., Hold, G. L., Pryde, S. E., Rehbein, H., Quinteiro, J., Rey-Mendez, M., et al. (2000). Use of restriction fragment length polymorphism to distinguish between Salmon species. J. Agric. Food Chem. 48, 2184–2188. doi: 10.1021/jf991213e
Scarano, D., and Rao, R. (2014). DNA markers for food products authentication. Diversity 6, 579–596. doi: 10.3390/d6030579
Schubart, C. D., Conde, J. E., Carmona-Suárez, C., Robles, R., and Felder, D. L. (2001). Lack of divergence between 16S mtDNA sequences of the swimming crabs Callinectes bocourti and C. maracaiboensis (Brachyura: Portunidae) from Venezuela. Fish. B NOAA 99, 475–481.
Schubart, C. D., and Koller, P. (2005). Genetic diversity of freshwater crabs (Brachyura: Sesarmidae) from central Jamaica with description of a new species J. Nat. Hist. 39, 469–481. doi: 10.1080/00222930410001671291
Scrucca, L., Fop, M., Murphy, T. B., and Raftery, A. E. (2016). mclust 5: clustering, classification and density estimation using Gaussian finite mixture models. R J. 8, 205–233.
Simko, I. (2016). High-resolution DNA melting analysis in plant research. Trends Plant Sci. 21, 528–537. doi: 10.1016/j.tplants.2016.01.004
Sullivan, T. J., and Neigel, J. E. (2017). Misidentification of megalopae as a potential source of error in studies of population genetics and ecology of the blue crab Callinectes sapidus. Mar. Ecol. Prog. Ser. 565, 95–111. doi: 10.3354/meps12043
Telenti, A., Marchesi, F., Balz, M., Bally, F., Böttger, E. C., and Bodmer, T. (1993). Rapid identification of mycobacteria to the species level by polymerase chain reaction and restriction enzyme analysis. J. Clin. Microbiol 31, 175–178. doi: 10.1128/jcm.31.2.175-178.1993
Untergasser, A., Cutcutache, I., Koressaar, T., Ye, J., Faircloth, B. C., Remm, M., et al. (2012). Primer3-new capabilities and interfaces. Nucleic Acids Res. 40:e115. doi: 10.1093/nar/gks596
Venables, W. N., and Ripley, B. D. (2002). Modern Applied Statistics With S, 4th Edn, Berlin: Springer.
Verrez-Bagnis, V., Sotelo, C. G., Mendes, R., Silva, H., Kappel, K., and Schröder, U. (2018). “Methods for zeafood uthenticity festing in Europe,” in Bioactive Molecules in Food. Reference Series in Phytochemistry, eds J. M. Mérillon and K. Ramawat (Cham: Springer), 1–55.
Warner, K., Lowell, B., Disla, C., Ortenzi, K., Savitz, J., and Hirshfield, M. (2015). Oceana Reveals Mislabeling of Iconic Chesapeake Blue Crab (Oceana 2015). Available online at: https://oceana.org/sites/default/files/crab_testing_report_final_3.27.15.pdf (accessed March 2020).
Weber, L. I., Puchnick, A., Lamego, J. P., and Levy, J. A. (2003). Genetic relationships among the most common swimming crabs of southern Brazil. J. Crustacean Biol. 23, 201–211. doi: 10.1651/0278-0372(2003)023[0201:gratmc]2.0.co;2
Williams, A. B. (1974). The swimming crabs of the genus Callinectes (Decapoda: Portunidae). Fish. Bull. 72, 685–798.
Winder, L., Phillips, C., Richards, N., Ochoa-Corona, F., Hardwick, S., Vink, C. J., et al. (2011). Evaluation of DNA melting analysis as a tool for species identification. Methods Ecol. Evol. 2, 312–320. doi: 10.1111/j.2041-210x.2010.00079.x
Windsor, A. M., Moore, M. K., Warner, K. A., Stadig, S. R., and Deeds, J. R. (2019). Evaluation of variation within the barcode region of cytochrome c oxidase I (COI) for the detection of commercial Callinectes sapidus Rathbun, 1896 (blue crab) products of non-US origin. PeerJ 7:e7827. doi: 10.7717/peerj.7827
Xu, W., Morris, U., Schmidt, B., Msellem, M., Shakely, D., Petzold, M., et al. (2015). SYBR Green real-time PCR-RFLP assay targeting the plasmodium cytochrome B Gene - A highly sensitive molecular tool for malaria parasite detection and species determination. PLoS One 10:e0120210. doi: 10.1371/journal.pone.0120210
Keywords: brachyuran, seafood, mislabeling, industry, diagnostics, species-delineation
Citation: Lee BB, Schott EJ, Behringer DC, Bojko J, Kough A and Plough LV (2020) Rapid Genetic Identification of the Blue Crab Callinectes sapidus and Other Callinectes spp. Using Restriction Enzyme Digestion and High Resolution Melt (HRM) Assays. Front. Mar. Sci. 7:633. doi: 10.3389/fmars.2020.00633
Received: 28 April 2020; Accepted: 10 July 2020;
Published: 14 August 2020.
Edited by:
Jianhua Fan, East China University of Science and Technology, ChinaReviewed by:
Angela Cuttitta, National Research Council (CNR), ItalyAntje Labes, Fachhochschule Flensburg, Germany
Copyright © 2020 Lee, Schott, Behringer, Bojko, Kough and Plough. This is an open-access article distributed under the terms of the Creative Commons Attribution License (CC BY). The use, distribution or reproduction in other forums is permitted, provided the original author(s) and the copyright owner(s) are credited and that the original publication in this journal is cited, in accordance with accepted academic practice. No use, distribution or reproduction is permitted which does not comply with these terms.
*Correspondence: Louis V. Plough, bHBsb3VnaEB1bWNlcy5lZHU=