 Subrat Naik
 Rajani Kanta Mishra
 K. C. Sahu1
- 1Department of Marine Sciences, Berhampur University, Berhampur, India
- 2National Centre for Coastal Research, Ministry of Earth Sciences, Chennai, India
- 3National Centre for Polar and Ocean Research, Ministry of Earth Sciences, Goa, India
- 4Indian National Centre for Ocean Information Services, Ministry of Earth Sciences, Hyderabad, India
Rushikulya Estuary is rich in biodiversity facing significant changes in recent periods due to pollution/anthropogenic impacts from the industries and growing urbanization along the banks of the river. This estuary caters mass nesting of Olive Ridley sea turtles and one of the world’s largest rookery in India. In view of the above, the present study examined the seasonal variability of water quality parameters [water temperature, pH, salinity, dissolved oxygen (DO), total suspended matter (TSM), inorganic nutrients (NO2-N, NO3-N, NH4-N, PO4-P, and SiO4-Si), and the phytopigment, i.e., Chlorophyll-a (chl-a)] from the seawater samples of three different seasons pre-monsoon, monsoon, and post-monsoon. Time series observations were made at five locations off Rushikulya Estuary, Bay of Bengal, from March 2011 to February 2013. A wide range of nutrient concentrations except for NO2-N, varied from 0.89–3.62 μmol/l in the NO3-N, from 1.36–6.81 μmol/l in the NH4-N, from 0.66–3.45 μmol/l in the PO4-P and from 0.89–7.97 μmol/l in the SiO4-Si. The highest chl-a (3.72 mg/m3) was recorded during pre-monsoon than monsoon and post-monsoon. Factor analysis (FA) showed that three underlying factors, each during pre-monsoon, monsoon, and post-monsoon, influenced the water quality to the extent of 75.02, 67.33, and 66.37%, respectively. The significant result from a statistical view of non-metric multidimensional scaling (nm-MDS) and cluster analysis (CA) revealed that the chl-a variability was due to the direct influence of nutrients than the physical parameters. Correlation analysis revealed that chl-a has positive correlation with DO, NO2, NO3, PO4, and SiO4, while negative with salinity in pre-monsoon and monsoon. The composite results indicated that the study area is well oxygenated and rich in nutrients, and chl-a distribution represents typical upper ocean dynamics and food chain linked to the pristine coastal and ecologically rich ecosystem.
Introduction
The east coast of India experiences a tropical monsoon kind of climate like other parts of the country (Mishra et al., 2009). Two monsoon seasons viz. summer (June–September) and winter (November–March) monsoons are prevailing in the Indian subcontinent. Winds that are southwesterly during June–September and northeasterly during November–March are predominant. April–May and October are transition periods during which the wind and currents get reversed. The summer monsoon winds are moisture-laden and cause maximum rain (more than 70% of annual rainfall) over the subcontinent (India Metrological Department [IMD], 2006). The Bay of Bengal (BoB) is a semi-enclosed tropical ocean basin, which is significantly influenced by monsoon and gets enormous volume of fresh water from both waterway discharges and precipitation (Emmel and Curray, 1983). The annual freshwater release into the BoB surpasses 1.5 × 10¹² m3, which decreases the mean salinity enormously in the northernmost bay (Laviolette, 1967). The estuaries, therefore, show marked differences in physical parameters like salinity during the wet and dry seasons. This is apparent from the seasonal variation in the vertical salinity structure in the estuaries. The estuarine ecosystem and associated natural habitat have been adapted to this seasonality. Water quality is considered as the essential factor controlling the health and state of the marine condition. It means the water quality depends on natural processes, weathering, and soil disintegration and on anthropogenic inputs, metropolitan and industrial wastewater discharge, etc. The anthropogenic releases comprise a consistent contaminating source, though surface spillover is a seasonal phenomenon, to a great extent influenced by the atmosphere within the basin (Singh et al., 2004). The nutrient input to the beachfront waters has been significantly expanding in the most recent decades because of the intensification of human activities and urbanization along the coastal waters (Newton et al., 2003; Newton and Mudge, 2005). The spreading of nutrient concentrations in beachfront waters causes a few natural alterations like an increase in productivity and stock enhancements (Menon et al., 2000; Srinivasan et al., 2010). However, anthropogenic inputs cause eutrophication, especially in the shadow regions of estuaries and bays where circulation is restricted by geomorphological graduations. A swift change in chemical characteristics of water bodies due to shifting waterways and discharges leads to diverse ecological consequences like changes in species composition, proliferation of phytoplankton, and depletion of oxygen concentrations (Welsh and Eller, 1991; Zhang et al., 2009; Zhao et al., 2009; Barik et al., 2017). Nearshore and estuarine waters show noteworthy variability with respect to precipitation, tidal prism, abiotic and biotic interactions, their quantum impacting the nutrient cycle of the coastal environments (Mishra et al., 2003; Naik et al., 2014). The estimation of physicochemical parameters in the marine condition comprehends the oceanic biological system; however, it is complicated to extract inferences from a large set of spatiotemporal observations. The monsoonal influence and seasonal variation in the phytoplankton biomass, water quality, and the status of the ecosystem in the BoB region have been studied extensively (Mishra et al., 2009; Baliarsing et al., 2013). However, the estuarine effects on the coastal water quality with relation to productivity in this region are meager. Hence, the present study was carried out with various statistical analyses to understand the water quality and productivity to assess the ecosystem in the region. The multivariate statistical techniques are suitable tools for the reduction of multi-constituent chemical and physical observed data to a small number of inherent factors retaining substantial meaningful information for interpretation (Massart et al., 1988). The significant phytoplankton pigment [Chlorophyll-a (chl-a)] has been utilized broadly as an intermediary for biomass and a gauge of maritime essential profitability (Behrenfeld et al., 2005; Westberry et al., 2008). The spatial and temporal distribution of chl-a depends in a general sense upon physical procedures along with the availability of light, nutrients, and oxygen. In the tropics, shallow coastal water is commonly well mixed and oxygen rich and phytoplankton production is not light limited. The principal source of nutrients in coastal waters is from river discharge; consequently, the influx of river water associated with rainfall plays an important role in tropical coastal primary productivity often promoting phytoplankton bloom (Mishra et al., 2009; Sarma et al., 2009; Baliarsingh et al., 2015). The multivariate statistical techniques, for example, cluster analysis (CA) and factor analysis (FA), have been broadly used as unbiased techniques in the examination of water quality datasets for extracting meaningful information (Vega et al., 1998; Singh et al., 2004). Thus, the present study of seasonal variability of phytoplankton biomass, the environmental variables, and river discharge containing anthropogenic influence facilitates us to understand the dynamics of the estuarine ecosystem.
Materials and Methods
Study Area
The present study was carried out off Rushikulya Estuary at five selected time series stations, southern coast of Odisha (Figure 1). Rushikulya is a perennial river, one of the major rivers that drains into the BoB. The river flows from the Daringbadi hill station in Kandhamal district flows through the Ganjam district for a distance of 165 km with a total catchment area of 7,700 km2. As the catchment is rich in mineral wealth, there are about 3,360 numbers of small-scale industries of different categories, mainly food and allied, forest and wood-based, rubber, plastic products, glass, and ceramics. Domestic sewage also contributes a significant component of pollutant reaching the river. These industries and untreated sewage have directly or indirectly affected the river water quality. The estuary accommodates and accounts for mass nesting of Olive Ridley sea turtles and known as one of the world’s major rookeries (arribada) in India (Pandav et al., 1994). The study area forms a complex ecosystem with highly variable primary production results mainly due to the concentration of nutrients, especially silicate and nitrate (Gouda and Panigrahy, 1992). The ecosystem received a high quantity of dissolved chemical inputs from several sources as runoff through the course of river and sea (Mohapatra and Padhy, 2001). The increasing activity of Gopalpur as well as weather port, fishing, coastal aquaculture, effluent discharge by heavy mineral exploration by Indian Rare Earth, Ltd., and growing urbanization has an influence on the coastal water quality off Rushikulya Estuary (Bramha et al., 2011). The circulation pattern of the study area is governed by the impacts of seasonal East India Coastal Current (EICC), surface current driven by monsoon winds, cyclonic motion (Shetye et al., 1991). The tides along the coast of India are predominantly semi-diurnal but mixed. The important tidal constituents are M2 (12.42 h), S2 (with the period of 12.00 h), and K1 (23.93 h). Tidal amplitudes along the coast of India increases from south to north (Pradhan et al., 2018). As the variation of flow, water quality and estuarine dynamics is apparent on seasonality induced by the Indian summer monsoon, Rushikulya Estuary is considered the monsoonal estuary.
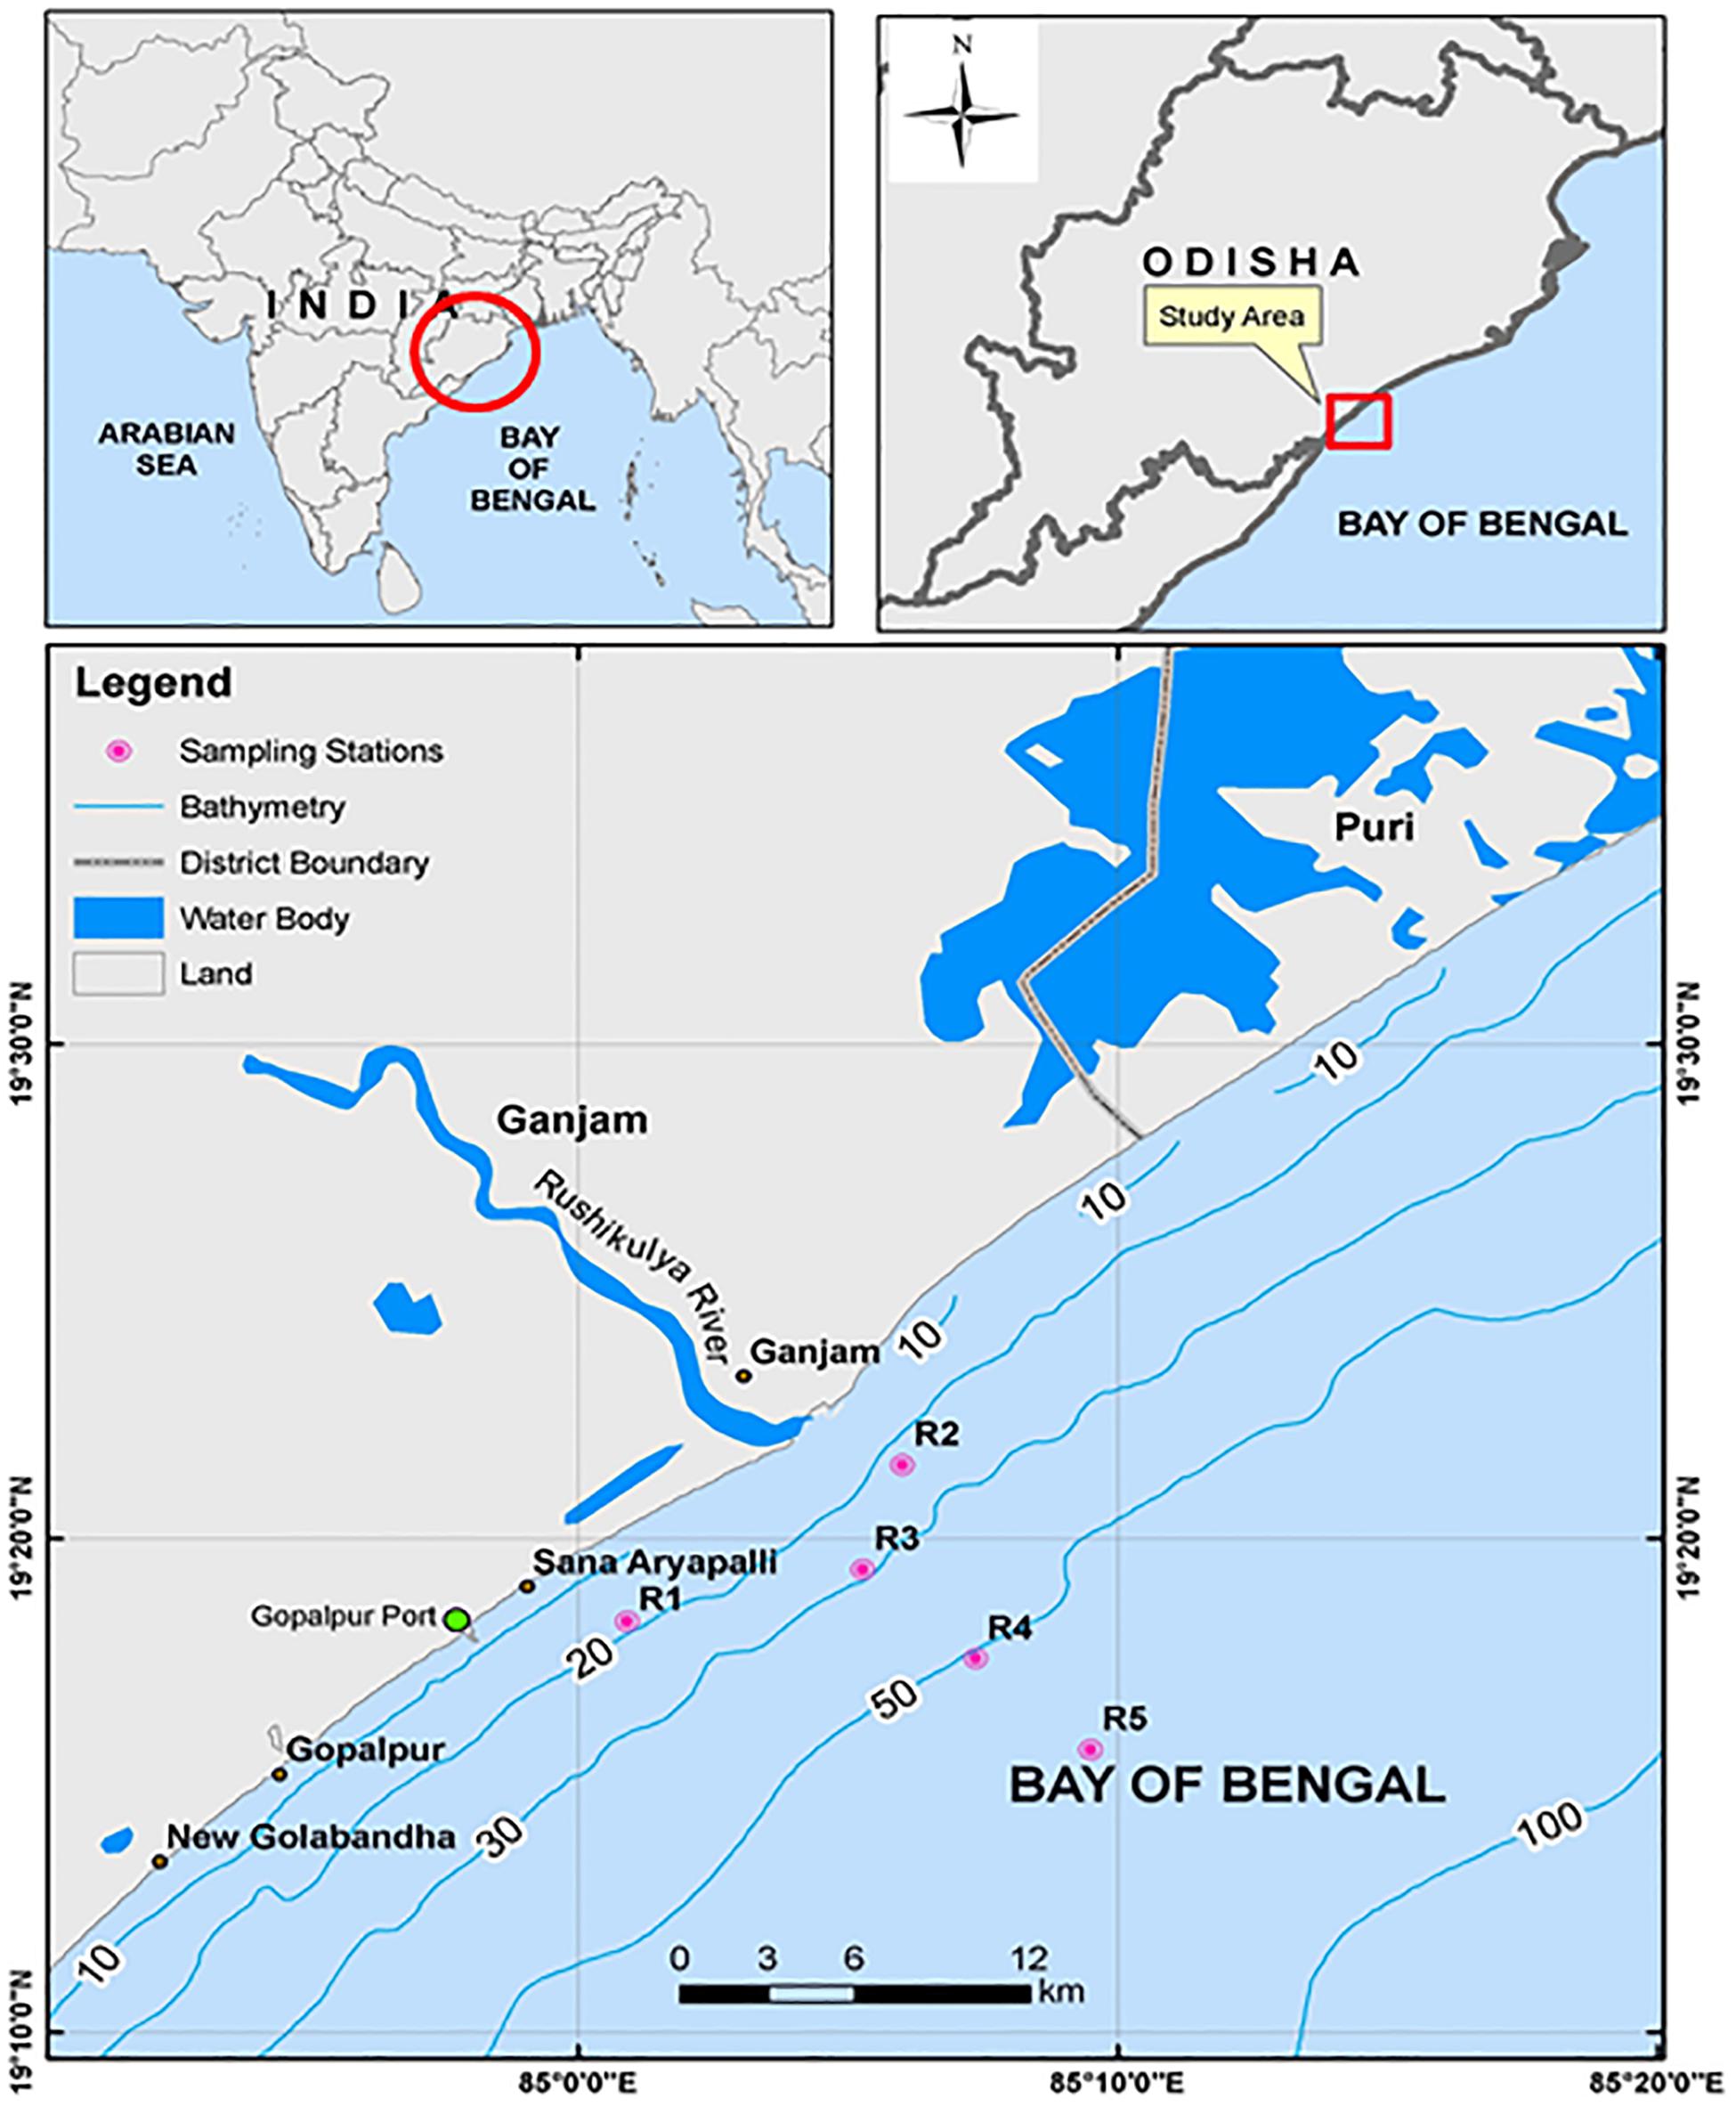
Figure 1. Map showing the sampling locations off Rushikulya Estuary.
Sampling and Analytical Methods
Physicochemical Parameters
Field surveys were carried out from March 2011 to February 2013 on boarding by a fishing trawler. The water samples were collected using the Niskin water sampler (5 l) from five selected time series stations at different depths of stations R1 (0, 5, and 10 m), R2 (0, 5, 10, and 15 m), R3 (0, 5, 10, 15, and 20 m), R4 and R5 (0, 5, 10, 15, 20, 25, and 30 m) along the coastal waters (Figure 1). The sampling stations were fixed according to bathymetry off Rushikulya Estuary. Though the samples were collected monthly, the datasets are taken for interpretation on a seasonal basis, i.e., pre-monsoon (March–May), monsoon (June–September), and post-monsoon (October–November; IMD). The in situ measurement of pH and water temperature (WT) used EUTECH pH meter (accuracy ± 0.01) and mercury-filled centigrade thermometer, respectively. Dissolved oxygen (DO) was fixed immediately using Winkler’s A and B solutions. DO was measured by adopting Winkler’s titration method (Grasshoff et al., 1999). For the analysis of nutrients, water samples were collected in clean polyethylene bottles, kept immediately in an ice box, and transported to the laboratory. The collected water samples were filtered by Millipore filtering system and analyzed for parameters such as nitrite (NO2-N), nitrate (NO3-N), ammonium (NH4-N), inorganic phosphate (PO4-P), silicate (SiO4-Si), and total suspended matter (TSM). The analytical precision of each nutrient parameter (nitrate + nitrite ± 0.02 μmol/l, ammonium ± 0.02 μmol/l, phosphate ± 0.01 μmol/l, and silicate ± 0.02 μmol/l) was adopted by following standard protocols (Grasshoff et al., 1999). Each analysis was done in duplicate, and the mean value was taken. Millipore cellulose nitrate membrane, 47 mm diameter filter (porosity 0.45 μm) was used for gravimetric determination of TSM. Salinity was measured following Knudsen’s argentometric titration method.
Phytopigment (Chlorophyll-a)
One liter of water sample was filtered through Whatman GF/F, 47-mm-diameter filter (porosity 0.7 μm) for the determination of chl-a. After filtration, the filter papers were stored securely at -4°C in freezing condition. Prior to spectrophotometric measurements, the filtrates were submerged in an individual centrifuge tube with 10 ml of 90% acetone and kept in a freezing condition for 24 h to facilitate complete extraction of pigments. The extracts were shaken vigorously in the dark and centrifuged at 4,000 rpm for about 10 min. The optical density of the supernatant solution was measured using a UV-visible double beam spectrophotometer [JASCO (V-650)] at 750, 665, 645, 630 NM with calibration of standard chl-a pigment (Sigma-Aldrich; C6144-1MG). Concentrations of chl-a were estimated following Strickland and Parsons (1972).
Data Treatment and Multivariate Statistical Method
In order to recognize the patterns that are inherent in water quality parameters as a whole, we considered the 11 parameters viz. WT, pH, salinity, DO, TSM, nutrients (NO2-N, NO3-N, NH4-N, PO4-P, and SiO4-Si) and chl-a of five selected time series stations as a multivariate dataset. At the outset, we normalized the dataset as they were from different measurement scales. For each measured parameter, the mean is set at 0 and standard deviation at 1. Each value scaled in the range between −2 and + 2. This normalized the range of values for each parameter and assigned them equal values in the multivariate analysis (Clarke and Gorley, 2006). Equivalent matrix for these normalized values was evaluated using euclidean distance (difference between the clusters of parameters as a distance in multivariate space). The greater the euclidean distance, the lower the similarity between the clusters containing the water quality parameters. Differences in euclidean distances were applied to hierarchical CA, non-metric multidimensional scaling (nm-MDS). CA was applied to the water quality datasets with a view to group the parameter wise spread over the stretch and in the resulted dendrogram. FA was performed for three seasonal datasets. The variance/covariance and factor loadings of the variables with eigenvalues were computed. Besides considerable data reduction, entire dataset variability is described through few varifactors/principal components (VFs/PCs) without losing much information. Further, grouping of the studied variables according to their common features by VFs helps in data interpretation (Vega et al., 1998; Singh et al., 2004). Statistical software (Statistical Package for the Social Sciences-SPSS 17) was used for computation of correlation matrix and FA (Plymouth Routines in Multivariate Ecological Research-PRIMER-6), and CA was used in the present study. The varimax rotated factor loadings were calculated using eigenvalues greater than 1 and sorted by the results having values greater than 0.4 based on the significant influence of the geochemical processes (Rath et al., 2000). For the meaningful graphical representation of seasonal and vertical variation of physicochemical parameters and chl-a, Ocean Data View is used.
Results and Discussion
The descriptive statistics of physicochemical parameters and chl-a are presented in Supplementary Table S1. The water temperature fluctuated between 25.25°C and 28.9°C throughout the study period. Spatial plots show that the highest temperature (28.9°C) was recorded at station R5 surface water during pre-monsoon season, and the lowest temperature (25.25°C) was recorded at 10 m depth of station R1 during post-monsoon season as shown in Figures 2i,iii. The water temperature hardly followed any particular trend of variability. Pearson’s correlation coefficient indicates that the water temperature exhibited a negative relation with nutrients throughout all seasons (Supplementary Table S2). The pH varied between 7.68 and 8.43 (Supplementary Table S1). The highest pH at 30 m water depth of station R5 was noticed during monsoon season, and the lowest value at the surface was observed at station R1 during the same season (Figure 2v). Observed pH values showed an increasing trend toward the bottom and offshore region of the study area. The highest pH value 8.43 was noticed during monsoon season at station R4 from 30 m depth, indicating an alkaline environment which is consistent with the value for tropical ocean water and values obtained from similar environmental offshore studies in Nigeria (STAR, 2003; Conoco, 2004). Such variations were also reported from many for Indian coastal waters (Chandran and Ramamurthy, 1984; Upadhyay, 1988). The DO content ranged between 5.96 and 8.3 mg/l during the study period (Supplementary Table S1). The maximum DO at surface was recorded at station R1 during post-monsoon season, and a minimum was noticed at 30 m depth of station R5 (Figure 2ix). DO values followed a vertically decreasing trend toward bottom and offshore stations. The high DO level in the surface water could be due to photosynthetic release by phytoplankton and air-sea interaction (Carignan et al., 2000). Correlation analysis revealed that the DO exhibited a positive correlation with chl-a and nutrients during all the seasons. The inverse relationship between DO and temperature is a natural process as warm water easily saturated with oxygen and, thus, can hold less DO. The negative correlation of DO with water temperature (Supplementary Table S2) can be addressed as solubility of oxygen in water diminishes with increasing temperature. The vertical profile of salinity along the five stations from various depths demonstrated wide variation of mean salinity ranging between 28.24 and 35.63 (Supplementary Table S1). The highest value of salinity was noticed at station R5 from 30 m depth during pre-monsoon, while the lowest was observed at station R1 from surface water during monsoon (Figures 2x,xi). Salinity followed an increasing trend toward bottom and offshore during all seasons. The most minimal salinity was recorded during monsoon season which may be ascribed because of precipitation brought by southwest monsoonal rains and a huge amount of fresh water inundation into the sea by means of estuary and terrestrial runoff. Salinity exhibited a negative correlation with nutrients (Supplementary Table S2). TSM ranged from 3.92 to 14.03 mg/l (Supplementary Table S1). The highest TSM was recorded during pre-monsoon at station R1 from 10 m depth and lowest at R3 from 20 m depth during the post-monsoon as shown in Figures 3i,iii. Relatively higher concentrations of TSM were observed in coastal stations which can be attributed to the turbulent waters and hence resuspension of bottom sediments. A pocket of increased TSM was noticed in subsurface during pre-monsoon, whereas this feature was persistent in surface as well as in subsurface during monsoon. The highest TSM was recorded during pre-monsoon season at station R1 (14.03 mg/l) which might be due to the addition of TSM from sediment resuspension and eroded sediments from beaches. This beach is highly eroding beach during pre-monsoon (Pradhan et al., 2018). Nearshore stations (R1 and R2) shows higher TSM as due to its shallowness and mostly laden with the riverine waters which carries a huge amount of sediments. It clearly shows the signature of resuspension of sediments which can be attributed to the tidal mixing and river influx observed during pre-monsoon and monsoon, respectively.
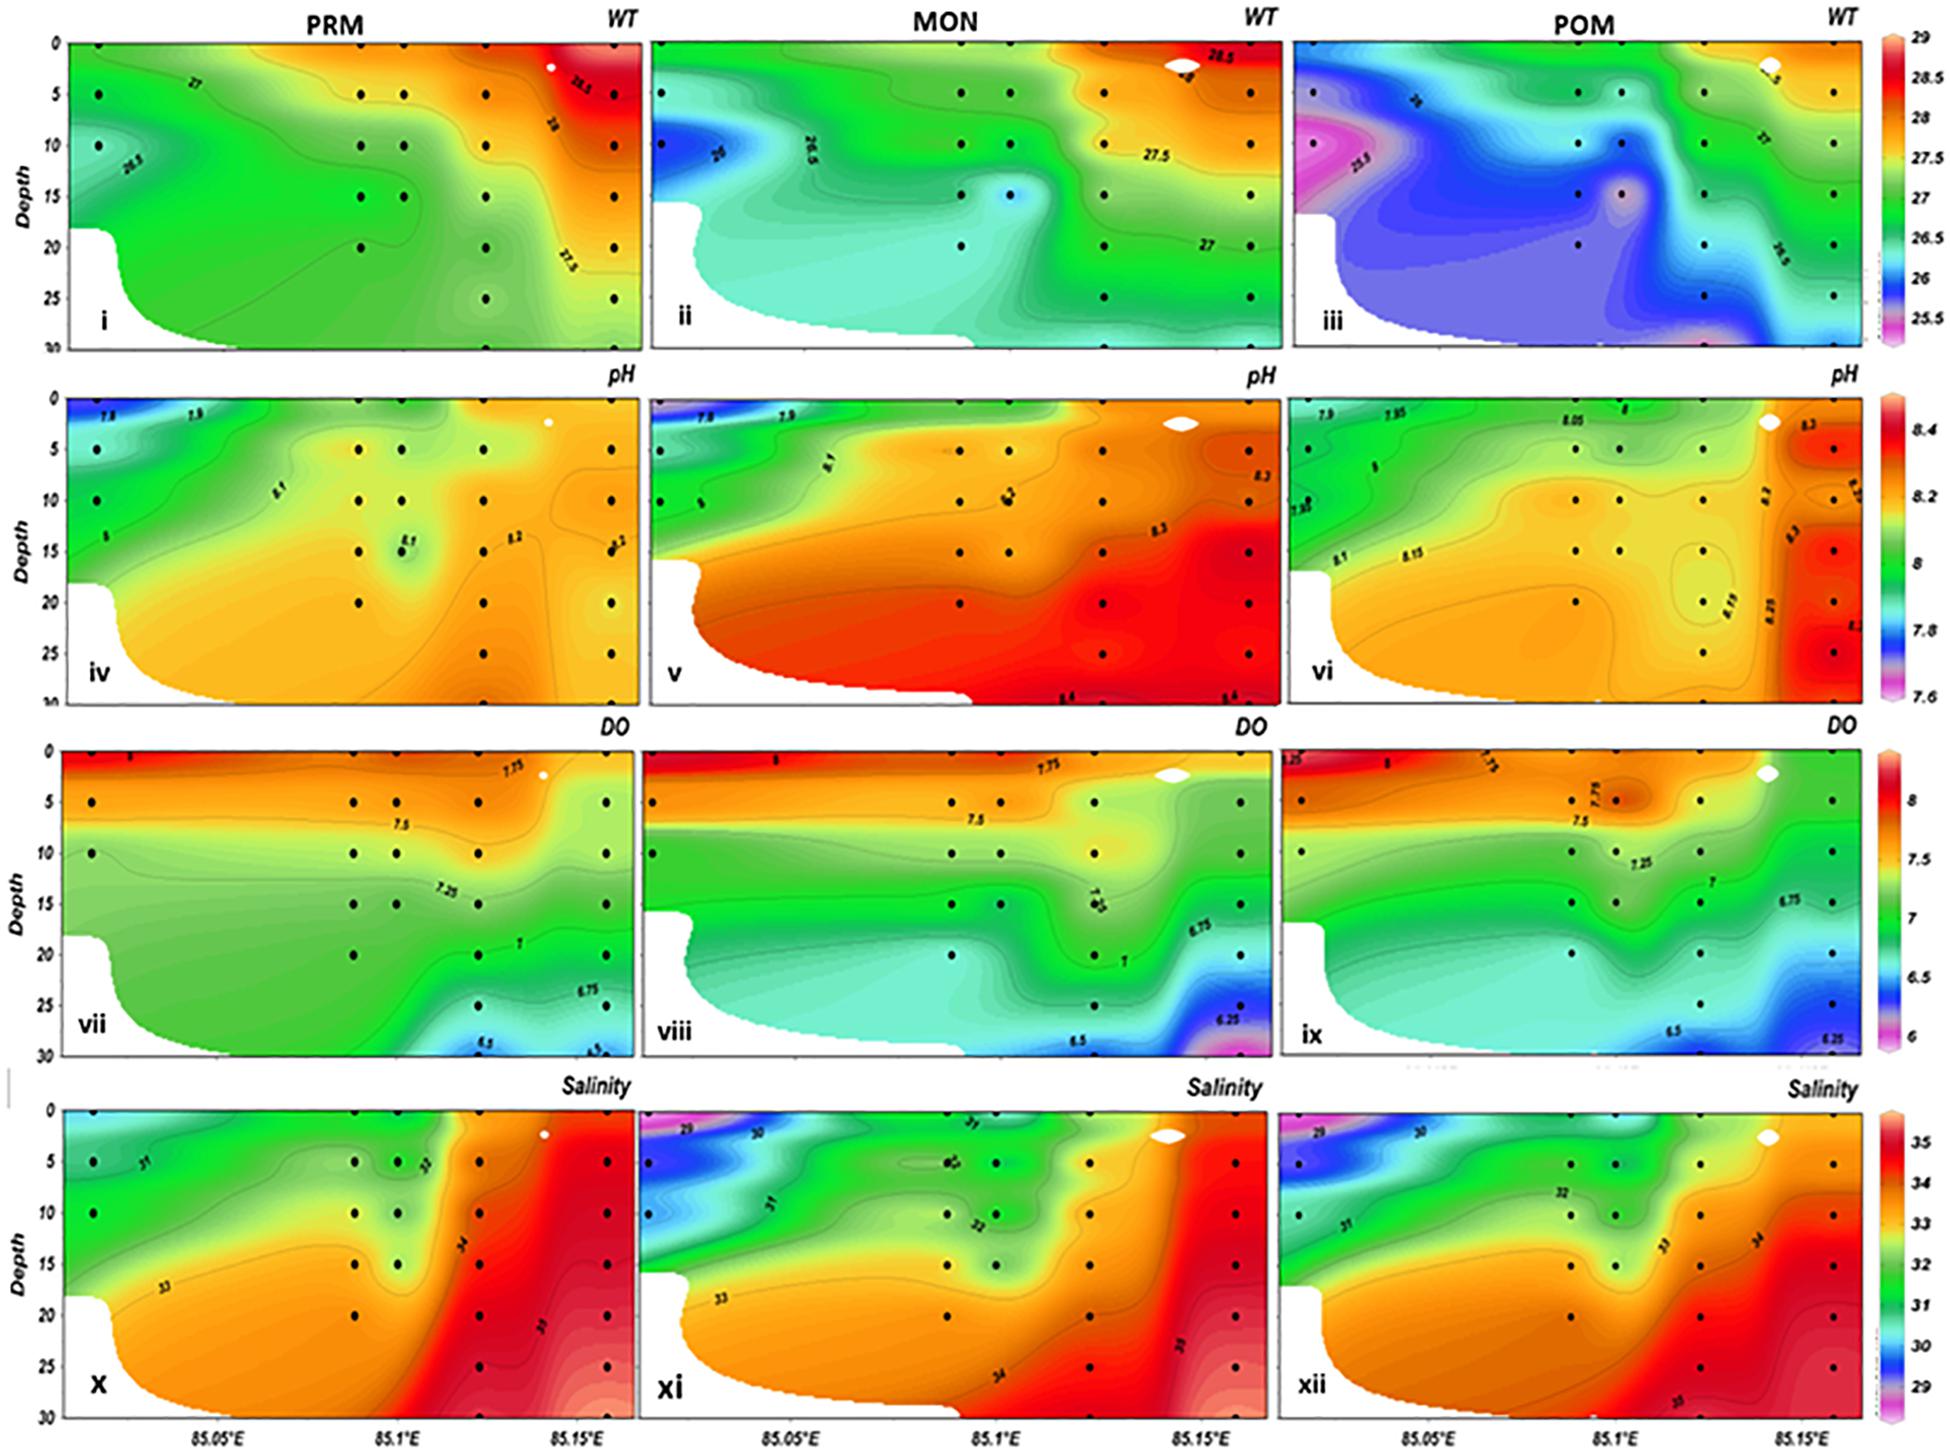
Figure 2. (i–xii)/Vertical distribution of water temperature (WT), pH, dissolved oxygen (DO), and salinity off Rushikulya Estuary (Black dots represents stations in sequence R1 > R2 > R3 > R4 > R5; PRM, pre-monsoon; MON, monsoon, POM, post-monsoon).
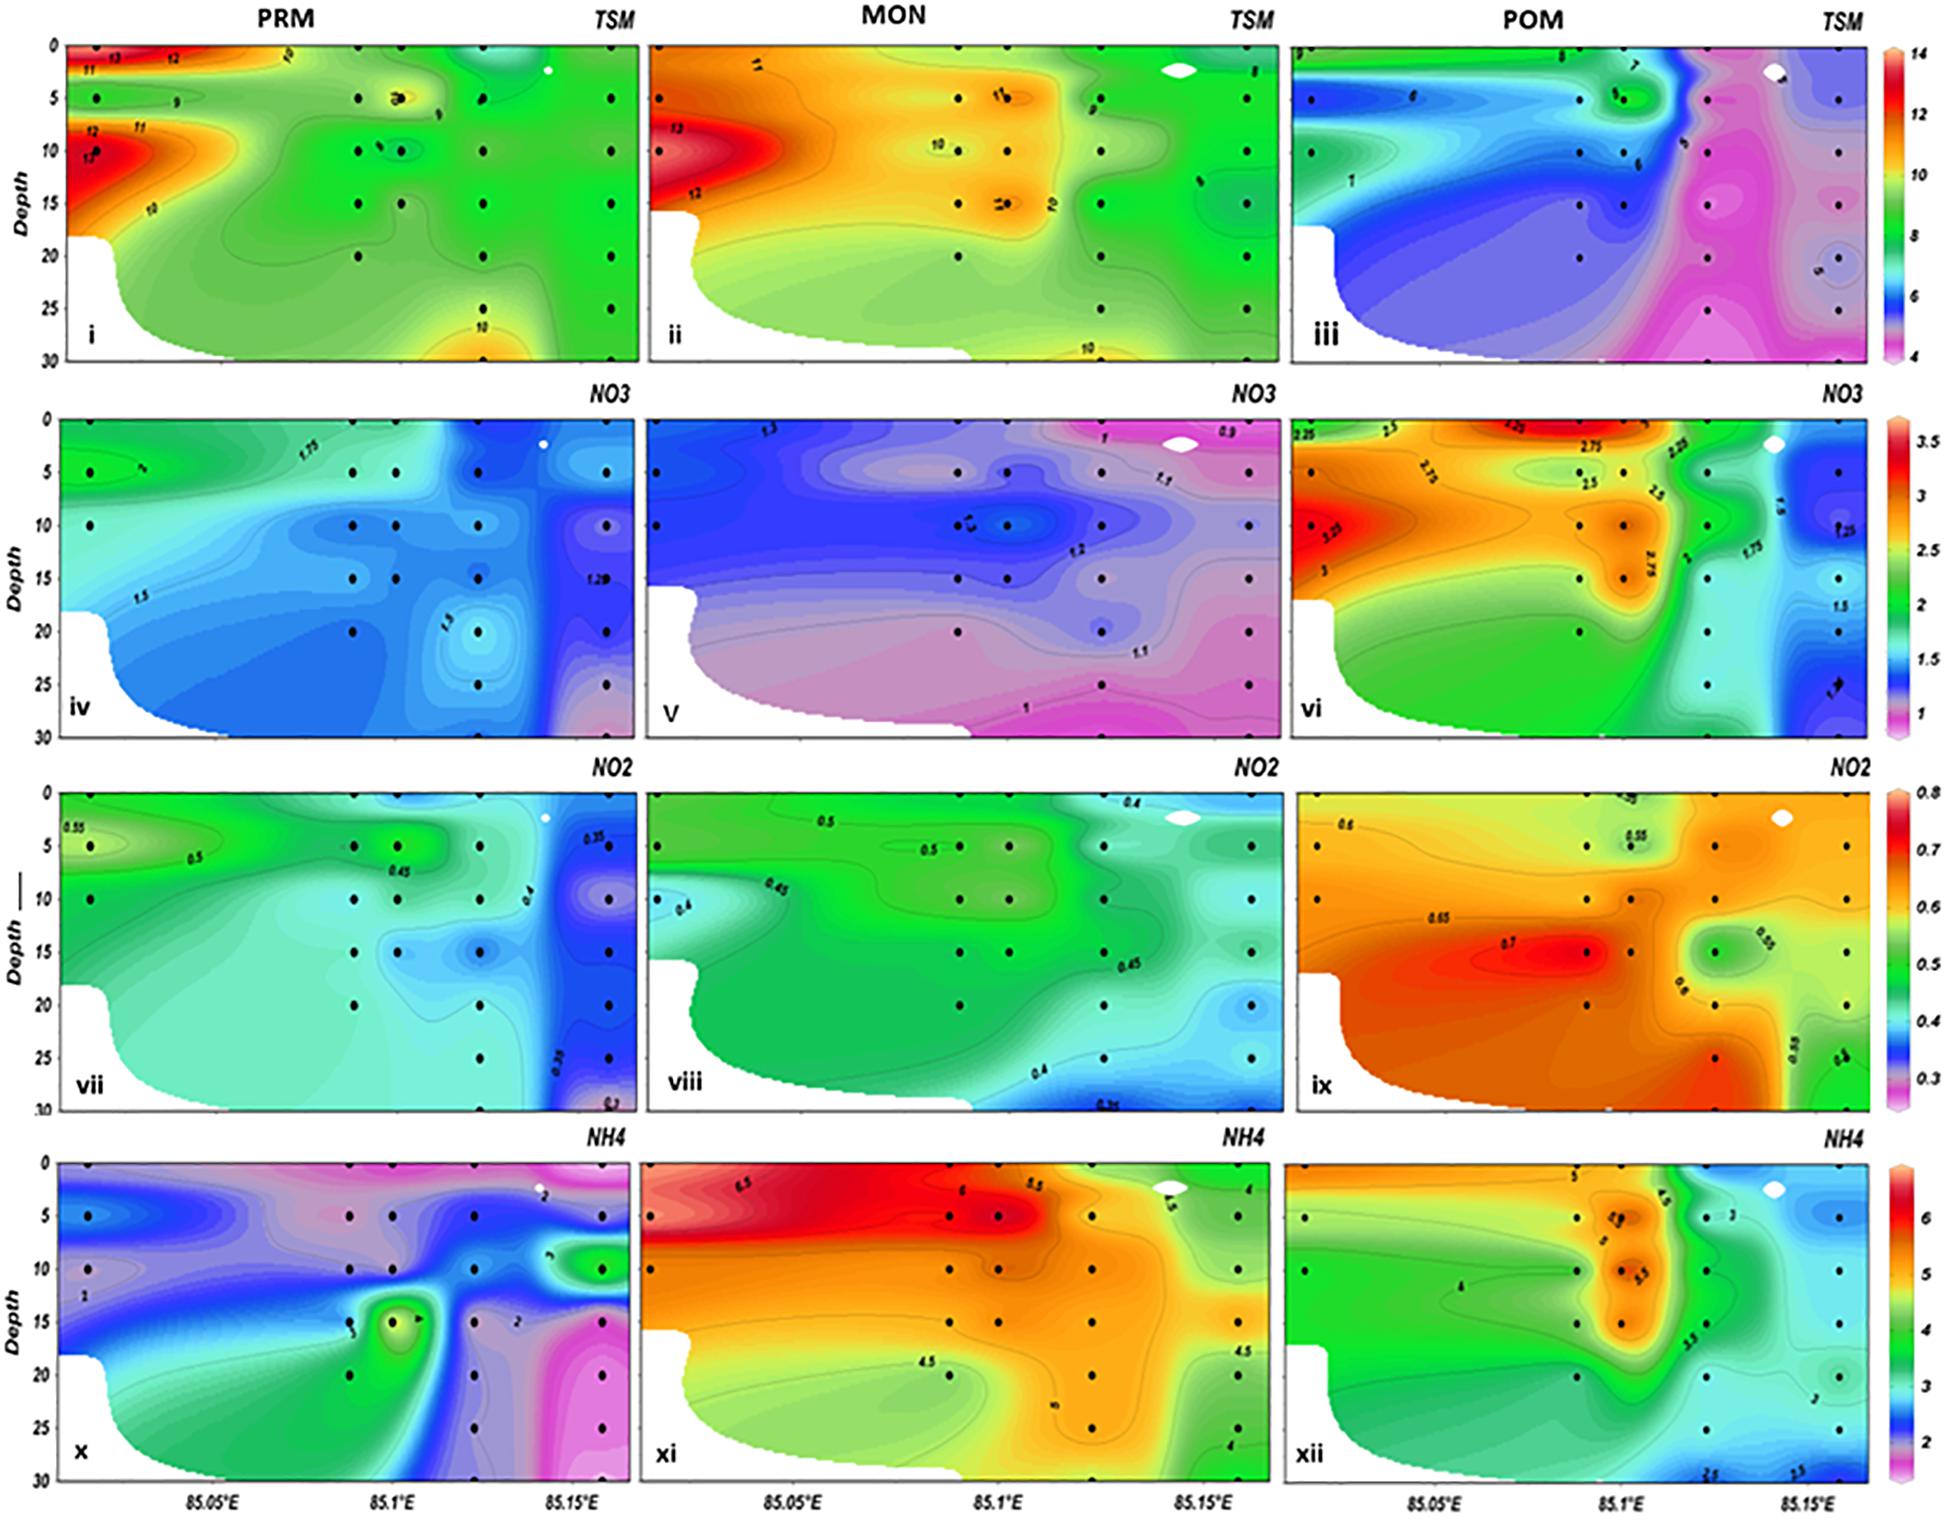
Figure 3. (i–xii)/Vertical distribution pf total suspended matter (TSM), NO3, NO2, and NH4 off Rushikulya Estuary (Black dots represents stations in sequence R1 > R2 > R3 > R4 > R5; PRM, pre-monsoon; MON, monsoon; POM, post-monsoon).
Nutrients and Phytopigment
The concentration of NO3-N ranged from 0.89 to 3.62 μmol/l (Supplementary Table S1). The highest value of NO3-N was observed at station R2 from 15 m depth in post-monsoon season, and lowest value was noticed in monsoon season at station R4 from 30 m depth as depicted in Figures 3v,vi. Lower values of NO3-N were noticed in the vertical profile of all the stations during pre-monsoon and monsoon, whereas in post-monsoon, a subsurface flushing of NO3-N was observed up to station R3. Natural sources of nitrate in surface water include igneous rock, land drains, and plant and animal debris. The anthropogenic contribution may be enhanced by municipal and industrial wastewater during post-monsoon season. The NO2-N concentration in the study area showed well-marked spatiotemporal variations. Average NO2-N varied from 0.28 to 0.77 μmol/l (Supplementary Table S1). The highest concentration of NO2-N was observed at station R4 from 25 m depth during post-monsoon season and lowest concentration at station R5 from surface water during pre-monsoon season (Figures 3vii,ix). A horizontal increasing trend of NO2-N was noticed during pre-monsoon and monsoon, whereas in post-monsoon, higher values were noticed in the subsurface layer of all the stations. The highest concentration of NO2-N was observed during post-monsoon and lowest concentration during pre-monsoon season. It is difficult to ascertain its causes, but it might be due to the addition of nitrite from exogenous sources or denitrification processes occurring at the sediment water interface (Sharp et al., 1982; Bianchi et al., 2004). Higher concentrations of subsurface nitrite and nitrate values during post-monsoon season were observed which might be due to their release from bottom sediments and land drainage. The similar observation was also reported by Shirodkar et al. (2009). During the study period, NH4-N varied from 1.36 to 6.81 μmol/l (Supplementary Table S1). The peak value was noticed at station R1 from surface water during monsoon season and lowest was recorded at station R5 from 30 m depth during pre-monsoon season (Figures 3x,xi). The peak value of NH4-N was recorded during monsoon season at station R1 from surface water. A similar observation was also reported off Rushikulya Estuary by Baliarsing et al. (2013). No natural sources have been noticed to increase the concentration of ammonia in the coastal waters. All the available information indicates anthropogenic releases and breaking down the organic matter as a source of ammonia to the coastal waters (Panigrahi et al., 2007; Smith et al., 2007). The phosphate concentration varied from 0.66 to 3.45 μmol/l (Supplementary Table S1). The maximum concentration of PO4-P was noticed at the surface water of R1 during post-monsoon season and lowest concentration was recorded at station R5 from 30 m depth during monsoon season as shown in Figures 4ii,iii. The highest concentration of PO4-P was noticed during post-monsoon season at station R1 from surface sample (0 m depth). The present results suggest that the main features of PO4-P distribution with high values during the post-monsoon season were possibly caused by the intrusion of sewage and/or industrial effluents. The SiO4-Si concentrations ranged from 0.89 to 7.97 μmol/l (Supplementary Table S1). The silicate concentration was found to be higher during monsoon season at station R2 from 5 m depth and the lowest value was found at station R5 from surface water during pre-monsoon season (Figures 4iv,v). The SiO4-Si concentration was found to be higher during monsoon season. Comparatively lower concentrations of silicate in the offshore stations than nearshore stations might be related to high biological productivity and a biological removal of dissolved silicate by absorption onto suspended sediments (De Souza et al., 1981).
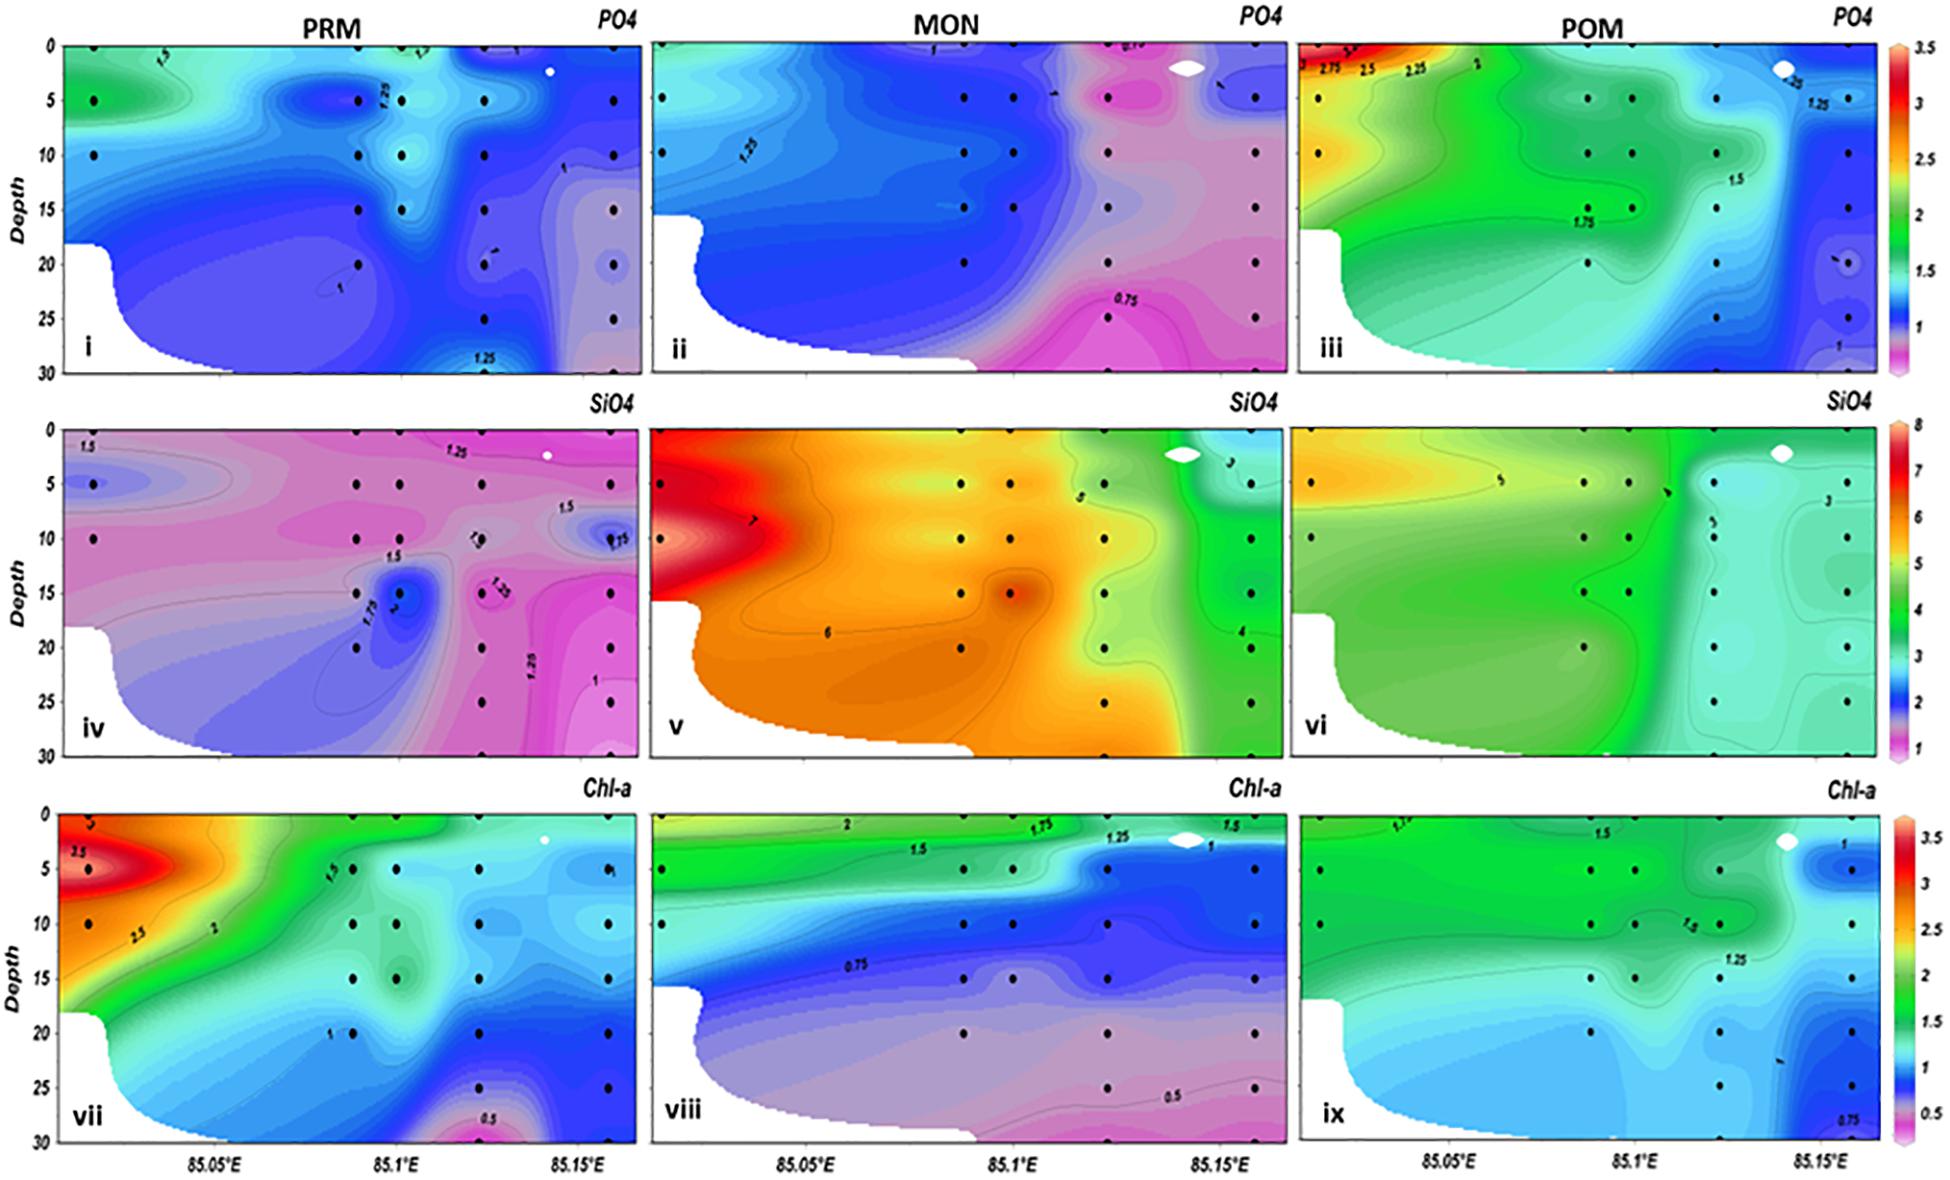
Figure 4. (i–ix)/Vertical distribution pf PO4, SiO4, and Chl-a off Rushikulya Estuary (Black dots represents stations in sequence R1 > R2 > R3 > R4 > R5; PRM, pre-monsoon; MON, monsoon; POM, post-monsoon).
The vertical distribution of chl-a showed high concentrations in the surface and subsurface layers of all the stations and low concentrations in the bottom waters. There was no spatial uniformity in the seasonal cycle of chl-a across the study area. The chl-a concentration was recorded from 0.25 to 3.72 mg/m3 during the study period (Supplementary Table S1). The highest chl-a concentration was observed at station R1 from 5 m depth during pre-monsoon season and the lowest value was recorded at station R4 from 30 m depth. Both horizontal and vertical distributions of chl-a are depicted in Figure 4vii. During the study period, the highest chl-a concentration was observed during pre-monsoon season from subsurface water (5 m depth) at station R1. The results clearly featured the frequency of high chl-a due to the period of spring efficiency in the coastal waters off Rushikulya Estuary. The pre-monsoon convection (overturning) process which brings nutrient-rich subsurface waters to the photic zone found responsible for this enhanced biological production. The relationship considers that the chl-a exhibited a strong positive correlation with nutrients, which are shown in Supplementary Table S2. The seasonal transition of monsoon circulation was also affected by the wind direction and SST in Odisha coast. During the transition period from northeast to southwest monsoon, chl-a distribution was observed high in nearshore station off Rushikulya Estuary. A similar observation was also reported in Pahang coastal waters (Sumadri et al., 2012).
Statistical Analyses
Factor Analysis
The three steps of FA, such as (i) generation of correlation matrix, (ii) extraction of underlying factors, and (iii) rotation of factors to extract maximum possible information from the datasets as explained by Gupta et al. (2005), were implemented for the datasets. The sorted rotated FA results along with eigenvalues and the percentage of total variance are given in Supplementary Table S3. For interpretation of associateships between different environmental variables, the factor loadings are termed as “strong,” “moderate,” and “weak” corresponding to absolute loading values of >0.75, 0.75–0.50, and 0.50–0.40, respectively (Liu et al., 2003). Factor loadings are correlations between the original variables and each factor. During pre-monsoon, three factors explained 67.27% of the total variance. F-1 explained about 35.67% of the total variance, which was strong loaded with DO and chl-a and moderate loaded with NO2 and NO3 and weak loaded with PO4, whereas negative loaded with pH and salinity. F-2 contributed 19.85% of the total variance, which was strong loaded with TSM and negative loaded with water temperature. F-3 explained about 11.76% of the total variance found to be strongly associated with NH4 and PO4 moderate negative loaded with SiO4 (Supplementary Table S3). The higher DO and chl-a values at the nearshore stations were due to the incursion of less saline riverine water when contrasted with high saline seaward waters. Moreover, increasing chl-a and decreasing salinity were also contributed by the riverine source. However, the moderate and weak relation of chl-a and DO suggests that the chl-a was not much influenced by other loadings but remained independent under the existing environmental conditions in this coastal environment. So, these factors can, therefore, be termed as productivity factors. In monsoon, three factors explained 73.95% of the total variance. F-1 contributed 37.55% of the total variance, which was strong loaded with TSM and SiO4 and moderate loaded with NH4 while negative and strong loaded with WT. F-2 explained about 24.82% of the total variance, which was strong loaded with PO4 and NO3 and moderate with chl-a and NO2. F-3 accounted for 11.58% of the total variance. It was strong loaded with DO and weak loaded with WT and chl-a and negative loaded with pH and salinity (Supplementary Table S3). Whereas in case of post-monsoon, four factors explained about 71.60% of the total variance. F-1 contributed 30.20% of the total variance, which was strong loaded with DO and moderate with TSM while negative loaded with salinity and pH. F-2 accounted for about 18.75% of the total variance, which was strong loaded with NO2 and moderate with NO3 and NH4. F-3 explained 12.25% of the total variance, which was strong loaded with WT and PO4. F-4 explained about 10.40% of the total variance, which was strong loaded with chl-a and moderate loaded with SiO4 (Supplementary Table S3). Results show that the nearshore water contains high nutrient values as compared to the offshore waters. These above factors signify that negative loading of pH with positive loading of nutrients can be termed as the terrigenous factors.
Cluster Analysis
The relationships among the environmental variables were obtained through cluster analyses using Ward’s method (linkage between groups). In this method, an analysis of variance approach is used to evaluate the euclidean distance between the clusters as similarity measure and synthesized in dendrograms and nm-MDS (Figures 5–7). The dendrogram indicated that the distance between the parameters was less significantly correlated. The physicochemical and biological parameters WT, pH, DO, salinity, TSM, NO2-N, NO3-N, NH4-N, PO4-P, SiO4-Si, and chl-a were used as variables. During pre-monsoon, three major clusters were observed. In the first, WT and salinity were included, whereas NH4-N, NO2-N, chl-a, NO3-N, and PO4-P fall in the second group. In the third group, the DO, pH, TSM, SiO4-Si, and depth were included. From the nm-MDS group, it was observed that the chl-a was the least influenced by WT and salinity. However, chl-a showed a very close proximity to NO3, NH4, NO2, and PO4. The intermediate group contains the parameters such as SiO4, DO, TSM, and pH where depth remained constant (Figure 5). However, a moderate linkage was observed with SiO4 and TSM to that of chl-a. It can be hypothesized that during pre-monsoon, the necessary nutrients for chl-a appeared as NO3, NH4, NO2, and PO4, whereas SiO4 is an accessory nutrient. Depth remained homogeneous from the entire group, which is attributed as a non-linkage parameter having an insignificant contribution to the observation attained. During monsoon, there were three groups parallel out from CA. Figure 5 shows that the chl-a was highly influenced by PO4, NO3, and NO2. NH4 was grouped in the second cluster, which was previously in close proximity to chl-a (Figure 6). It might be due to the ingress of fresh water because of riverine runoff and precipitation. Depth remained constant as per the previous condition. However, DO and pH were closely related, showing good saturation condition of DO in the study area. The TSM exhibited a distant relation with chl-a, which probably was due to the ingress of silt-borne fresh water from the nearby river discharge. During post-monsoon, the previous condition was maintained and no great variation was observed (Figure 7). In the tropical estuarine and coastal environment, the monsoon plays a major role in the variability of physicochemical parameters that can directly impact the dissemination of chl-a (Pednekar et al., 2012). As reflected from the rainfall and river discharge over the study area (Figure 8), the analysis of monthly average rainfall and river discharge over the study area shows that 80% of the annual rainfall is received during monsoon months viz. June–October, and the river discharge follows accordingly. Maximum river discharge is recorded during September (35%) followed by November (22%) and August (21%) (Figure 8). The major finding obtained from nm-MDS and CA is that a direct influence of nutrients rather than the physical parameters was a major cause of concern for chl-a distribution. Ammonia was linked with chl-a in pre-monsoon which has not maintained the same trend during monsoon and post-monsoon.
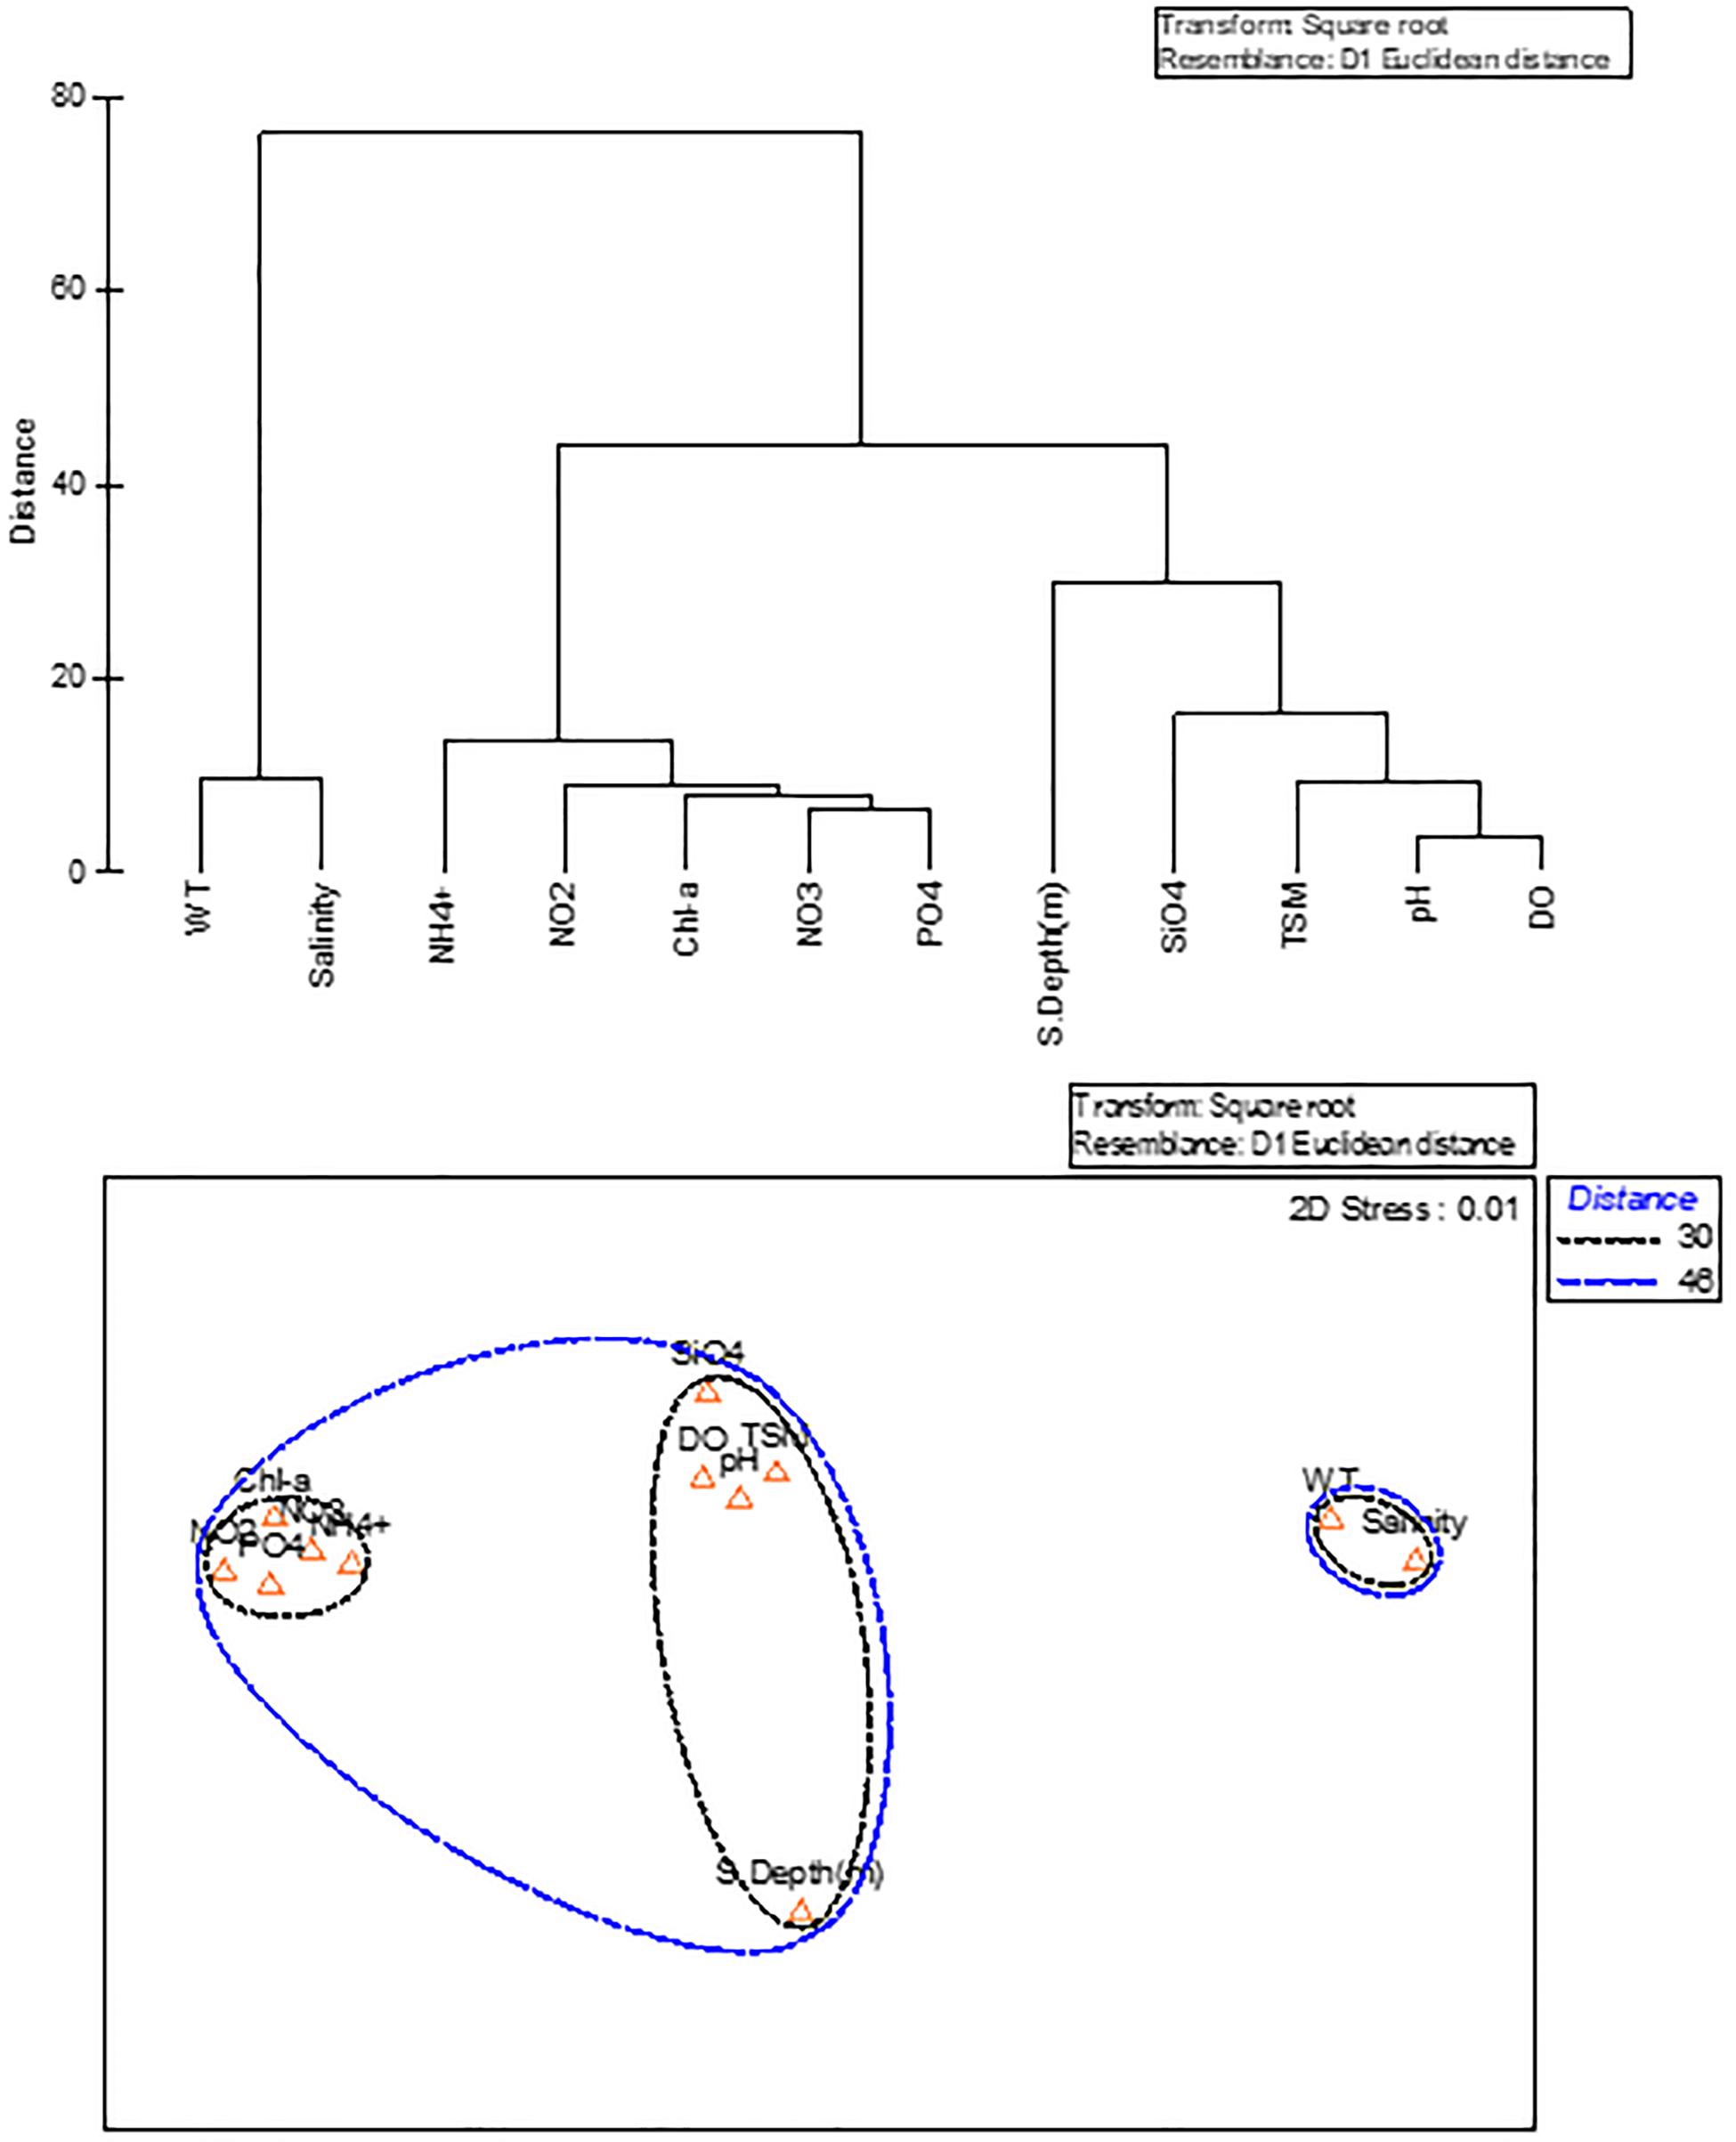
Figure 5. Cluster analysis and non-metric multidimensional scaling (nm-MDS) during pre-monsoon.
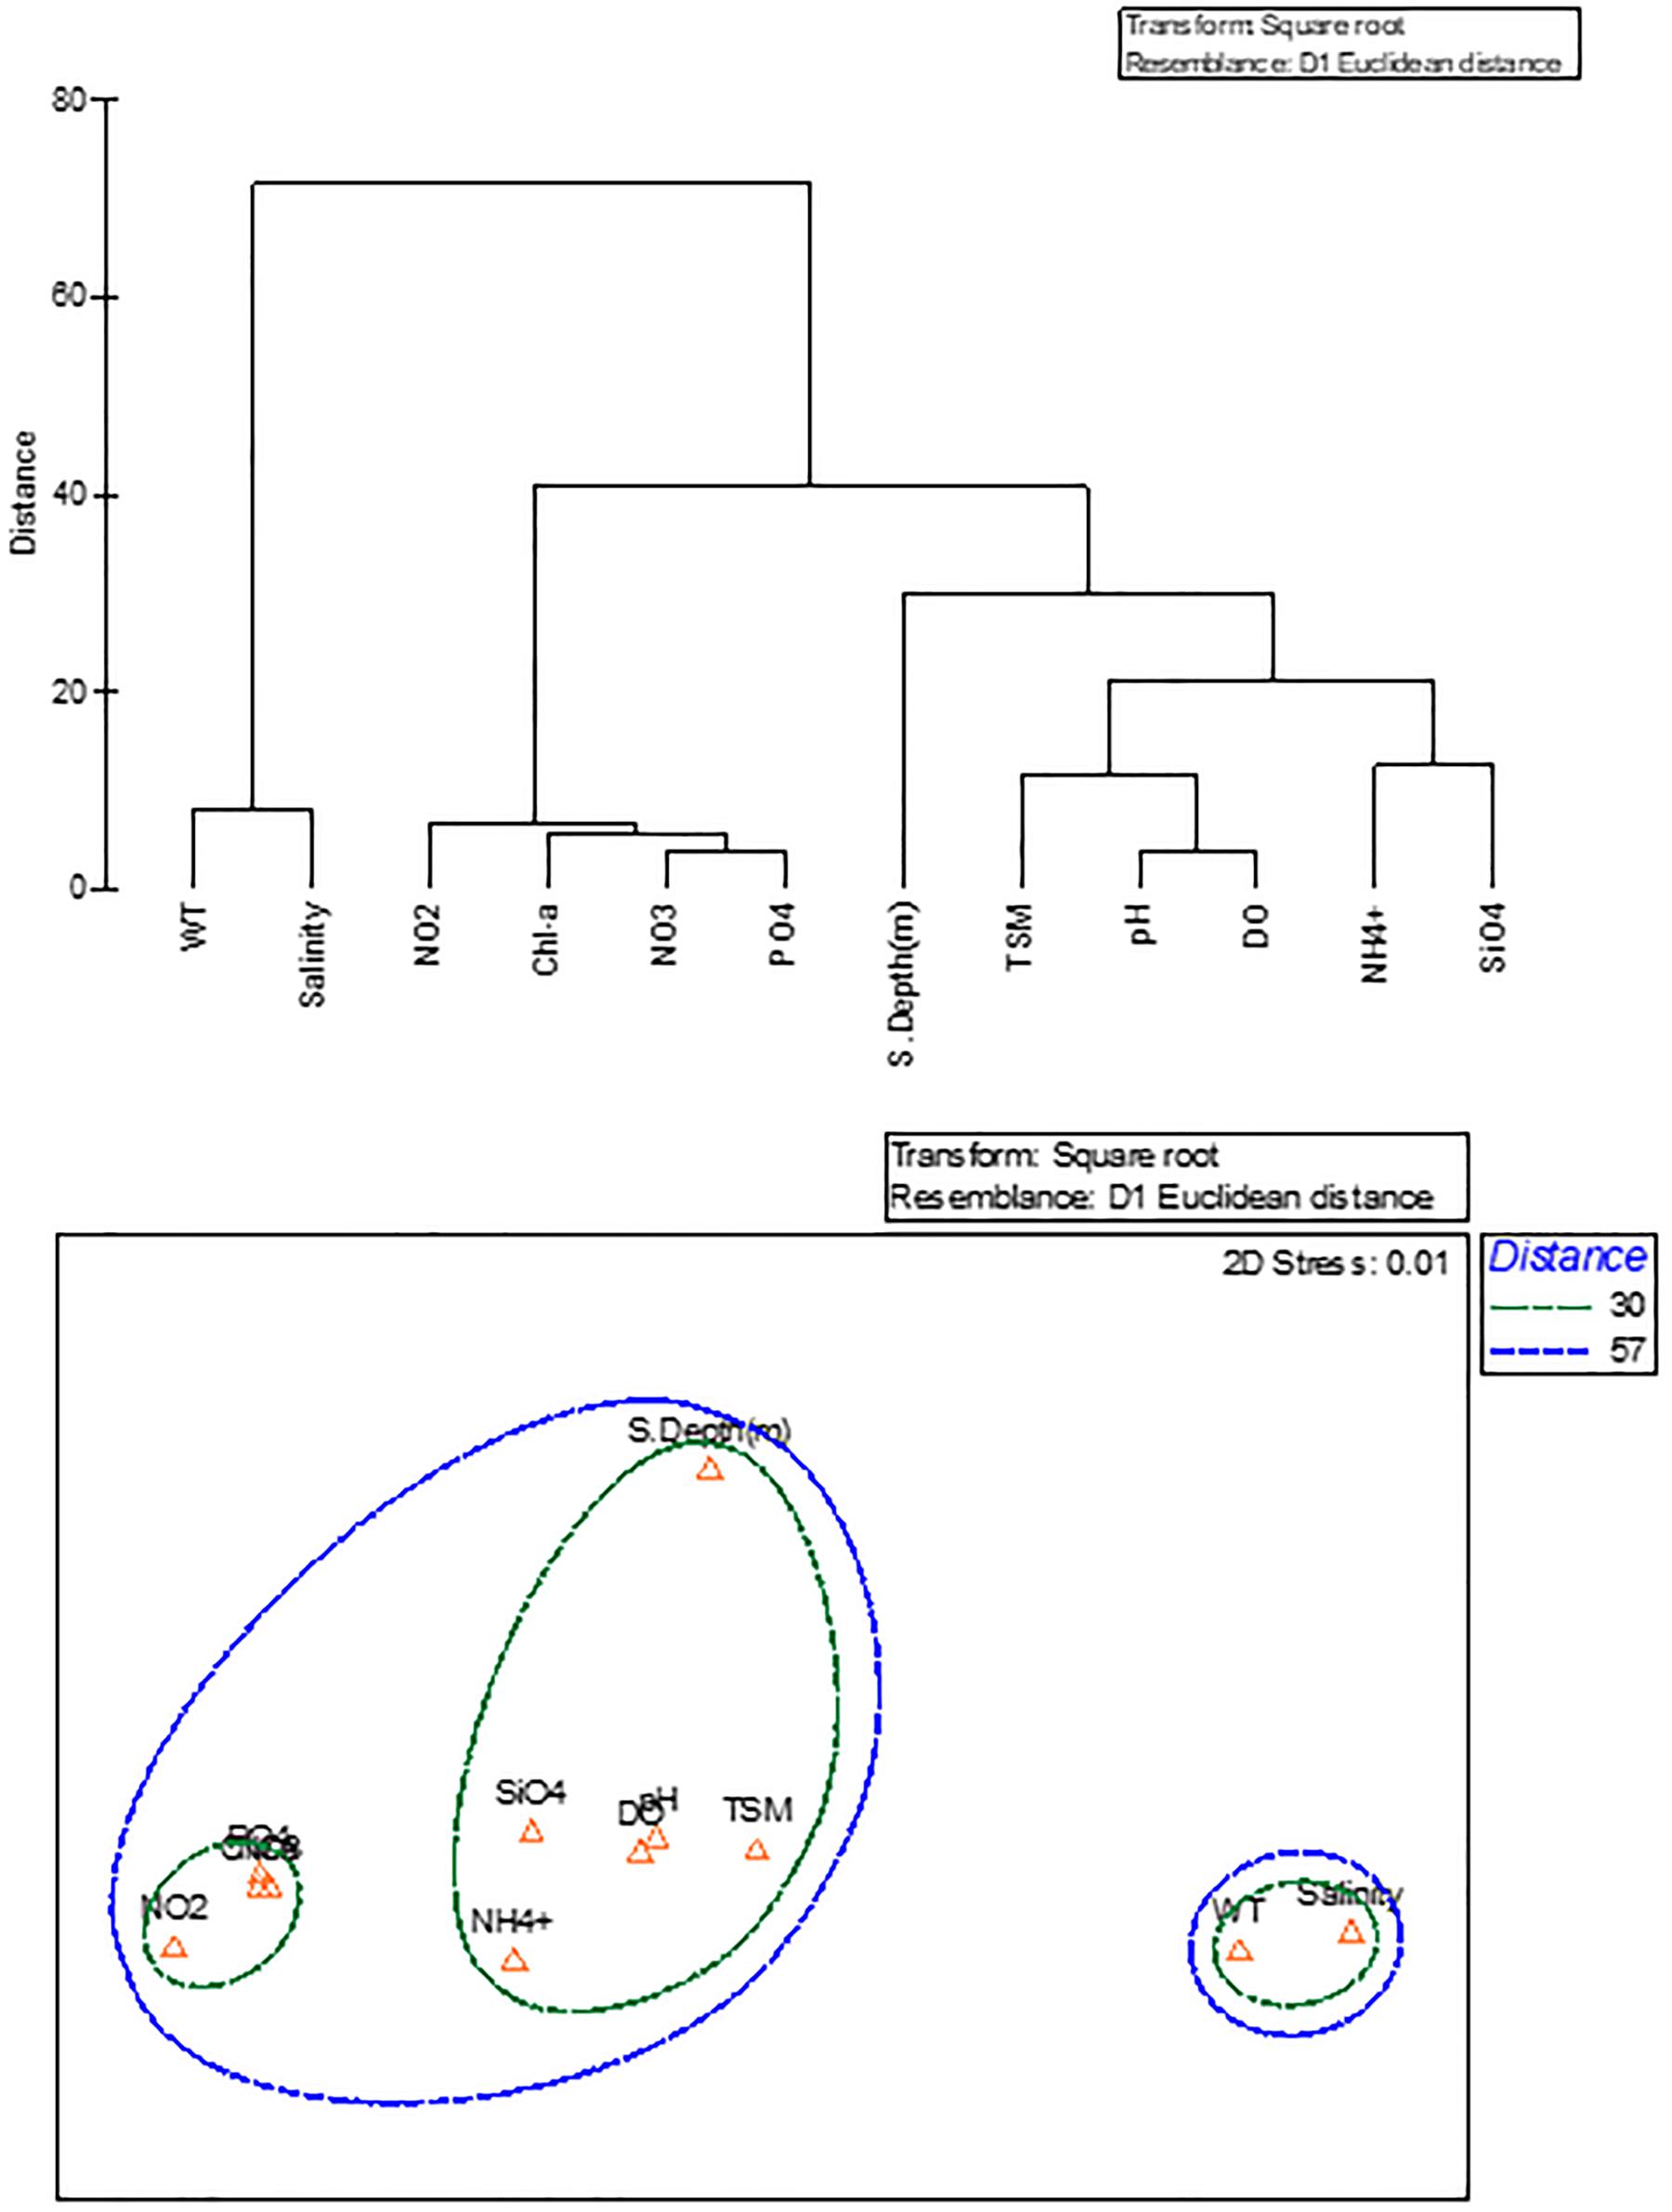
Figure 6. Cluster analysis and non-metric multidimensional scaling (nm-MDS) during monsoon.
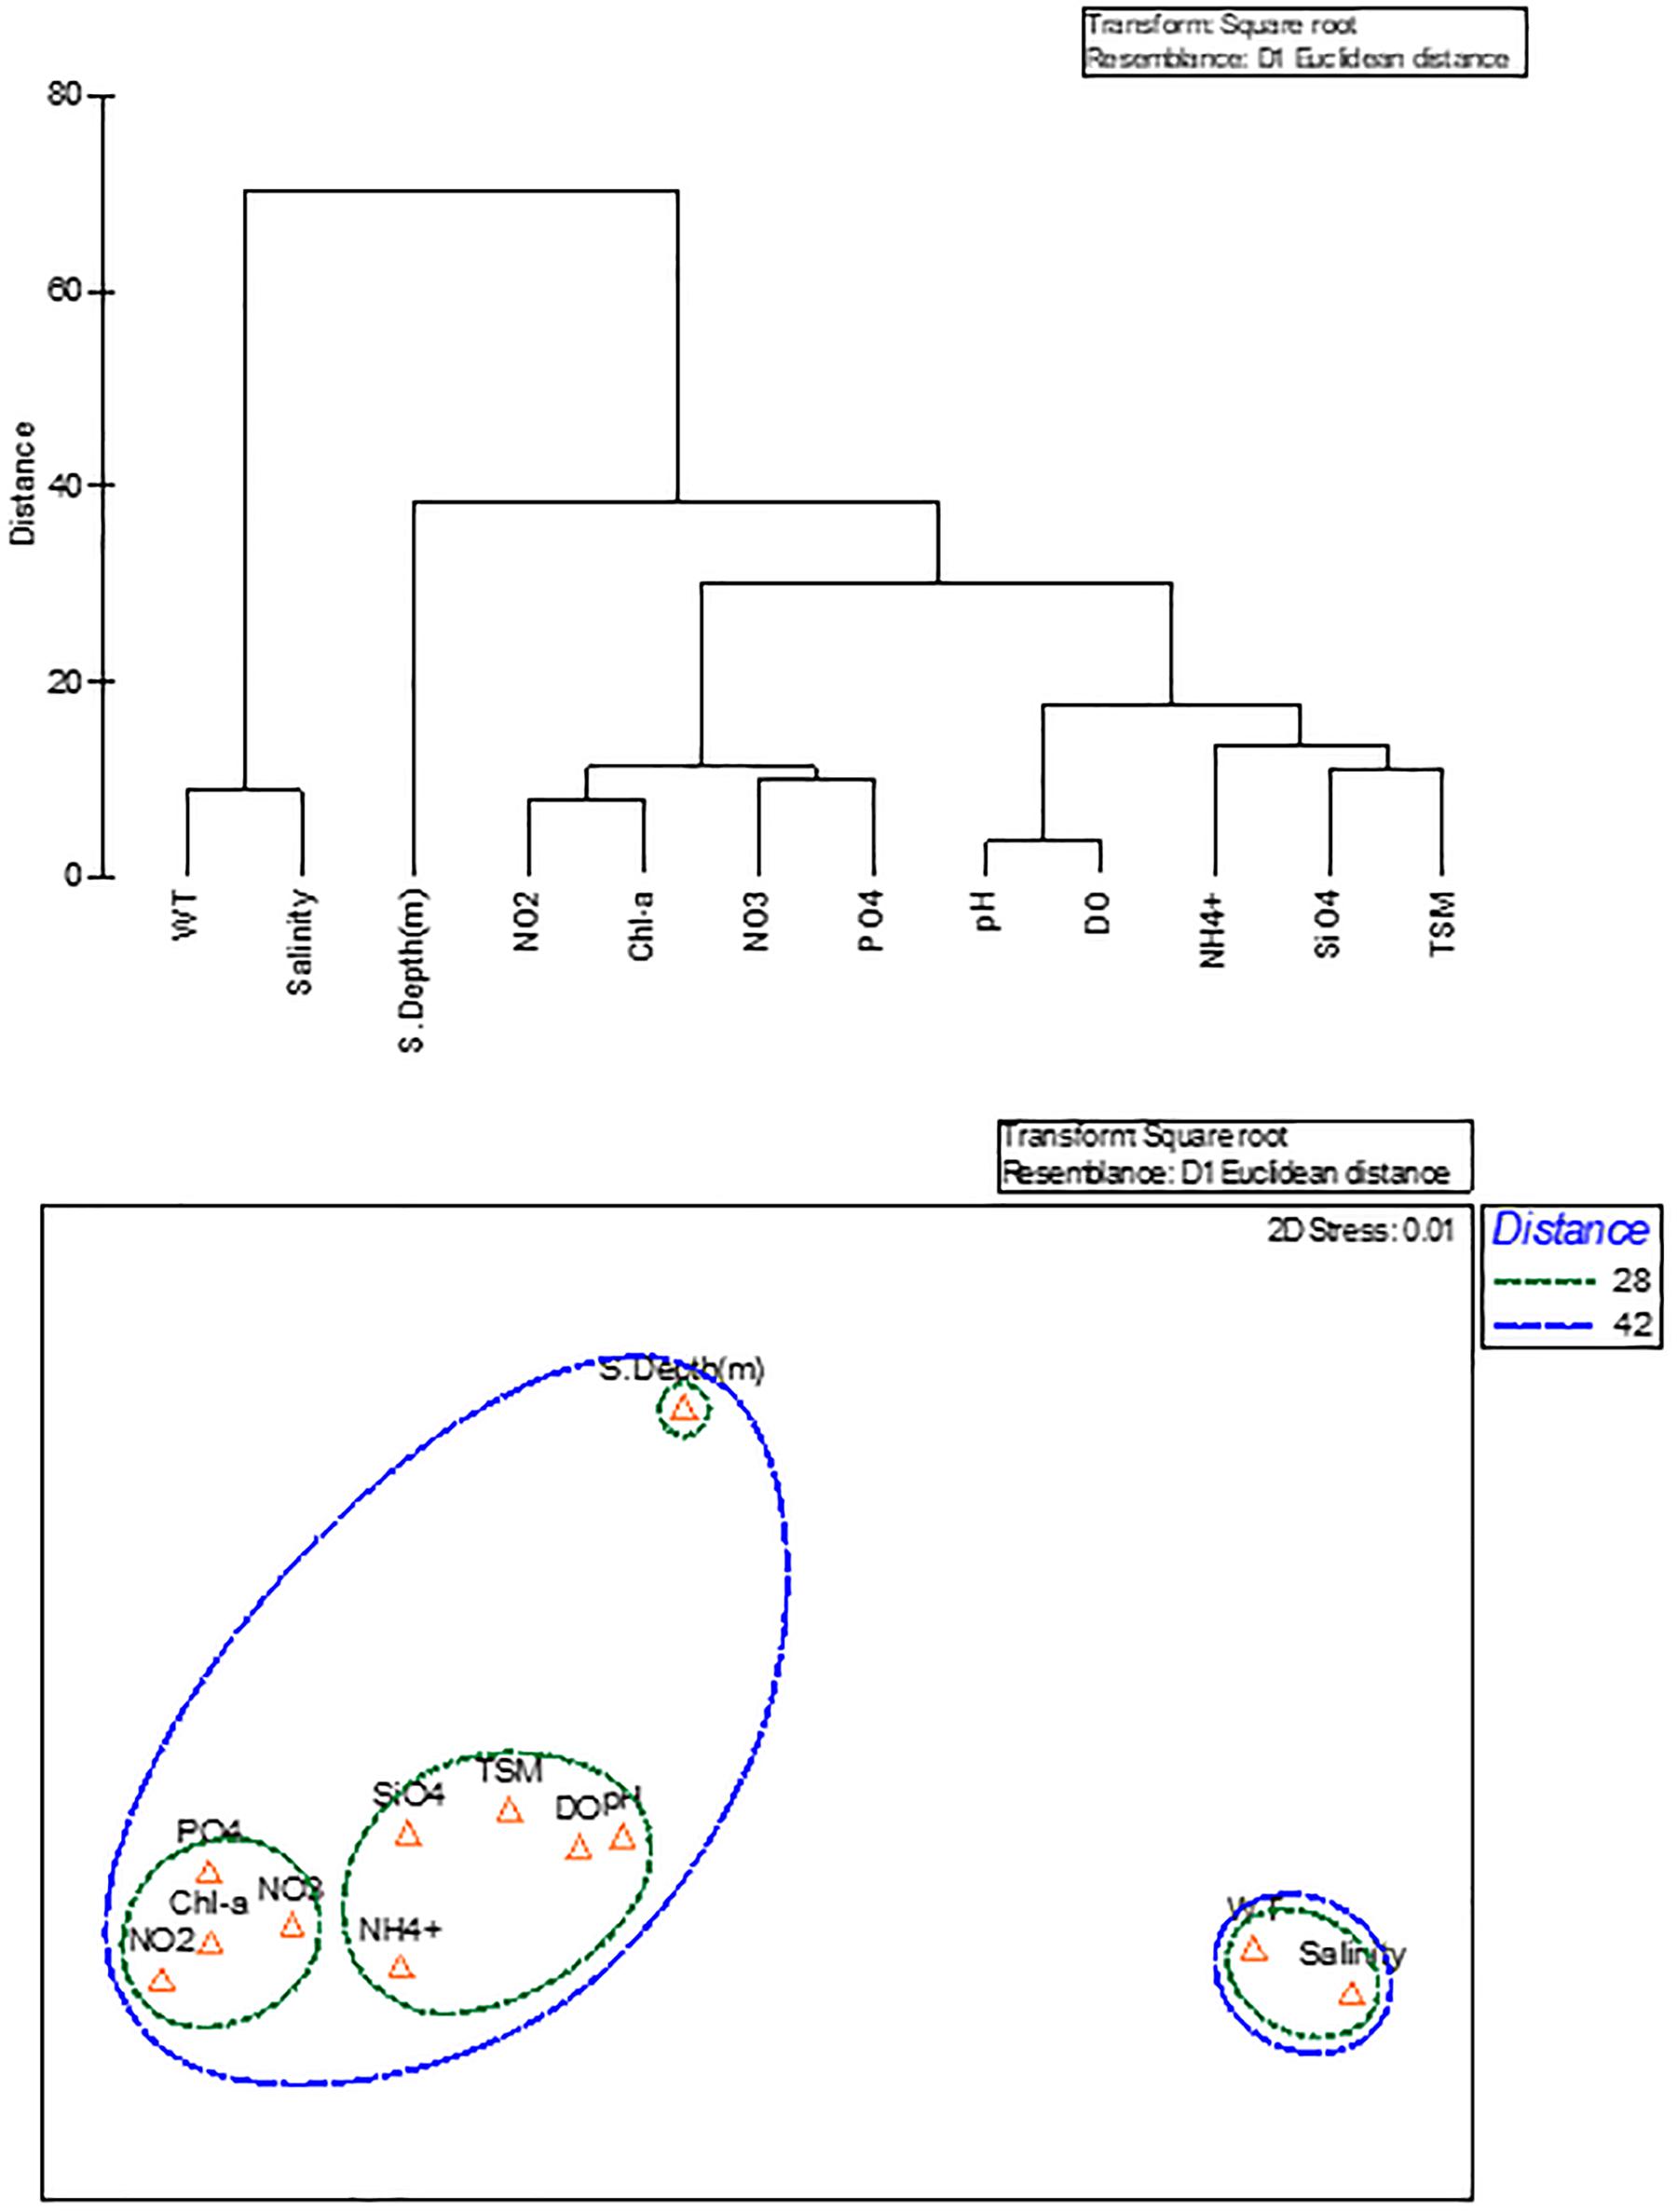
Figure 7. Cluster analysis and non-metric multidimensional scaling (nm-MDS) during post-monsoon.
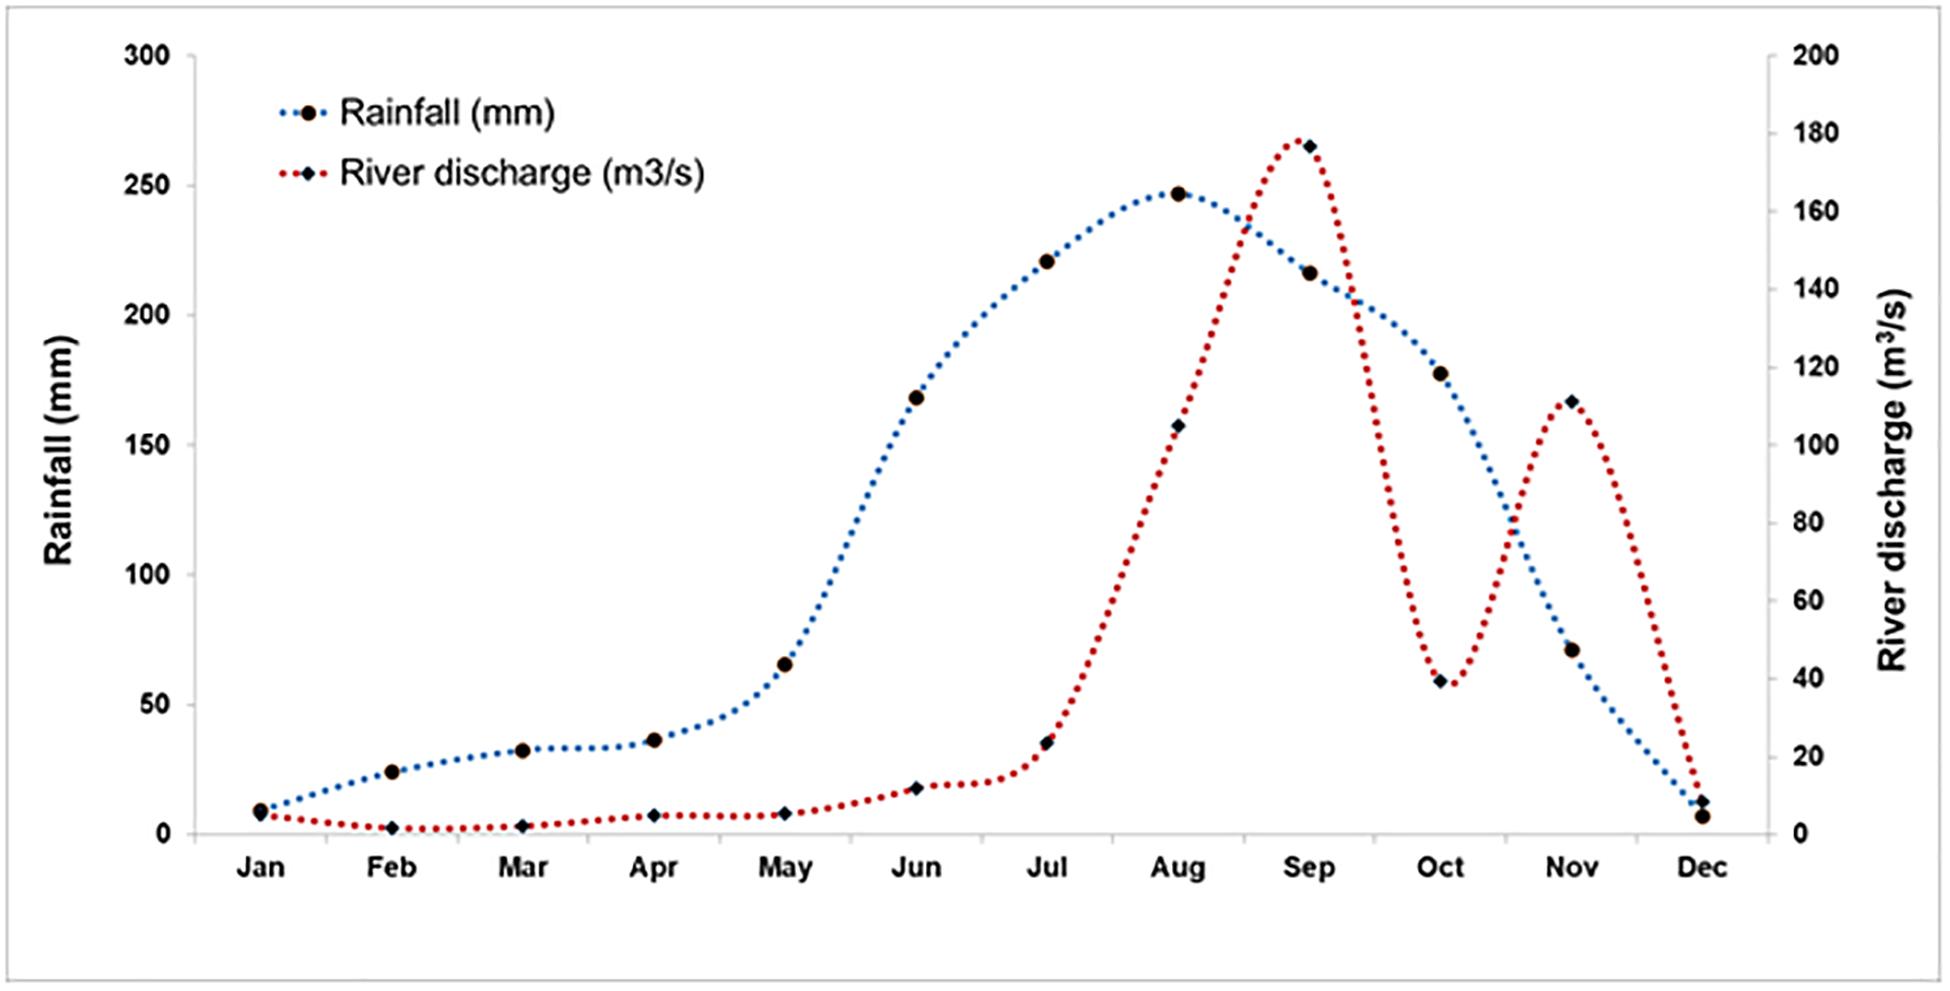
Figure 8. Monthly average of rainfall and river discharge at Ganjam Rain Gauge station during 2011–2013 (Source: Department of Water Resources, Government of Odisha).
Conclusion
The present study established the ecological conditions of coastal waters off Rushikulya Estuary, BoB, from time series observations at five locations. The hydrography was noticed inconsistent, and significant spatiotemporal variability of nutrients in the water column was apparent. Nutrient-rich bottom water was found to act as a significant pool in reloading the water column under sediment resuspension. The dominant parameters affecting the water quality over different seasons is deciphered using factor analyses. This would help in understanding the contaminants which influence the water quality and assimilative capacity of the estuary, as the external loading of contaminants that reduces the assimilative capacity. The study concludes that the nutrients and TSM were of terrigenous origin. We noticed lower DO in the surface and water column during monsoon compared to the post-monsoon and pre-monsoon. The study indicates that water influx at the coastal waters with different physicochemical properties, nearshore and offshore of the 30 m isobath, due to different estuarine and terrestrial runoff strongly linked to the seasonal tropical monsoon. This possibly resulted in the variability of physicochemical parameters and regulated the chl-a (phytoplankton biomass) in the study region with respect to the monsoonal influence that supplies the nutrients and the biomass. However, the study further needs to be monitored for a longer period for supplementary data in the study region to understand the impact of monsoonal influence/river discharges, anthropogenic influence and its significant effect on the phytoplankton biomass, productivity, and ecosystem. In addition, the higher resolution in situ data would be a baseline information to validate models and satellite retrieval data in the extensive coastal water ecosystem.
Data Availability Statement
All datasets generated for this study are included in the article/Supplementary Material.
Author Contributions
SN, KS, AL, RM, UP, and PM conceived the study and conducted the data analyses. SN and KS conducted the sample collection. SN carried out the lab analyses. SN, RM, and UP drafted the manuscript. All authors revised and edited the manuscript.
Conflict of Interest
The authors declare that the research was conducted in the absence of any commercial or financial relationships that could be construed as a potential conflict of interest.
Frontiers Media SA remains neutral with regard to jurisdictional claims in published maps and institutional affiliations.
Acknowledgments
We would like to thank the vice-chancellor of Berhampur University for providing laboratory facilities and invaluable help and support for this study. We would also like to thank the Indian National Centre for Ocean Information Services, MoES, Government of India, for funding support during the study period. RM would like to thank the Director of NCPOR for encouraging to study the oceanographic parameters and biology extensively including the coastal waters and publications.
Supplementary Material
The Supplementary Material for this article can be found online at: https://www.frontiersin.org/articles/10.3389/fmars.2020.00648/full#supplementary-material
References
Baliarsing, S. K., Srichandan, S., Naik, S., Sahu, K. C., Lotliker, A., and Kumar, T. S. (2013). Distribution of Hydro-biological Parameters in Coastal Waters off Rushikulya Estuary, East Coast of India: A Premonsoon Case Study. Pakistan J. Biol. Sci. 16, 779–787. doi: 10.3923/pjbs.2013.779.787
Baliarsingh, S. K., Lotliker, A. A., Sahu, K. C., and Sinivasa Kumar, T. (2015). Spatio-temporal distribution of chlorophyll-a in relation to physico-chemical parameters in coastal waters of the northwestern Bay of Bengal. Environ. Monit. Assess. 187:481. doi: 10.1007/s10661-015-4660-x
Barik, S. K., Muduli, P. R., Mohanty, B., Behera, A. T., Mallick, S., Das, A., et al. (2017). Spatio-temporal variability and the impact of Phailin on water quality of Chilika lagoon. Cont. Shelf Res. 136, 39–56. doi: 10.1016/j.csr.2017.01.019
Behrenfeld, M. J., Bose, E., Siegel, D. A., and Shea, D. M. (2005). Carbon based ocean productivity and phytoplankton physiology from space. Glob. Biogeochem. Cy. 19, 1–14. doi: 10.1029/2004GB002299
Bianchi, F., Ravagnan, E., Acri, F., Bernardi-Aubry, F., Boldrin, A., Camatti, E., et al. (2004). Variability and fluxes of hydrology, nutrients and particulate matter between the Venice Lagoon and the Adriatic Sea. Preliminary results (years 2001–2002). J. Mar. Syst. 51, 49–64. doi: 10.1016/j.jmarsys.2004.05.007
Bramha, S., Panda, U., Rath, P., Mohanty, P., and Satpathy, K. K. (2011). Anthropological influence in coastal water and and its impact on olive ridley turtle: A case study at Rushikulya mass nesting site. J. Ecol. Nat. Environ. 3, 268–272.
Carignan, R., Planas, D., and Vis, C. (2000). Planktonic production and respiration in oligotrophic Shield lakes. Limnol. Oceanogr. 45, 189–199. doi: 10.4319/lo.2000.45.1.0189
Chandran, R., and Ramamurthy, K. (1984). Hydrobiological studies in the gradient zone of Vellar estuary-I: physico-chemical parameters. Mahasagar. Bull. 17, 69–77.
Clarke, K. R., and Gorley, R. N. (2006). PRIMER v6: User Manual/Tutorial (Plymouth Routines in Multivariate Ecological Research). Albany: PRIMER-E. Plymouth.
Conoco (2004). Oil prospecting lease 248:Environmental Baseline Survey, Report No. CO/EIA/011/04. Texas: Conoco.
De Souza, S. N. R., Gupta, S., Sanzgiri, S., and Rajgopal, M. D. (1981). Studies on nutrients of Mandovi and Zuari River systems. Indian J.Mar. Sci. 10, 314–321.
Emmel, F. J., and Curray, J. R. (1983). The Bengal Submarine Fan, Northeastern Indian ocean. Geo Mar. Lett. 3, 119–124. doi: 10.1007/bf02462456
Gouda, R., and Panigrahy, R. C. (1992). Seasonal distribution and behaviour of silicate in the Rushikulya estuary, east coast of India. Indian J. Mar. Sci. 24, 11–115.
Grasshoff, K., Ehrhardt, M., Kremling, K., and Anderson, L. G. (1999). Methods of Seawater Analysis. Wiley-VCH.
Gupta, A. K., Gupta, S. K., and Patil, R. S. (2005). Statistical analyses of coastal water quality for a port and harbour region in India. Environ. Monit. Assess. 102, 179–200. doi: 10.1007/s10661-005-6021-6027
India Metrological Department [IMD] (2006). Ministry of Earth Sciences, Government of India, New Delhi, www.imd.gov.in. New Delhi: IMD.
Laviolette, P. E. (1967). Temperature, salinity and density of the worlds sea: Bay of Bengal and Andaman Sea. Washington, DC: Naval Oceanographic Office.
Liu, C.-W., Lin, K.-H., and Kuo, Y.-M. (2003). Application of factor analysis in the assessment of groundwater quality in a blackfoot disease area in Taiwan. Sci. Total Environ. 313, 77–89. doi: 10.1016/s0048-9697(02)00683-686
Massart, D. L., Vandeginste, B. G. M., Deming, S. N., Michotte, Y., and Kaufman, L. (1988). Chemometrics: a textbook. D. L. Massart. B. G. M. Vandeginste, S. N. Deming, Y. Michotte, and L. Kaufman, Elsevier, Amsterdam, 1988. ISBN 0-444-42660-4. Price Dfl 175.00. J. Chemom. 2, 298–300. doi: 10.1002/cem.1180020409
Menon, N. N., Balchand, A. N., and Menon, N. R. (2000). Hydrobiology of the Cochin backwater system – A review. Hydrobiologia 430, 149–183. doi: 10.1023/a:1004033400255
Mishra, R. K., Shaw, B. P., Das, S. K., Rao, K. S., Choudhary, S. B., and Rao, K. H. (2003). Spatio-temporal variation of optically active substances in the coastal water off Orissa from Rushikulya to Dharma (east coast of India). Indian J. Mar. Sci. 32, 133–140.
Mishra, R. K., Shaw, B. P., Sahu, B. K., Mishra, S., and Senga, Y. (2009). Seasonal appearance of Chlorophyceae phytoplankton bloom by river discharge off Paradeep at Orissa Coast in the Bay of Bengal. Environ. Monit. Assess. 149, 261–273. doi: 10.1007/s10661-008-0200-2
Mohapatra, T. R., and Padhy, S. N. (2001). Seasonal fluctuations of physico-chemical parameters of Rushikulya estuary, Bay of Bengal. Indian J. Environ. Ecoplann. 5, 35–40.
Naik, S., Mishra, R. K., Mahapatro, D., and Panigrahy, R. C. (2014). Impact of water quality on phytoplankton community and biomass in Dhamara Eastury, East coast of India. J. Environ. Biol. 35, 229–235.
Newton, A., Icely, J. D., Falcao, M., Nobre, A., Nunes, J. P., Ferreira, J. G., et al. (2003). Evaluation of eutrophication in the Ria Formosa coastal lagoon, Portugal. Cont. Shelf Res. 23, 1945–1961. doi: 10.1016/j.csr.2003.06.008
Newton, A., and Mudge, S. (2005). Lagoon-sea exchanges, nutrient dynamics and water quality management of the Ria Formosa (Portugal). Estuar. Coast. Shelf Sci. 62, 405–414. doi: 10.1016/j.ecss.2004.09.005
Pandav, B., Choudhury, B. C., and Kar, C. S. (1994). Discovery of a new sea turtle rookery in Orissa, India. Mar. Turt. Newsl. 67, 15–16.
Panigrahi, S., Acharya, B. C., Panigrahy, R. C., Nayak, B. K., Banarjee, K., and Sarkar, S. K. (2007). Anthropogenic impact on water quality of Chilika lagoon RAMSAR site: A statistical approach. Wetl. Ecol. Manag. 15, 113–126. doi: 10.1007/s11273-006-9017-3
Pednekar, S. M., Prabhu Matondkar, S. G., and Kerkar, V. (2012). Spatiotemporal distribution of harmful algal flora in the tropical estuarine complex of Goa, India. Sci. World J. 2012:596276. doi: 10.1100/2012/596276
Pradhan, U. K., Mishra, P., Mohanty, P. K., Panda, U. S., and Murthy, M. V. R. (2018). “Nearshore hydrodynamics near an open coast harbour at gopalpur, central east coast of India,” in Lecture Notes in Civil Engineering, eds M. di Prisco, S.-H. Chen, I. Vayas, S. K. Shukla, A. Sharma, N. Kumar, et al. (Singapore: Springer), 219–237. doi: 10.1007/978-981-13-3134-3_17
Rath, P., Bhatta, D., Sahoo, B. N., and Panda, U. C. (2000). Multivariate Statistical Approach to Study Physico-Chemical Characteristics in Nandira - Brahmani River, Angul-Talcher Belt, Orissa. Pollut. Res. 19, 701–710.
Sarma, V. V. S. S., Gupta, S. N. M., Babu, P. V. R., Acharya, T., Harikrishnachari, N., Vishnuvardhan, K., et al. (2009). Influence of river discharge on plankton metabolic rates in the tropical monsoon driven Godavari estuary. India. Estuar. Coast. Shelf Sci. 85, 515–524. doi: 10.1016/j.ecss.2009.09.003
Sharp, J. H., Culberson, C. H., and Church, T. M. (1982). The chemistry of the Delaware estuary. General considerations1. Limnol. Oceanogr. 27, 1015–1028. doi: 10.4319/lo.1982.27.6.1015
Shetye, S. R., Shenoi, S. S. C., Gouveia, A. D., Michael, G. S., Sundar, D., and Nampoothiri, G. (1991). Wind-driven coastal upwelling along the western boundary of the Bay of Bengal during the southwest monsoon. Cont. Shelf Res. 11, 1397–1408. doi: 10.1016/0278-4343(91)90042-90045
Shirodkar, P. V., Mesquita, A., Pradhan, U. K., Verlekar, X. N., Babu, M. T., and Vethamony, P. (2009). Factors controlling physico-chemical characteristics in the coastal waters off Mangalore—A multivariate approach. Environ. Res. 109, 245–257. doi: 10.1016/j.envres.2008.11.011
Singh, K. P., Malik, A., Mohan, D., and Sinha, S. (2004). Multivariate statistical techniques for the evaluation of spatial and temporal variations in water quality of Gomti River (India)—a case study. Water Res. 38, 3980–3992. doi: 10.1016/j.watres.2004.06.011
Smith, A. M., Keene, W. C., Maben, J. R., Pszenny, A. A. P., Fischer, E., and Stohl, A. (2007). Ammonia sources, transport, transformation, and deposition incoastal New England during summer. J. Geophys. Res. 112, D10S08. doi: 10.1029/2006JD007574
Srinivasan, V., Gorelick, S. M., and Goulder, L. (2010). Factors determining informal tanker water markets in Chennai. India. Water Int. 35, 254–269. doi: 10.1080/02508060.2010.487931
STAR (2003). Environmental Baseline survey of Agbami Field in OPL 216, Final Report. No. S0307C. Nigeria: Nigerian Agip Oil Company.
Strickland, J. D. H., and Parsons, T. R. (1972). A practical handbook of seawater analysis, Bulletin. Fish. Res. Board Canada 167:293.
Sumadri, M., Lihan, T., and Mustapha, M. (2012). N, and of Chlorophyll-a Distribution off Pahang Coastal Waters Using Satellite Images. Putrajaya: Malaysia Geospatial Melaka.
Upadhyay, S. (1988). Physico-chemical characteristics of the Mahanadi estuarine eco-system. East coast of India. Indian J. Mar. Sci. 17, 19–23.
Vega, M., Pardo, R., Barrado, E., and Debán, L. (1998). Assessment of seasonal and polluting effects on the quality of river water by exploratory data analysis. Water Res. 32, 3581–3592. doi: 10.1016/S0043-1354(98)00138-9
Welsh, B. L., and Eller, F. C. (1991). Mechanisms controlling summertime oxygen depletion in western Long Island Sound. Estuaries 14, 265–278. doi: 10.2307/1351661
Westberry, T., Behrenfeld, M. J., Siegel, E., and Boss, E. (2008). Carbon-based primary productivity modeling with vertically resolved photoacclimation. Glob. Biogeochem. Cy. 22:GB2024. doi: 10.1029/2007GB003078
Zhang, J. Z., Kelble, C. R., Fischer, C. J., and Moore, L. (2009). Hurricane Katrina-inducednutrient runoff from an agricultural area to coastal waters in Biscayne Bay. Florida. Estuar. Coast. Shelf Sci. 84, 209–218. doi: 10.1016/j.ecss.2009.06.026
Keywords: water quality, phytopigment, multivariate analyses, tropical waters, Rushikulya Estuary
Citation: Naik S, Mishra RK, Sahu KC, Lotliker AA, Panda US and Mishra P (2020) Monsoonal Influence and Variability of Water Quality, Phytoplankton Biomass in the Tropical Coastal Waters – A Multivariate Statistical Approach. Front. Mar. Sci. 7:648. doi: 10.3389/fmars.2020.00648
Received: 23 December 2019; Accepted: 14 July 2020;
Published: 11 August 2020.
Edited by:
Malcolm McFarland, Florida Atlantic University, United StatesReviewed by:
Dipnarayan Ganguly, National Centre for Sustainable Coastal Management, IndiaPunyasloke Bhadury, Indian Institute of Science Education and Research Kolkata, India
Pradipta Ranjan Muduli, Wetland Research and Training Centre (WRTC), Chilika Development Authority, India
Copyright © 2020 Naik, Mishra, Sahu, Lotliker, Panda and Mishra. This is an open-access article distributed under the terms of the Creative Commons Attribution License (CC BY). The use, distribution or reproduction in other forums is permitted, provided the original author(s) and the copyright owner(s) are credited and that the original publication in this journal is cited, in accordance with accepted academic practice. No use, distribution or reproduction is permitted which does not comply with these terms.
*Correspondence: Rajani Kanta Mishra, cmFqYW5pbWlzaHJhQHlhaG9vLmNvbQ==