 Andrew Willson1*
 Blair Witherington2
 Robert Baldwin1
 Manjula Tiwari3
 Thuraya Al Sariri4Ali Al Kiyumi4
 Suaad Al Harthi5
 Maïa Sarrouf Willson5Asma Al Bulushi5
 Ghasi Al Farsi5Juma Al Humaidy5Juma Al Araimi5
 Lamees A. Daar5
 Barbara Schroeder6
 James Perran Ross7
 Earl Possardt8
- 1Five Oceans Environmental Services LLC, Muscat, Oman
- 2Inwater Research Group, Jensen Beach, FL, United States
- 3Ocean Ecology Network, Research Affiliate to NOAA-National Marine Fisheries Service, Marine Turtle Ecology and Assessment Program South West Fisheries Science Center, La Jolla, CA, United States
- 4Ministry of Environment and Climate Affairs, Muscat, Oman
- 5Environment Society of Oman, Muscat, Oman
- 6NOAA, National Marine Fisheries Service, Silver Spring, MA, United States
- 7Department of Wildlife Ecology and Conservation, University of Florida, Gainesville, FL, United States
- 8U.S. Fish and Wildlife Service, Division of International Conservation, Falls Church, VA, United States
Nest count surveys provide an important means for tracking trends in marine turtle populations. In 2015 the IUCN Red List global status review changed the loggerhead turtle (Caretta caretta) from Endangered to Vulnerable status, and, with a revised regional management unit (RMU) assessment system in place, concluded that the Northwest Indian Ocean loggerhead turtle RMU was Critically Endangered (CR). We analyzed annual time series nest count survey data between 1978 and 2016 to evaluate population trend and characterize the existing spatial and temporal attributes of a globally significant rookery on Masirah Island, Oman. A two-point trend assessment using a subset of historical data (1985–1996) combined with recent data (2008–2016) on a representative, 9-km section of index beaches revealed a change from 584 tracks–1 km–1 season–1 (SD = 109.5) to 122.43 tracks–1 km–1 season–1 (SD = 37.3), representing a statistically significant 79% decline. Comparative data were tested for spatial and temporal conformity, and the influence of other parameters on the trend result were considered, such as nesting success ratios and spatial shifts in density. Our analyses confirm that the decline occurred within a single loggerhead generation. Mean multiyear nest counts from recent surveys provides an estimate of 55,202 nests year–1 (SD = 16,814, CI 0.95 53,326–57,078) across 83 km of nesting beach. Considering recent clutch frequency estimates the mean number of nesting loggerheads per year is estimated between 10,223 (CI 0.95 9875–10,570) and 11,500 (CI 0.95 11,109–11,891). The Northwest Indian Ocean RMU is thought to represent 35% of the global nesting population. Recognizing a pressing need to address the decline in this population we identify potential threats on nesting beaches and at sea which point toward priority actions for conservation of this CR RMU.
Introduction
Animals with long generation times pose a challenge for population trend assessments. Loggerhead sea turtles (Caretta caretta) are in this challenging group, with an estimated generation time (maturation age plus half of reproductive lifespan; Pianka, 1974) of approximately 47 years (National Marine Fisheries Service [NMFS] and US Fish and Wildlife Service [USFWS], 2008). For long-lived animals such as loggerheads, abundance data limited to short time spans is likely to capture fluctuations that do not represent overall population trends (Barker and Sauer, 1992; Thomas, 1996; Holmes and Fagan, 2002; Freckleton et al., 2006). Short time series sea turtle nest-count data are especially unrepresentative. Although annual nest counts remain the most helpful index of adult female sea turtle abundance due to inaccessibility of other life stages, these counts are influenced by short-term environmental factors other than female abundance (Richards et al., 2011). Because of this annual sampling error in the total female population, sea turtle population assessments strive to represent time series approaching a generation or more (Snover and Heppell, 2009).
Nesting beaches serve as a valuable focus for sea turtle population assessments largely because of the ease with which nests (egg clutches) can be counted and evaluated, compared to the difficulty of counting turtles at sea. Females emerge on sandy beaches leaving conspicuous tracks in the sand and may deposit several clutches of eggs within a nesting season. Nests produced (and counted) in a season are therefore a function of the number of annual nesting females and their clutch frequency (clutches per season), and multi-season counts are a function of total nesting females, clutch frequency, and re-migration intervals (period between successive breeding migrations) (Schroeder et al., 2003). Although the estimated population abundance pertains only to a single life stage (adult females), this life stage is critical for demographic assessment. However, because of the protracted age to maturity of 36.2 ± SD 7.71 year (95% CI 28.2 to 44.3 year) (based on studies in the Southwest Indian Ocean Regional Management Unit, Tucek et al., 2014), assessments of adult females can be slow to reveal meaningful population changes involving earlier life stages. These assessments have important conservation implications, leading to an evaluation of threats in declining populations (e.g., Witherington et al., 2009; Tapilatu et al., 2013) or of good management practices in increasing sea turtle populations (e.g., Boulon et al., 1996), as well as the role of biological and environmental parameters impacting population recovery and trends (e.g., Wallace et al., 2006).
In the most recent IUCN Red List global status review, loggerhead sea turtles, were designated as Vulnerable (Casale and Tucker, 2017), with an increasing trend in the majority of subpopulations and an unknown trend for a few. Global loggerhead populations are represented by 10 biologically defined regional management units (RMUs) (Wallace et al., 2010a). Only two RMUs include sites of high loggerhead nesting (>20,000 nests per year). These are the Northwest Atlantic RMU (principally Florida, United States) and the Northwest Indian Ocean RMU. The Northwest Indian Ocean RMU (NWIO RMU) of which Masirah Island is thought to represent over 90% of the population, was designated as Critically Endangered, based on evidence that the subpopulation has been subjected to a depletion of >80% relative to population size within three generations (Casale and Tucker, 2017). Other loggerhead turtle RMU’s of interest in the Indian Ocean are located in the south west and the south east, both of which are listed as near threatened and are estimated to account for 2.3 and 1.5% of the global stock based on nesting abundance respectively (Nel and Casale, 2015; Casale and Tucker, 2017). The range of animals from the Northwest Indian Ocean (NWIO) RMU are understood to overlap with those of the Southeast Indian Ocean RMU (Dalleau et al., 2014), however genetic studies suggest there is no mixing (Shamblin et al., 2014; Dalleau et al., 2016). The population trend in this RMU is considered to be increasing. A putative RMU exists in the Northeast Indian Ocean and this is considered Critically Endangered based on annual nesting abundance (<25 nests year–1). Little is known about trends or its range apart from encounter data from the southern coast of Sri Lanka.
In the NWIO, surveys of loggerhead turtles nesting in the Sultanate of Oman were initiated in 1977 (Ross and Barwani, 1982). Ground-verified and aerial surveys of sea turtle emergences on beaches and track counts between 1977 and 1979 on Masirah (Ross, 1979) and on beaches along the rest of the Arabian Sea coastline between 1986 and 1991 (Salm, 1991) demonstrated that the island of Masirah had the vast majority (>90%) of loggerhead nesting in Oman (USFWS NOAA, 2011). Elsewhere in Oman, loggerhead nesting has been documented on at least 178 additional beaches, mostly on the Al Hallaniyat Islands (over 3000 nests year) and along the mainland Arabian Sea coast (approximately 2000 nests year–1) (Salm, 1991; Salm et al., 1993). In nearby Yemen, Pilcher and Saad (1999) reported annual nesting of between 50 and 100 loggerheads on Socotra Island. Moqbil (2007) reported loggerhead nesting at other sites in Yemen at the beaches of Sharma, Jethmoon, and Dhargham, with the highest nesting numbers at Dhargham, although no site-specific data are provided.
Surveys conducted between the late 1970s and early 1990s also identified significant numbers of green turtles (Chelonia mydas) and hawksbill turtles (Eretmochelys imbricata) nesting in Oman with an estimated 20,000 and 600 turtles nesting per year respectively (Ross, 1979; Salm, 1991). Ras al Hadd, approximately 200 km to the north of Masirah and Ras al Sharma in Yemen are thought to account for 90% the nesting activity in the North Indian Ocean green turtle RMU (Mancini et al., 2019). The RMU is currently listed under IUCN status assessments as Vulnerable although recent data for historical comparison is limited but indicative of decline in both these rookeries. In 1977 a smaller green turtle rookery was also documented from the central east to the southern coast of Masirah accounting for an estimated 150 nesting turtles per year. This rookery was described as overexploited due to harvesting of adult females (Ross, 1979; Ross and Barwani, 1982). Hawksbill and olive ridley (Lepidochelys olivacea) nesting is also documented from the south west and south east of the island with estimates of 240–275 (Ross and Barwani, 1982) and 150–250 nesting females (Rees and Baker, 2006), respectively. No regional status assessments have been undertaken for either of these species and caution should be exercised when comparing current and historic numbers as there was apparently no distinction made between species in the latter study (Rees and Baker, 2006). Spatial overlap of nesting by different species on Masirah is accompanied by a degree of temporal overlap with hawksbill and olive ridley turtles starting to nest in January/February, loggerhead turtles in late April, and green turtles in August (Ross and Barwani, 1982).
Population size estimates for loggerheads nesting on Masirah have been produced using two principal methods: (1) tagging (i.e., application of metal flipper tags for identification) and re-sighting of nesting females, corrected for detection probability and clutch frequency, and (2) track counts (i.e., turtle emergences on the nesting beach, Ross, 1997, 1987; Ross and Barwani, 1982). These studies made assumptions on clutch frequency, determination of successful nesting using imprints left in the sand by emerging turtles, and spatial and temporal expansion of estimates, resulting in an estimate that 20,000–40,000 females nested on the island annually between 1977 and 1986, based on an estimated clutch frequency of 4.0 nests–1 female–1 season–1. This magnitude of nesting indicated Masirah to be the largest loggerhead rookery in the world. In the years since this initial assessment, standardized track and nest counts, under the guidance of Oman’s Ministry of Environment and Climate Affairs (MECA), were further refined and standardized in 2008 with an international collaboration between MECA, Environment Society of Oman (ESO)/Five Oceans Environmental Services LLC (5OES), US Fish and Wildlife Service (FWS), Florida Fish and Wildlife Commission (FWC), and the Marine Research Institute (MRI).
Recent work using satellite telemetry to determine clutch frequency of Masirah loggerheads has generated a nesting frequency denominator that shows lower population estimates. Rees et al. (2010) deployed satellite tags after the beginning of the nesting season producing a revised clutch frequency estimate of 4.8 ± 1.2 (SD) nests per season (n = 8), and Tucker et al. (2018) estimated an overall mean clutch frequency from satellite tags deployed on additional tagging of early season nesters estimating 5.4 nests per female annually (SD = 0.87, range of 4–7 nests, n = 34). This latter estimate results in a −27% correction to previous population estimates. Metrics related to population estimates of this RMU hold important conservation management implications given that the sub-population is considered isolated based on the genetic studies conducted on nesting females of the Masirah rookery (Bowen et al., 1994; Shamblin et al., 2014). The goals of loggerhead turtle research efforts on Masirah Island have been to understand the long-term trends of nesting females and their broader spatial ecology as a starting point to identify the conservation requirements for this globally important population. Here we report on changes in annual nest counts over four decades, and further evaluate the contribution this data provides toward local and regional management requirements.
Materials and Methods
Study Area and Field Methods 2008–2016
Masirah Island lies off the eastern coast of mainland Oman (19∼20°N, 58∼59°E), and is the country’s largest island, spanning 95 km north to south and 14 km east to west at its widest point. The island’s population is approximately 16,000 inhabitants (National Centre for Statistics and Information [NCSI], 2019) with the population center at the northern end, Ras Hilf, where a Royal Air Force of Oman air base is situated. During the loggerhead nesting season, from May through to September, the climate on Masirah is influenced by the southwest monsoon known locally as the “khareef.” Upwelling of seawater can cause sea surface temperatures to lower to 16–17°C (Wilson, 2000), differing from an annual mean of 25.8°C (Sarma et al., 2013). Mean monthly air temperatures during this period range between 26 and 30°C, with mean relative humidity of 69–79% and mean windspeeds ranging between 5.7 and 8.8 m s–1 (World Meteorological Organization [WMO], 2020).
The nesting beach monitoring program, as revised in 2008, was adapted from Florida, United States loggerhead nesting index beach surveys as described by Witherington et al. (2009). The monitoring methods were modified for representative sampling of the nesting season and a sampling method comparable to historical surveys, so that resulting data would be comparable for developing long-term nesting trends. Studies of loggerheads on Wassaw Island, Georgia, United States (within the Northwest Atlantic RMU) revealed that annual counts for nests and females not corrected for imperfect detection can result in the over-estimation of abundance trends (Pfaller et al., 2013). As such, for Masirah, attempts were made to isolate potential temporal and spatial biases on estimates through survey design and more detailed analysis. The survey design also accounted for the effort of field staff, transport options to and along beach areas, and the influence of the summer monsoon on survey events.
Continuity was maintained through annual field training at the start of each season, the presence of scientific supervisors to provide advice during the monitoring period and quality control checks on data at the end of the season. Temporal consistency of survey effort was determined by standard protocols that define a 20-week fixed monitoring season between 1st May and 17th September each year. Principle daily track count data were collected from “Index Beaches” running along a continuous 23 km stretch of the north and north east coast of the Island (Figure 1). The survey design introduced in 2008 extended the coverage along this part of the Island over the original 9 km beach section monitored during historical surveys, although maintained the original 1 km-long beach zones used for spatial consistency in tallying of track counts across the rookery. Zones Km 0 (K0) to Km 22 (K22) were surveyed on a daily basis whilst surveys of non-index beaches were conducted weekly or bi-monthly on the remaining 60 km of loggerhead nesting habitat between zones K23 and K83 along the east and south coasts of the Island (Figure 1).
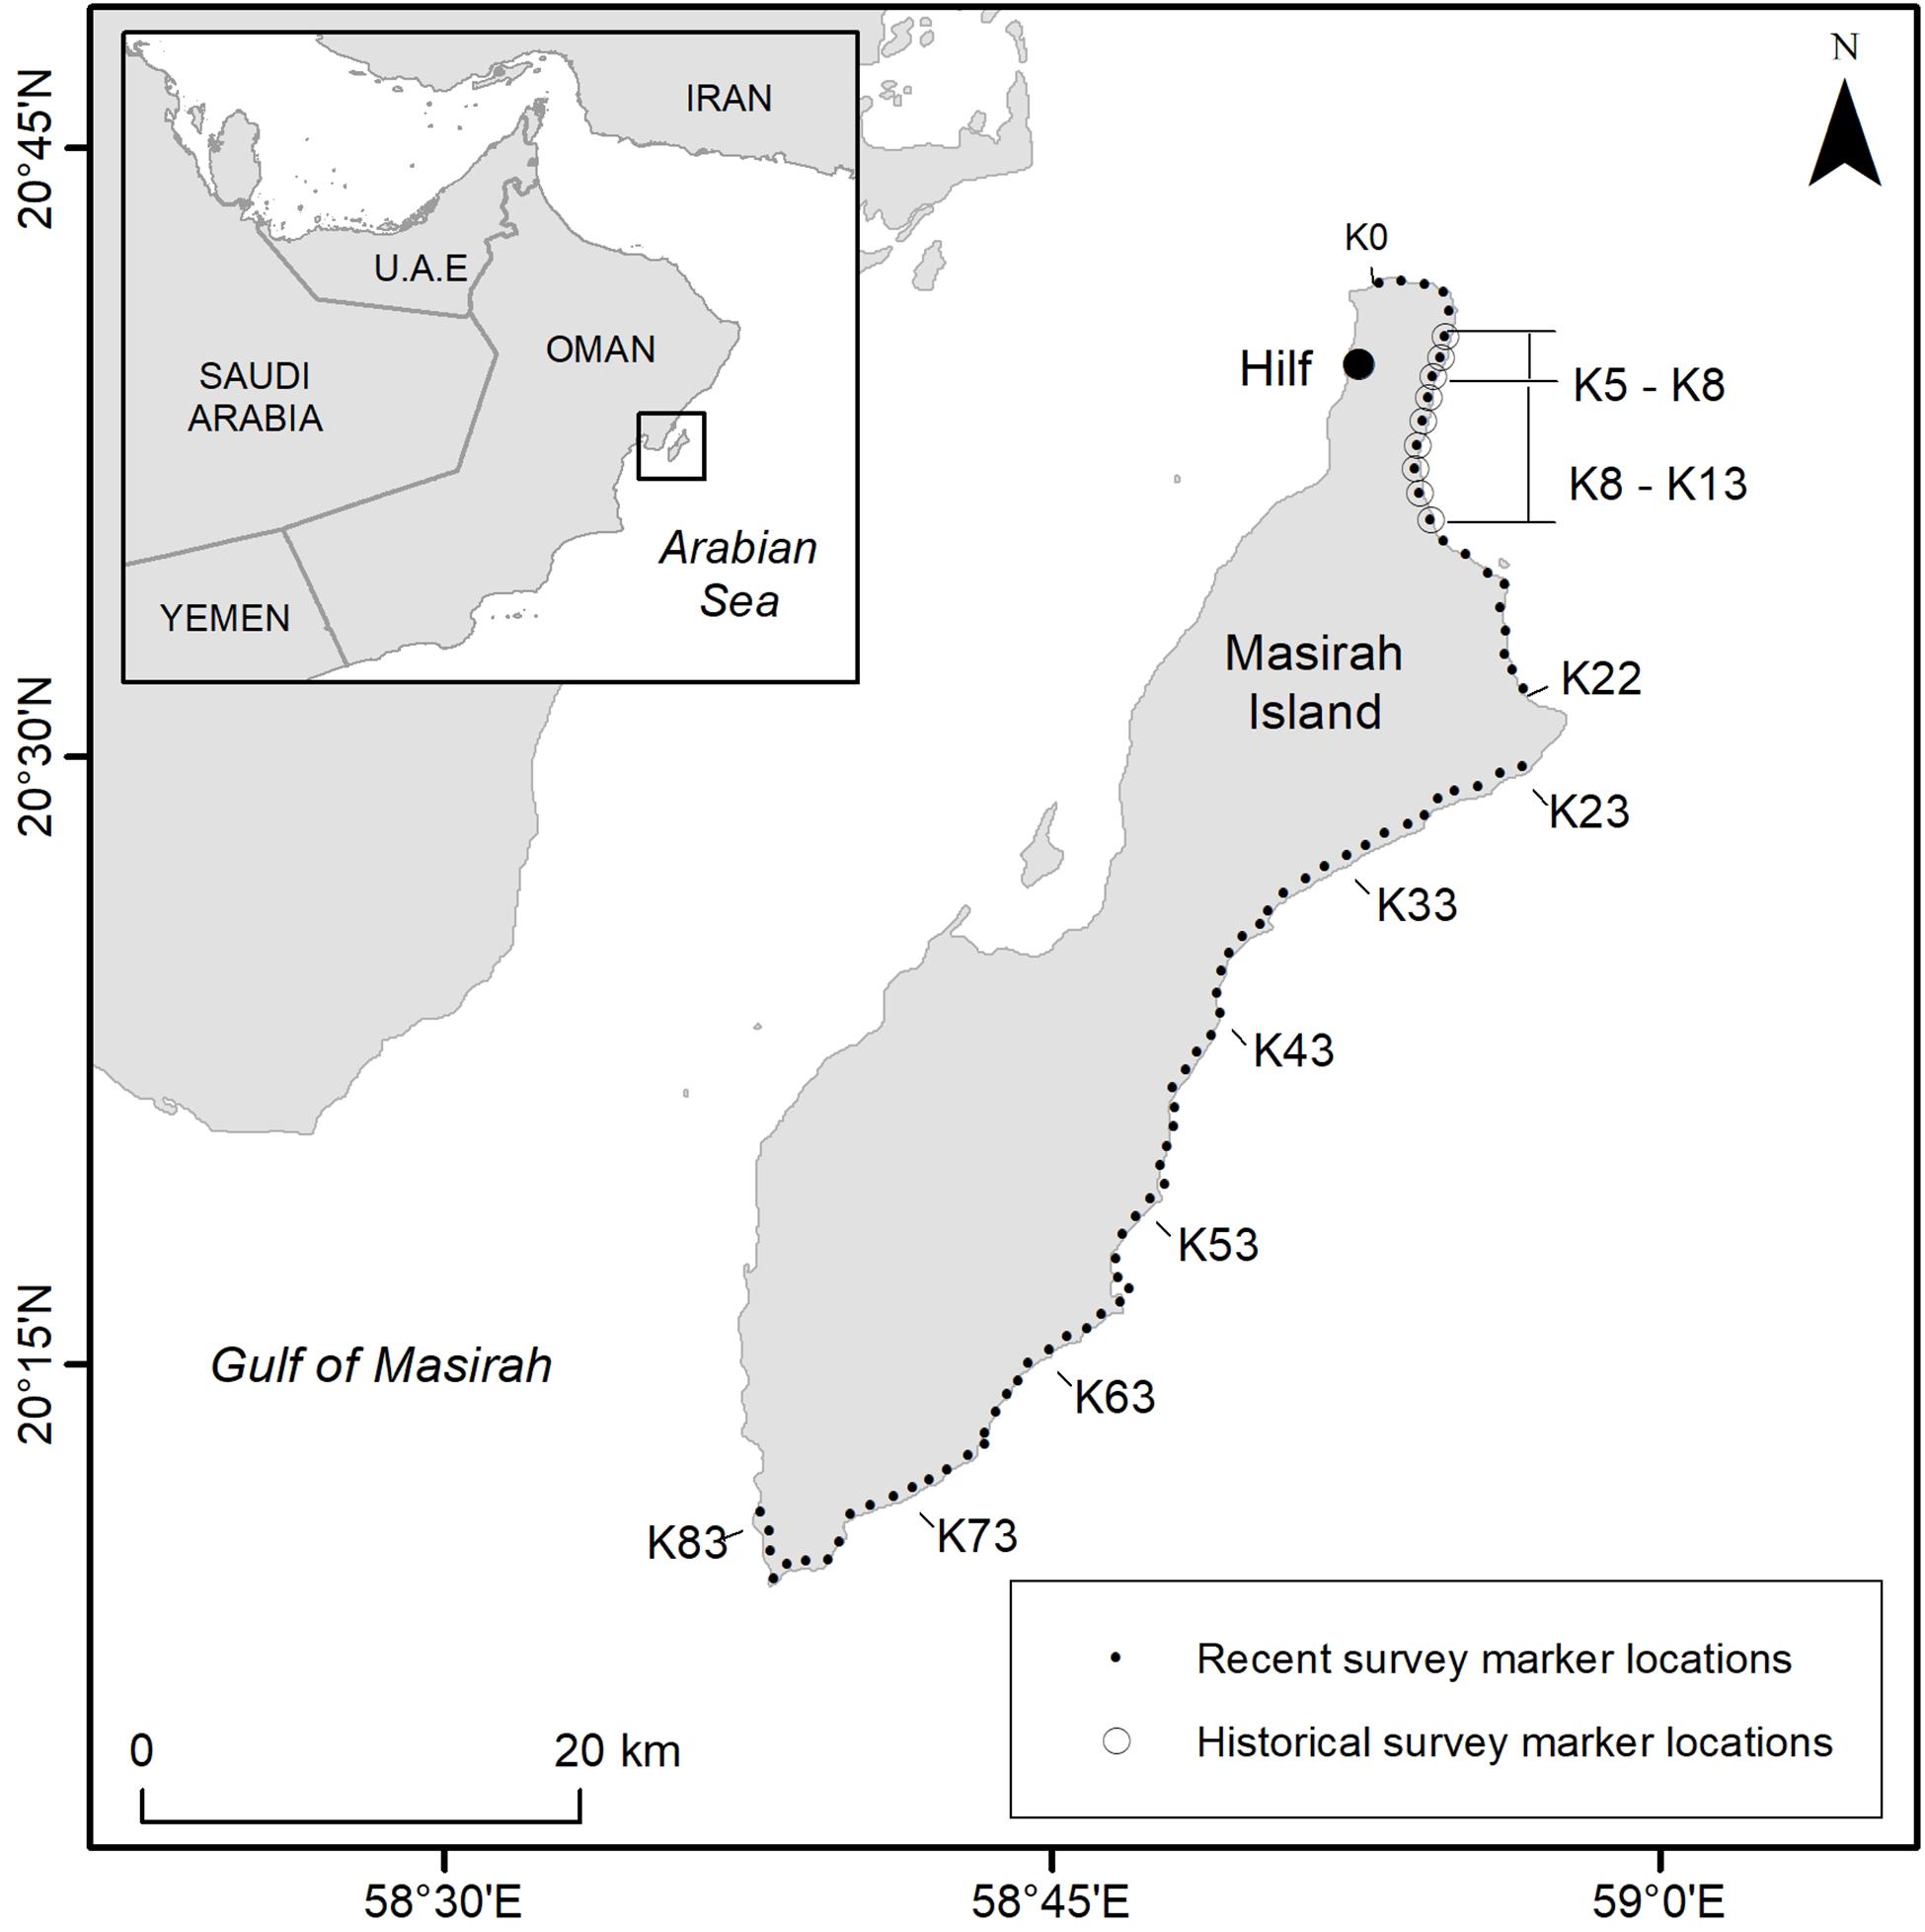
Figure 1. Loggerhead nesting beaches of Masirah Island represented by beach marker locations, situated approximately every kilometer along nesting habitat, (also known as “K” markers). Historical data collected between May and August was performed once per week between markers K5 and K13 (1977–1979), and up to five days per week (1985–1996). Daily counts were performed on K5–K8 (1977–1987). Recent surveys included daily surveys on index beaches between markers K0–K22 and up to once per week on non-index beaches between K23 and K83 (2008–2016). Location coordinates for nesting survey beach markers can be found in Supplementary Table S1.
All-Terrain Vehicles (ATVs) were used as the standard survey platform to enable consistent effort across large tracts of beach. As a general trend, during the nesting season, monsoon winds increase in strength from sunrise through to mid-afternoon, therefore surveys were mobilized prior to sunrise to minimize the influence of sand obscuring tracks left by nocturnal nesting turtles. Only tracks above the high-water mark were counted and all tracks were “marked” by the vehicle tire marks as a means of avoiding the recounting of tracks on successive days. All field staff were trained to determine whether an emergence resulted in a nest or was a non-nesting emergence by evaluating the imprints left in the sand by the turtles. Both morning track counts and night surveys were postponed in the event of windspeeds gusting above 40 km h–1.
Spatio-Temporal Variation in Nest Counts of Recent Data (2008–2016)
Daily nest counts for each kilometer of beach were pooled to provide for annual spatial analysis and seasonal temporal analysis of counts across years, whilst accounting for survey effort. Mean nesting densities (nests km–1 day–1) were calculated for index beaches (K0–K22), non-index beaches (K23–K83), and the entire rookery (K0–K83) by dividing the absolute counts for each kilometer by the survey effort (km–1 day–1). For analysis of daily seasonal trends of nesting densities on index beaches across all years, calendar dates were converted to ordinal dates.
The estimated number of nests per year (nests year–1) for the island was derived by separately calculating the mean number of nests per day for index and non-index beaches and multiplying this by the number of total days in the survey season (N = 140). The survey design dictated non-index beaches were monitored with less frequency (weekly or bi-weekly) and also accounted for a larger beach area. Therefore, confidence intervals and the dominance of non-index beaches have the potential to disproportionately skew estimates of more robust index beach season totals. Expected changes to effort on non-index beaches also have the potential to impact estimates based on effort ratio differences between beach areas. Additional bias generated by inconsistent monitoring throughout the seasons was addressed through preliminary screening of survey effort and resulted in the elimination of 2008 and 2009 non-index beach data. Our method recognizes that the purpose of the “all-island annual estimates” is to provide an indicative range of nest counts over the complete study period and identify shifts in nesting distribution. These results are not considered a robust approach for inter-annual trend analysis.
Trend Analysis of Historic and Recent Track Count Survey Data
Track counts from historical data were digitized from original field records collected by experienced personnel, as described by Ross and Barwani (1982). Between 1977 and 1996 counts of turtle emergences within predefined beach zones were made by following a simple track count technique that included tracks from both the successful and unsuccessful nesting emergences). For recent data (2008–2016) comparable total track counts were derived from the tallies of successful, unsuccessful, and undetermined nesting activities. All tracks were counted above the high-water line, however, spatial and temporal data resolutions differed in survey methods across years. To verify spatial overlap between location reference points used in different data series, the original historical map records from surveys were aligned with locations of recent beach count reference points from the 2008 to 2016 dataset as determined by GPS and satellite photo imagery (Google Earth Pro, 2016). Here we refer to historical beaches “3km Surf Beach” and “9km Beach” with the more recent reference system of K5–K8 and as K5–K13, respectively. These beaches coincide with recent surveys between K0 and K22 (Figure 1). Historical data collected between K5 and K13 were available in the form of weekly averages (based on daily track counts), with those averages assigned to the date at the beginning of each week. For inter-annual temporal alignment of data, ordinal dates were assigned to the historical datasets.
Throughout the historical data series, nesting beach surveys were completed between the beginning of May and the end of August in each year. The track count surveys between K5 and K13 were performed once per week between 1977 and 1979 and as often as 5 days per week between 1985 and 1996. Daily counts were achieved on 3 km of beach (K5–K8) between 1977 and 1987. To describe the trends, data were processed to provide a common metric of average track counts per day across K5–K13 beaches for a 120-day period starting at the beginning of May. For graphical presentation purposes, data collected between K5 and K8 from all surveys for all years, were plotted. Track counts conducted only between K5 and K8 between 1977 and 1987 were extrapolated out to cover 9 km of beach for graphical comparison only, and not included in statistical tests.
Data of the same temporal and spatial resolution were pooled into the data series to make cross comparisons of annual track count averages and compare percent change in counts between the periods for all datasets collected between K5 and K13, and separately between K5 and K8 for data belonging to survey periods between 1977–1986 and 2008–2016. Statistical testing of the hypothesis to determine strength of the decline and calculation of percentage differences from track counts between years was only performed on the data series with common time periods and extents of beach area surveyed. These were: (a) K5–K13 from 1985–1996 and 2008–2016 and (b) K5–K8 from 1977–1979 and 2008–2016. Welch’s t-test was selected based on the presence of unequal variance and sample size. For graphical presentation and comparison, the mean number of tracks per day for the 9 km of beach for each year was plotted by modifying the order of a polynomial regression curve until best fit was achieved. Although the trend was not considered to be linear, R-values were calculated to determine the strength of the relationship between the beginning and end points of the data.
Key concerns about potential inconsistencies in the datasets that may have resulted in false trend results and biases were also investigated. The assumption of a shift in the sampling effort between ordinal dates was evaluated by plotting ordinal dates of surveys for each year in the study (including historical data) and fitting a linear trend line and assigning an R-value. There was concern that there could be unknown natural or anthropogenic influences on the variation in the nesting trend caused by the number of nesting attempts that turtles would make to achieve successful nesting. This could only be tested in the recent data (2008–2016) which were fitted with a linear trend line allowing for generation of an R-value to determine the strength of the relationship.
Results
Effort and Estimated Season Nesting Totals 2008–2016
An annual mean of 3117 km (SD = ±227) of ATV beach survey effort was achieved between 2008 and 2016 (Table 1 and Figure 2). Effort on non-index beaches in 2008 and 2009 remained below 350 km season–1 (equivalent to less than 6 days of survey) although this increased to above 1000 km in 2013, representing almost a third of the survey effort in that year. Overall, 72% of effort was applied to index beaches (SD = 10). Across the island, survey effort between 2008 and 2016 resulted in successful nest counts of between 33,536 in 2009 and 10,776 in 2015. Index beach nest counts ranged from 32,891 in 2008 to 8629 in 2016.
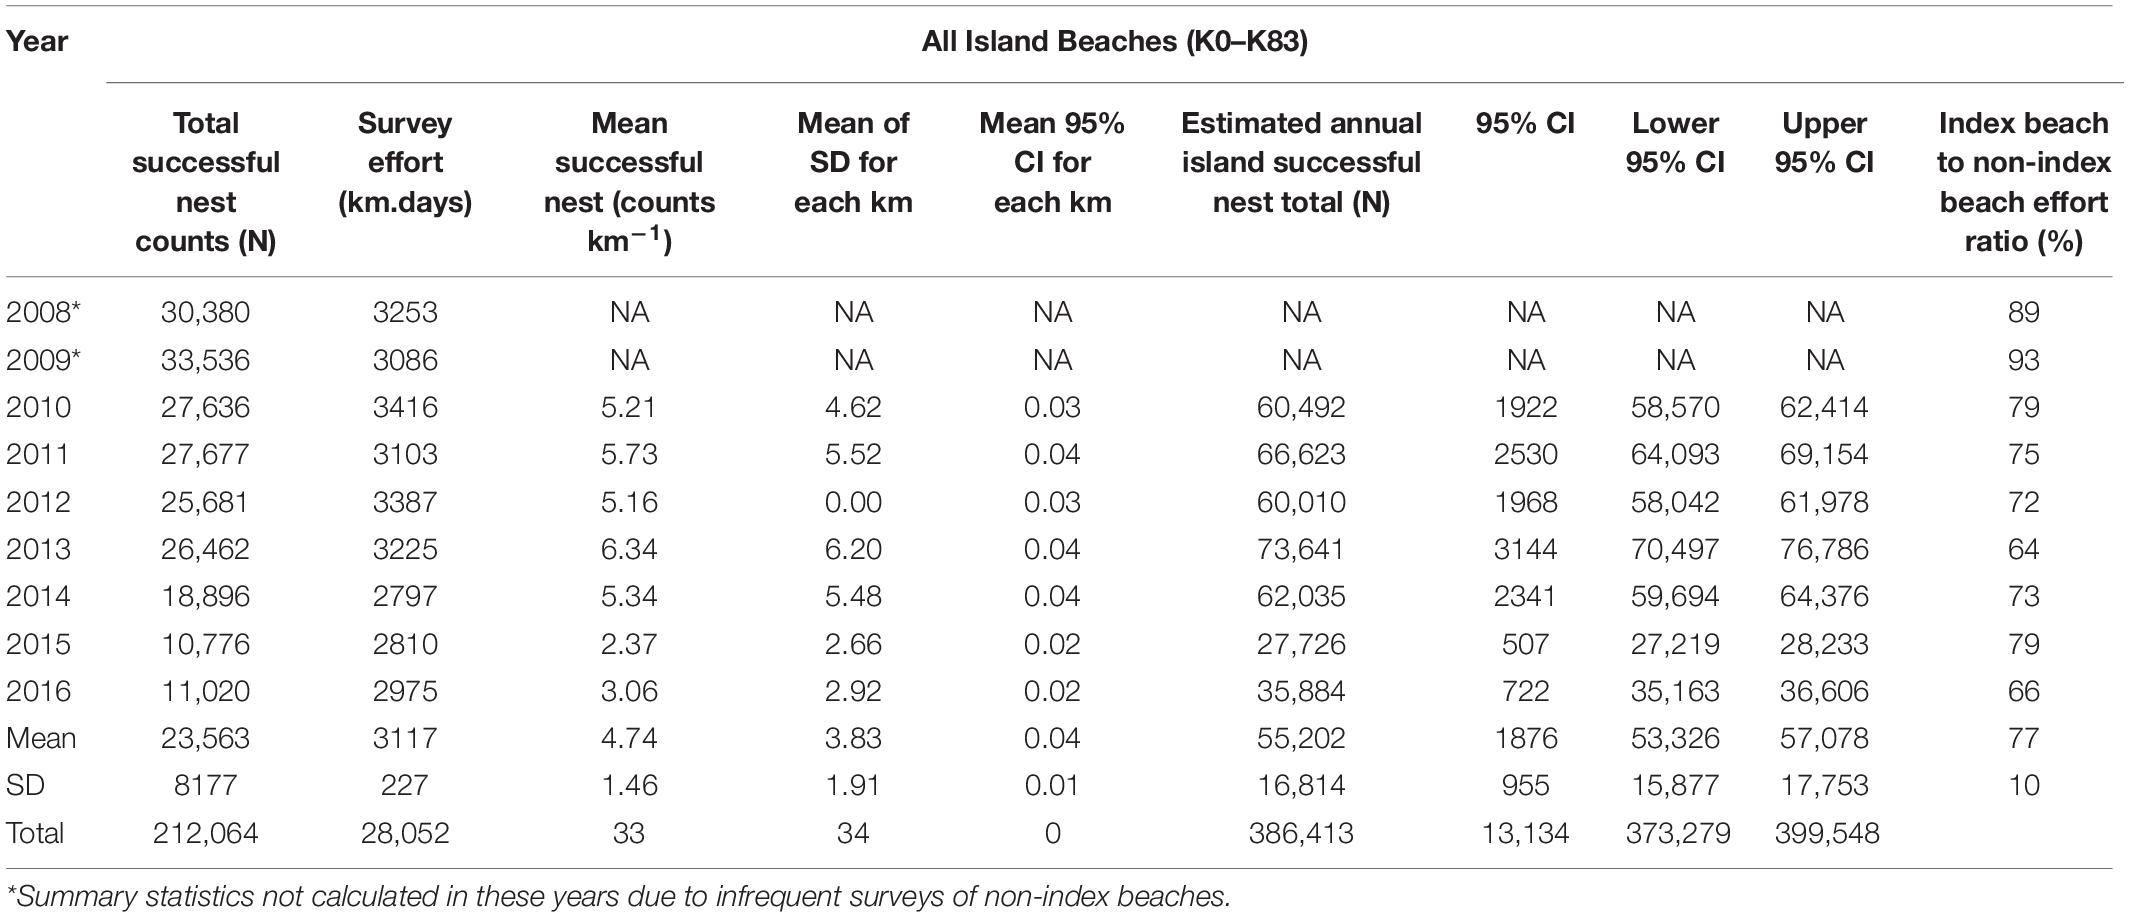
Table 1. Nest count summary statistics across all nest survey beaches derived from index and non-index beaches.
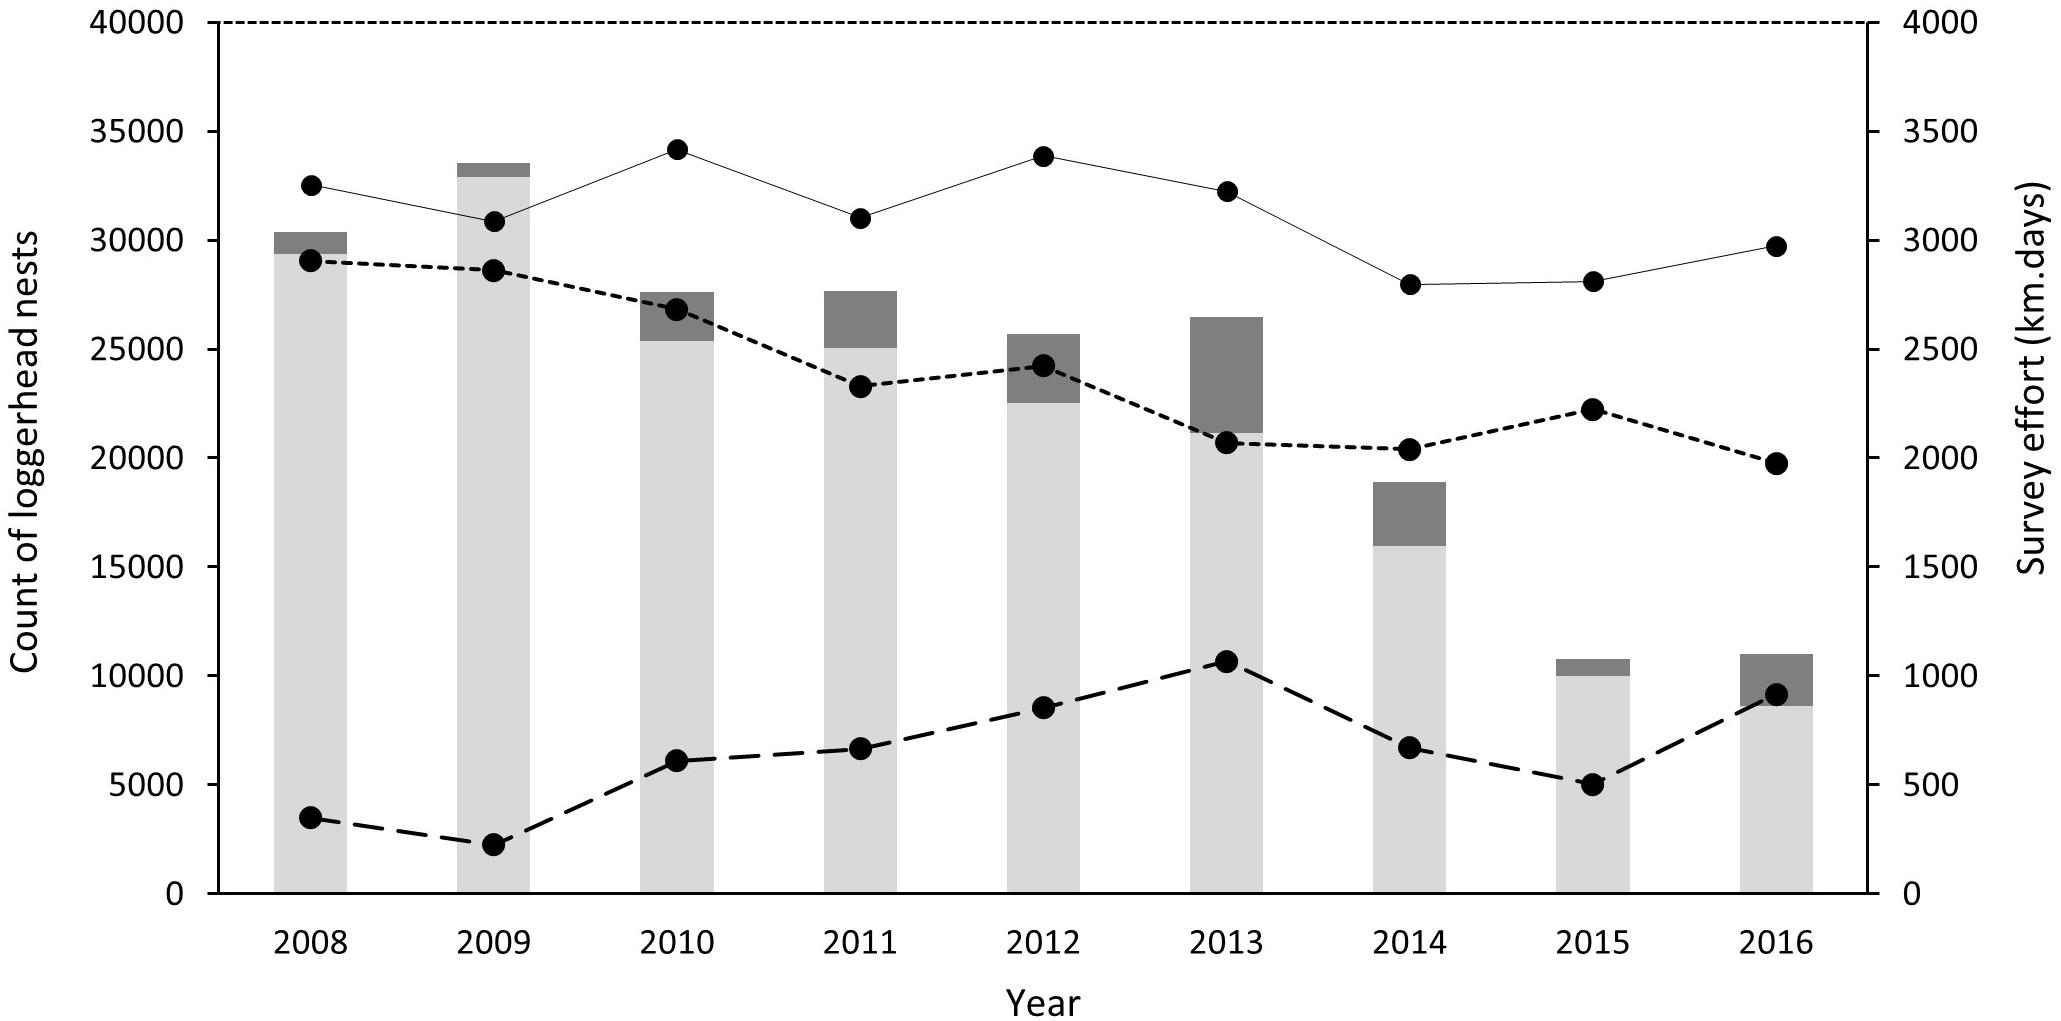
Figure 2. Annual loggerhead nest counts and survey effort of index and non-index beaches on Masirah (2008–2016). Light gray bars represent total annual counts of nests on index beaches and dark gray total annual counts of nests on non-index beaches. Points associated with the continuous line represents the annual survey effort for all beaches, the short-dashed line represents survey effort associated with index beaches and the long dashed line the survey effort of non-index beaches (km days).
Corrected for effort, the mean nests kilometer–1 day–1 over a season for index beaches ranges from 11.54 (SD = ±6.02) in 2009 to 4.41 (SD = ±2.66) by 2016 (Table 2 and Figure 3). Due to the inconsistency of sampling across the season and low number of surveys, non-index beach estimates are excluded for 2008 and 2009. Between 2010 and 2016, the estimates range between 4.94 (SD = ±5.78) nests km–1 in 2009 and 1.55 (SD = ±2.04) nests km–1 in 2015.
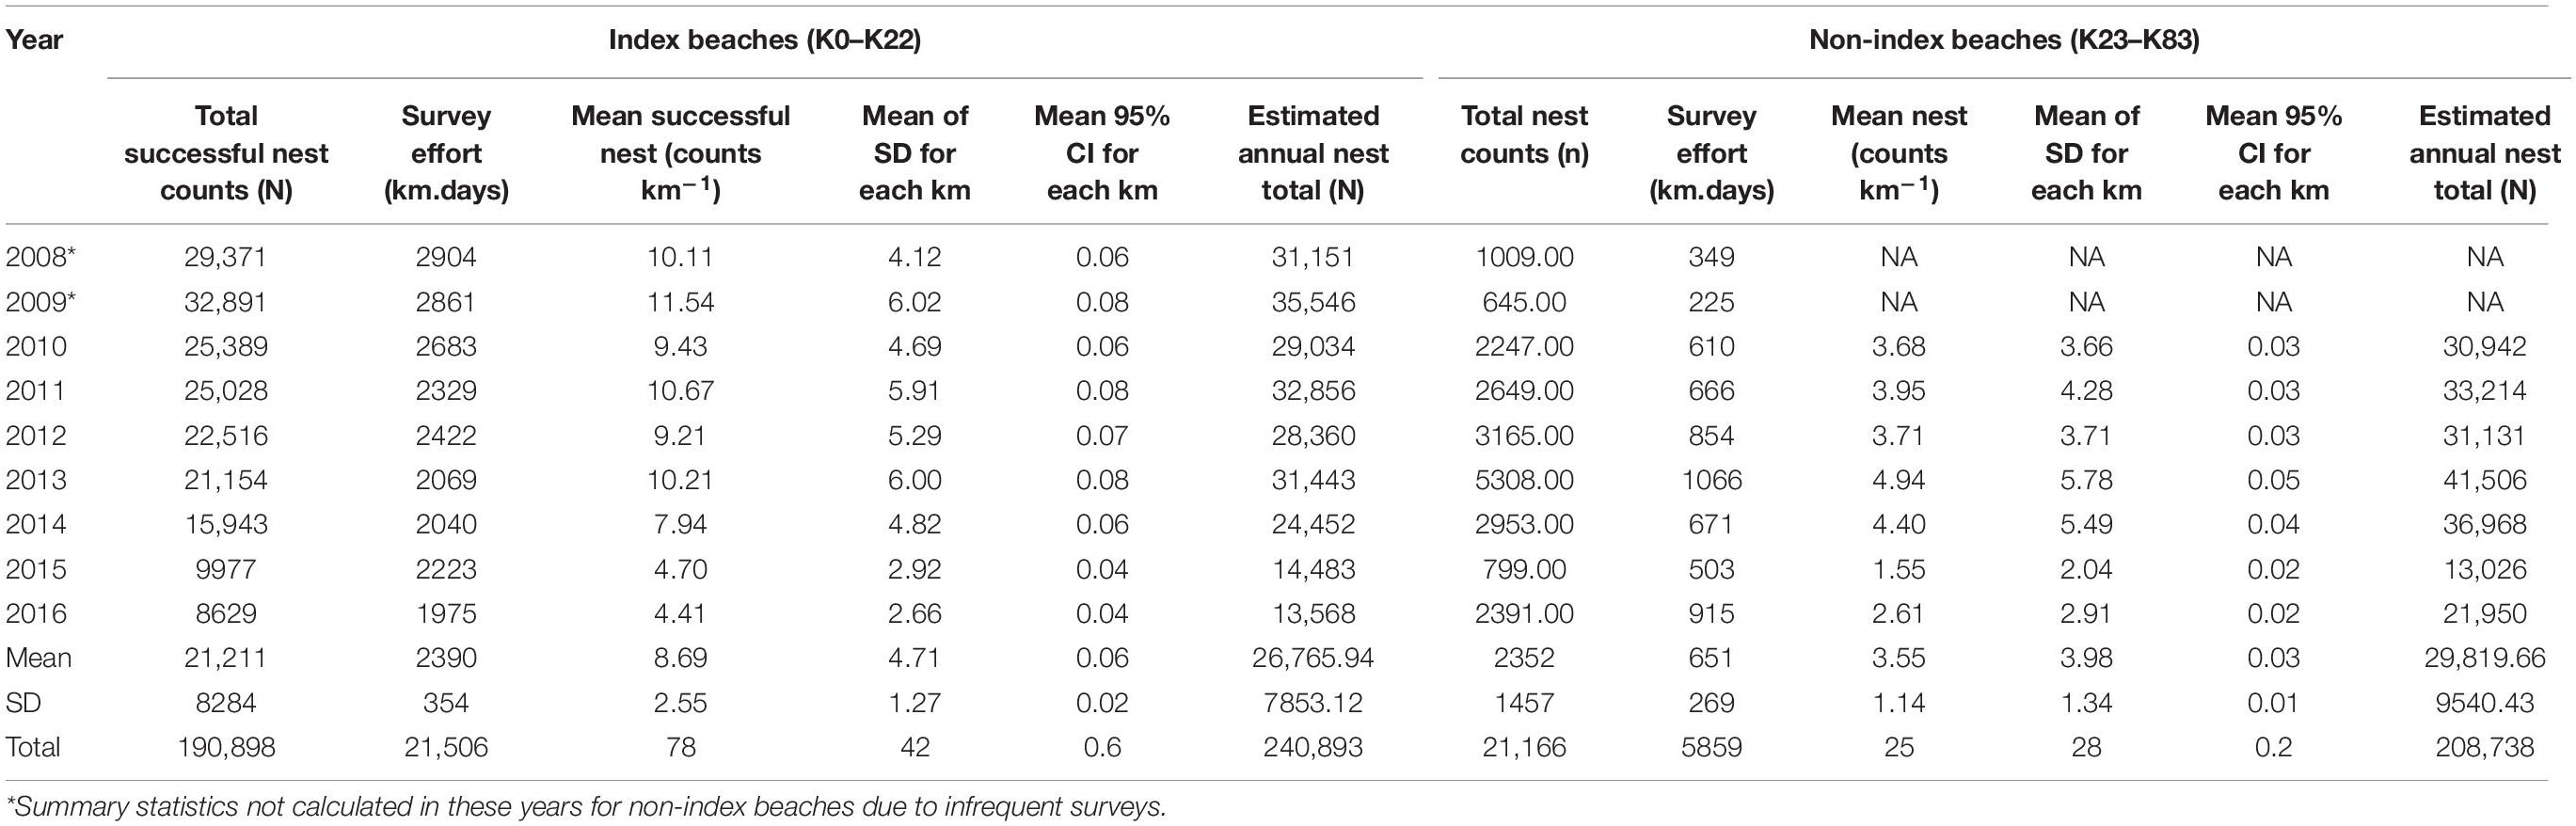
Table 2. Nest count summary statistics reported separately for index and non-index beaches.
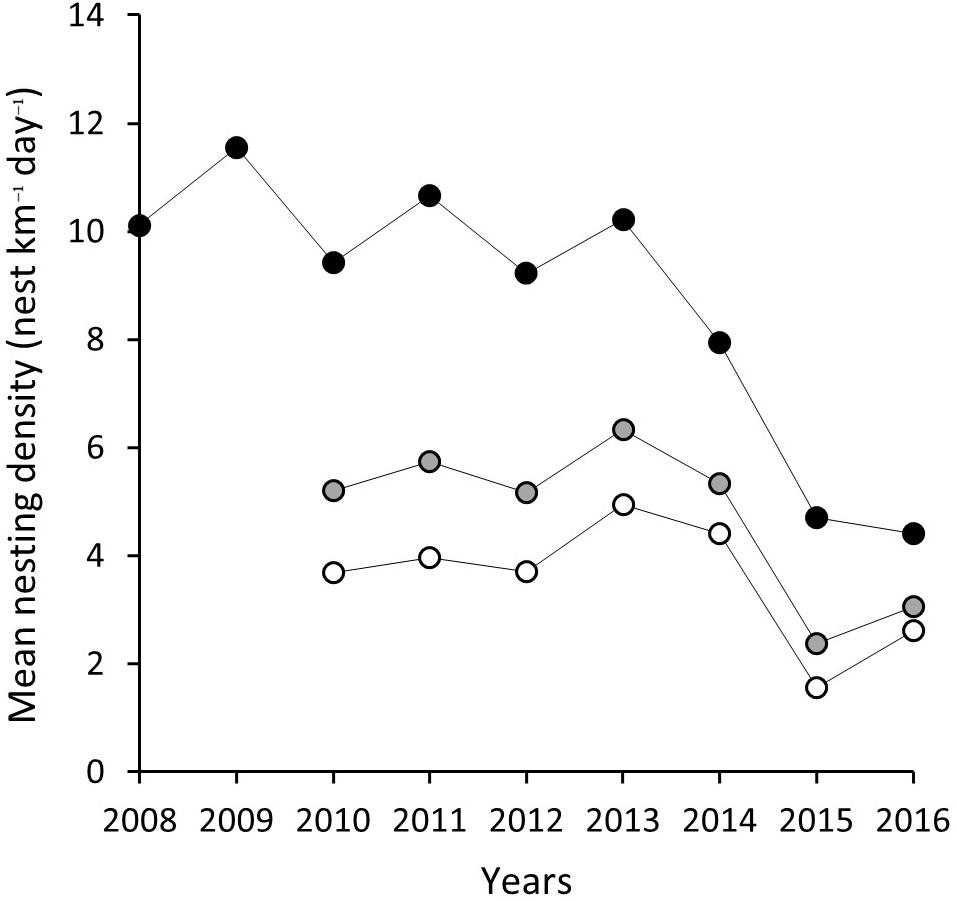
Figure 3. Mean nesting density (nests km–1 day–1) for index beaches (K0–K22) gray filled circle, non-index beaches (K23–K83) white filled circle and combined for all island black filled circle.
Correction to produce totals for the 140-day season results in a maximum estimate of 35,546 nests for index beaches in 2009 and a minimum of 13,568 in 2016, with a mean of 26,765 (SD = 7853) across all study years (Figure 4). For non-index beaches, the calculations provide estimates of 41,056 and 13,026 (CI 95%) for the same years. Together, index and non-index beaches generate mean estimates ranging from 73,641 in 2013 (CI 95% SD = ±3144) to 27,726 in 2015 (CI 95% SD = ±507) (Table 1). In consideration of the reliability and consistency of data for identification of robust trend metrics, it is worth highlighting the percentage differences in standard deviations related to the mean of nest counts for index beaches in comparison to non-index beaches across all years; for index beaches the standard deviation is 54% of the mean nesting density of 8.69 nests day–1 km–1 (mean of SD within all years = 4.71), whereas for non-index beaches the standard deviation is 98% of the mean nesting density of 3.55 nests km–1 day–1 (mean of SD within all years = 3.48). The percent of undetermined nesting attempts in relation to the total track count accounts for measurement error related to nesting success interpretation and ranges between 3.9% (N = 1190) and 0.9 (N = 409) with an average across years of 2.5% (SD = 0.9) (Table 3).
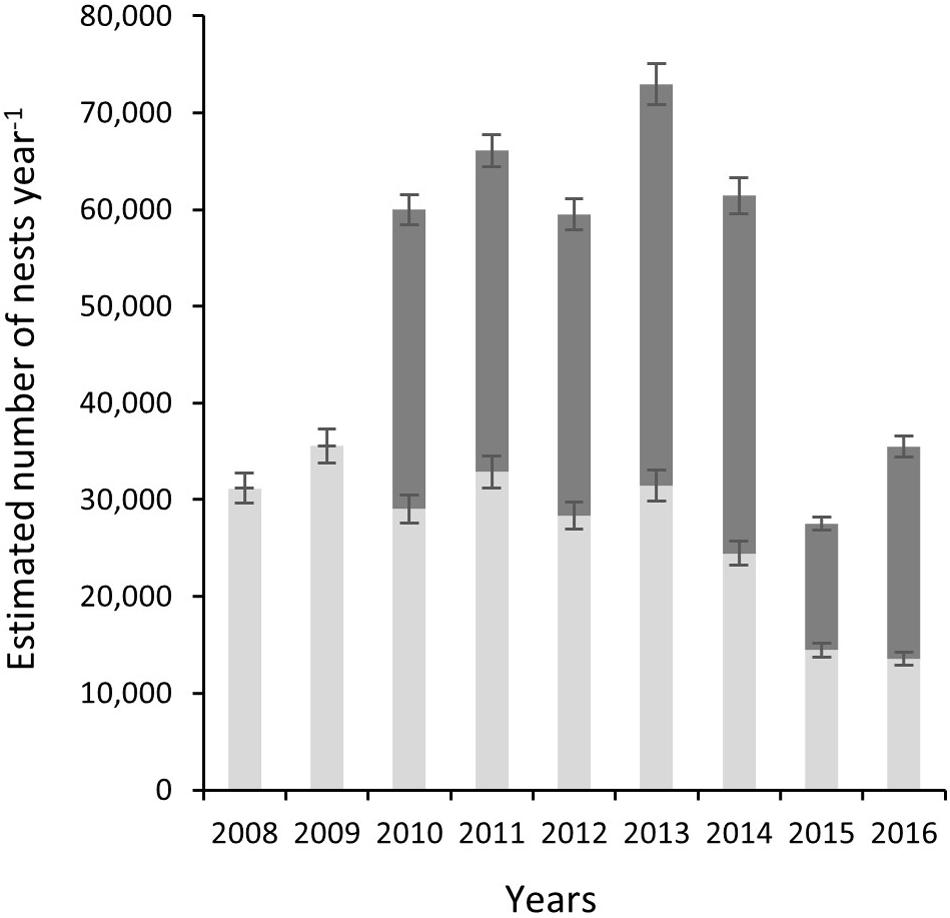
Figure 4. Estimated number of nests per year (nests year–1) for index beaches (K0–K22) as gray bars and non-index beaches (K23–K83) dark gray bars. Stacked results show total estimate for the rookery.
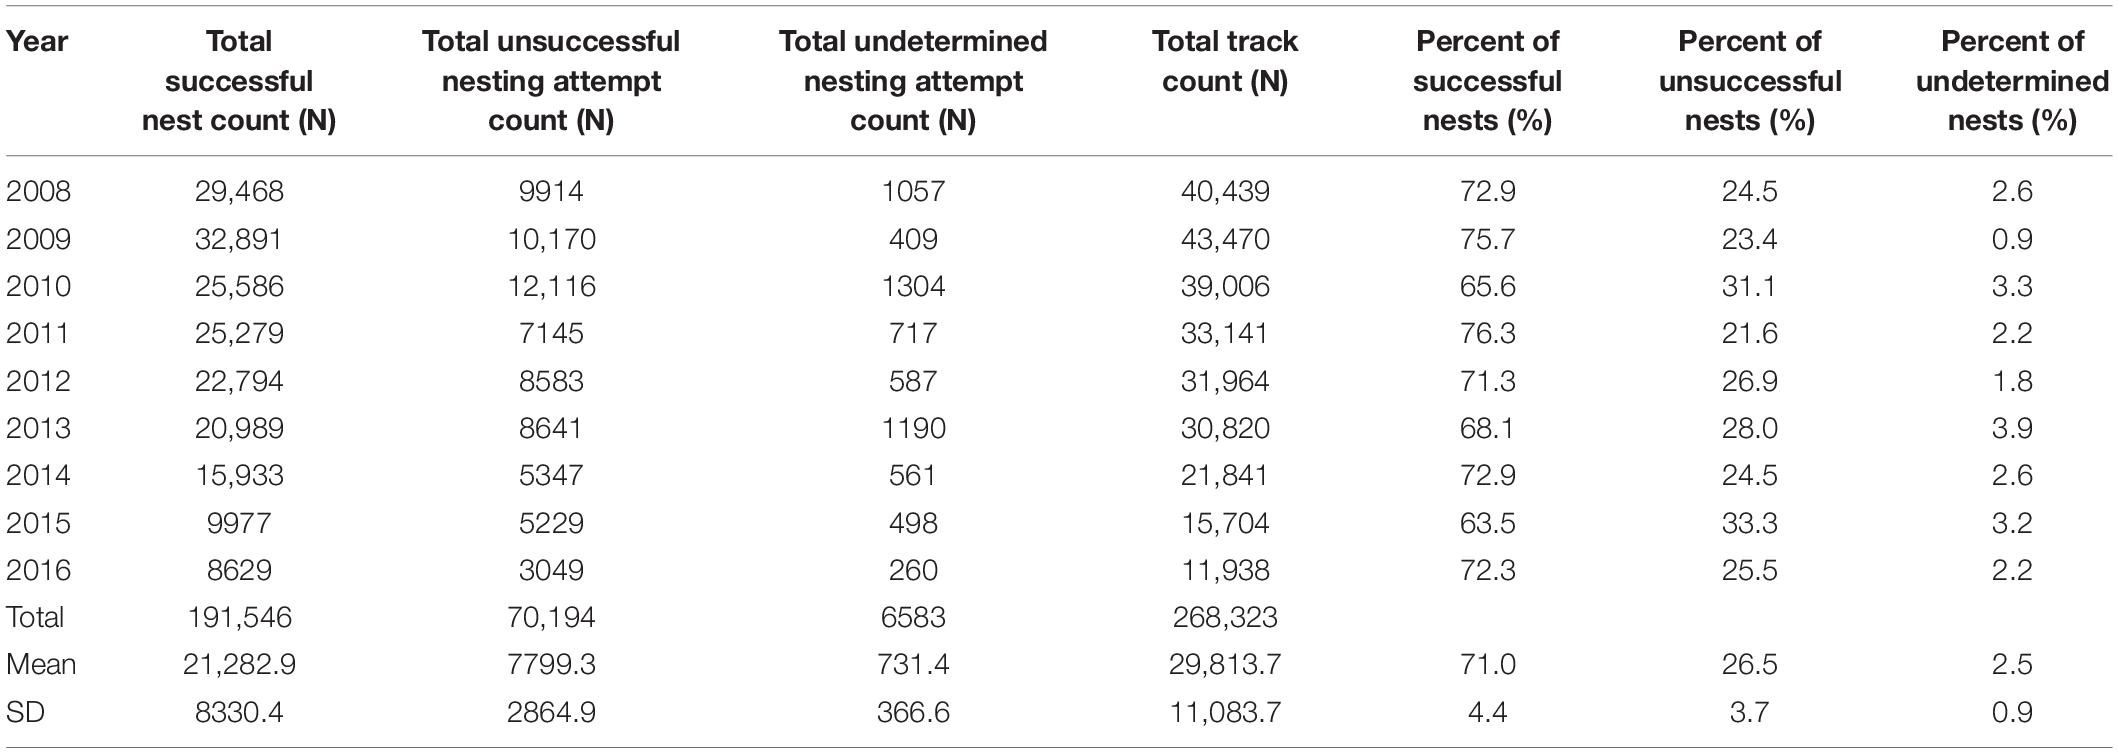
Table 3. Summary of nesting success surveys for K0–K22 for 2008–2016, including ratios of successful, unsuccessful, and undetermined nests in comparison to the track count total.
Spatio-Temporal Variation in Nest Counts 2008–2016
Mean nesting densities across the surveyed rookery area for datasets from 2008–2016 range from 0.8 (SD = ±0.44) to over 19.3 (SD = ±9.48) nests km–1 during the survey season (Figure 5). The spatial distribution of nesting density is contiguous with the great majority of nesting occurring toward the north of the island, with 49% of index beaches showing a density of 8.69 nests km–1 season–1 over the entire study period (SD = ±2.55). Although densities are also relatively high between K23 and K25 and K73–K75 (with seasonal means above 8 nests km–1 day–1) overall the nesting densities along the non-index beaches remain below a mean of 4.74 (SD = ±1.46).
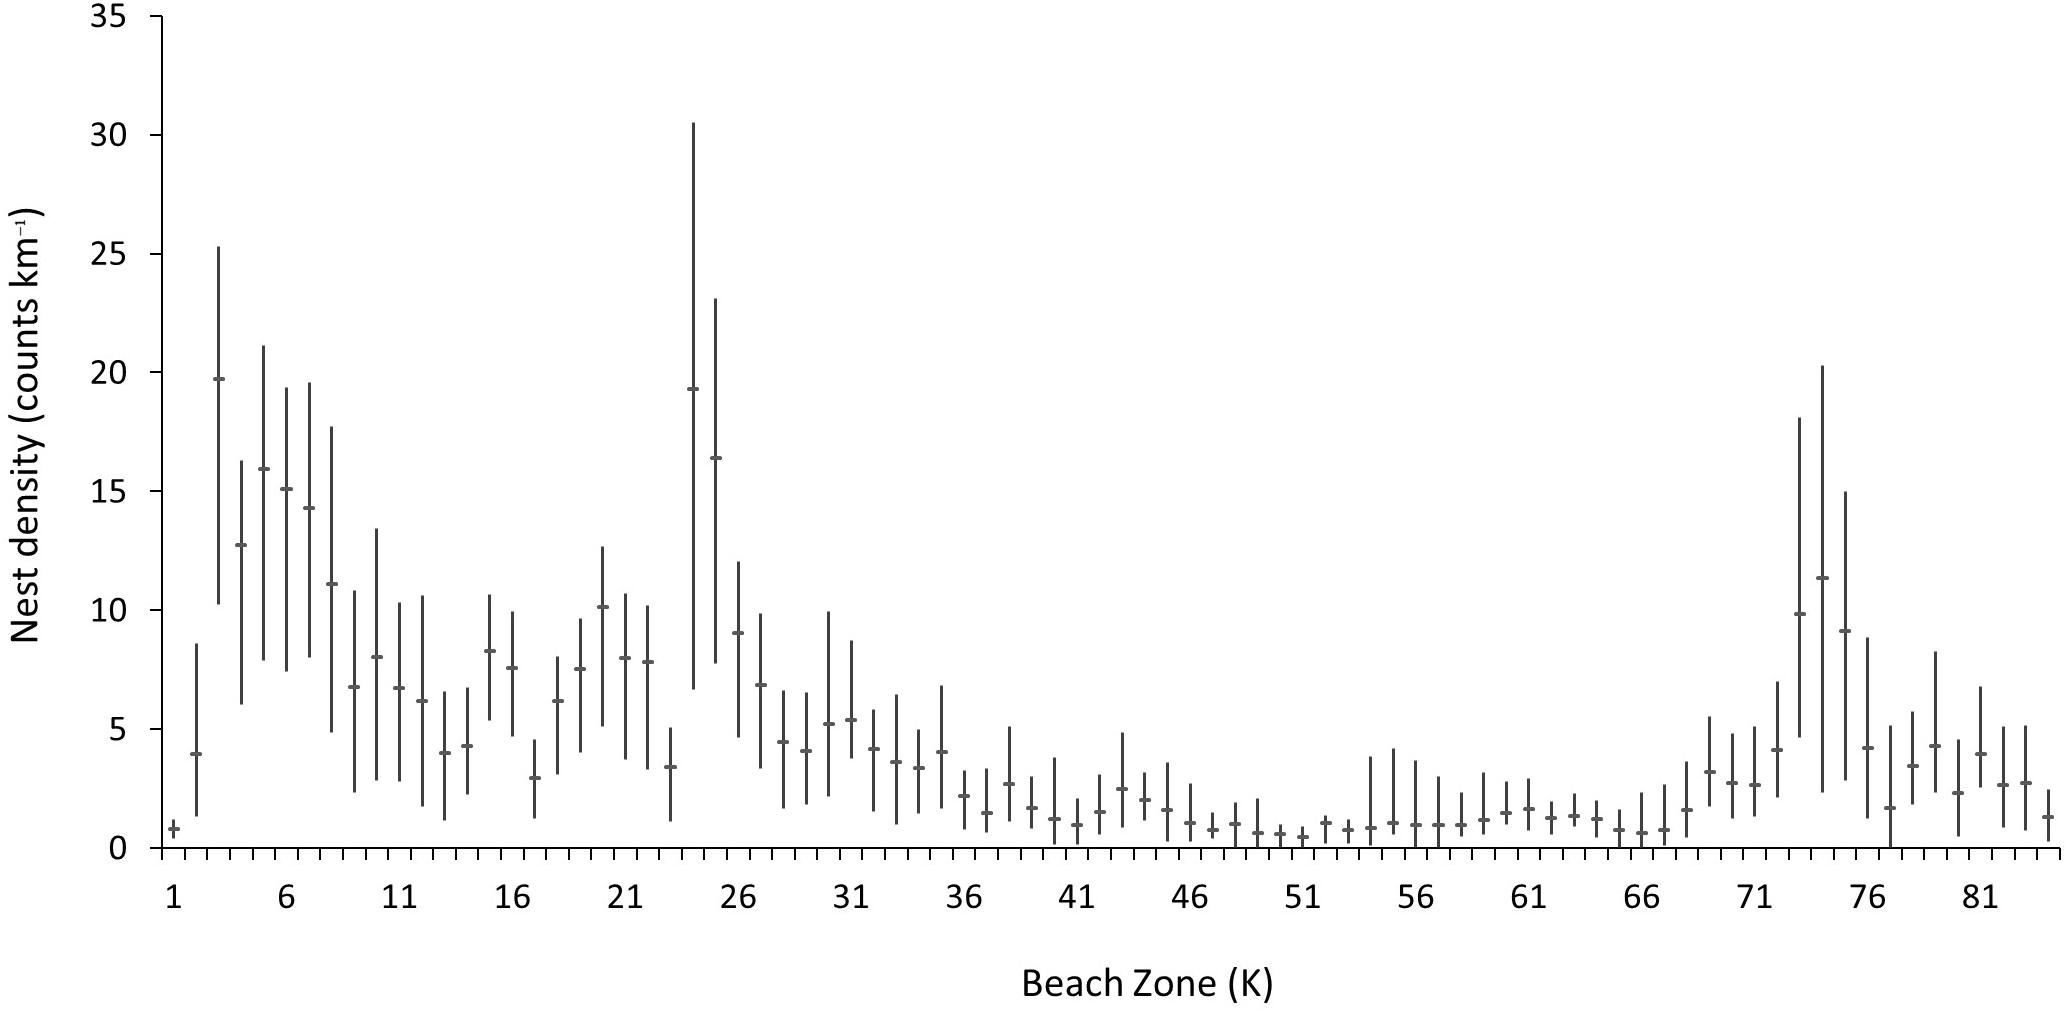
Figure 5. Mean nest counts per kilometer (horizontal bar) and minimum and maximum annual means (vertical bar) for all survey beaches on Masirah (2008–2016).
Standard deviation of nesting density on index beaches across all years can be as much as 50% of the mean. However the nesting densities in each kilometer section, also referred to as longshore variation, remains proportionally consistent between years to the overall count for a given year. Figure 6 shows the longshore annual mean nesting density plots from index beaches that demonstrate this consistency across years. There are exceptions within this trend, including the density peak of K2 being much less pronounced in 2015 and 2016 surveys.
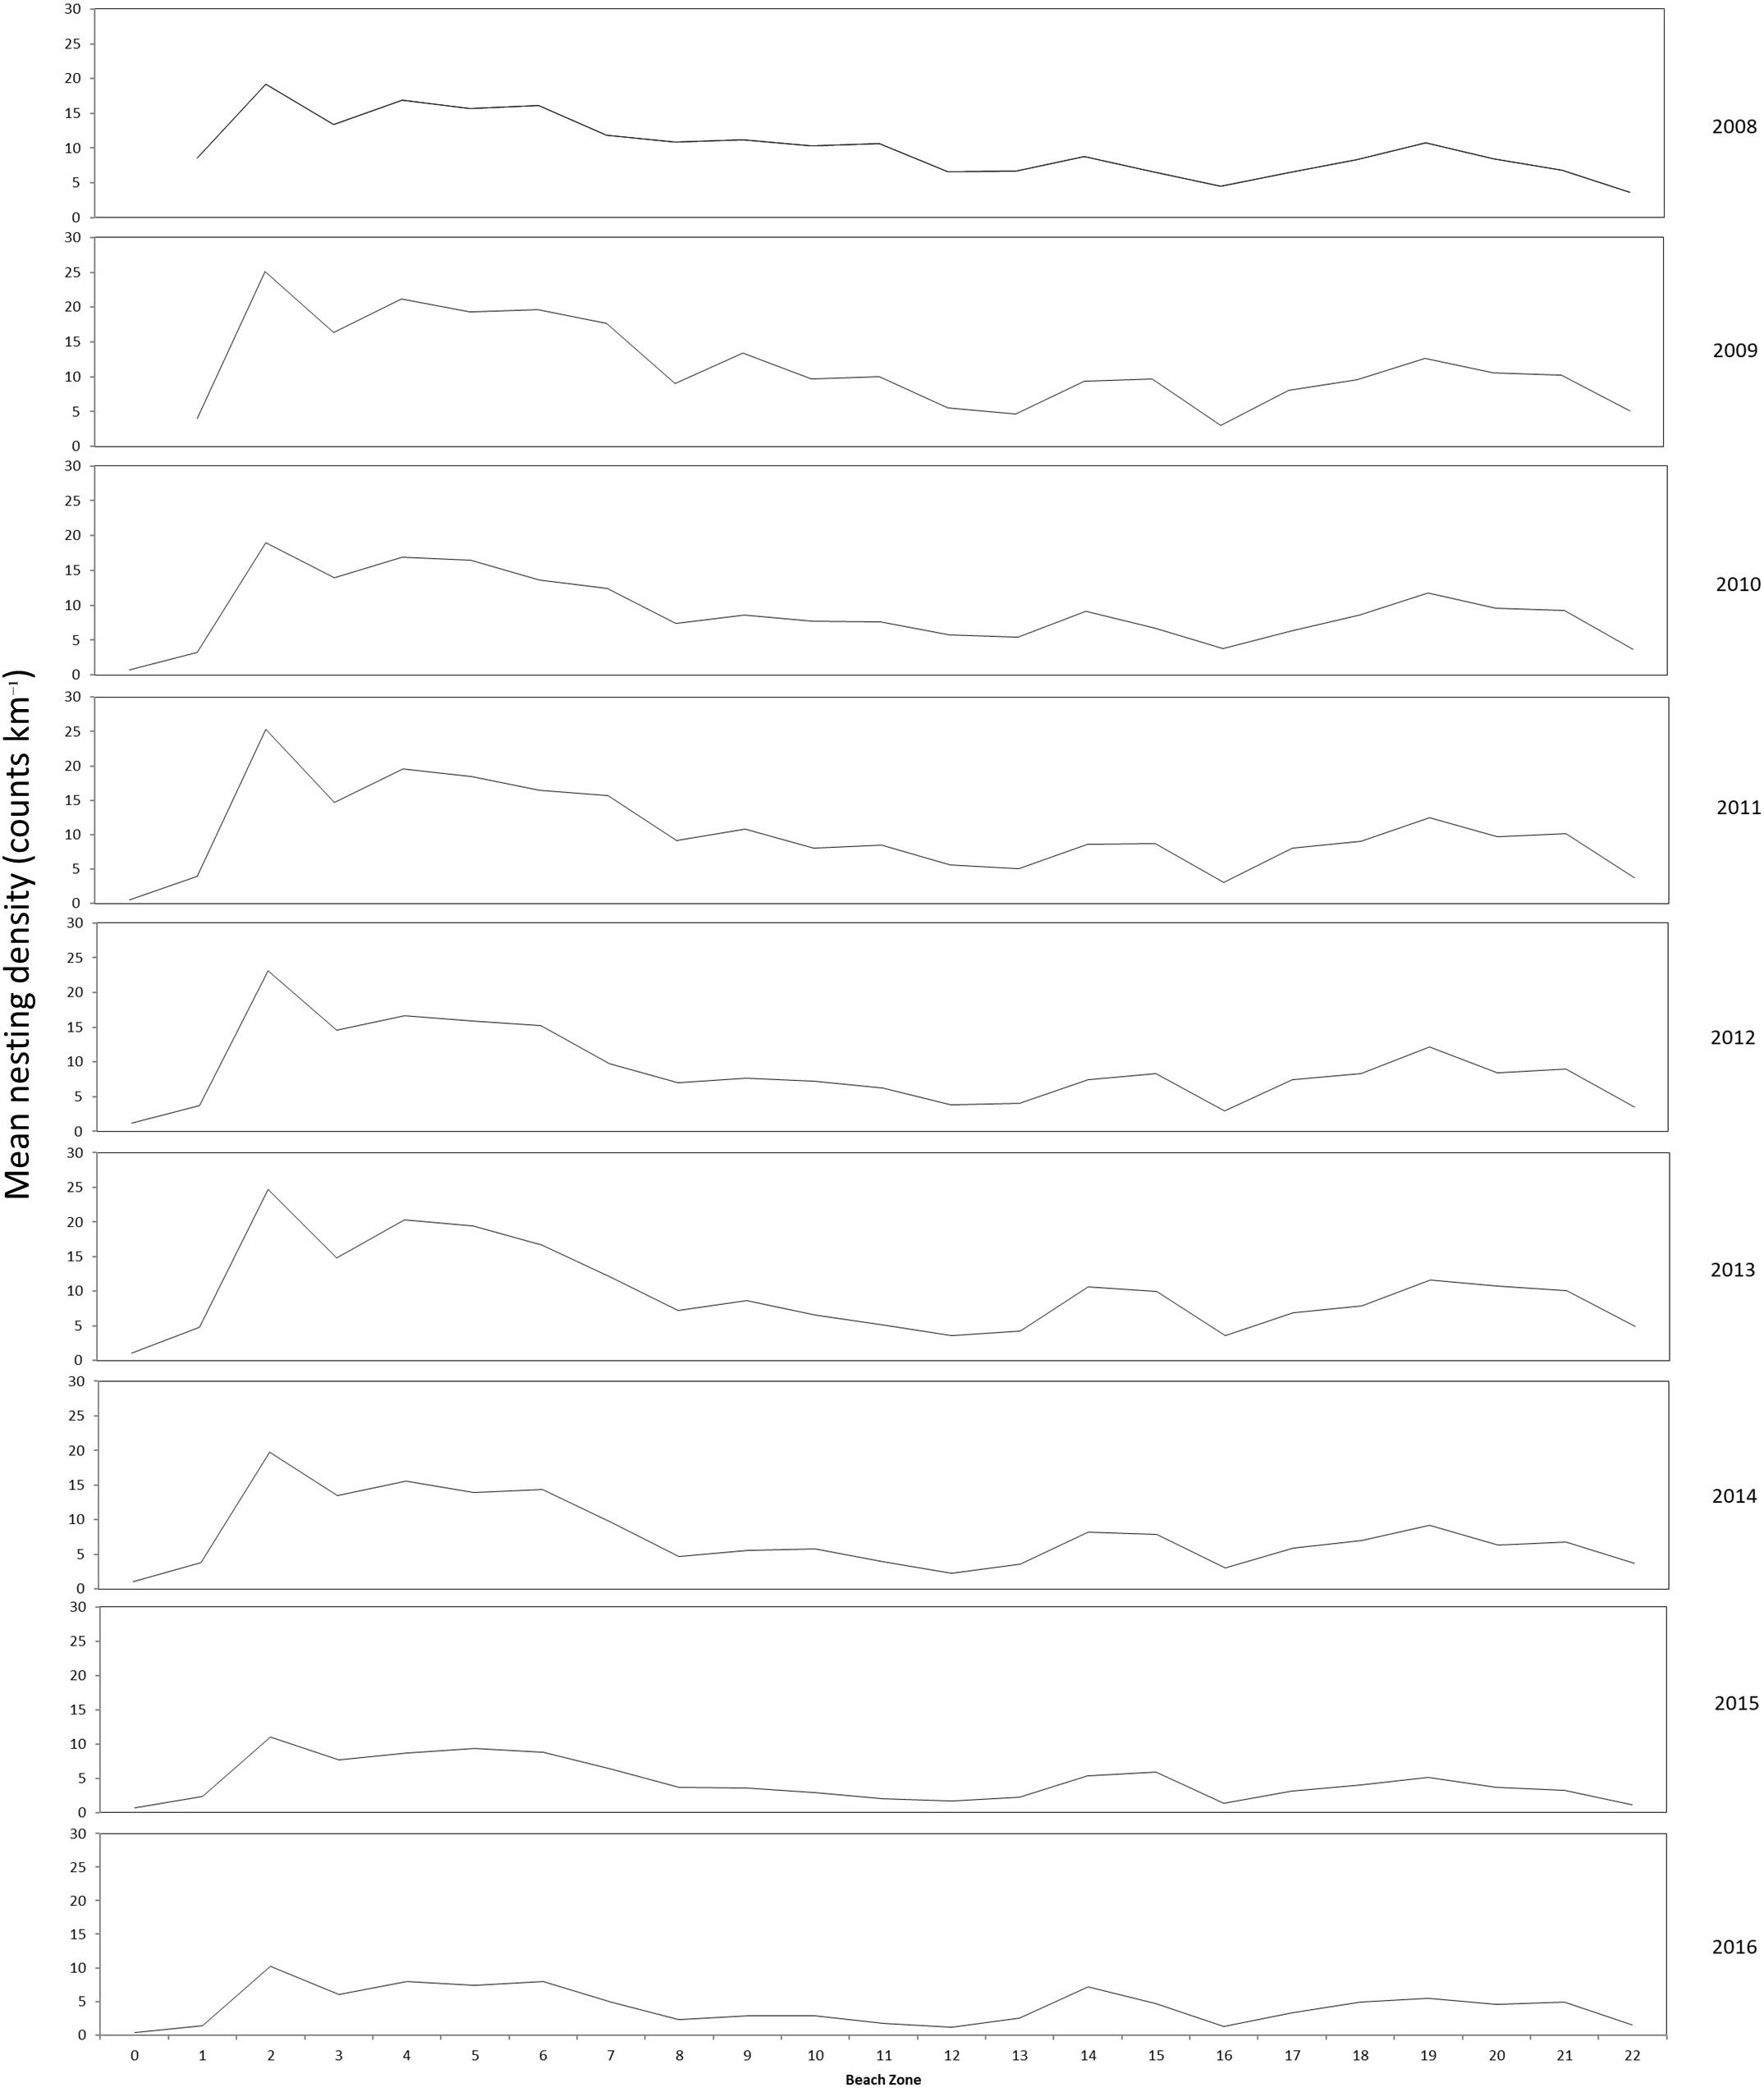
Figure 6. Longshore distribution of annual mean nesting density of index beaches (K0–K22) for marked beach sections surveyed between 2008 and 2016.
The seasonal plot, with daily nesting densities between different years, aligned according to ordinal dates (Figure 7), shows that the nesting season begins just prior to the start of the survey, given the average index beach nesting density over the eight year study period of 3.8 (SD = ±2.67) on the survey start date of 1st May (ordinal date 122). A 6th order polynomial regression curve best fits the daily nesting density averaged from ordinal dates, and shows a trend of steadily increasing density toward day 163 with 18.3 nests km–1 (SD = ± 9.69) and, thereafter, a gradual decline to 0.27 nests km–1 (SD = ±0.14) by the end of the survey season (day 261 or 17th September). The scatterplot shows that the two maximum daily records for nesting density from index beaches in any year was 37.6 and 33.6 nests–1 km–1 (2008), although these could be interpreted as outliers given densities from all other years remain below 26.3 nests km–1.
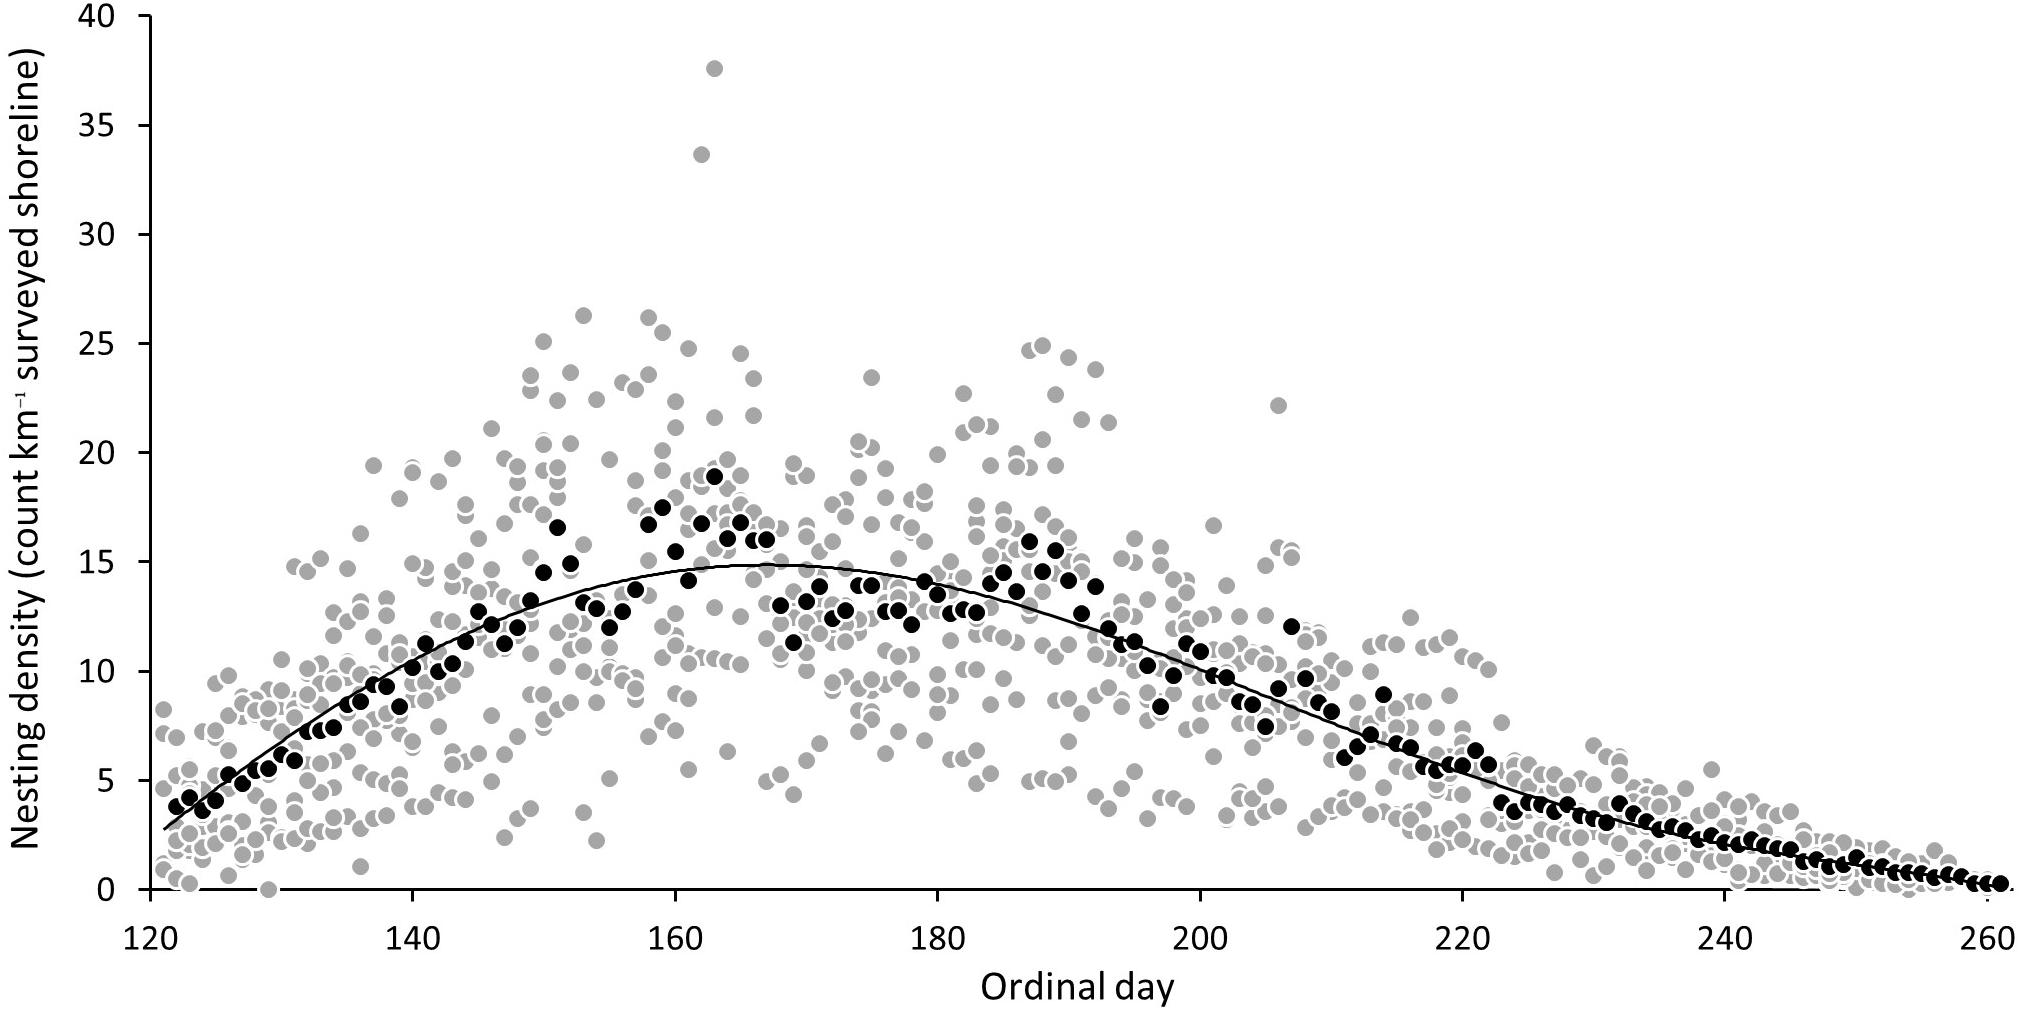
Figure 7. Mean daily nesting density (gray circle) and mean of nesting density of ordinal dates across all years (black circle) and sixth degree polynomial trend line (6th order) of mean daily nesting densities for index beaches on Masirah (2008–2016).
Long-Term Trend Analysis
A review of the relationship between the ratio of successful nests to total track counts between 2008 and 2016 (Figure 8) accounts for the influence of nesting success on the value of track counts as a reliable and consistent index for comparison between years, and its use in our long-term trend analysis (K5–K13). Between 2008 and 2016 there is a marginal decline in this ratio from 0.7 to 0.68 based on a straight line fit (R2 = 0.019, p = 4.2e-05). The mean across all years is calculated at 0.69 (SD = ± 0.04) with mean annual values ranging between 0.75 in 2011 (SD = ±0.07) and 0.62 in 2015 (SD = ±0.15) (Table 4).
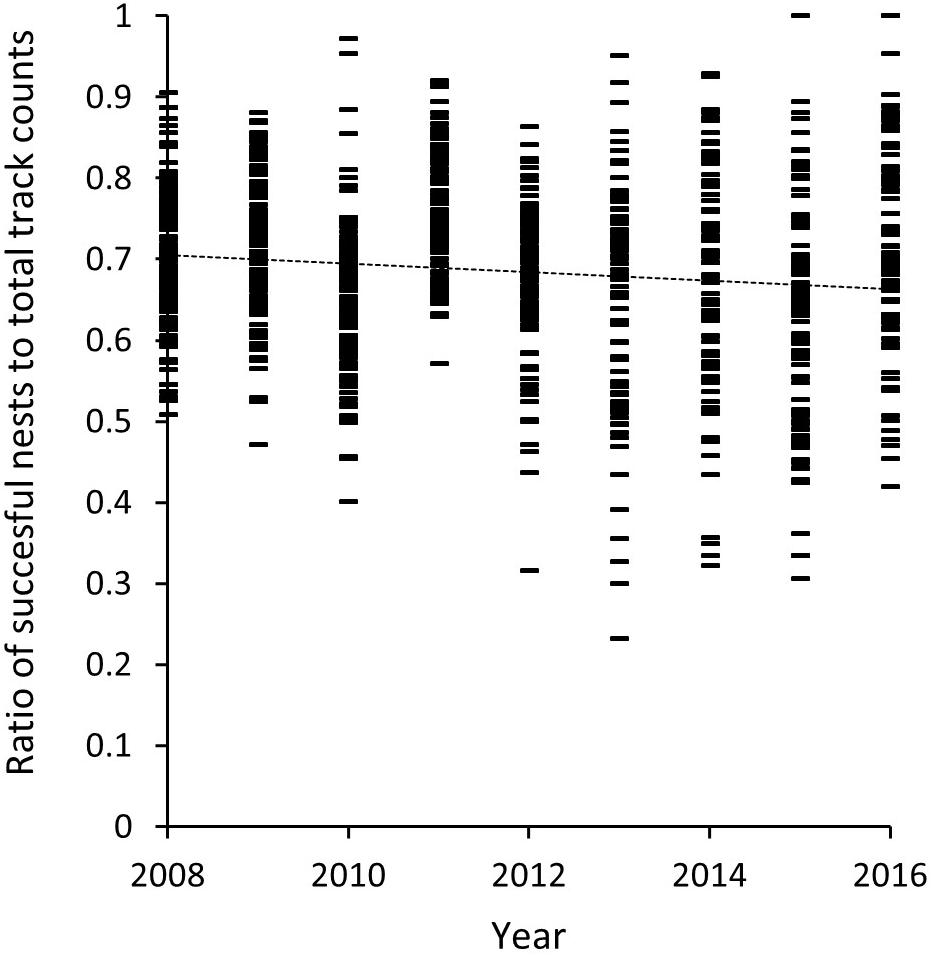
Figure 8. Ratio of mean daily nesting success of track count data for beaches included in the 9-km long-term trend analysis (K5–K13) for Masirah loggerheads (2008–2016).

Table 4. Summary of mean and standard deviation for the ratio of track counts to successful nesting for K5–K13 for 2008–2016.
Temporal consistency in sampling over all survey seasons is presented in Figure 9, where sampling days within each year have been converted to ordinal dates. Relatively consistent coverage within a 120-day season is evident for those years where surveys took place, as reflected by the near horizontal linear trend line (R2 = 0.0005). The mean ordinal date 181.29 (SD = ±8.04) sits very close to the mode of ordinal dates selected for this study (ordinal day 182). These results further validate our comparison for data collected with historical and recent methods. The least sampling effort is evident in 1977 (6 sampling days across the season) and the most biased year for sampling is 1996 where surveys end by day 178.
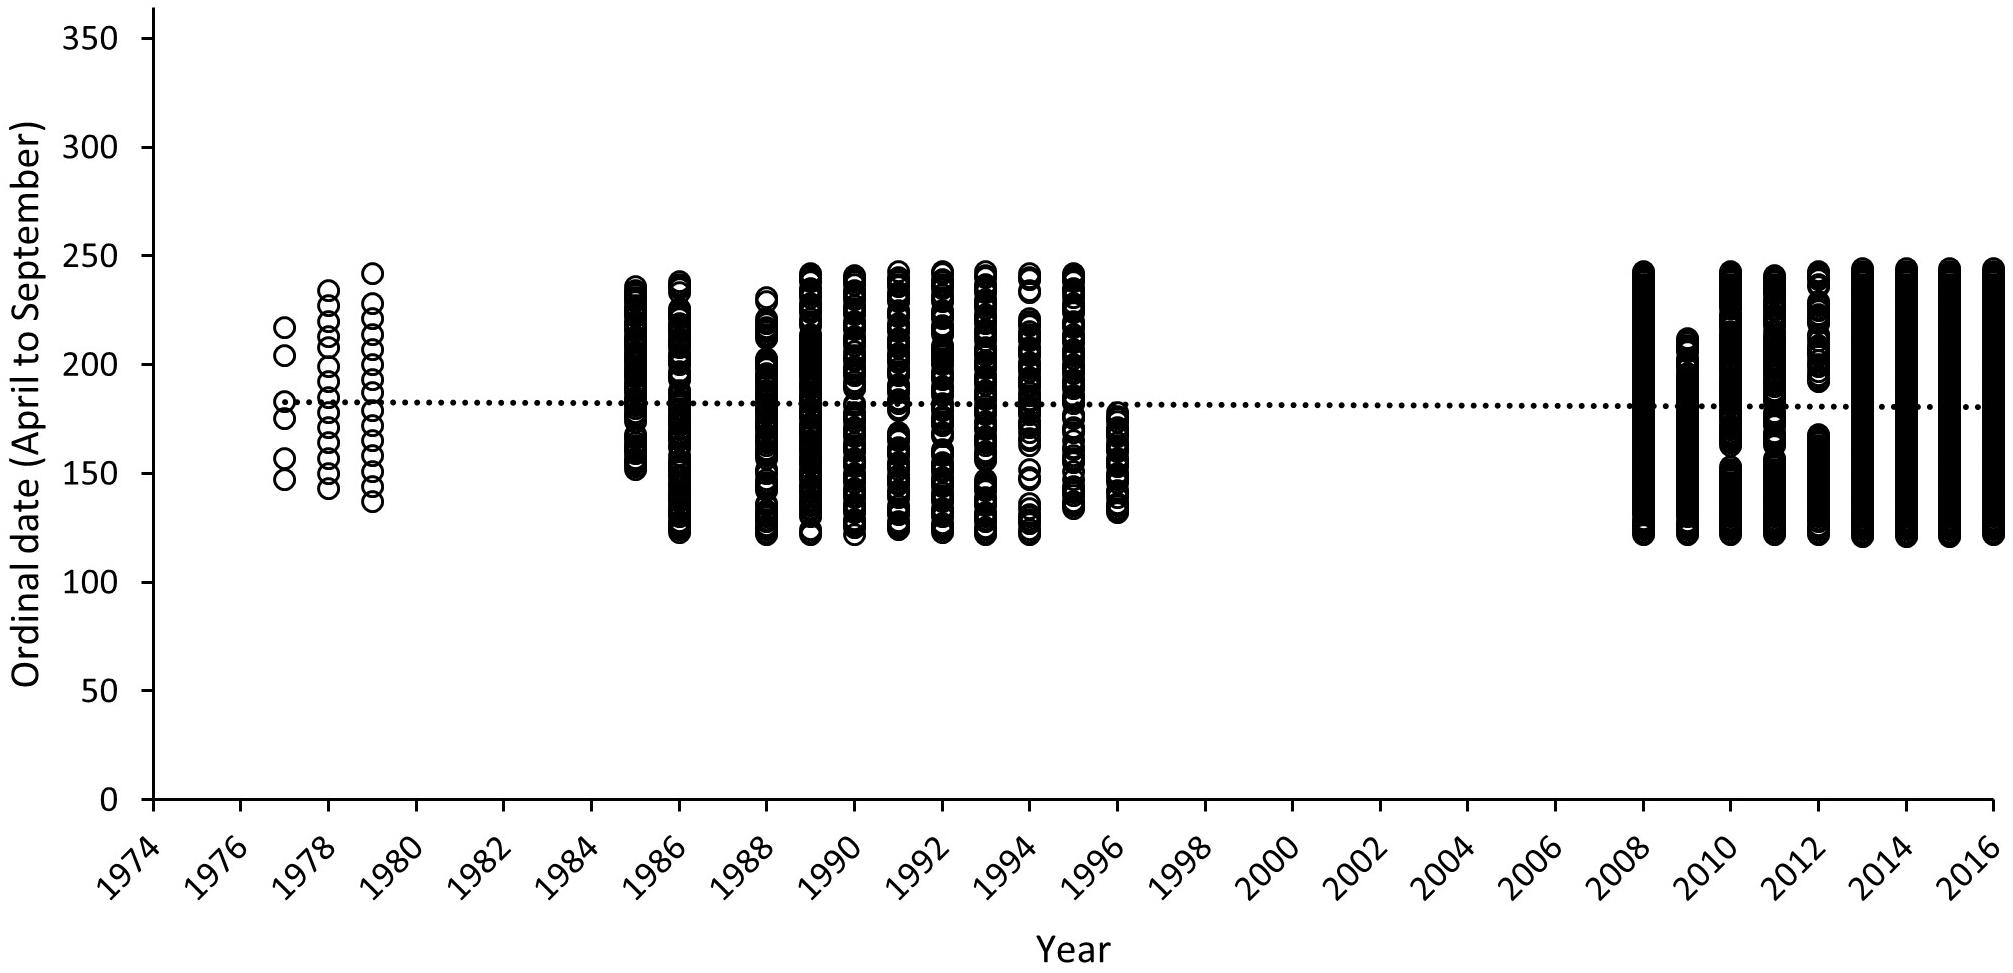
Figure 9. Ordinal dates of surveys for each year included within the long-term track count trend assessment for Masirah loggerheads (1977–2016). Dashed line represents mean of ordinal date across all years.
The long-term trend (Figure 10) presents data selected for spatial alignment and temporal conformity between 1977 and 2016. The most robust and comparable dataset from this period is taken between beaches K5–K13 between 1985–1996 and 2008–2016. A two-point trend assessment showed mean nesting density declining from 584 tracks km–1 season–1 (SD = ±109.5) to 122.4 tracks km–1 season–1 (SD = ±37.3), representing a 79% decline (Table 5). The t-test result [two sample t(df) = 12, p = 3.92 × 10⁻⁸] confirms significance of the differences between the two datasets. Assuming a linear trend between median years, contributing to historical and recent datasets (1990 and 2012), this decline is estimated at 21 tracks km–1 season–1. This metric, estimating rate of change, could be used as an indicator in the future to assess efficacy of conservation actions.
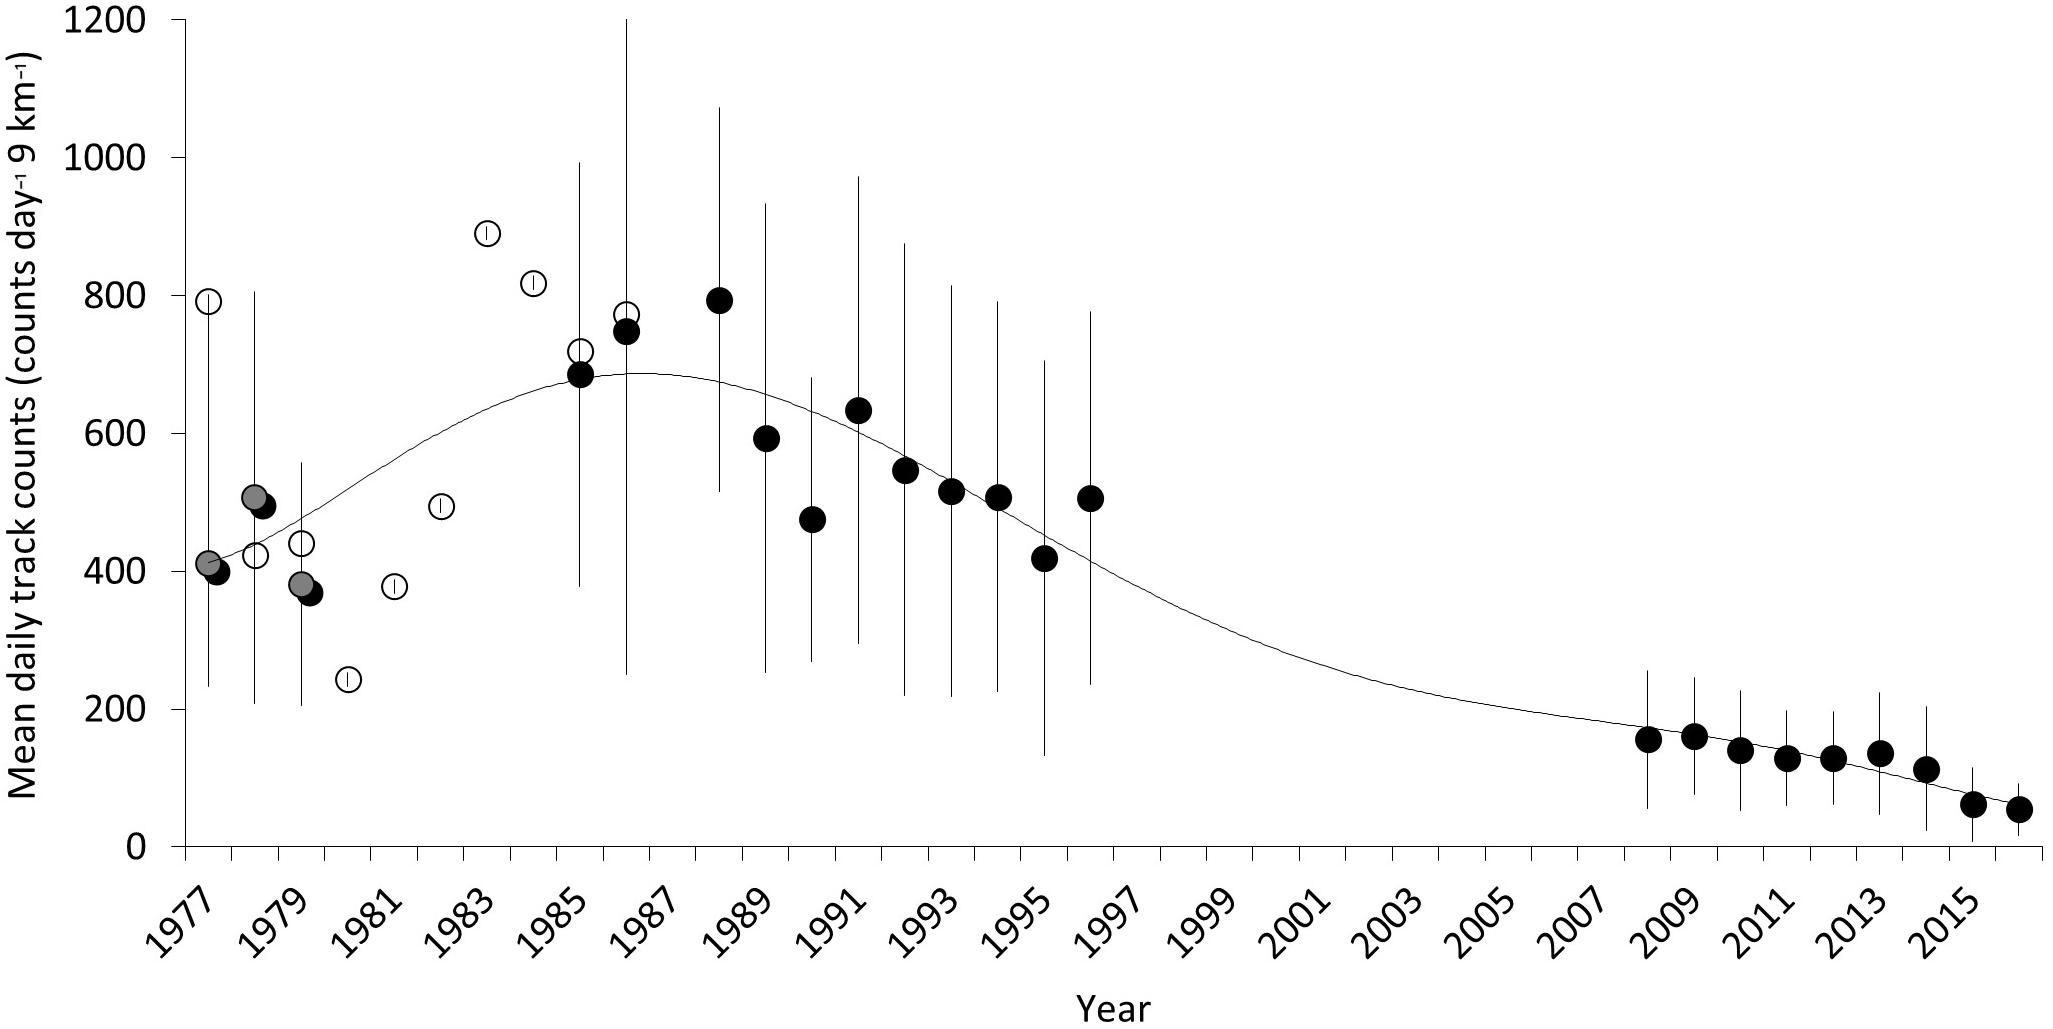
Figure 10. Long-term trend of mean track counts per day for a discrete 120 days season across 9-km of index beach on the northeast of Masirah Island intermittently from 1977 to 2017. Solid points are means from 5-day-per-week counts between K5 and K13. Open points are from weekly counts (Ross and Barwani, 1982) between K5 and K8 and extrapolated to the 9-km distance between K5 and K13. Gray points are weekly counts made between K5 and K13. The trend line is a sixth order polynomial regression.
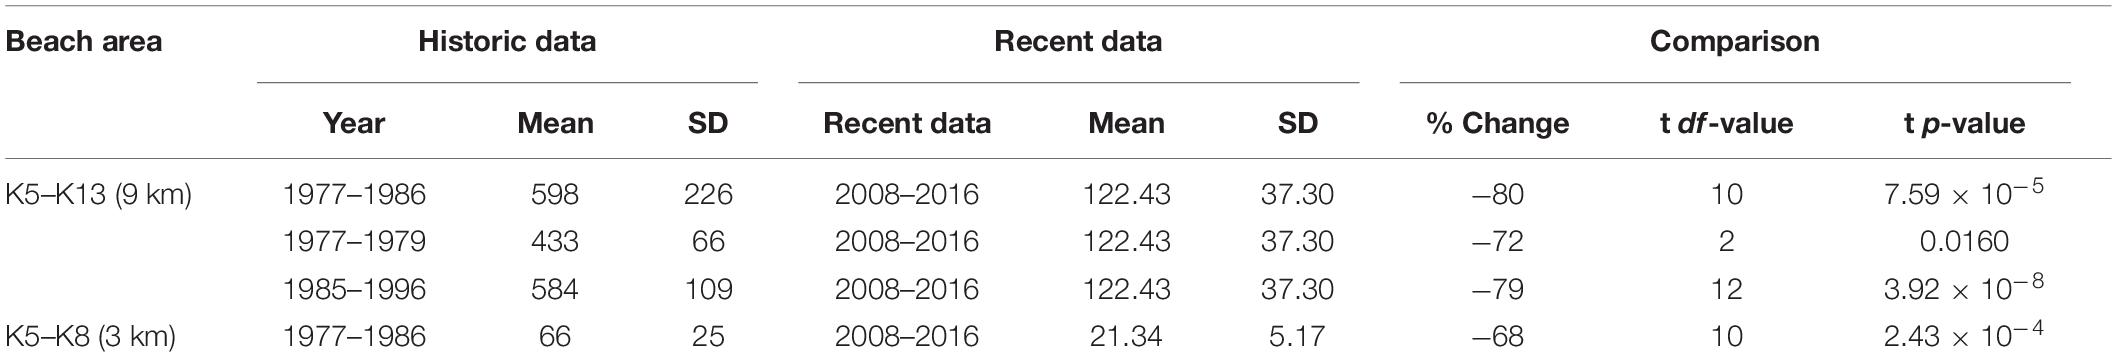
Table 5. Results of comparisons made between historical and recent nest survey counts for percentage change and tests for significant difference (alpha = 0.05).
Further comparison of seasonal estimates, generated by data acquired from weekly track counts for K5–K13 between 1977–1986 (mean = 597.6, SD = ±225.71) and 2008–2016 (mean = 122.4, SD = ±37.3), present a similar decline estimate of 80% [two sample t(df) = 10, p = 7.59 × 10⁻⁵] (Table 5). Less robust mean estimates from K5 to K8 for the 1977–1979, extrapolated out to 9 km (mean = 433.375, SD = ±65.9), compared to recent data (mean = 122.43, SD = ±37.3), generates a decline of 72% [two sample t(df) = 2, p = 0.015]. Data isolated and compared between K5 and K8 beaches for years 1977–1979 (mean = 66.4, SD = ±25.08) and 2008–2016 (mean = 21.34, SD = ±5.17) represents a 68% decline [two sample t(df) = 10, p = 2.43 × 10⁻⁴]. Together, the best fit across the complete dataset (1977–2016) is a 6-order polynomial regression (R2 = 0.904).
Discussion
Evidence of a Nesting Decline
Four comparisons of mean loggerhead nest counts at Masirah between early and late periods in the time series reveal significant declines of between 68 and 80% (Table 5). The steepest decline shown is a 79% decrease in the documented number of nests between the periods of 1985–1996 and 2008–2016; periods of only two decades.
Nest counts from 83 km of beach between 2008 and 2016 provide a mean multiyear estimate of 55,202 nests year–1 (SD = 16,814, CI 0.95 53,326–57,078) (Table 1). Clutch frequency estimates of 4.8 (N = 8, SD = 1.2) and 5.4 (N = 34, SD = 0.87) nests female–1 season–1 derived from satellite telemetry studies coincident with the period of this study (Rees et al., 2010; Tucker et al., 2018), provides us with an estimate of between 10,223 (CI 0.95 9875–10,570) and 11,500 (CI 0.95 11,109–11,891) nesting females year–1. This estimate varies substantially from the previous estimate of 20,000–40,000, which was derived from data between 1977 and 1986 (Ross, 1987, 1997), and assumed a clutch frequency of 4 nests female–1 season–1. Using the same dataset, but with the more recent clutch frequency estimate, this historical range would be approximately 14,815–33,333. It should be noted that the clutch frequency estimate from Rees et al. (2010) missed early season nesters, and the estimate from Tucker et al. (2018) was initiated at the beginning of the season. Such factors could positively or negatively bias the estimates and therefore caution should be specifically applied where population level inferences may be impacted by the small sample size (Tucker et al., 2018).
We present the most robust historical dataset available for loggerhead nesting on Masirah. The approach we use to assess annual trends is based on defendable assumptions about how the data represented annual nesting on the island. Our methods ensured that tracks were not double counted on subsequent days and that consistent methods were temporally and spatially comparable to historical surveys. Data from recent surveys demonstrate that measurement error related to scoring of successful nesting attempts remained consistently low across all years (Table 3). The track counts we used in the analysis were proportional to nest counts across multiple years (Figure 8). We also show that the nesting season sampled on Masirah captured the majority of the nesting season (Figure 7), with both historical and recent surveys generating datasets with balanced effort as determined by comparing ordinal dates in each year to the median ordinal value (Figure 9). Spatial longshore consistency is noted from comparative nesting density plots between years (Figure 6). Witherington et al. (2009) noted similar consistencies in spatial density patterns between seasons on Florida’s nesting beaches and concluded that because individual loggerheads are unlikely to nest in consecutive years (Schroeder et al., 2003), consistency of beach attributes likely shaped the distribution and “agreement” in beach selection between different cohorts. Flipper tagging studies at the north of Masirah detected a return of 3% of all tags deployed in 1977 from those encountered in 1978 (N = 1830) (Ross, 1979). This suggests that an annual remigration interval of 1 year for this population may be limited and that beach attributes on Masirah also drive the spatial pattern of nesting density.
Annual sea turtle nesting counts are influenced by the number of breeding females in the population and by their nesting frequency. Nesting frequency incorporates females’ remigration interval (years between breeding migrations) and clutch frequency (nests with clutches per breeding season). Although the relationship between these factors is complex (Richards et al., 2011), there is no evidence to suggest that changes in nesting frequency alone drive monotonic nesting trends spanning decades within a time series. The range of mean remigration intervals for loggerhead populations worldwide is 2–4 years (Murphy and Hopkins-Murphy, 1990; Miller, 1997; Miller et al., 2003; Hatase et al., 2004; Phillips et al., 2014), with individual turtles rarely having intervals as long as 7 years (Miller et al., 2003). Where decades-long time series in loggerhead remigration intervals (Phillips et al., 2014) or clutch frequency data (Hawkes et al., 2005) have been examined, no trends have been found. Thus, we propose that it is unlikely that the multi-decadal Masirah nesting decline has had significant long-term influence from changes in nesting frequency.
We conclude that the decline in annual loggerhead nesting effort measured on Masirah represents a similar magnitude change in the population of adult females. Similar steep declines in leatherback turtle nesting observed over long periods were attributed to mortality effects on population numbers (Spotila et al., 2000). We note that the ∼80% decline we report is rapid, in that it has occurred within the timeframe of a single loggerhead generation (National Marine Fisheries Service [NMFS] and US Fish and Wildlife Service [USFWS], 2008; Scott et al., 2012), and over the course of our study (1980s to the present). Between 2008 and 2016 the mean nesting density on K8–K22 was 6.54 nests–1 km–1 day–1 (SD = 2.96). Comparable data from the 2019 season reveals further decline to a density 1.85 nests–1 km–1 day–1 (SD = 0.82). We suggest the highest potential for adult loggerhead mortality occurs where hazards intersect with congregating females near breeding beaches. This mortality to adult females would result in the observed immediate effects on nesting numbers, although other significant mortality may also be occurring at other life stages across the population range that we are not yet aware of. It is of note that the population would be sensitive to mortality in this life stage because adult females have a much higher reproductive value than other life stages (eggs, hatchlings, juveniles) (Crouse et al., 1987).
Fisheries Threats
Global declines in sea turtle populations have generally been attributed to multiple factors such as mortality from bycatch in artisanal and commercial fisheries, exploitation of eggs and turtles, habitat destruction, as well as climate change (Jackson et al., 2001; Wallace et al., 2010b, 2011; Rhodin et al., 2015; Mazaris et al., 2017; Jensen et al., 2018). Bycatch is understood to be the most significant global threat to loggerheads (Wallace et al., 2011) and further evidence detailed in our discussion supports a hypothesis that local and regional bycatch is the most likely (but not the only) cause of the steep population decline observed in the Masirah rookery.
Oman fisheries are 99.1% “artisanal” (Ministry of Agriculture and Fisheries Wealth, 2018). Future turtle nesting declines caused by bycatch from this fleet were predicted from marine resource assessment surveys conducted in the Sultanate between the late 1980s and early 1990s (Salm et al., 1993). Community based surveys conducted on Masirah in 2013 indicated that entangling nets were responsible for 98% of bycatch (1640–1770 loggerhead turtles per year) in artisanal fisheries (Al Harthi et al., 2015). Satellite telemetry studies of loggerhead turtles nesting on Masirah (Rees et al., 2010) has further revealed that their habitat use overlaps with the range of inshore (skiff) and larger offshore dhow (launch) fleets (Ministry of Agriculture and Fisheries Wealth, 2013; Unpublished observations Environment Society of Oman [ESO], 2014; Unpublished observations Five Oceans Environmental Services [5OES], 2017).
Subsequent to these findings a government and community lead stakeholder group recommended collection of in situ bycatch data. Remote electronic monitoring methods (Metcalfe et al., 2017; Bartholomew et al., 2018) have been successfully used to capture bycatch events and evaluate the co-occurrence of fishing effort with loggerhead habitat utilization. However, scaling the study to include a larger sample of the fleet remains a challenge and may need to be realized in the form of a continuous monitoring program to track vessels which are understood to be adaptive in extraction of fishing resources (Five Oceans Environmental Services LLC [5OES], 2017). To address these challenges, we recommend that such efforts be combined with sustainable fisheries approaches proposed for Oman (World Bank, 2015) in order to secure incentives for stakeholder buy-in.
Historically, licensed industrial trawlers have also been active off Oman (Salm et al., 1993). Demersal and mid-water trawling by foreign fleets was reported to cause loggerhead mortality in 1977–1978 and efforts to limit trawling near the Masirah nesting beach, and reduce bycatch, were initiated and maintained by local action and agreements between concessionaires and the Ministry of Agriculture and Fisheries Wealth (J. Ross, personal communication, May 29, 2019). “Blatant flouting of regulations” was reported from an observer-based survey program conducted on the industrial demersal trawlers by authorities (Hare, 1991). An estimated 586 turtles were captured in 1989 with the highest incidence of turtle capture to the south of Masirah in July (Hare, 1991). These data fit with the inter-nesting period (Rees et al., 2010; Tucker et al., 2018). This industrial fishery was active up to 2009 and demersal trawling in Oman’s waters has been illegal since 2011 (Ministerial Decision No 20/2009). However, the full extent of the bycatch over this period is not understood although the extent of the licensed area is co-occurrent with the tracks of nesting females described by satellite telemetry studies (Rees et al., 2010).
At a regional level Productivity Susceptibility Analysis for the Indian Ocean has shown the NWIO RMU to score highly vulnerable to impacts from longline and gillnets, and medium vulnerability from purse seine fishing (Williams et al., 2018). Nesting females from Masirah are considered to intersect with fishing threats throughout their known range which includes Oman to the Red Sea, the Arabian Gulf and east as far as the Gulf of Kutch (Baldwin et al., 2003; Rees et al., 2010; Tiwari et al., 2018). However, 83% of juvenile loggerhead turtles captured by the European longline fleet off Reunion Island (n = 108) were characterized with the same mtDNA haplotypes as those sampled from the Arabian region (Dalleau et al., 2016). This demonstrates a broader range and exposure of the RMU to fisheries throughout the Indian Ocean.
The mortality of juveniles in the oceanic phase is implicated in the reduction of recruits to the adult population and the re-emerging decline of the Southwest Pacific RMU (Limpus and Casale, 2015). Similarly, it is possible that capture of juvenile loggerheads in the distant longline fleets (off Reunion) is suppressing the number of new recruits into the adult nesting population of Masirah, although as yet there are no studies to assess the scale of this potential problem. The requirement to address bycatch in the Indian Ocean is not unique to turtles, with 4.1 million small cetaceans estimated to have been captured by tuna gillnet fishing between 1950 and 2018 (Anderson et al., 2020). The urgent need for improved data collection of bycatch rates and mortality (using electronic monitoring) and implementation of effective mitigation to these threats has been recommended for Indian Ocean Tuna Commission member countries (Williams et al., 2018). To address threats outside Oman’s jurisdiction, a broad network of international collaborations will need to be established.
Climate Change
A global review ranked the NWIO RMU as one of the most resilient to the impacts of climate change (Fuentes et al., 2013). The survival and distribution of sea turtles is known to be influenced by trophic level ecosystem changes and water temperatures (Hawkes et al., 2009; Witt et al., 2010). In comparison to other species of turtles, loggerheads (as omnivores) are considered to be at lower risk from depleted foraging resources due to their broad diet (Godley et al., 1997; Tomas et al., 2001; Witt et al., 2010; Bjorndal, 2017). Habitat utilization of post-nesting migrants from Masirah alludes to this with behavioral plasticity documented in a foraging area comprised of neritic and oceanic environments within the Arabian Sea and Gulf of Aden (Rees et al., 2010). The Arabian Sea is now experiencing a period of ecosystem state change driven by loss of snow cover over the Himalayan region with weakening of monsoon winds resulting in stratification, deoxygenation and denitrification of the regions waters (Goes et al., 2020). This presents a concern for all marine fauna, and plans are underway to use satellite tracking data within an oceanographic modeling environment to understand the potential threats to the NWIO RMU (Goes Personal Communication May 9th, 2020). In light of new information in this study a repeat of the RMU climate change resilience study is warranted in-order to support prioritization of efficient and effective measures for increasing resilience (Morecroft, 2012; Fuentes et al., 2013).
Positive correlation has been documented between the increasing frequency of storm events (such as cyclones and hurricanes), the flooding of nests and the reduction of hatchling survival (Van Houtan and Bass, 2007). A category 5 cyclone that passed over Masirah in 1977 induced flooding that is estimated to have removed 42% of the loggerhead seasons total egg output (Ross, 1979). Post cyclone impact assessment in 2010 and 2015 revealed the most serious damage from flooding and erosion to nesting beaches at the north of the island (north of K40) and accounting for damage to 17% of the season’s total clutches (Environment Society of Oman [ESO], 2010, 2015). Increasing sea surface temperatures and reduction of wind shear related to climate change are linked to a higher proportion of cyclones reaching category 4 or 5 and having an increase in Power Disruptive Index in the Arabian Sea (Webster et al., 2005; Evan et al., 2011; Sebastian and Behera, 2015). This emerging trend presents a concern for the Masirah rookery where the loggerhead nesting season coincides with timing of recent cyclone events (Unpublished observations ESO, 2015).
Erosion of beach habitat and inundation by rising sea levels attributed to climate change has also become an additional concern for reproductive capacity of turtle rookeries (Hawkes et al., 2009; Witt et al., 2010; Fuentes et al., 2011; Behera et al., 2014; Patino-Martinez et al., 2014; Pike et al., 2015). On Masirah, beach erosion and hypoxic conditions are considered responsible for the 40–55% loss to clutches documented during hightide and monsoon induced flood events (Ross and Barwani, 1982). Projections of 0.5–1.2 m mean sea level rise (IPCC Climate Change, 2013) present a risk for low lying beaches at the north of the island that are regularly subjected to flood events observed by the authors during the nesting season. These threats require further consideration in future survey design.
Temperature-dependent sex determination and temperature tolerance during egg incubation is another key concern of climate change identified in global reviews, with increasing temperatures at nesting sites expected to drive feminization of populations or reduce hatching success due to exposure to temperatures above critical thresholds (Fuentes et al., 2009; Hawkes et al., 2009; Witt et al., 2010; Jensen et al., 2018). Global average surface temperatures are predicted to rise by 2–3°C by 2100 (Hinkel et al., 2015). The localized climatology of the Arabian Peninsula (and consequently those of NWIO RMU Oman based rookeries) will be driven by the strength and upwelling process of the South West monsoon (Attada et al., 2019) and therefore studies on Masirah to evaluate the influence of climate change on hatching success would be prudent.
Potential Rookery-Based Threats
Study of beach use at Masirah is providing increasing evidence of disturbance to nesting habitat. Index beaches at the north end of the island (K7–K22) witnessed a 15-fold increase in the number of artisanal skiff vessels stored (and recovered/launched) on beaches, from 32 in 2013 to 482 in 2017 (Five Oceans Environmental Services LLC [5OES], 2017). This equated to a density of 78 vessels km–1 between K7 and K11. The vessels are serviced by four-wheel drive vehicles that are required to transfer personnel and catch, and to launch and recover vessels. Driving over nesting habitat decreases hatching and emergence success though compaction of sand and at night can deter nesters (Mann, 1977; Nester, 2006). Tire tracks, and associated vegetation loss, increase erosion of beaches (Anders and Leatherman, 1987; Nester, 2006) and can also trap and impede hatchlings crawling toward the ocean (Anders and Leatherman, 1987; Lamont et al., 2002; Nester, 2006).
Significant beach debris has also been generated by the same fisher activities and is associated with entanglement, interreference and habitat displacement of nesting turtles on the island. In response the ESO collected over 500 tons of synthetic fishing net from 79 km of loggerhead turtle nesting habitat between 2016 and 2019 (Environment Society of Oman [ESO], 2019). Attempts to address the problem with a behavior change project have been initiated by the ESO in 2019 using facilities to safely dispose of nets (Environment Society of Oman [ESO], 2020), and have proven insufficient to address the problem on a large scale. In the opinion of the authors landing sites should be relocated to beaches low or absent in nesting. This could be done at minimal cost but provide significant returns for improving the quality of the nesting habitat.
High density index nesting beaches documented in this study are located around the periphery of the main settlement on the island, “Hilf,” a center with growing population and infrastructure. Improper lighting close to beaches or from urban areas is known to disturb and deter nesting females, as well as disorient hatchlings and reduce population recruitment (Silva et al., 2017; Dimitriadis et al., 2018). Hatchling orientation experiments conducted on index beaches at the north of the island in 1978 and more recently in 2013 have attributed orientation of hatchlings away from the sea to artificial light sources including the lighting from indirect urban glow (8–10 km away), municipal security lights, beach accommodation and street lights. The latter study documented that 90–100% of hatchlings (n = 60) involved in lighting arena trials mis-orientated away from the sea during the new moon lunar phase (Wheelan, 2013). The threat is suspected to be a serious long-term impediment to recruitment of loggerheads from index beaches although is waiting for funding resources to launch a pilot mitigation project.
Further recruitment losses on beach areas from illegal harvesting of nests for human consumption have been documented since early studies on Masirah although were considered marginal in extent (Ross, 1979, 1987; Baldwin, 1992). Anecdotal reports of poaching turtle eggs to use as a food source for livestock has also been reported historically (Ross, 1979; Environment Society of Oman [ESO], 2019) and will require more focused community engagement, together with revised measures for patrolling of beaches to ensure this practice does not escalate.
Commitments to Sea Turtle Conservation in Oman
Documentation of the nesting decline, together with evidence of threats across the range of this RMU supports the rationale to develop a holistic population recovery plan. The Biodiversity Impact Mitigation Hierarchy (BIMH) provides such a framework for the Masirah population because it addresses mortality across the species’ entire life cycle and range of habitat use through at-sea bycatch mitigation measures and compensatory conservation actions on the nesting beaches (Squires et al., 2018).
For the nesting rookery the government of Oman has proposed a plan to protect sea turtle nesting beaches within Masirah Island Protected Area and when decreed will focus more attention and resources toward the protection of nesting habitat. This is considered a vital step to support delivery of enforcement, monitoring, and integration of the community within conservation requirements (Busaidi et al., 2018).
A spatial plan considering management of all nesting beaches proposed by the government should be fully supported on two accounts; firstly, because the extent of the nesting decline has been so serious that all available space becomes important, and secondly because each beach area provides different beneficial attributes. Whilst beaches in the north have some of the highest nesting densities, those in the south are further away from anthropogenic disturbance and are less prone to flooding and damage from cyclone events. Accounting for these differing attributes will help provide resilience to a range of documented threats, particularly those from climate change (Hawkes et al., 2009; Witt et al., 2010; Fuentes et al., 2013; Jensen et al., 2018). An evaluation of factors impacting hatchling production, spatially and temporally, on Masirah should be an important objective to guide beach management strategies to optimize hatchling output. Maximizing hatchling production has been demonstrated elsewhere to be critical for population recovery (Boulon et al., 1996; Tapilatu and Tiwari, 2007; Tiwari et al., 2011; Mazaris et al., 2017).
Oman hosts globally important populations of three sea turtle species (Salm et al., 1993) and our findings for loggerheads may be a sentinel for the other species within the Arabian Sea that may be subject to similar threats. Long time-series nesting surveys are noted as important in detecting significant increases and decreases in abundance (Hayes, 2000; Mazaris et al., 2013) and it is our recommendation that the surveys on Masirah are continued annually with additional studies initiated across other important rookeries and species in Oman to ensure effective conservation measures are coordinated at the national scale. Index beach nest count surveys have proven a robust way to provide metrics important to the management of the population. However, direct metrics related to female fitness (i.e., reproductive output from hatching success studies) should be produced to track improvements in the environment (Pike, 2008).
Despite the previously documented nesting decline (Casale and Tucker, 2017), the global 2017 IUCN Red list status assessment found the NWIO RMU to represent 35% of loggerhead global abundance, surpassed only by the Northwest Atlantic RMU (41.8%). Other loggerhead RMUs represent only 1.5 to 7.5% of the global loggerhead abundance (Casale and Tucker, 2017). In the age of reported mass extinctions (Barnosky et al., 2011), turtle populations have witnessed remarkable recoveries where conservation efforts have been diligently applied (Mazaris et al., 2017). Our more recent findings do not support any suggestion of recovery of the Masirah population.
Many threats on the nesting beach and the marine environment are well known and documented. Given the rate of decline this demands immediate attention while more comprehensive and collaborative efforts can be developed through an effective recovery plan design process (Roberts and Hamann, 2016). Engagement in trans-boundary discussions through current international agreements such as the Indian Ocean and South East Asia (IOSEA) Turtle Memorandum of Understanding, Indian Ocean Tuna Commission (IOTC) and new regional initiatives are essential to address threats (e.g., fisheries impacts) occurring outside of Oman’s jurisdiction. With a strong and urgent political and social will, as well as the implementation of wise management strategies, there is still time and hope to reverse the observed decline and recover the Masirah loggerhead population to its historic premier status as the world’s largest nesting population.
Data Availability Statement
The raw data supporting the conclusions of this article will be made available by the authors, without undue reservation.
Ethics Statement
This animal study was reviewed and approved by the Ministry of Environment and Climate Affairs, Government of Oman (Permit Nos. 19/2012, 9/2013, 11/2014, 14/2015, 33/2015, 3/2016, 9/2016, 29/2016, 6210/10/13, 6210/10/32, 6210/10/33, 6210/10/42, 6210/10/43, 6210/10/74, 6210/10/78).
Author Contributions
BW, JR, AW, RB, EP, and MT guided the experimental design. AW, RB, SA, MW, TA, AAK, AAB, GA, JAH, JAA, LD, and JR managed or conducted the surveys. AW, BW, EP, RB, SA, MW, TA, JR, LD, BS, and MT drafted the manuscript. BW and AW conducted the analysis. All co-authors commented and provided edits to the original manuscript.
Funding
This work has been made possible by on-going support of the United States Department of Interior, Marine Turtle Conservation Act Fund, United States National Oceanic and Atmospheric Administration – National Marine Fisheries Service, and sponsorship through the Port of Duqm and Oman Oil.
Conflict of Interest
AW and RB were employed by the company Five Oceans Environmental Services LLC.
The remaining authors declare that the research was conducted in the absence of any commercial or financial relationships that could be construed as a potential conflict of interest.
Acknowledgments
The board and management team of the Environment Society of Oman are commended for their continued persistence in managing and guiding the project, and staff of the Ministry of Environment and Climate Affairs congratulated for liaison with stakeholders and permitting the project. Special thanks go to numerous volunteers and the incidental support provided by companies including Five Oceans Environmental Services. Special thanks for technical support is extended to C. Turley and N. Pilcher. Most importantly credits go to the numerous rangers of government offices and field assistants of the Environment Society of Oman who have spent many early mornings and late evenings traveling the beaches and counting tracks to make the data behind this publication a reality. The authors would also like to thank Peter Dutton and two reviewers for their valuable comments in earlier drafts of this manuscript.
Supplementary Material
The Supplementary Material for this article can be found online at: https://www.frontiersin.org/articles/10.3389/fmars.2020.00666/full#supplementary-material
References
Al Harthi, S., Al Bulushi, A., Willson, A., Baldwin, R., Looker, E., Gascoyne, J., et al. (2015). “Participatory approach towards addressing sea turtle resource use conflicts on Masirah Island, Sultanate of Oman,” in Poster Presented to 35th Annual Symposium on Sea Turtle Biology and Conservation, Dalman.
Anders, F. J., and Leatherman, S. P. (1987). Effects of off-road vehicles on coastal foredunes at Fire Island, New York, USA. Environ. Manage. 11, 45–52. doi: 10.1007/bf01867178
Anderson, R. C., Herrera, M., Ilangakoon, A. D., Koya, K. M., Moazzam, M., Mustika, P. L., et al. (2020). Cetacean bycatch in Indian Ocean tuna gillnet fisheries. Endanger. Species Res. 41, 39–53. doi: 10.3354/esr01008
Attada, R., Dasari, H. P., Parekh, A., Chowdary, J. S., Langodan, S., Knio, O., et al. (2019). The role of the Indian summer monsoon variability on Arabian Peninsula summer climate. Clim. Dyn. 52, 3389–3404. doi: 10.1007/s00382-018-4333-x
Baldwin, R., Hughes, G. R., and Prince, R. I. T. (2003). “Loggerhead turtles in the Indian Ocean,” in Loggerhead Sea Turtles, eds A. B. Bolten and B. E. Witherington (Washington, DC: Smithsonian Books), 218–232.
Baldwin, R. M. (1992). Nesting Turtles on Masirah Island: Management Issues, Options and Research Requirements. Muscat: Ministry of Regional Municipalities and Environment.
Barker, R. J., and Sauer, J. R. (1992). “Modelling population change from time series data,” in Wildlife 2001: Populations, eds D. R. McCullough and R. H. Barret (London: Elsevier), 182–194. doi: 10.1007/978-94-011-2868-1_17
Barnosky, A. D., Matzke, N., Tomiya, S., Wogan, G. O., Swartz, B., Quental, T. B., et al. (2011). Has the Earth’s sixth mass extinction already arrived? Nature 471:51. doi: 10.1038/nature09678
Bartholomew, D. C., Mangel, J. C., Alfaro-Shigueto, J., Pingo, S., Jimenez, A., and Godley, B. J. (2018). Remote electronic monitoring as a potential alternative to on-board observers in small-scale fisheries. Biol. Conserv. 219, 35–45. doi: 10.1016/j.biocon.2018.01.003
Behera, S., Mohanta, R., Kar, C., and Mishra, S. (2014). Impacts of the super cyclone philine on sea turtle nesting habitats at the rushikulya rookery, ganjam coast, India. Poultry Fish. Wildlife Sci. 2, 1–5. doi: 10.4172/2375-446X.1000114
Bjorndal, K. A. (2017). “Foraging ecology and nutrition of sea turtles,” in The Biology of Sea Turtles, Vol. I, eds P. L. Lutz and J. A. Musick (Boca Raton, FL: CRC Press), 213–246.
Boulon, R. H. Jr., Dutton, P. H., and McDonald, D. L. (1996). Leatherback turtles (Dermochelys coriacea) on St. Croix, U. S. virgin islands: fifteen years of conservation. Chelonian Conserv. Biol. 2, 141–147.
Bowen, B. W., Kamezaki, N., Limpus, C. J., Hughes, G. R., Meylan, A. B., and Avise, J. C. (1994). Global phylogeography of the loggerhead turtle (Caretta caretta) as indicated by mitochondrial DNA haplotypes. Evolution 48, 1820–1828. doi: 10.1142/9789814317764
Busaidi, M. A., Bose, S., Claereboudt, M., and Tiwari, M. (2018). Sea turtles tourism in Oman: current status and future prospects. Tourism Hosp. Res. 19, 321–336. doi: 10.1177/1467358417751026
Casale, P., and Tucker, A. D. (2017). Caretta caretta (amended version of 2015 assessment). The IUCN Red List of Threatened Species 2017: e. T3897A119333622. Available online at: https://dx.doi.org/10.2305/IUCN.UK.2017-2.RLTS.T3897A119333622.en (accessed May 31, 2020).
Crouse, D. T., Crowder, L. B., and Caswell, H. (1987). A stage based population model for loggerhead sea turtles and implications for conservation. Ecology 68, 1412–1423. doi: 10.2307/1939225
Dalleau, M., Benhamou, S., Sudre, J., Ciccione, S., and Bourjea, J. (2014). The spatial ecology of juvenile loggerhead turtles (Caretta caretta) in the Indian Ocean sheds light on the “lost years” mystery. Mar. Biol. 161, 1835–1849. doi: 10.1007/s00227-014-2465-z
Dalleau, M., Hoarau, L., Lalire, M., Gaspar, P., Tardy, C., Jaquemet, S., et al. (2016). Connectivity of the loggerhead turtle (Caretta caretta) in the western Indian ocean: implementation of local and regional management. Rap. Sci. 161, 1835–1849.
Dimitriadis, C., Konstantinidou, I. F., Sourbès, L., Koutsoubas, D., and Mazaris, A. (2018). Reduction of sea turtle population recruitment caused by nightlight: evidence from the Mediterranean region. Ocean Coastal Manage. 153, 108–115. doi: 10.1016/j.ocecoaman.2017.12.013
Environment Society of Oman [ESO] (2019). Progress Report for 2019. Available online at: http://www.eso.org.om/index/images/file/2020-03/Annual_Report_2019_English.pdf (accessed February 2, 2020).
Evan, A., Kossin, J., Chung, C., and Ramanathan, V. (2011). Arabian Sea tropical cyclones intensified by emissions of black carbon and other aerosols. Nature 479, 94–97. doi: 10.1038/nature10552
Freckleton, R. P., Watkinson, A. R., Green, R. E., and Sutherland, W. J. (2006). Census error and the detection of density dependence. J. Anim. Ecol. 75, 837–851. doi: 10.1111/j.1365-2656.2006.01121.x
Fuentes, M. M., Pike, D. A., Dimatteo, A., and Wallace, B. P. (2013). Resilience of marine turtle regional management units to climate change. Glob. Change Biol. 19, 1399–1406. doi: 10.1111/gcb.12138
Fuentes, M. M. P. B., Limpus, C. J., and Hamann, M. (2011). Vulnerability of sea turtle nesting grounds to climate change. Glob. Change Biol. 17, 140–153. doi: 10.1111/j.1365-2486.2010.02192.x
Fuentes, M. M. P. B., Maynard, J. A., Guinea, M., Bell, I. P., Werdell, P. J., and Hamann, M. (2009). Proxy indicators of sand temperature help project impacts of global warming on sea turtles in northern Australia. Endanger. Species Res. 9, 33–40. doi: 10.3354/esr00224
Godley, B. J., Smith, S. M., Clark, P. F., and Taylor, J. D. (1997). Molluscan and crustacean items in the diet of the loggerhead turtle, Caretta caretta (Linnaeus, 1758)[Testudines: Chelonidae] in the eastern Mediterranean. J. Molluscan Stud. 63, 474–476. doi: 10.1093/mollus/63.3.474
Goes, J. I., Tian, H., do Rosario Gomes, H., Anderson, O. R., Al-Hashmi, K., deRada, S., et al. (2020). ecosystem state change in the Arabian Sea fuelled by the recent loss of snow over the Himalayan-tibetan plateau region. Sci. Rep. 10:7422.
Google Earth Pro (2016). Google Earth Pro V 7.3.1.4507. Masirah Island, Sultanate of Oman. 20.628905N 58.901229 E. Eye at alt 18,000m. Image Landsat/Copernicus. Available online at: https://www.google.com/earth/ (accessed May 5, 2016).
Hare, S. R. (1991). Turtles caught incidental to demersal finfish fishery in Oman. Mar. Turtle Newslett. 53, 14–16.
Hatase, H., Matsuzawa, Y., Sato, K., Bando, T., and Goto, K. (2004). Remigration and growth of loggerhead turtles (Caretta caretta) nesting on Senri Beach in Minabe, Japan: life-history polymorphism in a sea turtle population. Mar. Biol. 144, 807–811. doi: 10.1007/s00227-003-1232-3
Hawkes, L. A., Broderick, A. C., Godfrey, M. H., and Godley, B. J. (2005). Status of nesting loggerhead turtles Caretta at Bald Head Island (North Carolina, USA) after 24 years of intensive monitoring and conservation. Oryx 39, 65–72. doi: 10.1017/s0030605305000116
Hawkes, L. A., Broderick, A. C., Godfrey, M. H., and Godley, B. J. (2009). Climate change and marine turtles. Endanger. Species Res. 7, 137–154. doi: 10.3354/esr00198
Hayes, G. (2000). Population Viability Analysis of Blanding’s (Emydoidea blandingii) and Spotted (Clemmys guttata) Turtles in Southern Maine. Unpublished report, Endangered Species Group. Bangor: Maine Department of Inland Fisheries and Wildlife.
Hinkel, J., Jaeger, C., Nicholls, R. J., Lowe, J., Renn, O., and Peijun, S. (2015). Sea-level rise scenarios and coastal risk management. Nat. Clim. Change 5:188. doi: 10.1038/nclimate2505
Holmes, E. E., and Fagan, W. F. (2002). Validating population viability analysis for corrupted data sets. Ecology 83, 2379–2386. doi: 10.1890/0012-9658(2002)083[2379:vpvafc]2.0.co;2
IPCC Climate Change (2013). The Physical Science Basis, eds T. F. Stocker et al. (Cambridge: Cambridge University Press), 1–29.
Jackson, J. B., Kirby, M. X., Berger, W. H., Bjorndal, K. A., Botsford, L. W., Bourque, B. J., et al. (2001). Historical overfishing and the recent collapse of coastal ecosystems. Science 293, 629–637. doi: 10.1126/science.1059199
Jensen, M. P., Allen, C. D., Eguchi, T., Bell, I. P., LaCasella, E. L., Hilton, W. A., et al. (2018). Environmental warming and feminization of one of the largest sea turtle populations in the world. Curr. Biol. 28, 154–159.
Lamont, M. M., Percival, H. F., and Colwell, S. V. (2002). Influence of vehicle tracks on loggerhead hatchling seaward movement along a northwest Florida Beach. Florida Field Naturalist 30, 77–109.
Limpus, C., and Casale, P. (2015). Caretta caretta (South Pacific subpopulation). The IUCN Red List of Threatened Species 2015: e.T84156809A84156890. Available online at: https://dx.doi.org/10.2305/IUCN.UK.2015-4.RLTS.T84156809A84156890.en (accessed May 31, 2020).
Mancini, A., Phillott, A., and Rees, A. (2019). Green Turtles. Chelonia mydas (North Indian Ocean Subpopulation). Available online at: https://dx.doi.org/10.2305/IUCN.UK.2019-2.RLTS.T142121108A142122995.en (accessed August 3, 2020).
Mann, T. M. (1977). Impact of Developed Coastline on Nesting and Hatchling Sea Turtles in Southeastern Florida. Unpublished M.S. thesis, Florida Atlantic University, Boca Raton, FL.
Mazaris, A. D., Kallimanis, A. S., Pantis, J. D., and Hays, G. C. (2013). Phenological response of sea turtles to environmental variation across a species’ northern range. Proc. R. Soc. B Biol. Sci. 280:20122397. doi: 10.1098/rspb.2012.2397
Mazaris, A. D., Schofield, G., Gkazinou, C., Almpanidou, V., and Hays, G. C. (2017). Global sea turtle conservation successes. Sci. Adv. 3:e1600730. doi: 10.1126/sciadv.1600730
Metcalfe, K., Collins, T., Abernethy, K. E., Boumba, R., Dengui, J. C., Miyalou, R., et al. (2017). Addressing uncertainty in marine resource management; combining community engagement and tracking technology to characterize human behavior. Conserv. Lett. 10, 460–469.
Miller, J. (1997). “Reproduction in sea turtles,” in The Biology of Sea Turtles, eds P. Lutz and J. Musick (New York, NY: CRC Press), 51–82.
Miller, J. D., Limpus, C. J., and Godfrey, M. H. (2003). “Nest site selection, oviposition, eggs, development, hatching, and emergence of loggerhead turtles,” in Loggerhead Sea Turtles, eds A. B. Bolten and B. E. Witherington (Washington, DC: Smithsonian Books), 125–143.
Ministry of Agriculture and Fisheries Wealth (2013). Ministerial Decree No. 368/20. Muscat: Ministry of Agriculture and Fisheries Wealth, Sultanate of Oman.
Ministry of Agriculture and Fisheries Wealth (2018). Fisheries Statistics Book. Muscat: Ministry of Agriculture and Fisheries Wealth, Sultanate of Oman.
Moqbil, A. A. (2007). Marine Turtle Activities in the Republic of Yemen, IOSEA Profile of the Month. Available online at: http://www.ioseaturtles.org/pom_detail.php?id=54 (accessed June 7, 2018).
Morecroft, M. D. (2012). Adapting conservation to a changing climate. J. Appl. Ecol. 49, 546–546. doi: 10.1111/j.1365-2664.2012.02147.x
Murphy, T. M., and Hopkins-Murphy, S. R. (1990). “Homing of translocated gravid loggerhead turtles,” in Proceedings of the 10th Annual Workshop on Sea Turtle Biology and Conservation. NOAA Technical Memorandum NMFS-SEFC-278, Miami, FL, 123–124.
National Centre for Statistics and Information [NCSI] (2019). Wilayat Masirah Total Population. Available online at: https://data.gov.om/OMPOP2016/population (accessed May 20, 2020).
National Marine Fisheries Service [NMFS] and US Fish and Wildlife Service [USFWS] (2008). Recovery Plan for the Northwest Atlantic Population of the Loggerhead Sea Turtle (Caretta caretta). Second revision. Silver Spring, MD: National Marine Fisheries Service, 325.
Nel, R., and Casale, P. (2015). Caretta Caretta (South West Indian Ocean Subpopulation). The IUCN Red List of Threatened Species. Cambridge: IUCN Global Species Programme Red List Unit.
Nester, L. R. (2006). Effects of Off-road Vehicles on the Nesting Activity of Loggerhead Sea Turtles in North Carolina. Masters dissertation, University of Florida, Gainesville, FL.
Patino-Martinez, J., Marco, A., Quinones, L., and Hawkes, L. A. (2014). The potential future influence of sea level rise on leatherback turtle nests. J. Exp. Mar. Biol. Ecol. 461, 116–123. doi: 10.1016/j.jembe.2014.07.021
Pfaller, J. B., Bjorndal, K. A., Chaloupka, M., Williams, K. L., Frick, M. G., and Bolten, A. B. (2013). Accounting for imperfect detection is critical for inferring marine turtle nesting population trends. PLoS One 8:e62326. doi: 10.1371/journal.pone.0062326
Phillips, K. F., Mansfield, K. L., Die, D. J., and Addison, D. S. (2014). Survival and remigration probabilities for loggerhead turtles (Caretta caretta) nesting in the eastern Gulf of Mexico. Mar. Biol. 161, 863–870. doi: 10.1007/s00227-013-2386-2
Pike, D. A. (2008). Natural beaches confer fitness benefits to nesting marine turtles. Biol. Lett. 4, 704–706. doi: 10.1098/rsbl.2008.0359
Pike, D. A., Roznik, E. A., and Bell, I. (2015). Nest inundation from sea-level rise threatens sea turtle population viability. R. Soc. Open Sci. 2:150127. doi: 10.1098/rsos.150127
Pilcher, N. J., and Saad, M. A. (1999). Sea Turtles of Socotra. Report to the Senckenberg Research Institute. Frankfurt: Senckenberg Research Institute.
Rees, A. F., Al Saady, S., Broderick, A. C., Coyne, M. S., Papathanasopoulou, N., and Godley, B. J. (2010). Behavioural polymorphism in one of the world’s largest populations of loggerhead sea turtles Caretta caretta. Mar. Ecol. Prog. Series 418, 201–212. doi: 10.3354/meps08767
Rees, A. F., and Baker, S. L. (2006). Hawksbill and olive ridley nesting on Masirah Island, Sultanate of Oman: an update. Mar. Turtle Newslett. 113, 2–5.
Rhodin, A., Thomson, S., Georgalis, G., Karl, H.-V., Danilov, I., Takahashi, A., et al. (2015). Turtles and Tortoises of the World During the Rise and Global Spread of Humanity: First Checklist and Review of Extinct Pleistocene and Holocene Chelonians. Available online at: https://iris.unito.it/retrieve/handle/2318/1637061/330650/Rhodin%20et%20at.%2C%20TEWG%2C%202015%20-%20Copia.pdf (accessed April 16, 2015).
Richards, P. M., Epperly, S. P., Heppell, S. S., King, R. T., Sasso, C. R., Moncada, F., et al. (2011). Sea turtle population estimates incorporating uncertainty: a new approach applied to western North Atlantic loggerheads Caretta. Endang. Spec. Res. 15, 151–158. doi: 10.3354/esr00379
Roberts, J. D., and Hamann, M. (2016). Testing a recipe for effective recovery plan design: a marine turtle case study. Endang. Spec. Res. 31, 147–161. doi: 10.3354/esr00755
Ross, J. P. (1979). Sea Turtles in the Sultnate of Oman. Muscat: World Wildlife Fund Project 1320 Report.
Ross, J. P. (1987). Sea Turtle Management Plan for the Sultanate of Oman. Muscat: Marine Science and Fisheries Centre, Ministry of Agriculture and Fisheries.
Ross, J. P. (1997). “Estimations of the nesting population size of loggerhead sea turtles, Caretta caretta, Masirah Island, Sultanate of Oman,” in Proceedings of the Seventeenth Annual Sea Turtle Symposium. NOAA Technical Memorandum NMFS SEFSC 415, eds S. P. Epperly and J. Braun (Orlando, FL: NOAA), 84–87.
Ross, J. P., and Barwani, M. A. (1982). “Review of sea turtles in the Arabian area,” in Biology and Conservation of Sea Turtles, ed. K. A. Bjorndal (Washington, DC: Smithsonian Institution Press), 373–383.
Salm, R. V. (1991). Turtles in Oman: Status, Threats and Management Options. Scientific Results of the IUCN Coastal Zone Management Project. Muscat: IUCN/Ministry of Commerce and Industry.
Salm, R. V., Jensen, R. A. C., and Papastravou, V. A. (1993). Marine Fauna of Oman: Cetaceans, Turtles, Seabirds and Shallow Water Corals. Gland, Switzerland: IUCN, 66.
Sarma, Y. V. B., Al-Hashmi, K., and Smith, S. L. (2013). Sea surface warming and its implications for harmful algal blooms off Oman. Int. J. Mar. Sci. 3, 65–71.
Schroeder, B. A., Foley, A. M., and Bagley, D. A. (2003). “Nesting patterns, reproductive migrations, and adult foraging areas of loggerhead turtles,” in Loggerhead Sea Turtles, eds A. B. Bolten and B. E. Witherington (Washington, DC: Smithsonian Books), 114–124.
Scott, R., Marsh, R., and Hays, G. C. (2012). Life in the really slow lane: loggerhead sea turtles mature late relative to other reptiles. Funct. Ecol. 26, 227–235. doi: 10.1111/j.1365-2435.2011.01915.x
Sebastian, M., and Behera, M. R. (2015). Impact of SST on tropical cyclones in North Indian Ocean. Proc. Eng. 116, 1072–1077. doi: 10.1016/j.proeng.2015.08.346
Shamblin, B. M., Bolten, A. B., Abreu-Grobois, F. A., Bjorndal, K. A., Cardona, L., Carreras, C., et al. (2014). Geographic patterns of genetic variation in a broadly distributed marine vertebrate: New insights into loggerhead turtle stock structure from expanded mitochondrial DNA sequences. PLoS One 9:e85956. doi: 10.1371/journal.pone.0085956
Silva, E., Marco, A., Graça, J., da, Pérez, H., Abella, E., Patino-Martinez, J., et al. (2017). Light pollution affects nesting behavior of loggerhead turtles and predation risk of nests and hatchlings. J. Photochem. Photobiol. 173, 240–249. doi: 10.1016/j.jphotobiol.2017.06.006
Snover, M. L., and Heppell, S. S. (2009). Application of diffusion approximation for risk assessments of sea turtle populations. Ecol. Appl. 19, 774–785. doi: 10.1890/07-1111.1
Spotila, J. R., Reina, R. D., Steyermark, A. C., Plotkin, P. T., and Paladino, F. V. (2000). Pacific leatherback turtles face extinction. Nature 405:529. doi: 10.1038/35014729
Squires, D., Restrepo, V., Garcia, S., and Dutton, P. H. (2018). Fisheries bycatch reduction within the least-cost biodiversity mitigation hierarchy: conservatory offsets with an application to sea turtles. Mar. Policy 93, 55–61. doi: 10.1016/j.marpol.2018.03.018
Tapilatu, R. F., Dutton, P. H., Tiwari, M., Wibbels, T., Ferdinandus, H. V., Iwanggin, W. G., et al. (2013). Long-term decline of the western Pacific leatherback, Dermochelys coriacea: a globally important sea turtle population. Ecosphere 4, 1–15.
Tapilatu, R. F., and Tiwari, M. (2007). Leatherback turtle, Dermochelys coriacea, hatching success at Jamursba-Medi and Wermon beaches in Papua, Indonesia. Chelonian Conserv. Biol. 6, 154–158. doi: 10.2744/1071-8443(2007)6[154:ltdchs]2.0.co;2
Thomas, L. (1996). Monitoring long-term population change: why are there so many analysis methods. Ecology 77, 49–58. doi: 10.2307/2265653
Tiwari, M., Baldwin, R., Al Kiyumi, A., Willson, M. S., Willson, A., and Possardt, E. (2018). Satellite telemetry studies on nesting loggerhead turtles in Oman. Indian Ocean Turtle Newslett. 28, 20–22.
Tiwari, M., Dutton, D. L., and Garner, J. A. (2011). Nest Relocation: a Necessary Management tool for Western Pacific Leatherback Nesting Beaches. Conservation and Sustainable Management of Sea Turtles in the Pacific Ocean. Hawaii: University of Hawaii Press, 87–96.
Tomas, J., Aznar, F. J., and Raga, J. A. (2001). Feeding ecology of the loggerhead turtle Caretta caretta in the western Mediterranean. J. Zool. 255, 525–532. doi: 10.1017/s0952836901001613
Tucek, J., Nel, R., Girondot, M., and Hughes, G. (2014). Age-size relationship at reproduction of South African female loggerhead turtles Caretta caretta. Endang. Species Res. 23, 167–175. doi: 10.3354/esr00562
Tucker, A. D., Baldwin, R., Willson, A., Al Kiyumi, A., Al Harthi, S., Schroeder, B., et al. (2018). Revised clutch frequency estimates for Masirah Island loggerhead turtles (Caretta caretta). Herpetol. Conserv. Biol. 13, 158–166.
USFWS NOAA (2011). Endangered and Threatened Species; Determination of Nine Distinct Population Segments of Loggerhead Sea Turtles as Endangered or Threatened. 76 Federal Register 184: 58868–58952. Washington, DC: US Fish and Wildlife Service USA.
Van Houtan, K., and Bass, O. (2007). Stormy oceans are associated with declines in sea turtle hatching. Curr. Biol. 17, R590–R591.
Wallace, B. P., DiMatteo, A. D., Bolten, A. B., Chaloupka, M. Y., Hutchinson, B. J., Abreu-Grobois, F. A., et al. (2011). Global conservation priorities for marine turtles. PLoS One 6:e24510. doi: 10.1371/journal.pone.0024510
Wallace, B. P., DiMatteo, A. D., Hurley, B. J., Finkbeiner, E. M., Bolten, A. B., Chaloupka, M. Y., et al. (2010a). Regional management units for marine turtles: a novel framework for prioritizing conservation and research across multiple scales. PLoS One 5:e15465. doi: 10.1371/journal.pone.0015465
Wallace, B. P., Kilham, S. S., Paladino, F. V., and Spotila, J. R. (2006). Energy budget calculations indicate resource limitation in Eastern Pacific leatherback turtles. Mar. Ecol. Prog. Ser. 318, 263–270. doi: 10.3354/meps318263
Wallace, B. P., Lewison, R. L., McDonald, S. L., McDonald, R. K., Kot, C. Y., Kelez, S., et al. (2010b). Global patterns of marine turtle bycatch. Conserv. Lett. 3, 131–142.
Webster, P. J., Holland, G. J., Curry, J. A., and Chang, H.-R. (2005). Changes in tropical cyclone number, duration, and intensity in a warming environment. Science 309, 1844–1846.
Wheelan, R. (2013). How Does Artificial Light Affect Loggerhead Sea Turtle Hatchlings (Caretta caretta) on Masirah Island, Sultanate of Oman? B.Sc. dissertation, Bournemouth University, Poole.
Williams, A. J., Georgeson, L., Summerson, R., Hobday, A., Hartog, J., Fuller, M., et al. (2018). Assessment of the Vulnerability of Sea Turtles to IOTC Tuna Fisheries. Available online at: https://www.iotc.org/documents/WPEB/14/40 (accessed August 28, 2018).
Wilson, S. C. (2000). “Northwest Arabian Sea and Gulf of Oman,” in Seas at the Millennium: an Environmental Evaluation: Volume II Regional Chapters: The Indian Ocean to the Pacific. Pergamon, ed. C. R. C. Sheppard (Oxford: Elsevier), 17–33.
Witherington, B., Kubilis, P., Brost, B., and Meylan, A. (2009). Decreasing annual nest counts in a globally important loggerhead sea turtle population. Ecol. Appl. 19, 30–54.
Witt, M. J., Hawkes, L. A., Godfrey, M. H., Godley, B. J., and Broderick, A. C. (2010). Predicting the impacts of climate change on a globally distributed species: the case of the loggerhead turtle. J. Exp. Biol. 213, 901–911.
World Bank (2015). Sustainable Management of the Fisheries Sector in Oman. A Vision for Shared Prosperity. World Bank Advisory Assignment, World Bank Group, Washington D.C. and Minisry of Agriculture and Fisheries Wealth Sultanate of Oman. December 2015. Washington, DC: World Bank.
World Meteorological Organization [WMO] (2020). World Weather Information Service, Official Forecasts, Masirah, Oman. Available online at: https://worldweather.wmo.int/en/city.html?cityId=1408 (accessed May 20, 2020).
Keywords: Caretta caretta, nest count, population trend, threats, conservation management, Northwest Indian Ocean Regional Management Unit
Citation: Willson A, Witherington B, Baldwin R, Tiwari M, Al Sariri T, Al Kiyumi A, Al Harthi S, Willson MS, Al Bulushi A, Al Farsi G, Al Humaidy J, Al Araimi J, Daar LA, Schroeder B, Ross JP and Possardt E (2020) Evaluating the Long-Term Trend and Management of a Globally Important Loggerhead Population Nesting on Masirah Island, Sultanate of Oman. Front. Mar. Sci. 7:666. doi: 10.3389/fmars.2020.00666
Received: 02 April 2020; Accepted: 22 July 2020;
Published: 21 August 2020.
Edited by:
Michele Thums, Australian Institute of Marine Science (AIMS), AustraliaReviewed by:
Andrea Ursula Whiting, Independent Researcher, Perth, AustraliaRonel Nel, Nelson Mandela University, South Africa
Copyright © 2020 Willson, Witherington, Baldwin, Tiwari, Al Sariri, Al Kiyumi, Al Harthi, Willson, Al Bulushi, Al Farsi, Al Humaidy, Al Araimi, Daar, Schroeder, Ross and Possardt. This is an open-access article distributed under the terms of the Creative Commons Attribution License (CC BY). The use, distribution or reproduction in other forums is permitted, provided the original author(s) and the copyright owner(s) are credited and that the original publication in this journal is cited, in accordance with accepted academic practice. No use, distribution or reproduction is permitted which does not comply with these terms.
*Correspondence: Andrew Willson, YW5keS53aWxsc29uQDVvZXMuY29t; YW5keXdpbGxzb25AZ21haWwuY29t