 Amit Sarkar1,2*
 Syed Wajih Ahmad Naqvi1,3Gaute Lavik4Anil Pratihary1,4Hema Naik1Gayatri Shirodkar1Marcel M. M. Kuypers4
- 1CSIR-National Institute of Oceanography, Dona Paula, India
- 2Kuwait Institute for Scientific Research, Salmiya, Kuwait
- 3Council of Scientific & Industrial Research, New Delhi, India
- 4Max Planck Institute for Marine Microbiology, Bremen, Germany
The western Indian continental shelf houses the world’s largest naturally formed coastal low-oxygen zone that develops seasonally during the summer monsoon. We investigated multiple reductive nitrogen transformation pathways and quantified their rates in this system through anaerobic incubations with additions of 15N-labeled substrates during the anoxic period for three consecutive years (2008–2010). Addition of 15N labeled ammonium (15NH4+) resulted in low to moderate anaerobic ammonia oxidation (Anammox) rates in about half of our incubations from the oxygen depleted waters. In contrast, incubations with labeled nitrite (15NO2–) led to large production of 30N2 over 29N2 in all incubation experiments, indicating denitrification to be the dominant N-loss pathway. Rates of dissimilatory nitrate/nitrite reduction to ammonium (DNRA) were found to be highly variable and were lower by an order of magnitude than the denitrification rates. Extrapolation of average rates over the sampling periods and volume of anoxic waters showed large nitrogen removal (3.70–11.1 Tg year–1) which is about three times as high as the previously reported estimate (1.3–3.8 Tg year–1). Despite the small area it occupies, this shallow seasonal anoxic zone may account for as much as 20–60% the of the total annual fixed nitrogen loss in the perennial oxygen minimum zone of the Arabian Sea.
Introduction
As in other parts of the North Indian Ocean, hydrography and biogeochemistry over the western Indian continental shelf (WICS) are also dominated by seasonal reversals of surface currents associated with the monsoons (Schott and McCreary, 2001; Naqvi et al., 2006a). During the winter or the Northeast Monsoon (NEM) the West India Coastal Current (WICC) anomalously flows poleward, causing downwelling and oligotrophic, well-oxygenated conditions off the Indian west coast. By contrast, the region behaves as a mini eastern boundary upwelling system during the summer or the Southwest Monsoon (SWM) when the WICC flows toward the equator. The equatorward flow induces upwelling, which is weak except off the southwest coast of India and the west coast of Sri Lanka where winds are more favorable. As a result, there is only modest enhancement of primary productivity and consequent oxygen demand in near-bottom waters (Naqvi et al., 2010a). However, despite moderate oxygen demand there are several factors that contribute to development of intense anoxia in near bottom waters: (1) The upwelled water, derived from the upper part of the mesopelagic oxygen minimum zone of the Arabian Sea is oxygen-depleted to begin with, although not anoxic; (2) Due to slow upwelling the upwelled water remains over the shelf for a long time; and (3) The cold, saline upwelled water is capped by a thin (<10 m) warm, fresher lens, unusual for any upwelling system, formed due to intense precipitation in the coastal zone during the SWM, resulting in very strong stratification very close to the surface, thereby greatly restricting oxygen diffusion from the surface. The exact time of formation of this coastal OMZ varies strongly. It seems to gradually evolve from the south to the north. Upwelling along the WICS has been reported to start in the south (8oN, off Cochin) probably during spring (in March) (Stramma et al., 1996; Schott and McCreary, 2001), gradually extending northward. In the north (19oN, off Mumbai) the effect of upwelling is felt at least until early December (Naik, 2003; Shankar et al., 2005). This time span far exceeds the duration of the SWM. However, strong water column stratification starts in June due to intense rainfall in coastal areas, which facilitates the formation of the low oxygen zone. The oxygen deficiency intensifies with time resulting in the prevalence of reducing conditions – conversion the oxidized nitrogen to molecular nitrogen (N2) followed by reduction of sulfate (SO42–) to hydrogen sulfide (H2S) – by July–August. In the north (e.g., off Mumbai) such conditions develop later in the season and last up to October–November. Thus, overall, reducing conditions over the WICS prevail for at least 3 months (90 days) (Naik, 2003; Naqvi et al., 2006b). These processes operate over a large geographical area, making the WICS the single largest low-oxygen system of its kind in the world, occupying an area of ∼200,000 km2 (O2 < 20 μM) – an order of magnitude bigger than the area of the famous dead zone of the Gulf of Mexico (area with O2 < 62.5 μM: 22,000 km2 – Rabalais et al., 2010). The shallow anoxic zone in the eastern Arabian Sea is believed to provide significant feedback to the global climate change through unusually high emissions of N2O (nitrous oxide) and DMS (dimethyl sulfide) (Naqvi et al., 2000; Shenoy et al., 2012).
As evident from the chemical data – a decrease in nitrate (NO3–) and a concomitant accumulation of nitrite (NO2–) – reductive nitrogen removal from this system typically begins to occur during the later phase of the SWM in July/August and continues till October/early November (Naqvi et al., 2009). The reducing zones can be categorized into “suboxic” (functionally identified by the presence of secondary NO2–, although it must be pointed out that recent work by Thamdrup et al. (2012) has shown that the secondary NO2–-bearing waters are also functionally anoxic) and anoxic (sulfidic); these zones are geographically separated, often located over the mid- and inner parts of the shelf (Naqvi et al., 2009). Direct measurements of N-loss rates and the processes involved are very scarce from WICS. Heterotrophic denitrification (NO3–→NO2–→NO→N2O→N2), in which bacteria use NO3– as an electron acceptor for organic matter oxidation (Froelich et al., 1979), was long believed to be the only process removing fixed nitrogen from the ocean, until anammox was recognized to be another major N-loss pathway (Dalsgaard et al., 2003; Kuypers et al., 2003). In previous studies undertaken over the WICS, rates reaching up to 837 nmol L–1 d–1 were determined based on changes in NO3– + NO2– concentration over time at fixed sampling locations (Naik, 2003). Similar rate was also calculated assuming that the initial NO3– content of 20 μM in the upwelled water was fully utilized over a month (Naqvi et al., 2006b). Overall annual N-loss in the range of 1.2–3.6 Tg was arrived at by scaling up these rates to the entire shelf for the duration of the seasonal anoxia. However, these estimates should be considered as minimum estimates as replenishment of the nitrate pool had not been taken into account. Devol et al. (2006) estimated N-loss at a few coastal stations by incubating samples spiked with 15NO3– on board ship and measuring the growth of 15N-labeled N2. The average rate was found to be to 33.2 nmol N L–1 d–1. The highest rate measured by these authors was 207 nmol N L–1 d–1, only about a quarter of the rate inferred from the overall changes in the nutrient concentrations. However, these measurements suffered from several uncertainties. For example, they did not take into account the possible N-loss through anammox. Moreover, the signal of labeled N2 produced from 15NO3– may be significantly diluted due to mixing of 15NO2–, originated during the first step of denitrification pathway, with high ambient substrate pool of 14NO2–. This may lead to underestimation (Holtappels et al., 2011). Also, none of the studies undertaken so far have considered the dissimilatory nitrate/nitrite reduction to ammonium (DNRA) that could have major implications for the estimation of the N-loss by labeling experiments (Jensen et al., 2011; Song et al., 2016) as well as for the estimates based on temporal changes in nitrate concentration (i.e., while DNRA removes NO3– or NO2–, it is not an N-loss process). Moreover, dissolved inorganic nitrogen (DIN) loading in this region is believed to have significantly increased in recent years due to enhanced synthetic fertilizer consumption in South Asia (∼17 × 1012 g N a–1), exhibiting an increase by factor of 50 since 1960s (Naqvi et al., 2009). Seitzinger et al. (2005) estimated that the South Asian rivers could account for as much as 4.2 Tg year–1 of the global riverine DIN input of 20.8 tgN year–1 to the ocean in 1990. However, the concentrations of NO3– reported from some of the rivers draining into the Arabian Sea are quite moderate (e.g., 8–9 μM from the Zuari estuary of Goa – Bardhan et al., 2015). In addition, Naqvi et al. (2010b) estimated annual deposition of ∼0.16 Tg of nitrogen from the atmosphere over the WICS which most probably is also increasing due to fossil fuel burning and industrialization (Duce et al., 2008). Consequently, the N-loss estimated from upwelled NO3– may be considerably lower than actual.
The main aim of the present study is to identify and quantify the multiple potential reductive nitrogen processes operating in the water column over the WICS during the period of anoxia by employing various combinations of 15N-labeled substrates. This is the first report evaluating relative contributions of denitrification and anammox to N-loss and also the significance of DNRA from this region. As the experiments were conducted for three consecutive years the results also provide an idea of the inter-annual variability.
Materials and Methods
Sampling Locations and Physicochemical Profiling of Water Column
Samples were collected from several stations located along coast-perpendicular transects during three cruises carried out from 2008 to 2010, on the Coastal Research Vessel Sagar Sukti (SaSu#183 and SaSu#205) and using a fishing trawler (CaTS#78). The period of observations was restricted to the time – from late August to late September – when severe oxygen deficiency develops over the WICS. In 2008, only the transect off Goa (15.52oN/73.76oE to 15.423oN/73.283oE) was sampled, whereas in 2009 and 2010 observations along two additional southern transects, off Karwar (14.478oN/74.25oE to 14.325oN/73.768oE) and Mangalore (13.14oN/74.64oE to 12.87oN/74.108oE), were also made (Figure 1 and Supplementary Tables S1, S2). Physicochemical characteristics of the water column (temperature, salinity, dissolved oxygen, inorganic nutrients, chlorophyll a and turbidity) were determined at each sampling site. N-loss rates were measured over the inner shelf (depth < 30 m) and mid shelf (depths 30–50 m) where strong reducing conditions prevailed.
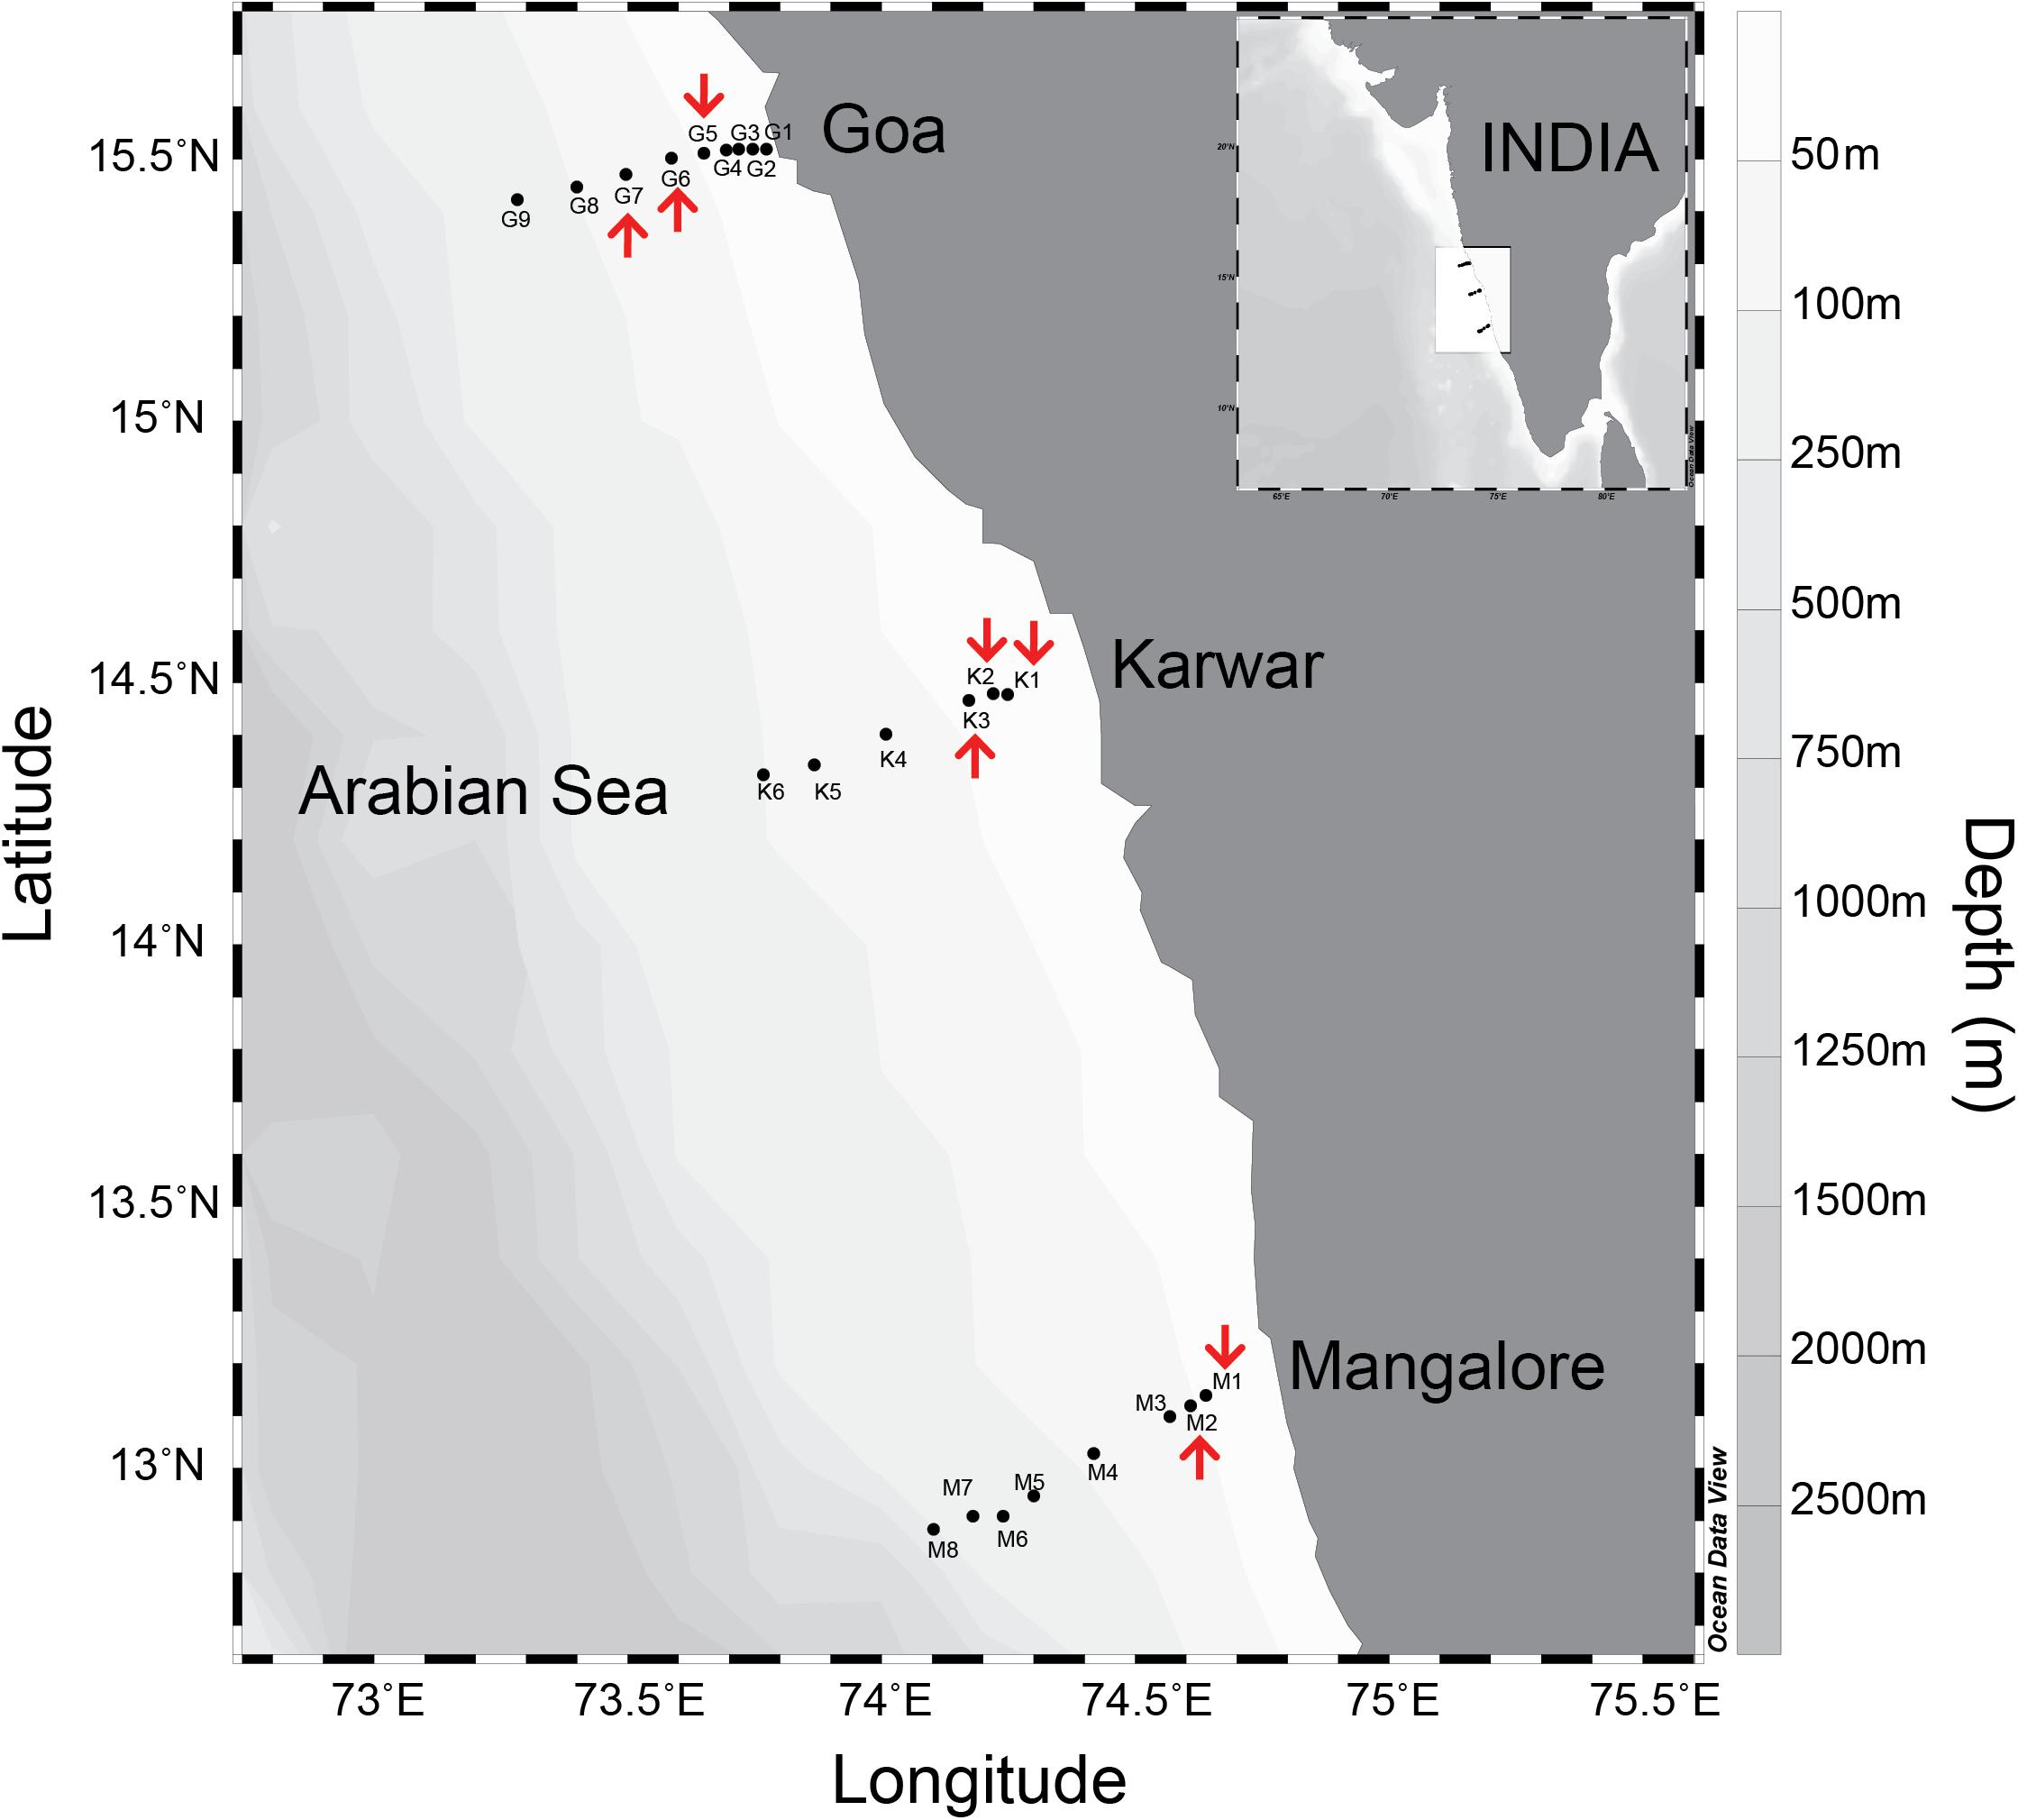
Figure 1. Study area in the eastern Arabian Sea along western continental shelf of India. Biogeochemical monitoring locations on each coast perpendicular transects are indicated by closed circle points. The stations marked with “red arrows” are where 15N-incubations experiments were performed.
A Sea-Bird Electronics CTD system (SBE 911) was used for obtaining continuous profiles of temperature and salinity. Niskin samplers (5 L) fitted with reversing thermometers and mounted on synthetic ropes were used for sampling of seawater from selected depths based on the CTD/O2 profiles. Dissolved O2 was measured in each sample following the Winkler titrimetric method (Grasshoff et al., 1983, precision < 1.34 μM). Sub-samples for nutrients (unfiltered) were frozen on Sagar Sukti cruises and stored in an ice box on the CaTS field trip for analyses in the shore laboratory using a SKALAR autoanalyzer (precisions ± 0.06, ± 0.01, ± 0.01, ± 0.01 μM for NO3–, NO2–, NH4+ and PO43–, respectively). In most cases, NO2– concentrations were also measured onboard immediately after sampling following the procedure of Bendschneider and Robinson (1952). The lower detection limit of the NO2– measurement was 0.05 μM. Deficiency in DIN was estimated from N∗(μM) = [(NO3– + NO2– + NH4+) – 16 × PO43– + 2.9] following Gruber and Sarmiento (1997). Chlorophyll a samples were collected in 1-liter amber colored HDPE bottles and were filtered immediately through glass-fiber filters (GF/F, 47 mm diameter, 0.7 μm pore size, Whatman) under low vacuum. The filter papers were soaked in 90% acetone and stored at −20°C in the dark to extract the pigments. Quantitative estimation of chlorophyll a was done after 24 h spectrofluorometrically at 655 nm wavelength (Strickland and Parsons, 1972). Precision of chlorophyll a measurement was ± 0.001 mg m–3.
Isotope Pairing Experiments
Depending on the depth and thickness of the perceived reducing layer, incubation experiments were restricted to 1–3 depths. In 2008, incubations were conducted at two stations at two depths each off Goa (Figure 2, O2 panel marked in diamond symbol). In 2009, three stations each along Goa and Karwar and 1 station off Mangalore were sampled. In 2010, three stations were sampled off Goa, two off Karwar and one off Mangalore (Figure 2, Table 1, and Supplementary Figures S2, S3). Water samples for incubation experiments were taken immediately after the retrieval of samplers in 250-ml glass serum bottles. Water approximating three times of the volume of the bottle was allowed to overflow before the sample was sealed using butyl rubber septum, taking care not to trap any air bubble, and crimped with aluminum cap. Samples were purged with helium for 20 min to reduce the background N2 concentration as well as to remove oxygen that might have been inadvertently introduced during sampling. After purging with helium for 15 min, various substrates (15NH4+, 15NO2– and 15NO2– + 14NH4+, Sigma-Aldrich stable isotope labeled products) were added to serum bottles and purging was continued for another 5 min to ensure removal of oxygen added along with the substrates and also proper mixing. The final concentration of each substrate was 8 μM. Samples were then quickly transferred into 12-ml Labco Exetainers carefully avoiding any atmospheric contamination and incubated in dark at near in situ temperature for 36–48 h. Microbial activities were terminated at approximately equal time intervals by adding 100 μl saturated HgCl2 solution after introducing 2 ml of helium headspace (Holtappels et al., 2011). Exetainers were stored upside down until analysis to prevent gas loss from the headspace through the septa.
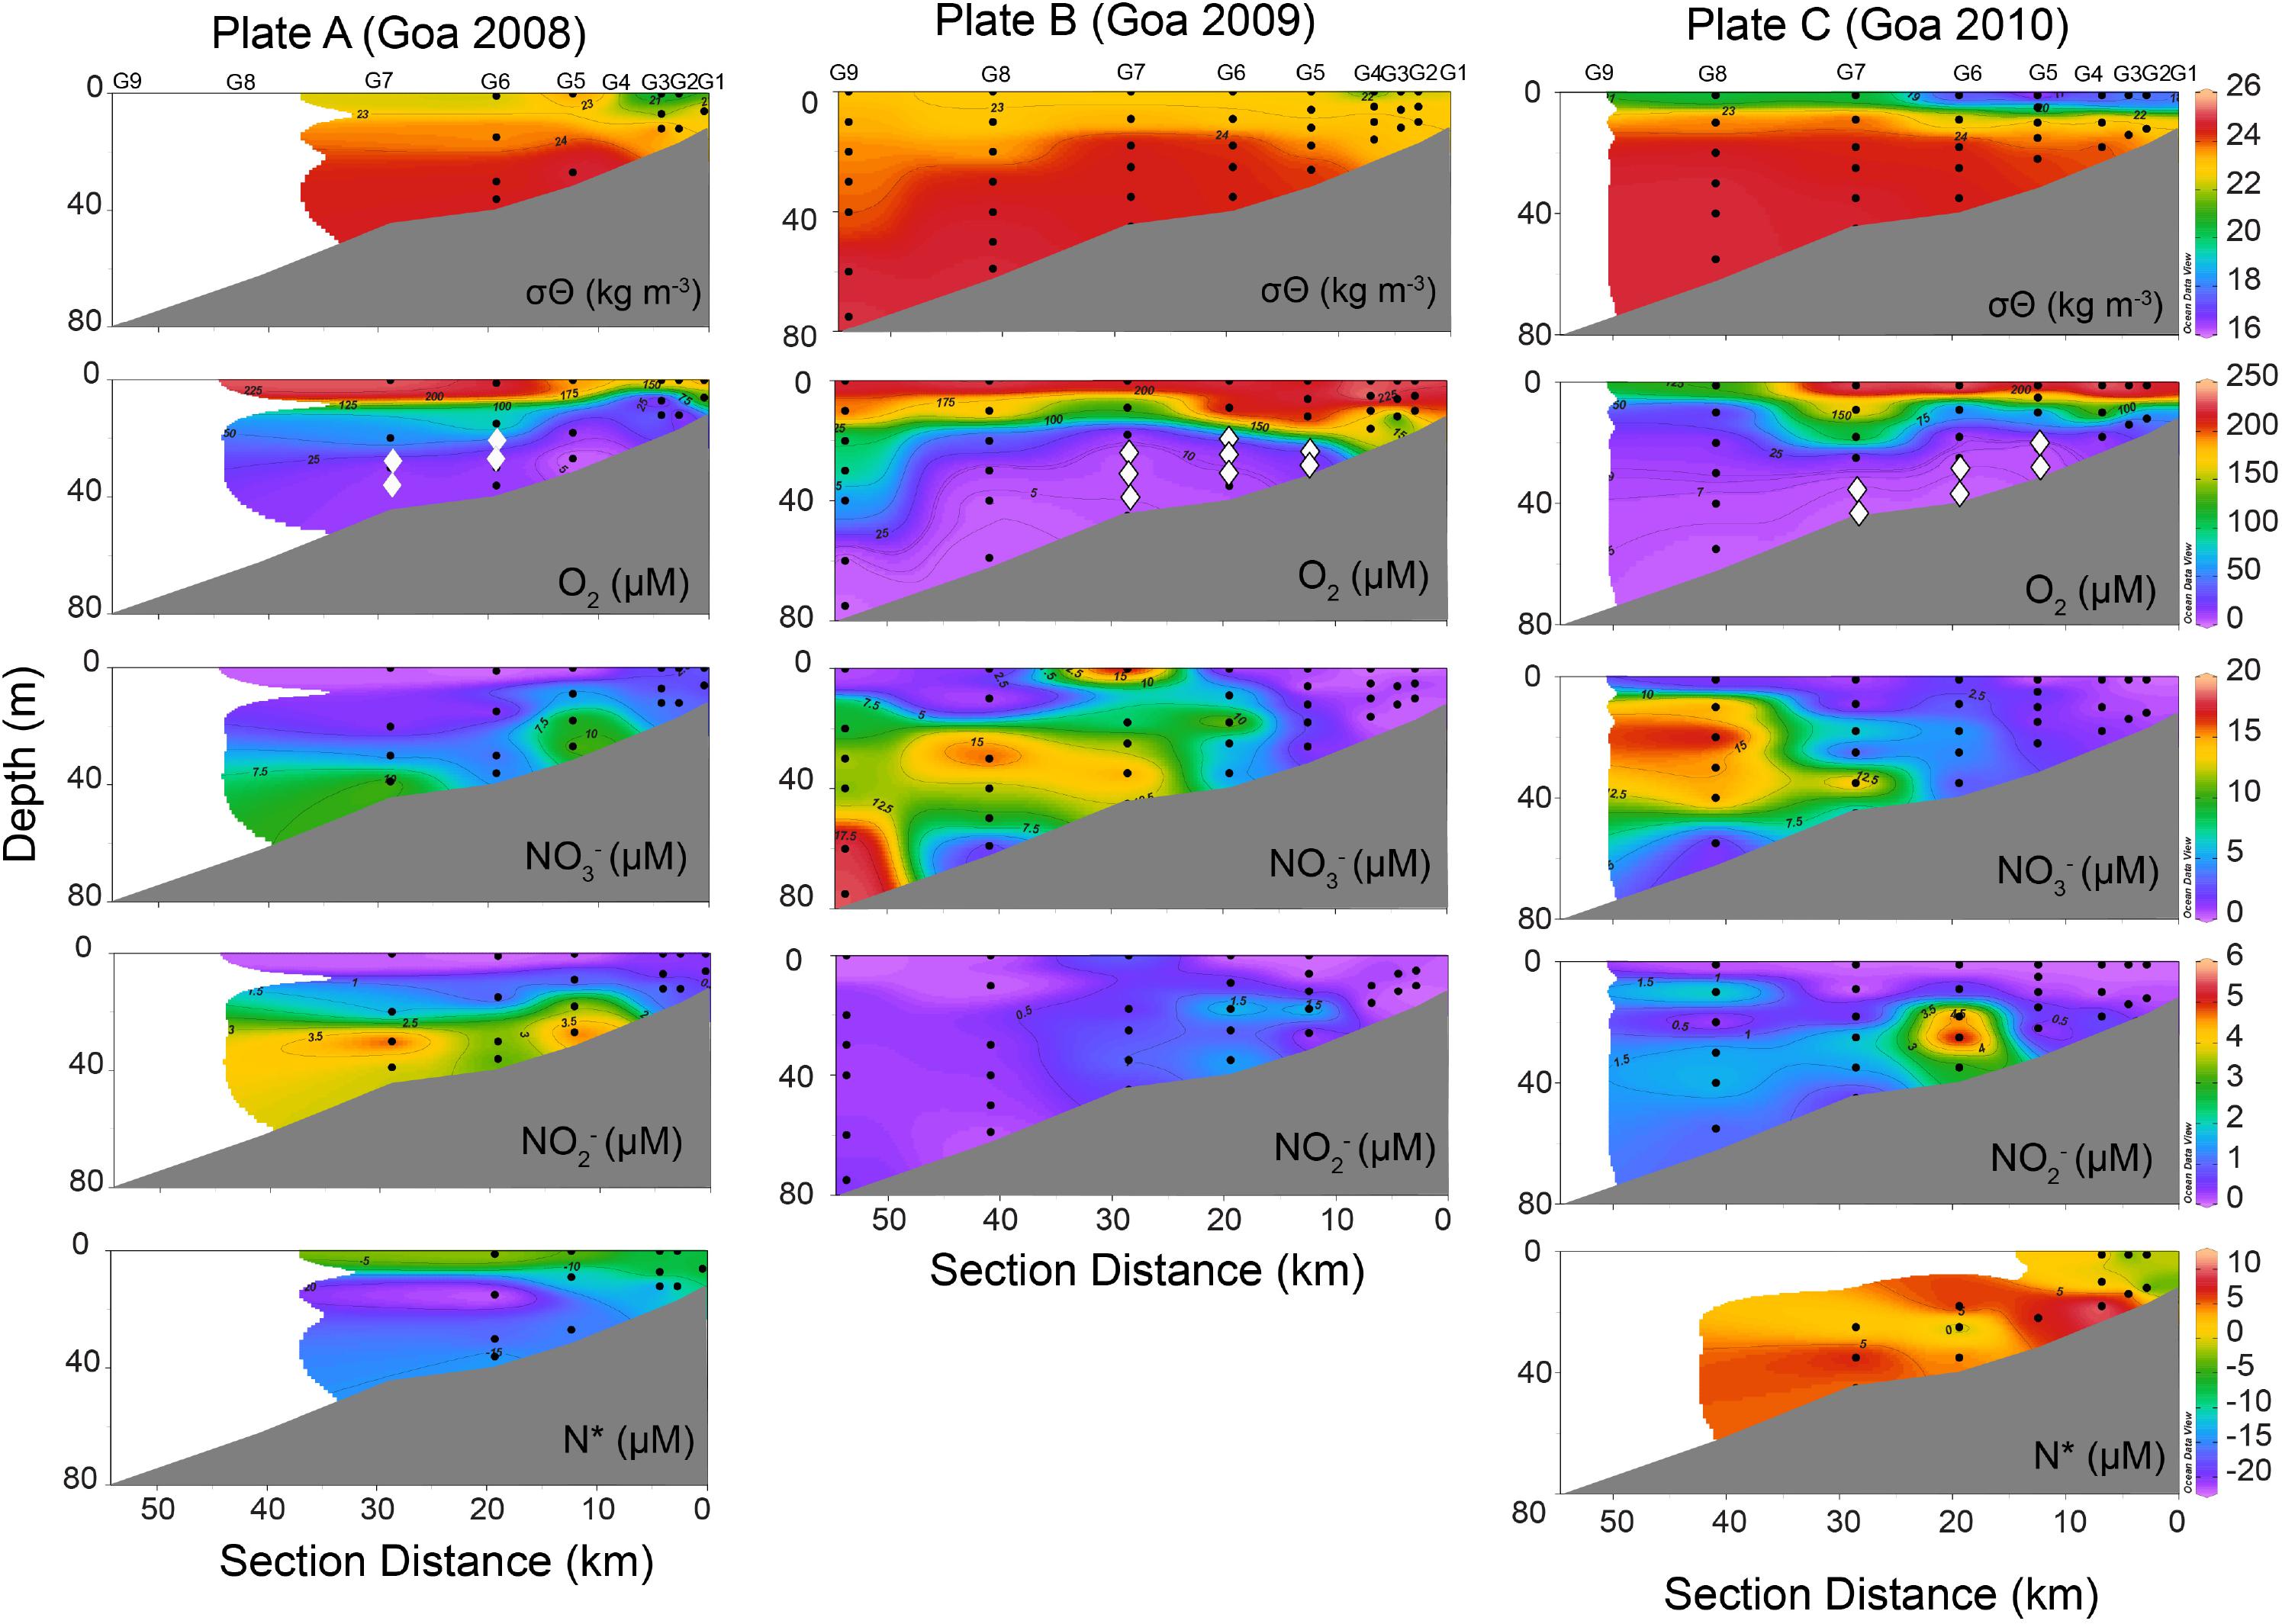
Figure 2. Distribution of physicochemical properties including potential density (σθ), dissolved oxygen (O2), nitrate (NO3–), nitrite (NO2–), and nitrogen deficit (N*) in the water column along coast perpendicular transect off Goa based on observations carried out during three consecutive years Plate A. 2008, Plate B. 2009, and Plate C. 2010. Depths marked as “diamond-◆” on O2 panels in all 3 years represents the depths where 15N-incubation experiments were conducted.
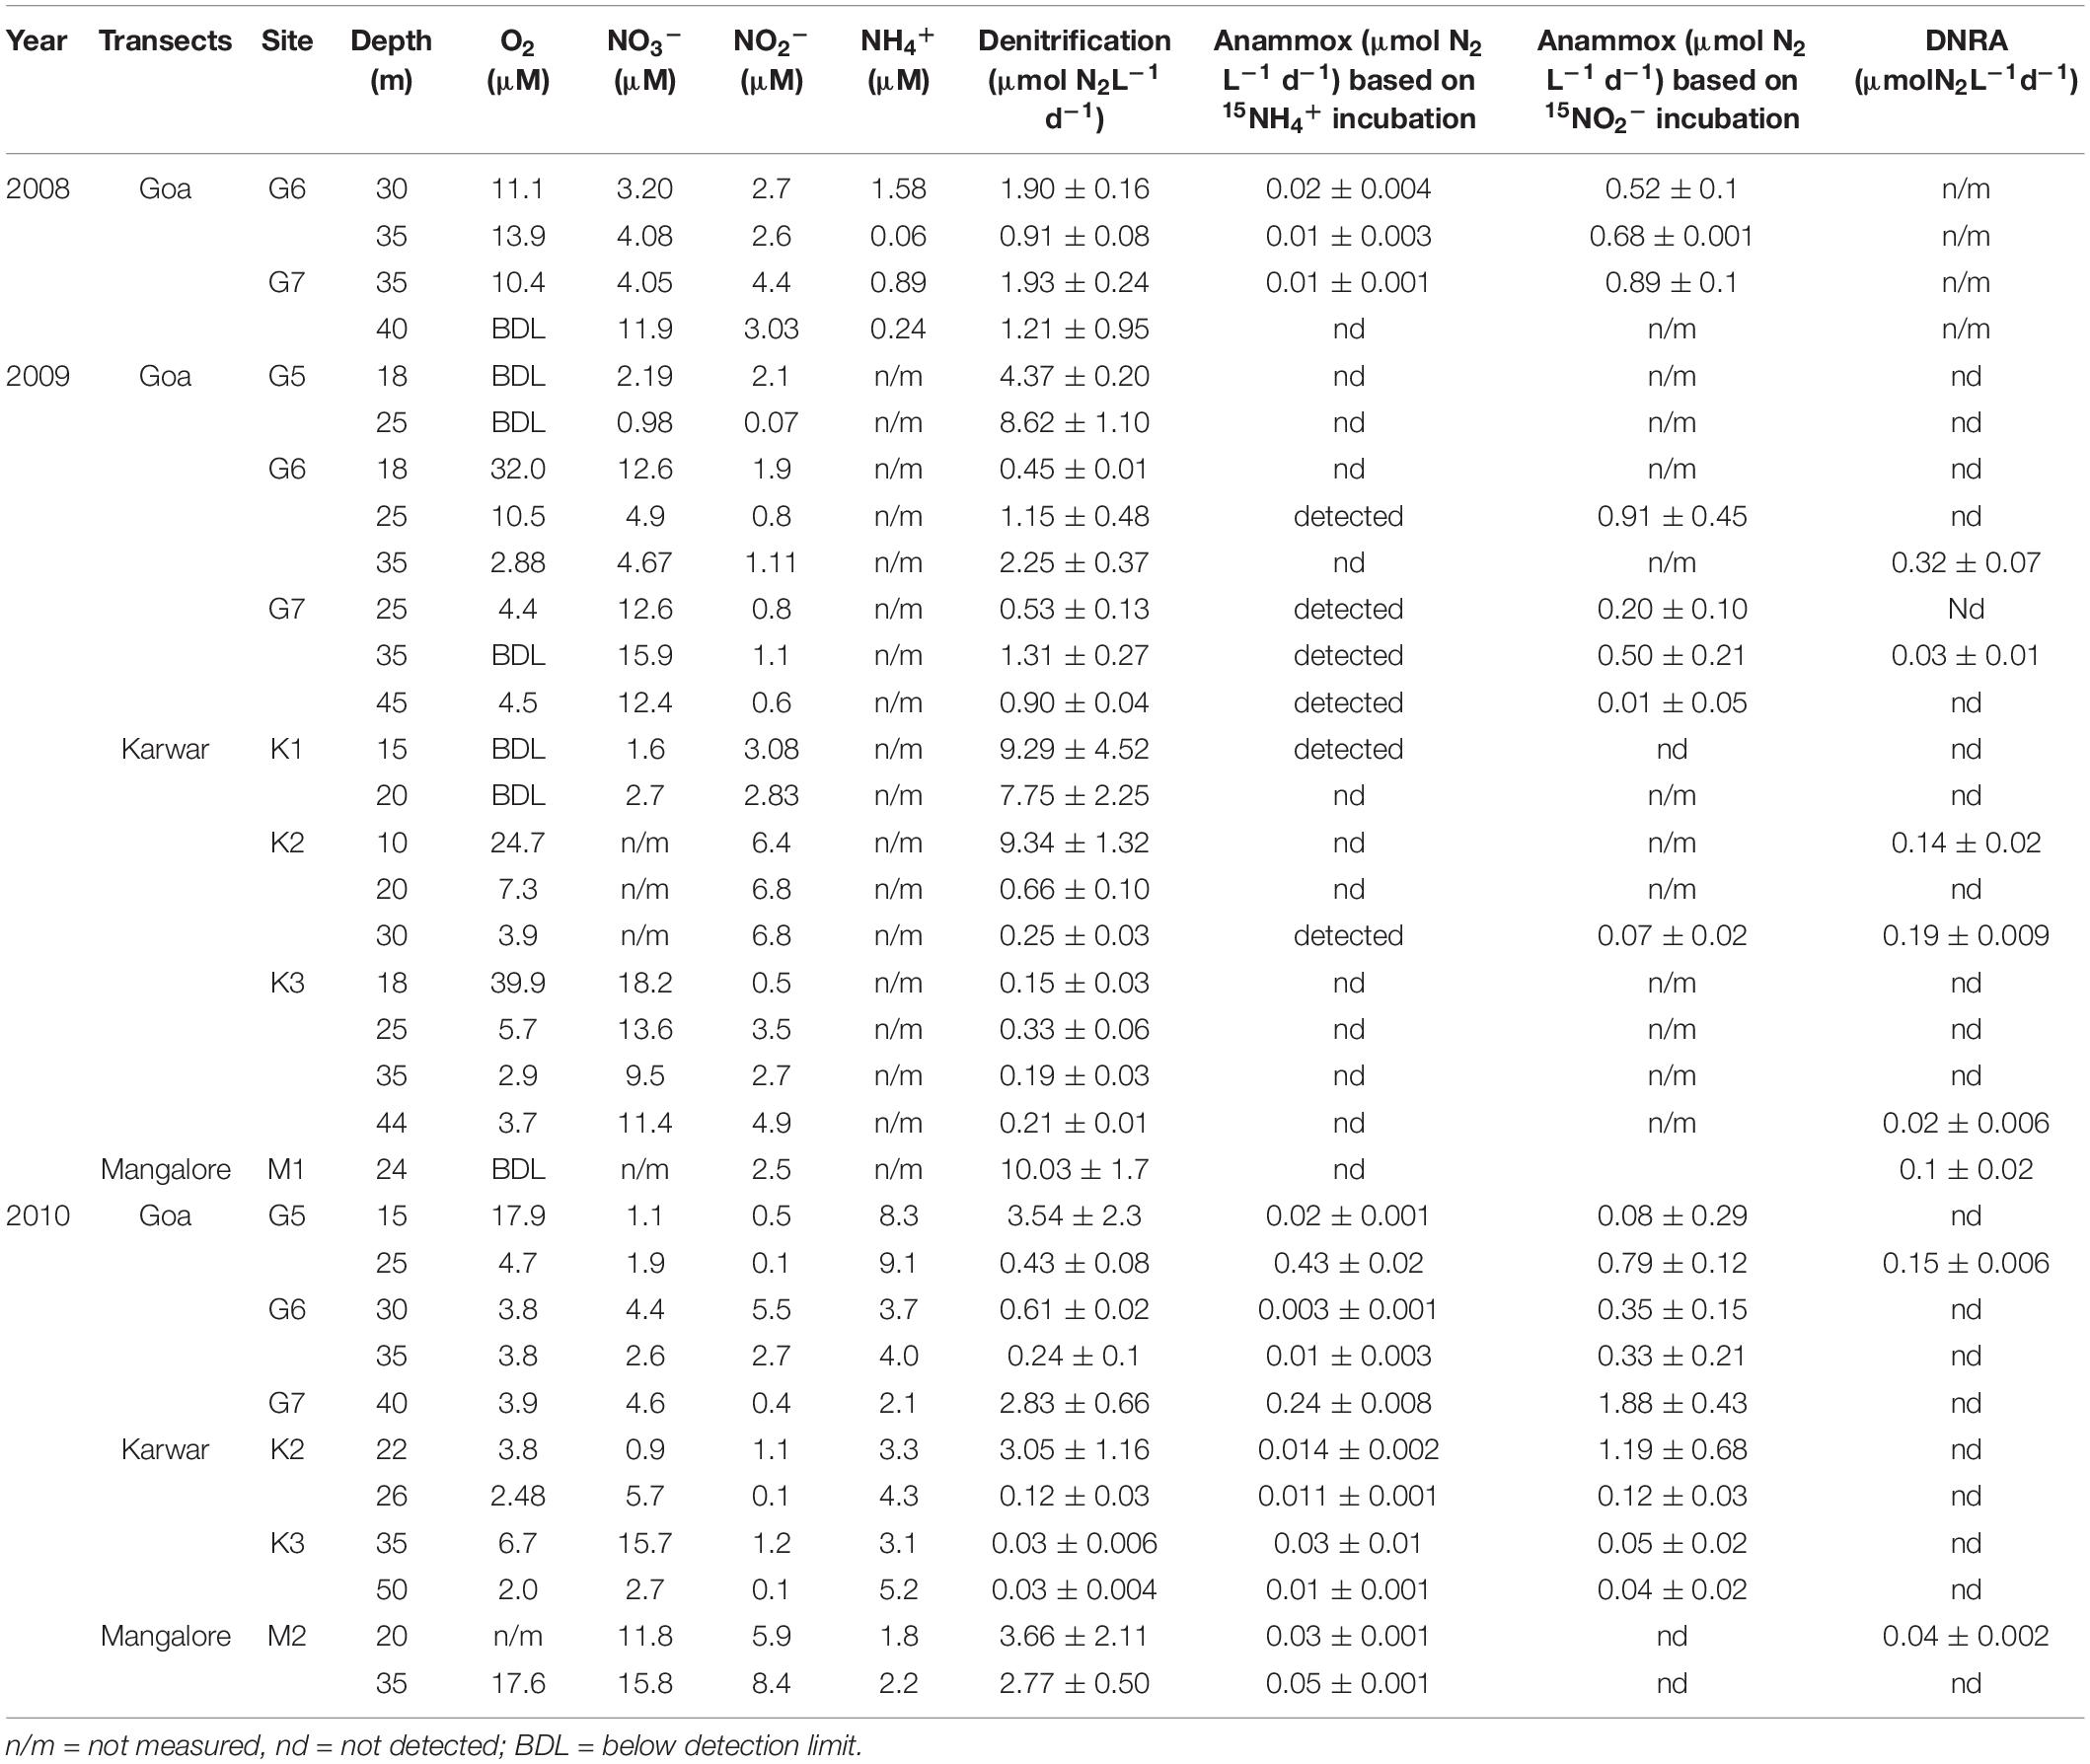
Table 1. Calculated rates (mean and stdev values) of different nitrogen transformation process (anammox rates obtained from both 15NH4+ and 15NO2− incubations) along with ancillary chemical data.
Analysis and Calculation of Denitrification, Anammox, and DNRA Rates
The stable isotopic composition of N2, measured as 28N2, 29N2, and 30N2 in the headspace, was determined within a few weeks of collection using a continuous flow mass spectrometer coupled with a custom build gas chromatograph (Fisons VG Optima, Manchester, United Kingdom). 100 μl of headspace sample was slowly and carefully drawn from the vial and injected into the GC-IRMS system using gas-tight syringe. Deionized water was used to compensate for the slight under-pressure in the headspace arising from outward He diffusion during storage as well as to make up for the volume of the gas withdrawn. Air was injected as the standard before and after each batch of eight samples. Concentrations of 29N2 and 30N2 produced during incubation were calculated as described by Holtappels et al. (2011). After analysis of the labeled N2, 15NO2– amended samples were used for DNRA rate measurements. The isotopic composition of NH4+ in the samples was determined after chemically converting it to N2 with sodium hypobromite (NaOBr) solution using the same mass spectrometer (Warembourg, 1993; Preisler et al., 2007).
The rates were computed as the slope of linear regression of 15N-production over time. Concentrations of N2 produced via denitrification and anammox pathways were calculated following Thamdrup and Dalsgaard (2002). N2 production via denitrification was computed from 15NO2– incubation as:
Denitrification = 30N2 × [FNO2]–2
Where, FNO2 refers to the 15N-mole fraction in the NO2– pool.
Anammox was quantified from the 15NH4+ incubation considering the mole fractions of 15N in the substrate pool (FNH4) and excess 29N2:
Anammox=29N2 × [FNH4]–1
In some cases (at stations G6 and G7 off Goa, and station K2 off Karwar in 2009) where NH4+ concentrations were not available, anammox rates were calculated from 15NO2– incubation as:
Anammox=29N2×[FNO2]–2–[Denitrification × 2 × (1−FNO2)]
Dissimilatory nitrate/nitrite reduction to ammonium rates were calculated from the slope of linear regression of 15N-labeled NH4+ production with time in the NO2– spiked samples (Jensen et al., 2011).
Results
Physicochemical Characteristics
The physicochemical conditions along various transects visited in the 3 years were very similar in that water column was strongly stratified in all cases (as exemplified by transect off Goa in Figure 2). In 2008 and 2009, surface water had potential density (σθ) of ∼20–22.5 kg m–3 that increased to 23.5–24.5 kg m–3 in the cooler and more saline subsurface upwelled water below the thermocline (Figure 2, Plates A and B). Due to a more intense rainfall in 2010, surface σθ values were much lower (Figure 2, Plate C). In all cases, surface waters were mostly oxygen saturated or slightly supersaturated (>200 μM) but O2 concentrations declined sharply (<10 μM, often reaching non-detectable limit) below the thin surface layer. Presence of sulfide was noticed by its strong odor along all transects in 2009. Surface water was mostly nutrient depleted. Over the deeper outer shelf (depth > 50 m) NO3– levels were higher (>15 μM) below the surface, but the concentrations decreased steadily toward the coast. Lower NO3– levels in oxygen-depleted water over the inner- and mid-shelf regions often coincided with elevated NO2– (up to 6 μM) indicating vigorous anaerobic microbial NO3– reduction (Figure 2). Dissolved NH4+, whenever measured, showed some accumulation in NO3– reducing water, either being produced through organic matter mineralization and/or DNRA or originating from the underlying sediment. Except for the year 2010, off Goa, strongly negative N∗ values in subsurface waters over the shelf indicated high fixed N-loss under suboxic/anoxic conditions (Figure 2, Plates A and C). The two southern transects (off Karwar and Mangalore) also showed similar physicochemical characteristics (Supplementary Figures S2, S3).
Nitrogen Reduction Pathways Over the WICS
Denitrification was detected in all samples, as indicated by significant (r2 ≥ 0.7) production of 30N2 in 15NO2–-spiked incubations. In fact, most of the N-loss over the shelf appears to be through this process (Table 1 and Supplementary Figure S4, 1 to 33). Production of 30N2 exceeded that of 29N2 in a majority of experiments, maintaining the theoretical production ratio of 2 (1−FNO2)/FNO2 through random isotope pairing as proposed by Nielsen (1992). In 2008, denitrification rates along the Goa transect ranged from 0.91 ± 0.08 to 1.93 ± 0.24 μmol N2 L–1 d–1. Higher denitrification rates were observed in 2009 at the inner shelf stations. At station G5, the denitrification rate averaged 6.49 ± 0.65 μmol N2 L–1 d–1; even higher rates were measured along the two southern transects, 9.34 ± 1.32 μmol N2 L–1 d–1 off Karwar and 10.03 ± 1.7 μmol N2 L–1 d–1 off Mangalore (Table 1). In 2010, denitrification rates were considerably lower over the inner shelf as compared to those in 2009. However, at the mid shelf stations inter-annual variations were less pronounced. Using all the 3 year’s data, the average denitrification rate was calculated as 2.45 ± 0.63 μmol N2 L–1 d–1.
Anammox activity was confirmed by results of 15NH4+ incubations that led to significant 29N2 production in over half (60%) of the all experiments (Table 1 and Supplementary Figure S5, 1 to 20). Anammox rates were calculated using 29N2 production rates from both 15NH4+ and 15NO2– incubations; these are presented in Table 1. The rates were significantly different from each other (Independent samples t-test, p < 0.05) with consistently higher rates from 15NO2– incubations. This is expected due to the differences in 15N enrichment in the substrate pool (Bulow et al., 2010 and references there in). For consistency, in the present study we considered anammox rates derived only from 15NH4+ incubation which is recommended to be more direct and precise. In 2008, anammox rates ranged between 0 and 0.02 ± 0.004 μmol N2 L–1 d–1. This process was mostly undetectable in 2009. In 2010, overall anammox rates were higher but highly variable from below detection to 0.43 μmol N2 L–1 d–1. The average anammox rate derived from all our 15NH4+ incubations was ∼0.06 ± 0.004 μmol N2 L–1 d–1. These numbers are two orders of magnitude lower than the above-mentioned denitrification rate.
Dissimilatory nitrate/nitrite reduction to ammonium activities were seen only sporadically. In both 2009 and 2010, DNRA activity was found at one depth along the Goa transect, and anammox was not detected in 2008. Off Karwar DNRA was found at 3 depths in 2009, but it was absent in 2010. A completely opposite trend was observed off Mangalore. The average DNRA rate (109.25 ± 22.1 nmol N2 L–1 d–1) was higher than that observed over the Omani shelf (highest ∼40 nmol N2 L–1 d–1).
Spatial and Inter Annual Variability of Nitrogen Reduction Processes
The spatio-temporal trends in denitrification and anammox rates were tested using non-parametric Mann Whitney t-test (two-tailed). Due to large intra-annual variability, no inter-annual variability was evident in both processes (Supplementary Figures S10a,b). However, denitrification rates along the Goa coast were significantly lower than that at the Karwar coast at p ≤ 0.1 (p: 0.10), and Mangalore coast at p < 0.05 (P: 0.04). Anammox rates were different only between Karwar and Mangalore at a significance level of p ≤ 0.1 (p: 0.07). Denitrification was found to be more active at the oxic-suboxic/anoxic interface compared to deeper water (Figures 3A,B). In 2009, low rates of denitrification were measured at the base of the oxycline at stations G6 (Figure 3B) and K3 where O2 concentrations were > 30 μM (Table 1). These O2 levels probably inhibited denitrification at these stations. In fact, with just a few exceptions, low levels of denitrification (only 10–25% of the mean of all measured rates) were consistently found in waters containing measurable O2. Anammox activity was low and stochastic to infer any trend in its depth distribution (Table 1 and Figures 3A,B). In 2010, anammox rates in bottom waters at stations G5 and G7 off Goa, were not only higher than those at the oxycline but also the highest recorded in this study (Table 1 and Figures 3A,B). However, at most of the depths where the anammox activity was detected O2 levels were low but often measurable (<5 μM).
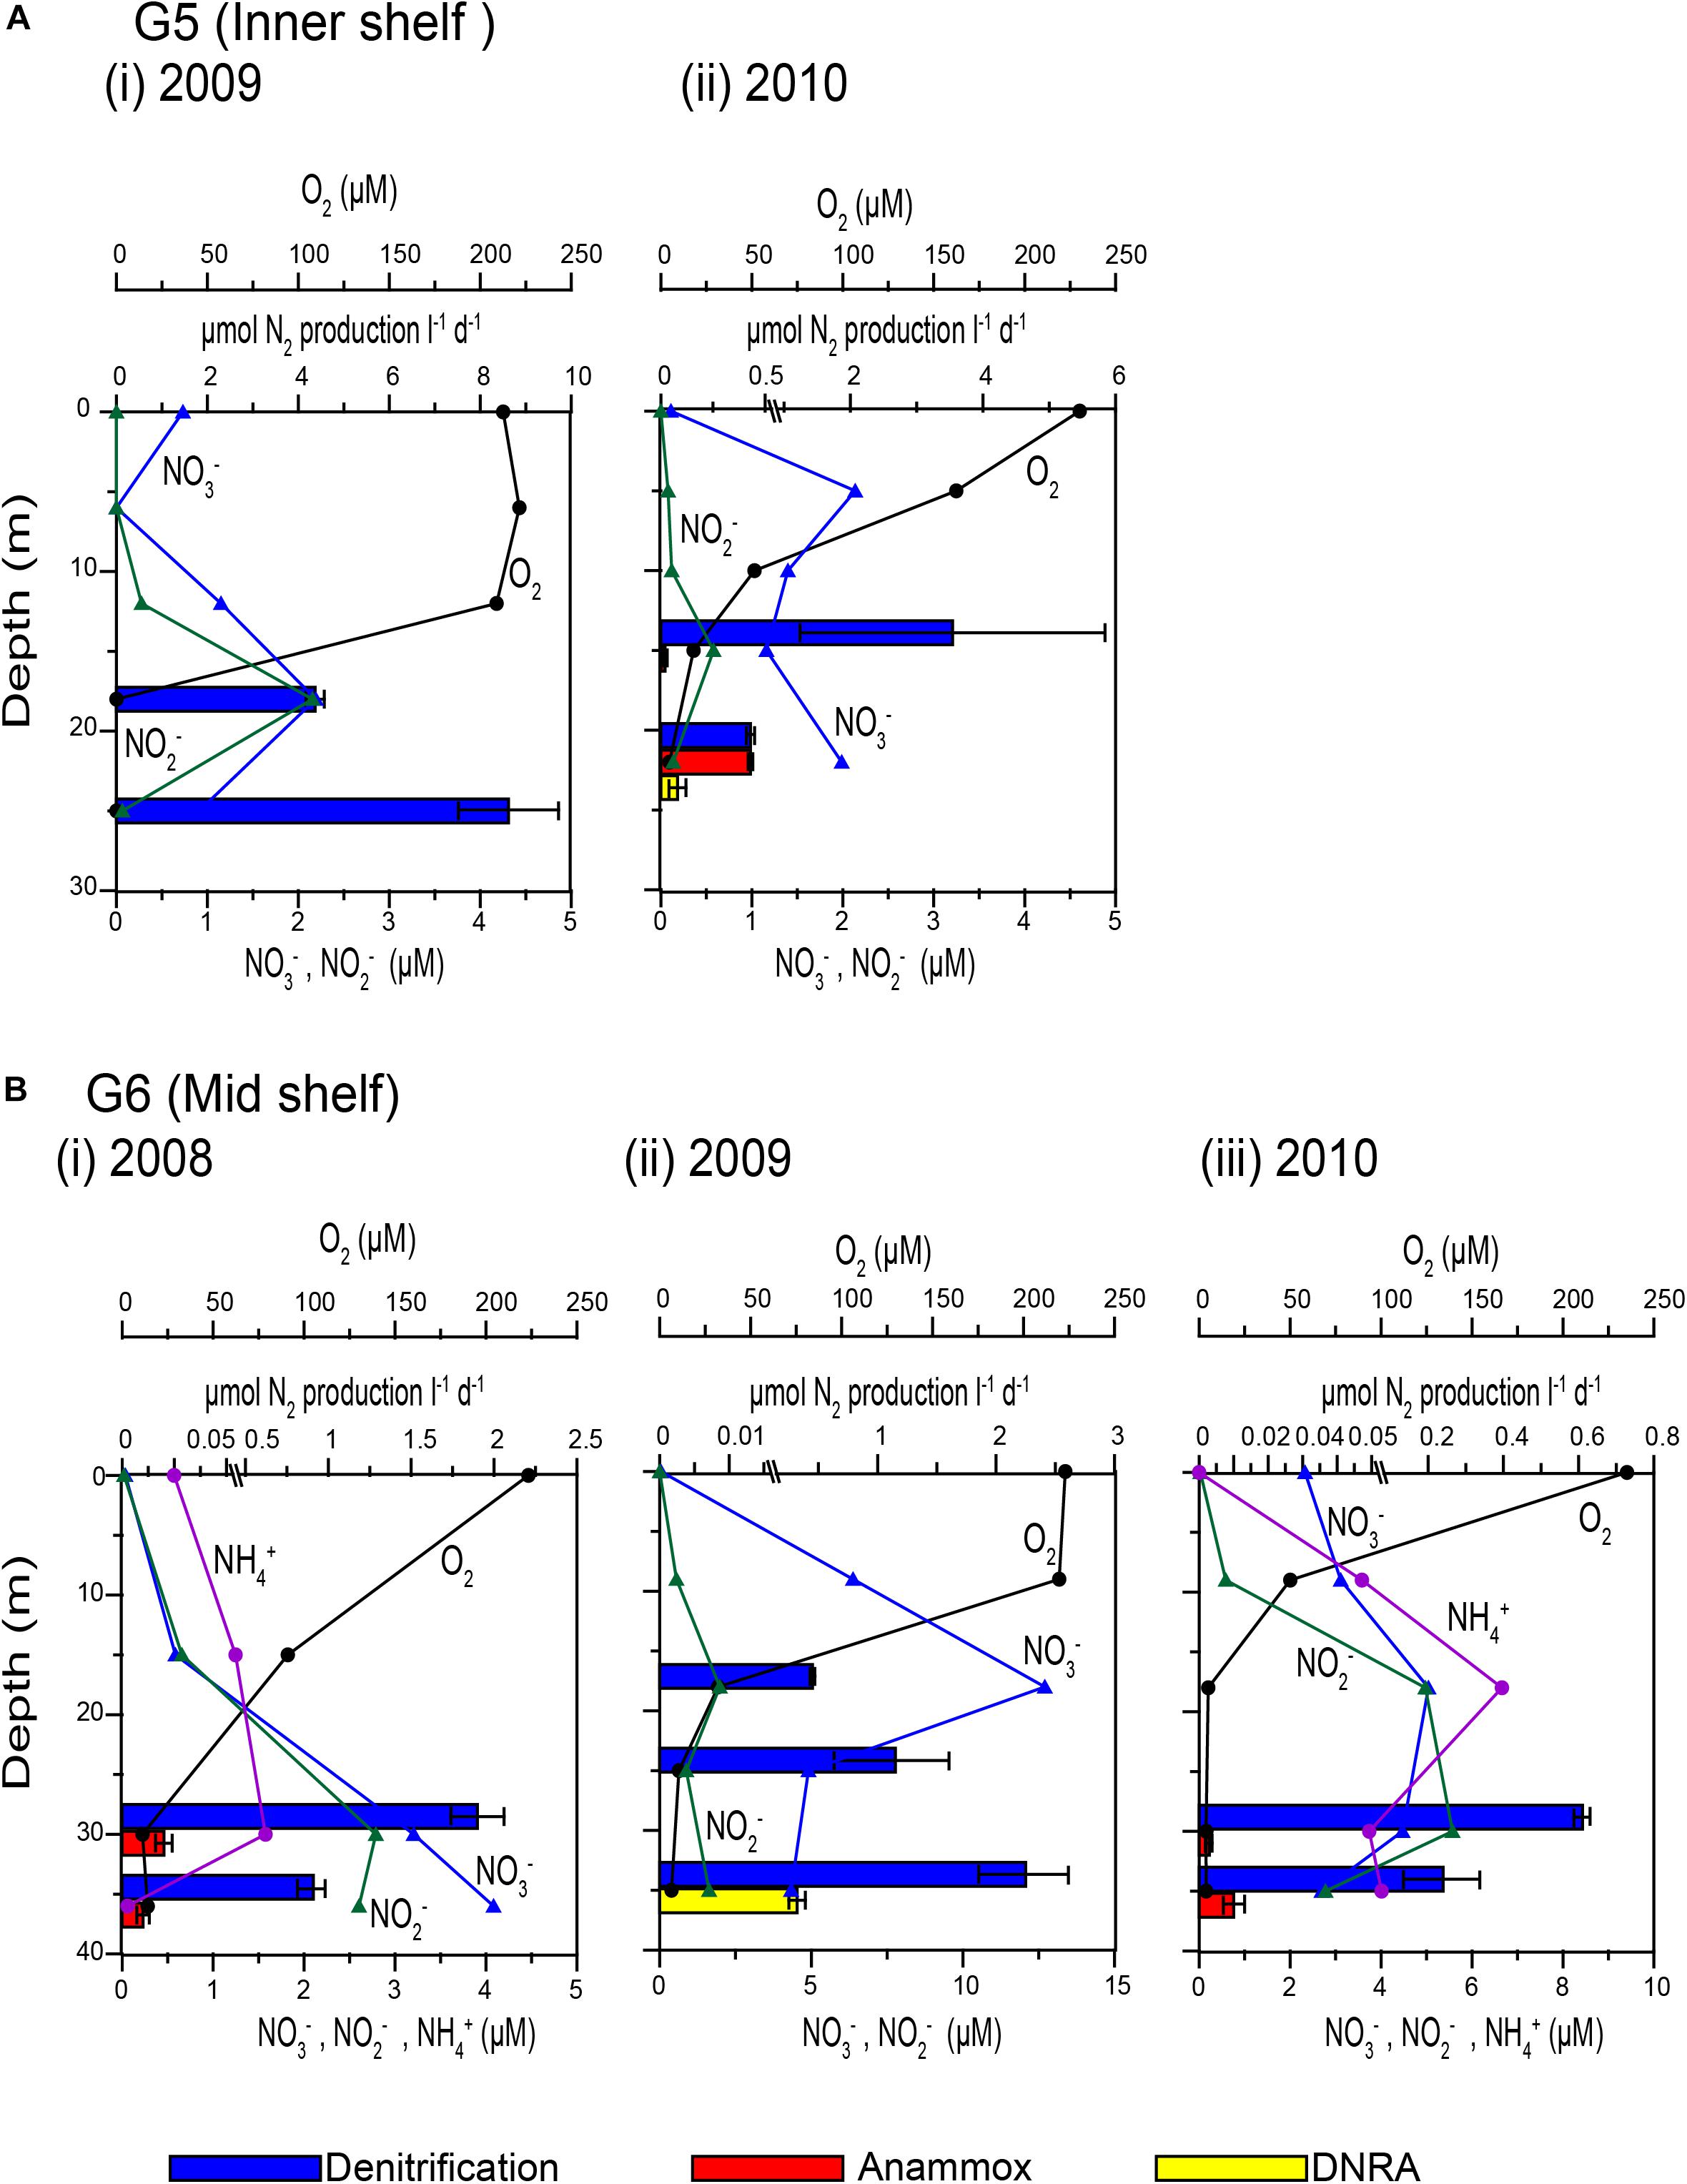
Figure 3. Depth wise variations in concentrations of dissolved oxygen, nitrate, nitrite and ammonium (connected vertical profiles) and N2 production rates measured by isotope pairing experiments (horizontal bars): (A) G5 inner shelf station off Goa (i) 2009 and (ii) 2010 and (B) G6 mid shelf station off Goa during (i) 2008, (ii) 2009, and (iii) 2010.
Overall denitrification rates did not show large inter annual variations over the 3 years period of the study. Over the inner shelf, average denitrification rate was higher in 2009 (6.49 ± 0.65 μmol N2 L–1 d–1) compared to 2010 (1.98 ± 1.1 μmol N2 L–1 d–1, respectively). In comparison, average anammox average rate was the highest in 2010 (0.07 ± 0.004 μmol N2 L–1 d–1), seven times more than the rates measured in 2008 (0.01 ± 0.002 μmol N2 L–1 d–1). In 2009, near-bottom waters at most inner shelf stations were found to be sulfidic (Supplementary Figure S1). At these stations denitrification rates were exceedingly high while anammox activity was not detected (Figure 3A).
N-Loss Rates Over the WICS
Despite the intra-annual variability observed at individual stations/sections, our data show quite similar average denitrification rates for 3 years. The mean values of our 3-year N-loss rates through denitrification and anammox were 2.45 ± 0.6 and 0.06 ± 0.004 μmol N2 L–1 d–1, respectively. For up-scaling these values over the entire shelf we followed the assumption previously made by Naqvi et al. (2000) and Naik (2003). Naqvi et al. (2000) estimated the area of the hypoxic zone over the WCSI to be 180,000 km2. However, O2 levels over this entire area are not low enough to support reductive N-loss, and as a lower limit about one third of the entire shelf, 60,000 km2, was assumed to functionally anoxic. The total volume of reducing water was estimated to range between 1.2 and 3.6 × 10¹² m3 taking the thickness of the reducing layer to be 20 m. Applying our 3 years average N-loss rates to this volume and assuming the reducing condition to last for 90 days, the overall N-loss would range from 3.70 ± 0.091 to 11.1 ± 2.72 Tg year–1 via denitrification, and from 0.09 ± 0.01 to 0.27 ± 0.03 Tg year–1 via anammox (Table 2).
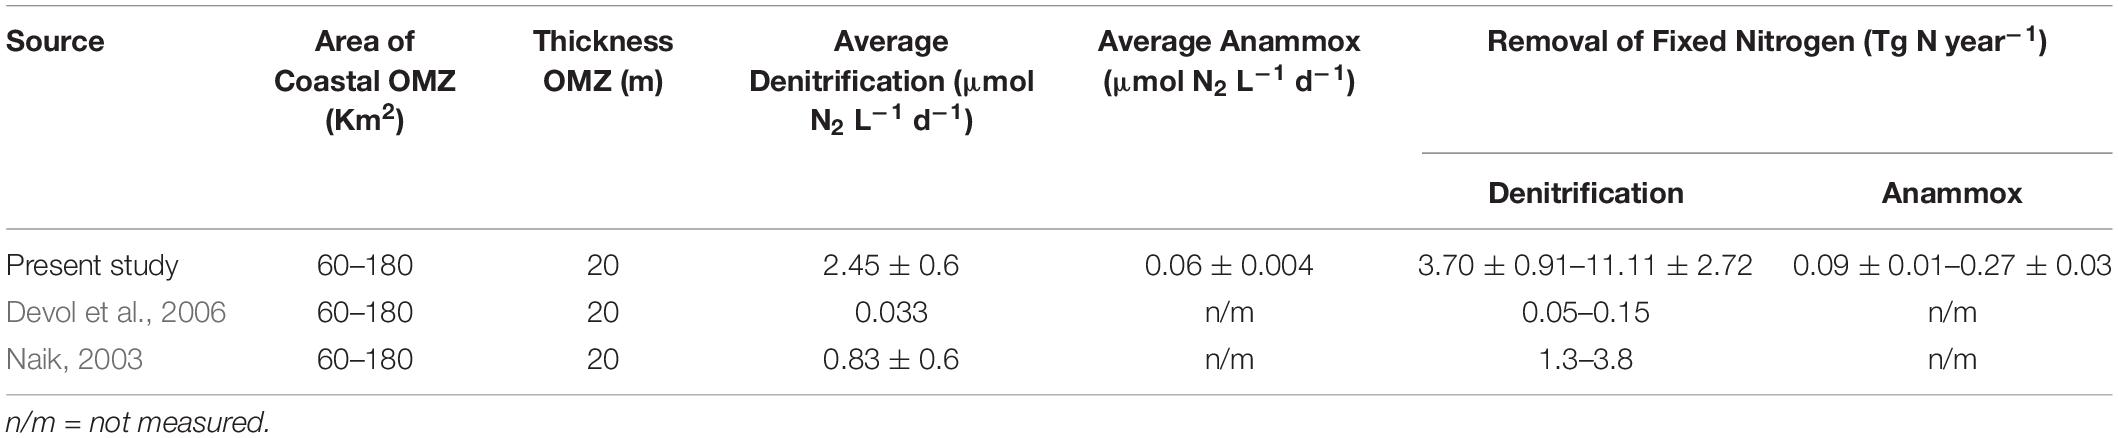
Table 2. Total nitrogen loss (mean and standard deviation values) from eastern Arabian Sea from present study and comparison with earlier data extrapolated to the OMZ area and thickness adopted from Naqvi et al. (2000).
Discussion
Oxygen Deficiency and Associated Biogeochemical Properties
Consistent with earlier observations (Naqvi et al., 2009, 2010a), suboxic (Winkler O2 < 10 μM; NO3– and NO2– > 0 μM) and anoxic (O2 = 0 μM; H2S > 0 μM) conditions were found to prevail over the inner-shelf and mid shelf regions in the present study as well. This oxygen deficient environment that evidently supported reductive nitrogen transformations (Hannig et al., 2007; Lavik et al., 2009; Naqvi et al., 2010a) was chosen for 15N labeling experiments (Figure 2, depths marked by diamond in O2 panels). Oxygenated surface water had extremely low NO3– concentrations (< 1 μM at most of the stations) with very few exceptions. Average surface chlorophyll a concentration was ∼2 mg m–3, with the highest concentration (7.01 mg m–3) occurring at a station M8. Earlier observations made during the SWM also revealed high surface chlorophyll levels (e.g., 2.63 mg m–3 at station G5 – Maya et al., 2011). Bhavya et al. (2017) reported average carbon uptake rate of 0.23 mg C l–1 d–1 water over the coast of Mangalore; this was significantly higher than production during the pre-monsoon but slightly lower than that during the post-monsoon period. In the coastal Arabian Sea primary production has been reported to be the largest contributor to the carbon stock (Barber et al., 2001). Therefore, the low NO3– levels in surface waters observed in the present study are probably due to biological uptake which in turn makes organic matter available to support microbial respiration in sub surface layers, increasing the O2 demand (Devol et al., 2006). Hypoxic water below the surface over the outer shelf was NO3– rich (∼15 μM), but NO3– was gradually depleted as the water upwelled and moved up the shelf. Accumulation of NO2– in the suboxic water over the inner- and mid-shelf points to active denitrification that apparently varied in strength spatially. When the NO3– was fully utilized, sulfate reduction commenced leading to buildup of H2S and NH4+. The highest NH4+ concentrations (up to 9.1 μM) in low-oxygen waters (Table 1) are consistent with earlier measurements by Naqvi et al. (2009). Concentration of H2S was not measured in the present study; however, its frequent presence over the inner shelf was indicated by strong odor. Soon after our observations off Goa in 2009, station located on Goa transect was visited for time series sampling and a build-up of sulfide in subsurface water was noticed (Supplementary Figure S1, reaching concentration as high as ∼12 μM (Shenoy et al., 2012). Overall, our results show the presence of intensely O2-depleted waters underlying a shallow and sharp pycnocline suitable for suboxic/anoxic microbial processes like denitrification, anammox and DNRA.
Regulation of Nitrogen Reduction Pathways Over the WICS
In the present study, denitrification was found to be the dominant fixed nitrogen removal process. The average denitrification rate (2.45 ± 0.6 μmol N2 L–1 d–1) was more than double of the previously reported value derived from the observed NO3– + NO2– loss over time (Naik, 2003) and almost two orders of magnitude higher than the estimates derived from incubation of samples spiked with 15NO3– (Devol et al., 2006). Contrastingly, anammox process, measured and detected for the first time over the WICS, was found to occur to a much lesser extent (∼0.06 ± 0.004 μmol N2 L–1 d–1). In 15NH4+ incubations, production of 30N2 was not detected thereby ruling out significant involvement of micro-aerobic ammonium oxidation as reported from the Black Sea (Lam et al., 2007). Nevertheless, our anammox rate over the Indian shelf in the eastern Arabian Sea is comparable with the rate measured off Oman in the western Arabian Sea where this process was found to be the dominant nitrogen loss pathway (Jensen et al., 2011). This indicates that anammox is not limited by the substrate availability as both NO3– and NH4+ were mostly available in near-bottom waters sampled by us. The growth rate of anammox bacteria are reported to be very slow, with doubling times of 10–30 days in bio-reactors under controlled conditions (Strous et al., 1998). Lower doubling times of 5.5–7.5 days were obtained in specialized membrane bioreactor (van der Star et al., 2008); however, the growth of anammox organisms is believed to be even slower in the OMZs (Dalsgaard et al., 2012). In the eastern Arabian Sea non-sulphidic (suboxic) anaerobic conditions generally persist only for a few weeks and within this relatively short time anammox bacteria may not be able to build the necessary biomass to utilize the relatively abundant ammonia. In this study DNRA was independently found to occur in some samples in the absence of detectable anammox activity. Along the shelves off Peru and Oman, occurrence of DNRA and its close coupling with anammox has been reported to account for the production of 30N2 in experiments conducted with 15NO2– (Kartal et al., 2007; Jensen et al., 2011). However, our incubations with 15NO2– + 14NH4+ did not show any effect on 30N2 production compared to incubations with 15NO2– alone. If DNRA-anammox were coupled, then addition of 14NH4+ would have diluted the 15NH4+ pool thereby resulting in a lower 30N2 yield (Kartal et al., 2007; Song et al., 2016). Furthermore, only ∼24% of the samples yielded positive results in our direct measurement of 15NH4+ production from 15NO2– in 2009 and 2010, and showed no correlation with the anammox rates. The average DNRA rate (109.6 ± 22.1 nmol N2 L–1 d–1) was higher than that observed over the Omani shelf (highest ∼40 nmol N2 L–1 d–1). This indicates that while DNRA could make some contribution to the observed NH4+ accumulation over the Indian shelf, the sedimentary flux of NH4+ is perhaps more important as Pratihary et al. (2014) reported very high benthic NH4+ efflux (3.74 mmol m–2 d–1) based on whole core incubations in this region.
The ambient O2 concentration did not show any clear control over denitrification (r = 0.22, p > 0.05) and anammox (r = 0.17, p > 0.05) in present study. However, it must be noted that the Winkler O2 measurements at near-zero levels may result in systematic overestimation. There are several reports on the sensitivity of denitrification to ambient O2 concentrations ranging from 0.2 to 5 μM in non-sulphidic O2-depleted waters (Dalsgaard et al., 2014, 2012; Bristow et al., 2017). For the first step of denitrification – nitrate reduction to nitrite – a somewhat high O2 tolerance (>25 μM) was noticed from the OMZ waters off Namibia and Peru (Kalvelage et al., 2011) than what is inferred from the field data (Thamdrup et al., 2012). Earlier observations in the Baltic Sea (Rönner and Sörensson, 1985) showed that O2 concentrations of ∼9–11 μM could inhibit denitrification; this is supported by the results of Jensen et al. (2009) from the Mariager Fjord. Like denitrification, anammox is also sensitive to the ambient O2 concentration. In the Black Sea, anammox bacteria were found to be active at low levels of O2 (4–8 μM) but showed complete inhibition at 13–14 μM (Jensen et al., 2008). Elsewhere in the oceans tolerance of anammox to O2 has been found to vary from nanomolar levels in the OMZs to as high as ∼15 μM in shallow waters (Kalvelage et al., 2011; Dalsgaard et al., 2012). As stated earlier, the Winkler O2 data used in some of these studies are not very reliable at vanishingly low levels. However, if real, this variability may be explained either by adaptation of anammox organisms to variable O2 conditions in coastal waters or by the presence of aggregated particles providing anaerobic micro-niches (Kalvelage et al., 2011; Klawonn et al., 2015). Time series observations by Shenoy et al. (2012) carried out for 3 days at station G5 showed highly fluctuating O2 concentrations on very short time scales (hours), indicating that the anammox and possibly also denitrifying bacteria might be better adapted to these varying O2 concentrations. Thus, due to multiple uncertainties it is not possible to categorically address the issue of O2 control on rates measured in the present study.
In many of the incubation experiments carried out by us, an initial lag phase of 10–12 h occurred before linear increase of 15N labeled N2 production. Around 70% of experiments with 15NO2– amendments in which denitrification were detected and ∼30% experiments with 15NH4+ which confirmed anammox activity showed such a lag phase. The most likely explanation of this time lag, also observed by us in similar incubations of anoxic reservoir samples (Naqvi et al., 2018), is that the microbes that perform denitrification and anammox were present in the water but were activated only when O2 level fell below the threshold (functionally anoxic). The possible causes of the presence of O2 in our samples subjected to incubation are discussed below. The data from the lag phase were not considered for calculation of rates and only the linear portion of the curve was used for this purpose. In some cases, a large (exponential) increase in labeled N2 production, departing from the linear trend, was also seen toward the end of the experiments. These data points, ostensibly arising from the so-called “bottle effect,” were not used for the rate calculation either. For these reasons, the rates computed by us should be considered as conservative. It is worth mentioning that average denitrification rates estimated from all experiments without lag phases (1.78 ± 0.19 μmol N2 L–1 d–1) were marginally lower than those from experiments with lag phases (2.74 ± 0.8 μmol N2 L–1 d–1). Even our lower mean values are more than twice the earlier estimates from the WICS (0.83 μmol N2 L–1 d–1 – Naik, 2003). Contrastingly, in case of anammox, rates calculated from 15NH4+ experiments with lag phase in 29N2 production were relatively far lower (0.01 ± 0.003 μmol N2 L–1 d–1) than those from experiments showing linear production from the beginning (0.08 ± 0.004 μmol N2 L–1 d–1). This suggests that anammox rates could not have been overestimated.
In isotope pairing technique (IPT) a time lag of ∼40 h in labeled N2 production has been observed previously in 15NO3– incubations (Dalsgaard et al., 2003). This can be attributed to the time taken for the conversion of NO3– to NO2– pool before N2 production starts. In modified IPT involving 15NO2– as the substrate, time lag could arise from the inhibitory effect of traces of O2 on denitrification/anammox in the incubated samples. The length of time lag has been found to be directly proportional to the O2 concentration (Baumann et al., 1997). Results of O2 amendment experiments by Jensen et al. (2008) revealed that the presence of ∼13.5 μM of O2 could produce 30 h lag before labeled N2 production commenced. There are several possibilities of O2 contamination occurring during experiments involving the IPT. Dalsgaard et al. (2014) pointed out that O2 could leach out from the PVC samplers to anoxic water samples. However, purging with helium for 15 min in 250-ml samples collected in serum bottles should take care of such contamination; this has been practiced as standard operating protocol in many previous studies, both in water from oceanic OMZs (Dalsgaard et al., 2003; Kuypers et al., 2005; Jensen et al., 2008; Holtappels et al., 2011) and anoxic freshwaters (Naqvi et al., 2018). However, there still remains a possibility that some O2 contamination could occur while transferring samples from serum bottles to Labco exetainers. De Brabandere et al. (2014) also demonstrated that Labco exetainers often used for incubations, as was also done in our study, could suffer from significant O2 diffusion through their butyl septa. Considering O2 consumption rates of 0.13 μmol l–1 h–1 in 15NO2– incubation (Jensen et al., 2008), ∼1.3 μM O2 might have produced a time lag of 10–12 h in our experiments. The initial time lag was seen in samples having measurable O2 levels (often > 10 μM). We strongly believe that He purging for 20 min was sufficient to completely remove O2 initially and that the production of lag phase is most likely due to subsequent contamination. Interestingly, no time lag was observed in the case of samples that contained traces of sulfide, as in our 2009 experiments. We hypothesize that traces of O2 introduced through contamination could have been quickly utilized for the oxidation of sulfide, but as discussed below we do not rule out the possibility of the occurrence of chemolithotrophic denitrification in the presence of sulfide (Lavik et al., 2009).
Over the Peruvian and Namibian shelves, re-suspension of sediments and presence of copious marine snow are expected to be most conducive for creating particle associated micro-anaerobic niches within which substantial N-loss could occur (Kuypers et al., 2005; Woebken et al., 2007; Kalvelage et al., 2011, 2013). Co-variation of turbidity and anammox rates was observed in these areas. The water column over the western Indian shelf is more turbid (1–4 NTU, measured in 2009), than off Peru and Namibia (0.05–0.1 NTU; Kuypers et al., 2005). In the present study, water turbidity (Figure 4A) showed statistically significant correlation with denitrification (r = 0.47, p < 0.05). This suggests N removal through denitrification may also occur in particle-associated micro-anaerobic niches over the WICS.
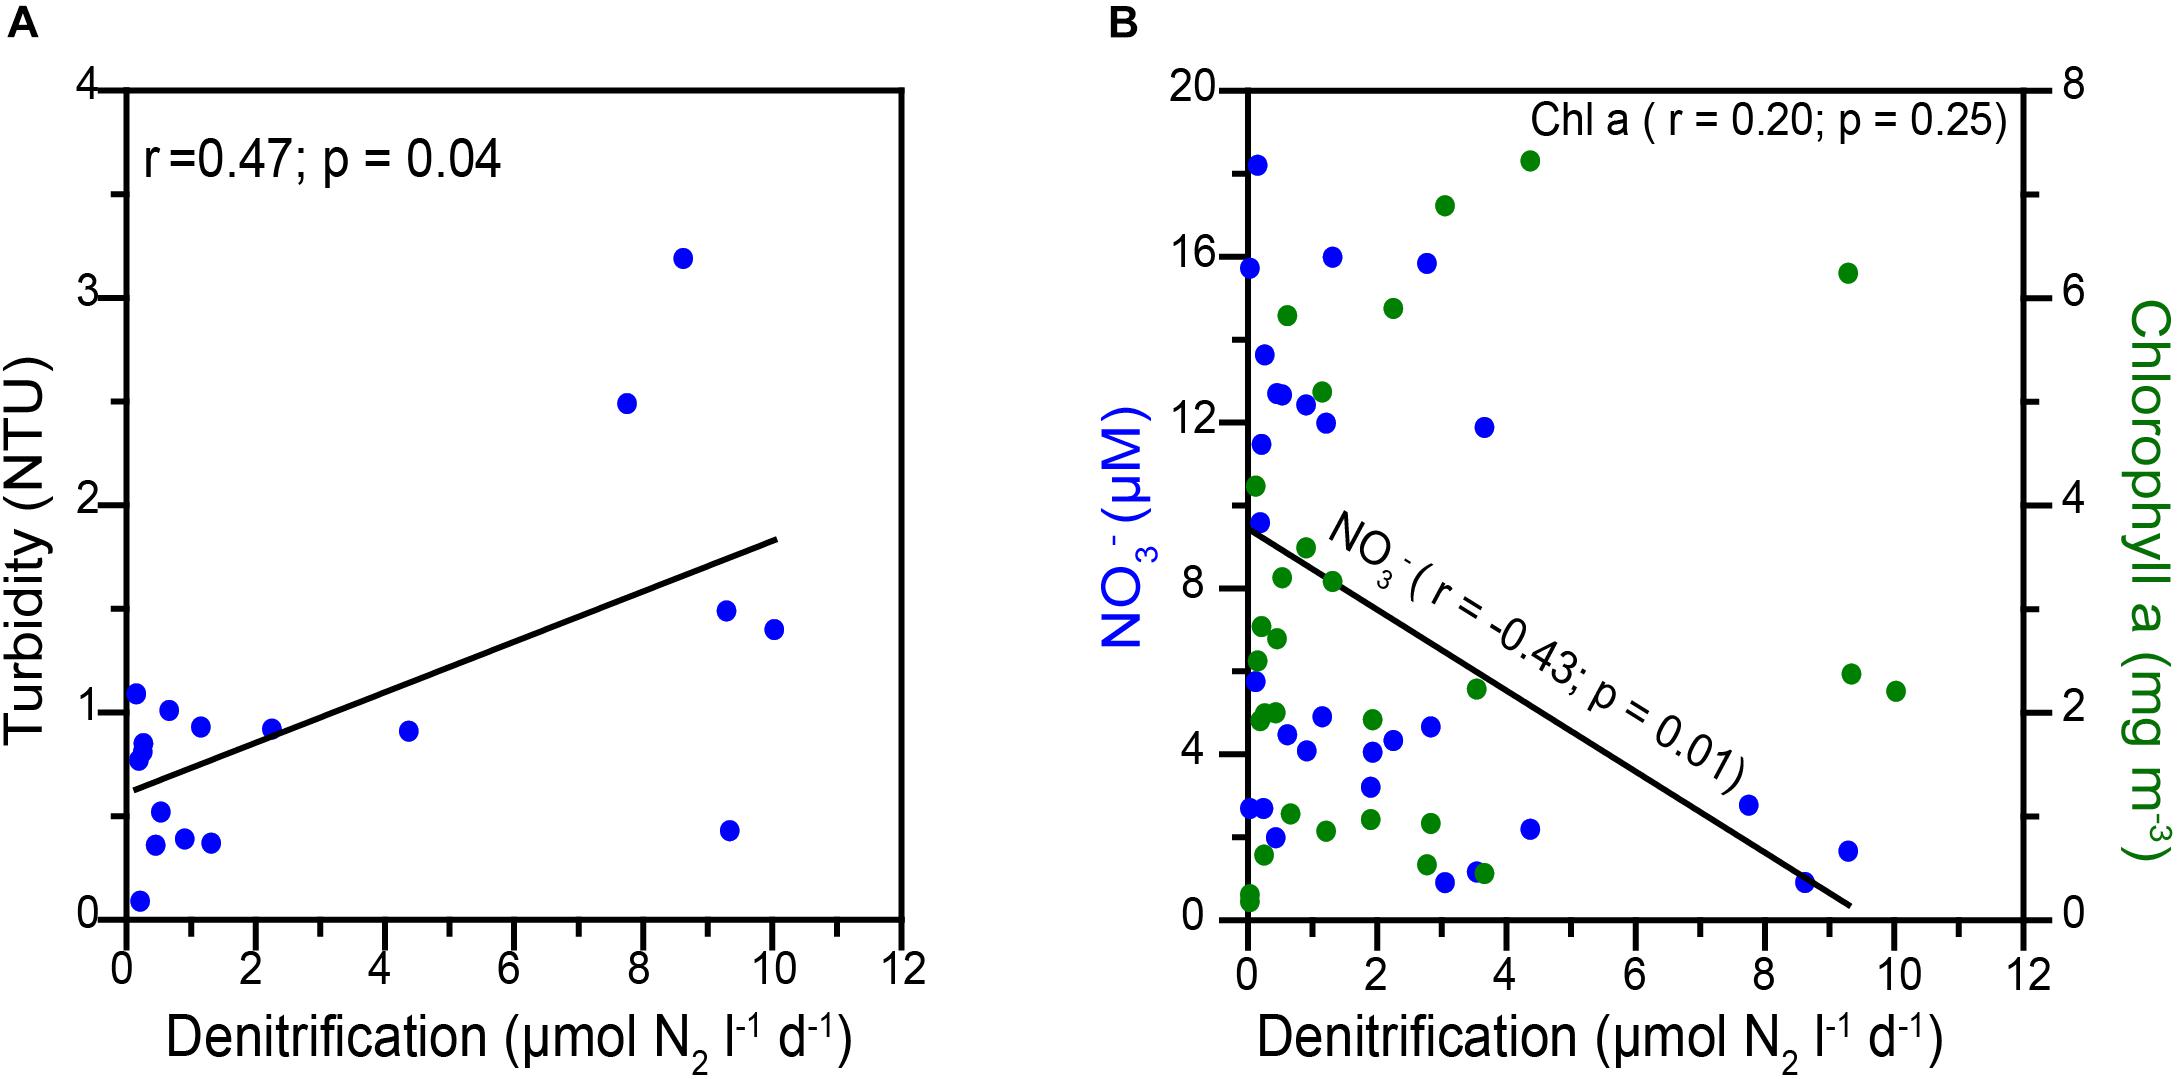
Figure 4. Correlations between (A) Denitrification versus turbidity and (B) denitrification versus nitrate (blue circles) and chlorophyll a (green circle).
The availability of NO3– and organic matter are expected to regulate heterotrophic denitrification (Ward et al., 2008; Dalsgaard et al., 2012) as well as anammox (Kalvelage et al., 2013; Callbeck, 2017) in oceanic oxygen-deficient zones. In our study, in some cases, we noticed high denitrification rates to be associated with higher chlorophyll a (a proxy of organic matter availability) as well as lower NO3– levels (reflecting denitrification/anammox activities). NO3– showed statistically significant inverse relation (r = −0.43, p < 0.05), whereas chlorophyll a yielded non-significant correlations with the measured denitrification rates (r = 0.20; p > 0.05) (Figure 4B). This indicates that the N-loss was not limited by organic matter over the Indian shelf.
Sulfide has been reported to inhibit anammox activity (Dalsgaard et al., 2003; Jensen et al., 2008), and this may account for lower anammox rates in our samples in 2009. Recent studies have also shown that sulfide can act as an electron donor for autotrophic denitrification. Various groups of microbes capable of sulfide driven chemolithoautotrophic denitrification have been detected in anoxic waters of the Baltic Sea (Brettar et al., 2006; Hannig et al., 2007), in Saanich Inlet (Zaikova et al., 2010), off Namibia (Lavik et al., 2009) and off Peru (Schunck et al., 2013). These bacteria are known to be fast growing and capable of forming blooms within days to weeks (Lavik et al., 2009). Therefore, it is not unlikely that the high rate of denitrification measured in 2009 arises at least in part from autotrophic denitrification by sulfide-oxidizing microbes. However, it must be pointed out that based on results of incubations alone one cannot distinguish between heterotrophic and autotrophic denitrification processes. Nevertheless, since all our denitrification rates were determined in waters with measurable nitrate/nitrite concentrations and were calculated from the linear increase in N2 production, it is clear that these processes, whether autotrophic or heterotrophic, is mainly responsible for the apparent N-loss over the Indian shelf. The denitrification rate is of the same order of magnitude but more than double as the NO3– loss rate observed in the region (Naik, 2003). On the other hand, the estimated anammox rates are much lower.
N-Removal Versus Uptake Over the Western Indian Continental Shelf During Seasonal Anoxia
The overall nitrogen removal over the WICS is estimated to range between 3.70 ± 0.91 and 11.1 ± 2.72 Tg annually. This corresponds to ∼8–24% of the N-loss estimated for the open ocean OMZ of the Arabian Sea by Bulow et al. (2010) and as high as 24–60% of the model-based value (DeVries et al., 2012). In comparison, anammox contributes only 0.09 ± 0.01–0.27 ± 0.03 Tg to the N-loss per year. Our estimate is also almost three times higher than the previous estimate derived from changes in nitrate concentrations over time (Naik, 2003). The main shortcoming of this estimate that is based on complete removal of an initial NO3– concentration of ∼24 μM in the upwelled water over a month at a fixed sampling location (Naik, 2003), is that it ignores additional inputs of NO3–. A number of autochthonous and allochthonous sources of fixed nitrogen exist over WICS during the SWM season. As mentioned earlier, atmospheric deposition and land runoff contribute significantly toward the nitrogen inventory (Seitzinger et al., 2005; Naqvi et al., 2010b; Bardhan et al., 2015) which is believed to have increased in recent times. Moreover, high (millimolar) concentrations of NO3– are also found in ground water of Goa very close to coast and the submarine groundwater discharge is expected to be a significant but hitherto poorly quantified source of fixed nitrogen to coastal waters.
A considerable amount of fixed nitrogen is removed by the phytoplankton. The chlorophyll a (averaging to 2.74 mg m–3) observed in the present study indicates moderately high primary production. Bhavya et al. (2017) reported a carbon uptake rate of 38.8 μmol C l–1 d–1 from coastal waters of the eastern Arabian Sea during the SWM. Using the Redfield stoichiometry (Redfield et al., 1963) this would correspond to a fixed N demand of 5.8 μmol L–1 d–1. However, most of this nitrogen is expected to be regenerated in subsurface waters and thus made available to microbes facilitating the N-loss processes. Once the bottom waters of the WICS turn SO42– reducing, after the oxidized N has been fully utilized, the nitrogen regenerated is in the reduced form (NH4+). However, it is eventually expected to be oxidized to NO3–. Thus, the nitrogen taken up by the autotrophs does not leave the system. The overall N-loss from the system through denitrification and anammox with the former dominating far exceed inputs through upwelling.
Conclusion
The present study provides the first results, based on direct measurements using the isotope pairing method of denitrification, anammox and DNRA rates over the world’s largest naturally formed coastal low-O2 zone that develops seasonally over the western Indian continental shelf. The results reveal that denitrification is the predominant process responsible for N-loss at rates that are among the highest reported from any aquatic system. Although anammox was also commonly detected in low O2 waters its rates were much lower. DNRA was less commonly observed, and at still lower rates. Large spatial and inter annual variations in environmental conditions seem to control the magnitude of different pathways. Denitrification rates were higher over the inner shelf and at the interface of the oxic-suboxic/anoxic layers. Higher rates were observed off Karwar and Mangalore than off Goa. Evolution of sulfate reducing condition and occurrence of dissolved hydrogen sulfide might inhibit anammox activity but stimulate denitrification through chemolithoautotrophy. As in case of the OMZ off Peru, where the measured N-loss rate is the highest over the shelf but the accumulated N∗ signal is maximal in the offshore OMZ (Kalvelage et al., 2013; Thomsen et al., 2016), strong exchange of water between the coastal and the open ocean OMZ may export N-loss signals (i.e., N∗ and N2/Ar ratios, Devol et al., 2006; DeVries et al., 2012) to the open ocean in the Arabian Sea as well.
Data Availability Statement
The original contributions presented in the study are included in the article/Supplementary Material, further inquiries can be directed to the corresponding author.
Author Contributions
SN and MK designed the experiments. AS, SN, AP, GS, and HN performed all the experiments. AS and SN analyzed all the samples. AS, SN, and GL processed the data. AS wrote the manuscript with inputs from SN and GL. All authors contributed to the article and approved the submitted version.
Funding
Financial support for this research was provided by the European Commission through the award of a Marie Curie International Incoming Fellowship to SN to Max-Planck Society, Germany and the SIBER-INDIA program (Ministry of Earth Sciences, India). The Council of Scientific & Industrial Research (India) supported AS and GS through the award of Senior Research Fellowships.
Conflict of Interest
The authors declare that the research was conducted in the absence of any commercial or financial relationships that could be construed as a potential conflict of interest.
Acknowledgments
We thank all the Master and crew of CRV Sagar Sukti and H. Dalvi and A. Methar for extending their assistance in sample collections. We thank Dr. Rakhesh Madhusoodhanan, KISR, Kuwait for support with the statistical analysis.
Supplementary Material
The Supplementary Material for this article can be found online at: https://www.frontiersin.org/articles/10.3389/fmars.2020.00678/full#supplementary-material
References
Barber, R. T., Marra, J., Bidigare, R. C., Codispoti, L. A., Halpern, D., Johnson, Z., et al. (2001). Primary productivity and its regulation in the Arabian Sea during 1995. Deep Sea Res. Part II Top. Stud. Oceanogr. 48, 1127–1172. doi: 10.1016/s0967-0645(00)00134-x
Bardhan, P., Karapurkar, S. G., Shenoy, D. M., Kurian, S., Sarkar, A., Maya, M. V., et al. (2015). Carbon and nitrogen isotopic composition of suspended particulate organic matter in Zuari Estuary, west coast of India. J. Mar. Syst. 141, 90–97. doi: 10.1016/j.jmarsys.2014.07.009
Baumann, B., Snozzi, M., Vandermeer, J. R., and Zehnder, A. J. B. (1997). Development of stable denitrifying cultures during repeated aerobic-anaerobic transient periods. Wat. Res. 31, 1947–1954. doi: 10.1016/s0043-1354(97)00053-5
Bendschneider, K., and Robinson, R. J. (1952). A new spectrophotometric method for the determination of nitrite in sea water. J. Mar. Res. 11, 87–96.
Bhavya, P. S., Kumar, S., Gupta, G. V. M., and Sudheesh, V. (2017). Carbon uptake rates in the Cochin estuary and adjoining coastal Arabian Sea. Estuar. Coast. 40, 447–456. doi: 10.1007/s12237-016-0147-4
Brettar, I., Labrenz, M., Flavier, S., Botel, J., Kuosa, H., Christen, R., et al. (2006). Identification of a Thiomicrospira denitrificans like epsilon proteo bacterium as a catalyst for autotrophic denitrification in the central Baltic Sea. Appl. Environ. Microbiol. 72, 1364–1372. doi: 10.1128/aem.72.2.1364-1372.2006
Bristow, L. A., Callbeck, C. M., Larsen, M., Altabet, M. A., Dekaezemacker, J., Forth, M., et al. (2017). N2 production rates limited by nitrite availability in the Bay of Bengal oxygen minimum zone. Nat. Geosci. 10:24. doi: 10.1038/ngeo2847
Bulow, S. E., Rich, J. J., Naik, H. S., Pratihary, A. K., and Ward, B. B. (2010). Denitrification exceeds anammox as a nitrogen loss pathway in the Arabian Sea oxygen minimum zone. Deep Sea Res. Part I Oceanogr. Res. Pap. 57, 384–393. doi: 10.1016/j.dsr.2009.10.014
Callbeck, C. M. (2017). Distribution and Activity Of Anammox And Sulphide-Oxidizing Nitrate-Reducing Bacteria In Oxygen Minimum Zones. Doctoral dissertation, Universität Bremen, Bremen.
Dalsgaard, T., Canfield, D. E., Petersen, J., Thamdrup, B., and Acuña-González, J. (2003). N2 production by the anammox reaction in the anoxic water column of GolfoDulce, Costa Rica. Nature 422, 606–608. doi: 10.1038/nature01526
Dalsgaard, T., Stewart, F. J., Thamdrup, B., De Brabandere, L., Revsbech, N. P., Ulloa, O., et al. (2014). Oxygen at nanomolar levels reversibly suppresses process rates and gene expression in anammox and denitrification in the oxygen minimum zone off northern Chile. mBio 5:e001966-14.
Dalsgaard, T., Thamdrup, B., Farías, L., and Revsbech, N. P. (2012). Anammox and denitrification in the oxygen minimum zone of the eastern South Pacific. Limnol. Oceanogr. 57, 1331–1346. doi: 10.4319/lo.2012.57.5.1331
De Brabandere, L., Canfield, D. E., Dalsgaard, T., Friederich, G. E., Revsbech, N. P., Ulloa, O., et al. (2014). Vertical partitioning of nitrogen-loss processes across the oxic-anoxic interface of an oceanic oxygen minimum zone. Environ. Microbiol. 16, 3041–3054. doi: 10.1111/1462-2920.12255
Devol, A. H., Uhlenhopp, A. G., Naqvi, S. W. A., Brandes, J. A., Jayakumar, D. A., Naik, H., et al. (2006). Denitrification rates and excess nitrogen gas concentrations in the Arabian Sea oxygen deficient zone. Deep Sea Res. Part I Oceanogr. Res. Pap. 53, 1533–1547. doi: 10.1016/j.dsr.2006.07.005
DeVries, T., Deutsch, C., Primeau, F., Chang, B., and Devol, A. (2012). Global rates of water-column denitrification derived from nitrogen gas measurements. Nat. Geosci. 5, 547–550. doi: 10.1038/ngeo1515
Duce, R. A., LaRoche, J., Altieri, K., Arrigo, K. R., Baker, A. R., Capone, D. G., et al. (2008). Impacts of atmospheric anthropogenic nitrogen on the open ocean. Science 320, 893–897.
Froelich, P. N., Klinkhammer, G. P., Bender, M. L., Luedtke, N. A., Heath, G. R., Cullen, D., et al. (1979). Early oxidation of organic matter in pelagic sediments of eastern equatorial Atlantic: suboxic diagenesis. Geochim. Cosmochim. Acta 43, 1075–1090. doi: 10.1016/0016-7037(79)90095-4
Grasshoff, K., Ehrhardt, M., and Kremling, K. (1983). Methods Of Seawater Analysis. Weinheim: Verlag Chemie.
Gruber, N., and Sarmiento, J. L. (1997). Global patterns of marine nitrogen fixation and denitrification. Glob. Biogeochem. Cycles 11, 235–266. doi: 10.1029/97gb00077
Hannig, M., Lavik, G., Kuypers, M. M. M., Woebken, D., Martens-Habbena, W., and Jürgens, K. (2007). Shift from denitrification to anammox after inflow events in the central Baltic Sea. Limnol. Oceanogr. 52, 1336–1345. doi: 10.4319/lo.2007.52.4.1336
Holtappels, M., Lavik, G., Jensen, M. M., and Kuypers, M. M. M. (2011). 15N-labelling experiments to dissect the contributions of heterotrophic denitrification and anammox to nitrogen removal in the OMZ waters of the ocean. Methods Enzymol. 486, 223–251. doi: 10.1016/b978-0-12-381294-0.00010-9
Jensen, M. M., Kuypers, M. M. M., Lavik, G., and Thamdrup, B. (2008). Rates and regulation of anaerobic ammonium oxidation and denitrification in the Black Sea. Limnol. Oceanogr. 53, 23–36. doi: 10.4319/lo.2008.53.1.0023
Jensen, M. M., Lam, P., Revsbech, N. P., Nagel, B., Gaye, B., Jetten, M. S. M., et al. (2011). Intensive nitrogen loss over the Omani Shelf due to anammox coupled with dissimilatory nitrite reduction to ammonium. ISME J. 5, 1660–1670. doi: 10.1038/ismej.2011.44
Jensen, M. M., Petersen, J., Dalsgaard, T., and Thamdrup, B. (2009). Pathways, rates, and regulation of N22 production in the chemocline of an anoxic basin, Mariager Fjord, Denmark. Mar. Chemis. 113, 102–113.
Kalvelage, T., Jensen, M. M., Contreras, S., Revsbech, N. P., Lam, P., Günter, M., et al. (2011). Oxygen sensitivity of anammox and coupled N-cycle processes in oxygen minimum zones. PLoS One 6:e29299. doi: 10.1371/journal.pone.0029299
Kalvelage, T., Lavik, G., Lam, P., Contreras, S., Arteaga, L., Löscher, C. R., et al. (2013). Nitrogen cycling driven by organic matter export in the South Pacific oxygen minimum zone. Nat. Geosci. 6, 228–234. doi: 10.1038/ngeo1739
Kartal, B., Kuypers, M. M. M., Lavik, G., Schalk, J., Op den Camp, H. J. M., Jetten, M. S. M., et al. (2007). Anammox bacteria disguised as denitrifiers: nitrate reduction to dinitrogen gas via nitrite and ammonium. Environ. Microbiol. 9, 635–642. doi: 10.1111/j.1462-2920.2006.01183.x
Klawonn, I., Bonaglia, S., Brüchert, V., and Ploug, H. (2015). Aerobic and anaerobic nitrogen transformation processes in N2-fixing cyanobacterial aggregates. ISME J. 9:1456. doi: 10.1038/ismej.2014.232
Kuypers, M. M. M., Lavik, G., Woebken, D., Schmid, M., Fuchs, B. M., Amann, R., et al. (2005). Massive nitrogen loss from the Benguela upwelling system through anaerobic ammonium oxidation. Proc. Natl. Acad. Sci. U.S.A. 102, 6478–6483. doi: 10.1073/pnas.0502088102
Kuypers, M. M. M., Sliekers, A. O., Lavik, G., Schmid, M., Jørgensen, B. B., Kuenen, J. G., et al. (2003). Anaerobic ammonium oxidation by anammox bacteria in the Black Sea. Nature 422, 608–611. doi: 10.1038/nature01472
Lam, P., Jensen, M., Lavik, G., McGinnis, D. F., Müller, B., Schubert, C. J., et al. (2007). Linking crenarchaeal and bacterial nitrification to anammox in the Black Sea. Proc. Natl. Acad. Sci. U.S.A. 104, 7104–7109. doi: 10.1073/pnas.0611081104
Lavik, G., Stührmann, T., Brüchert, V., Van der Plas, A., Mohrholz, V., Lam, P., et al. (2009). Detoxification of sulphidic African shelf waters by blooming chemolithotrophs. Nature 457, 581–584. doi: 10.1038/nature07588
Maya, M. V., Karapurkar, S. G., Naik, H., Roy, R., Shenoy, D. M., and Naqvi, S. W. A. (2011). Intraannual variability of carbon and nitrogen stable isotopes in suspended organic matter in waters of the western continental shelf of India. Biogeosciences 8, 3441–3456. doi: 10.5194/bg-8-3441-2011
Naik, H. (2003). Benthic Nitrogen Cycling With Special Reference To Nitrous Oxide In The Coastal And Continental Shelf Environments Of The Eastern Arabian Sea. Dissertation thesis, Marine Science Department, Goa University, Goa.
Naqvi, S. W. A., Bange, H. W., Farías, L., Monteiro, P. M. S., Scranton, M. I., and Zhang, J. (2010a). Marine hypoxia/anoxia as a source of CH4 and N2O. Biogeosciences 7, 2159–2190.
Naqvi, S. W. A., Naik, H., D’ Souza, W., Narvekar, P. V., Paropkari, A. L., and Bange, H. W. (2010b). “Carbon and nitrogen fluxes in the North Indian Ocean,” in Carbon And Nutrient Fluxes In Continental Margins: A Global Synthesis, eds K. K. Liu, L. Atkinson, R. Quinones, and M. L. Talaue (Berlin: Springer).
Naqvi, S. W. A., Jayakumar, D. A., Narvekar, P. V., Naik, H., Sarma, V. V. S. S., D’Souza, W., et al. (2000). Increased marine production of N2O due to intensifying anoxia on the Indian continental shelf. Nature 408, 346–349. doi: 10.1038/35042551
Naqvi, S. W. A., Lam, P., Narvenkar, G., Sarkar, A., Naik, H., Pratihary, A., et al. (2018). Methane stimulates massive nitrogen loss from freshwater reservoirs in India. Nat. Commun. 9, 1–10.
Naqvi, S. W. A., Naik, H., Jayakumar, A., Pratihary, A. K., Narvenkar, G., Kurian, S., et al. (2009). “Seasonal anoxia over the western Indian continental shelf,” in Indian Ocean Biogeochemical Processes And Ecological Variability 1, eds J. D. Wiggert, R. R. Hood, S. W. A. Naqvi, K. H. Brink, and S. L. Smith (Berlin: Springer), 333–345. doi: 10.1029/2008gm000745
Naqvi, S. W. A., Naik, H., Jayakumar, D. A., Shailaja, M. S., and Narvekar, P. V. (2006a). “Seasonal oxygen deficiency over the western continental shelf of India,” in Past and Present Water Column Anoxia, NATO Science Series, IV. Earth and Environmental Sciences 64, ed. L. Neretin (Dordrecht: Springer), 195–224. doi: 10.1007/1-4020-4297-3_08
Naqvi, S. W. A., Naik, H., Pratihary, A. K., DeSouza, W., Narvekar, P. V., Jayakumar, D. A., et al. (2006b). Coastal versus open-ocean denitrification in the Arabian Sea. Biogeosciences 3, 621–633. doi: 10.5194/bg-3-621-2006
Nielsen, L. P. (1992). Denitrification in sediment determined from nitrogen isotope pairing. FEMS Microbiol. Lett. 86, 357–362. doi: 10.1111/j.1574-6968.1992.tb04828.x
Pratihary, A. K., Naqvi, S. W. A., Narvenkar, G., Kurian, S., Naik, H., Naik, R., et al. (2014). Benthic mineralization and nutrient exchange over the inner continental shelf of western India. Biogeosciences 11, 2771–2791. doi: 10.5194/bg-11-2771-2014
Preisler, A., De Beer, D., Lichtschlag, A., Lavik, G., Boetius, A., and Jørgensen, B. B. (2007). Biological and chemical sulphide oxidation in a Beggiatoa inhabited marine sediment. ISME J. 1, 341–353. doi: 10.1038/ismej.2007.50
Rabalais, N. N., Diaz, R. J., Levin, L. A., Turner, R. E., Gilbert, D., and Zhang, J. (2010). Dynamics and distribution of natural and human-caused hypoxia. Biogeosciences 7:585. doi: 10.5194/bg-7-585-2010
Redfield, A. C., Ketchum, B. H., and Richards, F. A. (1963). “The influence of organisms on the composition of sea-water,” in The Composition Of Seawater: Comparative And Descriptive Oceanography. The Sea: Ideas And Observations On Progress In The Study Of The Seas, ed. M. N. Hill (New York, NY: Interscience Publishers), 26–77.
Rönner, U., and Sörensson, F. (1985). Denitrification rates in the low-oxygen waters of the stratified Baltic proper. Appl. Environ. Microbiol. 50, 801–806.
Schlitzer, R. (2018). Ocean Data View. Available online at: https://odv.awi.de
Schott, F., and McCreary, J. P. (2001). The monsoon circulation of the Indian Ocean. Prog. Oceanogr. 51:123.
Schunck, H., Lavik, G., Desai, D. K., Großkopf, T., Kalvelage, T., Löscher, C. R., et al. (2013). Giant hydrogen sulphide plume in the oxygen minimum zone off Peru supports chemolithoautotrophy. PLoS One 8:e68661. doi: 10.1371/journal.pone.0068661
Seitzinger, S. P., Harrison, J. A., Dumont, E., Beusen, A. H. W., and Bouwman, A. F. (2005). Sources and delivery of carbon, nitrogen, and phosphorus to the coastal zone: an overview of global nutrient export from watersheds (NEWS) models and their application. Glob. Biogeochem. Cycles 19:2606.
Shankar, D., Shenoi, S. S. C., Nayak, R. K., Vinayachandran, P. N., Nampoothiri, G., Almeida, A. M., et al. (2005). Hydrography of the eastern Arabian Sea during summer monsoon 2002. J. Earth Syst. Sci. 114, 459–474. doi: 10.1007/bf02702023
Shenoy, D. M., Sujith, K. B., Gauns, M., Patil, S., Sarkar, A., Naik, H., et al. (2012). Production of dimethylsulphide during the seasonal anoxia off Goa. Biogeochemistry 110, 47–55. doi: 10.1007/s10533-012-9720-5
Song, G. D., Liu, S. M., Kuypers, M. M. M., and Lavik, G. (2016). Application of the isotope pairing technique in sediments where anammox, denitrification, and dissimilatory nitrate reduction to ammonium coexist. Limnol. Oceanogr. Methods 14, 801–815. doi: 10.1002/lom3.10127
Stramma, L., Fischer, J., and Schott, F. (1996). The flow field off southwest India at 8N during the southwest monsoon of August 1993. J. Mar. Res. 54, 55–72. doi: 10.1357/0022240963213448
Strickland, J. D. H., and Parsons, T. R. (1972). A practical handbook of seawater analysis. Fish. Res. Board Canada 167:31.
Strous, M., Heijnen, J. J., Kuenen, J. G., and Jetten, M. S. M. (1998). The sequencing batch reactor as a powerful tool for the study of slowly growing anaerobic ammonium-oxidizing microorganisms. Appl. Microbiol. Biotechnol. 50, 589–596. doi: 10.1007/s002530051340
Thamdrup, B., and Dalsgaard, T. (2002). Production of N2 through anaerobic ammonium oxidation coupled to nitrate reduction in marine sediments. Appl. Environ. Microbiol. 68, 1312–1318. doi: 10.1128/aem.68.3.1312-1318.2002
Thamdrup, B., Dalsgaard, T., and Revsbech, N. P. (2012). Widespread functional anoxia in the oxygen minimum zone of the Eastern South Pacific. Deep Sea Res. Part I Oceanogr. Res. Pap. 65, 36–45. doi: 10.1016/j.dsr.2012.03.001
Thomsen, S., Kanzow, T., Krahmann, G., Greatbatch, R. J., Dengler, M., and Lavik, G. (2016). The formation of a subsurface anticyclonic eddy in the Peru-Chile Undercurrent and its impact on the near-coastal salinity, oxygen, and nutrient distributions. J. Geophys. Res. Oceans 121, 476–501. doi: 10.1002/2015jc010878
van der Star, W. R. L., Miclea, A. I., Van dongen, U. G. J. M., Muyzer, G., Picioreanu, C., and Van Loosdrecht, M. C. M. (2008). The membrane bioreactor: a novel tool to grow anammox bacteria as free cells. Biotechnol. Bioeng. 101, 286–294. doi: 10.1002/bit.21891
Ward, B. B., Tuit, C. B., Jayakumar, A., Rich, J. J., Moffet, J., and Naqvi, S. W. A. (2008). Organic carbon, and not copper, controls denitrification in oxygen minimum zones of the ocean. Deep Sea Res. Part I Oceanogr. Res. Pap. 55, 1672–1683. doi: 10.1016/j.dsr.2008.07.005
Warembourg, F. R. (1993). “Nitrogen fixation in soil and plant system,” in Nitrogen Isotopes Techniques, eds R. Knowles and T. H. Blackburn (San Diego, CA: Academic Press), 127–156. doi: 10.1016/b978-0-08-092407-6.50010-9
Woebken, D., Fuchs, B. M., Kuypers, M. M. M., and Amann, R. (2007). Potential interactions of particle-associated anammox bacteria with bacterial and archaeal partners in the Namibian upwelling system. Appl. Environ. Microbiol. 73, 4648–4657. doi: 10.1128/aem.02774-06
Keywords: seasonal hypoxia/anoxia, denitrification, anammox, DNRA, nitrogen loss
Citation: Sarkar A, Naqvi SWA, Lavik G, Pratihary A, Naik H, Shirodkar G and Kuypers MMM (2020) Massive Nitrogen Loss Over the Western Indian Continental Shelf During Seasonal Anoxia: Evidence From Isotope Pairing Technique. Front. Mar. Sci. 7:678. doi: 10.3389/fmars.2020.00678
Received: 27 April 2020; Accepted: 27 July 2020;
Published: 13 August 2020.
Edited by:
Hongjie Wang, University of Delaware, United StatesReviewed by:
Antonio Bode, Instituto Español de Oceanografía (IEO), SpainXuefeng Peng, University of California, Santa Barbara, United States
Copyright © 2020 Sarkar, Naqvi, Lavik, Pratihary, Naik, Shirodkar and Kuypers. This is an open-access article distributed under the terms of the Creative Commons Attribution License (CC BY). The use, distribution or reproduction in other forums is permitted, provided the original author(s) and the copyright owner(s) are credited and that the original publication in this journal is cited, in accordance with accepted academic practice. No use, distribution or reproduction is permitted which does not comply with these terms.
*Correspondence: Amit Sarkar, YW1pdHNhcmthcjgxQGdtYWlsLmNvbQ==