 Gabriel A. Juma
 Adiel M. Magana3
 Githaiga N. Michael
- 1Department of Environmental Studies and Resource Development, Chuka University, Chuka, Kenya
- 2Department of Oceanography and Hydrography, Kenya Marine and Fisheries Research Institute, Mombasa, Kenya
- 3Department of Biological Sciences, Chuka University, Chuka, Kenya
- 4Department of Biological Sciences, University of Embu, Embu, Kenya
Seagrass and associated blue carbon ecosystems are important carbon sinks, and hence understanding their spatial and temporal variability is vital in appreciating their potential roles in climate change mitigation and adaptation. The Indo-Pacific region has the highest seagrass biodiversity, yet little focus has been made to compare seagrass habitat extent and carbon dynamics with their temperate counterparts. The present study assessed habitat characteristics and seagrass species distribution, diversity, and carbon storage in Eastern (marine) and Western (estuarine) mangrove-fringed creeks of Gazi Bay, Kenya. Data on species composition, canopy cover, biomass, and sediment organic carbon were collected in 80 plots of 0.25 × 0.25 m laid along transects established perpendicular to the waterline. Five species formation, viz., Thalassia hemprichii, Cymodocea rotundata, Cymodocea serrulata, Enhalus acoroides, and Thalassidendron ciliatum, were encountered as either single or mixed stands. There was a significant difference in total seagrass biomass between creeks (p < 0.01), with the Eastern creek recording a mean of 10.2 ± 0.6 Mg C ha–1 while the Western creek recording 4.3 ± 0.3 Mg C ha–1. In addition, sediment carbon to 1-m depth varied significantly (p < 0.01) between species in the two creeks and ranged from 98 to 302 Mg C ha–1, with the Eastern and Western creeks recording means of 258 ± 90 and 107 ± 21 Mg C ha–1, respectively. The total carbon stock from 50 ha of seagrasses in the Eastern creek was 13,420 Mg C, whereas in the 70 ha of the Western creek it was 7,769 Mg C. The study shows that seagrass community attributes such as species composition and productivity can vary dramatically over a small spatial extent due to differences in biophysical conditions and caution estimations of site-specific carbon stocks using generalized global values.
Introduction
Conservation of the blue carbon sink such as mangroves, tidal salt marshes, and seagrasses is important because of their contribution to climate change mitigation and adaptations. Despite their role in capturing and storing huge carbon stocks (Fourqurean et al., 2012; Rogelj et al., 2016), less information is available from blue carbon ecosystems when compared to their terrestrial counterparts (Huxham et al., 2018). The natural and human pressures on these habitats expose them to loss and degradation, leading to the release of CO2 back into the atmosphere and thereby hindering their role in carbon storage (Duarte et al., 2005; Howard et al., 2018).
Seagrass meadows are keystone ecosystems along the coasts providing a range of benefits to humans and other organisms, among them regulatory, support, provisioning, and cultural services (Hejnowicz et al., 2015; Nordlund et al., 2018). They contribute to nutrient cycling (Costanza et al., 1997) and sediment stabilization and provide nursery to over one fifth of the world’s 25 largest fisheries (Unsworth et al., 2019). They are efficient in carbon capture and storage (Duarte and Prairie, 2005; Gedan et al., 2009), hence necessitating their inclusion in carbon offsetting schemes (Howard et al., 2017; Herr et al., 2017). Despite their value, seagrasses across the world are threatened by a combination of both human and natural factors (Cabaço et al., 2008; Mazarrasa et al., 2017; Githaiga et al., 2019), contributing to the global estimated loss of 1.5% per year (Waycott et al., 2009; Pendleton et al., 2012).
Seagrass species thrive in varying habitats ranging from estuaries, mud flats, sheltered bays, and lagoons across wide latitudinal distributions ranging from temperate to tropical latitudes with varying geomorphological, hydrological, and ecological conditions (Lyimo et al., 2018; Bulmer et al., 2020). These affect the distribution and abundance of the seagrass species in their physiological and survival processes (Lyimo, 2016; Gullström et al., 2017; Mazarrasa et al., 2018). The integrity of these marine habitats is also likely to be affected by biophysical factors such as water currents, day length, epiphytes, wave action, temperature, light availability, salinity, and substrate type and depth (Hemminga and Duarte, 2000; Green and Short, 2003). Additionally, anthropogenic stressors upstream or along the coastline, such as effluent discharge and agricultural activities, facilitate sediment and nutrient loading, thereby affecting seagrass health status. Direct effects are on structural traits such as cover, density, and biomass accumulation that subsequently influence seagrass sediment organic carbon (Corg) sequestration and deposition in the soil through three major processes: biomass accumulation and productivity, allochthonous Corg load in the water column, and the burial rates in sediment (Serrano et al., 2016a, b; Mazarrasa et al., 2018). Largest of the carbon pools is the sediment organic carbon comprising autochthonous and allochthonous carbon which may be deposited for millennia in sediment, though in some conditions get remineralized, leading to further CO2 emissions (Kennedy et al., 2010). Seagrass meadows have a larger global spatial extent when compared to other blue carbon sinks (Mcleod et al., 2011). They occupy a global coverage of 3,000 km2 with more than 70 species (Small and Nicholls, 2003; Short et al., 2011). Species vary in abundance and distribution across latitudes, with the tropical bioregions having the highest diversity at 24 out of the known 60 species globally (Short et al., 2007). Compared to other blue carbon sinks, there is less research focusing on seagrass carbon dynamics, leading to uncertainties in the seagrass habitat extent and contribution to the blue carbon budget. In the African coastline for example, there is still a huge paucity of information regarding seagrass habitat extent, quantitative carbon estimates, and habitat influence despite the extensive meadows (Githaiga et al., 2016, 2017).
This study assessed habitat characteristics and the carbon stocks of two seagrass meadows in Gazi Bay, Kenya, that lies within the East African coastline. We hypothesized that the seagrass distribution, abundance, and carbon stocks differ significantly between the estuarine and marine seagrass meadows. The bay is known to host a high seagrass diversity, with up to 12 species described in the Western Indian Ocean (WIO) region occurring here (Ochieng and Erftemeijer, 2003). Our study on habitat variations and influence on seagrass carbon stocks is of significance as it provides a better understanding of tropical seagrass ecosystems for comparison with their temperate and subtropical counterparts. Additionally, as the first study assessing habitat influence on carbon storage in seagrass within the African tropics, it provides insights for the enhanced management of these critical ecosystems.
Materials and Methods
The Study Site
The study was carried out in the two creeks of Gazi Bay – Eastern creek (04.41610°S, 039.52610°E) and Western creek (04.41661°S, 039.51253°E) – in Kenya between May and September 2018. The Eastern creek lies on the eastern part of the bay bordering Mikoko Pamoja, a community-managed managed mangrove carbon offsetting project area in Gazi. It is characterized by shallow subtidal areas and channels that intersect the intertidal flats (Hemminga et al., 1994). Some areas have rocky substrate and macroalgae lying in close association with the seagrass species. The area of the eastern creek is estimated at 50 ha and lacks direct influence of freshwater (Figure 1). Key mangrove species fringing the eastern creeks are the Sonneratia alba and Rhizophora mucronate (Supplementary Figure S1).
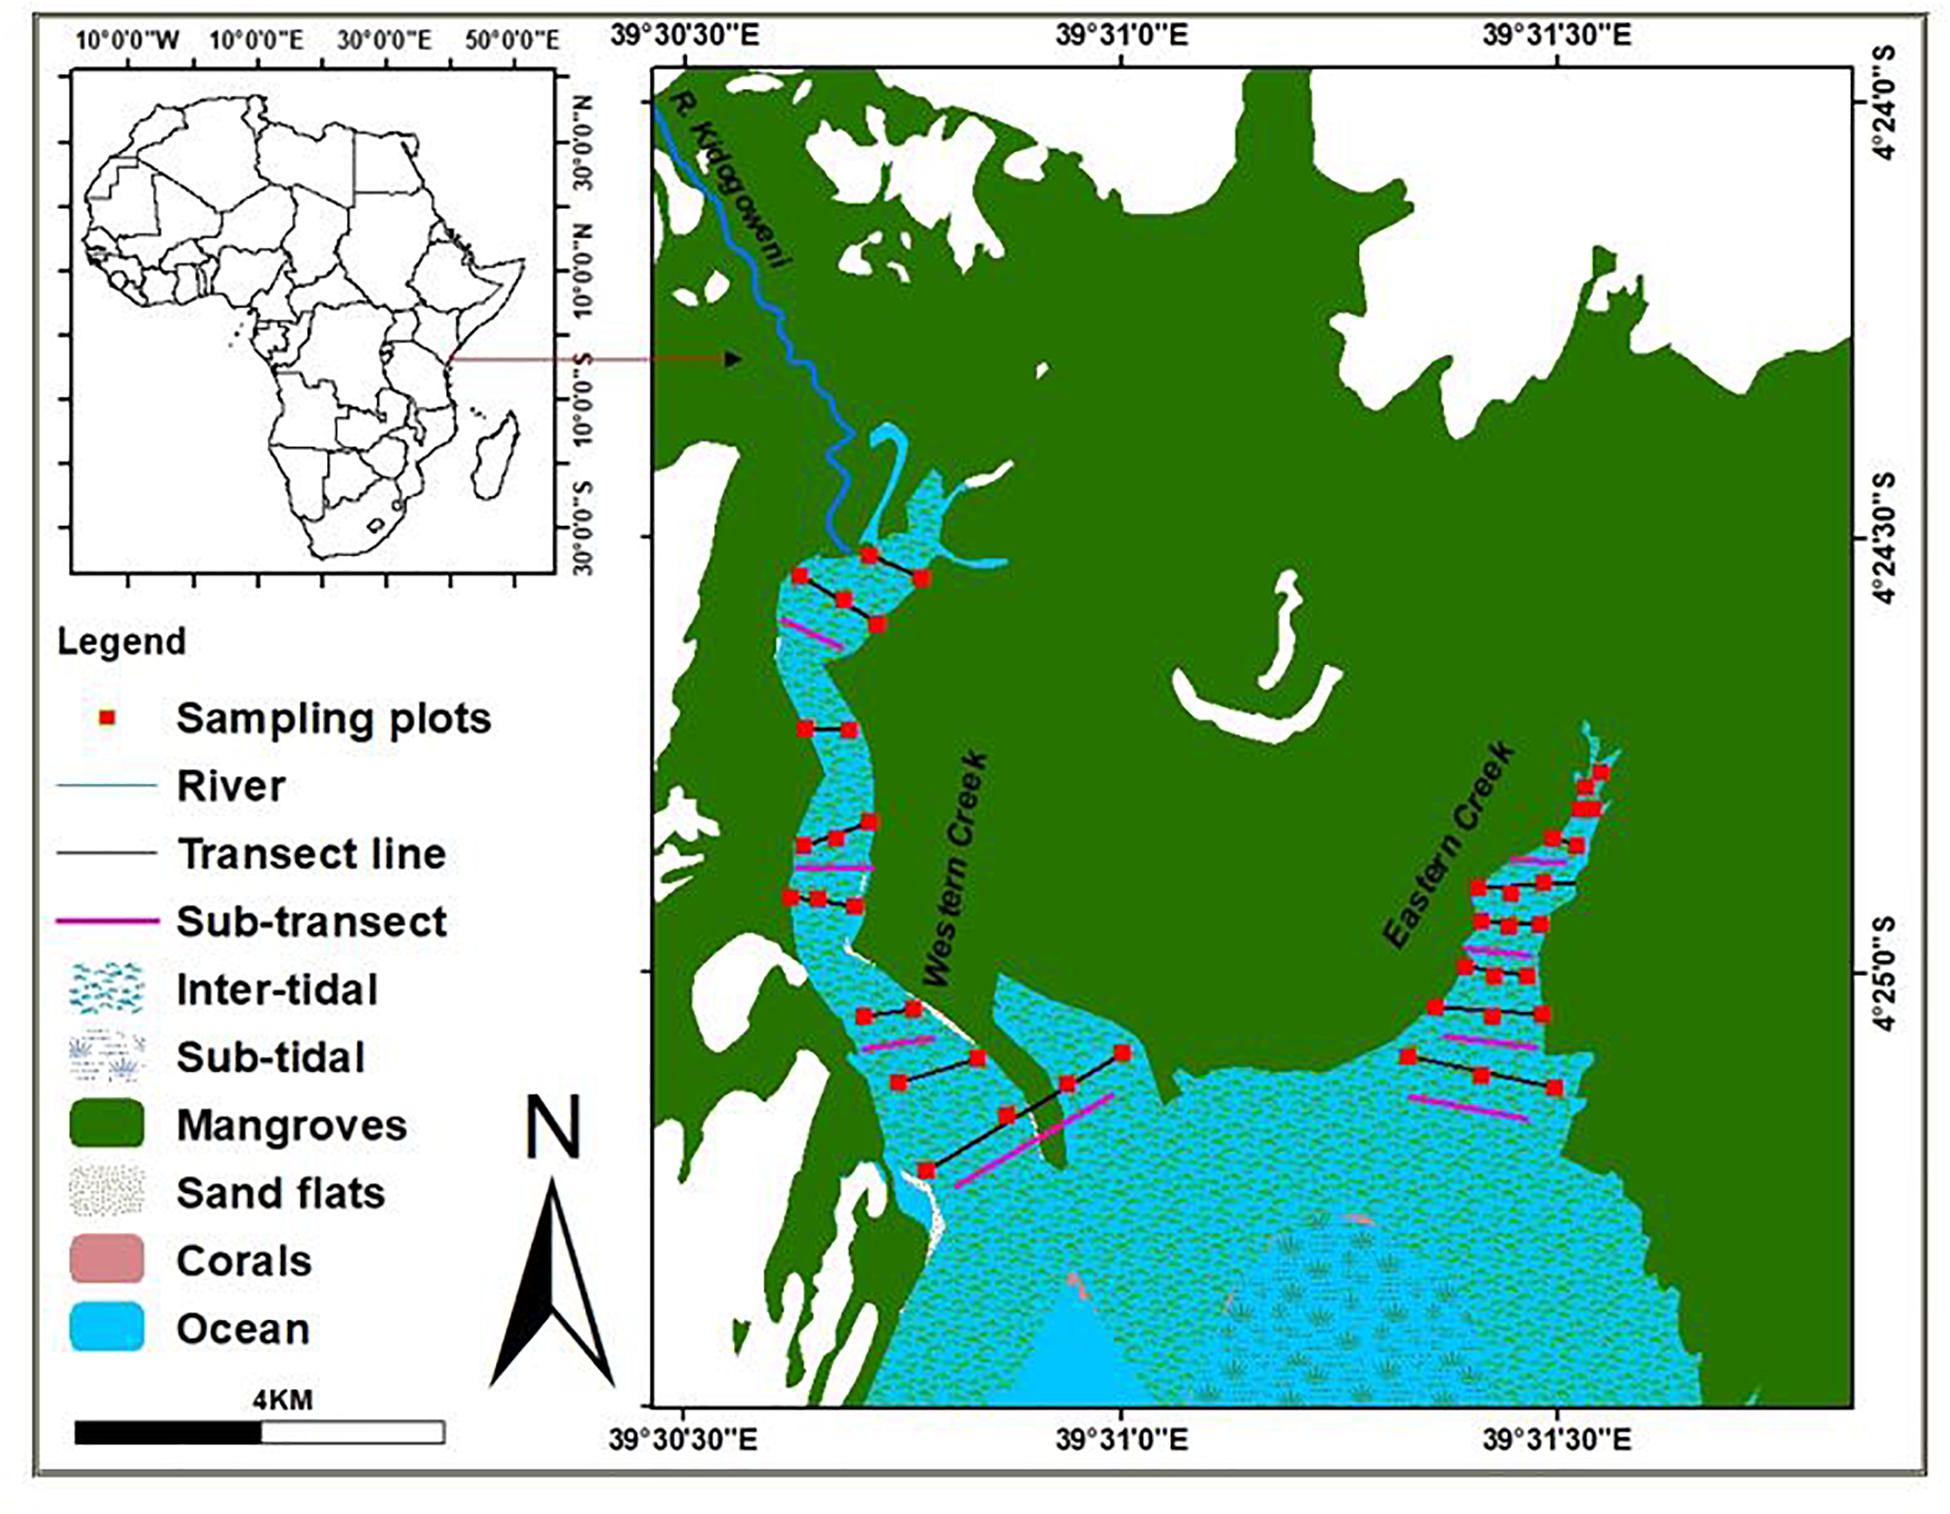
Figure 1. MAP of Gazi Bay indicating the creeks and seagrass-covered areas.
The Western creek, on the other hand, lies on the northwestern part of the bay outside the Mikoko Pamoja project area. This creek covers about 70 ha and is open to the seasonal river channel, River Kidogoweni, allowing inflow of freshwater during the rainy season. The creek is shallow with exposed sand banks during low tides (Figure 1). Due to proximity to human settlement in Gazi, the seagrasses in the western creek are highly influenced by fishing and tourism activities in the area (Supplementary Figure S2).
Sampling Design
The sampling approach adopted the protocol recommended by the Coastal Blue Carbon manual and the Intergovernmental Panel for Climate Change (IPCC, 2014). In each creek, eight transects at intervals of 100 m were initially laid perpendicular to the creek from the upper zone, adjacent to the mangrove ecosystem, all the way to the seagrass meadows near the open waters of the bay. Five quadrats measuring 0.5 × 0.5 m were laid along the transects at intervals of 25 m to determine the distribution and abundance of seagrass species in each creek. In assessing the spatial variability in sediment organic carbon and biomass between creeks, two sub-transects were laid within Thalassia hemprichii, Cymodocea rotundata, Cymodocea serrulata and mixed species stands in Western creek; and within Enhalus acoroides, Thalassodendron ciliatum, C. rotundata and mixed stands in the Eastern creek based on dominance. Five quadrates measuring 0.5 × 0.5 m were then laid along each sub-transect at intervals of 25 m. A total of 40 quadrats were established in each creek and 480 samples obtained for laboratory processing. Data collection was done during low spring tides, when the seagrass beds are easily accessible by foot.
Measurement of Physiochemical Parameters
Measurements for the analysis of the physiochemical parameters were done in situ, within the plots. Total dissolved solids (in milligrams per liter), conductivity (in microseconds per centimeter), water temperature (in degree Celsius), and pH were measured using the HANNA Combo PH and EC multimeter Hi-98129. The probe was immersed to 5 cm in water for every reading. Salinity (in parts per thousand) was measured in the creeks using a refractometer, while depth was measured using a tape.
Determination of the Species Type, Cover, Canopy Height, and the Shoot Density
Seagrass species were identified in situ using field manuals appropriate for the region included (Richmond, 2002). The percentage canopy cover was determined by visual estimate. Canopy height estimation involved measuring the total blade length of 10% of individual shoots randomly selected from the total number within the quadrat and calculating their mean heights. Shoot density was determined by counting the entire shoots within the quadrats and expressed in square meters (Howard et al., 2014).
Estimation of Above- and Belowground Biomass
Aboveground seagrass materials were harvested within the 0.25-m2 quadrats and cleaned using freshwater. Sorting was done followed by scraping using a razor blade to remove the epiphytes. The fronds were then washed in 10% HCl, rinsed to remove the calcareous materials, and then dried in an oven at 60°C for 72 h.
Estimation of the belowground biomass was done by taking four cores from each of the 0.25 m2 quadrats using a Russian peat sampler. The cores were washed through a 500 μm sieve. Cleaned material was sorted into necromass, rhizomes, and roots and then dried in an oven for 72 h at 60°C. Total biomass was determined by multiplying the biomass with the carbon conversion factor of 0.34 and extrapolation done per hectare (IPCC, 2014).
Determination of Sediment Corg
Two sediment cores, each having an extension of 50 cm, were obtained using a peat sampler within the quadrats. Since the relative content of the sedimentary carbon may be influenced by the sediment compaction, the difference in length from the upper part of the core to the surface of the sediment, outside and inside the corer, was assessed when passing it down into the sediment (IPCC, 2014). Since we intended to analyze for sediment Corg, plant material, infauna, and larger shells were removed from the sediment samples. The samples were sliced into subsections of 5 cm and oven-dried at 60°C for 72 h in the laboratory to attain a constant weight. The top 50 cm estimates of the sediment were extrapolated to 1 m in estimating the carbon stocks (Howard et al., 2014).
Measurement of Percentage Organic Matter
The organic matter content was determined using the loss of ignition (LOI) technique at 450°C for 6 h. The percentage organic matter (OM) was calculated using the formula
where % LOI is the percentage loss of ignition.
Depending on the organic matter in each of the sample, the sediment Corg values were calculated using the following relations (Howard et al., 2014):
where % LOI is the percentage loss of ignition and % Corg is the percentage sediment organic carbon.
Calculation of the Total Carbon Stocks
In order to determine the total carbon stocks in the two creeks, the soil dry bulk density (DBD) (sediment dry weight per unit volume) for each of the subsections per core was calculated using the formula:
where DBD is the dry bulk density.
The soil carbon density was then calculated as follows:
The amount of carbon in each core section was then calculated by multiplying the soil carbon density (in grams per cubic centimeter) by 5 cm (the thickness interval). The amount of carbon per core was then obtained by the addition of the carbon amount in all the sections of one core and the value extrapolated to 1 m (Howard et al., 2014; Githaiga et al., 2017). An average amount of carbon was then obtained for the two cores in each quadrat for sediment Corg.
To determine the total amount of carbon in the two meadows, the average carbon stocks from each pool was summed up for each creek and the sum multiplied by the area of the creek.
The variabilities and errors associated with the measurements were determined by calculating the standard deviation for each pool in each creek and multiplying by the area of the corresponding creek.
Data Analysis
Species richness, diversity, and abundance were determined by the Shannon–Wiener diversity index (H) and index of evenness.
To analyze for statistically significant variations between creeks and among species, data were tested for normality and homogeneity of variance and log-transformed, where assumptions of normality were not found. One-way ANOVA was used to test for variations in the aboveground, belowground, and sediment carbon among species. Where significant variations were detected, Tukey’s post hoc test was used to compare the means. Two-sample t-test was used to test for significant variations between the creeks. In all the statistical tests, the significant level was set at α = 0.05. A generalized linear model (GLM) with Gaussian error distribution was fitted to establish the relationship between sediment carbon and the environmental variables in the Eastern and Western creeks.
Results
Assessment of Physical–Chemical Parameters in Eastern and Western Creeks
Most of the physical–chemical parameters measured were found to vary significantly between the creeks. Depth ranged between 0.20 and 0.80 m in the Western creek (mean = 0.53 ± 0.31 m), while the values for the Eastern creek ranged between 0.50 and 1.50 m (mean = 0.93 ± 0.20 m) during the low tide when the samples were taken (Table 1). Salinity varied between the two creeks, with the Eastern creek recording higher values (mean = 34.7 PSU, range = 33–35 PSU). The Western creek had a mean of 30.0 PSU (range = 29–31 PSU). The two-sample t test revealed a significant variation between the creeks (t = 40.82, df = 70, p < 0.05) at the 95% confidence level.
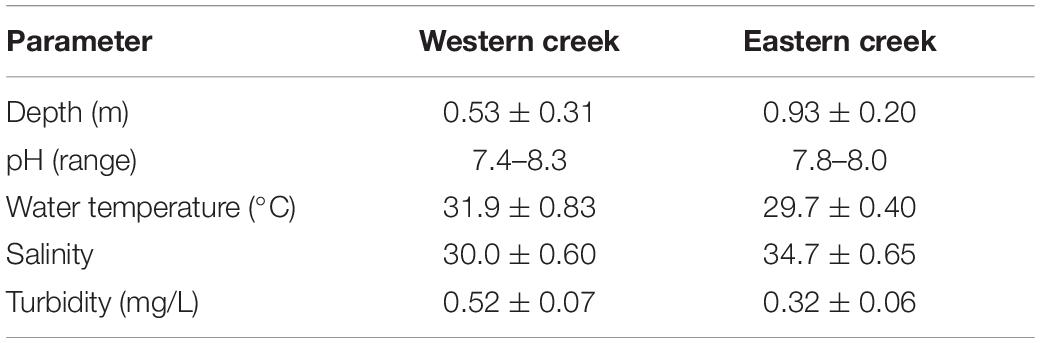
Table 1. Physical–chemical parameters in the Eastern and Western creeks.
Turbidity values were higher in the Western creek (mean = 0.52 ± 0.07 mg/L, range = 0.35–0.68 mg/L) than in the Eastern creek (mean = 0.32 ± 0.06 mg/L, range = 0.2–0.41 mg/L). The means recorded for the two creeks revealed a significant difference (t = −13.6, df = 76, p < 0.05) at the 95% confidence level. The pH for the Western creek ranged between 7.4 and 8.3, while the pH values for the Eastern creek ranged between 7.8 and 8.0 (Table 1). There was significant variation in the water temperature (t = −15.66, df = 51, p < 0.05) at the 95% confidence level, with the Western creek having higher values (mean = 31.9 ± 0.83°C, range = 30.3–33.2°C) while the Eastern creek had a mean of 29.7 ± 0.40°C, range = 29.0–30.2°C.
Seagrass Species Diversity and Distribution Between the Creeks
Nine seagrass species out of the 12 species recorded in the entire bay were encountered in the creeks (Table 2). Six species – C. rotundata, Halodule uninervis, T. hemprichii, C. serrulata, Syringodium isoetifolium, and E. acoroides – were observed in both creeks. However, Halophila stipulacea and Halophila ovalis were only observed in the Western creek, while T. ciliatum was observed in the Eastern creek. The most common species in the Eastern creek was T. ciliatum, while C. rotundata was the most common in the Western creek (Table 2).
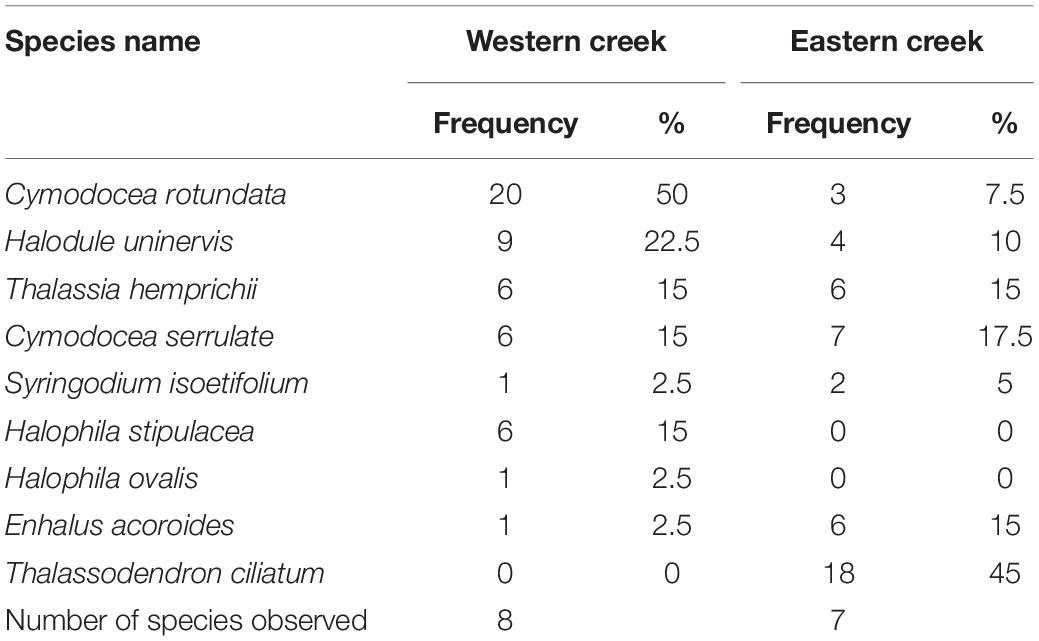
Table 2. Seagrass species distribution and frequency in the Eastern and Western creeks.
The diversity of seagrass species (expressed as the Shannon–Wiener index, H) was higher in the Eastern creek (H = 1.71) than in the Western creek (H = 1.67). Similarly, the Eastern creek had a higher evenness value (E = 0.88) than the Western creek (E = 0.80). However, there was no significant difference in seagrass species diversity between the two creeks (t = 0.11, df = 13, p = 0.46).
Variation in Aboveground and Belowground Biomass Between Creeks and Among Species
The mean values in aboveground biomass between the two creeks were significantly different (t = -3.422, df = 79, p < 0.001) at the 95% confidence level, with the Eastern creek having higher biomass (1.01 ± 0.15 Mg C ha–1, range = 0.24–3.79 Mg C ha–1) than the Western creek (0.49 ± 0.03 Mg C ha–1, range = 0.21–1.03 Mg C ha–1). In the two creeks, the biomass values varied significantly between species [F(7, 79) = 38.35, p < 0.001], with the highest being recorded in T. ciliatum species (2.38 ± 0.28 Mg C ha–1, range = 1.22–3.79 Mg C ha–1) and the lowest in C. rotundata of the Western creek (0.35 ± 0.04 Mg C ha–1, range = 0.21–0.56 Mg C ha–1).
Belowground biomass indicated a significant difference (t = −7.25, df = 79, p < 0.001) at the 95% confidence interval, with the Eastern creek recording the highest at 9.17 ± 0.67 Mg C ha–1 (range = 0.76–16.72 Mg C ha–1) while the Western creek had 3.84 ± 0.29 Mg C ha–1 (range = 0.67–8.92 Mg C ha–1) (Figure 2). Belowground biomass was also significantly different among species [F(7, 79) = 12.98, p < 0.001], with E. acoroides recording the highest at 12.35 ± 1.02 Mg C ha–1 (range = 8.19–16.72 Mg C ha–1) while the lowest was in C. rotundata of the Western creek at 3.07 ± 0.40 Mg C ha–1 (range = 1.14–4.42 Mg C ha–1).
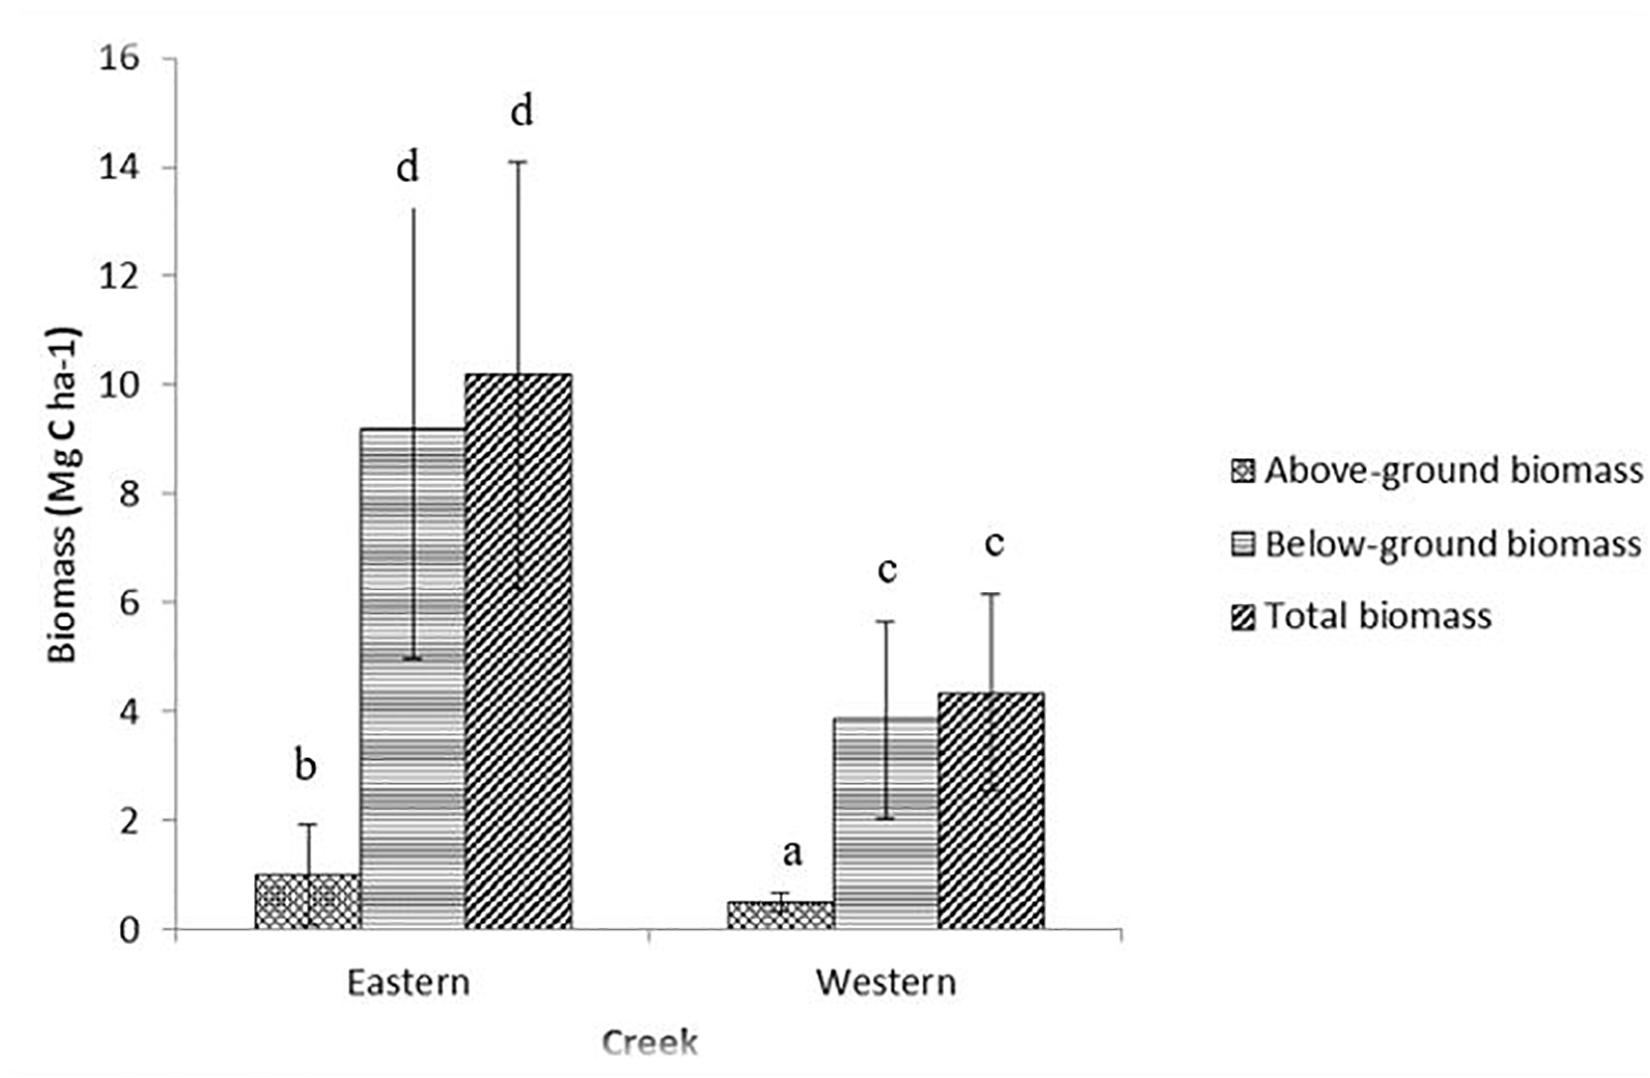
Figure 2. Variations in biomass between the Eastern and Western creeks (mean ± 95% CI). Letters indicate significant differences in biomass (p < 0.01).
Comparison of Sediment Organic Carbon Among the Species and in the Creeks
Soil properties (dry bulk density and percentage organic carbon) significantly varied between the creeks (p < 0.001). These differences strikingly persisted to 50 cm depth (Figure 3). The Western creek recorded a higher mean dry bulk density at 1.49 ± 0.38 g cm–3, while the Eastern creek recorded 0.87 ± 0.32 g cm–3. On the other hand, the Eastern creek recorded a higher organic carbon concentration at 3.56%, while the Western creek recorded an average of 0.76%.
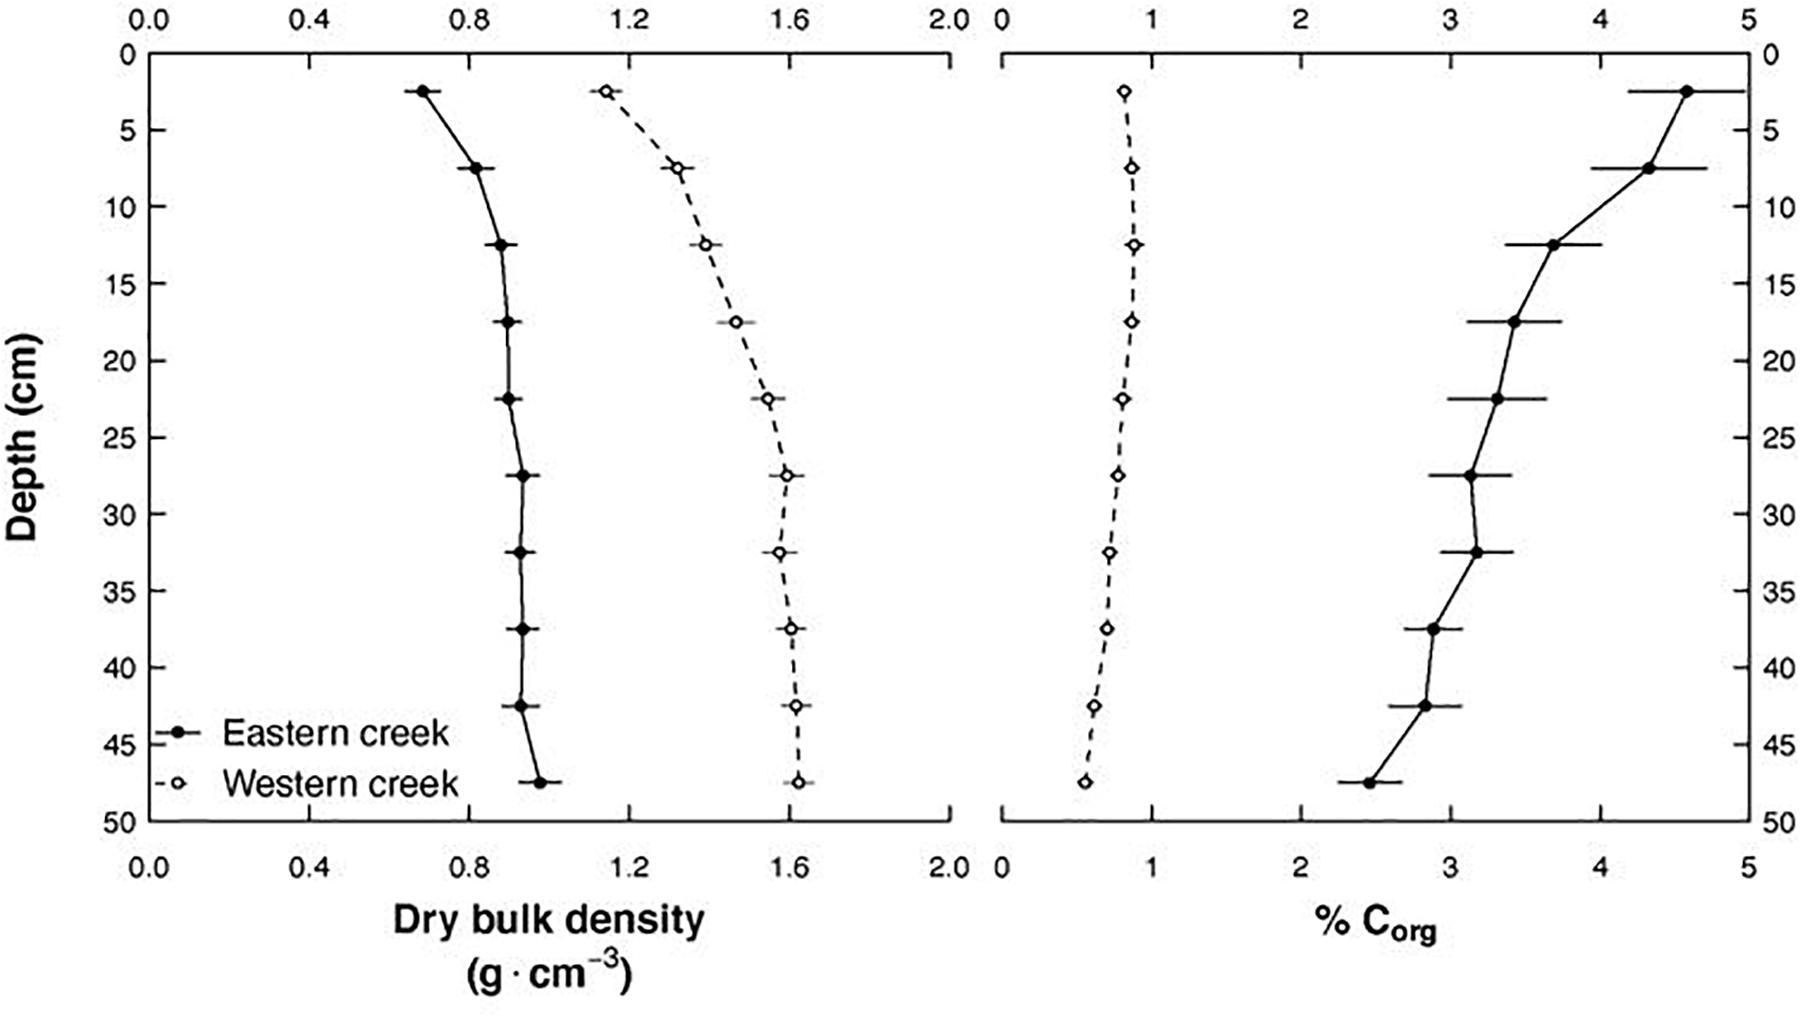
Figure 3. Changes in soil dry bulk density and percentage organic carbon along depth to 50 cm and between the Eastern and Western creeks.
Sediment organic carbon differed among the species, with the highest values recorded in the mixed stands of the Eastern creek at 302.45 ± 43.23 Mg C ha–1 while C. rotundata of the Western creek had the lowest at 97.57 ± 7.74 Mg C ha–1 (mean ± 95% CI). One-way ANOVA revealed a significant difference among the species Corg [F(7, 79) = 20.28, p < 0.001]. Sediment Corg also varied between the creeks, with the Eastern creek recording higher values at 258.21 ± 90.12 Mg C ha–1 (range = 117.85–544.65 Mg C ha–1) while the Western creek recorded 106.66 ± 21.36 Mg C ha–1 (range = 67.25–160.48 Mg C ha–1) (Figure 4). The two-sample t tests revealed a significant difference in the sediment Corg of the two creeks (t = −10.86, df = 44, p < 0.001).
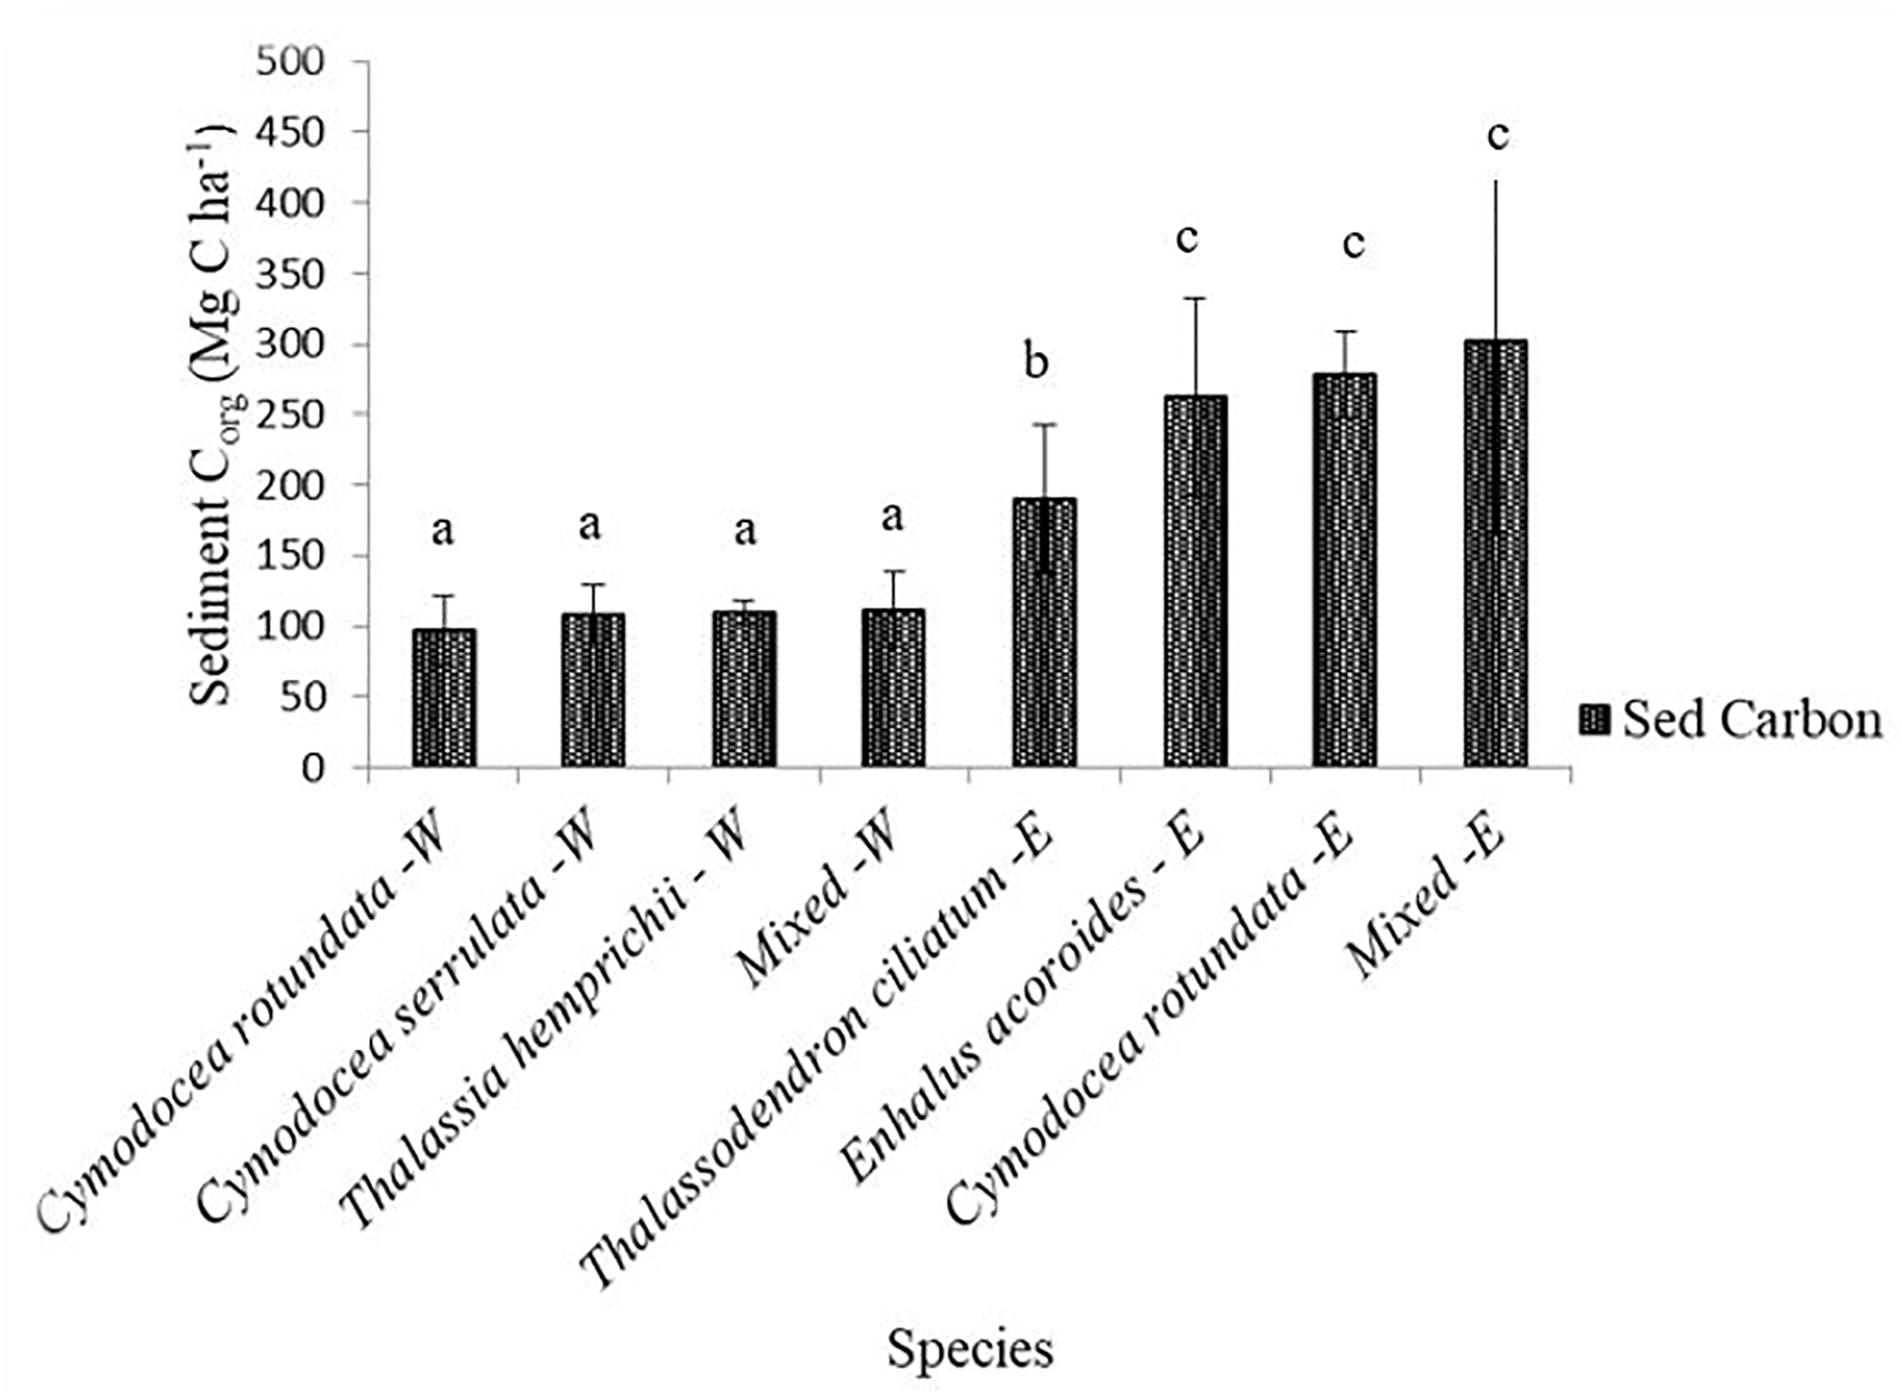
Figure 4. Variations in sediment Corg to 1 m depth among species in the Eastern and Western creeks (mean ± 95% CI). Sed Carbon, sediment organic carbon; E, Eastern; W, Western. Letters a, b and c indicate significant difference in sediment carbon among species (p < 0.001).
Environmental Factors Explaining Corg in Eastern and Western Creeks
A GLM, with Gaussian error distribution, was fitted separately for each creek with sediment carbon as the continuous response variable. In the Eastern creek, GLM was constructed for seagrass species, belowground biomass, aboveground biomass, temperature, salinity, depth, shoot density, and seagrass shoot height as the explanatory variable. Turbidity was found to correlate above 0.7 with depth while temperature correlated to pH. Using the Akaike’s information criterion (AIC), species (T. ciliatum, p < 0.01) and temperature (p < 0.03) had a significant influence on sediment carbon. The residuals of the best model (AIC = 22) are presented in Supplementary Figure S3.
In the Western creek, a correlation above 0.7 was found between depth and turbidity. A GLM was fitted for aboveground biomass, belowground biomass, species, shoot density, shoot height, pH, salinity, temperature, and turbidity. Aboveground biomass (p < 0.03), turbidity (p < 0.05), total shoot density (0.008), and species (C. serrulate: p = 0.03; mixed species: 0.05; and T. hemprichii: p < 0.06) were found to significantly influence sediment carbon stocks in the Western creek. The residuals of the model with the lowest AIC of 336 are shown in Supplementary Figure S4.
Discussion
Sediment Corg Stock Variations Between the Creeks
The current study compared seagrass habitats in the Eastern and Western creeks of Gazi Bay, Kenya, in terms of their species composition, distribution and the carbon stocks in the above- and belowground components. The Eastern creek was dominated by T. ciliatum and E. acoroides that are characterized by long leaves and have higher shoot density, signifying more sediment trapping. Higher values for rhizomes, roots, and necromass were recorded in this creek. On the other hand, Western creek was dominated by small-leaved and short-lived species such as C. rotundata, which could be attributed to human perturbations and sediment erosion. It was also characterized by lower diversity, abundance, and shoot density of the seagrass communities. Such meadows are known to have lower dissolved organic carbon (DOC) supply, which is likely to affect the percentage of organic carbon through the reduced decomposition of the refractory organic compounds. This difference in species composition and shoot density between the creeks may therefore partly explain the differences in the concentrations of organic matter between them (Serrano et al., 2018; Enríquez et al., 2019), resulting in variations in sediment carbon between the creeks.
The study found that the Eastern creek had higher seagrass biomass and sediment Corg values for the top 1 m when compared to the Western creek and the values obtained by Githaiga et al. (2017) in the open waters of the bay (236 ± 24 Mg C ha–1). Similarly, the average Corg values obtained for the two creeks are above the mean derived from the global seagrass data set at 166 Mg C ha–1, although they are within the global range of 115.5–829.2 Mg C ha–1 (Fourqurean et al., 2012). Recent studies have indicated variations in organic carbon stock estimates and other seagrass community attributes such as species over such smaller spatial scales (Lavery et al., 2013; Röhr et al., 2016).
In the two creeks, sediment Corg stocks varied with species. This was the same case in biomass and other structural attributes such as shoot density and canopy heights, which could explain the variations in the carbon storage capacities. Large-leaved species are efficient in sequestering carbon as well as in trapping allochthonous carbon (Agawin and Duarte, 2002; Mellors et al., 2002). They also tend to establish more permanent and stable beds than the ephemeral and small species due to their higher resistance to hydrodynamic energy, hence the high carbon stocking (Ondiviela et al., 2014; Huxham et al., 2018). Additionally, rhizomes, roots, necromass, and DOC differ among species and contribute substantially to the primary production, resulting in more Corg in complex meadows with high shoot density and belowground biomass than in sparse meadows (Kaldy et al., 2006; Armitage and Fourqurean, 2016). The burial rates of both autochthonous and allochthonous organic carbon are estimated at 50% originating from other ecosystems (Kennedy et al., 2010; Duarte and Krause-Jensen, 2017). Past studies have shown that Corg from the adjacent mangrove ecosystems were transported to the seagrass meadows in both creeks (Bouillon et al., 2007; Huxham et al., 2018).
Nine seagrass species out of the 12 recorded in Gazi Bay were encountered in the two creeks during the study (Ochieng and Erftemeijer, 2003), with the Eastern creek having higher seagrass species diversity and abundance. Turbidity and depth were found to influence the species distribution and biomass between the creeks. The dominance of T. ciliatum in the Eastern creek can be attributed to the stable state of this creek. It is usually intolerant of any freshwater input and occupies hard and rocky substrates (Waycott et al., 2004). On the other hand, the pioneer and short-lived species H. ovalis and H. stipulacea were recorded only in the Western creek. The availability of an inflow channel (River Kidogoweni) in the Western creek and the shifting sand banks make this area highly disturbed, which could explain the existence of H. ovalis and H. stipulacea and the higher abundance of C. rotundata, which are usually pioneer species and occupy disturbed areas (Noel et al., 2012). Additionally, destructive fishing practices such as boat dredging were observed in this area and could contribute to the disturbance. The higher turbidity recorded in the Western creek may also account for the low seagrass diversity in this creek. Reduction of irradiance as a result of turbidity hinders the photosynthetic process, thereby affecting seagrass morphology and growth (Lee et al., 2007; Lavery et al., 2013).
Aboveground and Belowground Biomass
The total biomass estimates for the current study were within range when compared to other published data. The biomass values compare well with the 5.9 ± 0.9 Mg C ha–1 recorded by Githaiga et al. (2017) in the open water of the bay, although higher than the global mean of 2.51 ± 0.49 Mg C ha–1 (Fourqurean et al., 2012). The biomass values significantly varied between the creeks and were highly correlated to species and plant shoot density. Seagrass meadows with larger species have higher aboveground and belowground biomass compared to smaller species (Duarte and Chiscano, 1999). The variations in biomass among species and between creeks enhance the meadows’ efficiency to sequester autochthonous Corg. The estuarine environment of the Western creek is likely to subject this seagrass habitat to periodic freshwater inundation, leading to low light levels and burial by suspended sediments, runoff turbidity, and nutrient loading (McDonald et al., 2016). This may lower the plant growth rate and shoot density in this creek, hence lowering biomass (Peralta et al., 2008). Additionally, the proximity of this creek to human settlement increases the prevalence of anthropogenic impacts on seagrass through boat dredging and seine net fishing, hence affecting seagrass survival and the expansion of meadows. This was observed during the study and may explain the lower biomass values recorded in the Western creek. The Eastern creek had species with numerous stems that have the ability to withstand wave action when compared to the other species. Enhalus, which also dominated this area, has big rhizomes, extensive root system, and large fronds, accumulating greater biomass in the belowground components during growth and development (Waycott et al., 2004). In general, the variation is attributed to differences in the biophysical parameters leading to different physiological, phenotypic, and morphological growth patterns of seagrass.
Total Carbon Stocks
The current study focused on seagrass carbon stocks within the mangrove-fringed creeks of Gazi Bay. It compared the carbon stocks between the Eastern and Western creeks that have varying biophysical features. In the Eastern creek (50 ha), the total carbon stocks in the three carbon pools is 13,419.5 ± 4,547 Mg. On the other hand, the Western creek (70 ha) has a total stock of 7,769.3 ± 1,518 Mg of carbon. Although the sediment carbon values were extrapolated to 1-m depth following IPCC (2014) and Githaiga et al. (2017), this may be a limitation since sediment Corg decreases with depth. Additionally, future studies may focus on carbon sources and the sediment accumulation rates. Based on the IPCC’s tier 1 emission factor of 7.9 tons of C per hectare, protecting seagrass in these two creeks will prevent emissions of 948 Mg CO2 eq. year-1 (IPCC, 2014). (Tier 1 emission factor uses a gain–loss concept to estimate carbon dioxide emissions, based on general conversion factors, obtained from globally combined databases; Howard et al., 2014). The sediment Corg data contributes information on the seagrass carbon budget of the greater Gazi Bay region and adds to our understanding of the total Corg of seagrass along the Kenyan coast and the African coastline.
This study shows that the community attributes (species) and carbon stocks (biomass and soil) of seagrass meadows can differ dramatically over small spatial scales and complements prior studies. Intertidal areas that are under the influence of riverine inputs (and greater human disturbance) can have lower species diversity and reduced carbon stocks when compared to those areas that do not experience these impacts. This type of spatial variability should be considered when designing blue carbon projects.
Data Availability Statement
All datasets generated for this study are included in the article/Supplementary Material.
Author Contributions
GJ performed conceptualization of the draft, data curation, worked on the methodology, research administration, research investigation, the formal data analysis, writing the original draft, and performed editing and review. AM carried out conceptualization of the research, methodology development, supervision, validation of methods, visualization, writing, review and final editing. GM performed conceptualization, helped in developing methodology, supervision, project administration, validation of methods, and writing of the manuscript (review and editing). JK is a Pew Fellow (2019). He carried out research conceptualization, aligning methodology, field supervision, visualization, and manuscript writing (review and editing). All authors contributed to the article and approved the submitted version.
Funding
The research was funded by the Newton Fund from the British Council (Grant No. 275670159).
Conflict of Interest
The authors declare that the research was conducted in the absence of any commercial or financial relationships that could be construed as a potential conflict of interest.
Acknowledgments
The study was done under the scientific framework of Kenya Marine and Fisheries Research Institute under “Punguza Hewa Kaa Project,” with funding from the UK’s Newton Institutional Link. We thank Chuka University for technical support. We acknowledge the contribution of the KMFRI’s team, Derrick Omollo, Charles Muthama, Peter Musembi, Tom Kisiengo, George Onduso, and Laitani Suleiman, for their field and laboratory assistance.
Supplementary Material
The Supplementary Material for this article can be found online at: https://www.frontiersin.org/articles/10.3389/fmars.2020.00696/full#supplementary-material
FIGURE S1 | A section of seagrass meadows in Mangrove fringed Eastern creek.
FIGURE S2 | A section of seagrass meadows in the Western creek.
FIGURE S3 | Residuals of best fitted model (AIC = 22) for the Eastern Creek.
FIGURE S4 | Residuals of best fitted model (AIC = 336) for variables the Western creek.
References
Agawin, N. S., and Duarte, C. M. (2002). Evidence of direct particle trapping by a tropical seagrass meadow. Estuaries Coast. 25, 1205–1209. doi: 10.1007/bf02692217
Armitage, A. R., and Fourqurean, J. W. (2016). Carbon storage in seagrass soils: long-term nutrient history exceeds the effects of near-term nutrient enrichment. Biogeosciences 13, 313–321. doi: 10.5194/bg-13-313-2016
Bouillon, S., Dehairs, F., Velimirov, B., Abril, G., and Borges, A. V. (2007). Dynamics of organic and inorganic carbon across contiguous mangrove and seagrass systems (Gazi Bay, Kenya). J. Geophys. Res. 112:G02018.
Bulmer, R. H., Stephenson, F., Jones, H. F., Townsend, M., Hillman, J. R., Schwendenmann, L., et al. (2020). Blue carbon stocks and cross-habitat subsidies. Front. Mar. Sci. 7:380. doi: 10.3389/fmars.2020.00380
Cabaço, S., Santos, R., and Duarte, C. M. (2008). The impact of sediment burial and erosion on seagrasses: a review. Estuar. Coast. Shelf Sci. 79, 354–366. doi: 10.1016/j.ecss.2008.04.021
Costanza, R., d’Arge, R., De Groot, R., Farber, S., Grasso, M., Hannon, B., et al. (1997). The value of the world’s ecosystem services and natural capital. Nature 387, 253–260.
Duarte, C. M., and Chiscano, C. L. (1999). Seagrass biomass and production: a reassessment. Aquat. Bot. 65, 159–174. doi: 10.1016/s0304-3770(99)00038-8
Duarte, C. M., and Krause-Jensen, D. (2017). Export from seagrass meadows contributes to marine carbon sequestration. Front. Mar. Sci. 4:13. doi: 10.3389/fmars.2017.00013
Duarte, C. M., Middelburg, J. J., and Caraco, N. (2005). Major role of marine vegetation on the oceanic carbon cycle. Biogeosciences 2, 1–8. doi: 10.5194/bg-2-1-2005
Duarte, C. M., and Prairie, Y. T. (2005). Prevalence of heterotrophy and atmospheric CO2 emissions from aquatic ecosystems. Ecosystems 8, 862–870. doi: 10.1007/s10021-005-0177-4
Enríquez, S., Olivé, I., Cayabyab, N., and Hedley, J. D. (2019). Structural complexity governs seagrass acclimatization to depth with relevant consequences for meadow production, macrophyte diversity and habitat carbon storage capacity. Sci. Rep. 9, 1–14.
Fourqurean, J. W., Duarte, C. M., Kennedy, H., Marba, N., Holmer, M., Mateo, M. A., et al. (2012). Seagrass ecosystems as a globally significant carbon stock. Nat. Geosci. 5, 505–509. doi: 10.1038/ngeo1477
Gedan, K. B., Silliman, B. R., and Bertness, M. D. (2009). Centuries of human-driven change in salt marsh ecosystems. Ann. Rev. Mar. Sci. 1, 117–141. doi: 10.1146/annurev.marine.010908.163930
Githaiga, M. N., Frouws, A. M., Kairo, J. G., and Huxham, M. (2019). Seagrass removal leads to rapid changes in fauna and loss of carbon. Front. Ecol. Evolut. 7:62.
Githaiga, M. N., Gilpin, L., Kairo, J. G., and Huxham, M. (2016). Biomass and productivity of seagrasses in Africa. Bot. Mar. 59, 173–186. doi: 10.1515/bot-2015-0075
Githaiga, M. N., Kairo, J. G., Gilpin, L., and Huxham, M. (2017). Carbon storage in the seagrass meadows of Gazi Bay, Kenya. PLoS One 12:e0177001. doi: 10.1371/journal.pone.0177001
Green, E. P., and Short, F. T. (2003). World Atlas of Seagrasses. Berkeley, CA: University of California Press.
Gullström, M., Lyimo, L. D., Dahl, M., Samuelsson, G. S., Eggertsen, M., Anderberg, E., et al. (2017). Blue carbon storage in tropical seagrass meadows relates to carbonate stock dynamics, plant–sediment processes, and landscape context: insights from the Western Indian ocean. Ecosystems 21, 551–566. doi: 10.1007/s10021-017-0170-8
Hejnowicz, A. P., Kennedy, H., Rudd, M. A., and Huxham, M. R. (2015). Harnessing the climate mitigation, conservation and poverty alleviation potential of seagrasses: prospects for developing blue carbon initiatives and payment for ecosystem service programmes. Front. Mar. Sci. 2:32. doi: 10.3389/fmars.2015.00032
Hemminga, M. A., Slim, F. J., Kazungu, J., Ganssen, G. M., Nieuwenhuize, J., and Kruyt, N. M. (1994). Carbon outwelling from a mangrove forest with adjacent seagrass beds and coral reefs (Gazi Bay, Kenya). Mar. Ecol. Progr. Ser. 106, 291–301. doi: 10.3354/meps106291
Herr, D., von Unger, M., Laffoley, D., and McGivern, A. (2017). Pathways for implementation of blue carbon initiatives. Aquat. Conserv. 27, 116–129. doi: 10.1002/aqc.2793
Howard, J., Hoyt, S., Isensee, K., Telszewski, M., and Pidgeon, E. (2014). Coastal Blue Carbon: Methods for Assessing Carbon Stocks and Emissions Factors in Mangroves, Tidal Salt Marshes, and Seagrass Meadows. Arlington, VA: Conservation International, Intergovernmental Oceanographic Commission of UNESCO, International Union for Conservation of Nature, 99–107.
Howard, J., Sutton-Grier, A., Herr, D., Kleypas, J., Landis, E., Mcleod, E., et al. (2017). Clarifying the role of coastal and marine systems in climate mitigation. Front. Ecol. Environ. 15:42–50. doi: 10.1002/fee.1451
Howard, J. L., Creed, J. C., Aguiar, M. V., and Fouqurean, J. W. (2018). CO2 released by carbonate sediment production in some coastal areas may offset the benefits of seagrass “Blue Carbon” storage. Limnol. Oceanogr. 63, 160–172. doi: 10.1002/lno.10621
Huxham, M., Whitlock, D., Githaiga, M., and Dencer-Brown, A. (2018). Carbon in the coastal seascape: how interactions between mangrove forests, Seagrass meadows and tidal marshes influence carbon storage. Curr. For. Rep. 4, 101–110. doi: 10.1007/s40725-018-0077-4
IPCC (2014). 2013 Supplement to the 2006 IPCC Guidelines for National Greenhouse Gas Inventory, Wetlands, Vol. 2. Geneva: IPCC.
Kaldy, J. E., Eldridge, P. M., Cifuentes, L. A., and Jones, W. B. (2006). Utilization of DOC from seagrass rhizomes by sediment bacteria: 13C-tracer experiments and modeling. Mar. Ecol, Progr. Ser. 317, 41–55. doi: 10.3354/meps317041
Kennedy, H., Beggins, J., Duarte, C. M., Fourqurean, J. W., Holmer, M., Marbà, N., et al. (2010). Seagrass sediments as a global carbon sink: isotopic constraints. Glob. Biogeochem. Cycles 24:GB4026. doi: 10.1029/2010GB003848
Lavery, P. S., Mateo, M. Á., Serrano, O., and Rozaimi, M. (2013). Variability in the carbon storage of seagrass habitats and its implications for global estimates of blue carbon ecosystem service. PLoS One 8:e73748. doi: 10.1371/journal.pone.0073748
Lee, K. S., Park, S. R., and Kim, Y. K. (2007). Effects of irradiance, temperature, and nutrients on growth dynamics of seagrasses: a review. J. Exp. Mar. Biol. Ecol. 350, 144–175. doi: 10.1016/j.jembe.2007.06.016
Lyimo, L. D. (2016). Carbon Sequestration Processes in Tropical Seagrass Beds. Doctoral Dissertation, Stockholm University, Stockholm.
Lyimo, L. D., Dahl, M., Samuelsson, G. S., Eggertsen, M., Anderberg, E., Rasmusson, L. M., et al. (2018). Blue carbon storage in tropical seagrass meadows relates to carbonate stock dynamics, plant-sediment processes, and landscape context: insights from the Western Indian Ocean. Ecosystems 21, 551–566. doi: 10.1007/s10021-017-0170-8
Mazarrasa, I., Marbà, N., Garcia-Orellana, J., Masqué, P., Arias-Ortiz, A., and Duarte, C. M. (2017). Dynamics of carbon sources supporting burial in seagrass sediments under increasing anthropogenic pressure. Limnol. Oceanogr. 62, 1451–1465. doi: 10.1002/lno.10509
Mazarrasa, I., Samper-Villarreal, J., Serrano, O., Lavery, P. S., Lovelock, C. E., Marbà, N., et al. (2018). Habitat characteristics provide insights of carbon storage in seagrass meadows. Mar. Pollut. Bull. 134, 106–117. doi: 10.1016/j.marpolbul.2018.01.059
McDonald, A. M., Prado, P., Heck, K. L. Jr., Fourqurean, J. W., Frankovich, T. A., Dunton, K. H., et al. (2016). Seagrass growth, reproductive, and morphological plasticity across environmental gradients over a large spatial scale. Aquat. Bot. 134, 87–96. doi: 10.1016/j.aquabot.2016.07.007
Mcleod, E., Chmura, G. L., Bouillon, S., Salm, R., Björk, M., Duarte, C. M., et al. (2011). A blueprint for blue carbon: toward an improved understanding of the role of vegetated coastal habitats in sequestering CO2. Front. Ecol. Environ. 9, 552–560. doi: 10.1890/110004
Mellors, J., Marsh, H., Carruthers, T. J. B., and Waycott, M. (2002). Testing the sediment-trapping paradigm of seagrass: do seagrass influence nutrient status and sediment structure in tropical intertidal environments? Bull. Mar. Sci. 71, 1215–1226.
Noel, H. W., Lucero, R. S., Parcasio, J. R., Saturnino, C., Labis, P. Y., and Lucero, M. J. (2012). Productivity and Distribution of Seagrass Communities in Davao Gulf. Available online at: http://hdl.handle.net/2433/154040 (accessed July 24, 2018).
Nordlund, L. M., Jackson, E. L., Nakaoka, M., Samper-Villarreal, J., Beca-Carretero, P., and Creed, J. C. (2018). Seagrass ecosystem services–what’s next? Mar. Pollut. Bull. 134, 145–151. doi: 10.1016/j.marpolbul.2017.09.014
Ochieng, C. A., and Erftemeijer, P. L. A. (2003). “Kenya and Tanzania,” in World Atlas of Seagrasses, eds E. P. Green and F. T. Short (Berkeley: University of California Press), 82.
Ondiviela, B., Losada, I. J., Lara, J. L., Maza, M., Galván, C., Bouma, T. J., et al. (2014). The role of seagrasses in coastal protection in a changing climate. Coast. Eng. 87, 158–168. doi: 10.1016/j.coastaleng.2013.11.005
Pendleton, L., Donato, D. C., Murray, B. C., Crooks, S., Jenkins, W. A., Sifleet, S., et al. (2012). Estimating global “blue carbon” emissions from conversion and degradation of vegetated coastal ecosystems. PLoS One 7:e43542. doi: 10.1371/journal.pone.0043542
Peralta, G., Van Duren, L. A., Morris, E. P., and Bouma, T. J. (2008). Consequences of shoot density and stiffness for ecosystem engineering by benthic macrophytes in flow dominated areas: a hydrodynamic flume study. Mar. Ecol. Progr. Ser. 368, 103–115. doi: 10.3354/meps07574
Richmond, M. D. (2002). A Field Guide to the Seashores of Eastern Africa and the Western Indian Ocean Islands. Stockholm: Swedish International Development Cooperation Agency.
Rogelj, J., Den Elzen, M., Höhne, N., Fransen, T., Fekete, H., Winkler, H., et al. (2016). Paris agreement climate proposals need a boost to keep warming well below 2°C. Nature 534, 631–639. doi: 10.1038/nature18307
Röhr, M. E., Boström, C., Canal-Vergés, P., and Holmer, M. (2016). Blue carbon stocks in Baltic Sea eelgrass (Zostera marina) meadows. Biogeosciences 13, 6139–6153. doi: 10.5194/bg-13-6139-2016
Serrano, O., Almahasheer, H., Duarte, C. M., and Irigoien, X. (2018). Carbon stocks and accumulation rates in Red Sea seagrass meadows. Sci. Rep. 8, 1–13.
Serrano, O., Lavery, P., Duarte, C., Kendrick, G. A., Calfat, A. M., York, P. H., et al. (2016a). Can mud (silt and clay) concentration be used to predict soil organic carbon content within seagrass ecosystems? Biogeosciences 17, 4915–4926. doi: 10.5194/bg-13-4915-2016
Serrano, O., Ruhon, R., Lavery, P. S., Kendrick, G. A., Hickey, S., Masqué, P., et al. (2016b). Impact of mooring activities on carbon stocks in seagrass meadows. Sci. Rep. 6:23193.
Short, F., Carruthers, T., Dennison, W., and Waycott, M. (2007). Global seagrass distribution and diversity: a bioregional model. J. Exp. Mar. Biol. Ecol. 350, 3–20. doi: 10.1016/j.jembe.2007.06.012
Short, F. T., Polidoro, B., Livingstone, S. R., Carpenter, K. E., Bandeira, S., Bujang, J. S., et al. (2011). Extinction risk assessment of the world’s seagrass species. Biol. Conserv. 144, 1961–1971.
Small, C., and Nicholls, R. J. (2003). A global analysis of human settlement in coastal zones. J. Coast. Res. 19, 584–599.
Unsworth, R. K., Nordlund, L. M., and Cullen-Unsworth, L. C. (2019). Seagrass meadows support global fisheries production. Conserv. Lett. 12:e12566. doi: 10.1111/conl.12566
Waycott, M., Duarte, C. M., Carruthers, T. J., Orth, R. J., Dennison, W. C., Olyarnik, S., et al. (2009). Accelerating loss of seagrasses across the globe threatens coastal ecosystems. Proc. Natl. Acad. Sci. U.S.A. 106, 12377–12381. doi: 10.1073/pnas.0905620106
Keywords: seagrass, carbon stocks, above- and belowground biomass, sediment carbon, Gazi Bay, Kenya
Citation: Juma GA, Magana AM, Michael GN and Kairo JG (2020) Variation in Seagrass Carbon Stocks Between Tropical Estuarine and Marine Mangrove-Fringed Creeks. Front. Mar. Sci. 7:696. doi: 10.3389/fmars.2020.00696
Received: 19 January 2020; Accepted: 31 July 2020;
Published: 28 August 2020.
Edited by:
Natasa Maria Vaidianu, Ovidius University, RomaniaReviewed by:
Oscar Serrano, Edith Cowan University, AustraliaZhijian Jiang, South China Sea Institute of Oceanology (CAS), China
Copyright © 2020 Juma, Magana, Michael and Kairo. This is an open-access article distributed under the terms of the Creative Commons Attribution License (CC BY). The use, distribution or reproduction in other forums is permitted, provided the original author(s) and the copyright owner(s) are credited and that the original publication in this journal is cited, in accordance with accepted academic practice. No use, distribution or reproduction is permitted which does not comply with these terms.
*Correspondence: Gabriel A. Juma, YWtva29qdW1hMTJAZ21haWwuY29t