 Lu Zhai
 Cui Liang
 Daniel Pauly
- 1Fisheries College, Ocean University of China, Qingdao, China
- 2CAS Key Laboratory of Marine Ecology and Environmental Sciences, Institute of Oceanology, Chinese Academy of Sciences, Qingdao, China
- 3Laboratory for Marine Ecology and Environmental Science, Qingdao National Laboratory for Marine Science and Technology, Qingdao, China
- 4Sea Around Us, Institute for the Oceans and Fisheries, University of British Columbia, Vancouver, BC, Canada
Sixteen marine fish species (populations) exploited by Chinese fisheries were assessed, using published time series of catch and the CMSY and BSM methods. Given the catch times series as inputs, some ancillary information and reasonable constraints, carrying capacity, maximum sustainable yield, and likely time series of biomass and exploitation rate were estimated. The results show that one (7%) of the assessed species was severely depleted, four species (27%) were fully/overfished, six (40%) were outside of safe biological limits, one species (7%) was recovering and three species (20%) were in a healthy state at the end year of their assessment. However, one species, Pacific sardine (Sardinops sagax), could not be assessed using CMSY, as the exceedingly large fluctuations of its biomass were mainly environmentally driven. These results correspond with previous knowledge on the status of fish populations along the coast of China, where overfishing is rampant. Based on these assessments, some of the benefits that would result from a reduction of the excessive fishing effort are outlined.
Introduction
China is the country with the world’s largest marine fisheries catch (FAO, 2018). It is widely agreed that China’s domestic fisheries resources are overexploited (Shen and Heino, 2014). However, it seems that overfishing has gradually changed the structure and function of marine ecosystems of China’s coastal seas (Zhai and Pauly, 2020) and that the state of its domestic resources is the main reason for its current emphasis on distant-water fishing (Mallory, 2013).
China’s fisheries management system has been gradually improving since the 1980s (Huang and He, 2019). Its most powerful regulations are the “double control” system and summer fishing moratoria (Shen and Heino, 2014). The former are regulations of both the total number of marine engine-powered fishing vessels and their total engine power; the latter have been implemented since 1995 and extended from 3 to 4 months and more in many areas (Ministry of Agriculture and Rural Affairs of the People’s Republic of China [MARA], 2018). Also, some other regulations and programs are being implemented including vessel buyback, alternative employment opportunities for fishers (Song, 2007) and a 10 year fishing ban in the Yangtze River Basin (Ministry of Agriculture and Rural Affairs of the People’s Republic of China [MARA], 2019).
China has carried out a large number of fishery resource surveys and stock assessment work in recent years, but still faces difficulties due to a lack of historical data. Thus, there are still deficiencies regarding China’s fish stock assessments: the range of species covered by assessments is narrow, evaluation methods are limited and the results are not usually expressed as B/BMSY, i.e., the ratio of stock biomass to the biomass that can produce the maximum sustainable yield (MSY) or other management-relevant indicators. Until recently, very few stock assessments were conducted that allowed for estimating the potential for stock rebuilding (Villasante et al., 2013), although this dire situation is now being overcome (see Zhai and Pauly, 2019; Ji et al., 2019; Liang et al., 2020a,b; Wang et al., 2020; Zhang et al., 2020).
Here, the newly developed CMSY method (Froese et al., 2017), catch time series and some Supplementary Information are used to infer likely biomass trajectories for 16 species of exploited fish along Chinese coastlines. This method was shown to be adequate for the assessment of hundreds of fish stocks in and around Europe (Froese et al., 2017, 2018; Demirel et al., 2020). Moreover, a number of contributions show that the method can be used for stock assessment in China (Ji et al., 2019; Liang et al., 2020b; Wang et al., 2020).
Also, a Bayesian state-space implementation of the Schaefer model (BSM; Froese et al., 2017) is applied here with the same catch time series and priors, and additional catch/effort (C/f, or CPUE) and/or biomass data, to assess the biomass and exploitation rate, and thus to assess the stock status and extent of overfishing in Chinese and adjacent waters. This contribution is a further example of the study of data-poor fisheries and our results provide information toward a science-based management of China’s fisheries.
Materials and Methods
Data Sources
The main features of the catch time series and additional information available for 16 fish populations investigated here are given in Table 1, while the data sources are shown in Supplementary Table 1. All species investigated here are important commercial fish in China since the 1950s that have more than 10 years of catch data.
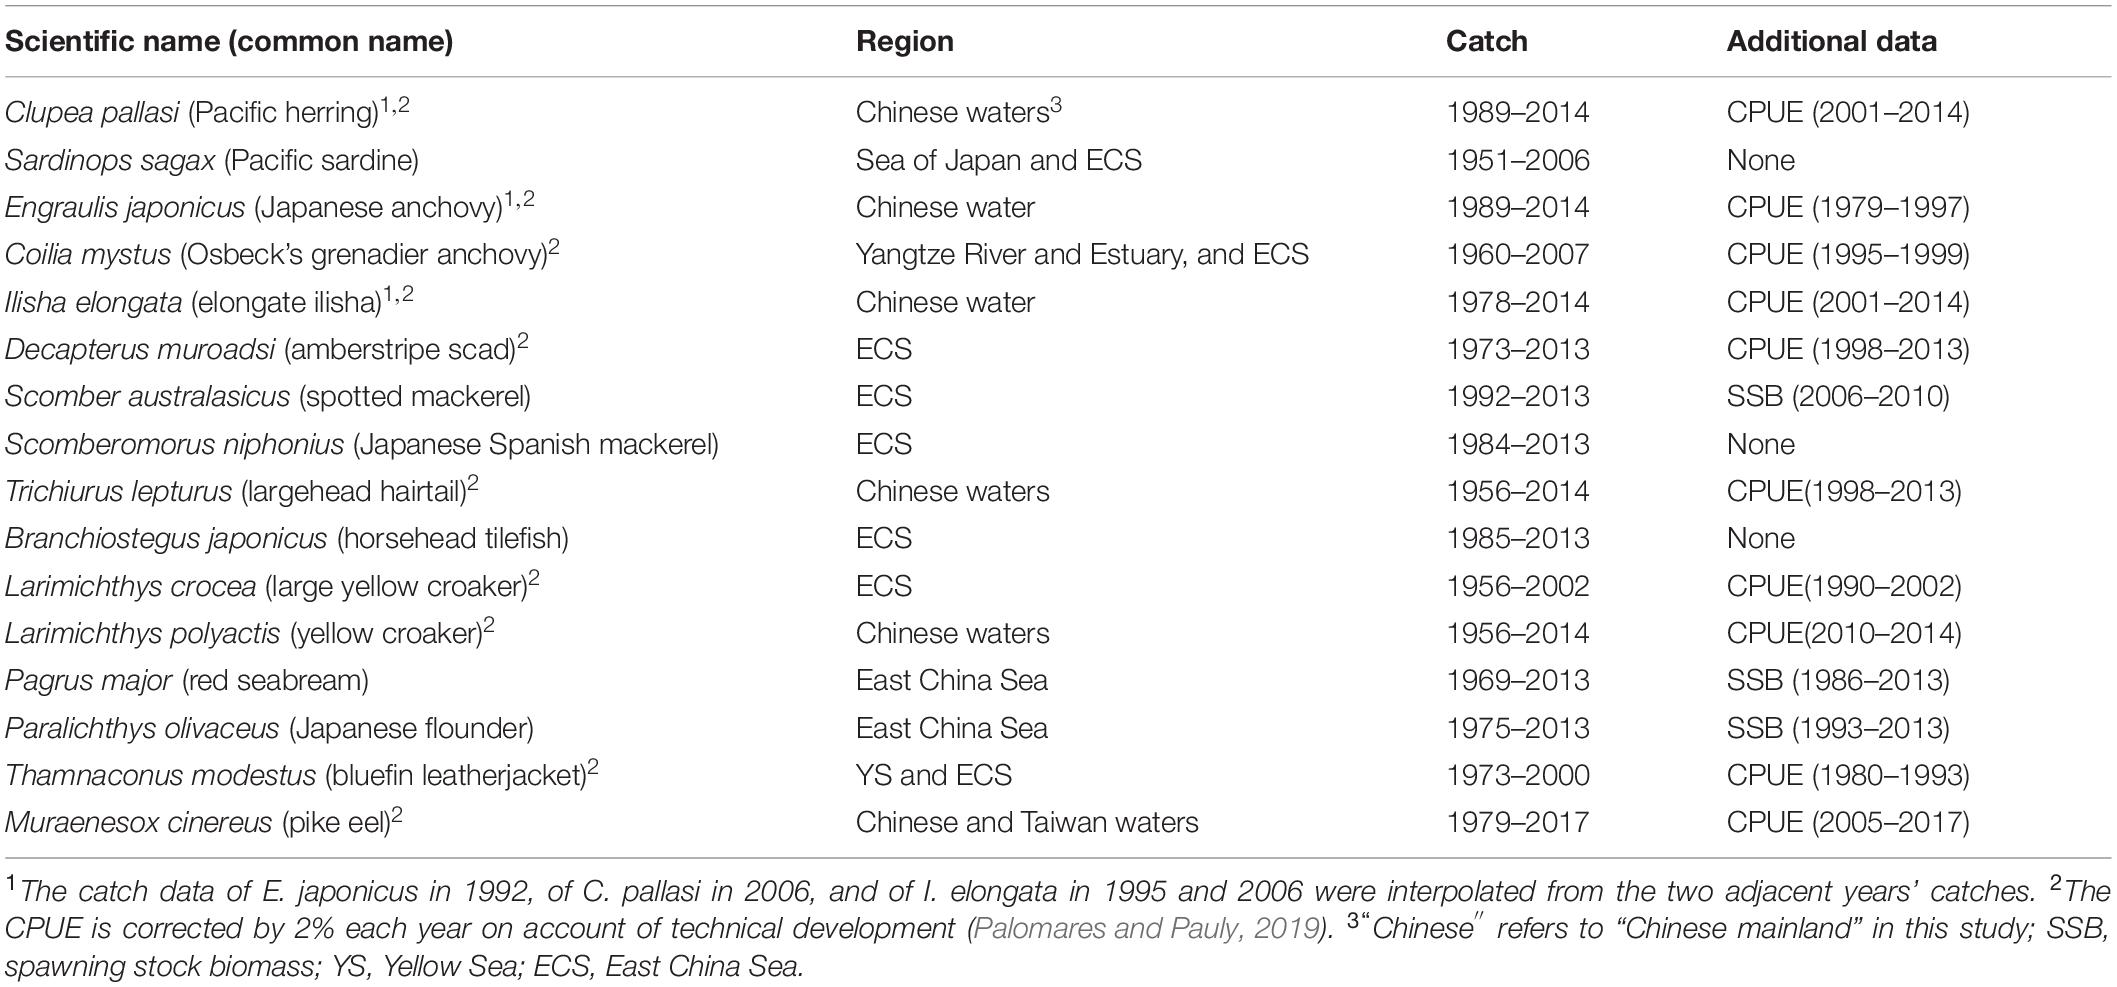
Table 1. Summary of data available for the stock assessments presented here (the data themselves and data sources are presented in Supplementary Table 1).
The CMSY and BSM Methods
The principle of the CMSY method is that, given catch time series and using a Monte Carlo approach, multiple biomass trajectories of the biomass of the stock in question are traced, and the parameters retained that generated the biomass trajectory (or trajectories) that is (are) compatible with the time series of catches, and a number of constraints (Froese et al., 2017). Here, “compatible” means that, among other things, the stock does not crash, i.e., its biomass does not drop to zero.
When, as is the case here, relative abundance data, such as CPUE or spawning stock biomass (SSB), are also available, a Bayesian state-space implementation of the Schaefer production model (BSM; Millar and Meyer, 1999) is applied to estimate the intrinsic rate of population growth (r) and unexploited stock size (or carrying capacity; k) of each stock (Froese et al., 2017).
The CMSY and BSM methods are based on the logic of the surplus-production model of Schaefer (1954, 1957). Thus, they assume that from 1 year (t) to the next (t + 1), the biomass (Bt) follows the equation:
where r is the intrinsic rate of population growth, k the carrying capacity, and Ct is the catch in year t.
However, Eq. (1) is slightly modified when the biomass falls below 0.25k, to allow for depensation or reduced recruitment when stock size is severely depleted (Froese et al., 2017):
where the term 4rBt/k ensures a linear decline of recruitment below half of the biomass capable of generating MSY.
Prior Information
The R code implementing the CMSY method incorporates a routine which estimates wide (uniform) priors for k (Froese et al., 2017), whose output were here accepted:
where klow and khigh are the lower and upper bounds of the prior range of k, max(C) is the maximum catch in the time series and rlow and rhigh are the lower and upper bound of the range of r-values that the CMSY method explores. This is expressed by
where the variables and parameters are defined as in Eq. (3).
As stated in Froese et al. (2017), when running the BSM method, the estimated standard deviation of r in log-space is described by a uniform distribution between 0.001 irf and 0.02 irf by
where irf is an inverse range factor to determine r range, and rhigh and rlow is provided in Table 2.
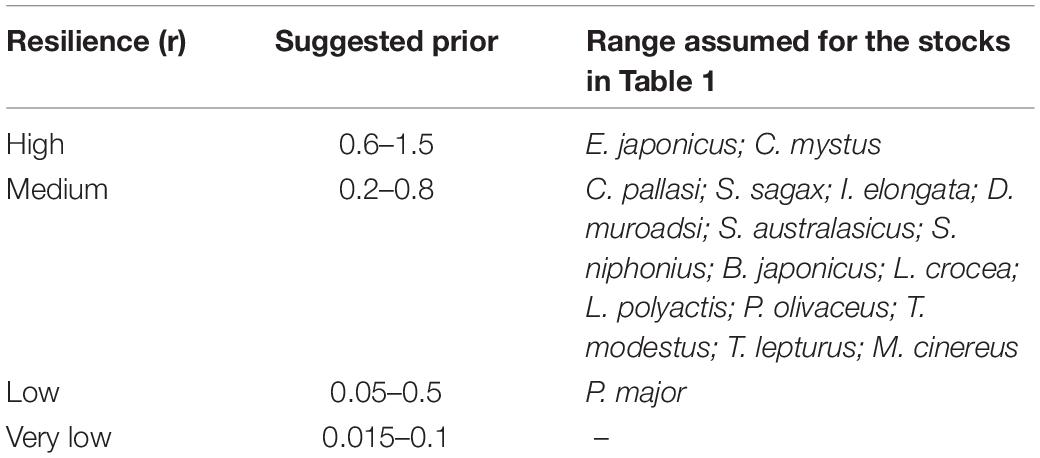
Table 2. Ranges suggested by FishBase (see text footnote 1) for population growth rate (in year–1).
The k estimation by BSM also assumes that k has a log-normal distribution, while the mean of k provides the reasonable central value. The standard deviation of k is assumed to be a quarter of the distance between the central value and the lower bound of the k-range (McAllister et al., 2001).
Additionally, the BSM method allows the estimation of the catchability coefficient q, which relates biomass to CPUE, when the latter is available. For this, priors are defined as
where qlow and qhigh are the lower prior and higher prior for the catchability coefficient respectively; rpgm is the geometric mean of the prior range for r; CPUEmean is the mean CPUE over the last 5 or 10 years; Cmean is mean catch over the same period.
For stocks with low recent prior biomass, the ranges of multipliers are 0.25–0.5 for qlow and 0.5–1 for qhigh.
The intrinsic rate of population growth (r) is largely determined by the size and age at first maturity of individuals of the species in question, and FishBase1 (Froese and Pauly, 2019), based on these and other traits, provides ranges of likely values (“priors”) for all fish species (Froese et al., 2000). Also, a resilience classification based on the stock fecundity was proposed by Musick (1999). The available resilience ranges and those selected for the 16 stocks studied here are given in Table 2.
Additionally, two constraints are required for the CMSY method, i.e., the faction of carrying capacity that the biomass was exhibiting just before the first annual catch in the available time series is subtracted (Bstart/k; see Eq. 1) and the faction of carrying capacity that the biomass reached at the end of the catch time series, again expressed as a fraction of k (Bend/k). The first of these constraints is a function of the fishing pressure to which the population (or stock) in question was exposed to prior to the period for which catch data are available, and which would have reduced the biomass below carrying capacity.
Table 3 presents suggested ranges of Bstart/k and Bend/k for the stocks in Table 1. Note that for some species that were already exploited in the 1950s, we selected a very low depletion (Bstart/k = 0.8–1) for the start of the series because of the low technology that was deployed at the time (Zhan et al., 1986; Yang, 1988; Zhang and Hua, 1990; Yu and Zheng, 2000; Liu, 2005; Xu and Liu, 2007; Wang et al., 2011; Xu et al., 2014; Yan et al., 2014). For some other species, we selected a low range (Bstart/k = 0.4–0.8), in view of the fact that from the 1970s to the 1990s, a massive increase of fishing effort occurred, and the technological sophistication of that effort also increased (Zhu, 1992; Qiu, 1995; Lu et al., 1998; Bo et al., 2005).
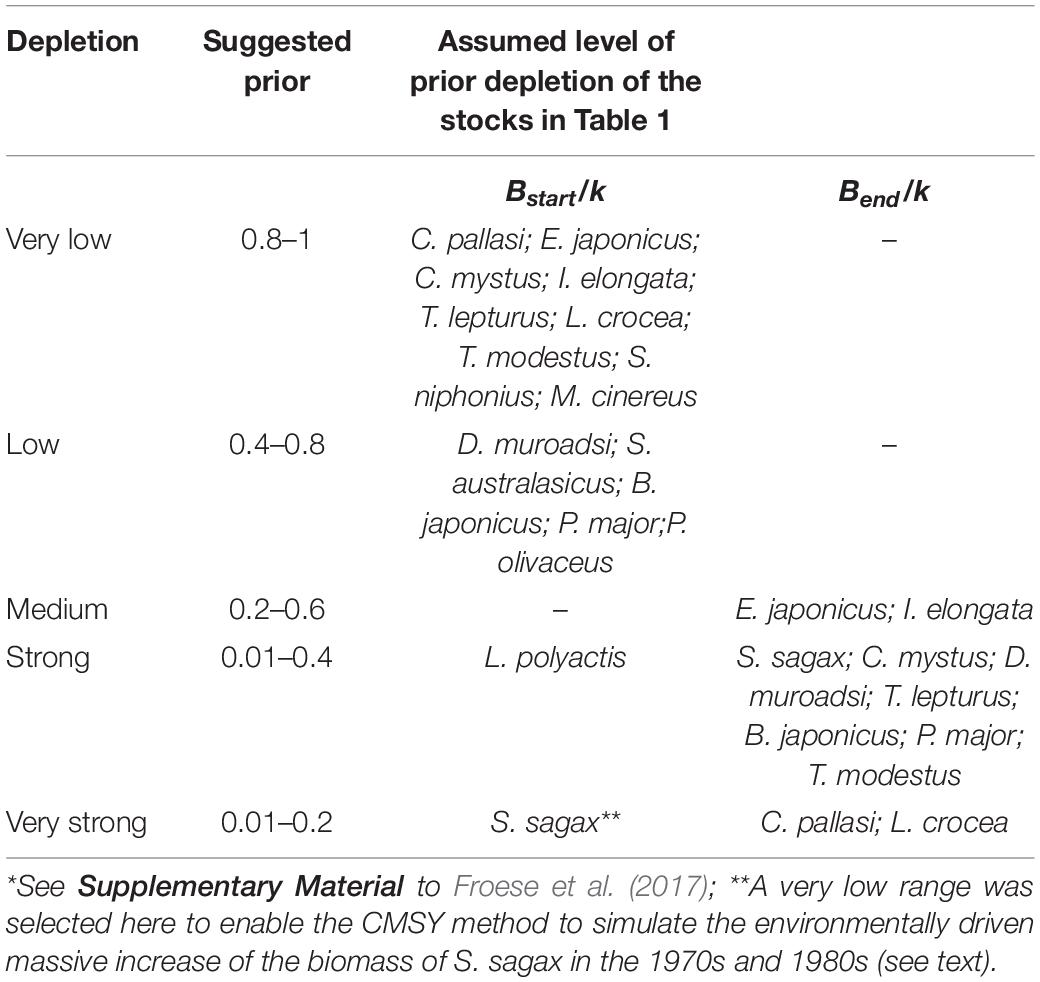
Table 3. Suggested ranges of the fraction Bstart/k and Bend/k for the biomass depletion before catch data are available*.
There are two exceptions here, Larimichthys polyactis and Sardinops sagax, were set at the strong (0.01–0.4) and very strong (0.01–0.2) depletion, respectively (Table 3). For L. polyactis, the catch of the stock in the final year increased to 2∼3 times that of the start year (Lin et al., 2004; Yan et al., 2014). Thus, we have a good reason to assume that L. polyactis was already strongly overfished in the mid-1950s.
The Bstart/k for S. sagax was set at a very strong depletion (0.01–0.2; see Table 3) to force its biomass at the start of the assessment period to be very low. This biomass subsequently increased due to environmental factors (Wei and Li, 1986; Lluch-Belda et al., 1989), a topic to which we will return.
The second constraint, the expected biomass at the end relative to carrying capacity (Bend/k), should be roughly reflective of the fishing pressure which generated the available catch time series. Table 3 presents suggested ranges of Bend/k, i.e., the fraction of the population initially present that is left in the water, set based on the default rules of CMSY method (Froese et al., 2017).
The last constraint, i.e., the ratio of biomass reached during an intermediate year to carrying capacity (Bint/k), can be used if such knowledge is available. We set “default” Bint/k for all stocks in this study except for Engraulis japonicus (Japanese anchovy; int. year is 2009, prior range is 0.2–0.6; Li et al., 2015).
The CMSY method identifies the r and k values generating viable biomass trajectories (if any), then output the geometric means and confidence intervals of these estimates. As well, various parameters that can be derived from r and k, notably MSY = 0.25r⋅k, FMSY = 0.5r and BMSY = 0.5k (Schaefer, 1954; Ricker, 1975) are also estimated.
The BSM method can run with additional constraints, such as SSB or catch/effort (C/f, or CPUE) (Froese et al., 2017), which represent (relative) abundance. In this case, the viable biomass trajectories will take account of the (relative) abundance data, even if they pertain to a shorter period than the catch data (Table 1). In the process, an estimate of the catchability coefficient q = (C/f)/B is also produced as an average for the period with CPUE data (see Eq. 6).
Four of the sixteen stocks in the study, i.e., E. japonicus, Coilia mystus, L. polyactis and Muraenesox cinereus with more than one SSB or CPUE time series, we used a routine “Bcrumb,” to interpolate and average SSB or CPUE for them. This routine was developed as a component of JARA (Just Another Redlist Assessment) described in Winker and Sherley (2019). Moreover, considering the technological improvement of the fishery, the CPUE is corrected by 2% increases every year according to Palomares and Pauly (2019), given gear and other technological improvements of the industrial sector.
The ratio B/BMSY in the final year, which is often used to express stock status, is estimated by both CMSY as well as BSM. For management purposes, the more precise results of BSM may be preferred over the results of a CMSY assessment. Table 4 presents suggestion of fish stock status based on B/BMSY and F/FMSY in final year. (Note that 2⋅Bend/k = BMSY/k, as MSY is taken at 0.5k).
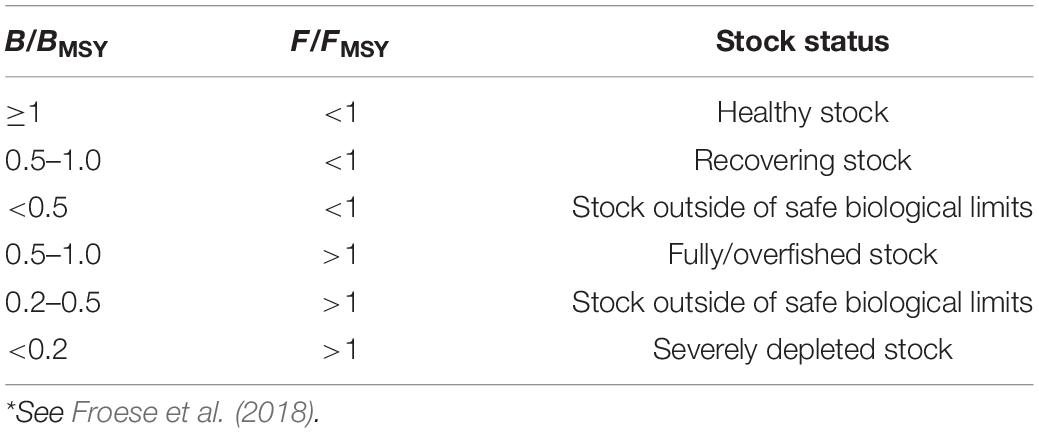
Table 4. Definition of fish stock status, based on B/BMSY in the final year of a time series*.
Results
Altogether 16 fish populations were analyzed by CMSY method, with 13 also assessed using the BSM methods, as CPUE/biomass data were available for them. The results of estimated r-k for Scomberomorus niphonius and E. japonicus are shown in Figure 1 as examples, while all other results are shown in Table 5 and Supplementary Figure 1(except for S. sagax).
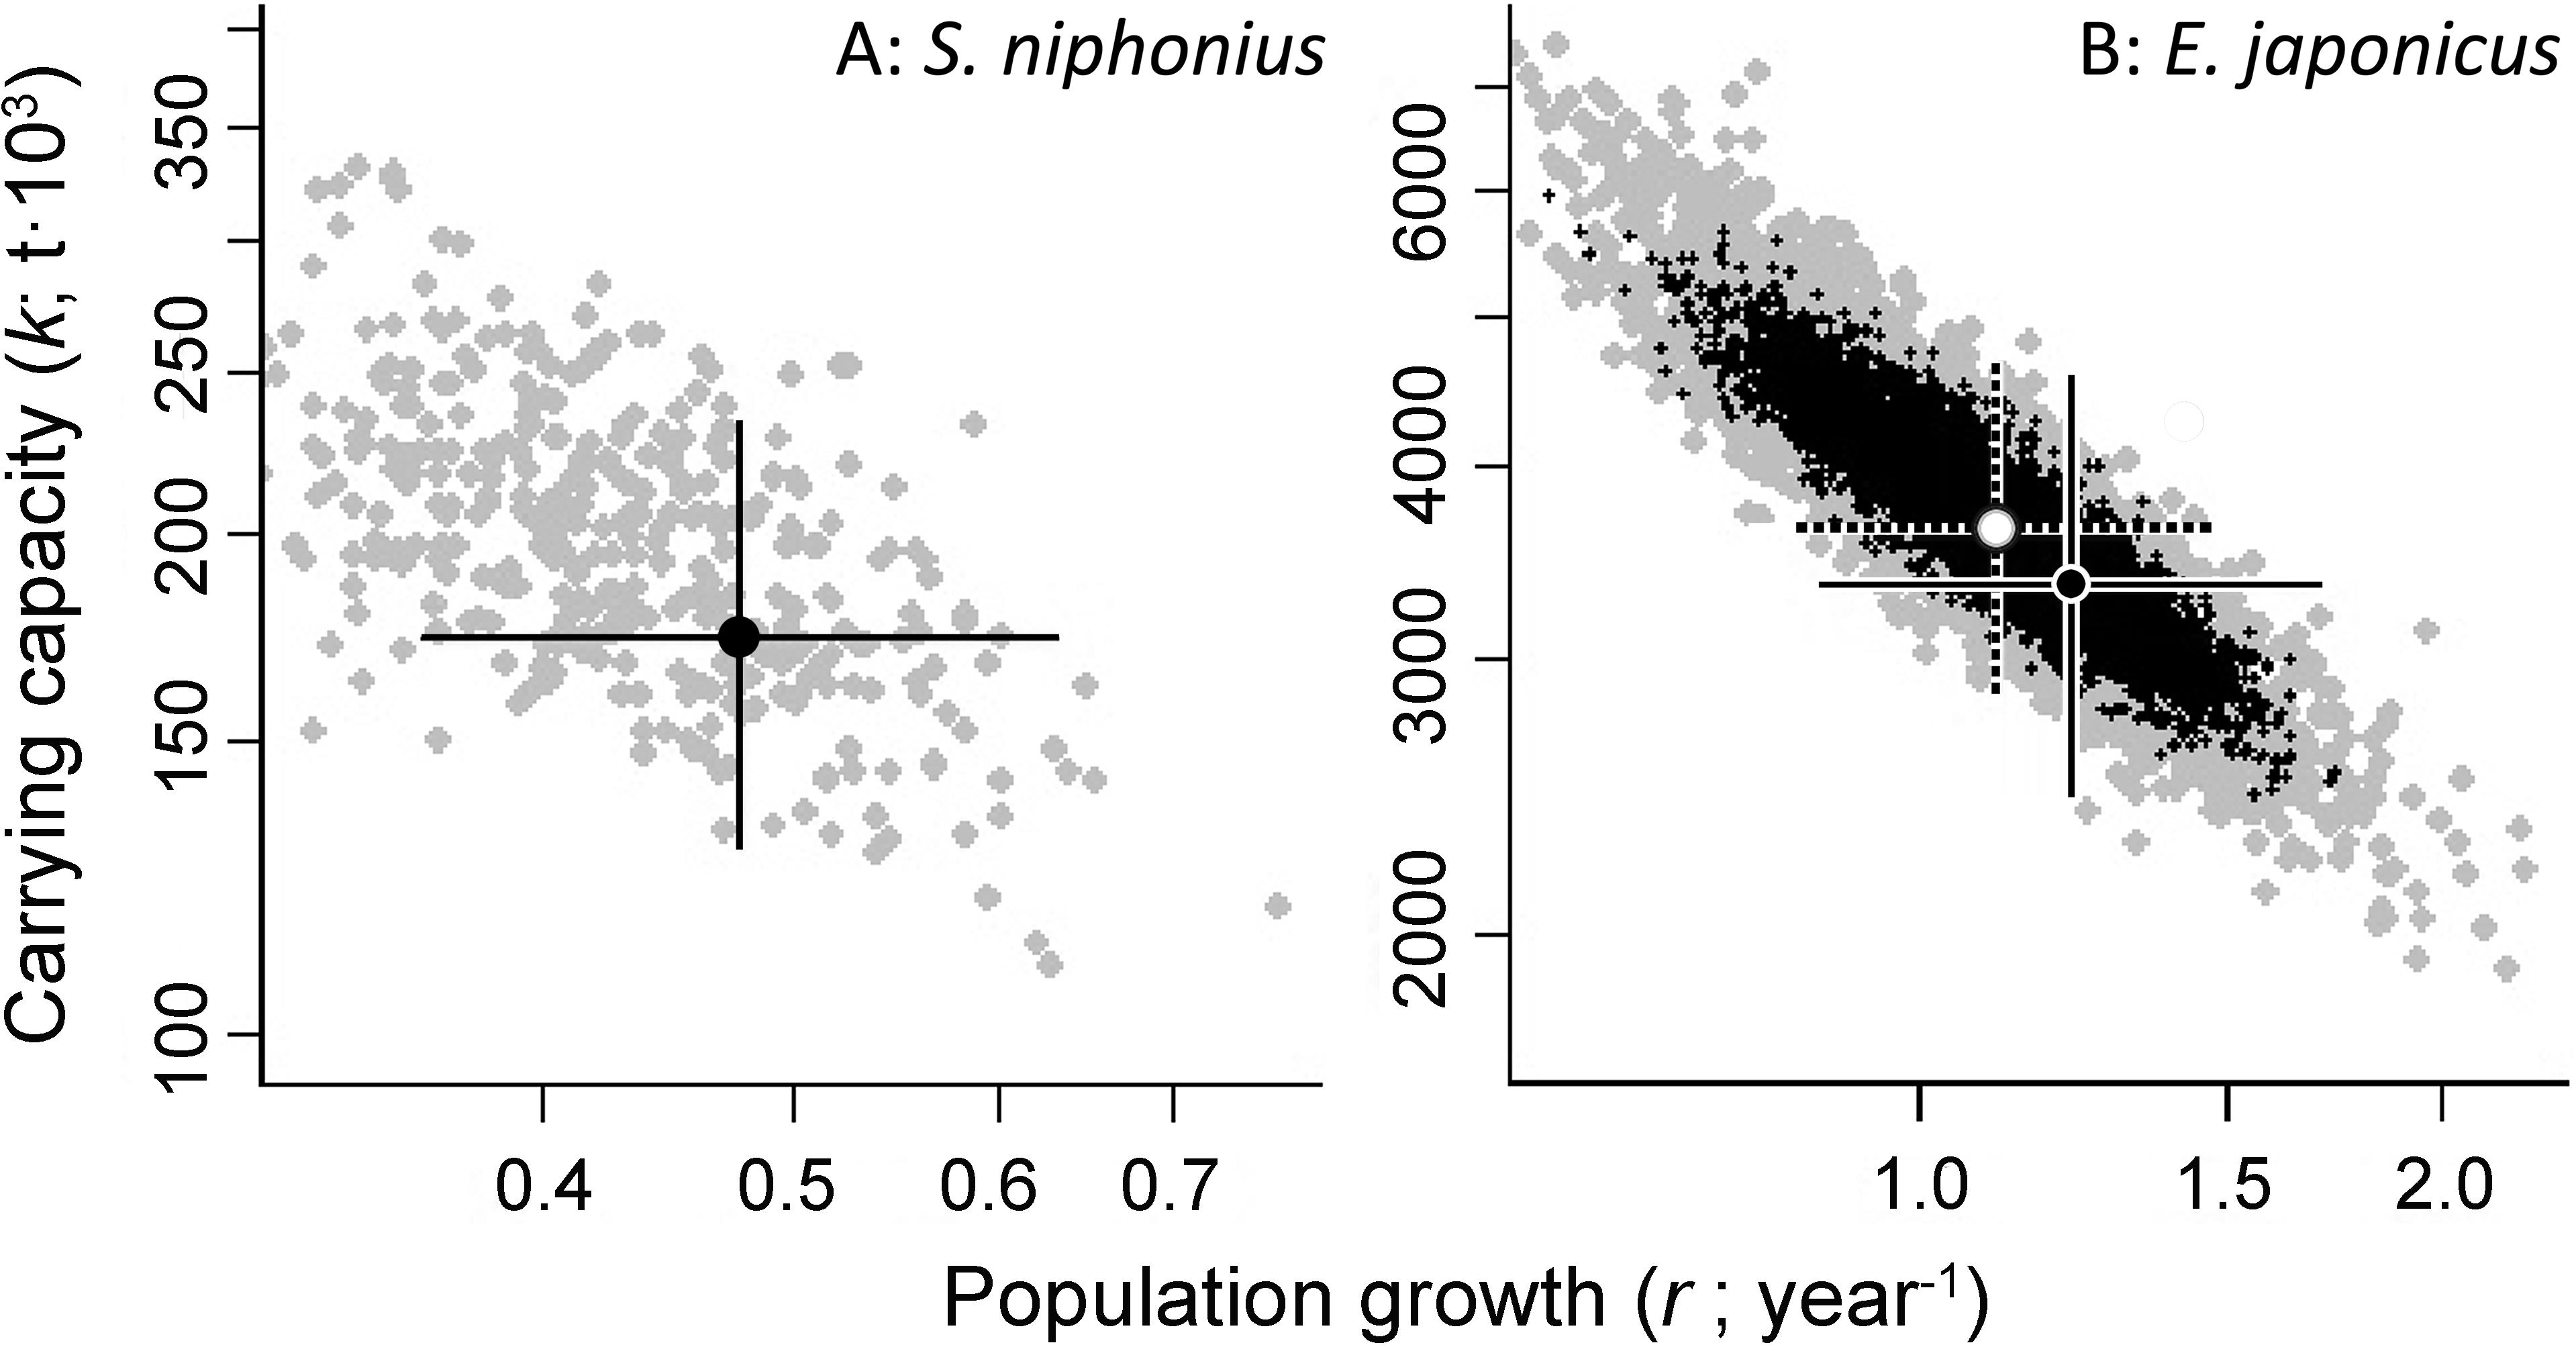
Figure 1. Examples of the identification of viable and best trajectories (as defined by values of r and k), for the populations of (A) Japanese Spanish mackerel (S. niphonius) and (B) Japanese anchovy (E. japonicus). In (A), the viable r-k pairs (gray) were obtained by the CMSY method, and the solid crosses identify the most probable r-k pairs, along with their 95% confidence intervals; in (B), the viable r-k pairs (black) were obtained by the BSM method, the dotted cross identifies the most probable r-k pair, and its 95% confidence intervals.
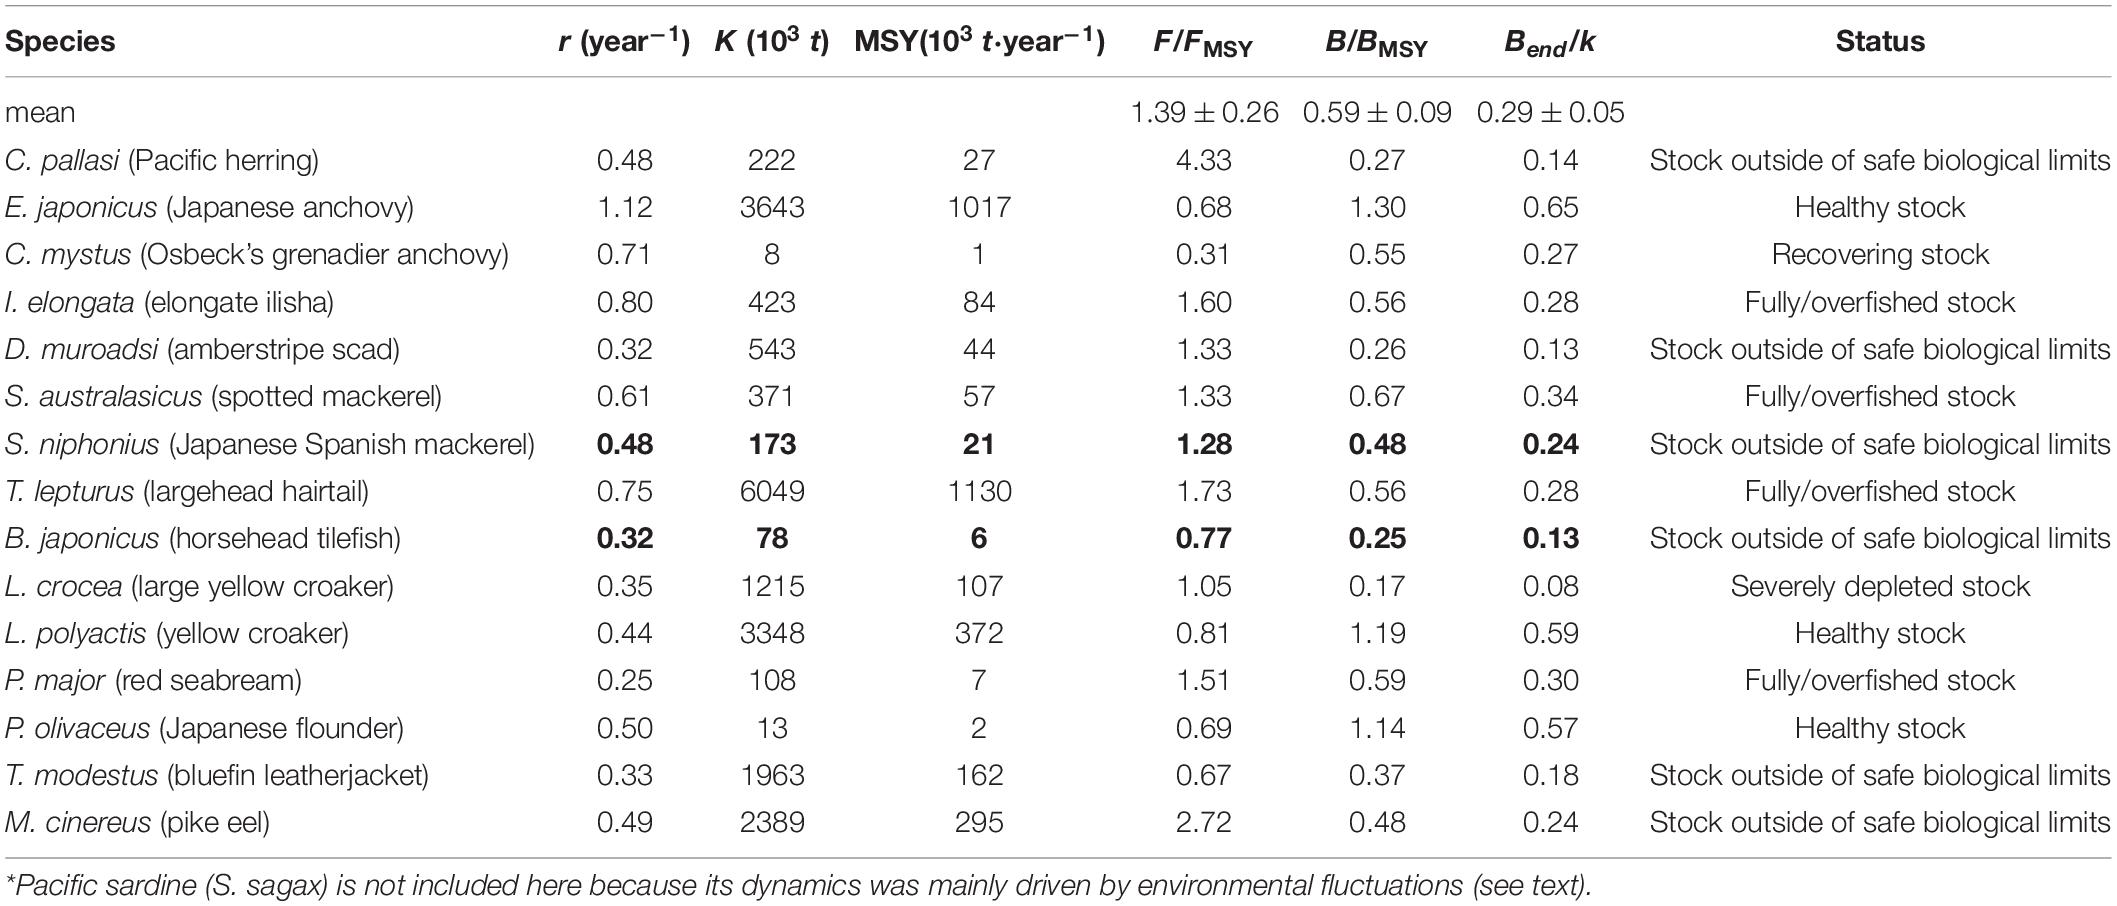
Table 5. Estimates of r, k, MSY, B/BMSY and status as obtained by CMSY and/or BSM method for 15 fish stocks of China’s coastal seas. The result in normal font are based on the BSM method, i.e., they used catch and additional relative abundance data; the results in bold font are only based on catch time series and CMSY*.
In Figure 1A, featuring Japanese Spanish mackerel (S. niphonius) and Figure 1B, featuring Japanese anchovy (E. japonicus), the viable r-k pairs (gray) were obtained by the CMSY method, and the solid crosses identify the most probable r-k pairs, along with their 95% confidence intervals. In Figure 1B, the BSM method used (relative) abundance data (i.e., SSB/CPUE), and the viable r-k pairs it estimated are in black. The dotted cross identifies the most probable r-k pair, and its 95% confidence intervals. The overlaps between the two clouds of dots (and hence the closeness of the two crosses) implies that the results of the two methods are similar, and thus more credible than if they did not overlap.
The biomass trends resulting from the CMSY and BSM analyses are shown in the different panels of Figure 2. In each panel, the key item is the biomass trajectory (solid black line) and its 95% confidence intervals (dotted line). The horizontal dashed line represents BMSY, while the vertical solid lines show the priors on biomass range at the start and end of time series. Finally, the open dots indicate corrected CPUE trends of the 13 stocks for which such data was available.
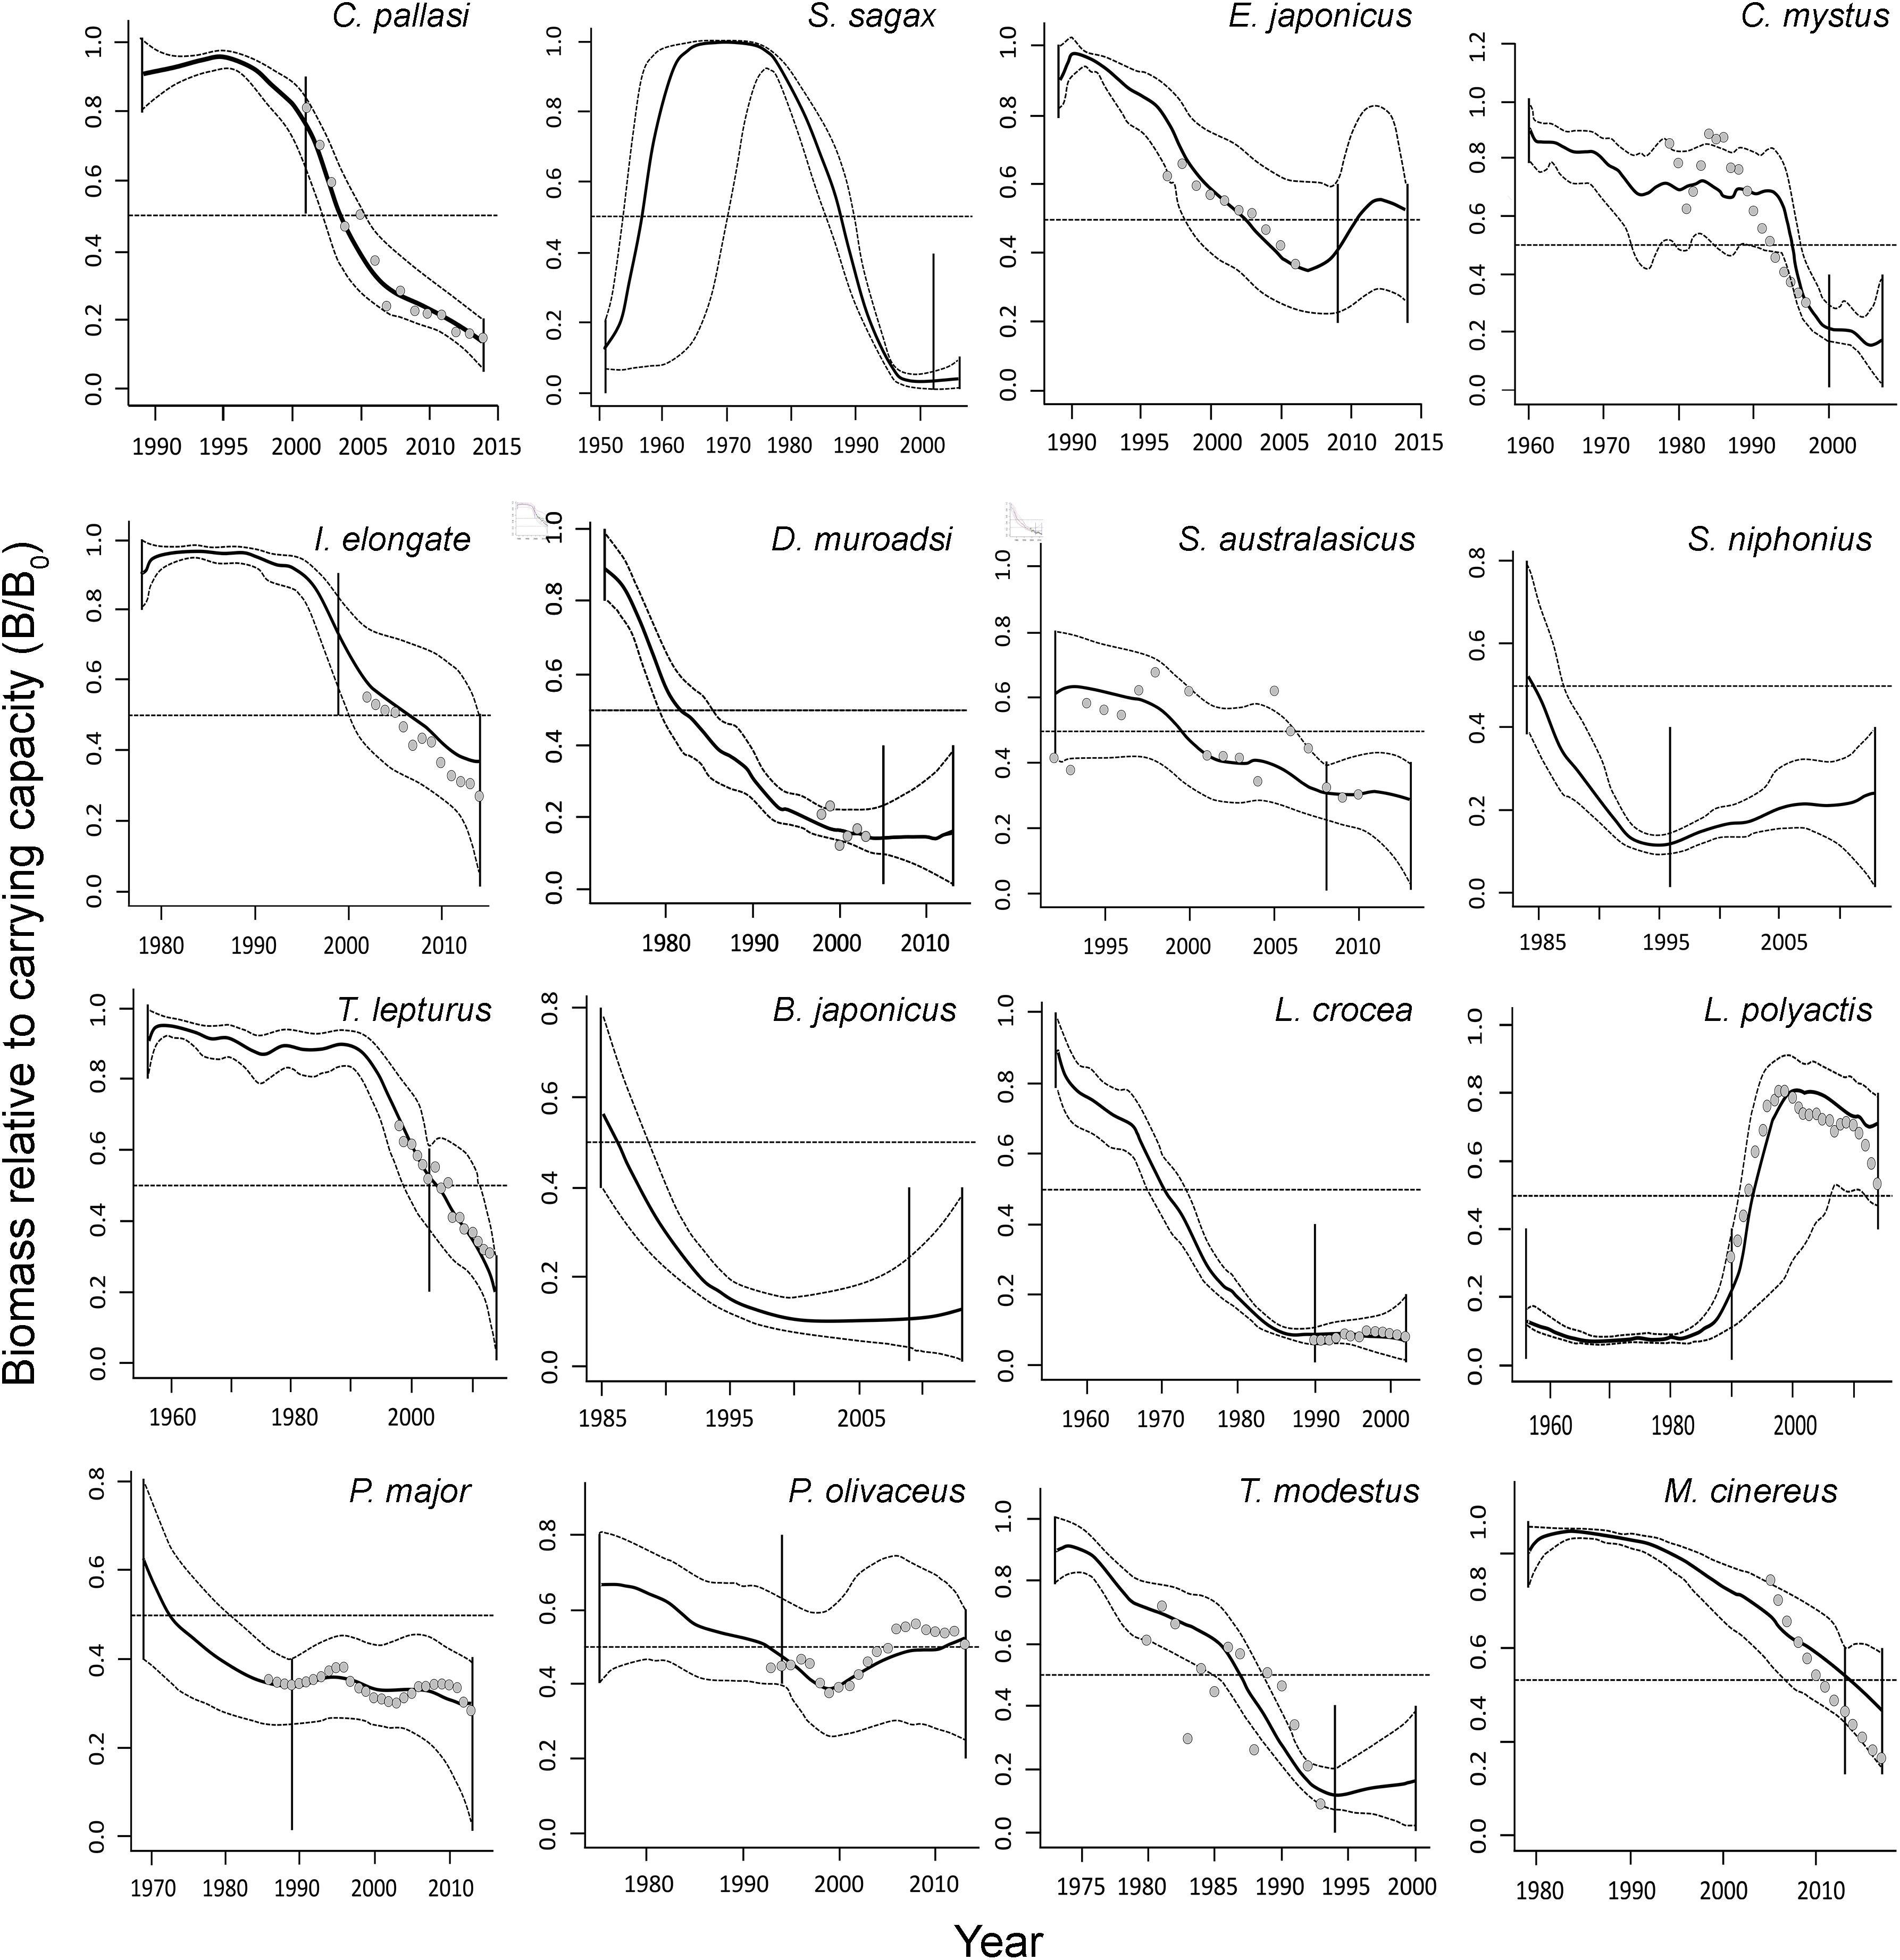
Figure 2. Biomass trajectories of 16 single-species stocks in Table 1, as estimated by the CMSY method (solid black lines) and their uncertainty (gray dashed lines), related abundance series (gray dots; SSB and corrected CPUE by 2% every year), when available, and vertical lines represented priors (from Tables 3, 4). Except for S. sagax (see text), all of these trajectories are due to excessively high catches.
As shown in Figure 2, the biomass of all species generally declined, although a few species, notably L. polyactis, substantially recovered. The mean B/BMSY for 15 stocks is 0.59 ± 0.10 (SE) and mean Bend/k is 0.29 ± 0.05 (SE).
The results demonstrate that the exploitation rate (i.e., F) for 9 species of the 15 are higher than FMSY. The average value for 15 species is 1.39 ± 0.26 (SE). The species Clupea pallasi have the highest exploitation rate of 4.33 (Table 5 and Supplementary Figure 2).
According to the definition of fish stock status (see Table 4), the average status of China’s coastal fish stock assessed here is fully/overfished. Three of the assessed stocks were healthy, one was recovering, six were outside of safe biological limits, four were fully/overfished, one was severely depleted (see Figure 3).
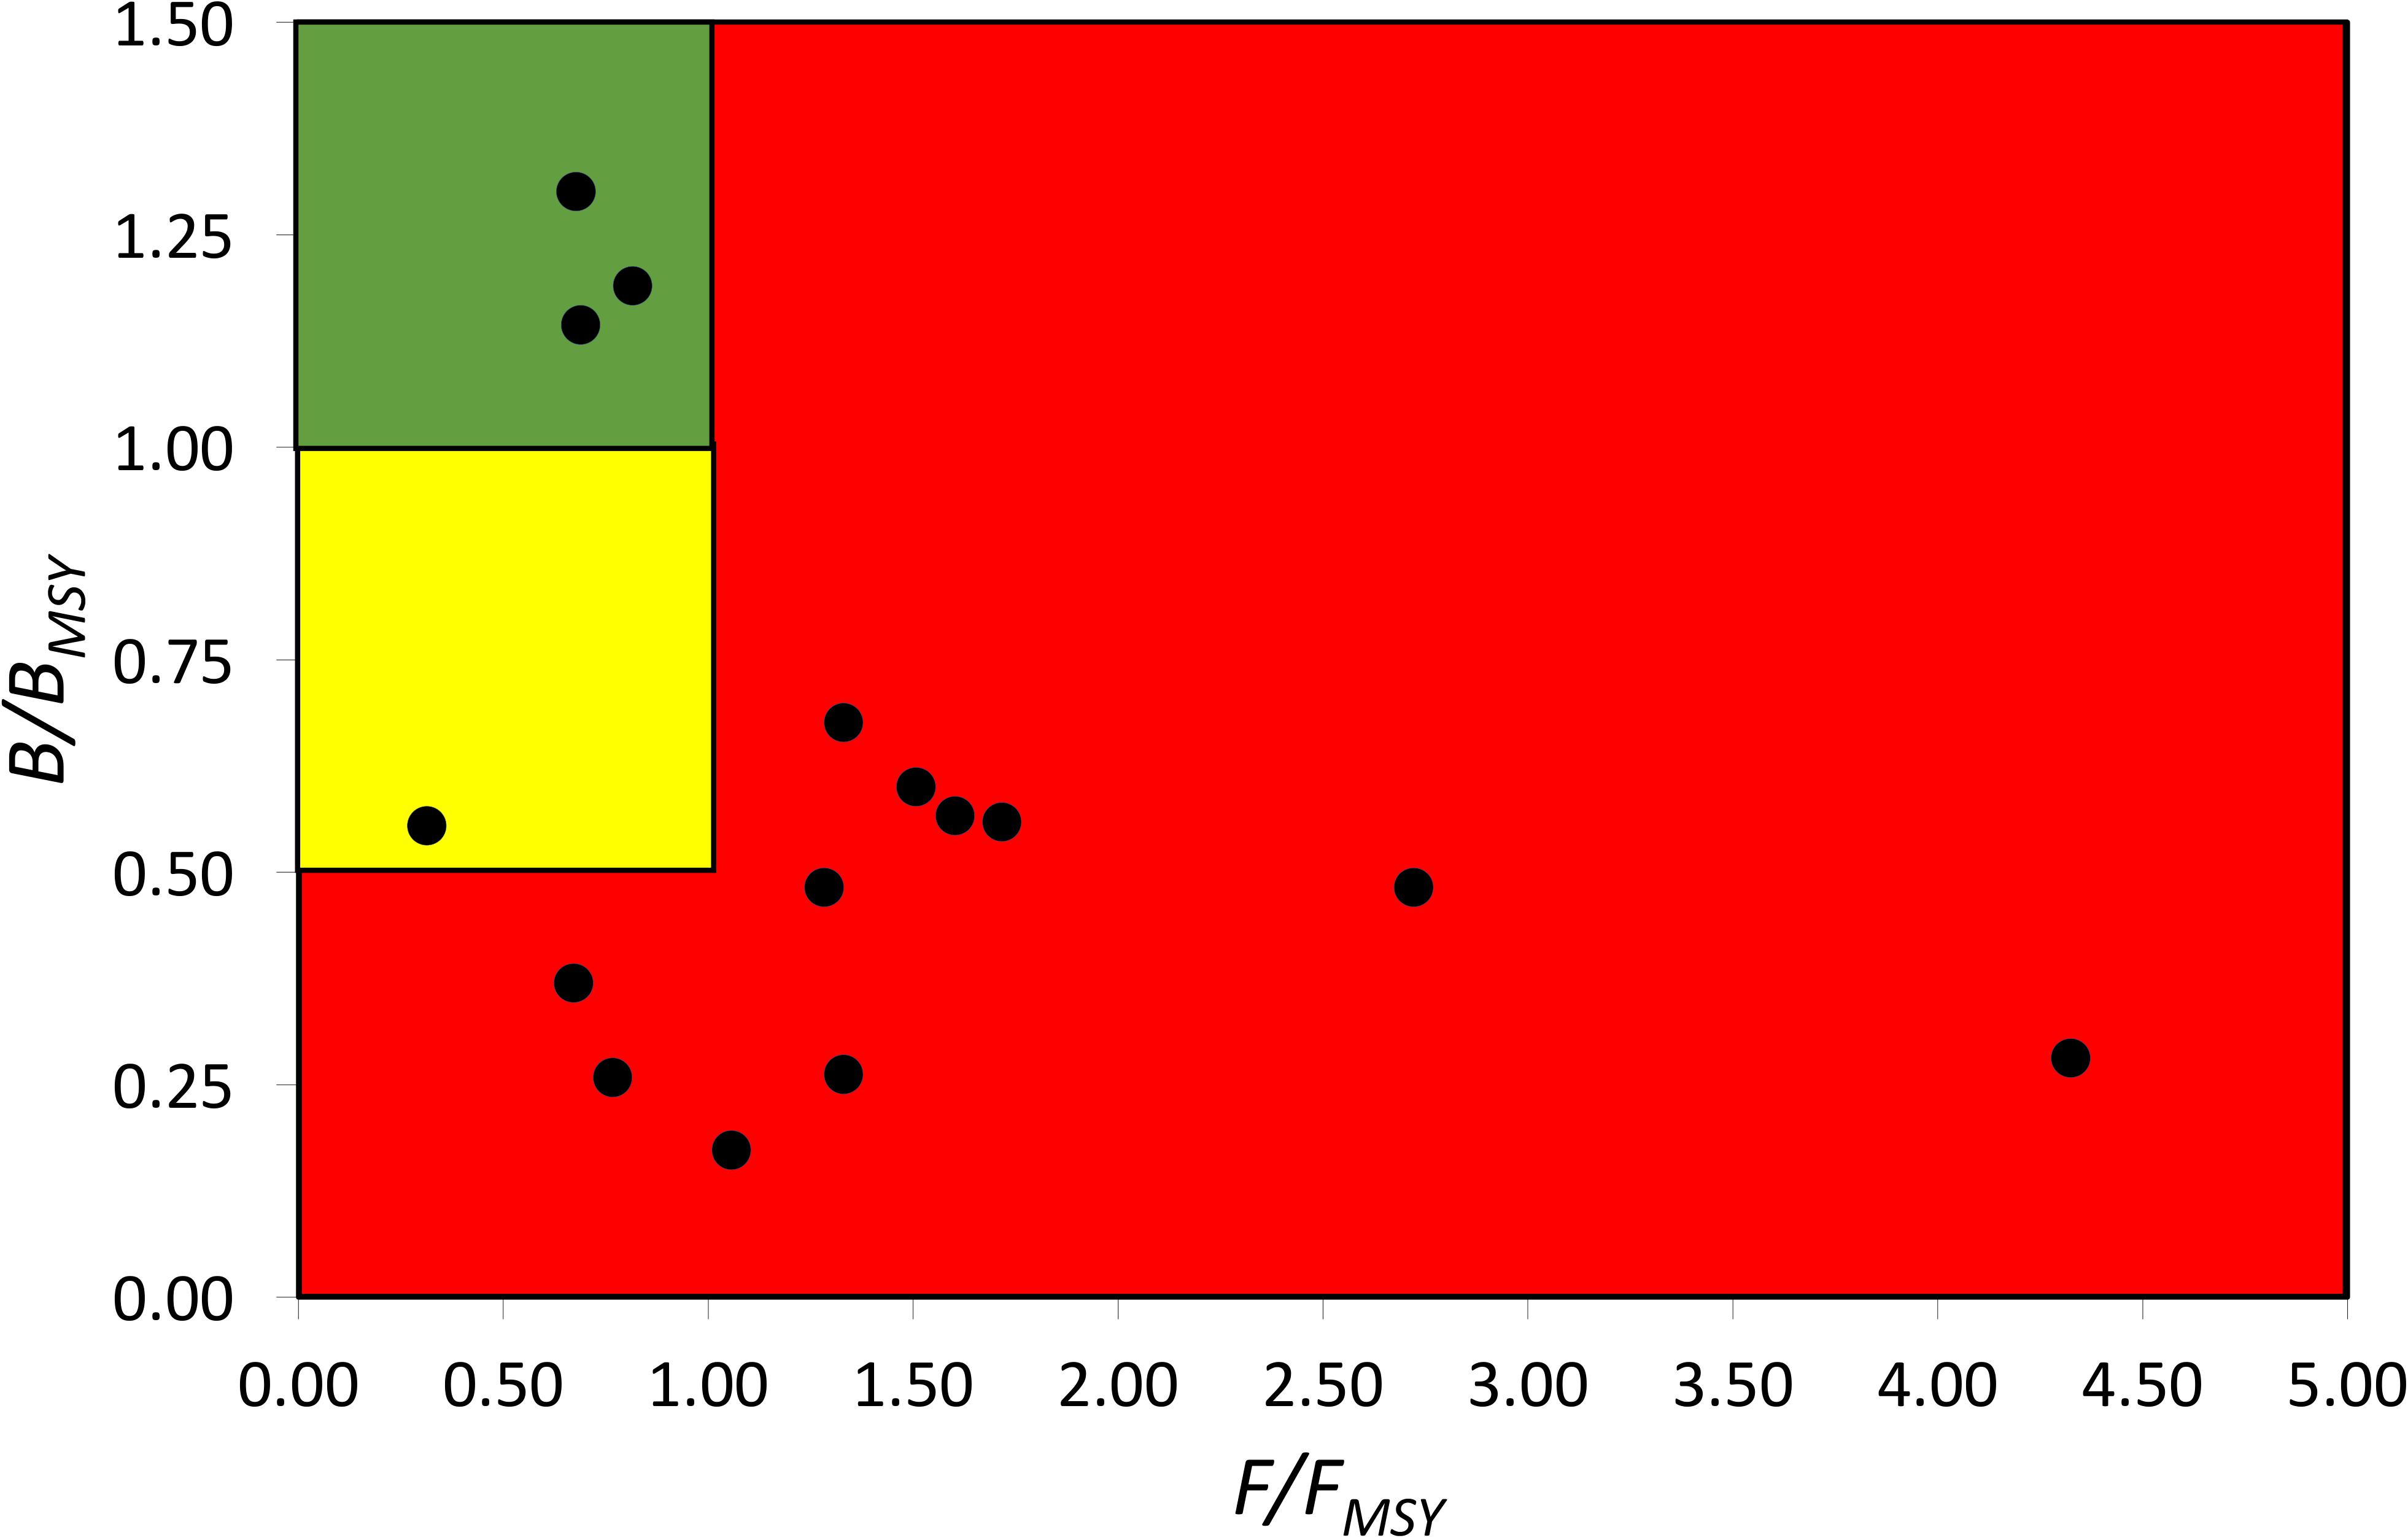
Figure 3. Pressure (F/FMSY) – status (B/BMSY) plot of 15 fish stocks of China’s coastal seas for the last years with available data (2000–2017). Red area: stocks that are being overfished or are outside of safe biological limits; yellow area: recovering stocks; green area: stocks subject to sustainable fishing pressure and of a healthy stock biomass that can produce high yields close to MSY.
Discussion
Time series of catches such as analyzed here are scarce for Chinese waters; however, the few that are available provided the impression of massive overfishing, consistent with other analyses (Liang and Pauly, 2017b; Zhai and Pauly, 2019; Liang et al., 2020a,b). All of the thirteen stocks with CPUE or SSB included in this contribution were well fitted by the CMSY and BSM methods, i.e., the most likely estimated r-k pair are included within the 95% confidence intervals of each other (see Supplementary Figure 1). Similarly, Ji et al. (2019) found a good match between the estimates of population parameters of Trichiurus lepturus in the Yellow and Bohai Seas obtained by using CMSY and those from the Schaefer and Fox models. Thus, the CMSY method can for assessing data-limited fisheries, although the related BSM methods, which additional information (e.g., CPUE data) produces narrower confidence intervals (Ren and Liu, 2020).
The intrinsic rate of population growth (r) is key in defining the response of populations to challenges such as fisheries (Cheung et al., 2005; Anderson et al., 2008). FishBase (see text footnote 1; Froese and Pauly, 2019) provides estimated ranges of r for fish populations based on life-history traits of fish populations which are very useful, as they compensate for the lack of estimates from local data.
The uncertainties of catch, SSB or CPUE data, which may result, e.g., from discards not having been considered, or unreported catch issues, will lead to errors in the assessment. In these cases, the local experience of fisheries experts should be accounted for when screening the data sets and results.
The catches of most of the species investigated here exhibited an explosive growth in the 1990s and/or the 2000s, then stagnated and declined. This feature basically coincides with China’s fishery development history. Fisheries of China developed gradually from the 1950s to the 1970s, then rapidly in 1980s and 1990s, with its total catch peaking in the 2000s (Anon, 1963-2019; Shen and Heino, 2014; Supplementary Figure 3). Even though China’s national catch statistics were over-reported in the 1990s, resulting in distortions in the catch and CPUE data (Watson and Pauly, 2001), the rapid growth of China’s overall fishing effort in undeniable, and it had a strong effect on the structure of its coastal ecosystems (Zhai and Pauly, 2019).
Some important fish species, such as Decapterus muroadsi, Branchiostegus japonicus, and Larimichthys crocea, were already strongly exploited in the 1950s. Thus, the stock of large yellow croaker (L. crocea), a prized species in China, was quickly depleted when China developed its industrial fisheries; it finally collapsed in 1974, once Chinese and South Korean fleet reached its overwintering grounds (Xu and Liu, 2007), rendering it commercially extinct (Zhao et al., 2002). Although protection measures for the spawning grounds of large yellow croaker were put in place by China in the early 1980s, the stock was severely depleted, and does not seem able to recover (Liu and Sadovy de Mitcheson, 2008).
Another important commercial species of China, yellow croaker (L. polyactis), showed first signs of overexploitation in the 1960s, but they were masked by the offshore expansion of the fisheries (Liang and Pauly, 2017a) and large catches of other species (Fei, 1980). The catch of yellow croaker initially decreased, but later appeared to increase to more than two times than that in the 1950s. This stock recovery was the result of China’s and South Korea’s protective measures, notably a 6-year total ban on fishing in its main spawning ground in the southern Yellow Sea in the 1980s (Lee and Midani, 2014; Yan et al., 2014). However, the recovery of yellow croaker came at a cost, as the adult individuals became much smaller, and reached maturity at smaller sizes (Dieckmann et al., 2005; Yan et al., 2014), as can be expected on theoretical grounds (Pauly, 1984, 2019).
Japanese anchovy (E. japonicus), which had one of three populations found not to be overfished, is a very common and important small pelagic fish, especially as food for other commercial species. As a low-value species (Yu and Zheng, 2000), it was largely a bycatch species until the mid-1980s, when it became the target species of reduction (i.e., fishmeal) fisheries (Zhu et al., 1990; Tang et al., 2002) and thus began to show up in China fisheries statistics and fisheries research. While this research showed that Japanese anchovy was overfished around 2006 (Li et al., 2015), its stock seems to have recovered since, possibly because the top predators in China’s coastal seas have been fished out, which reduced predation pressure on small pelagic fish.
Japanese flounder (Paralichthys olivaceus), another stock that is currently in good shape, was depleted in the early 1990s. Then, management measures, which include restocking (via the release of juveniles) were put in place and strengthened, which allowed the population to recover (Zhou, 2011).
Osbeck’s grenadier anchovy (C. mystus), is the only stock found to be recovering. This anchovy is an amphidromous species that is very popular with consumers along the Yangtze River; in fact, it was one of the most important resource species of the Yangtze Estuary before the 1960s (Wang and Ni, 1984; Zheng, 2012). It became even more valuable in the last 30 years, as the populations of associated species, such as Reeves shad (Tenualosa reevesii) and the noodlefish (Salanx prognathus) strongly declined (Ni, 1999). The environment of C. mystus is very vulnerable to human activities and terrigenous pollution. Thus, we laud the decision to prohibit the harvesting of Osbeck’s grenadier anchovy in the Yangtze River and its estuary, as published on February 1, 2019 (Anon, 2019), and the 10 years’ fishing ban for the entire Yangtze River Basin that began in January 2020. These decisions, if vigorously implemented, may help the stock to recover, in spite of the pollution and degradation of its habitat (Yang et al., 2012). Note, finally that the stock of C. mystus in the Min River Estuary was found to be in good shape (Zhang et al., 2020), thus suggesting a strong influence of local conditions.
Pacific sardine (S. sagax), also known as “South American pilchard” (see text footnote 1; Froese and Pauly, 2019), ranges across the entire Pacific and beyond, and has supported many huge fisheries, notably off Chile and Peru, California (Steinbeck, 1945; Cisneros-Mata et al., 1995; Yáñez et al., 2001), and Japan (Watanabe et al., 1995). The stocks of Pacific sardine fluctuate strongly in response to climatic events, often in similar ways across very distant regions (Lluch-Belda et al., 1989, 1992; Deyle et al., 2013), which led to high catches in China in the 1970s and 1980s (Wang, 1985). As the 2-parameter CMSY model cannot readily accommodate massive changes in biomass due to environmental fluctuations, Pacific sardine treated as if it was overfished in 1950–1975. This allowed its biomass to increase until the 1980s (as occurred in reality), then to decline due to strong fishing pressure and the fading of the environmental conditions that had generated the massive increase. However, we did not report on it “MSY” or other statistics, which would be unrealistic.
Conclusion
In conclusion, most stocks we studied have biomasses that are much lower than BMSY, i.e., the biomass associated with MSY. Thus, China loses millions of tonnes every year of potential catch to overfishing, and huge sums in the form of subsidies to fisheries that exploit overfished coastal stocks (Mallory, 2016). Although mariculture and the release of juveniles are maintaining several stocks, this is not a sustainable proposition; also, these measures lead to genetic diversity losses (Wang et al., 2012). Aquaculture should not be expected to maintain wild fish populations. Prudent fisheries management, on the other hand, can do this, and counter fisheries resources degradation. China has now taken measures to control its excessive fishing effort and we hope that the present study will serve as supporting scientific evidence toward fishing effort reduction.
Data Availability Statement
All datasets generated for this study are included in the article/Supplementary Material.
Author Contributions
LZ was responsible for data collection, formal analysis, and writing original draft. CL was responsible for data curation, reviewing, and editing the manuscript. DP was responsible for conceptualization, methodology, and supervision. All authors contributed to the article and approved the submitted version.
Conflict of Interest
The authors declare that the research was conducted in the absence of any commercial or financial relationships that could be construed as a potential conflict of interest.
The reviewer DD declared a past co-authorship with one of the authors, DP, to the handling editor.
Funding
LZ’s studies in Canada were funded by the China Scholarship Council (CSC). CL’s work was funded by Qingdao Postdoctoral Applied Research Project, NSFC-Shandong Joint Fund for Marine Ecology and Environmental Sciences (grant number U1606404). DP’s research was supported by the Sea Around Us, funded by the Oak Foundation, the Marisla Foundation, the David and Lucile Packard Foundation, the Minderoo Foundation, and the Bloomberg Philanthropies through RARE.
Acknowledgments
LZ would like to thank the China Scholarship Council (CSC). CL thanks the Qingdao Postdoctoral Applied Research Project. DP acknowledges support by the Sea Around Us, funded by a number of philanthropic foundations. The authors also thank Rainer Froese for his comments on an early draft of this contribution and Evelyn Liu for the figures.
Supplementary Material
The Supplementary Material for this article can be found online at: https://www.frontiersin.org/articles/10.3389/fmars.2020.483993/full#supplementary-material
Footnotes
References
Anderson, C. N., Hsieh, C. H., Sandin, S. A., Hewitt, R., Hollowed, A., Beddington, J., et al. (2008). Why fishing magnifies fluctuations in fish abundance. Nature 452, 835–839. doi: 10.1038/nature06851
Anon (2019). Full Coverage of the Closed Fishing System in Key River Basins in China. Beijing: Information of the Ministry of Agriculture and Rural Affairs, People’s Republic of China.
Bo, Z. L., Zhou, W. X., Xue, L. J., and Chen, W. P. (2005). Survey of Branchiostegus resource in the north part of the East China Sea and in the southern part of Yellow Sea. J. Fish. China 29, 676–681.
Cheung, W. W. L., Pitcher, T. J., and Pauly, D. (2005). A fuzzy logic expert system to estimate intrinsic extinction vulnerabilities of marine fishes to fishing. Biol. Conserv. 124, 97–111. doi: 10.1016/j.biocon.2005.01.017
Cisneros-Mata, M. A., Nevárez-Martínez, M. O., and Hammann, M. G. (1995). The rise and fall of the Pacific sardine, Sardinops sagax caeruleus Girard, in the Gulf of California, Mexico. CalCOFl Rep. 36, 136–143.
Demirel, N., Zengin, M., and Ulman, A. (2020). First large-scale eastern mediterranean and black sea stock assessment reveals a dramatic decline. Front. Mar. Sci. 7:103. doi: 10.3389/fmars.2020.00103
Deyle, E. R., Fogarty, M., Hsieh, C.-H., Kaufman, L., MacCall, A. D., Munch, S. B., et al. (2013). Predicting climate effects on Pacific sardine. Proc. Natl. Acad. Sci. 110, 6430–6435. doi: 10.1073/pnas.1215506110
Dieckmann, U., Heino, M., and Jin, X. (2005). Shrinking fish: fisheries-induced evolution in the Yellow Sea. Options Autumn 2005:8.
FAO (2018). The State of World Fisheries and Aquaculture 2018. Rome: Food and Agriculture Organization of the United Nations.
Fei, H. N. (1980). Characteristics of aquatic resources and recommendations for enhanced management. China Fish. 3, 4–5.
Froese, R., Demirel, N., Coro, G., Kleisner, K. M., and Winker, H. (2017). Estimating fisheries reference points from catch and resilience. Fish Fish. 18, 506–526. doi: 10.1111/faf.12190
Froese, R., Palomares, M. L. D., and Pauly, D. (2000). “Estimation of life history key facts of fishes,” in FishBase 2000: Concepts, Design and Data Sources, eds R. Froese and D. Pauly (Los Baños: ICLARM), 167–175.
Froese, R., Winker, H., Coro, G., Demirel, N., Tsikliras, A. C., Dimarchopoulou, D., et al. (2018). Status and rebuilding of European fisheries. Mar. Policy 93, 159–170. doi: 10.1016/j.marpol.2018.04.018
Huang, S. L., and He, Y. R. (2019). Management of China’s capture fisheries: review and prospect. Aquac. Fish. 4, 173–182. doi: 10.1016/j.aaf.2019.05.004
Ji, Y. P., Liu, Q., Liao, B. C., Zhang, Q. Q., and Han, Y. N. (2019). Estimating biological reference points for largehead hairtail (Trichiurus lepturus) fishery in the Yellow Sea and Bohai Sea. Acta Oceanol. Sin. 38, 20–26. doi: 10.1016/j.fishres.2011.05.007
Lee, S.-G., and Midani, A. R. (2014). National comprehensive approaches for rebuilding fisheries in South Korea. Mar. Policy 45, 156–162. doi: 10.1016/j.marpol.2013.12.010
Li, Q. C., Zou, Y., Zhang, S. H., Wang, Y. J., Zhao, D., and Song, A. H. (2015). Changes in main fish stocks in Bohai Sea around Shandong Province. Fish. Sci. 34, 647–651. doi: 10.16378/j.cnki.1003-1111.2015.10.009
Liang, C., and Pauly, D. (2017a). Fisheries impacts on china’s coastal ecosystems: unmasking a pervasive ‘fishing down’ effect. PLoS One 12:e0173296. doi: 10.1371/journal.pone.0173296
Liang, C., and Pauly, D. (2017b). Growth and mortality of exploited fishes in China’s coastal seas and their uses for yield-per-recruit analyses. J. Appl. Ichthyol. 33, 746–756. doi: 10.1111/jai.13379
Liang, C., Xian, W. W., Liu, S. D., and Pauly, D. (2020a). Assessments of 14 exploited fish and invertebrate stocks in Chinese waters using the LBB method. Front. Mar. Sci. 7:314. doi: 10.3389/fmars.2020.00314
Liang, C., Xian, W. W., and Pauly, D. (2020b). Assessments of 15 exploited fish stocks in Chinese, South Korean and Japanese waters using the CMSY and BSM methods. Front. Mar. Sci. 7:623. doi: 10.3389/fmars.2020.00623
Lin, L. S., Cheng, J. H., Ren, Y. P., and Ling, J. Z. (2004). Analysis of population biology of small yellow croaker Pseudosciaena polyactis in the East China Sea region. J. Fish. Sci. China 1, 333–338.
Liu, H. X. (2005). Study of Year-Recruit-Model for Spotted Mackerel, Scomber Australasicus, in the Waters off Northeastern Taiwan. dissertation/doctoral thesis, National Taiwan University, Taiwan.
Liu, M., and Sadovy de Mitcheson, Y. (2008). Profile of a fishery collapse: why mariculture failed to save the large yellow croaker. Fish Fish. 9, 219–242. doi: 10.1111/j.1467-2979.2008.00278.x
Lluch-Belda, D., Crawford, R. J. M., Kawasaki, T., MacCall, A. D., Parrish, R. H., Schwartzlose, R. A., et al. (1989). World-wide fluctuations of sardine and anchovy stocks: the regime problem. S. Afr. J. Mar. Sci. 8, 195–205. doi: 10.2989/02577618909504561
Lluch-Belda, D., Schwartzlose, R. A., Serra, R., Parrish, R., Kawasaki, T., Hedgecock, D., et al. (1992). Sardine and anchovy regime fluctuations of abundance in four regions of the world oceans: a workshop report. Fish. Oceanogr. 1, 339–347. doi: 10.1111/j.1365-2419.1992.tb00006.x
Lu, Z. B., Yan, Y. M., and Du, Q. (1998). Variation of fishery resources and estimation of suitable fishing efforts in Xiamen coastal waters. J. Oceanogr. Taiwan Strait. 17, 309–316.
Mallory, T. G. (2013). China’s distant water fishing industry: evolving policies and implications. Mar. Policy 38, 99–108. doi: 10.1016/j.marpol.2012.05.024
Mallory, T. G. (2016). Fisheries subsidies in China: quantitative and qualitative assessment of policy coherence and effectiveness. Mar. Policy 68, 74–82. doi: 10.1016/j.marpol.2016.01.028
McAllister, M. K., Pikitch, E. K., and Babcock, E. A. (2001). Using demographic methods to construct Bayesian priors for the intrinsic rate of increase in the Schaefer model and implications for stock rebuilding. Can. J. Fish. Aquat. Sci. 58, 1871–1890. doi: 10.1139/f01-114
Millar, R. B., and Meyer, R. (1999). Nonlinear State-Space Modeling of Fisheries Biomass Dynamics using the Gibbs Sampler. Auckland: Department of Statistics, The University of Auckland. Technical Report STAT9901.
Ministry of Agriculture and Rural Affairs of the People’s Republic of China [MARA] (2018). Announcement of the MARA [2018, No. 1]: Announcement of the Ministry of Agriculture on the Adjustment of the Summer Fishing Moratorium System. Beijing: MARA.
Ministry of Agriculture and Rural Affairs of the People’s Republic of China [MARA] (2019). Announcement of the MARA[2019, No. 4]: Announcement on the Area and Time of the Ban on Fishing in Key Waters of the Yangtze River Basin. Beijing: MARA.
Musick, J. A. (1999). Criteria to define extinction risk in marine fishes. Fisheries 24, 6–14. doi: 10.1577/1548-8446(1999)024<0006:ctderi>2.0.co;2
Ni, Y. (1999). Fishery resources conservation for Coilia mystus in the Changjiang Estuary. J. Fish. Sci. China 6, 75–77.
Palomares, M. L. D., and Pauly, D. (2019). On the creeping increase of vessels’ fishing power. Ecol. Soc. 24:31. doi: 10.2307/26796991
Pauly, D. (1984). A mechanism for the juvenile-to-adult transition in fishes. J. du Conseil int. pour l’Exploration de la Mer 41, 280–284. doi: 10.1093/icesjms/41.3.280
Pauly, D. (2019). Gasping Fish and Panting Squids: Oxygen, Temperature and the Growth of Water-Breathing Animals – 2nd Edition. Excellence in Ecology. Oldendorf: International Ecology Institute.
Qiu, S. Y. (1995). Dynamics of Japanese spanish mackerel, Scomberomorus niphonius (Cuvier et Valenciennes) stocks in the yellow sea and bohai sea. Modern Fish. Inform. 10, 16–19.
Ren, Q. Q., and Liu, M. (2020). Assessing northwest Pacific fishery stocks using two new methods: the monte Carlo Catch-MSY (CMSY) and the bayesian schaefer model (BSM). Front. Mar. Sci. 7:430. doi: 10.3389/fmars.2020.00430
Ricker, W. E. (1975). Computation and interpretation of biological statistics of fish populations. Bull. Fish. Res. Bd. Can. 191, 382p.
Schaefer, M. B. (1954). Some aspects of the dynamics of populations important to the management of the commercial marine fisheries. Inter Am. Trop. Tuna Commission Bull. 1, 23–56.
Schaefer, M. B. (1957). A study of the dynamics of the fishery for yellowfin tuna in the eastern tropical Pacific Ocean. Inter Am. Trop. Tuna Commission Bull. 2, 243–285.
Shen, G., and Heino, M. (2014). An overview of marine fisheries management in China. Mar. Policy 44, 265–272. doi: 10.1016/j.marpol.2013.09.012
Song, L. Q. (2007). Study on Dual-Transform of Marine Fishermen in China. Qingdao: China Ocean University Press.
Tang, M. Z., Lian, D. J., Lu, Y., and Yin, X. W. (2002). Fisheries administration and changes of Anchovy resources in the East and Yellow Sea. Fish. Sci. 21, 44–45.
Villasante, S., Rodríguez-González, D., Antelo, M., Rivero-Rodríguez, S., de Santiago, J. A., and Macho, G. (2013). All fish for China? Ambio. 42, 923–936. doi: 10.1007/s13280-013-0448-9
Wang, L., Shi, X., Su, Y., Meng, Z., and Lin, H. (2012). Loss of genetic diversity in the cultured stocks of the large yellow croaker, Larimichthys crocea, revealed by microsatellites. Int. J. Mol. Sci. 13, 5584–5597. doi: 10.3390/ijms13055584
Wang, Y. B., Wang, Y., Liang, C., Zhang, H., and Xian, W. W. (2020). Assessment of 12 fish species in the northwest Pacific using the CMSY and BSM methods. Front. Mar. Sci. 7:616. doi: 10.3389/fmars.2020.00616
Wang, Y. H., and Ni, Y. (1984). On the fisheries resources and their exploitation of the Changjiang (Yangtze) River Estuary in Shanghai Region. J. Fish. China 8, 147–159.
Wang, Q. H. (1985). Preliminary study on the Sardinops melanosticta (T&S) in the Yellow Sea. J. Shandong Ocean Univ. 15, 85–93.
Wang, Y. Z., Jia, X. P., Lin, Z. J., and Sun, D. R. (2011). Response of Trichiurus lepturus catches to fishing and climate variability in the East China Sea. J. Fish. China 35, 1881–1889.
Watanabe, Y., Zenitani, H., and Kimura, R. (1995). Population decline of the Japanese sardine Sardinops melanostictus owing to recruitment failures. Can. J. Fish. Aquat. Sci. 52, 1609–1616. doi: 10.1139/f95-154
Watson, R., and Pauly, D. (2001). Systematic distortions in world fisheries catch trends. Nature 414, 534–536. doi: 10.1038/35107050
Wei, S., and Li, F. G. (1986). Life habits and resource changes of S. sagax. Foreign Aquat. 1, 41–44.
Winker, H., and Sherley, R. (2019). JARA: ‘Just Another Red-List Assessment’. bioRxiv [preprint]. doi: 10.1101/672899
Xu, K. D., and Liu, Z. F. (2007). The current stock of large yellow croaker Pseudosciaena crocea in the East China Sea with respects of its stock decline. J. Dalian Fish. Univ. 22, 392–395.
Xu, S. S., Song, J. M., Li, X. G., Yuan, H. M., Li, N., and Duan, L. Q. (2014). Variation Characteristics of Catch Structure in the Bohai Sea and Its Influencing Factors. J. Nat. Resour. 29, 500–506.
Yan, L. P., Liu, Z. L., Zhang, H., Ling, J. Z., Yuan, X. W., and Li, S. F. (2014). Evolution of biological resource characteristics and resource quantity of small yellow croaker. Mar. Fish. 36, 481–488.
Yáñez, E., Barbieri, M. A., Silva, C., Nieto, K., and Espíndola, F. (2001). Climate variability and pelagic fisheries in northern Chile. Prog. Oceanogr. 49, 581–596. doi: 10.1016/S0079-6611(01)00042-8
Yang, H., Xie, P., Ni, L. Y., and Flower, R. J. (2012). Pollution in the Yangtze. Science 337:410. doi: 10.1126/science.337.6093.410-a
Yang, J. M. (1988). Status of fishery resources development in the western Huanghai Sea (Yellow Sea). Mar. Sci. 4, 70–71.
Yu, C. G., and Zheng, B. (2000). Current situation and countermeasures of the utilization of Engraulis japonicus resources in zhejiang offshore. Mar. Fish. 1, 23–26.
Zhai, L., and Pauly, D. (2019). Yield-per-recruit, utility-per-recruit, and relative biomass of 21 exploited fish species in China’s coastal seas. Front. Mar. Sci. 6:724. doi: 10.3389/fmars.2019.00724
Zhai, L., and Pauly, D. (2020). Construction and interpretation of particle size distribution spectra from 19 Ecopath models of Chinese coastal ecosystems. Front. Mar. Sci. 7:298. doi: 10.3389/fmars.2020.00298
Zhan, B. Y., Lou, D. C., and Zhong, J. S. (1986). An assessment of the filefish population and rational exploitations of the resource. J. Fish. China 10, 409–418.
Zhang, G. X., and Hua, J. D. (1990). Changes in the resources of the Coilia mystus in the Yangtze River Estuary and estimation of its maximum sustainable yield. 131–134.
Zhang, L. L., Ren, Q. Q., Liu, M., Xu, Q., Kang, B., and Lin, J. J. (2020). Fishery stock assessments in the Min River Estuary and its adjacent waters of southern China using the length-based Bayesian estimation (LBB) method. Front. Mar. Sci. 7:507. doi: 10.3389/fmars.2020.00507
Zhao, S. L., Wang, R. X., and Liu, X. S. (2002). Reason of exhaustion of resources of Pseudosciaena crocea in zhoushan fishing ground and the measures of protection and proliferation. J. Zhejiang Ocean Univ. 21, 162–165.
Zheng, Y. (2012). Evaluation of Coilia mystus of the Yangtze River. J. Anhui Agric. 40, 17140–17143.
Zhu, D. S., Chen, Y. Z., and Wang, W. X. (1990). Investigation and study on acoustic evaluation of carp and other economic fish resources in the East Yellow Sea. Mar. Fish. Res. 11, 18–23.
Keywords: data-poor fisheries, Chinese coastal fisheries, biomass declines, CMSY, stock assessments
Citation: Zhai L, Liang C and Pauly D (2020) Assessments of 16 Exploited Fish Stocks in Chinese Waters Using the CMSY and BSM Methods. Front. Mar. Sci. 7:483993. doi: 10.3389/fmars.2020.483993
Received: 10 July 2019; Accepted: 29 October 2020;
Published: 23 November 2020.
Edited by:
Athanassios C. Tsikliras, Aristotle University of Thessaloniki, GreeceReviewed by:
Gianpaolo Coro, Istituto di Scienza e Tecnologie dell’Informazione “Alessandro Faedo” (ISTI), ItalyDonna Dimarchopoulou, University of Rhode Island, United States
Copyright © 2020 Zhai, Liang and Pauly. This is an open-access article distributed under the terms of the Creative Commons Attribution License (CC BY). The use, distribution or reproduction in other forums is permitted, provided the original author(s) and the copyright owner(s) are credited and that the original publication in this journal is cited, in accordance with accepted academic practice. No use, distribution or reproduction is permitted which does not comply with these terms.
*Correspondence: Lu Zhai, emhhaWx1MDcwOEBob3RtYWlsLmNvbQ==