 Chiara De Falco
 Annalisa Bracco
 Claudia Pasquero
- 1Department of Earth and Environmental Sciences, University of Milan-Bicocca, Milan, Italy
- 2School of Earth and Atmospheric Sciences, Georgia Institute of Technology, Atlanta, GA, United States
The frequency of coral bleaching events has been increasing in recent decades due to the temperature rise registered in most regions near the ocean. Their occurrence in the Maldivian Archipelago has been observed in the months following the peak of strong El Niño events. Bleaching has not been uniform, and some reefs have been only marginally impacted. Here, we use satellite observations and a regional ocean model to explore the spatial and temporal variability of sea surface temperatures (SSTs), and quantify the relative magnitude of ENSO-related episodes with respect to the recent warming. In line with other studies, it is confirmed that the long-term trend in SST significantly increases the frequency of stress conditions for the Maldivian corals. It is also found that the interaction between currents and the steep bathymetry is responsible for a local cooling of about 0.2°C in the Archipelago during the warmest season, with respect to the surrounding waters. This cooling largely reduces the frequency of mortality conditions.
1. Introduction
Tropical coral ecosystems are hotspots of biodiversity. Reefs contribute to key ecosystem services spanning from food and tourism resources to protection against high waves during storms. In the Maldives, located in the Indian Ocean to the south west of Cape Comorin (India) and composed of 26 atolls and over 1,100 islands, coral reefs constitute also the primary building material (Kench, 2011). Whether the ability of coral reefs to provide these essential services will continue in the future, however, is uncertain. Warming of ocean waters, acidification, overfishing, pollution, and damage from coastal development constitute local and global threats that jeopardize the sustainability of reef systems. In the Maldives, the increase in sea surface temperature (SST) is the most pressing danger (Pisapia et al., 2016, 2019).
Whenever SSTs exceed climatological values by 1 or 2°C in the warmest season for a sufficiently long time, reef-building (sclearctinian) corals expel their symbiotic algae, with consequent bleaching and often mortality. In the Maldives, these prolonged periods can occur in the period between April and June, usually following peak positive El Niño Southern Oscillation (ENSO) conditions in the tropical Pacific (Schuhmacher et al., 2005; Zahir et al., 2009; Pisapia et al., 2016; Ibrahim et al., 2017). The two most recent bleaching events during which coral mortality rates well above 50% were recorded at most sites occurred in 1998, when little monitoring was in place, and in 2016, when a more careful assessment was possible (Zahir et al., 2009; Ibrahim et al., 2017). In the decade following the 1998 bleaching event, most of the Maldivian coral reefs recovered to pre-1998 levels of coverage, with some changes in composition toward more temperature resilient species (Morri et al., 2015). The recovery level was higher and faster than in other sites in the Indian Ocean. Various factors may have contributed to this nearly complete recovery, including elevated biomass of herbivorous fish on the reefs that are not targeted by the local fishermen (Risk and Sluka, 2000; McClanahan et al., 2011), large connectivity among sites (Naseer and Hatcher, 2004), overall pristine conditions of most of the islands and atolls, with still limited anthropogenic pollution and eutrophication compared to other regions (Ibrahim et al., 2017), and the existence of refuges or sites where corals survived through bleaching events and repopulated the surrounding reefs. The presence of refuges was clearly observed during the 2016 events, where some reefs, or hope spots, reported bleaching only to 25% or less of their area, despite much greater (up to 100%) decline in live coral coverage at other sites (Ibrahim et al., 2017).
In this work, we use satellite and reanalysis products and a regional ocean model to explore the possibility of physical drivers contributing to the patchiness in bleaching events, and therefore to the presence of these hope spots, in the Maldives, and to evaluate how the predicted warming may modify the likelihood of coral bleaching in the next few decades. While recognizing that many factors other than physical may contribute to the observed differences among sites, and that products from satellite may not have sufficient resolution to resolve scales small enough to distinguish clearly between specific sites, we wish to explore how and where ENSO events, both positive and negative, may modify the strength and duration of SST anomalies, and how the ocean circulation influences the distribution of ocean temperatures in one of the most pristine marine biodiversity hotspots on the planet.
2. Data and Methods
The SST data set of choice in this work is the Group for High Resolution Sea Surface Temperature (GHRSST) Level 4 (National Centers for Environmental Information, 2016), available over the period 1982–2018 with daily temporal 0.25° spatial resolution. It is based on SST measured from Advanced Very High Resolution Radiometers (AVHRR) blended with in-situ observations, ships, and buoys (both drifters and moorings), using the optimal interpolation (OI) method (Reynolds et al., 2007). We performed a more detailed analysis of the years 2013 and 2016 using a version of GHRSST at higher spatial resolution (0.054°), available from April 2006 (UK Met Office, 2005). This last version uses satellite data from multiple sensors in addition to AVHRR, including the Advanced Along Track Scanning Radiometer (AATSR), the Spinning Enhanced Visible and Infrared Imager (SEVIRI), the Advanced Microwave Scanning Radiometer-EOS (AMSRE), and the Tropical Rainfall Measuring Mission Microwave Imager (TMI).
To better understand the patterns of SST revealed by our analysis, we conducted a numerical investigation using CROCO (Coastal and Regional Ocean COmmunity) model, a publicly available oceanic modeling system built upon ROMS (Regional Ocean Modeling System) in its Agrif version (Auclair et al., 2018). We performed a simulation covering a neutral ENSO year (2013) at 5 km horizontal resolution and using 60 vertical sigma levels. The model domain covered the region from 67 to 79°E in longitude and from −11.6°S to 16°N in latitude. Temperature, salinity, and velocity fields from SODA3 (Carton et al., 2018) were used at the open ocean boundaries, while 3-hourly ERA5 (Copernicus Climate Change Service C3S, 2017) heat, momentum, and freshwater (precipitation–evaporation) fluxes forced the circulation at the surface. A spin-up under climatological forcing and boundary conditions was performed to ensure a statistically steady state in CROCO before proceeding with the 2013 simulation.
The analysis has been performed on two domains in the Indian Ocean; one covers the Maldivian Archipelago and the surrounding ocean, from 70.5 to 75.5°E in longitude and from 3.3°S to 9.5°N in latitude, while the second is restricted to the atolls, from 72.5 to 74°E in longitude and from 0.5°S to 7.5°N in latitude.
If given enough time (order of years or longer), corals can acclimatize and adapt to slightly different conditions (Maynard et al., 2008; Guest et al., 2012; Penin et al., 2013). This implies that coral bleaching does not happen at a fixed temperature at all times or locations. The local temperature threshold to define a potential stress for corals is typically based on the maximum monthly mean (MMM) temperature. The US National Oceanic and Atmospheric Administration (NOAA) defines as HotSpots (HS) the daily temperature anomalies above MMM temperature. Corals are considered to be thermally stressed at temperatures 1°C or more above MMM temperature, i.e., HS ≥1°C (Glynn and D'Croz, 1990; Lough, 2011; Chaudhury et al., 2019).
The extent of bleaching depends not only on the temperature maxima but also on the temporal persistence of the thermal stress (Lesser, 2011). To account for both the magnitude and the duration of the stress, the metric “degree heating period” (DHP) is introduced. It is computed at any given time by integrating HS of 1°C or greater over the preceding 12 weeks:
where is the Heaviside function. Operationally, the integral operator is replaced by a summation, as temperature is typically available as a discrete time series: for daily temperatures, for instance, defining δt=1 day the DHP becomes
Depending on the units used to express it and the HS stress threshold used, this metric appears in the literature as Degree Heating Days (expressed in °C day) (Maynard et al., 2008) or Degree Heating Weeks (expressed in °C-week) (Liu et al., 2014).
Values of DHP above 4 and 8°C-week are representative of bleaching and mortality conditions, respectively (Liu et al., 2005). The use of a threshold based metric has been criticized (McClanahan et al., 2019), but remains widely implemented and provides useful information (e.g., Liu et al., 2014; Hughes et al., 2017; Ibrahim et al., 2017; Kayanne, 2017; Lough et al., 2018).
Considering that bleaching in the Maldives occurs during strong El Niño years, the analysis is performed by taking into account the ENSO cycle. For this purpose, we use the Oceanic Niño Index (ONI). The ONI tracks the running 3-months average SST in the Niño3.4 region, located in the tropical Pacific between 120–170°E and 5°S to 5°N. Considering that the onset of El Niño is typically at the end of the year, and that its warming impact on the Indian Ocean temperatures peaks in April–May (Schott and McCreary, 2001), we define ENSO years as the 12 months from October to September. ENSO+(−) years are those with five consecutive 3 months running means with a temperature anomaly higher that 0.5°C (lower than -0.5°). The studied years, between 1982 and 2018, have been divided into ENSO+ (El-Niño), ENSO− (La-Niña), and neutral years (see Supplementary Table 1).
3. Results
3.1. Interannual Variability of Coral Bleaching Conditions
The amplitude of the climatological seasonal cycle of SST in the study region is <2°C (see Supplementary Figure 1), and the surface MMM temperature is in April. From the onset of the summer monsoon, at the end of May, the extensive cloud cover reduces the solar radiation that reaches the ocean surface inducing a SST reduction in the region (Roy et al., 2014; Dey et al., 2015). The spatial structure of the surface MMM temperature is shown in Figure 1A, with values locally varying between 29.5°C in the south and 30°C in the north of the domain. Coral bleaching occurred, so far, in the warmest season, from March to May, and in association with strong El Niño events (Wilkinson, 2008; Zahir et al., 2009; Chatterjee et al., 2012; Ibrahim et al., 2017). The maximum daily SST has a strong correlation with the peak of the annual ONI value that, in the considered period, always occurs in the preceding winter, with local correlation coefficients varying between 0.45 in the equatorial region to 0.84 in the northern latitudes (Supplementary Figure 2)1.
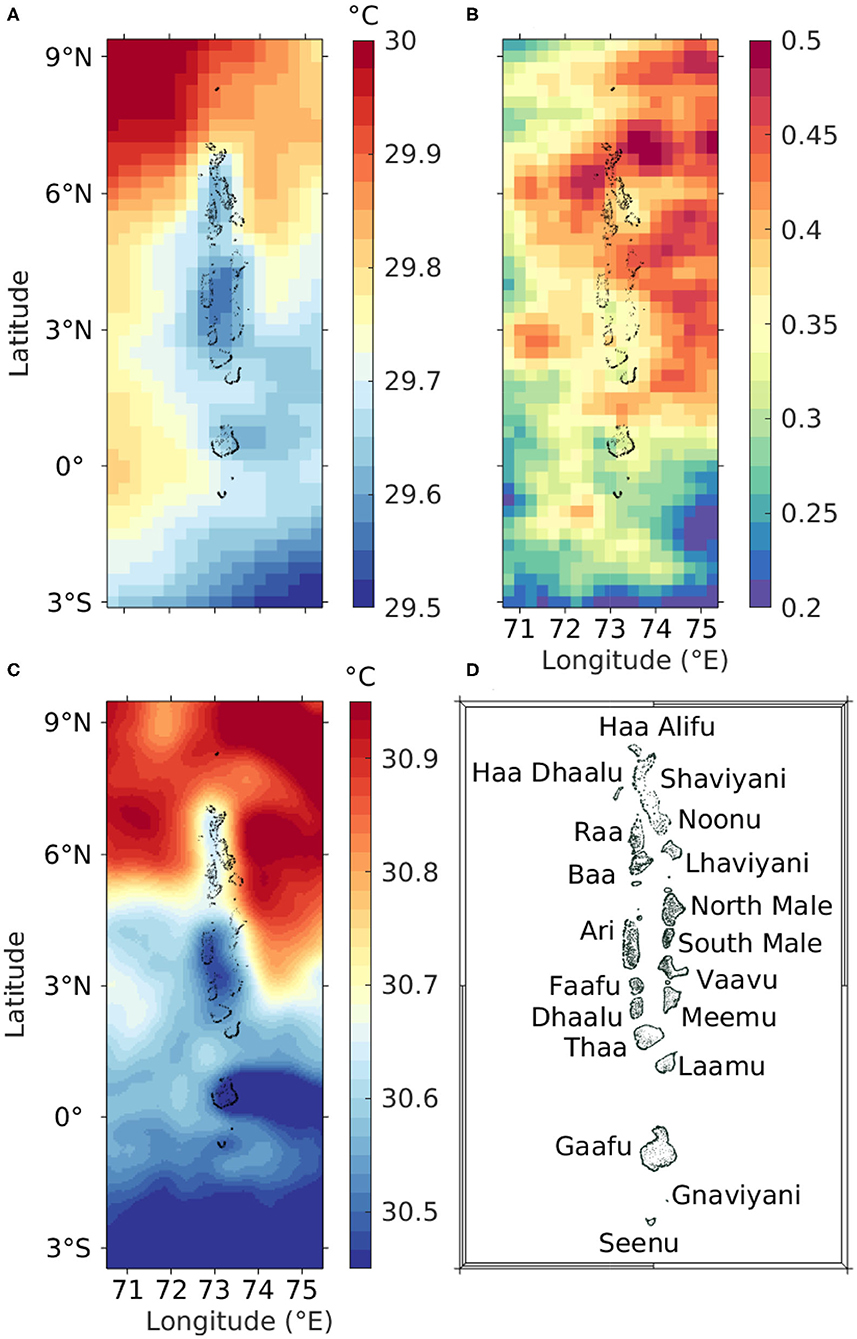
Figure 1. (A) Map of maximum monthly mean surface temperature averaged over the period 1982–2018; (B) linear regression coefficient of April–May maximum daily surface temperatures on maximum annual Oceanic Niño Index (ONI) for the 1982–2018 interval; (C) mean April–May sea surface temperature (SST) in 2016 following the 2015 El-Niño. Group for High Resolution Sea Surface Temperature (GHRSST) data have been used at 25 km resolution for (A,B) and at 5 km resolution—the same used later in the model run—for (C). (D) Map of the Maldives Archipelago.
Figure 1B shows the linear regression of the maximum daily SST during the March–May period onto the maximum ONI index. During years with peak ONI values of 1°C, the local difference between March–May peak daily surface temperature and its mean value varies from 0.2°C near the equator to 0.5°C on the northeastern corner of the domain. Three relative minima are present over the Archipelago, with ENSO-related temperature variability smaller near the atolls and in the shallow inner sea, and larger over the deep passes among the islands (see Supplementary Figure 3). In the surface MMM temperature map and in the ENSO-SST regression map, waters around the Maldivian archipelago are characterized by climatological temperatures and ENSO impacts somewhat smaller compared to the surrounding areas. These maps suggest a role for the physical circulation at the atolls in controlling the temperature anomalies that will be discussed later on.
The patchiness in Figure 1B is further highlighted in Figure 1C that shows the warming patterns following the 2016 El-Niño in April and May. The warming caused by the 2016 event was more intense in April and less so in May, while in 1998 the opposite was verified (see Supplementary Figure 7). Interestingly the 2016 satellite data hint to the possibility of hope spots in the Faafu, South Ari, and Baa atolls (Figure 1D) where indeed 7 of the 8 reefs with high potential of surviving the bleaching event were sampled (Ibrahim et al., 2017). The southern atolls, Gaafu especially, show conditions that are similar or even more promising. Unfortunately, the scarcity of surveys in these atolls precludes the possibility of an adequate assessment of the local reefs conditions (Ibrahim et al., 2017).
Focusing on the interannual variability of the upper ocean conditions, we compute probability density functions (PDFs) of April and May temperatures over the whole study area and over the box covering only the atolls, separately for ENSO+, ENSO−, and ENSO neutral years. The PDFs (Figure 2) indicate that the largest differences between the three clusters of years are in the warm tail of the distributions. During ENSO− (La Niña) years, the probability of occurrence of low temperatures (T < 29°C) is nearly unchanged compared to neutral years, while chances of high temperatures (T > 30°C) are suppressed (Figure 2A). During ENSO+ (El Niño) years, the whole distribution is wider and is significantly displaced to higher temperatures. This asymmetric behavior (i.e., El Niño—La Niña differences being relatively small at low temperatures and large at high temperatures) can be explained by the fact that over this domain, there is an anti-correlation between the depth of the mixed layer and the SST, with colder (warmer) surface waters being associated with a deeper (shallower) mixed layer (see Supplementary Figure 4). The mixed layer in the warmest months (April–May) is shallower during ENSO+ years than in the 1980–2016 climatology (see Supplementary Figure 5A). This difference results in part from a strengthening of the heat fluxes into the Ocean (Supplementary Figure 5B), and also from the weakening of the winds over the Maldives (Supplementary Figure 5C) during ENSO+ years. An anomalous air–sea heat flux that warms the ocean in an El Niño year, when surface temperatures tend to be higher and the mixed layer shallower than climatological values (see Supplementary Figure 5A), is distributed over a thinner layer and generates a larger temperature increase. On the other hand, anomalous air–sea fluxes leading to ocean cooling are distributed, during any year, over a deeper mixed layer generating a smaller temperature decrease (see Supplementary Figure 6). The PDFs (Figure 2) further highlight that the impact of ENSO+ events is reduced near the islands, with a lower probability of reaching 32°C around the atolls with respect to the open ocean.
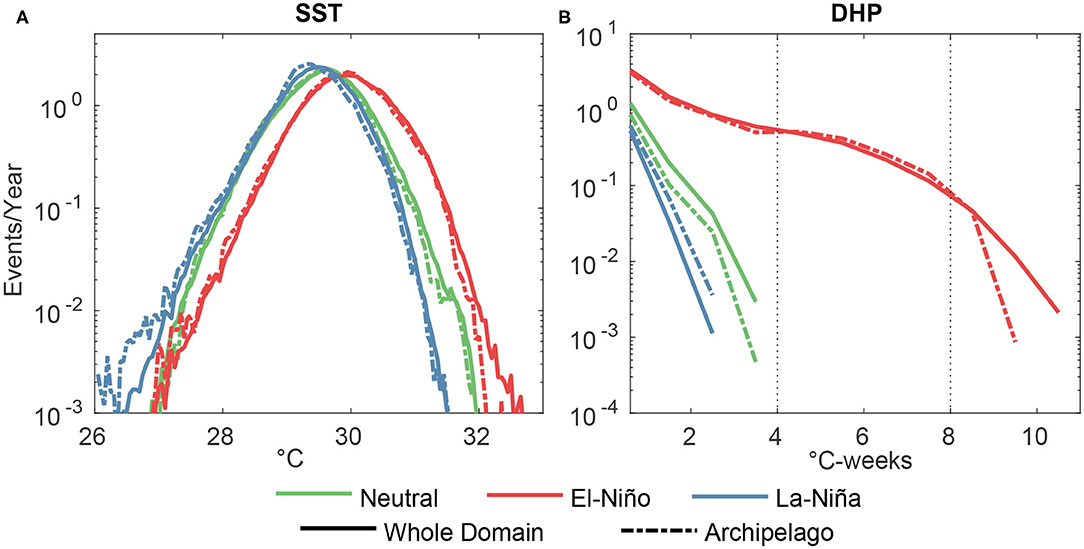
Figure 2. Sea surface temperature distributions for the month of April from Group for High Resolution Sea Surface Temperature (GHRSST) (A). Distribution of the degree heating period conditioned to days with HS (Hot Spots) temperature more than 1°C in the satellite data (B).
To further quantify the thermal stress on corals linked to ENSO episodes, we compute the average number of days per year with local HS value larger than 1°C. Results, computed for ENSO+, ENSO−, and neutral years and then spatially normalized, are shown in Table 1. For instance, the value of 1.0 ± 0.3 found in GHRSST for ENSO neutral conditions indicates that on average each pixel within the domain experiences thermal stress for 1.0 ± 0.3 days per year. During El Niño years, this value increases to 5.1 ± 1.6 days/year, while during La Niña years it decreases to 0.25 ± 0.06 days/year. No significant differences are found between the whole domain and the small box, despite the warm tail of ENSO+ distribution being lower over the atolls (Figure 2A).
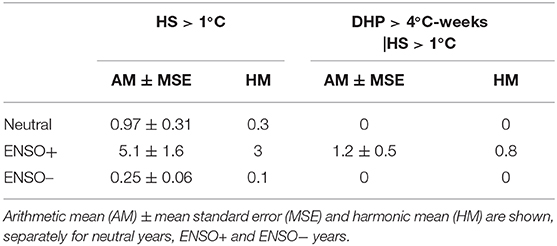
Table 1. Number of days per year with HS > 1°C (left column) and with simultaneous DHP > 4°C-weeks and HS > 1°C (right column) from GHRSST data set.
Considering that an isolated occurrence of a daily HS > 1°C is typically well borne by corals, while it can lead to bleaching if significant thermal stress occurred over the preceding weeks, we focus on the simultaneous occurrence of large values of DHP and HS > 1°C. The PDFs of DHP conditioned on HS > 1°C are shown in Figure 2B. Both bleaching threshold (DHP = 4°C-week) and mortality threshold (DHP = 8°C-week) have been reached in at least 1 El Nino year during the analyzed period of 1982–2018, while these values never occurred during non-El Niño years (see also Table 1).
Mortality conditions, corresponding to the extreme DHP values from 8 to 10 in Figure 2B, are less frequent over the small box comprising only the Archipelago. During ENSO+ years, the chances of reaching mortality conditions drops by 84% in the small box compared to that in the whole domain.
The analysis of the patterns of SSTa during two strong recent El Niño events (see Supplementary Figure 7) indicates that the warming temperature trend (see Supplementary Figure 8) may be already impacting the Maldives coral reefs. At face value, the 2016 anomalies were as strong as in 1998, and indeed the two bleaching events were of comparable severity (Eakin et al., 2019; Pisapia et al., 2019). However, if the anomalies are computed after removing the multidecadal linear SST trend of 0.012°C/year, which is the lower bound estimate from the 1982–2018 period, then they are significantly larger in 1998 around the Maldivian archipelago (see Supplementary Figures 7C,D). This suggests that the mortality of spring 2016 was exacerbated by the basin-wide, global ocean warming. Based on this analysis, it might be expected that coral bleaching, historically present only following strong ENSO+ events, could occur more regularly. This statement does not account for coral adaptation and assumes that the threshold temperature conducive to thermal stress remains fixed.
3.2. Physical Control of Spatial Temperature Patterns
As mentioned earlier, the MMM temperature in Figure 1A has a latitudinal dependence with lower values south of the equator, and larger values at the northern atolls. On top of this latitudinal structure, there is a clear minimum near the Maldives, where the temperature is lower than in the surrounding areas by about 0.2°C during the warmest months. This pattern is reflected also in the regressions with the ONI index and in the PDFs (Figures 1B, 2). The reduced temperatures over the Maldives are visible in all the analyzed years. Figure 3A, for example, shows the April–May mean SST anomaly with respect to its zonal (longitudinal) mean in 2013, a neutral year with respect to ENSO. The atmospheric heat fluxes do not display any cooling over the Maldives (not shown), and this suggests that the cooling has an oceanic origin.
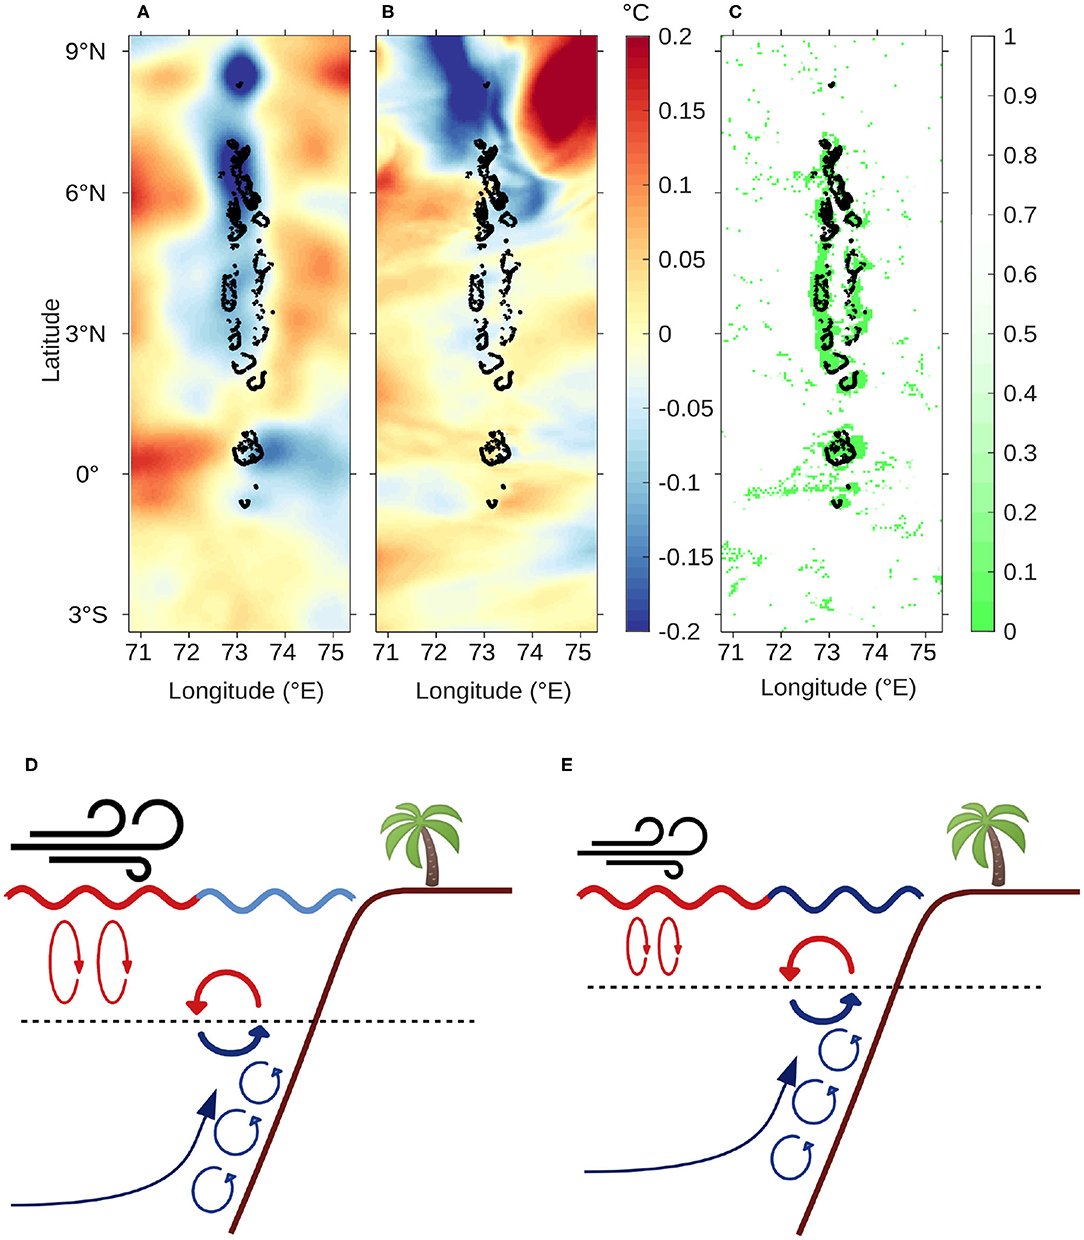
Figure 3. Sea surface temperature (SST) anomalies with respect to the zonally averaged monthly mean temperature in April and May 2013, from (A) Group for High Resolution Sea Surface Temperature (GHRSST) and (B) Coastal and Regional Ocean COmmunity (CROCO) simulation. (C) Annual mean of the minimum of the Richardson number between 20 and 50 m, an indicator of mixing at the base of the mixed layer, from CROCO simulation. Lower panels present a schematic representation of the effects of mixing in the upper ocean for two mixed layer depths: (D) When the mixed layer is deeper, the cooling from below is distributed over a greater volume of water, and the resulting decrease in temperature has a lower magnitude than in case (E), when the mixed layer is shallower and the volume of water involved in the process is smaller, resulting in a stronger surface temperature reduction.
To better understand the dynamical processes involved, we simulated the ocean circulation in and around the Archipelago, focusing on year 2013, using CROCO. Results are shown in Figures 3B,C.
Mixing enhancement around the islands is present year-round, with varying intensity and geographic distribution depending on the strength and direction of the currents. Averaged over the whole archipelago, the thermal signal of upper-ocean mixing is greatest in March–May as seen in the SSTs (see Supplementary Figure 9). In these months, the mixed-later depth is shallowest (see Supplementary Figure 10), and the impact of mixing from below is easily detected at the surface.
4. Discussion
Before the 1980s, bleaching events were registered in the Maldives only on local scales (Hughes et al., 2018). Since then, however, the anthropic pressure on coral reefs has been increasing (Hughes et al., 2003; Anthony et al., 2008; Brierley and Kingsford, 2009; Brown and Cossins, 2011; Dove et al., 2013). In particular, the SST warming following the two strongest El Niño episodes of the past 3 decades caused widespread bleaching in April and May of 1998 and 2016.
After the 1998 bleaching episode, coral recovery was faster than in other regions of the Pacific ocean, and in 2016 several hope spots were found, in which bleaching affected 25% or less of the colonies. Both observations point to the existence of patchy impacts that cannot be easily explained in terms of biological drivers alone. Most of the atolls are indeed in pristine conditions relative to many others at similar latitudes (Ibrahim et al., 2017) and are not subject to an overwhelming pressure from stressors common to tropical coral assemblages, such as overfishing, coastal development, or pollution. Exceptions to this statement were observed in the years prior to 2016 limited to the Central Maldives, where some reefs were found moderately affected by outbreaks of crown-of-thorns starfish and sediment inputs (Pisapia et al., 2016).
El-Niño-related increase in temperature is the most important global factor that leads to mass bleachings. How much a single reef is impacted by this world-wide event strictly depends on regional biological and physical processes. Environmental and background climate conditions influence the temperature at which a bleaching event can occur (Carilli et al., 2012). The diverse response of corals to a strong El-Niño event remains an active research area. Both local radiative budgets, temperature differences and each species resilience and recovery abilities, as well as the frequency of heat waves in the considered area, should be considered. For example, it has been seen that corals have an increased ability to resist and recover after a severe thermal stress event in ocean regions characterized by high-frequency variability and large temperature swings (Thompson and van Woesik, 2009; Carilli et al., 2012). On the other hand, reefs subjected to anthropogenic stressors, such as overfishing and pollution tend to have reduced recovery abilities (Wooldridge, 2009; Richmond et al., 2018).
In this work, we explored the possibility that physical drivers may partially justify the observed patchiness. We found that indeed the warm SST patterns recorded in 1998 and 2016 did not have the same structure, and that the one recorded in 2016 may explain why some atolls were spared in part. Through this analysis, we also noticed that the ocean immediately surrounding the islands is characterized by temperatures on average lower than its open counterpart by about 0.2°C in the spring season, when bleaching occurs. These cool anomalies—with reference to the latitudinal mean—persist also during El Niño, potentially limiting its catastrophic impact on the reefs: they likely contribute to the existence of hope spots and reduce the maximum values of temperatures at which the corals are exposed during bleaching events.
Using a regional ocean model, CROCO, we found that these patches emerge due to the mixing associated with the strong shear around the bathymetry of the islands. The currents near the ocean surface have to slow down when intersecting the steep sea floor. The shear that is consequently generated enhances the vertical mixing, bringing colder water from below into the mixed layer. If the mixed layer is sufficiently shallow, the colder water can imprint the ocean surface and lead to local cooling. If the mixed layer is deeper than about 30 m, and the winds are strong enough to sustain it, then the signal is not detectable near the surface, and the impact of the mixing from below on the SST is negligible. The first situation is representative of the period from February to May, and the second of the rest of the year (see Figures 3D,E for a schematic representation). The stronger the zonal (latitudinal) component of the near surface currents, the stronger is the shear and therefore the vertical mixing.
The model resolution implemented, 5 km in the horizontal, is not sufficient to delve into the strength and local distribution of this mechanism across and within the atolls. In a future work, we will investigate the pattern and impact of this cooling signal in detail by improving CROCO resolving power.
So far the coral reefs of the Maldives have been spared by complete bleaching despite the strong, positive temperature trend in the Indian Ocean. Their recovery has also been quicker relative to that of other places. The pristine conditions of most of the islands and their proximity have likely contributed. Here, we have shown that the specific current-mixed layer depth conditions and their interactions with the bathymetry could have also played a role.
Data Availability Statement
The original contributions generated for the study are included in the article/Supplementary Material, further inquiries can be directed to the corresponding author/s.
Author Contributions
CD performed the simulations and conducted analyses. CD, AB, and CP drafted the manuscript and contributed to discussions, interpretations, and writing. All authors designed the study, read, and approved the submitted version.
Conflict of Interest
The authors declare that the research was conducted in the absence of any commercial or financial relationships that could be construed as a potential conflict of interest.
Acknowledgments
This work was an outcome of Project MIUR – Dipartimenti di Eccellenza 2018–2022. This study has been conducted using the Group for High Resolution Sea Surface Temperature (GHRSST) and Simple Ocean Data Assimilation version 3 (SODA3) data sets. AB was partially supported by the National Science Foundation [OCE-1658174]. The authors wish to thank F. Marchese for the kind help in preparing the Maldives map and the reviewers for their careful and constructive comments.
Supplementary Material
The Supplementary Material for this article can be found online at: https://www.frontiersin.org/articles/10.3389/fmars.2020.539869/full#supplementary-material
Footnotes
1. ^We verified that the influence of the Indian Ocean Zonal Mode or Dipole, the other major mode of climate variability in this region (Edwards et al., 2001; Saji, 2018), on the SST is negligible in April–May: it interests only the coolest season of the year, from September to November, and is therefore unrelated to bleaching events.
References
Anthony, K., Kline, D., Diaz-Pulido, G., Dove, S., and Hoegh-Guldberg, O. (2008). Ocean acidification causes bleaching and productivity loss in coral reef builders. Proc. Natl. Acad. Sci. U.S.A. 105, 17442–17446. doi: 10.1073/pnas.0804478105
Auclair, F., Benshila, R., Debreu, L., Ducousso, N., Dumas, F., Marchesiello, P., and Lemarié, F. (2018). “Some recent developments around the croco initiative for complex regional to coastal modeling,” in COMOD 2018–Workshop on Coastal Ocean Modelling (Hambourg).
Brierley, A., and Kingsford, M. (2009). Impacts of climate change on marine organisms and ecosystems. Curr. Biol. 19, R602–R614. doi: 10.1016/j.cub.2009.05.046
Brown, B. E., and Cossins, A. R. (2011). The Potential for Temperature Acclimatisation of Reef Corals in the Face of Climate Change. Dordrecht: Springer Netherlands.
Carilli, J., Donner, S., and Hartmann, A. (2012). Historical temperature variability affects coral response to heat stress. PLoS ONE 7:e34418. doi: 10.1371/journal.pone.0034418
Carton, J., Chepurin, G., and Chen, L. (2018). Soda3: a new ocean climate reanalysis. J. Clim. 31, 6967–6983. doi: 10.1175/JCLI-D-18-0149.1
Chatterjee, A., Shankar, D., Shenoi, S., Reddy, G., Michael, G. S., Ravichandran, M., et al. (2012). A new atlas of temperature and salinity for the north Indian Ocean. J. Earth Syst. Sci. 121, 559–593. doi: 10.1007/s12040-012-0191-9
Chaudhury, N., Arora, M., and Gujrati, A. (2019). “Mass coral bleaching responses from Indian coral reef regions,” in Climate Change and the Vulnerable Indian Coast (New Delhi: Ministry of Environment, Forest and Climate Change).
Copernicus Climate Change Service C3S (2017). ERA5: Fifth Generation of ECMWF Atmospheric Reanalyses of the Global Climate. Copernicus Climate Change Service Climate Data Store (CDS).
Dey, S., Nishant, N., Sengupta, K., and Ghosh, S. (2015). Cloud climatology over the oceanic regions adjacent to the Indian subcontinent: inter-comparison between passive and active sensors. Int. J. Rem. Sens. 36, 899–916. doi: 10.1080/01431161.2014.1001082
Dove, S., Kline, D., Pantos, O., Angly, F., Tyson, G., and Hoegh-Guldberg, O. (2013). Future reef decalcification under business-as-usual CO2 emission scenario. Proc. Natl. Acad. Sci. U.S.A. 110, 15342–15347. doi: 10.1073/pnas.1302701110
Eakin, C. M., Sweatman, H. P. A., and Brainard, R. E. (2019). The 2014–2017 global-scale coral bleaching event: insights and impacts. Coral Reefs 38, 539–545. doi: 10.1007/s00338-019-01844-2
Edwards, A., Clark, S., Zahir, H., Rajasuriya, A., Naseer, A., and Rubens, J. (2001). Coral bleaching and mortality on artificial and natural reefs in Maldives in 1998, sea surface temperature anomalies and initial recovery. Mar. Pollut. Bull. 42, 7–15. doi: 10.1016/S0025-326X(00)00200-9
Glynn, P. W., and D'Croz, L. (1990). Experimental evidence for high temperature stress as the cause of El Niño-coincident coral mortality. Coral Reefs 8, 181–191. doi: 10.1007/BF00265009
Guest, J., Baird, A., Maynard, J., Muttaqin, E., Edwards, A., Campbell, S., et al. (2012). Contrasting patterns of coral bleaching susceptibility in 2010 suggest an adaptive response to thermal stress. PLoS ONE 7:e33353. doi: 10.1371/journal.pone.0033353
Hughes, T., Anderson, K., Connolly, S., Heron, S., Kerry, J., Lough, J., et al. (2018). Spatial and temporal patterns of mass bleaching of corals in the anthropocene. Science 359, 80–83. doi: 10.1126/science.aan8048
Hughes, T., Baird, A., Bellwood, D., Card, M., Connolly, S., Folke, C., et al. (2003). Climate change, human impacts, and the resilience of coral reefs. Science 301, 929–933. doi: 10.1126/science.1085046
Hughes, T., Kerry, J., Alvarez-Noriega, M., Álvarez Romero, J., Anderson, K., Baird, A., et al. (2017). Global warming and recurrent mass bleaching of corals. Nature 543, 373–377. doi: 10.1038/nature21707
Ibrahim, N., Mohamed, M., Basheer, A., Haleem, I., Nistharan, F., Schmidt, A., et al. (2017). Status of Coral Bleaching in the Maldives 2016. Male: Marine Research Center.
Kayanne, H. (2017). Validation of degree heating weeks as a coral bleaching index in the northwestern Pacific. Coral Reefs 36, 63–70. doi: 10.1007/s00338-016-1524-y
Liu, G., Heron, S., Eakin, C. M., Muller-Karger, F., Vega-Rodriguez, M., Guild, L., et al. (2014). Reef-scale thermal stress monitoring of coral ecosystems: new 5-km global products from NOAA coral reef watch. Rem. Sens. (Okinawa) 6, 11579–11606. doi: 10.3390/rs61111579
Liu, G., Strong, A., Skirving, W., and Arzayus, F. (2005). “Overview of NOAA coral reef watch program's near-real time satellite global coral bleaching monitoring activities,” in Proceedings of 10th International Coral Reef Symposium (Okinawa), 1783–1793.
Lough, J., Anderson, K., and Hughes, T. (2018). Increasing thermal stress for tropical coral reefs: 1871–2017. Sci. Rep. 8:6079. doi: 10.1038/s41598-018-24530-9
Maynard, J., Anthony, K., Marshall, P., and Masiri, I. (2008). Major bleaching events can lead to increased thermal tolerance in corals. Mar. Biol. 155, 173–182. doi: 10.1007/s00227-008-1015-y
McClanahan, T., Darling, E., Maina, J., Muthiga, N., D'agata, S., Jupiter, S., et al. (2019). Temperature patterns and mechanisms influencing coral bleaching during the 2016 El Niño. Nat. Clim. Change 9, 845–851. doi: 10.1038/s41558-019-0576-8
McClanahan, T., Maina, J., and Muthiga, N. (2011). Associations between climate stress and coral reef diversity in the western Indian Ocean. Glob. Change Biol. 17, 2023–2032. doi: 10.1111/j.1365-2486.2011.02395.x
Morri, C., Montefalcone, M., Lasagna, R., Gatti, G., Rovere, A., Parravicini, V., et al. (2015). Through bleaching and tsunami: coral reef recovery in the Maldives. Mar. Pollut. Bull. 98, 188–200. doi: 10.1016/j.marpolbul.2015.06.050
Naseer, A., and Hatcher, B. (2004). Assessing the integrated growth response of coral reefs to monsoon forcing using morphometric analysis of reefs in the Maldives. Coral Reefs. 23, 161–168. doi: 10.1007/s00338-003-0366-6
National Centers for Environmental Information (2016). GHRSST Level 4 AVHRR_OI Global Blended Sea Surface Temperature Analysis (GDS Version 2) From NCEI. Ver. 2.0. PO.DAAC (California City).
Penin, L., Vidal-Dupiol, J., and Adjeroud, M. (2013). Response of coral assemblages to thermal stress: are bleaching intensity and spatial patterns consistent between events? Environ. Monit. Assess. 185, 5031–5042. doi: 10.1007/s10661-012-2923-3
Pisapia, C., Burn, D., and Pratchett, M. (2019). Changes in the population and community structure of corals during recent disturbances (February 2016–October 2017) on Maldivian coral reefs. Sci. Rep. 9:8402. doi: 10.1038/s41598-019-44809-9
Pisapia, C., Burn, D., Yoosuf, R., Najeeb, A., Anderson, K., and Pratchett, M. (2016). Coral recovery in the central Maldives archipelago since the last major mass-bleaching, in 1998. Sci. Rep. 6:34720. doi: 10.1038/srep34720
Reynolds, R., Smiths, T., Liu, C., Chelton, D. B., Casey, K., and Schlax, M. (2007). Daily high-resolution-blended analyses for sea surface temperature. J. Clim. 20, 5473–5496. doi: 10.1175/2007JCLI1824.1
Richmond, R. H., Tisthammer, K. H., and Spies, N. P. (2018). The effects of anthropogenic stressors on reproduction and recruitment of corals and reef organisms. Front. Mar. Sci. 5:226. doi: 10.3389/fmars.2018.00226
Risk, M., and Sluka, R. (2000). “The Maldives: a nation of atolls,” in Coral Reefs of the Indian Ocean: Their Ecology and Conservation, eds T. R. McClanahan, C. R.C. Sheppard, D. O. Obura (California, CA: Oxford University Press), 325–351.
Roy, S., Saha, S., Bhowmik, S., and Kundu, P. (2014). Analysis of monthly cloud climatology of the Indian subcontinent as observed by TRMM precipitation radar. Int. J. Climatol. 35, 2080–2091. doi: 10.1002/joc.4108
Schott, F., and McCreary, J. (2001). The monsoon circulation of the Indian Ocean. Prog. Oceanogr. 51, 1–123. doi: 10.1016/S0079-6611(01)00083-0
Schuhmacher, H., Loch, K., Loch, W., and See, W. (2005). The aftermath of coral bleaching on a Maldivian reef–a quantitative study. Facies 51, 80–92. doi: 10.1007/s10347-005-0020-6
Thompson, D. M., and van Woesik, R. (2009). Corals escape bleaching in regions that recently and historically experienced frequent thermal stress. Proc. R. Soc. B 276, 2893–2901. doi: 10.1098/rspb.2009.0591
UK Met Office (2005). GHRSST Level 4 OSTIA Global Foundation Sea Surface Temperature Analysis. Ver. 1.0. PO.DAAC (CA).
Wilkinson, C. (2008). Status of Coral Reefs of the World: 2008. Townsville, QLD: Global Coral Reef Monitoring Network and Australian Institute of Marine Science.
Wooldridge, S. (2009). Water quality and coral bleaching thresholds: formalising the linkage for the inshore reefs of the great barrier reef, Australia. Mar. Pollut. Bull. 58, 745–751. doi: 10.1016/j.marpolbul.2008.12.013
Keywords: coral bleaching, climate change, Maldives, ocean currents, ENSO teleconnections
Citation: De Falco C, Bracco A and Pasquero C (2020) Climatic and Oceanographic Controls on Coral Bleaching Conditions in the Maldivian Region. Front. Mar. Sci. 7:539869. doi: 10.3389/fmars.2020.539869
Received: 24 March 2020; Accepted: 28 August 2020;
Published: 20 November 2020.
Edited by:
Maren Ziegler, University of Giessen, GermanyReviewed by:
Aldo Cróquer, Simón Bolívar University, VenezuelaRobert A. B. Mason, The University of Queensland, Australia
Copyright © 2020 De Falco, Bracco and Pasquero. This is an open-access article distributed under the terms of the Creative Commons Attribution License (CC BY). The use, distribution or reproduction in other forums is permitted, provided the original author(s) and the copyright owner(s) are credited and that the original publication in this journal is cited, in accordance with accepted academic practice. No use, distribution or reproduction is permitted which does not comply with these terms.
*Correspondence: Chiara De Falco, Yy5kZWZhbGNvMUBjYW1wdXMudW5pbWliLml0