 Tim van Emmerik1*
 Justin van Klaveren2
 Lourens J. J. Meijer2
 Joost W. Krooshof1,2
 Dixie Ann A. Palmos3
 Maria Antonia Tanchuling4
- 1Hydrology and Quantitative Water Management Group, Wageningen University, Wageningen, Netherlands
- 2The Ocean Cleanup, Rotterdam, Netherlands
- 3Science of Identity Foundation, Manila, Philippines
- 4Institute of Civil Engineering, University of the Philippines Diliman, Quezon City, Philippines
The Philippines is suggested to be one of the world's main contributors to global marine plastic pollution. Several rivers in the Manila metropolitan area are assumed to be main pathways of land-based plastic waste into the ocean. However, these model estimates remain uncertain due to a lack of field data. The main goal of this study was therefore to collect field data on floating macroplastic flux and polymer category in three of Manila's main rivers: the Meycauayan, Tullahan and Pasig. We measured plastic flux, item polymer category, and flow velocity at two locations per river during an 11-day period. Each river was measured close to the river mouth, and several kilometer upstream. The results showed no significant difference between the plastic flux in upstream and downstream flow direction at the three river mouths. The Meycauayan and Pasig rivers did have significantly higher plastic flux at the river mouth compared to the upstream location. The observations suggest accumulation of macroplastics in the river mouths during periods of low freshwater discharge. In this case, instantaneous plastic flux is mainly determined by the tidal dynamics. It is hypothesized that plastics are temporarily retained in estuaries, and may be flushed out during neap tide or increased river discharge. Due to the retention capacity of the estuaries, net plastic export into the ocean could not be estimated. Future research is needed to further investigate the role of tidal dynamics on the transport and net export of riverine macroplastics.
1. Introduction
Plastic pollution of aquatic ecosystems is an emerging environmental hazard. In freshwater systems, negative effects of macroplastics (>0.5 cm) include endangerment of species, economic losses through damage to vessels, and increased urban flood risk because of clogging of hydraulic structures (Hong et al., 2017; Honingh et al., 2020; van Emmerik and Schwarz, 2020). Rivers are assumed to be one of the main pathways for land-based plastics into the world's oceans (Schmidt et al., 2017), where plastic waste further threatens biodiversity and breaks down into microplastics (Lasut et al., 2018; Abreo et al., 2019).
The Philippines is considered to be one the largest contributors to marine plastic pollution (Jambeck et al., 2015; Lebreton et al., 2017; Lebreton and Andrady, 2019). Model estimates suggest that the Philippines is the third largest producer of mismanaged plastic waste (4.52 Mt y−1), after China and India (Lebreton and Andrady, 2019). In combination with extensive coastal zone and short distance between population and river systems, the Philippines is assumed to have the highest national plastic emissions from rivers into the ocean (Meijer et al., 2019). Rivers traversing densely populated urban areas, such as the Philippines' capital Metropolitan Manila, are expected to export high amounts of plastic waste from land into the ocean (van Emmerik et al., 2019b; Schirinzi et al., 2020). The Pasig, Tullahan and Meycauayan rivers, three of the main rivers flowing through Metropolitan Manila, all feature in the model-based global top five of the most plastic emitting rivers (Meijer et al., 2019). However, field data of plastic abundance in these rivers are scarce, and model estimates may therefore be inaccurate.
Field-based plastic research in the Philippines to date mainly focused on marine litter (Abreo et al., 2019), and there are almost no studies done on plastic pollution in freshwater environments (Superio and Abreo, 2020). A recent effort measured microplastics in the Pasig river for the first time (Deocaris et al., 2019). Due to the lack of data on riverine macroplastics, or the potential relation between macroplastics and microplastics, these results can unfortunately not be used to estimate total riverine plastic transport. The Philippines heavily depends on marine and freshwater environments and data on abundance of plastic pollution in the environment is necessary to improve the understanding of this challenge (Abreo, 2018).
In recent years, the number of studies focused on quantifying macroplastic abundance in river networks has increased. Recently, van Calcar and van Emmerik (2019) demonstrated that the magnitude, temporal variation, and typical composition of riverine macroplastics varies greatly between rivers. Available long-term observations studies revealed that many rivers exhibit a strong seasonality in macroplastic transport (Castro-Jiménez et al., 2019; van Emmerik et al., 2019b; Schirinzi et al., 2020). Composition of plastics is important to identify potential waste sources (consumers or industry), and transport mechanisms from land into river systems (natural or anthropogenic). Characterization of riverine macroplastics can be in turn used to optimize prevention, mitigation and reduction strategies.
Estimating plastic export from rivers into the ocean is complicated by bidirectional flow dynamics in estuaries. Most monitoring efforts to date focused on measuring plastic flux upstream of the tidal influence, but this is not informative of the actual plastic flux dynamics or export at the river mouth. Observations suggest that plastics are retained in estuaries, especially when freshwater discharge is low. The plastic flux during ebb tide (toward the ocean) and flood tide (in upstream direction) was found of similar magnitude in the Saigon river (van Emmerik et al., 2019b). In the Seine, recent work demonstrated that the riverbanks along the estuary are hot spots for deposited (macro)plastic litter (Tramoy et al., 2020). Acha et al. (2003) investigated plastic debris concentrations in the Rio de la Plata estuary. They found that the upstream (river side) concentrations were significantly higher than the downstream concentrations (ocean side), suggesting strong retention of plastics at the estuarine front of the river. The studies on the Seine and Rio de la Plata demonstrate the long-term retention of macroplastics in estuaries. We hypothesize that there is also shorter-term retention of macroplastics in estuaries, especially during periods of low freshwater discharge. In such case, the bidirectional flow is mainly governed by the tidal dynamics.
This study presents the results of a 2-week field assessment during the 2019 dry season of macroplastic flux and composition in Manila's three main rivers: the Pasig, Meycauayan and Tullahan. Each river was measured at a location closest to the river mouth, and at a location several kilometers upstream. We specifically discuss the role of tidal dynamics on the accumulation and transport of macroplastics from these rivers into the ocean. The observational data presented in this paper give additional insights in the plastic flux dynamics close to the river mouth. With this paper, we aim to explore the role of estuaries as (temporary) sinks of riverine macroplastic pollution and its potential effect on net export of plastic into the ocean.
2. Methods
2.1. Study Site
The Metropolitan Manila, or National Capital Region, is the capital of the Philippines, and has over 12 million inhabitants (Ajibade, 2019). Manila is surrounded by the Manila Bay in the West and the Laguna de Bay, a freshwater lake, in the Southeast (see Figure 1). The Meycauayan, Tullahan and Pasig rivers are three of the main rivers flowing through Metro Manila (Kumar et al., 2018). For each river two measurement locations were selected, one closest to the river mouth and one more upstream (see Figure 1). The location, distance to river mouth and river width of each measurement location can be found in Table 1. The dry season lasts from January to April. Low flow conditions in the measured rivers occur between March and May, and high flow conditions between October and November (Gorme et al., 2010; Deocaris et al., 2019). Observations were done every day between 19 and 29 March, 2019 from 09:00 to 17:00. During the measurement period no precipitation was observed.
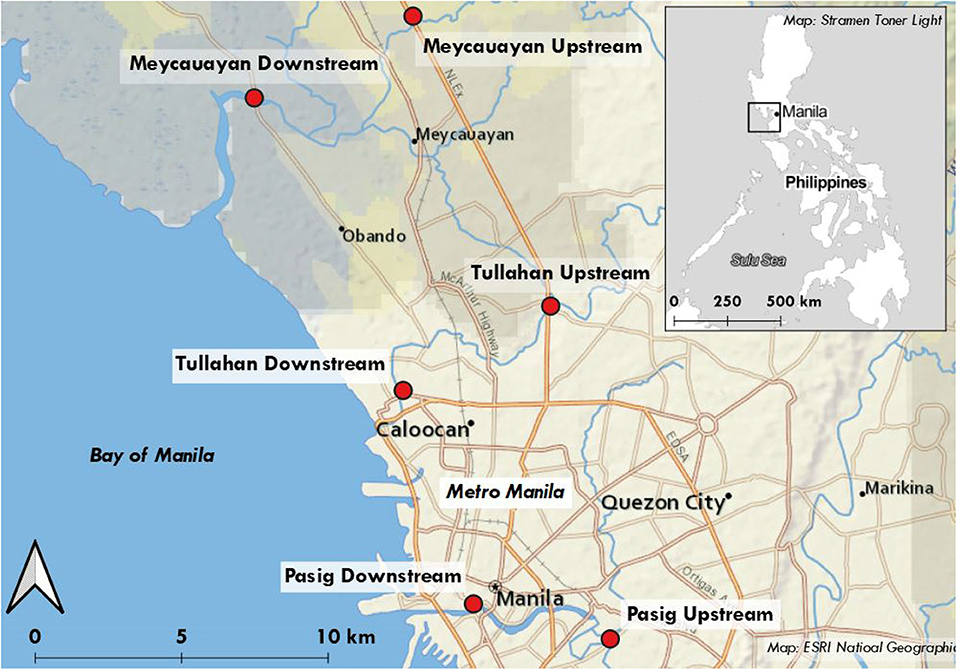
Figure 1. Overview of the upstream and downstream measurement locations along the Meycauayan, Tullahan, and Pasig rivers. The urbanized Metro Manila area is shown in gray, and rural areas in green. Map source: Stamen.
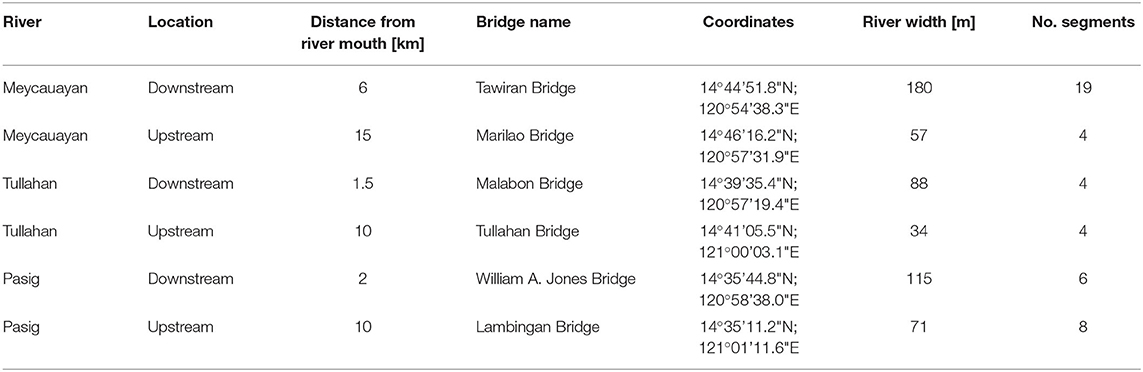
Table 1. Overview of the measurement locations.
2.2. Plastic Observations
Plastic measurements were done using the visual counting method, introduced by González-Fernández and Hanke (2017) and adapted by van Emmerik et al. (2018). For this method, observations were done from bridges. Each bridge was divided in segments of 10–30 m, depending on the plastic flux and height above the water. Observers counted all floating plastic items within a section of the river width for 2 to 20 min facing downstream direction. The exact observation time depended on the number of segments and plastic flux. This was repeated for all sections until the complete river width is covered (called a “sweep”). Each sweep was done within 1 h at most, and was assumed that the measurements at each segment are representative for that hour. The total instantaneous plastic flux P [items hour−1] for the entire river cross-section is then calculated using:
With the plastic flux p [items min−1] for each segment i, the total counted plastic items C [items] in section i, and the measurement duration T [min] at section i. The total plastic flux over the entire river width P is expressed in items hour−1, the most commonly used unit (e.g., Castro-Jiménez et al., 2019; van Calcar and van Emmerik, 2019; Schirinzi et al., 2020). Plastic flux in downstream direction is noted as positive, and plastic flux in upstream direction is noted as negative. For the visual counting method, each floating and superficially submerged plastic item that was visible is counted, independent of its size. The height above the water depended on the location and on the water level. No exact measurements were done, but the height was estimated to be between 3 and 5 m for all locations. The maximum depth at which items were visible was 10 cm, and the minimum observed item size was 1 cm. Note that the observations there did not cover the complete macroplastic size spectrum (>0.5 cm). Wind speed and direction can in some cases influence the cross-sectional distribution or even flow direction of individual items (Vriend et al., 2020). During this study, wind speed and direction were not measured, and was not noticed to play a role on the plastic flux. The bridges were selected based on safety, travel time for the observers, and distance to the river mouth. The bridges all had pedestrian traffic zones separated from motorized traffic, to ensure safety during the observations. The number of segments ranged between 4 and 19 segments (see Table 1 for a complete overview). Each bridge was measured by a team consisting of two to three observers. An additional benefit of the visual counting method is that generally no permits are required for the observations.
To determine the composition of the floating plastic, the visual counting method was expanded to count items per plastic polymer category. A seven-category protocol was used, that distinguishes between different polymer categories based on typical items (van Emmerik et al., 2020). See Supplementary Table 2 for an overview of the seven categories and examples of specific items that typically belong to these categories. We used seven categories: polyethylene terephthalate (PET; soft drink bottles), polystyrene (PS; cutlery, straws), expanded polystyrene (EPS; foam), hard polyolefin (POhard; caps, rigid items, cosmetic bottles), soft polyolefin (POsoft; bags, foils), Multilayer (food packaging, printed foils) and Other (other or non-identifiable plastics). Note that polyolefins include polyethylene (PE) and polypropylene (PP). Plastic polymer categories were identified by a team of two persons. One person observed the items and reported the category of each item, which was written down on a tally sheet by the second person. These measurements require at least two people and additional focus. Therefore, these categorization measurements were done less frequently. Depending on the location and available time, these measurements were done once to several times per day. For further analysis, we only investigate the relative contribution of each polymer category of total number of classified items for each river, and not its temporal variation.
2.3. Additional Data
Flow velocity was measured hourly at each location using the “Pooh-Sticks” method (Bull and Lawler, 1991). For this method, a floating item (e.g., plastic or orange peels) was tracked and timed over a predefined transect. If a single observer measured flow velocity, a floating item was tracked over the first 10 m downstream of the bridge. This transect was measured and marked at the beginning of the measurement period. If two observers measured flow velocity, an easily identifiable item was release by one observed on one side of the bridge. The second observer timed how long it took for the item to appear on the other side of the bridge. The bridge width was measured with measurement tape at the beginning of the observation period. The flow velocity [m s−1] is calculated by dividing the transect length by the travel time of the tracked item. Flow velocity measurements were done hourly in the middle segment of the river. Flow in downstream direction is noted as positive, flow in upstream direction is noted as negative. Astronomical tide data in height above Mean Sea Level (MSL) [m] was retrieved for the Manila Bay from World Tides (https://www.worldtides.info/).
2.4. Statistical Analysis
To explore the correlation between the plastic flux and flow velocity, the Pearson and Spearman correlations were calculated for each monitoring location. We calculated both to investigate whether any correlation is just monotonic (Spearman), or also linear (Pearson). The correlations were calculated using the complete time series, the positive flux only, and the negative flux only. We also performed Wilcoxon–Mann–Whitney tests to investigate the significance of the difference between the (1) plastic flux during ebb tide (downstream flow direction) and flood tide (upstream flow direction), and (2) plastic flux and flow velocity for each river at the upstream and downstream location.
3. Results
The observed plastic flux in the three measured rivers (Meycauayan, Tullahan, Pasig) showed a clear diurnal variation (see Figure 2). The range of instantaneous plastic flux is the highest for the downstream location of the Meycauayan (Figure 2A), varying between 1·105 and −1·105 items per hour. At all other downstream locations, the plastic flux varied between 1·104 and −1·104 items per hour, one order of magnitude lower. Bidirectional flow was measured at all locations. The observed flow velocity range is the largest at Pasig Downstream (−0.57 to 0.64 m/s) and Meycauayan Downstream (−0.56 to 0.45 m/s), both near the river mouth, and the lowest at Tullahan Upstream (0.11 to 0.32 m/s). The flow velocity at the upstream and downstream measurement location was significantly different for the Meycauayan (p = 1.2·10−9) and Tullahan (p = 3.9·10−6), but not for the Pasig (p = 0.05).
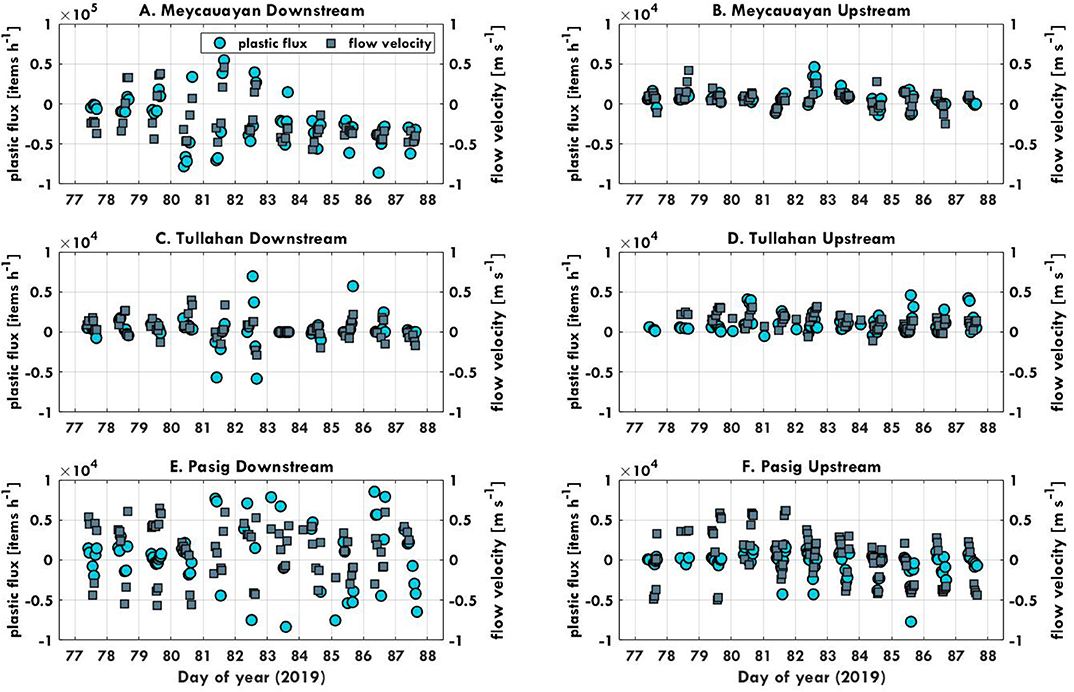
Figure 2. Hourly observations of instantaneous plastic flux [items h−1] and flow velocity for the Meycauayan (A Upstream, B Downstream), Tullahan (C Upstream, D Downstream) and Pasig (E Upstream, F Downstream) rivers, from 19 to 29 March, 2019. Note that scale for Meycauayan Downstream (A) deviates from the other locations.
The median plastic flux for the ebb and flood tide constituents at each location shows a variation between rivers and within each river (see Figure 3). The largest median plastic flux was observed at Meycauayan Downstream (3·104 items per hour), followed by Pasig Downstream (7·103 items per hour). For both the Meycauayan and Pasig rivers, the flux at the downstream location is one order of magnitude larger than at the upstream location. The differences are significant in both rivers (p = 7.5·10−9 and p = 3.5·10−2, respectively). At the Tullahan, the plastic flux at the upstream and downstream locations are around the same order of magnitude, though the upstream flux is significantly larger (p = 9.7·10−6).
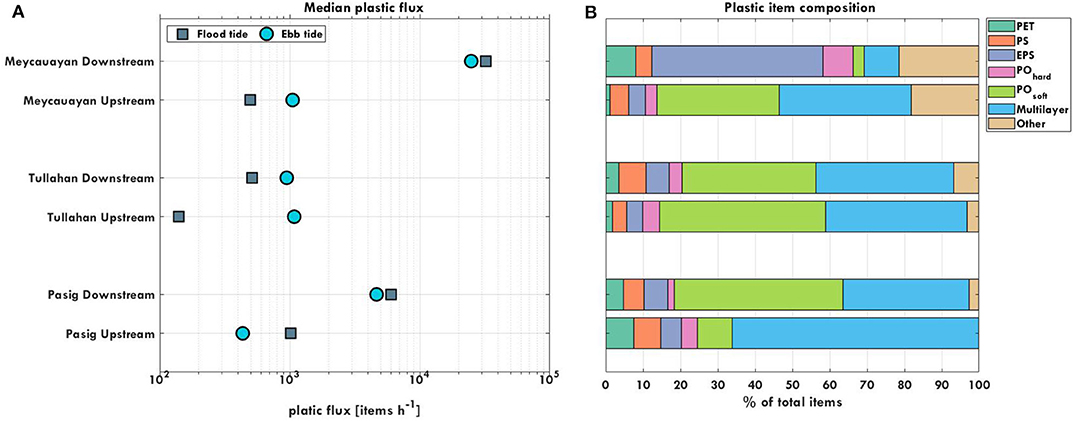
Figure 3. (A) Median plastic flux for flood and ebb tide constituents at all six measurement locations [items h−1]. Only the differences between ebb and flood tide at Tullahan Upstream and Pasig Upstream were found significant. (B) Item polymer categories at all six measurement locations. The categories refer to (including some examples of typical items): polyethylene terephthalate (PET; soft drink bottles), polystyrene (PS; cutlery, straws), expanded polystyrene (EPS; foam), hard polyolefin (POhard; caps, rigid items, cosmetic bottles), soft polyolefin (POsoft; bags, foils), Multilayer (food packaging, printed foils), and Other (other or non-identifiable plastics).
At three locations, the plastic flux is larger during flood tide than during ebb tide (Meycauayan Downstream, Pasig Downstream and Pasig Upstream). At only two locations a significant difference between flood and ebb tide plastic flux was found. At Tullahan Upstream and Pasig Upstream the difference was significant (p = 4.7·10−2 and p = 6.3·10−4, respectively). For the remaining locations, the differences are not significant. Note that the values presented in this paper are estimates of median plastic flux in upstream and downstream direction, and not actual plastic export into the ocean.
Total plastic flux and flow velocity show significant positive correlations (Spearman: 0.50–0.78, Pearson: 0.47–0.72) for all locations except the Tullahan Upstream location (Supplementary Table 2 and Supplementary Figure 3). When only looking at the positive (ebb tide) or negative (flood tide) flow directions, correlations are lower and less are significant. In positive direction, significant correlations were found at the Meycauayan and Pasig Upstream locations. In negative directions, significant correlations were found for all rivers at the downstream locations. At the Pasig, a negative significant relation was found at the downstream location, suggesting that the plastic flux decreases for increasing flow velocity.
The most abundant plastic polymer category varies between measurement locations (see Figure 3). At most locations (Meycauayan Upstream, Tullahan Downstream and Upstream, Pasig Downstream and Upstream), POsoft and Multilayer are the most abundant categories. Only at Meycauayan Downstream EPS was counted most. This is also the location with the largest share of item categories as Other. At Pasig Upstream, Multilayer was the most abundant plastic category. The remaining locations, the abundance of POsoft and Multilayer was similar.
4. Discussion
The observations in the three Manila river mouths suggest that most plastics are flowing back and forth during periods of low freshwater discharge. The lack of accurate data on tidal dynamics makes it difficult however to estimate the net export of plastics from the rivers into the ocean. Without mass statistics it is also not possible to estimate the plastic mass flux from the plastic item flux (van Emmerik et al., 2018). Using literature values also comes with uncertainty, as found mean mass per item vary over an order of magnitude (van Emmerik et al., 2019a,b). We therefore cannot directly compare our measurements of plastic flux to recent modeled riverine plastic export estimates (Meijer et al., 2019). We did find that the ranking of the three rivers based on median downstream plastic flux deviates from the ranking based on plastic export. The Pasig was estimated the most plastic exporting river (9.7·104 t y−1), followed by the Tullahan (2.2·104 t y−1) and Meycauayan (1.7·104 t y−1) rivers. In our study, the highest plastic flux was measured at the Meycauayan (3·104 items h−1), followed by the Pasig (7·103 items h−1) and Tullahan (1·103 items h−1). These differences may be explained by several factors, including limited observation length, hydrometeorological seasonality, ongoing river management interventions, focus on floating plastic, and tidal dynamics. In addition, our observations demonstrate that current global river plastic export models are overlooking the complex tidal dynamics, which seem to play a key role in actual net export of plastics into the ocean.
Tidal dynamics have previously been assumed to play a major role in the export of plastics from rivers into the ocean (Acha et al., 2003; Ivar do Sul et al., 2014; van Emmerik et al., 2019b; Lorenzi et al., 2020; Tramoy et al., 2020). The results presented in this study demonstrate that plastic flux is correlated to flow velocity, which is in turn strongly depending on the tide. In the Meycauayan and Pasig rivers, the median plastic flux increases around one order of magnitude from the upstream to downstream location, which may be explained by the tidal dynamics. During the dry season, the Manila rivers have a relatively low freshwater discharge (Deocaris et al., 2019). The flow dynamics are therefore mainly influenced by the tide, which is stronger closer to the river mouth. Recall from Figure 2 that the flow velocity at the downstream locations was bidirectional, with similar maximum flow velocity in both directions. At the upstream locations, the maximum positive flow is higher than the maximum negative flow, suggesting a net downstream directed transport. At the river mouths, plastic is flowing in both directions in equal rates, suggesting low net transport from the river into the ocean. Observations covering full tidal cycles are needed to estimate the actual net transport per day. Similar suggestions were made by Lorenzi et al. (2020), who found an accumulation of river plastics during the tide dominated season, and increased transport into the ocean after increased freshwater discharge. The tidal zone may function as a temporary sink for plastic pollution. Only in case of strong outgoing flow, lasting longer than a tidal cycle, plastic may be flushed out of the estuary. Based on early observations of plastics in estuaries, Ivar do Sul et al. (2014) hypothesized that tidal dynamics cause slow transport, and flood events cause large-scale movement. Acha et al. (2003) measured plastic debris concentrations on the estuary floor, and found significantly higher values on the river side than the ocean side. These observations support the assumption that estuaries can act as (temporary) macroplastic sinks. Similarly, Tramoy et al. (2020) recently proposed that it is likely that the residence time of macroplastics may surpass decades in the estuary of the river Seine, also as a result of tidal dynamics.
The plastic flux data presented in this paper do not represent net export of plastic into the ocean. For comparison with other rivers, we only consider the plastic flux in downstream direction (ebb tide). The plastic flux in downstream direction measured in the Manila rivers, specially at Meycauayan Downstream, is high compared to plastic flux in downstream direction measured in other rivers using the same method. The median observed downstream plastic flux of 3·104 items per hour in the Meycauayan river is similar to the Ciliwung river in Jakarta (2 km upstream from river mouth, Indonesia, 2·104 items per hour, van Emmerik et al., 2019a). The plastic flux in the Pasig river (7·103 items per hour items per hour) is similar in magnitude to the Klang (10 km upstream from river mouth, Malaysia, 3·103 items per hour items per hour) and Chao Phraya (30 km upstream from river mouth, Thailand, 6·103 items per hour items per hour) (van Calcar and van Emmerik, 2019). The Tullahan had the lowest median plastic flux (1·103 items per hour items per hour), which is similar to the peak plastic flux measured during increased river discharge in the Seine (France), 70 km upstream of the river mouth (van Emmerik et al., 2019c).
The observation length was of limited duration, and measurements were only done during the day. The current 11-day field assessment does not cover the seasonal cycle in riverine plastic flux, which has shown to vary over up to two order of magnitudes (Castro-Jiménez et al., 2019; van Emmerik et al., 2019b; Schirinzi et al., 2020). The instantaneous plastic flux in the Manila rivers may therefore even be orders of magnitude larger during the wet season or as a result of high river discharge. Monthly river discharge of the Pasig river varies with a factor of around 20 during the year (Deocaris et al., 2019). During peak flow, additional plastic can be mobilized, and plastic accumulated on riverbanks may be re-mobilized (Liro et al., 2020). As the Philippines also regularly experiences extreme weather conditions (Onda et al., 2020), such as cyclones, additional plastics can be expected to be introduced into the river network during such events. Combined with increased river discharge during those events, the plastic flux and actual plastic export into the ocean may be considerably higher.
The field assessment presented in this study mainly focused on the floating plastic. However, plastic is also abundant on riverbanks, suspended in the water column and in river sediment (van Emmerik and Schwarz, 2020). Based on lab experiments, Zaat (2020) suggested that near-neutrally buoyant foils (e.g., POsoft, Multilayer) can be distributed homogeneously over the water column, especially for higher flow velocities. The floating plastic at the Pasig and Tullahan river mouths were mainly identified as POsoft and Multilayer. At the Meycauayan river mouth, foamy EPS was the most identified plastic item category. In other rivers, EPS is often associated with food boxes and isolation material used in the fishing industry (van Emmerik et al., 2019b). The relatively large share of EPS at the Meycauayan Downstream location may be explained by either more local fishing activities, or influx from the Bay of Manila. EPS has a low density and will not be suspended in the water column. In the Pasig and Tullahan rivers, the actual abundance of plastics—including those distributed along the water column—may therefore be considerably higher.
The results from our paper suggest retention of plastics in river estuaries, emphasizing the crucial role that tidal dynamics play in the movement of plastics in coastal sections of river networks. Future observations covering full tidal cycles may allow for calculating actual net export of plastic into the ocean, and shed light on the role of tidal dynamics on plastic transport from river to sea.
5. Conclusions
The Meycauayan, Tullahan, and Pasig rivers all showed no significant difference between downstream and upstream flowing plastic flux. Only in the Meycauayan and Pasig, a significantly larger median flux was measured at the mouth compared to the upstream location. The results suggest that the tidal dynamics play an important role in the net export of riverine plastics into the ocean. During periods of low river discharge, estuarine zones function as temporary sinks of plastic pollution. Accumulated plastics are hypothesized to get flushed out during neap tide or increased freshwater discharge. Additional factors, such as seasonality of river discharge and extreme hydrometeorological events, are expected to lead to increased river plastic flux. Long-term data of plastic flux and tidal dynamics, in combination with hydrodynamic modeling of Manila's water system, may shed light on the total annual plastic transport and its spatiotemporal variation. This paper present the first macroplastic observations for the Meycauayan, Tullahan, and Pasig rivers and give insights into the potential sources, sinks and pathways of aquatic plastic pollution in Manila. Above all, the results emphasize the need for further investigation of the role of tidal dynamics on river plastic transport and export into the ocean.
Data Availability Statement
All datasets generated for this study are included in the article/Supplementary Material.
Author Contributions
JK, LM, and TE: conceptualization and methodology. JK, JWK, and TE: formal analysis. JK and LM: data collection. TE and JWK: visualization. TE: writing—original draft. All authors: writing—reviewing and editing.
Conflict of Interest
LM is employed by The Ocean Cleanup. TE, JK, and JWK have previously been employed by The Ocean Cleanup. DP is employed by Science of Identity Foundation.
The authors declare that this study received funding from The Ocean Cleanup. The funder was involved in the study design, collection, analysis, interpretation of data, the writing of this article and the decision to submit it for publication.
Acknowledgments
We would like to thank the donors of The Ocean Cleanup who helped fund this research. We thank the team of SIFCare Manila for their efforts to facilitate and participate in the field data collection. We thank Bart Vermeulen from Wageningen University for the valuable comments on an earlier version of the manuscript. We thank the reviewers for their constructive feedback that helped improving this manuscript considerably.
Supplementary Material
The Supplementary Material for this article can be found online at: https://www.frontiersin.org/articles/10.3389/fmars.2020.545812/full#supplementary-material
References
Abreo, N. A. S. (2018). Marine plastics in the Philippines: a call for research. Philipp. Sci. Lett. 11, 20–21.
Abreo, N. A. S., Thompson, K. F., Arabejo, G. F. P., and Superio, M. D. A. (2019). Social media as a novel source of data on the impact of marine litter on megafauna: the Philippines as a case study. Mar. Pollut. Bull. 140, 51–59. doi: 10.1016/j.marpolbul.2019.01.030
Acha, E. M., Mianzan, H. W., Iribarne, O., Gagliardini, D. A., Lasta, C., and Daleo, P. (2003). The role of the Rıo de la Plata bottom salinity front in accumulating debris. Marine Pollut. Bull. 46, 197–202. doi: 10.1016/s0025-326x(02)00356-9
Ajibade, I. (2019). Planned retreat in global south megacities: disentangling policy, practice, and environmental justice. Clim. Change 157, 299–317. doi: 10.1007/s10584-019-02535-1
Bull, P. A. and Lawler, D. M. (1991). “Flow measurements and water tracing,” in Caving Practice and Equipment, ed D. Judson (Cordee-Leicester/British Case Research Association), 167–178.
Castro-Jiménez, J., González-Fernández, D., Fornier, M., Schmidt, N., and Sempere, R. (2019). Macro-litter in surface waters from the Rhone river: plastic pollution and loading to the NW Mediterranean sea. Mar. Pollut. Bull. 146, 60–66. doi: 10.1016/j.marpolbul.2019.05.067
Deocaris, C. C., Allosada, J. O., Ardiente, L. T., Bitang, L. G. G., Dulohan, C. L., Lapuz, J. K. I., et al. (2019). Occurrence of microplastic fragments in the Pasig river. H2Open J. 2, 92–100. doi: 10.2166/h2oj.2019.001
González-Fernández, D., and Hanke, G. (2017). Toward a harmonized approach for monitoring of riverine floating macro litter inputs to the marine environment. Front. Mar. Sci. 4:86. doi: 10.3389/fmars.2017.00086
Gorme, J. B., Maniquiz, M. C., Song, P., and Kim, L.-H. (2010). The water quality of the Pasig river in the city of manila, Philippines: current status, management and future recovery. Environ. Eng. Res. 15, 173–179. doi: 10.4491/eer.2010.15.3.173
Hong, S., Lee, J., and Lim, S. (2017). Navigational threats by derelict fishing gear to navy ships in the Korean seas. Marine Pollut. Bull. 119, 100–105. doi: 10.1016/j.marpolbul.2017.04.006
Honingh, D., van Emmerik, T., Uijttewaal, W., Kardhana, H., Hoes, O., and van de Giesen, N. (2020). Urban river water level increase through plastic waste accumulation at a rack structure. Front. Earth Sci. 8:28. doi: 10.3389/feart.2020.00028
Ivar do Sul, J. A., Costa, M. F., Silva-Cavalcanti, J. S., and Araújo, M. C. B. (2014). Plastic debris retention and exportation by a mangrove forest patch. Mar. Pollut. Bull. 78, 252-257. doi: 10.1016/j.marpolbul.2013.11.011
Jambeck, J. R., Geyer, R., Wilcox, C., Siegler, T. R., Perryman, M., Andrady, A., et al. (2015). Plastic waste inputs from land into the ocean. Science 347, 768–771. doi: 10.1126/science.1260352
Kumar, P., Masago, Y., Mishra, B. K., and Fukushi, K. (2018). Evaluating future stress due to combined effect of climate change and rapid urbanization for Pasig-Marikina river, Manila. Groundwater Sustain. Dev. 6, 227–234. doi: 10.1016/j.gsd.2018.01.004
Lasut, M. T., Weber, M., Pangalila, F., Rumampuk, N. D., Rimper, J. R., Warouw, V., et al. (2018). “From coral triangle to trash triangle–how the hot spot of global marine biodiversity is threatened by plastic waste,” in Proceedings of the International Conference on Microplastic Pollution in the Mediterranean Sea (Springer), 107-113. doi: 10.1007/978-3-319-71279-6_15
Lebreton, L., and Andrady, A. (2019). Future scenarios of global plastic waste generation and disposal. Palgrave Commun. 5:6. doi: 10.1057/s41599-018-0212-7
Lebreton, L. C., Van der Zwet, J., Damsteeg, J.-W., Slat, B., Andrady, A., and Reisser, J. (2017). River plastic emissions to the world's oceans. Nat. Commun. 8:15611. doi: 10.1038/ncomms15611
Liro, M., van Emmerik, T., Wyżga, B., Liro, J., and Mikuś, P. (2020). Macroplastic storage and remobilization in rivers. Water 12:2055. doi: 10.3390/w12072055
Lorenzi, L., Reginato, B. C., Mayer, D. G., and Dantas, D. V. (2020). Plastic floating debris along a summer-winter estuarine environmental gradient in a coastal Lagoon: how does plastic debris arrive in a conservation unit? Environ. Sci. Pollut. Res. 27, 1–10. doi: 10.1007/s11356-020-07708-5
Meijer, L. J. J., van Emmerik, T., Lebreton, L., Schmidt, C., and van der Ent, R. (2019). Over 1000 rivers accountable for 80% of global riverine plastic emissions into the ocean. EarthArXiv [Preprint]. doi: 10.31223/osf.io/zjgty
Onda, D. F. L., Gomez, N. C. F., Purganan, D. J. E., Tolentino, M. P. S., Bitalac, J. M. S., Calpito, J. V. M., et al. (2020). Marine microbes and plastic debris: research status and opportunities in the Philippines. Philipp. J. Sci. 149, 89–100.
Schirinzi, G. F., Köck-Schulmeyer, M., Cabrera, M., González-Fernández, D., Hanke, G., Farré, M., et al. (2020). Riverine anthropogenic litter load to the Mediterranean sea near the metropolitan area of Barcelona, Spain. Sci. Tot. Environ. 714:136807. doi: 10.1016/j.scitotenv.2020.136807
Schmidt, C., Krauth, T., and Wagner, S. (2017). Export of plastic debris by rivers into the sea. Environ. Sci. Technol. 51, 12246–12253. doi: 10.1021/acs.est.7b02368
Superio, M. D. A., and Abreo, N. A. S. (2020). Plastic in freshwater ecosystems: a looming crisis in the Philippines. Philipp. Sci. Lett. 13, 1–5.
Tramoy, R., Gasperi, J., Colasse, L., and Tassin, B. (2020). Transfer dynamic of macroplastics in estuaries–new insights from the seine estuary: Part 1. Long term dynamic based on date-prints on stranded debris. Mar. Pollut. Bull. 152:110894. doi: 10.1016/j.marpolbul.2020.110894
van Calcar, C., and van Emmerik, T. (2019). Abundance of plastic debris across European and Asian rivers. Environ. Res. Lett. 14:124051. doi: 10.1088/1748-9326/ab5468
van Emmerik, T., Kieu-Le, T.-C., Loozen, M., van Oeveren, K., Strady, E., Bui, X.-T., et al. (2018). A methodology to characterize riverine macroplastic emission into the ocean. Front. Mar. Sci. 5:372. doi: 10.3389/fmars.2018.00372
van Emmerik, T., Loozen, M., Van Oeveren, K., Buschman, F., and Prinsen, G. (2019a). Riverine plastic emission from Jakarta into the ocean. Environ. Res. Lett. 14:084033. doi: 10.1088/1748-9326/ab30e8
van Emmerik, T., and Schwarz, A. (2020). Plastic debris in rivers. WIREs Water e1398:7. doi: 10.1002/wat2.1398
van Emmerik, T., Seibert, J., Strobl, B., Etter, S., den Oudendammer, T., Rutten, M., et al. (2020). Crowd-sourced observations of riverine macroplastic pollution. Front. Earth Sci. 8:298. doi: 10.3389/feart.2020.00298
van Emmerik, T., Strady, E., Kieu-Le, T.-C., Nguyen, L., and Gratiot, N. (2019b). Seasonality of riverine macroplastic transport. Sci. Rep. 9, 1–9. doi: 10.1038/s41598-019-50096-1
van Emmerik, T., Tramoy, R., van Calcar, C., Alligant, S., Treilles, R., Tassin, B., et al. (2019c). Seine plastic debris transport tenfolded during increased river discharge. Front. Mar. Sci. 6:642. doi: 10.3389/fmars.2019.00642
Vriend, P., Van Calcar, C., Kooi, M., Landman, H., Pikaar, R., and Van Emmerik, T. (2020). Rapid assessment of floating macroplastic transport in the rhine. Front. Mar. Sci. 7:10. doi: 10.3389/fmars.2020.00010
Keywords: hydrology, plastic, marine litter, floating debris, river plastic, Philippines, estuary
Citation: van Emmerik T, van Klaveren J, Meijer LJJ, Krooshof JW, Palmos DAA and Tanchuling MA (2020) Manila River Mouths Act as Temporary Sinks for Macroplastic Pollution. Front. Mar. Sci. 7:545812. doi: 10.3389/fmars.2020.545812
Received: 26 March 2020; Accepted: 25 August 2020;
Published: 07 October 2020.
Edited by:
Christopher Kim Pham, University of the Azores, PortugalReviewed by:
Martin Thiel, Catholic University of the North, ChileChin-Chang Hung, National Sun Yat-sen University, Taiwan
Copyright © 2020 van Emmerik, van Klaveren, Meijer, Krooshof, Palmos and Tanchuling. This is an open-access article distributed under the terms of the Creative Commons Attribution License (CC BY). The use, distribution or reproduction in other forums is permitted, provided the original author(s) and the copyright owner(s) are credited and that the original publication in this journal is cited, in accordance with accepted academic practice. No use, distribution or reproduction is permitted which does not comply with these terms.
*Correspondence: Tim van Emmerik, dGltLnZhbmVtbWVyaWtAd3VyLm5s